Embed Size (px)
Citation preview

Chapter 10: Lee's Summit
COMMUNITY PROFILE
The City of Lee's Summit is in Jackson County and is part of the Kansas City Metropolitan area.
Lee's Summit was the most prosperous, best educated, and fastest growing community examined
during phase I of the study. Lee Summit has a strong industrial base and is the home of many
service and retail businesses. The City is a member of the Mid-America Regional Council Solid
Waste Management District (District E).
Lee's Summit is 15 miles southeast of downtown Kansas City, 16Omiles north of Spingfleld and
250 miles west of St. Louis.
Area (sq. miles) Population (1992) Density (per sq. mile) Pop. Change since 1980 Number of households Persons per household High school graduates Median Family Income Percent below poverty level
Lee's Summit 59.1
51,327 868
78.6% 17,632
2.60 89.9??
%45,101 4.8%
Jackson County 605
634,057 19
13.1% 252,582
2.46 79.5%
$34,300 13.W

SoEd waste collection
Solid waste is collected by several private waste haulers in Lee's Summit. The city licenses the
haulers but does not h c h i s e or set up collection zones. Waste haulers are required to offer
curbside recycling to their customers.
golid waprc disDosal
The City of Lee's Summit owns and operates the landfill. The landfill accepts waste ffom Lee's
Summit and the surrounding communities. The current tipping fee for solid waste is $6.50 per
cubic yard. The landfill receives approximately 110,000 tons of solid waste per year.
Wnste reduction and tecyclin~ ~romams
The Lee's Summit recycling drop-off center began as a project operated by a local not-for protit
organization. In 1992, the center was acquired by the City and became part of an integrated
municipal solid waste management plan. Many recyclables and some banned items are accepted
at this center. In addition to these efforts, the C i has mandated that all trash haulers operating
within the C i limits must offer curbside recycling, and a group of rotating recycling centers was
formed for residents use. Lee's Summit also operates a yard waste composting facility at the
landfill.
Lee's Sununir Renrhs
Information about sample size and composition are listed in tables 10-1 through 10-8
All weights are listed in pounds and all volumes are in cubic f a t

SORT # 1
Sort Conditions
The first sort was conducted March 25th through the 29th. The sort facility was set up in the
landfill adjacent to the unloading area. Weather conditions were sunny and cold.

Sample # Sample Size Weight Volume
TOTALS 3471.6 725.2 AVERAGE 248.0 51.8
LEE'S SUMMIT SORT #I
Composition Recycling Res. Comm. Activities
Curb side1 Drop-off Curb side1 Drop-off Curb sidel Drop-off Curb side1 Drop-off Curb side1 Drop-off Curb side1 Drop-off Curb side1 Drop-off Curb side1 Drop-off Curb side1 Drop-off Curb side1 Drop-off Curb side1 Drop-off Curb sidel Drop-off Curb sidel Drop-off Curb side/ Drop-off
Collection Location
City of Lee's Summit City of Lee's Summit City of Lee's Summit City of Lee's Summit Raytown and Lee's Summit City of Lee's Summit City of Lee's Summit City of Lee's Summit City of Lee's Summit City of Lee's Summit City of Lee's Summit City of Lee's Summit City of Lee's Summit City of Lee's Summit
TABLE 10-1

CATEGORY
Cardboard Newsprint Magazines High Grade Mixed PAPER TOTALS
Clear Brown Gmen Other GLASS TOTALS
Alum. Cans Other Alum Non fenous Food Cans Ferrous Oil Filters METAL TOTALS
PET # 1
HDPE # 2 Film Other Plastic PLASTIC TOTALS
Food Waste
Wood Waste
Textiles Diapers Other Organics ORGANIC TOTALS
Fines Other Inorganics INORGANIC TOTAL
GRAND TOTAL
LEES SUMMIT SORT # 1 TOTALS AVERAGE PERCENTAGE
wt . vol. wt. vol. Pct. by wt. Pct. by vol.
TABLE 10-2


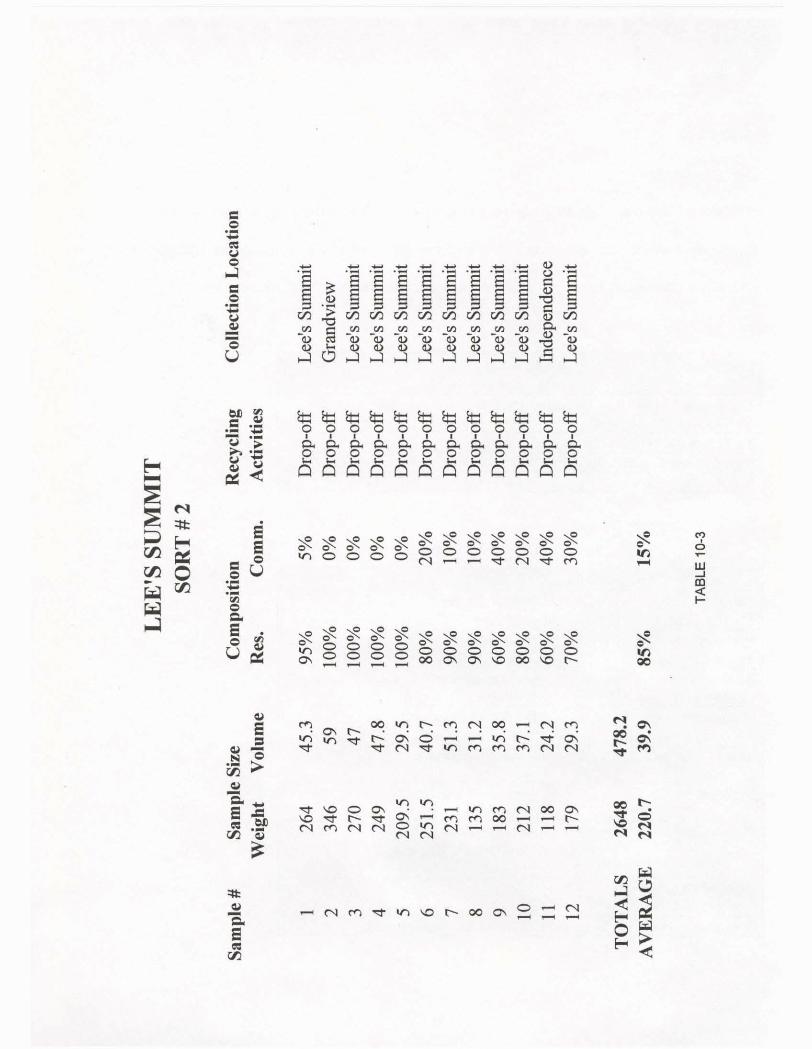
SORT # 2
Sort Conditions
The second sort was conducted July 1st through the 3rd. The sort facility was set up near the
maintenance facility, approximately ?4 mile from the tipping area. The samples were transported
to and fiom the facility by trailer. Weather conditions were sunny, humid, and very hot.

CATEGORY
Cardboard
Newsprint Magazines
High Grade
Mixed PAPER TOTALS
Clear
Brown Green
Other GLASS TOTALS
Alum. Cans
Other Alum
Non ferrous Food Cans
Ferrous
Oil Filters METAL TOTALS
PET # 1
HDPE # 2 Film
Other Plastic PLASTIC TOTALS
Food Waste
Wood Waste
Textiles Diapers Other Organics ORGANIC TOTALS
Fines
Other lnorganics INORGANIC TOTALS
LEE'S SUMMIT TOTALS AVERAGE
wt. vol. wt. vol.
SORT # 2 PERCENTAGE
Pct. by wt. Pct. by vol.
GRAND TOTAL 2647.5 477.5 220.6 39.8 100.00% 100.00%
TABLE 10-4
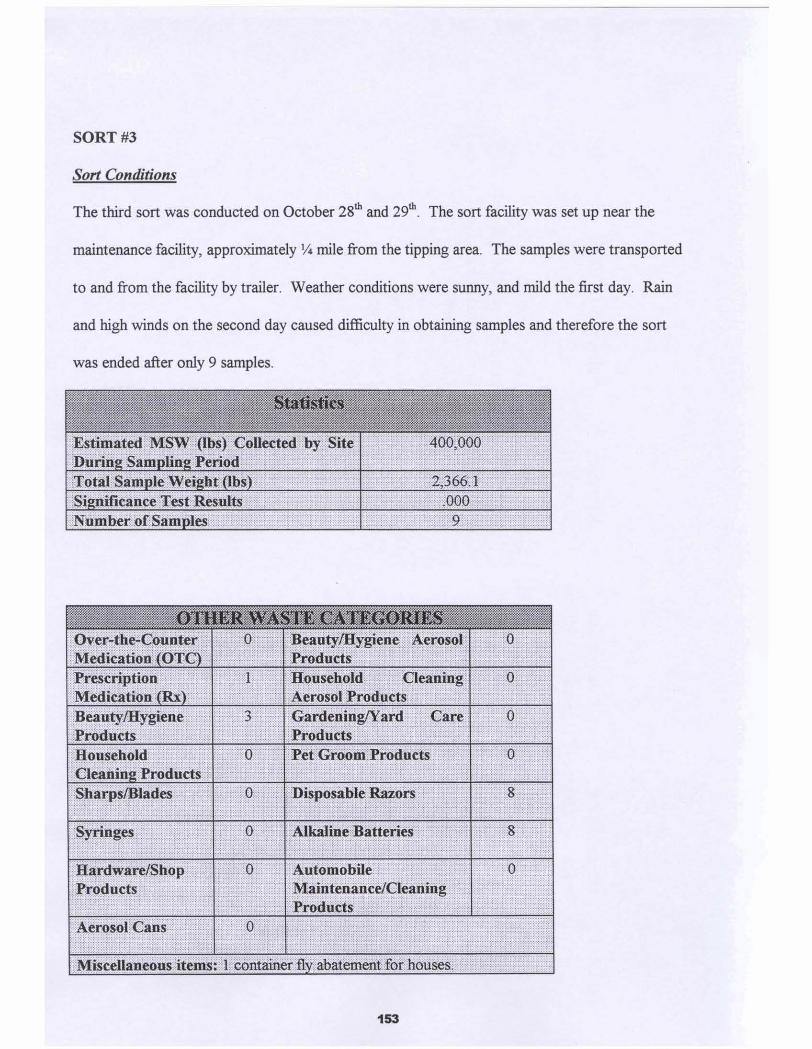
SORT #3
sort C o a m
The third sort was conducted on October 28* and 29*. The sort facility was set up near the
maintenance facility, approximately % mile from the tipping area. The samples were transported
to and from the Wty by trailer. Weather conditions were sunny, and mild the first day. Rain
and high winds on the second day caused d i E d t y in obtaining samples and therefore the sort
was ended after only 9 samples.
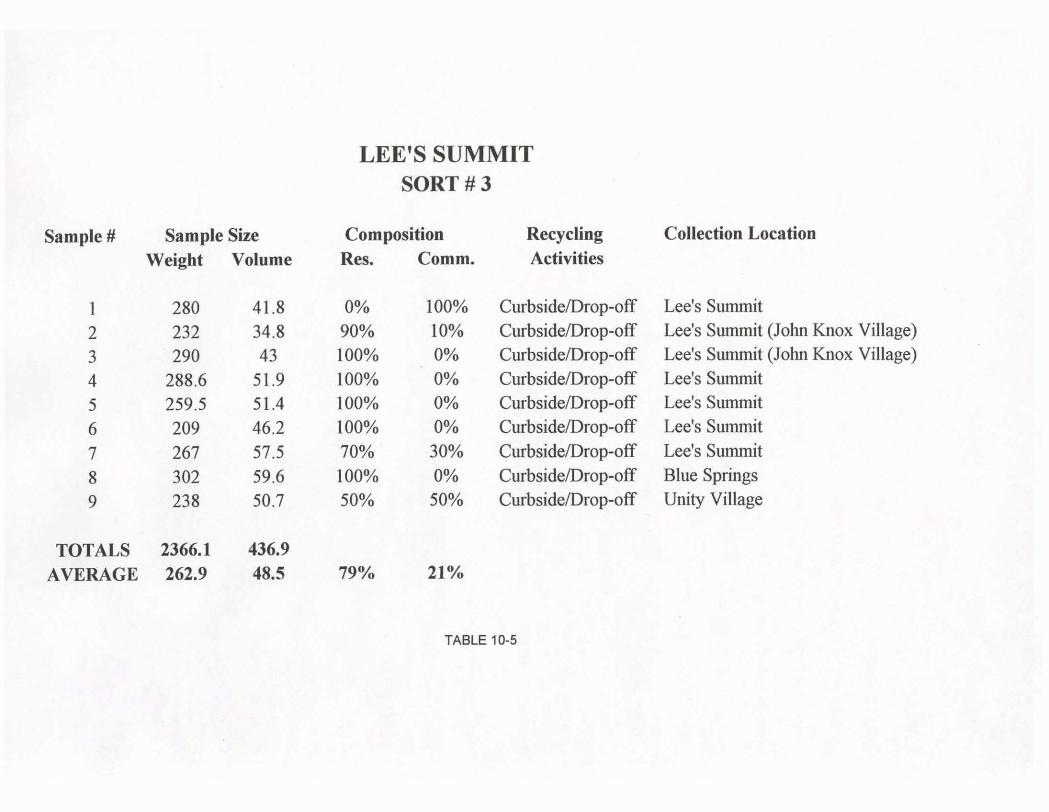
Sample # Sample She Weight Volume
TOTALS 2366.1 436.9 AVERAGE 262.9 48.5
LEE'S SUMMIT SORT # 3
Composition Res. Comm.
Recycling Activities
Collection Location
Lee's Summit Lee's Summit (John Knox Village) Lee's Summit (John Knox Village) Lee's Summit Lee's Summit Lee's Summit Lee's Summit Blue Springs Unity Village
TABLE 10-5

CATEGORY
Card board Newsprint Magazines High Grade Mixed PAPER TOTALS
Clear Brown Green Other GLASS TOTALS
Alum. Cans Other Alum Non ferrous Food Cans Ferrous Oil Filters METAL TOTALS
PET # 1
HDPE # 2 Film Other Plastic PLASTIC TOTALS
Food Waste Wood Waste Textiles Diapers Other Organics ORGANIC TOTALS
Fines Other lnorganics INORGANIC TOTALS
LEE'S SUMMIT TOTALS AVERAGE
wt. vol. wt. vol.
GRAND TOTAL 2365.2 436.8 262.8 48.5
SORT # 3 PERCENTAGES
Pct. by wt. Pct. by vol.
TABLE 10-6

SORT SUMMARY
$emonal variat20ns
High grade paper was higher during the third sort. A larger percentage of commercial waste
was sorted during the third round. Most of that commercial waste seemed to come from
doctors offices.
Brown glass containers were higher during the third round. No obvious cause.
Other plastics were higher during the second sort. No obvious cause.
Other organics were higher during the second sort. Several bags of yard waste were found.
Fines were higher during the first sort. Modification in the sorting procedure caused more of
the fines to be sorted into the appropriate categories in the second and third round.
Satr~pulis
Chart 10-1 graphically compares the three seasonal waste sort results and shows the average
waste composition, by major category, for Lee's Summit.
The sample data for all Lee's Summit sorts is listed on table 10-7.
The sort results for al l Lee's Summit sorts are listed on table 10-8.
The summary of statistical relevance for the Lee's Summit sorts is located on page 158.
The total for all "other wastes" found during the Lee's Summit sorts is on page 158.
AU weights are in pounds and volumes are listed in cubic feet.
Comparisons of the Lee's Summit waste stream to previous studies and other communities can be
found in chapter 13.
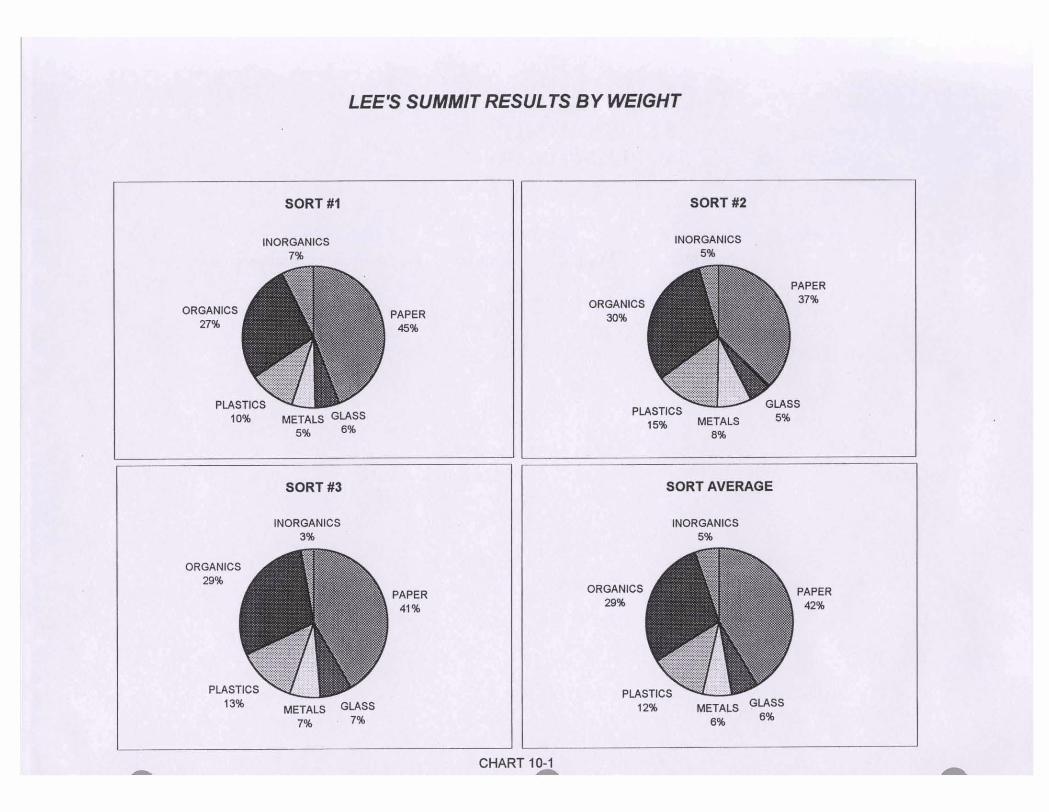
LEE'S SUMMIT RESULTS BY WEIGHT
SORT #I SORT #2
INORGANICS INORGANICS 7% 5%
PAPER 30% 46%
5% 6% 896
SORT #3 SORT AVERAGE
INORQANICS INOROMCS 3%
PAPER ORGANICS PAPER
41 % 2% 42%
METALS GLASS 7% 7%

LEE'S SUMMIT SAMPLE SUMMARY
Sort # Dates Number of Sample Size Composition Samples Weight Volume Residential Commercial
TOTALS AVERAGE
TABLE 10-7

LEE'S SUMMIT SORT # I SORT # 2
WT. VOL. WT. VOL.
SUMMARY AVERAGE
WT. VOL. SORT W
WT. VOL. CATEGORY
Cardboard Newsprint Magazines High Grade Mixed PAPER TOTALS
Clear B m Green Other GLASS TOTALS
Alum. Cans Other Alum Non ferrous Food Cans Ferrous Oil Filters METAL TOTALS
PET # 1 HDPE # 2 Film Other Plastic PLASTIC TOTALS
Food waste
Wood Waste Textites Diapers Other Organics ORGANIC TOTALS
Fines Other lnorganics INORGANIC TOTALS
SORT TOTALS 100% 100% 100% 100% 100% 100% 100% 100%
TABLE 10-8