Embed Size (px)
Citation preview
Chapter 10
Revised January 2007
Panko’sBusiness Data Networks and Telecommunications, 6th edition
Copyright 2007 Prentice-HallMay only be used by adopters of the book
Network Management

Network SimulationSoftware
3
Figure 10-1: Network Simulation
• Simulation
– Build a model, study its implications
– More economical to simulate network alternatives than to build several networks and see which one is best
• Purposes– Compare alternatives to select the best one
– Sensitivity analysis to see what will happen if the values of variables were varied over a range
– Anticipating bottlenecks because procurement cycles are long in business, so problems must be anticipated well ahead of time

4
Figure 10-1: Network Simulation
• What Is: the existing situation
Net 1
Net 2
Net 3
Net 4
Net 5
Net 6
Utilization inPeak Hour
95%
Too high!
R7
What Is analysis:Describe the current situation.
Problem: Utilization in the peak hourIs too high (95%); this will
create many momentary overloads

5
Figure 10-1: Network Simulation
• What-If: See the Impact of a Change
Net 1
Net 2
Net 3
Net 4
Net 5
Net 6
Est.Utilization inPeak Hour
70%
AddedRouter
AddedLink
What If analysis:What will happen if something is done?
Adding a new link between R3 and Net5will give good peak hour utilization.
R3
R7

6
Figure 10-1: Network Simulation
• The Simulation Process:Step 1: Before the Simulation, Collect Data
– Data must be good
– Otherwise, GIGO (garbage in, garbage out)
– Collect data on the current network
– Forecast growth
7
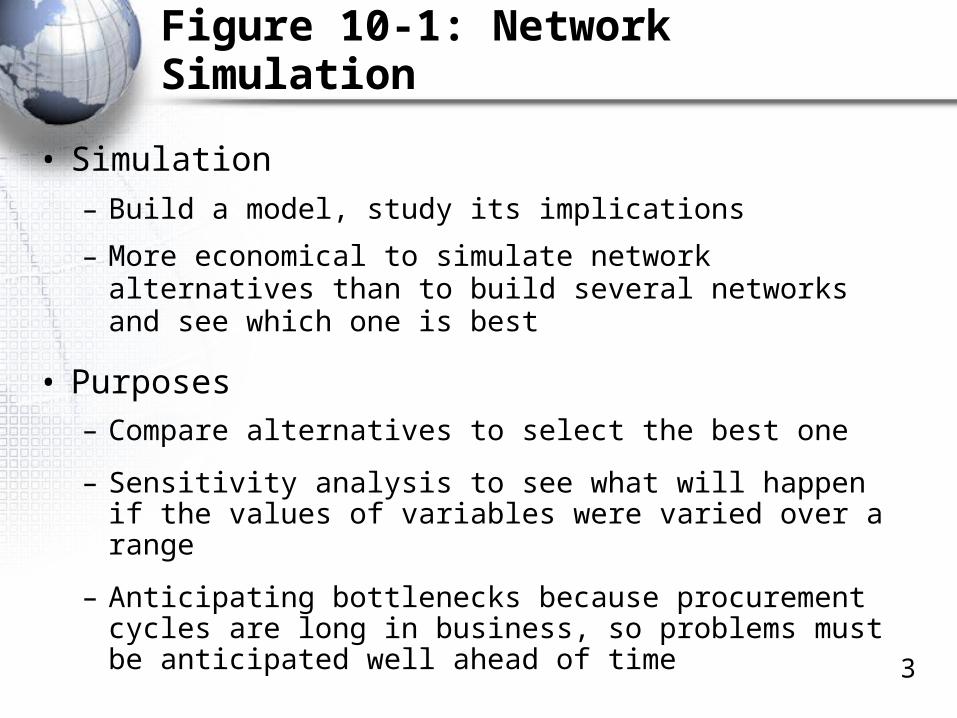
Figure 10-2: OPNET IT Guru Node Template
Dragged IconThe Process:
2.Add node icons to thesimulation Work Area
(clients, servers,switches, routers, etc.)
Drag from theObject Palette
Object Palette
Work Area
8
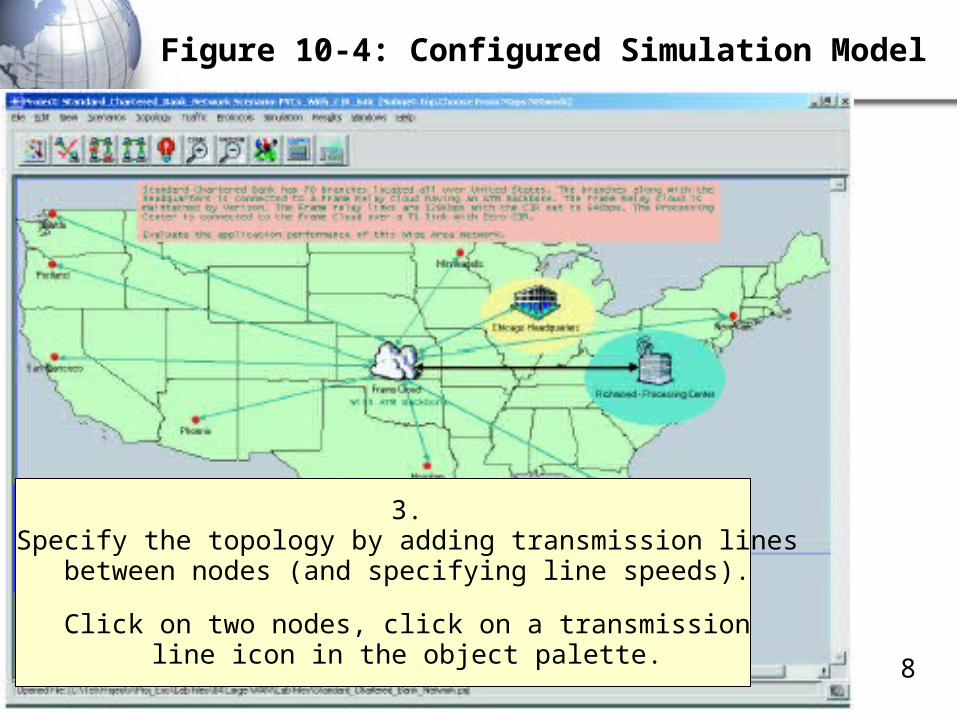
Figure 10-4: Configured Simulation Model
3.Specify the topology by adding transmission lines
between nodes (and specifying line speeds).
Click on two nodes, click on a transmissionline icon in the object palette.

9
Figure 10-3: Configuring a Frame Relay CIR
4.Configure EACH node and
transmission lines (IP Time-to-Live value, etc.).In this case, Frame Relay burst speed rate.

10
Figure 10-4: Configured Simulation Model
5.Add applications, which generate traffic data
Applications

11
Figure 10-1: Network Simulation
• 6. Run the simulation for some simulated period of time
– Examine the output to determine implications
– Validate the simulation if possible (compare with actual data to see if it is correct)

12
Figure 10-5: What-If Analysis
7.Do what-if analyses,
trying different alternatives.
IP Subnetting

14
IP Subnetting
• IP Addresses always are 32 bits long
• The firm is assigned a network part– Usually with 8 to 24 bits
• The firm can assign the remaining bits to the subnet part and the host part
– Different choices give different numbers of subnets and hosts per subnet, as in the following examples
– Firms must trade-off the number of subnets and the number of hosts per subnet in a way that makes sense for their organizational situation

15
IP Subnetting
• If a part has N bits, it can represent 2N-2 subnets or hosts per subnet
– 2N because if you have N bits, you can represent 2N possibilities
– Minus 2 is because you cannot have a part that is all zeros or all ones
Part Size(bits) 2N 2N-2
4 24 = 16 16-2 = 14
8 ? ?
12 4,096 4,094
65,536 65,53416
10 ? ?

16
Figure 10-6: IP Subnetting
DescriptionStep
32Total size of IP address(bits)
1
Size of network partassigned to firm (bits)
2 16
Remaining bits for firm toassign
3 16
Selected subnet/host partsizes (bits)
4 8 / 8
Number of possibleSubnets (2N-2)
254
(28-2)
Number of possible hostsper subnets (2N-2)
254
By Definition
Assigned tothe firm
Bits for thefirm to assign
The firm’sdecision

17
Figure 10-6: IP Subnetting
DescriptionStep
32Total size of IP address(bits)
1
Size of network partassigned to firm (bits)
2 16
Remaining bits for firm toassign
3 16
Selected subnet/host partsizes (bits)
4 6/10
Number of possibleSubnets (2N-2)
62
(26-2)
Number of possible hostsper subnets (2N-2)
1,022
By Definition
Assigned tothe firm
Bits for thefirm to assign
The firm’sdecision

18
Figure 10-6: IP Subnetting
DescriptionStep
32Total size of IP address(bits)
1
Size of network partassigned to firm (bits)
2 8
Remaining bits for firm toassign
3 24
Selected subnet/host partsizes (bits)
4 12/12
Number of possibleSubnets (2N-2)
4,094
Number of possible hostsper subnets (2N-2)
4,094
By Definition
Assigned tothe firm
Bits for thefirm to assign
The firm’sdecision

19
Figure 10-6: IP Subnetting
DescriptionStep
32Total size of IP address(bits)
1
Size of network partassigned to firm (bits)
2 8
Remaining bits for firm toassign
3 24
Selected subnet/host partsizes (bits)
4 8/16
Number of possibleSubnets (2N-2)
254
Number of possible hostsper subnets (2N-2)
65,534
By Definition
Assigned tothe firm
Bits for thefirm to assign
The firm’sdecision

20
Figure 10-6: IP Subnetting
DescriptionStep
Size of network partassigned to firm (bits)
2 20
Remaining bits for firm toassign
3 12
Selected host partsizes (bits)
4 ?
Number of possibleSubnets (2N-2)
?
Number of possible hostsper subnets (2N-2)
?
Selected subnet partsizes (bits)
Added 4

21
Figure 10-6: IP Subnetting
DescriptionStep
Size of network partassigned to firm (bits)
2 20
Remaining bits for firm toassign
3 12
Selected host partsizes (bits)
4 ?
Number of possibleSubnets (2N-2)
?
Number of possible hostsper subnets (2N-2)
?
Selected subnet partsizes (bits)
Added 6

Directory Servers
Store corporate information
Hierarchical organization of content
LDAP standard to access directory servers

23
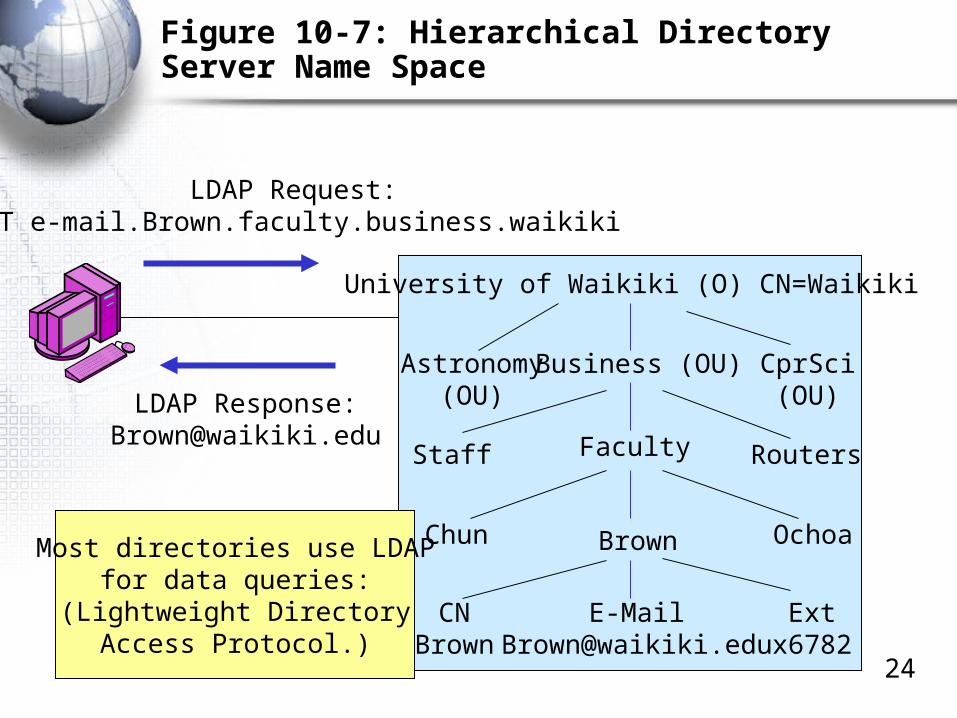
Figure 10-7: Hierarchical Directory Server Name Space
University of Waikiki (O) CN=Waikiki
Astronomy(OU)
Staff
Chun
CNBrown
Extx6782
Directory Server withHierarchical Object Structure
Ochoa
Routers
CprSci(OU)
Brown
Faculty
Business (OU)
O=organizationOU=organizational unitCN=common name
Centralized management requiresCentralized information storage.
Directory servers provide this.
Directory servers are organizedas hierarchies
24
Figure 10-7: Hierarchical Directory Server Name Space
University of Waikiki (O) CN=Waikiki
Astronomy(OU)
Staff
Chun
CNBrown
Extx6782
Ochoa
Routers
CprSci(OU)
Brown
Faculty
Business (OU)
LDAP Request:GET e-mail.Brown.faculty.business.waikiki
LDAP Response:[email protected]
Most directories use LDAPfor data queries:
(Lightweight DirectoryAccess Protocol.)

25
Figure 10-7: Hierarchical Directory Server Name Space
University of Waikiki (O) CN=Waikiki
Astronomy(OU)
Staff
Chun
CNBrown
Extx6782
Ochoa
Routers
CprSci(OU)
Brown
Faculty
Business (OU)
Based on the example
in the previous slide,
give the LDAP request
message for Ochoa’s
telephone extension:

Needed to set up new routers
Needed to change operation of existing routers
Time consuming and an important skill
Configuring Routers

27
Figure 10-8: Cisco Internetwork Operating System (IOS) Command Line Interface (CLI)
• Cisco dominates the router market
• Routers are computers
– They have operating systems
– The Cisco operating system is called the Internetwork Operating System (IOS)
– IOS is also used in other Cisco products
• IOS uses a command line interface (CLI)
– Type complex commands at a prompt:
• Router#hostname julia

28
Figure 10-8: Cisco Internetwork Operating System (IOS) Command Line Interface (CLI)
Command Comment
Router>enable[Enter]Router> is the prompt. The “>” showsthat the user is in non-privileged mode.
This command enables privileged modeso that user can take supervisory actions. User must enter the enable secret.
Note: All commands end with [Enter]. Enter is not shown in subsequent commands.
29
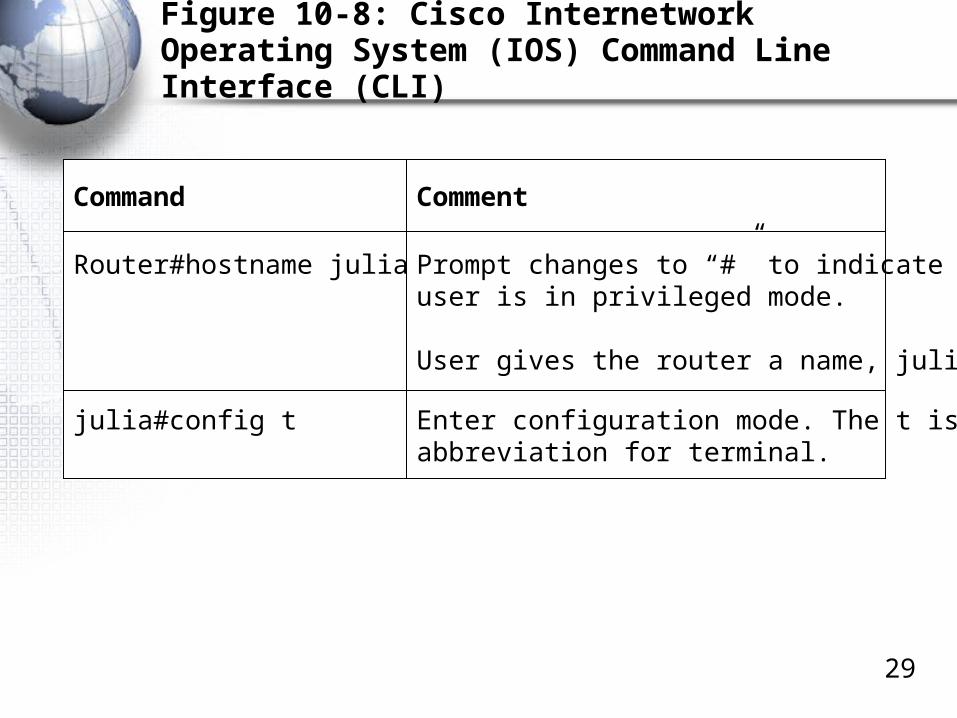
Figure 10-8: Cisco Internetwork Operating System (IOS) Command Line Interface (CLI)
Command Comment
Router#hostname julia
Prompt changes to “#” to indicate thatuser is in privileged mode.
User gives the router a name, julia.
julia#config t
Enter configuration mode. The t is anabbreviation for terminal.

30
Figure 10-8: Cisco Internetwork Operating System (IOS) Command Line Interface (CLI)
Command Comment
julia(config)#int e0
The prompt changes to julia(config) toindicate that the user is in configurationmode.
User wishes to configure the first Ethernet interface, e0. (Router has two Ethernet interfaces, 0 and 1.)
julia(config-if)#ip address
10.5.0.6 255.255.0.0
User gives interface e0 an IP address(10.5.0.6) and a subnet mask(255.255.0.0). (Every routerinterface must have a separate IPaddress.) The IP subnet is 5.

31
Figure 10-8: Cisco Internetwork Operating System (IOS) Command Line Interface (CLI)
Command Comment
julia(config-if)#no shutdown
This is an odd one. The command toshut down an interface is “shutdown”.Correspondingly, “no shutdown” turnsthe interface on.
julia(config-if)# Ctrl-Z
User types Ctrl-Z (the key combination,not the letters) to end the configurationof e0.

32
Figure 10-8: Cisco Internetwork Operating System (IOS) Command Line Interface (CLI)
Command Comment
julia(config-if)#ip address10.6.0.1 255.255.0.0
User gives the interface an IP addressand subnet mask. The subnet is 6.
julia(config-if)#no shutdown Turns on s1.
julia(config-if)# Ctrl-Z Ends the configuration of s1.
julia(config)#int s1
Next, the user wishes to configure the Second serial interface, s1. (Router has two serial interfaces, 0 and 1.)

33
Figure 10-8: Cisco Internetwork Operating System (IOS) Command Line Interface (CLI)
Command Comment
julia#disable
Takes user back to non-privilegedmode. This prevents anyone gettingaccess to the terminal from makingadministrative changes to the router.
julia> The user is now in non-privileged mode
julia# router rip
Enables the Router Information Protocol(RIP) routing protocol.

34
Figure 10-8: Cisco Internetwork Operating System (IOS) Command Line Interface (CLI)
Give the commands to configure Ethernet interface 2 with the IP address 192.168.47.3. Do not show Enters. Do show the prompts.
Julia>

Network Management Utilities

36
Figure 10-9: Network Management Utilities
• Network management utilities are programs to help network managers administer the network
• Security Concerns
– Danger: management tools can be used to make attacks
– So policies should limit these tools to certain employees and to certain purposes
– Firewalls block many network management tools to avoid attacks
37
Figure 10-9: Network Management Utilities
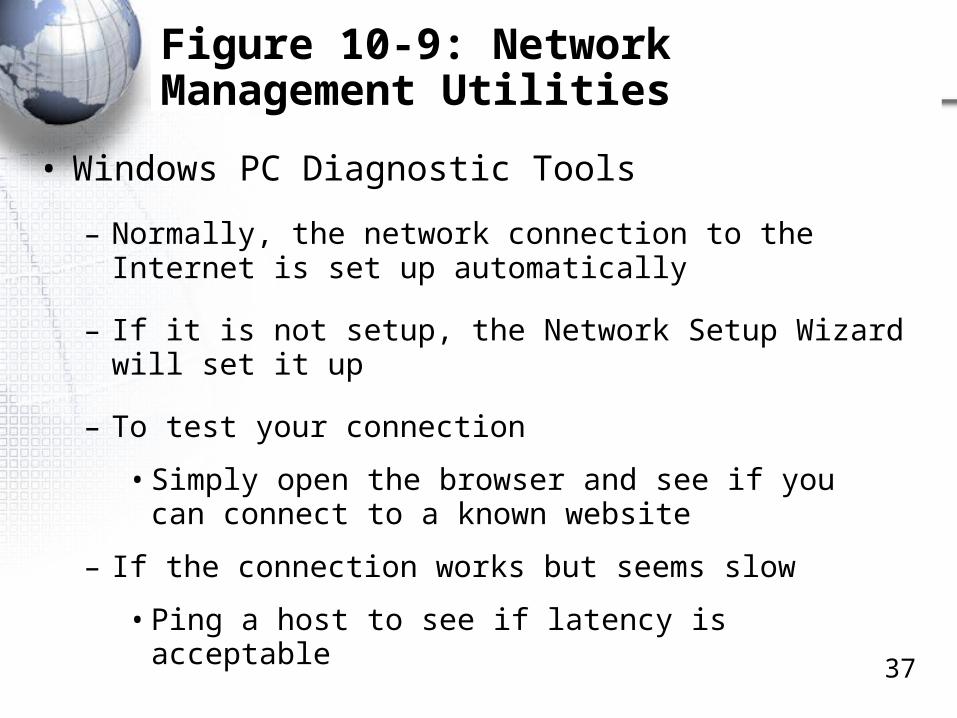
• Windows PC Diagnostic Tools
– Normally, the network connection to the Internet is set up automatically
– If it is not setup, the Network Setup Wizard will set it up
– To test your connection
• Simply open the browser and see if you can connect to a known website
– If the connection works but seems slow
• Ping a host to see if latency is acceptable

38
Figure 10-9: Network Management Utilities
• Windows PC Diagnostic Tools
– If there is no connection, do loopback testing and ipconfig/winipconfig
• At the command line, Ping 127.0.0.1. This is the loopback interface (you ping yourself)
• If it works, the problem is likely to be in the network.
– For detailed information on the connection: ipconfig /all or winipconfig (older versions of Windows)
• This can let you see if your IP address is reasonable, your network mask is correct, etc.
39
Figure 10-9: Network Management Utilities
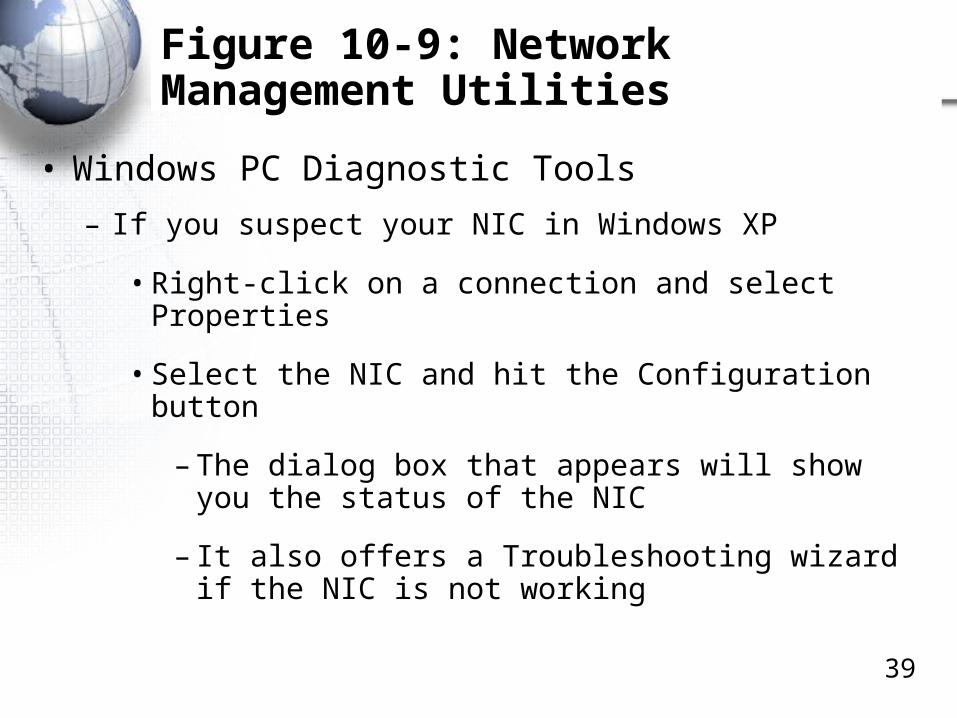
• Windows PC Diagnostic Tools
– If you suspect your NIC in Windows XP
• Right-click on a connection and select Properties
• Select the NIC and hit the Configuration button
– The dialog box that appears will show you the status of the NIC
– It also offers a Troubleshooting wizard if the NIC is not working
40
Figure 10-9: Network Management Utilities
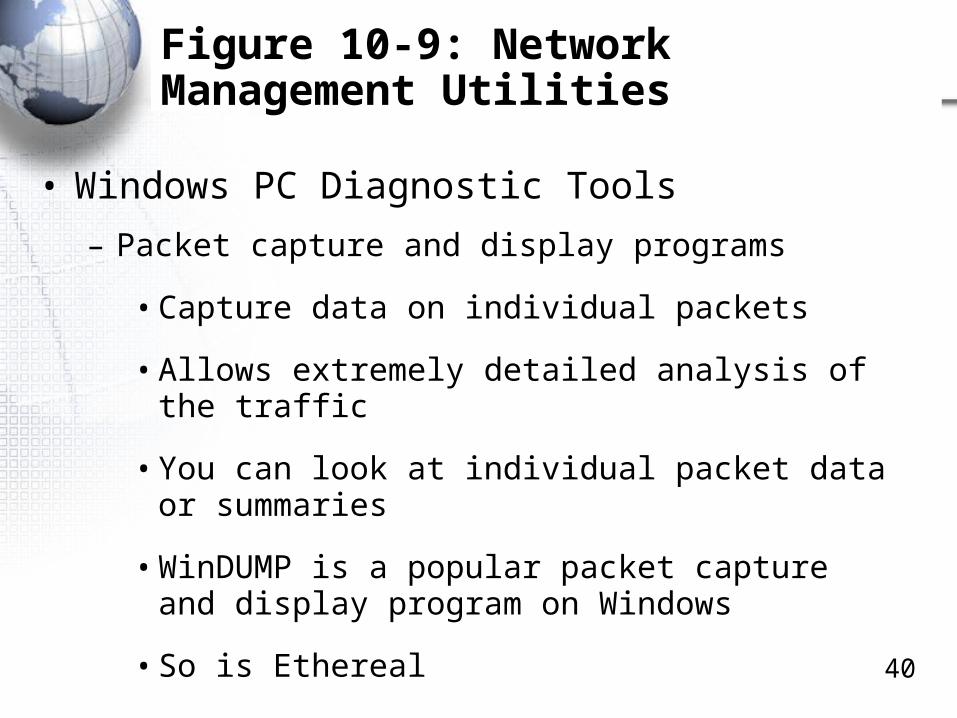
• Windows PC Diagnostic Tools
– Packet capture and display programs
• Capture data on individual packets
• Allows extremely detailed analysis of the traffic
• You can look at individual packet data or summaries
• WinDUMP is a popular packet capture and display program on Windows
• So is Ethereal

41
Figure 10-9: Network Management Utilities
Command prompt>tcpdump www2.pukanui.com
7:50.10.500020 10.0.5.3.62030 >www2.pukanui.com.http: S 800000050:800000050(0) win 4086 <mss1460>
7:50.10.500020 is the time
10.0.5.3.62030 is the source host (62030 is the port number)
www2.pukanui.com.http is the destination host. Its port is http (80)
WinDUMP from Ch. 8a

42
Figure 10-9: Network Management Utilities
7:50.10.500020 10.0.5.3.62030 > www2.pukanui.com.http: S 800000050:800000050(0) win 4086 <mss1460>
S indicates that the SYN flag is set
800000050:800000050(0) Seq. No. and length
Win 4086 is the window size (for flow control)
<mss1460> is an option that sets the maximum segment size (size of the TCP data field) to 1460 octets
WinDUMP from Ch. 8a

43
Figure 10-9: Network Management Utilities
7:50.10.500030 www2.pukanui.com.http > 10.0.5.3.62030 : S 300000030:300000030(0) ack 800000051 win 8760 <mss1460>
SYN/ACK from the webserver
7:50.10.500040 10.0.5.3.62030 > www2.pukanui.com.http: . ack 1 win 4086
ACK to finish 3-way open
Change in sequence numberto simple numbering (1)
WinDUMP from Ch. 8a

44
Figure 10-11: EtherPeek Packet Capture and Summarization Program
Summarization in apacket capture
and analysis program

45
Figure 10-9: Network Management Utilities
• Windows PC Diagnostic Tools
– Connection analysis
• At the command line, netstat shows active connections
• This can identify problem connections
Spyware running on Port 3290
Figure 10-12

46
Figure 10-9: Network Management Utilities
• Route Analysis Tools
– To test the route to another host
– (1) Ping gives the latency of a whole route
– (2) Tracert gives latencies to each router
• Note the high latency between R2 and R3.This could indicate a network problem.
(1) Ping 275 ms
(2)Tracert
25 ms 75 ms
250 ms
225 ms
150 ms (Problem?)
R1 R2 R3

47
Figure 10-9: Network Management Utilities
• Network Mapping Tools
– To understand how the network is organized
– Discovering IP addresses with active devices
– Fingerprinting them to determine their operating system (client, server, or router)
– A popular network mapping program is nmap (shown in Chapter 9)
• Loved by hackers
• Use carefully: Can crash some hosts

Simple Network Management Protocol (SNMP)

49
Figure 10-13: Simple Network Management Protocol (SNMP)
• Simple Network Management Protocol (SNMP)
– A protocol for remotely managing network devices from a centralized device
– For many tasks, avoid the expense of traveling to many devices
– SNMP standardizes remote management communication
– Collects information from remote devices to give the network administrator an overview of the network
– Optionally, allows the network administrator to reconfigure remote devices
– Potential for large labor cost savings

50
Figure 10-13: Simple Network Management Protocol (SNMP)
Network ManagementSoftware (Manager)
RMON Probe
ManagedDevice
Manager manages multiple managed devices from a central location

51
Figure 10-13: Simple Network Management Protocol (SNMP)
Network ManagementSoftware (Manager)
NetworkManagement
Agent (Agent),Objects
RMON Probe
NetworkManagement
Agent (Agent),Objects
Manager talks to a network management agent on each managed device—not to themanaged device directly.

52
Figure 10-13: Simple Network Management Protocol (SNMP)
Network ManagementSoftware (Manager)
NetworkManagement
Agent (Agent),Objects
RMON Probe
NetworkManagement
Agent (Agent),Objects
RMON (remote monitoring) probe is a special agent that collects data about multiple devices in a region of in the network. It is like a local manager that can be queried by the main manager.

53
Figure 10-13: Simple Network Management Protocol (SNMP)
ManagementInformationBase (MIB)
ManagementInformationBase (MIB)
ManagementInformationBase (MIB)
Network ManagementSoftware (Manager)
RMON Probe
MIB stores data about devices.MIB on manager stores all.MIB on device stores local information

54
Figure 10-13: Simple Network Management Protocol (SNMP)
Network ManagementSoftware (Manager)
Simple NetworkManagement Protocol (SNMP)
Messages RMON Probe
1.Command (Get, Set, etc.)
2.Response
3.Trap (Alarm) Initiated by
a Managed Device

55
Figure 10-14: SNMP Object Model
• SNMP Object Model
– The MIB database schema
– Defines objects (parameters) about which information is stored for each managed device
• SNMP System Objects– System name
– System description
– System contact person
– System uptime (since last reboot)
– …
ManagementInformationBase (MIB)
56
Figure 10-14: SNMP Object Model
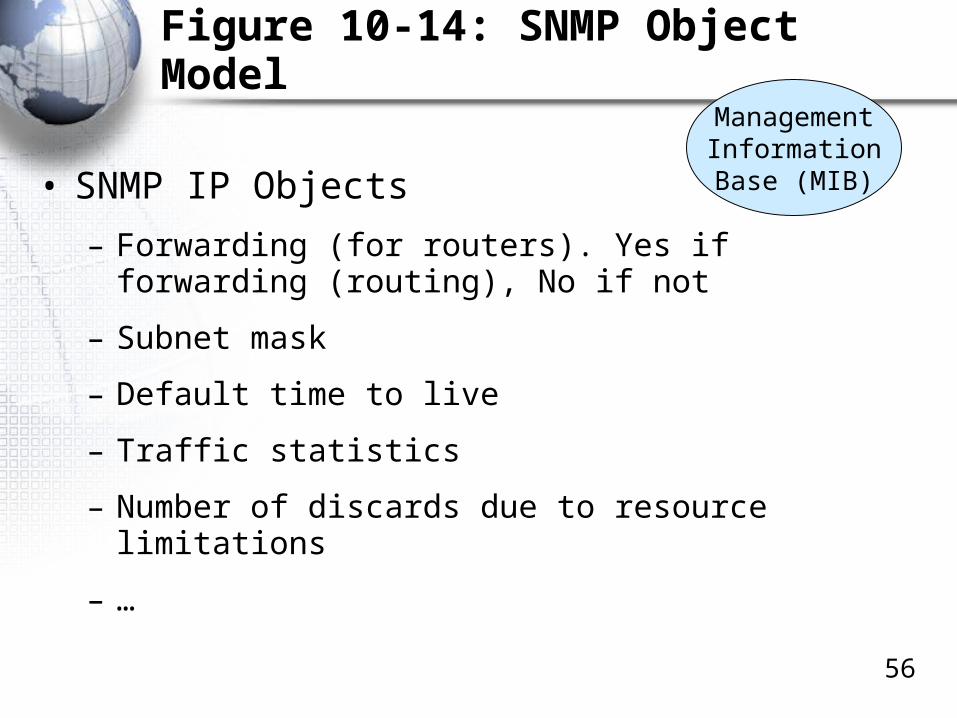
• SNMP IP Objects
– Forwarding (for routers). Yes if forwarding (routing), No if not
– Subnet mask
– Default time to live
– Traffic statistics
– Number of discards due to resource limitations
– …
ManagementInformationBase (MIB)

57
Figure 10-14: SNMP Object Model
• SNMP IP Objects (Continued)
– Number of discards because could not find route
– Number of rows in routing table
– Rows discarded because of lack of space
– Individual row data in the routing table
– …
ManagementInformationBase (MIB)
58
Figure 10-14: SNMP Object Model
• SNMP TCP Objects
– Maximum / minimum retransmission time
– Maximum number of TCP connections allowed
– Opens / failed connections / resets
– Segments sent
– Segments retransmitted
– Errors in incoming segments
– No open port errors
– Data on individual connections (sockets, states)
– …
ManagementInformationBase (MIB)

59
Figure 10-14: SNMP Object Model
• SNMP UDP Objects
– Error: no application on requested port
– Traffic statistics
• SNMP ICMP Objects
– Number of error messages of various types
ManagementInformationBase (MIB)

60
Figure 10-14: SNMP Object Model
• SNMP Interface Objects (One per Port)
– Type (e.g., 69 is 100Base-FX; 71 is 802.11)
– Status: up / down / testing
– Speed
– MTU (maximum transmission unit—the maximum packet size)
– Traffic statistics: octets, unicast / broadcast / multicast packets
– Errors: discards, unknown protocols, etc.
ManagementInformationBase (MIB)

Traffic Management
Capacity is expensive; it must be used wiselyEspecially in WANs, where capacity is expensive

62
Figure 10-15: Traffic Management Methods
• Traditional Approaches
– Overprovisioning
• In Ethernet, install much more capacity than is needed most of the time
• This is wasteful of capacity
• Unacceptable in WANs, where capacity is expensive
• Does not require much ongoing management labor

63
Figure 10-15: Traffic Management Methods
• Traditional Approaches
– Priority
• In Ethernet, assign priority to applications based on sensitivity to latency
• In momentary periods of congestion, switch sends high-priority frames through
• Substantial ongoing management labor
• Used heavily in WANs

64
Figure 10-15: Traffic Management Methods
• Traditional Approaches
– QoS Reservations
• In ATM, reserve capacity on each switch and transmission line for an application
• Allows strong QoS guarantees for voice traffic
• Wasteful if the reserved capacity is not sued
• Highly labor-intensive
• Usually, data gets the scraps—capacity that is not reserved for voice

65
Figure 10-15: Traffic Management Methods
• Traffic Shaping
– The Concept
• Control traffic coming into the network at access switches
– Like the doorman in a night club
– Filter out unwanted applications
– Give a maximum percentage of traffic to other applications
• Prevents congestion from starting instead of just coping when congestion occurs—controls the on ramp to the network

Topics Covered

67
Topics Covered
• Network Simulation
– Study before you install equipment
– There is a process to follow
– What Is versus What If
• IP Subnetting
– Must balance number of subnets with number of hosts per subnet
– A part with N bits can support 2N-2 subnets or hosts

68
Topics Covered
• Directory Servers
– Centralized storage of information
– Hierarchical organization
– LDAP is the protocol for data queries
• Configuring Routers
– Cisco IOS command line interface (CLI)
– Worked through a simple example
• Network Management Utilities
– Diagnose a network connection for a client PC

69
Topics Covered
• Simple Network Management Protocol (SNMP)
– Protocol for managing network devices remotely
– Manager, managed device, agent, RMON probe
– Management information base (MIB)
– SNMP messages: commands and responses, traps
• Traffic Management
– Overprovisioning
– Priority
– QoS reservations
– Traffic shaping: prevent congestion from occurring