Embed Size (px)
Citation preview

Chapter 11: The Data Survey
Supplemental Material
Jussi Ahola
Laboratory of Computer and Information Science

Contents
• Information theoretic measures and their calculation
• Features used in the data survey
• Cases

Good references
• Claude E. Shannon and Warren Weawer: The Mathematical Theory of Communication
• Thomas M. Cover and Joy A. Thomas: Elements of Information Theory
• David J.C. MacKay: Information Theory, Probability and Neural Networks

Entropy
• Measure of information content or ”uncertainty”:
• H(x) ≥ 0, with equality iff pi=1 for one i
• max H(x), when pi is same for every i
xP
xPXHxAx
1log

Calculating entropy

Calculating entropy
BIN 0.0 0.1 0.2 0.3 0.4 0.5 0.6 0.7 0.8 0.9 1.0
Y 1 1 2 2 2 1 7 7 9 5 3
P(Y) 0.025 0.025 0.05 0.05 0.05 0.025 0.175 0.175 0.225 0.125 0.075
MEASURE ACTUAL NORMALIZED
Hmax(X)=Hmax(Y) 3.459 1
H(x) 3.334 0.964
H(y) 3.067 0.887
BIN 0.0 0.1 0.2 0.3 0.4 0.5 0.6 0.7 0.8 0.9 1.0
X 2 4 7 5 3 4 4 4 3 3 1
P(X) 0.05 0.1 0.175 0.125 0.075 0.100 0.100 0.100 0.075 0.075 0.025

Joint and conditional entropies and mutual information
• Joint entropy H(X,Y) describes information content of the whole data
• Conditional entropy H(X|Y) measures the average uncertainty that remains about x when y is known
• Mutual information I(X;Y)=H(X)-H(X|Y) measures the amount of information that y conveys about x, or vice versa

Calculating conditional entropyBIN 0.0 0.1 0.2 0.3 0.4 0.5 0.6 0.7 0.8 0.9 1.0
P(y) 0.025 0.025 0.05 0.05 0.05 0.025 0.175 0.175 0.225 0.125 0.075
P(x|y) 1 1 0.5 0.5 0.5 1 0.143 0.143 0.111 0.2 0.333
BIN 0.0 0.1 0.2 0.3 0.4 0.5 0.6 0.7 0.8 0.9 1.0
P(x) 0.025 0.025 0.05 0.05 0.05 0.025 0.175 0.175 0.225 0.125 0.075
P(y|x) 1 1 0.5 0.5 0.5 1 0.143 0.143 0.111 0.2 0.333
MEASURE ACTUAL NORMALIZED
H(X,Y) 5.322 1
H(X|Y) 2.255 0.676
H(Y|X) 1.988 0.648
I(X;Y) 1.079 0.3518

Relationships of entropies
H(X,Y)
H(X)
H(Y)
H(X|Y) I(X;Y) H(Y|X)

Features
• Entropies calculated from raw input and output signal states
• Signal H(X), H(Y): Indicates how much entropy there is in one data set input/output signal without regard to the output/input signal(s), ratio: sH/sHmax

Features
• Channel H(X),H(Y): Measures the average information per signal at the input/output of the communication channel, ratio: cH/sHmax
• Channel H(X|Y),H(Y|X): Reverse/forward entropy measures how much information is known about the input/output given the output/input, ratio: cH(|)/sHmax

Features
• Channel H(X,Y): The average uncertainty over the data set as whole, ratio: cH(X,Y)/cH(X)+cH(Y)
• Channel I(X;Y): The amount of mutual information between input and output, ratio: cI(X,Y)/cH(Y)

Case 1: CARS
• 8 variables about different car properties (brand, weight, cubic inch size, production year etc.)
• Three subtasks: predicting origin, brand and weigth

Case 1: CARS

Case 1: CARS

Case 1: CARS

Case 1: CARS
• Entropic analysis confirmed a number of intuitions about the data that would be difficult to obtain by other means
• Only a simple model is needed

Case 1: CARS

Case 1: CARS

Case 1: CARS

Case 1: CARS
• Requires a complex model and still the prediction can’t be done with complete certainty
• Different brands have different levels of certainty

Case 1: CARS

Case 1: CARS

Case 1: CARS

Case 1: CARS
• Some form of generalized model has to be built
• The survey provides the information needed for designing the model

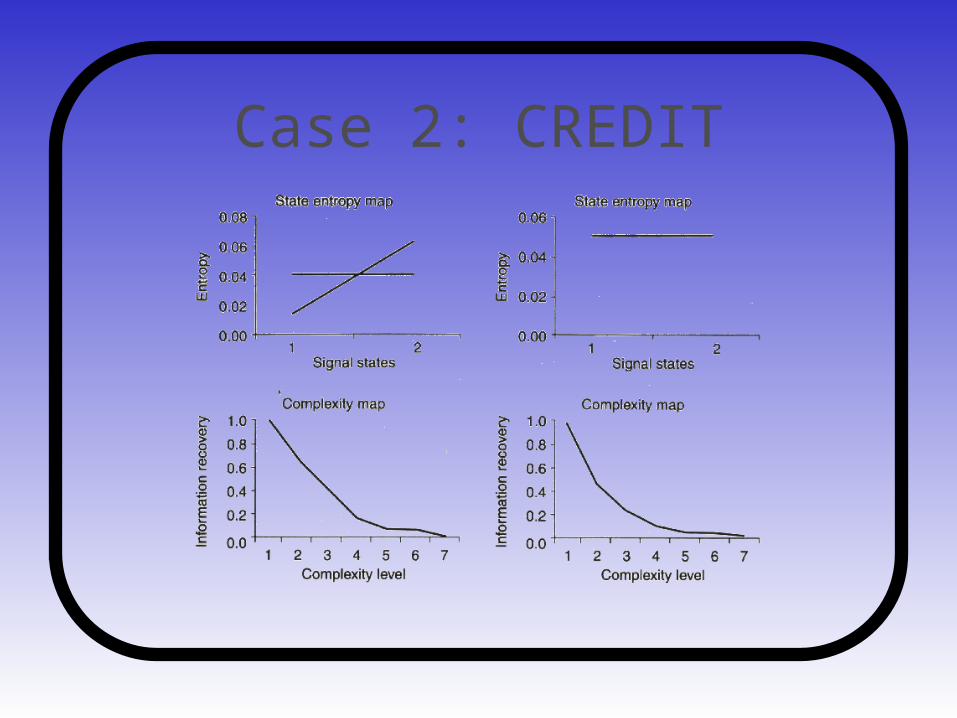
Case 2: CREDIT
• Included information from a credit card survey
• Objective was to build an effective credit card solicitation program

Case 2: CREDIT

Case 2: CREDIT

Case 2: CREDIT

Case 2: CREDIT

Case 2: CREDIT
Case 2: CREDIT

Case 2: CREDIT
• It was possible determine that a model good enough to solve the problem could be built
• This model should be rather complex, even with the balanced data set

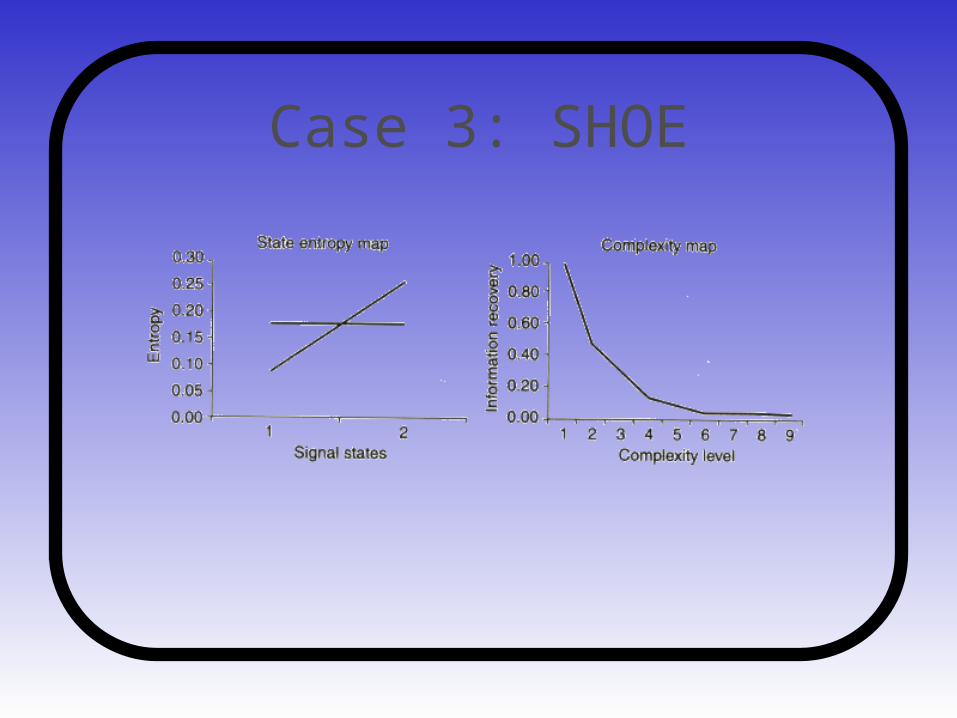
Case 3: SHOE
• Data was about the behaviour of buyers of a running shoe manifacturer
• Objective was to predict and target customers who fit the profile as potential members in their buyers program

Case 3: SHOE
Case 3: SHOE

Case 3: SHOE
• A moderately good, but quite complex, model could be built
• Not useful predictor in the real-world, because of the frequently introduced new shoe styles