Embed Size (px)
Citation preview

Chapter 12
Principles of
Corporate FinanceEighth Edition
Agency Problems, Management
Compensation, and The Measurement
of PerformanceSlides by
Matthew Will
Copyright © 2006 by The McGraw-Hill Companies, Inc. All rights reserved
McGraw-Hill/Irwin
Copyright © 2006 by The McGraw-Hill Companies, Inc. All rights reserved
12- 2
McGraw-Hill/Irwin
Topics Covered
The Capital Investment ProcessDecision Makers Need Good InformationIncentivesResidual Income and EVABias in Accounting Measures of
Performance Measuring Economic Profitability

Copyright © 2006 by The McGraw-Hill Companies, Inc. All rights reserved
12- 3
McGraw-Hill/Irwin
The Principal Agent Problem
Shareholders = Owners
Managers = Employees
Question: Who has the power?
Answer: Managers

Copyright © 2006 by The McGraw-Hill Companies, Inc. All rights reserved
12- 4
McGraw-Hill/Irwin
Capital Investment Decision
Project Creation“Bottom Up”
Strategic Planning“Top Down”
Capital Investments

Copyright © 2006 by The McGraw-Hill Companies, Inc. All rights reserved
12- 5
McGraw-Hill/Irwin
Capital Investment Process
Capital budgetProject authorizationR&DMarketingPost-audits

Copyright © 2006 by The McGraw-Hill Companies, Inc. All rights reserved
12- 6
McGraw-Hill/Irwin
Off Budget Expenditures
Information TechnologyResearch and DevelopmentMarketingTraining and Development

Copyright © 2006 by The McGraw-Hill Companies, Inc. All rights reserved
12- 7
McGraw-Hill/Irwin
Information Problems
1. Consistent Forecasts
2. Reducing Forecast Bias
3. Getting Senior Management Needed Information
4. Eliminating Conflicts of Interest
The correct information
is …

Copyright © 2006 by The McGraw-Hill Companies, Inc. All rights reserved
12- 8
McGraw-Hill/Irwin
Brealey, Myers & Allen’s Second Law
The proportion of proposed The proportion of proposed projects having a positive NPV projects having a positive NPV at the official corporate hurdle at the official corporate hurdle
rate is independent of the rate is independent of the hurdle rate.hurdle rate.

Copyright © 2006 by The McGraw-Hill Companies, Inc. All rights reserved
12- 9
McGraw-Hill/Irwin
Incentives
Reduced effortPerksEmpire buildingEntrenching investmentAvoiding risk
Agency Problems in Capital Budgeting

Copyright © 2006 by The McGraw-Hill Companies, Inc. All rights reserved
12- 10
McGraw-Hill/Irwin
Incentive Issues
Monitoring - Reviewing the actions of managers and providing incentives to maximize shareholder value.
Free Rider Problem - When owners rely on the efforts of others to monitor the company.
Management Compensation - How to pay managers so as to reduce the cost and need for monitoring and to maximize shareholder value.

Copyright © 2006 by The McGraw-Hill Companies, Inc. All rights reserved
12- 11
McGraw-Hill/Irwin
CEO Compensation (2003-04)
0
500
1000
1500
2000
2500
$ 1,
000
s
Aus
tral
ia
Can
ada
Chi
na
Fan
ce
Ger
man
y
Indi
a
Ital
y
Japa
n
Mex
ico
Net
herl
ands
Sing
apor
e
Spai
n
Swed
en
Swit
zerl
and
Uni
ted
Kin
gdom
Uni
ted
Stat
es
Benefits
Perks
Options & Others
Variable Bonus
Basic Compensation

Copyright © 2006 by The McGraw-Hill Companies, Inc. All rights reserved
12- 12
McGraw-Hill/Irwin
Residual Income & EVA
Techniques for overcoming errors in accounting measurements of performance.
Emphasizes NPV concepts in performance evaluation over accounting standards.
Looks more to long term than short term decisions.
More closely tracks shareholder value than accounting measurements.

Copyright © 2006 by The McGraw-Hill Companies, Inc. All rights reserved
12- 13
McGraw-Hill/Irwin
Residual Income & EVA
Income
Sales 550
COGS 275
Selling, G&A 75
200
taxes @ 35% 70
Net Income $130
Assets
Net W.C. 80
Property, plant and equipment 1170
less depr. 360
Net Invest.. 810
Other assets 110
Total Assets $1,000
Quayle City Subduction Plant ($mil)Quayle City Subduction Plant ($mil)

Copyright © 2006 by The McGraw-Hill Companies, Inc. All rights reserved
12- 14
McGraw-Hill/Irwin
Residual Income & EVA
Quayle City Subduction Plant ($mil)Quayle City Subduction Plant ($mil)
13.000,1
130ROI
Given COC = 10%
%3%10%13 NetROI

Copyright © 2006 by The McGraw-Hill Companies, Inc. All rights reserved
12- 15
McGraw-Hill/Irwin
Residual Income & EVA
Residual Income or EVA = Net Dollar return after deducting the cost of capital
© EVA is copyrighted by Stern-Stewart Consulting Firm and used with permission.
Investment Capital ofCost - Earned Income
required income-Earned Income
Income Residual
EVA

Copyright © 2006 by The McGraw-Hill Companies, Inc. All rights reserved
12- 16
McGraw-Hill/Irwin
Residual Income & EVA
Quayle City Subduction Plant ($mil)Quayle City Subduction Plant ($mil)
Given COC = 10%
million 03$
)000,110(.130
Income Residual
EVA

Copyright © 2006 by The McGraw-Hill Companies, Inc. All rights reserved
12- 17
McGraw-Hill/Irwin
Economic Profit
Economic Profit = capital invested multiplied by the spread between return on investment and the cost of capital.
© EVA is copyrighted by Stern-Stewart Consulting Firm and used with permission.
Invested Capital)(
Profit Economic
rROI
EP

Copyright © 2006 by The McGraw-Hill Companies, Inc. All rights reserved
12- 18
McGraw-Hill/Irwin
Economic Profit
© EVA is copyrighted by Stern-Stewart Consulting Firm and used with permission.
Quayle City Subduction Plant ($mil)Quayle City Subduction Plant ($mil)
Example at 10% COC continued.
million $30
1,000.10)-.13(
Invested Capital)(
rROIEP

Copyright © 2006 by The McGraw-Hill Companies, Inc. All rights reserved
12- 19
McGraw-Hill/Irwin
Message of EVA
+ Managers are motivated to only invest in projects that earn more than they cost.
+ EVA makes cost of capital visible to managers.
+ Leads to a reduction in assets employed.
- EVA does not measure present value
- Rewards quick paybacks and ignores time value of money
Copyright © 2006 by The McGraw-Hill Companies, Inc. All rights reserved
12- 20
McGraw-Hill/Irwin
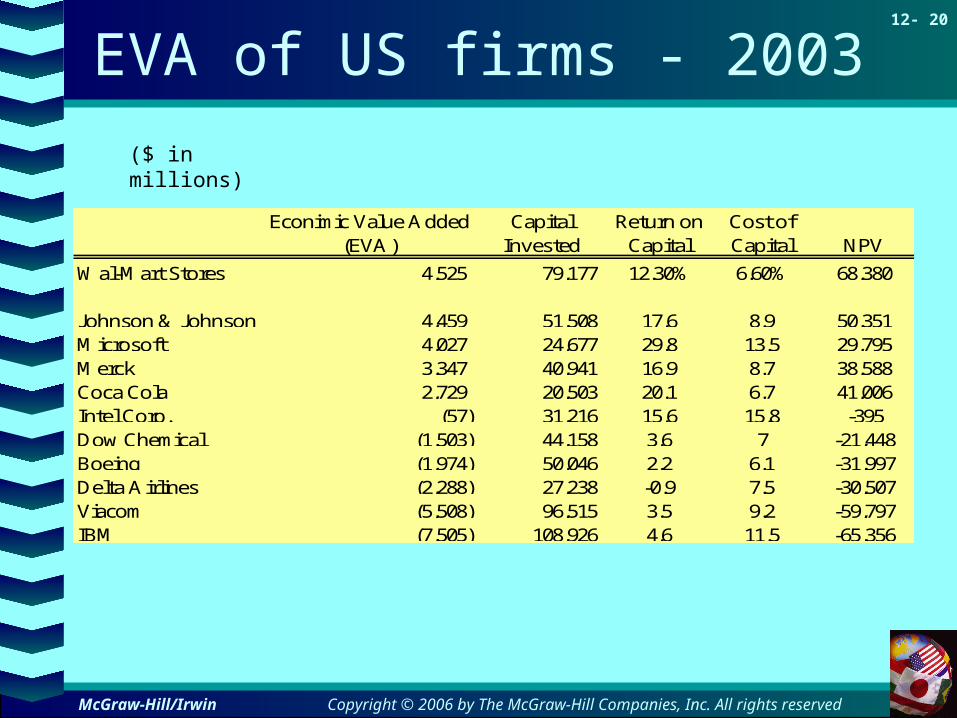
EVA of US firms - 2003
($ in millions)
Econimic Value Added (EVA)
Capital Invested
Return on Capital
Cost of Capital NPV
Wal-Mart Stores 4,525 79,177 12.30% 6.60% 68,380
Johnson & Johnson 4,459 51,508 17.6 8.9 50,351Microsoft 4,027 24,677 29.8 13.5 29,795Merck 3,347 40,941 16.9 8.7 38,588Coca Cola 2,729 20,503 20.1 6.7 41,006Intel Corp. (57) 31,216 15.6 15.8 -395Dow Chemical (1,503) 44,158 3.6 7 -21,448Boeing (1,974) 50,046 2.2 6.1 -31,997Delta Airlines (2,288) 27,238 -0.9 7.5 -30,507Viacom (5,508) 96,515 3.5 9.2 -59,797IBM (7,505) 108,926 4.6 11.5 -65,356

Copyright © 2006 by The McGraw-Hill Companies, Inc. All rights reserved
12- 21
McGraw-Hill/Irwin
Accounting Measurements
0
011 )(
price beginning
price in changereceipts cashreturn of Rate
P
PPC
Economic income = cash flow + change in present value
0
011 )(return of Rate
PV
PVPVC

Copyright © 2006 by The McGraw-Hill Companies, Inc. All rights reserved
12- 22
McGraw-Hill/Irwin
Accounting Measurements
ECONOMIC ACCOUNTING
Cash flow + Cash flow +
change in PV = change in book value =
Cash flow - Cash flow -
economic depreciation accounting depreciation
Economic income Accounting income
PV at start of year BV at start of year
INCOME
RETURN

Copyright © 2006 by The McGraw-Hill Companies, Inc. All rights reserved
12- 23
McGraw-Hill/Irwin
Nodhead Book Income & ROI
1 2 3 4 5 6
Cash flow 100 200 250 298 298 298Book value at start of year, straight-line depreciation 1000 833 667 500 333 167Book value at end of year, straight-line depreciation 833 667 500 333 167 0Book depreciation 167 167 167 167 167 167Book income -67 33 83 131 131 131Book ROI -6.70% 3.96% 12.44% 26.20% 39.34% 78.44%Forecasted EVA -167 -50 16 81 98 114
Year

Copyright © 2006 by The McGraw-Hill Companies, Inc. All rights reserved
12- 24
McGraw-Hill/Irwin
Elements of a Desirable Monitoring System
Long Run View: Can distinguish between desirable and undesirable
decisions Reflects what is happening to the stockholders’
wealth Takes into account scarce capital allocations Takes into account the opportunity cost of capital
How does EVA and ROI do with respect to these?

Copyright © 2006 by The McGraw-Hill Companies, Inc. All rights reserved
12- 25
McGraw-Hill/Irwin
Nodhead Store ForecastsEconomic Profitability
1 2 3 4 5 6
Cash flow 100 200 250 298 298 298PV, at start of year, 10 percent discount rate $1,000.81 1000 901 741 517 271PV, at end of year, 10 percent discount rate 1,001 901 741 517 271 0Economic depreciation 0 100 160 224 246 271Economic income $100 $100 $90 $74 $52 $27Rate of return 10.00% 10.00% 10.00% 10.01% 10.00% 10.00%Forecasted EVA (5-.1*2) $0.00 $0.00 $0.00 $0.09 $0.02 ($0.01)Book value at start of year, straight-line depreciation 1000 833 667 500 333 167
Book ROI -6.70% 3.96% 12.44% 26.20% 39.34% 78.44%
Year

Copyright © 2006 by The McGraw-Hill Companies, Inc. All rights reserved
12- 26
McGraw-Hill/Irwin
Elements of a Desirable Monitoring System
Long Run View: Can distinguish between desirable and undesirable
decisions Reflects what is happening to the stockholders’
wealth Takes into account scarce capital allocations Takes into account the opportunity cost of capital
How does Economic Profitability and Rate of Return do on these dimensions?

Copyright © 2006 by The McGraw-Hill Companies, Inc. All rights reserved
12- 27
McGraw-Hill/Irwin
Web Resources
www.sternstewart.com
www.emblemsvag.com/economic_profit.htm
Click to access web sitesClick to access web sites
Internet connection requiredInternet connection required