Embed Size (px)
Citation preview
14-1
Chapter 14 HM
ow Economies Grow and Develop acroeconomics In Context (Goodwin, et al.)
Chapter Overview This chapter discusses theories of economic growth, highlighting the Solow growth model and the importance of investment in manufactured capital. It also discusses the role of strong institutions, industrial policy, and human capital as key ingredients to economic growth. The chapter then presents the debate on economic convergence, which examines whether or not a reduction in global inequality is occurring. The chapter also examines the process of economic development and the policies that have been implemented in recent years. You will be introduced to the view that the “one size fits all” approach to economic development emphasizing structural reforms has produced disappointing results, and that different approaches are required in response to the circumstances in each country. Chapter Objectives After reading and reviewing this chapter, you should be able to:
1. Explain the difference between “economic growth” and “economic development.”
2. Understand economists’ traditional (Solow) model of economic growth. 3. Describe general patterns of economic growth over time and across different regions and countries. 4. Discuss the controversy concerning whether global inequality is increasing or decreasing.
5. List various factors that play a role in development. 6. Explain how development polices have evolved over time. Key Terms factors of production total factor productivity Industrial Revolution virtuous cycles (in development)
convergence bilateral development assistance multilateral development assistance
14-2
Active Review Fill in the Blank 1. When an economy has experienced increases in aggregate levels of production and income, and its real GDP has risen by some percentage from one year to the next, it has experienced economic ____________________. 2. When an economy has moved people from a situation of poverty to material plenty through investments in productive capacity and changes in the organization of work, it has experienced economic ____________________. 3. Labor, capital, and natural resources are just three __________________, key inputs into the production function. 4. A measure of the productivity of all factors of production is ________________ productivity. 5. The process of social and economic change that began in 18th century England and resulted in a huge increase in output per worker is called the ___________________. 6. Self-reinforcing patterns of high savings, investment, productivity growth, and economic expansion, such as experienced by Japan and other “Asian tigers,” are called _______________________. 7. The idea that poor countries are on a path to “catch up” with the rich countries due to underlying economic forces, is called ______________________. 8. Aid or loans given by the government of a rich country like the U.S. to a poor country like Ethiopia is called _________________development assistance. 9. Aid or loans given by international institutions such as the World Bank, IMF, or United Nations Development Program (UNDP) is called ______________ development assistance. 10. Suppose a U.S. company builds a factory in China to produce electronic goods. When such a private company acquires or creates assets for their own business operations in a foreign country, it is engaging in __________________ investment. True or False 11. Economic growth will always lead to inflation. 12. A major cause of Japan’s extraordinary growth in the period of 1950-1980 was its high savings rate, which reached as high as 20% of household income in the mid 1970s..
14-3
13. Additions to a nation’s capital stock will automatically lead to economic growth. 14. History shows that having a plentiful resources of arable land, energy, and/or minerals is a requirement for a country to have strong economic growth and development. 15. A system of private property rights is essential for economic growth. Short Answer 16. Explain the difference between economic growth and economic development. 17. Given data on growth of real GDP and the growth of population, how can growth in real GDP per capita be calculated? 18. What is the economy-wide production function in Solow’s growth model? Also define the variables. 19. What is the growth accounting equation? 20. According to the Solow growth model, what are the main ingredients to achieving increases in income per capita? 21. Explain the idea of convergence. 22. Does the evidence suggest that convergence is indeed occurring? 23. Identify 7 factors that can promote economic growth and development. Are these factors requirements for achieving economic growth?
14-4
24. What kinds of institutions are beneficial for promoting economic growth and development? 25. Why have the net official flows from multilateral agencies turned negative in recent years? Problems 1. Suppose the following data for the fictitious country Growland: 2005 2006 Real GDP (in 2000 U.S. dollars)
286.9 billion 301.3 billion
Population 220.5 million 223.0 million a. Calculate the growth in real GDP between 2005 and 2006. b. Calculate the GDP per capita for 2005 and 2006. (Note that GDP is measured in billions, while population is measured in millions.) c. Calculate the population growth rate between 2005 and 2006. d. Calculate the growth rate of GDP per capita. 2. Draw a graph with shifts in the ADE/ASR curves to illustrate each of the following: a. Economic growth with inflation rising. b. Economic growth with inflation falling.
14-5
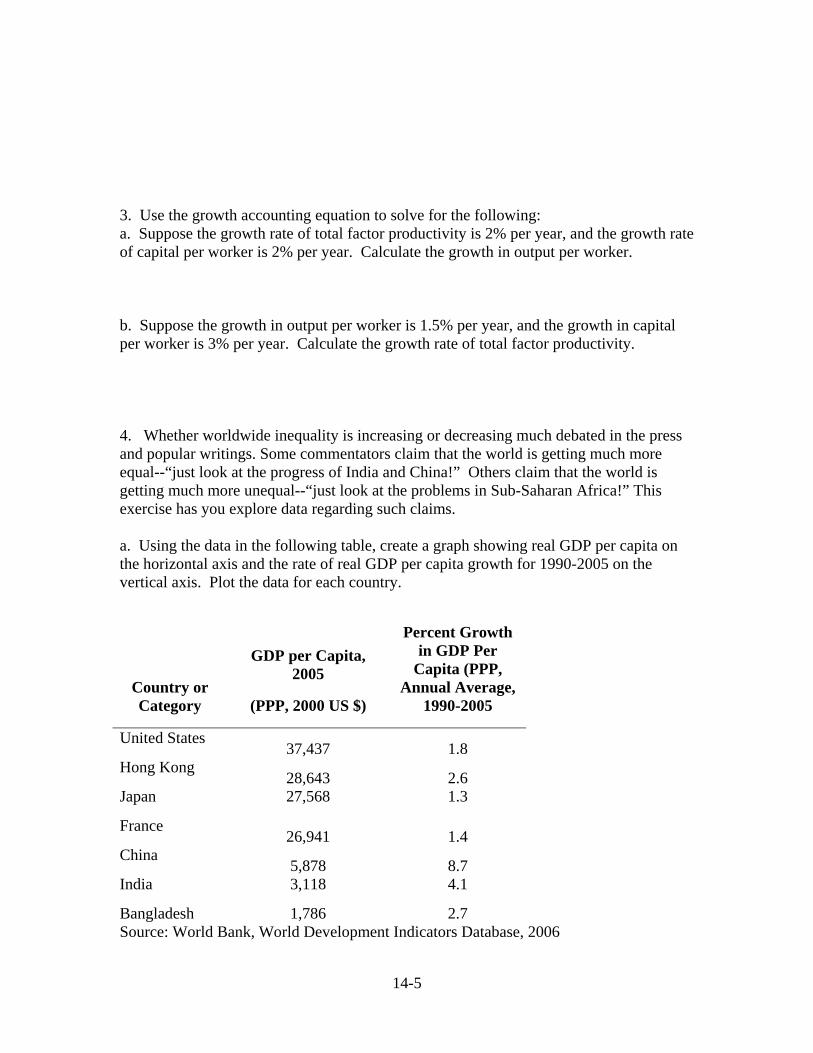
3. Use the growth accounting equation to solve for the following: a. Suppose the growth rate of total factor productivity is 2% per year, and the growth rate of capital per worker is 2% per year. Calculate the growth in output per worker. b. Suppose the growth in output per worker is 1.5% per year, and the growth in capital per worker is 3% per year. Calculate the growth rate of total factor productivity. 4. Whether worldwide inequality is increasing or decreasing much debated in the press and popular writings. Some commentators claim that the world is getting much more equal--“just look at the progress of India and China!” Others claim that the world is getting much more unequal--“just look at the problems in Sub-Saharan Africa!” This exercise has you explore data regarding such claims. a. Using the data in the following table, create a graph showing real GDP per capita on the horizontal axis and the rate of real GDP per capita growth for 1990-2005 on the vertical axis. Plot the data for each country.
Country or Category
GDP per Capita, 2005
(PPP, 2000 US $)
Percent Growth in GDP Per
Capita (PPP, Annual Average,
1990-2005
United States 37,437 1.8
Hong Kong 28,643 2.6
Japan 27,568 1.3
France 26,941 1.4
China 5,878 8.7
India 3,118 4.1
Bangladesh 1,786 2.7 Source: World Bank, World Development Indicators Database, 2006
14-6
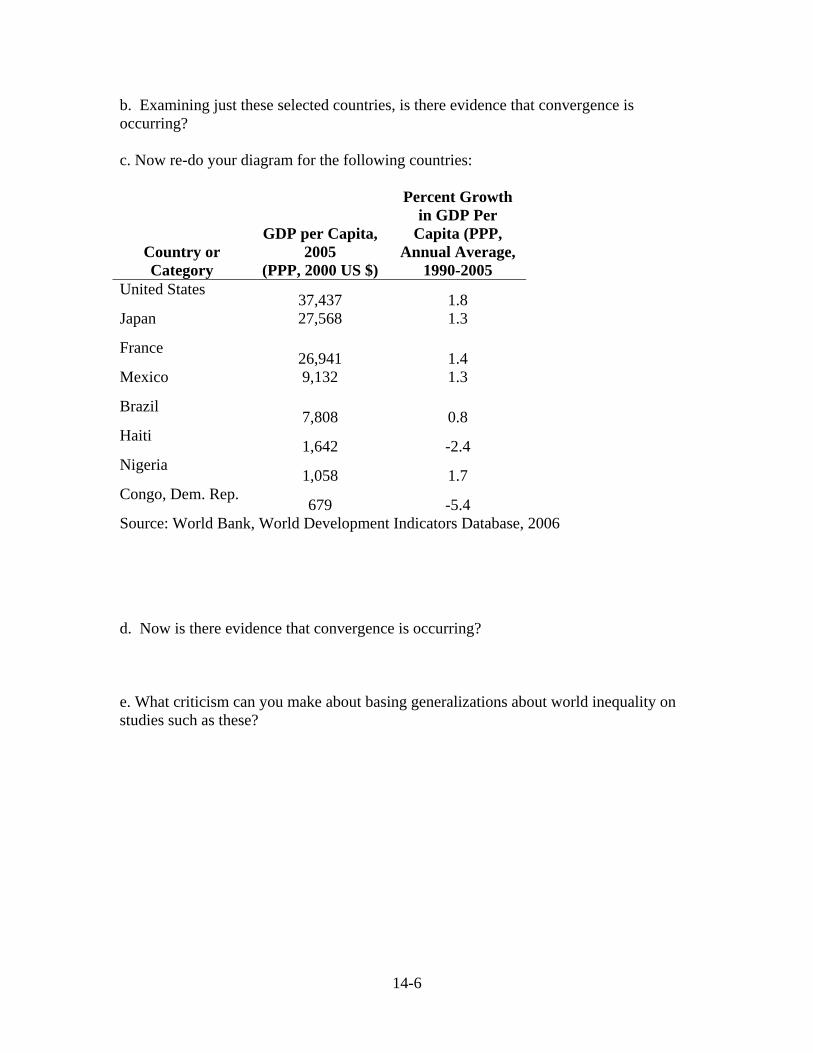
b. Examining just these selected countries, is there evidence that convergence is occurring? c. Now re-do your diagram for the following countries:
Country or Category
GDP per Capita, 2005
(PPP, 2000 US $)
Percent Growth in GDP Per
Capita (PPP, Annual Average,
1990-2005 United States
37,437 1.8 Japan 27,568 1.3
France 26,941 1.4
Mexico 9,132 1.3
Brazil 7,808 0.8
Haiti 1,642 -2.4
Nigeria 1,058 1.7
Congo, Dem. Rep. 679 -5.4
Source: World Bank, World Development Indicators Database, 2006
d. Now is there evidence that convergence is occurring? e. What criticism can you make about basing generalizations about world inequality on studies such as these?
14-7
Self Test 1. Suppose in a given year, a country’s real GDP growth rate was 5%. And its population grew at 2%. Then its per capita real GDP growth rate was:
a. 7% b. 5% c. 3% d. 2% e. 2.5%
2. If an economy is experiencing economic growth, this is usually shown in the ADE/ASR model with
a. a shift to the up of the ASR and maximum capacity b. a shift to the left of the ADE curve. c. a shift to the right of the ADE curve. d. a shift to the right of the ASR and maximum capacity e. a shift to the right of the ASR and maximum capacity, together with a shift to the
right of the ADE curve. 3. Which of the following is not a factor of production?
a. Labor b. Capital c. Output d. Natural resources e. Human capital
4. In the Solow growth model, the economy-wide production function can be written as:
a. Y = A + K 0.3L 0.7
b. Y = A/ K 0.7L 0.3
c. Y = K 0.3L 0.7 - A d. Y = A K 0.3L 0.7
e. Y = A K 0.7L 0.3
5. Suppose total factor productivity is growing at 1.5% per year, and capital per worker is growing at 3% per year. Then according to the growth accounting equation, the growth rate of output per worker is:
a. 0.6% b. 1.4% c. 1.7% d. 2.4% e. None of the above.
14-8
6. What are the main ingredients for achieving economic growth per capita, according to the Solow growth model?
a. Increase the amount of manufactured capital per person b. Increases in technological innovation c. Increase the number of workers d. A and B e. All of the above.
7. The process of social and economic change that began in 18th century England and led to huge increases in output per worker is called
a. the democratic revolution b. the communist revolution c. the industrial revolution d. the gender revolution e. the environmental revolution
8. Which of the following was not one of the factors that contributed to the Industrial revolution?
a. New agricultural techniques, new tools and machines that boosted agricultural productivity.
b. New technologies adopted in factory production that boosted output in manufacturing.
c. New communication technologies that boosted output in the service sector. d. Supplies of cheap raw materials from other countries. e. Access to markets in other countries in which to sell finished products.
9. Which of the following is one of the trends of global economic growth in the 20th century?
a. World per capita economic output grew about fivefold. b. The use of energy more than tripled. c. Per capita incomes steadily increased. d. Most of the growth came in the second half of the 20th century. e. All of the above.
14-9
10. Which of the following factors were key to Japan’s rapid economic growth in the 1950-1980 period?
a. High savings rates. b. The investment of savings in machines and equipment to boost productivity rates. c. Investment in human capital. d. Promotion of exports. e. All of the above.
11. Which of the following characterizes the global distribution of per capita GDP across countries?
a. Income per person is highest in the industrialized countries. b. Income per person is lowest in many African and Asian countries. c. The income per person in many industrialized countries such as U.S., Canada, Europe, and Japan is more than $25,000. d. Many of the low-income countries in sub-Sahara have income per capita lower than $2,500. e. All of the above.
12. Which of the following best characterizes the distribution of the world’s income among the world’s households?
a. Nearly three-quarters of the world’s income goes to the richest 20 percent, while the poorest 40 percent only receive 5 percent of the world’s income.
b. Nearly half of the world’s income goes to the richest 20%, while the poorest 20 percent only receive 1.5% of the world’s income.
c. Nearly half of the world’s income goes to the richest 20%, while the poorest 40 percent only receive 10% of the world’s income.
d. About one-third of the world’s income goes to the richest 20 percent, while the poorest 20 percent receive about 30% of the world’s income.
e. None of the above. 13. The evidence on the convergence debate suggests:
a. It is clear that convergence is occurring. b. It is clear that convergence is failing to occur. c. If one examines the number of poor countries remaining in poverty, it appears
convergence is not occurring. But if one adjusts for population and look at the number of people moving out of poverty, it does appear convergence is occurring.
d. If one examines the number of poor countries remaining in poverty, it appears convergence is indeed occurring. But if one adjusts for population and look at the number of people moving out of poverty, it does not appear convergence is occurring.
e. Developing countries are neither converging nor diverging with the developed countries, but are growing at the same rate as the developed countries.
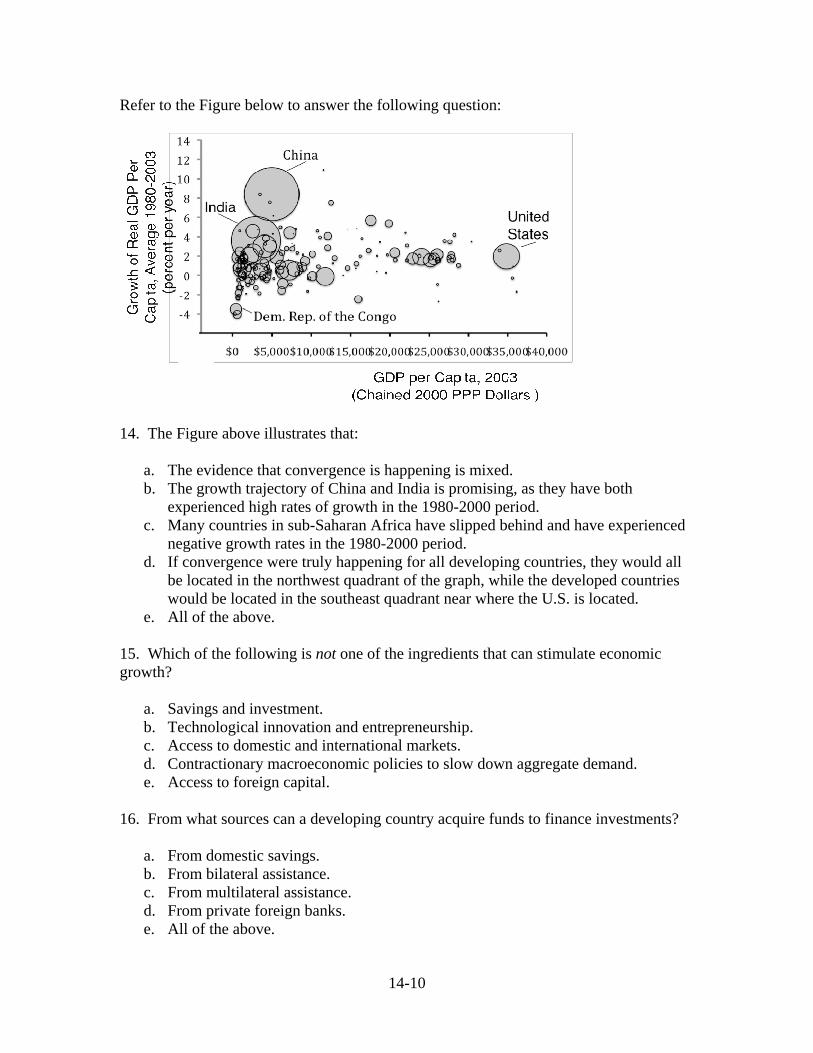
Refer to the Figure below to answer the following question:
14. The Figure above illustrates that:
a. The evidence that convergence is happening is mixed. b. The growth trajectory of China and India is promising, as they have both
experienced high rates of growth in the 1980-2000 period. c. Many countries in sub-Saharan Africa have slipped behind and have experienced
negative growth rates in the 1980-2000 period. d. If convergence were truly happening for all developing countries, they would all
be located in the northwest quadrant of the graph, while the developed countries would be located in the southeast quadrant near where the U.S. is located.
e. All of the above. 15. Which of the following is not one of the ingredients that can stimulate economic growth?
a. Savings and investment. b. Technological innovation and entrepreneurship. c. Access to domestic and international markets. d. Contractionary macroeconomic policies to slow down aggregate demand. e. Access to foreign capital.
16. From what sources can a developing country acquire funds to finance investments?
a. From domestic savings. b. From bilateral assistance. c. From multilateral assistance. d. From private foreign banks.
14-10
e. All of the above.
14-11
17. Which of the following have sharply increased as a source of financial capital to developing countries in the years 2001 - 2005?
a. Official flows from multilateral agencies. b. Private capital flows (both FDI and loans). c. Bilateral grants. d. Workers’ remittances e. All of the above.
18. Approximately how much in development assistance (as a % of GDP) do the rich countries give to poor developing countries?
a. Less than 1% b. About 1% c. About 3% d. About 5% e. About 10%
19. Which of the following was not one of the main policies promoted in the “Washington Consensus”?
a. Fiscal discipline b. Development of infrastructure, health, and education c. Market liberalization d. Privatization e. Trade liberalization
20. Which of the following best characterizes the record of the policies of the “Washington Consensus”?
a. The countries that most strictly followed the World Bank’s market-oriented development path suffered the most severe crises.
b. Some countries in Africa were forced to make cutbacks in desperately needed health and education.
c. Countries were barred from using fiscal policy for macroeconomic stabilization. d. Some countries that did not follow the Washington Consensus experienced
notable success. e. All of the above.
14-12
Answers to Active Review Questions 1. growth 2. development 3. factors of production 4. total factor (productivity) 5. Industrial Revolution 6. virtuous cycles (in development) 7. convergence 8. bilateral 9. multilateral 10. foreign direct (investment) 11. False, the effect of economic growth on inflation is ambiguous. If the ASR curve shifts further to the right than the ADE curve, the inflation rate may decline. If the ADE curve shifts further to the right than the ASR curve, the inflation rate may rise. 12. True. 13. False. Poorly planned or misguided development projects may lead to waste or even harm. 14. False. While natural resources are generally very important, there are some economies with few natural resources that have done very well (e.g. Hong Kong and Singapore, which are natural ports but have little energy or mineral resources or arable land). 15. False. Some countries, like China and Vietnam, have been successful in achieving economic growth without a system of private property rights. 16. Economic growth is the growth in production of output (or income), and can be measured as the percent change in real GDP. Economic development is the movement of the population from poverty into a situation of material plenty or well-being. 17. Growth in real GDP per capita = growth in real GDP – growth in population. 18. Y = A K 0.3L 0.7 , where Y is aggregate output; A is “total factor productivity” (a number based on the current state of technology); K is a quantitative measure of the size of the stock of manufactured capital; and L the quantity of labor used during the period of time, measured as the number of workers. 19. It is an equation that measures the growth rate of output per worker. Specifically, it is: growth rate of output per worker = growth rate of total factor productivity + 0.3(growth rate of manufactured capital per worker). 20. The main ingredients are increasing the manufactured capital per person, and increasing technology. 21. The idea of convergence is that the poor countries are on a path to “catch up” with the rich countries, because they are starting off with little capital. So as they experience increases in their manufactured capital stock, their output will grow at a faster rate than that of rich countries that are already rich in manufactured capital. 22. If one examines the number of poor countries remaining in poverty, and one counts each country equally, then it appears convergence is not occurring. But if one adjusts for population and look at the number of people moving out of poverty, it does appear convergence is occurring. This is primarily due to the rapid growth rates of the two most populous countries, China and India.
14-13
23. The factors that can promote economic growth include: savings and investment, technological innovation and entrepreneurship, good macroeconomic policies that stabilize aggregate demand, access to international markets, availability of natural resources, access to foreign capital, good institutions. These factors are not requirements for economic growth, however, as there are many examples of countries that have achieved growth without one or more of these factors. 24. The beneficial institutions include: a good banking system; a good legal system with private property rights and contact enforcement; and the absence of corruption, internal conflict, and political instability. 25. Because developing countries are currently paying back more due to their heavy debt burdens, than what they receive in new loans. Answers to Problems 1. a. [(301.3 − 286.9) / 286.9] × 100 = 5.0% b. Real GDP per capita for 2005 = $286,900,000,000 / 220,500,000 = $1,301 Real GDP per capita for 2006 = $301,300,000,000 / 223,000,000 = $1,351 c. [(223.0 − 220.5)/220.5] × 100 = 1.1% d. 5.0% − 1.1% = 3.9% Calculating the percentage change in real GDP per capita from part b, as (1351-1301)/1301 × 100, gives a rate of 3.8%. This is also an acceptable answer. Technical Note: The simple formula given for figuring percentage changes is to blame for the discrepancy between the two answers. In practice, professional economists often use a different formula--the “log-difference formula”--to calculate percentage changes. Using the “ln” (natural log) function on a calculator or spreadsheet, the equation [ln(GDP2006) - ln(GDP2006)] × 100 gives a measure of percentage change. Using this method of calculating percentage changes, there would be no discrepancies (except due to rounding.)
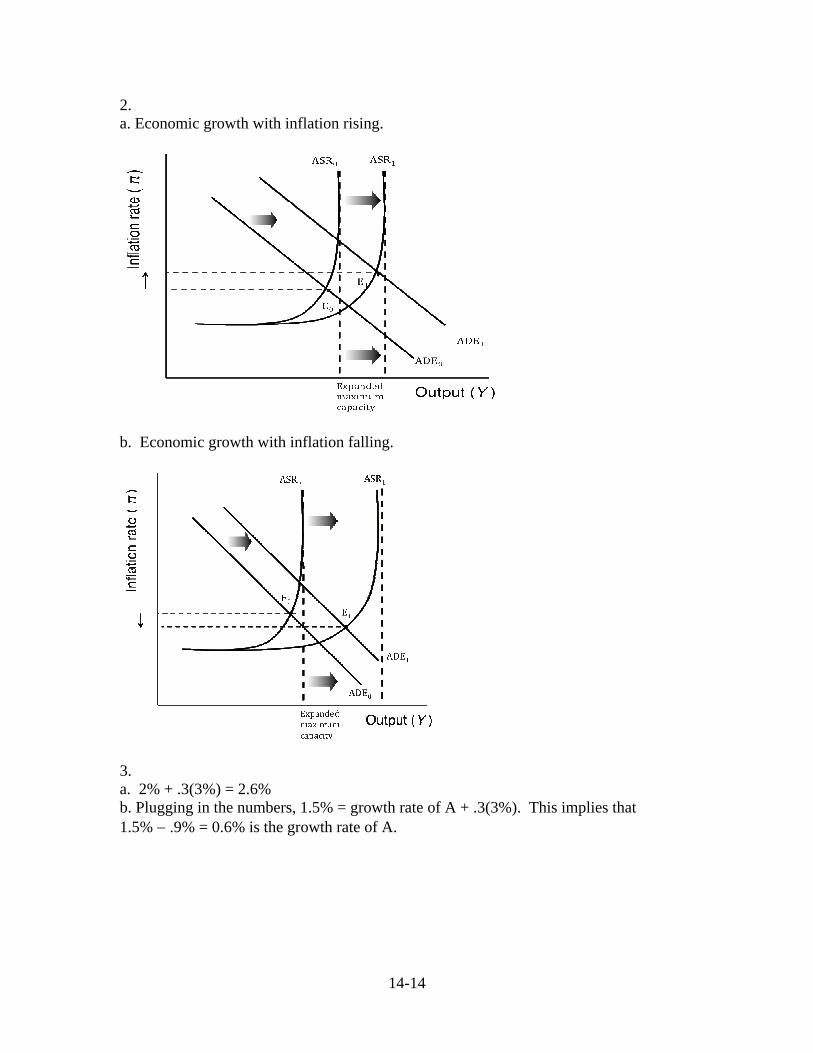
2. a. Economic growth with inflation rising.
b. Economic growth with inflation falling.
3. a. 2% + .3(3%) = 2.6% b. Plugging in the numbers, 1.5% = growth rate of A + .3(3%). This implies that 1.5% − .9% = 0.6% is the growth rate of A.
14-14
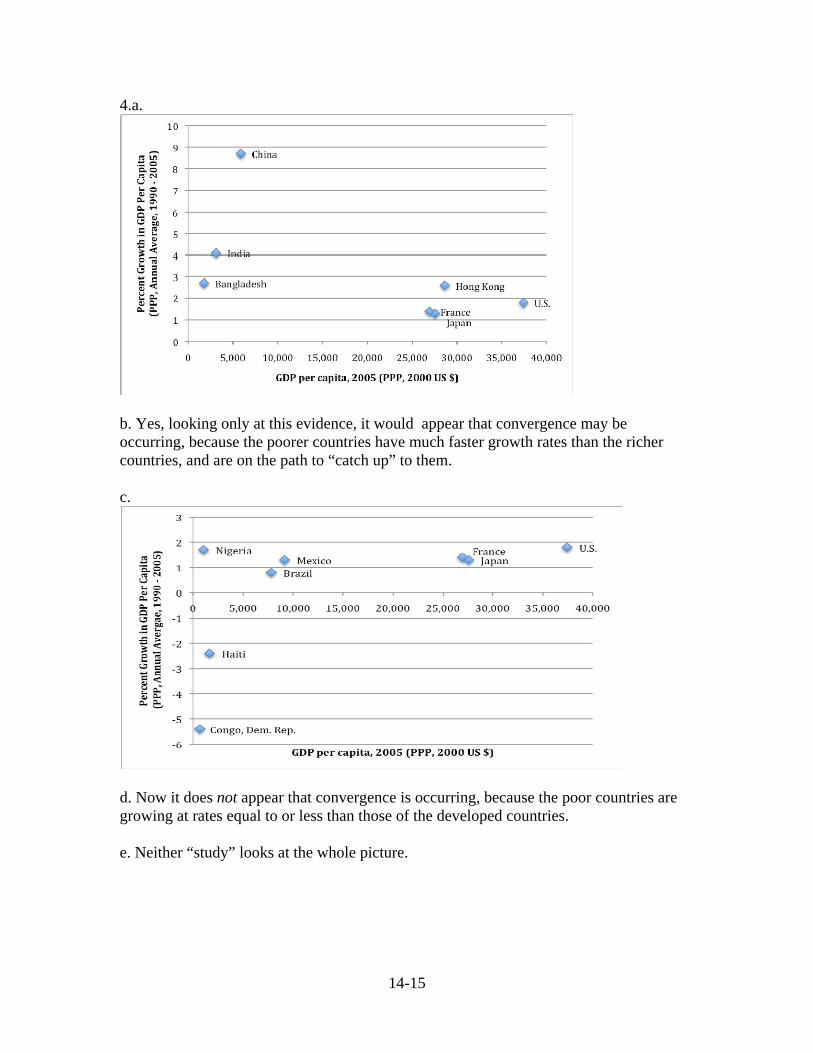
4.a.
b. Yes, looking only at this evidence, it would appear that convergence may be occurring, because the poorer countries have much faster growth rates than the richer countries, and are on the path to “catch up” to them. c.
d. Now it does not appear that convergence is occurring, because the poor countries are growing at rates equal to or less than those of the developed countries. e. Neither “study” looks at the whole picture.
14-15
14-16
Answers to Self Test Questions
1. C 2. E 3. C 4. D 5. D 6. D 7. C 8. C 9. E 10. E
11. E 12. A 13. C 14. E 15. D 16. E 17. B 18. A 19. B 20. E