Embed Size (px)
DESCRIPTION
Chapter 16 Global industry profiles. Lecture plan. Sectoral trends and prospects for three global industries: grain automotive telecommunications. Historical overview Production and consumption Industry structure Grain traders Government role Grain trade and investment - PowerPoint PPT Presentation
Citation preview
Copyright 2006 McGraw-Hill Australia Pty Ltd. PPTs t/a International Trade and Investment: An Asia-Pacific Perspective 2e by Gionea. Slides prepared by John Gionea..
16–1
Chapter 16 Global industry
profiles
Copyright 2006 McGraw-Hill Australia Pty Ltd. PPTs t/a International Trade and Investment: An Asia-Pacific Perspective 2e by Gionea. Slides prepared by John Gionea..
16–2
Lecture plan
Sectoral trends and prospects for three
global industries:
• grain
• automotive
• telecommunications
Copyright 2006 McGraw-Hill Australia Pty Ltd. PPTs t/a International Trade and Investment: An Asia-Pacific Perspective 2e by Gionea. Slides prepared by John Gionea..
16–3
Grain industry
• Historical overview• Production and
consumption• Industry structure• Grain traders• Government role• Grain trade and investment• Prospects for the grain market
Copyright 2006 McGraw-Hill Australia Pty Ltd. PPTs t/a International Trade and Investment: An Asia-Pacific Perspective 2e by Gionea. Slides prepared by John Gionea..
16–4
The world grain production
• Wheat & feed grain production dominated by about 8 major suppliers, mostly developed countries (around 75% of world’s grain production).
• Rice production is dominated by Asian countries (China, India, Indonesia, Philippines, and Bangladesh).
• Long periods of oversupply interrupted by brief periods of shortage.
• Accumulation of stocks by protectionist policies (e.g. EU, US)

Copyright 2006 McGraw-Hill Australia Pty Ltd. PPTs t/a International Trade and Investment: An Asia-Pacific Perspective 2e by Gionea. Slides prepared by John Gionea..
16–5
World grain consumption
• Strong population growth (+2 m. over 1971–97)
• Changing diets in developing countries favour grain-intensive foods.
• Income growth (income elasticities in low-income countries tend to be > than in high-income countries).
• Overall, world demand for grain has slowed down over last 2 decades, mainly due to slow down in population.
Copyright 2006 McGraw-Hill Australia Pty Ltd. PPTs t/a International Trade and Investment: An Asia-Pacific Perspective 2e by Gionea. Slides prepared by John Gionea..
16–6
Grain importers
• Chronically food deficient countries: Singapore, Japan, Middle East
• Import requirements reasonably stable and predictable
• Countries whose import requirements are small and confined to specialist needs (UK)
• Countries relying on imports to close gap between production and consumption (China, ex-USSR, Saudi Arabia)

Copyright 2006 McGraw-Hill Australia Pty Ltd. PPTs t/a International Trade and Investment: An Asia-Pacific Perspective 2e by Gionea. Slides prepared by John Gionea..
16–7
World grain exports* in 2003 by main grains (%). Total value: US$37.2b
* SITC 041–045
Source: ITC UNCTAD/WTO

Copyright 2006 McGraw-Hill Australia Pty Ltd. PPTs t/a International Trade and Investment: An Asia-Pacific Perspective 2e by Gionea. Slides prepared by John Gionea..
16–8
Grain prices
• Prices are volatile; reasons:
– weather
– oil prices (influencing costs for farmers)
– value of US dollar
– government policies (EU, US)
– political events (wars, nuclear accidents)
• Not necessarily volatile incomes for farmers, or large price fluctuations for consumers
• Long-term decline in real grain prices (Engel’s law)

Copyright 2006 McGraw-Hill Australia Pty Ltd. PPTs t/a International Trade and Investment: An Asia-Pacific Perspective 2e by Gionea. Slides prepared by John Gionea..
16–9
Trade policies
• Trade dominated by private firms, but governments have major role
• Protectionist policies in exporting and importing countries
• Uruguay Round committed major exporting countries to liberalisation
Copyright 2006 McGraw-Hill Australia Pty Ltd. PPTs t/a International Trade and Investment: An Asia-Pacific Perspective 2e by Gionea. Slides prepared by John Gionea..
16–10
Major grain trade players
• Private traders– Cargill (Tradax), (Continental), Louis Dreyfus,
Andre (Garnac in US), Bunge & Born• State/farmers trading organisations
– Canadian Wheat Board, Australian
Wheat Board (privatised), Middle East Trade Boards
• State importing organisations – Iran, Egypt, Iraq
Copyright 2006 McGraw-Hill Australia Pty Ltd. PPTs t/a International Trade and Investment: An Asia-Pacific Perspective 2e by Gionea. Slides prepared by John Gionea..
16–11
Futures contracts
• Standard quantity and quality
• Future month for delivery
• Traded at central exchanges (Chicago, Kansas)
• ‘Sell’ contract can be settled by a ‘buy’ transaction, and by delivering the commodity against the contract.
• Enables users of futures to protect their cash positions by hedging (e.g. taking equal and opposite positions in cash and futures markets)
Copyright 2006 McGraw-Hill Australia Pty Ltd. PPTs t/a International Trade and Investment: An Asia-Pacific Perspective 2e by Gionea. Slides prepared by John Gionea..
16–12
Futures traders
• Business men who produce, market and process various commodities
• Speculators who voluntarily risk their capital with the expectation of making profits
Copyright 2006 McGraw-Hill Australia Pty Ltd. PPTs t/a International Trade and Investment: An Asia-Pacific Perspective 2e by Gionea. Slides prepared by John Gionea..
16–13
Marketing policies
• Traders cannot significantly influence international prices, but they ‘make money’ at any level of price.
• Price is the most important factor in the marketing mix programs.
• Futures and options used—does not eliminate risks
• Promotion: seminars, investment in processing facilities or storage capacities

Copyright 2006 McGraw-Hill Australia Pty Ltd. PPTs t/a International Trade and Investment: An Asia-Pacific Perspective 2e by Gionea. Slides prepared by John Gionea..
16–14
Prospects of the grain market
• More stable prices– growing population– trade liberalisation (Uruguay and Doha
Rounds) – global warming– low productivity growth
• Biotechnology? (may increase supply)• China prospects?• Food security? (good prospects)
Copyright 2006 McGraw-Hill Australia Pty Ltd. PPTs t/a International Trade and Investment: An Asia-Pacific Perspective 2e by Gionea. Slides prepared by John Gionea..
16–15
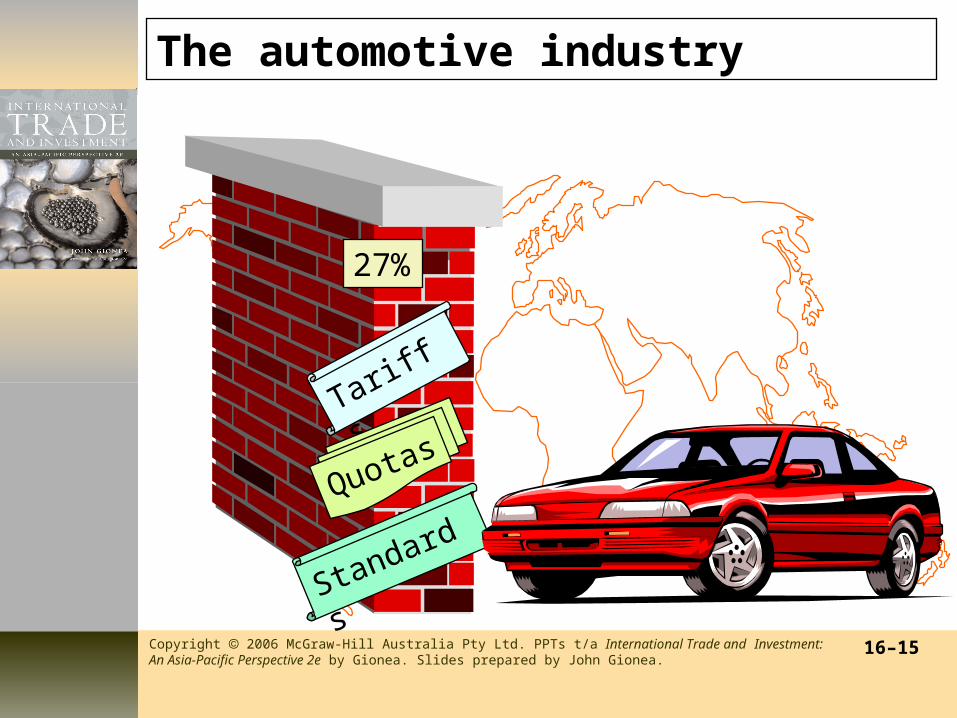
The automotive industry
Tariffs
27%
Quotas
Standards
Copyright 2006 McGraw-Hill Australia Pty Ltd. PPTs t/a International Trade and Investment: An Asia-Pacific Perspective 2e by Gionea. Slides prepared by John Gionea..
16–16
Brief automotive history
• Early 1900s: Henry Ford’s company brought standardised parts, mass production and use of a continuous assembly line into operation
• Through strategies of foreign direct investment, Ford and GM obtained strong market positions in Europe and North America.
• Assembly of passenger motor vehicles (PMVs) commenced in Australia in 1925.
• Post-World War 2: boom in European production by such companies as Fiat (Italy), Renault (France), and Volkswagen (Germany).
• Further economies of scale brought about by European economic integration.
Copyright 2006 McGraw-Hill Australia Pty Ltd. PPTs t/a International Trade and Investment: An Asia-Pacific Perspective 2e by Gionea. Slides prepared by John Gionea..
16–17
Brief automotive history cont.
• Japanese automotive expansion– 1960s: < 1m units– 1970: 3m units– energy crisis: assault of small/medium
cars; US market share reaches 23%– voluntary export restraints (VERs in
1994: 4.2m cars in US market)– Japanese FDI in US: 2m cars by 1990
• South Korean automotive expansion
Copyright 2006 McGraw-Hill Australia Pty Ltd. PPTs t/a International Trade and Investment: An Asia-Pacific Perspective 2e by Gionea. Slides prepared by John Gionea..
16–18
More motor vehicles on the roads
• Manufacturing in the world’s GDP declined from 27% in 1970 to only 20% in 2001.
• In 1950 only 70 million cars, trucks, and buses on the world's roads.
• By 1994, about nine times that number (630 million).
• Since about 1970, global fleet growing at rate of about 16 million vehicles per year.
• By 2025 there will be well over 1 billion vehicles on the world's roads.
Copyright 2006 McGraw-Hill Australia Pty Ltd. PPTs t/a International Trade and Investment: An Asia-Pacific Perspective 2e by Gionea. Slides prepared by John Gionea..
16–19
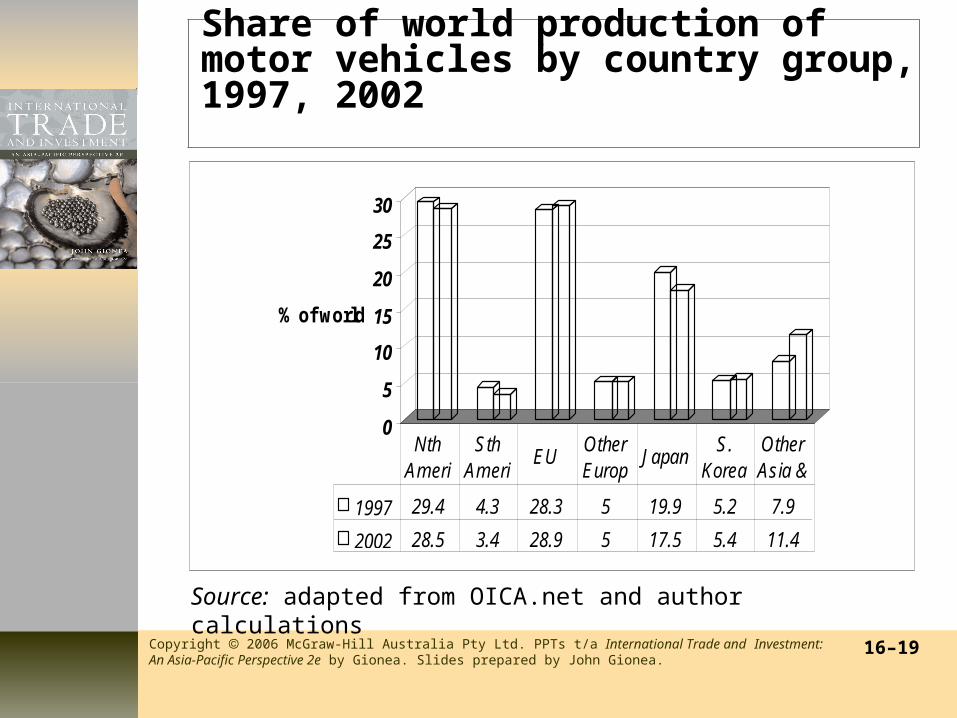
Share of world production of motor vehicles by country group, 1997, 2002
0
5
10
15
20
25
30
% of world
1997 29.4 4.3 28.3 5 19.9 5.2 7.9
2002 28.5 3.4 28.9 5 17.5 5.4 11.4
Nth Ameri
Sth Ameri
EUOther Europ
JapanS.
KoreaOther Asia &
Source: adapted from OICA.net and author calculations
Copyright 2006 McGraw-Hill Australia Pty Ltd. PPTs t/a International Trade and Investment: An Asia-Pacific Perspective 2e by Gionea. Slides prepared by John Gionea..
16–20
Importance of the automotive industry
• Significant employer of both capital and labour
• Employs 2.5 million people worldwide
• Three times as many are employed in garages and by car component suppliers
• ‘Barometer’ of the economy
• Provided 9.9% of the world’s merchandise exports and about 13.3% of exports of manufactures in 2003

Copyright 2006 McGraw-Hill Australia Pty Ltd. PPTs t/a International Trade and Investment: An Asia-Pacific Perspective 2e by Gionea. Slides prepared by John Gionea..
16–21
Oversupply and declining profitability
• 1996: automotive industry working at 73% capacity. Reasons:
– old markets have matured; no net growth
• Rush for overseas investment
– ‘build where you sell’—‘market orientation’
– tariff protection; local content rules
– overcapacity in developing markets of Asia and Latin America
Copyright 2006 McGraw-Hill Australia Pty Ltd. PPTs t/a International Trade and Investment: An Asia-Pacific Perspective 2e by Gionea. Slides prepared by John Gionea..
16–22
World trade in automotive products
• 2003 value: US$723b (9.9% of total world merchandise exports)
• High concentration: 10 exporting countries/groupings held in 2003 about 94% of world exports (comparative indicator in world imports is about 84%)
• Top import markets are EU (43% of world imports, including intra-EU imports); US (about 25% of world ‘s imports); China’s share (1.7%)
• 2003 Australian auto imports: US$11.1b (1.5%)
• Regional concentration
• Growing intra-firm (MNEs) trade
World trade in automotive products
Copyright 2006 McGraw-Hill Australia Pty Ltd. PPTs t/a International Trade and Investment: An Asia-Pacific Perspective 2e by Gionea. Slides prepared by John Gionea..
16–23
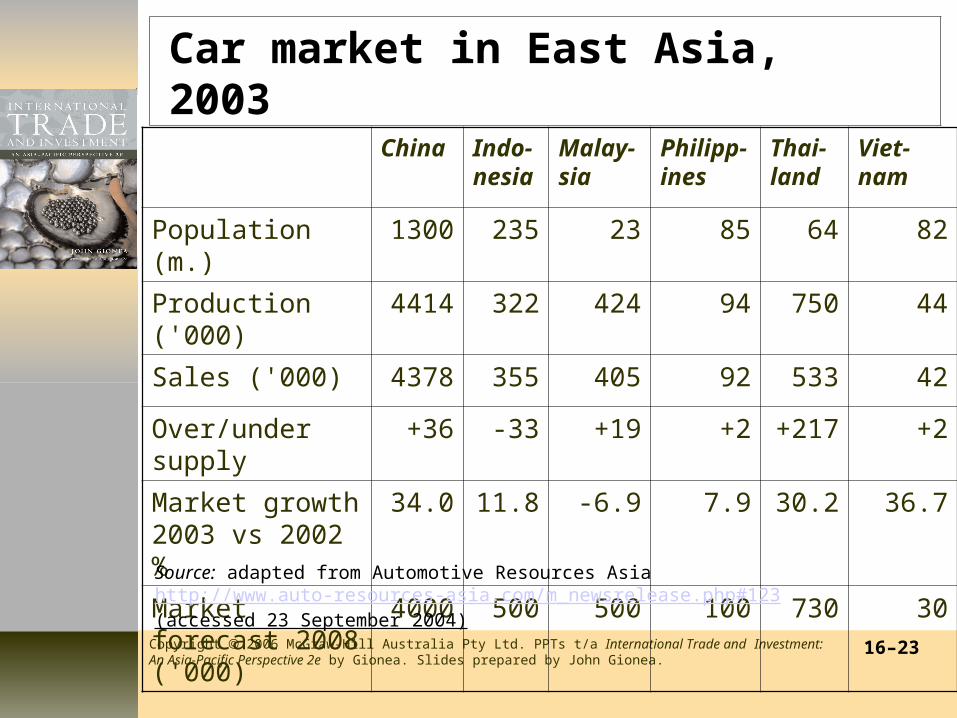
Car market in East Asia, 2003
China Indo-nesia
Malay-sia
Philipp-ines
Thai-land
Viet-nam
Population (m.) 1300 235 23 85 64 82
Production ('000) 4414 322 424 94 750 44
Sales ('000) 4378 355 405 92 533 42
Over/under supply
+36 -33 +19 +2 +217 +2
Market growth 2003 vs 2002 %
34.0 11.8 -6.9 7.9 30.2 36.7
Market forecast 2008 ('000)
4000 500 500 100 730 30
Source: adapted from Automotive Resources Asia http://www.auto-resources-asia.com/m_newsrelease.php#123 (accessed 23 September 2004)
Copyright 2006 McGraw-Hill Australia Pty Ltd. PPTs t/a International Trade and Investment: An Asia-Pacific Perspective 2e by Gionea. Slides prepared by John Gionea..
16–24
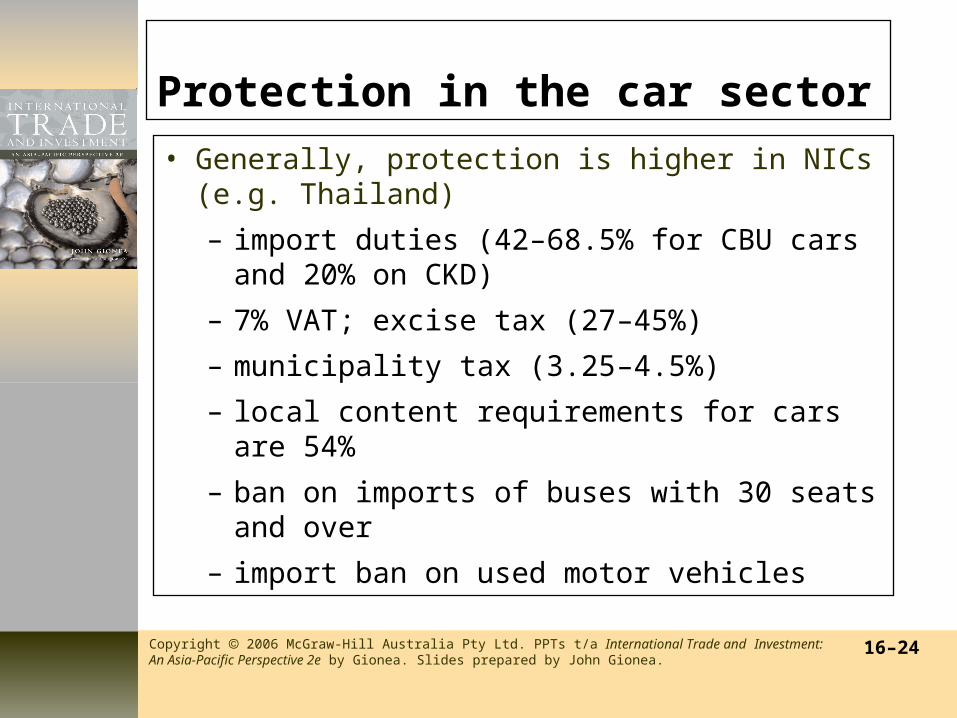
Protection in the car sector
• Generally, protection is higher in NICs (e.g. Thailand)
– import duties (42–68.5% for CBU cars and 20% on CKD)
– 7% VAT; excise tax (27–45%)
– municipality tax (3.25–4.5%)
– local content requirements for cars are 54%
– ban on imports of buses with 30 seats and over
– import ban on used motor vehicles
Copyright 2006 McGraw-Hill Australia Pty Ltd. PPTs t/a International Trade and Investment: An Asia-Pacific Perspective 2e by Gionea. Slides prepared by John Gionea..
16–25
Protection in the car sector cont.
• In developed countries tariff protection generally replaced by non-tariff barriers (e.g. VER)
• Very sensitive sector; powerful lobby groups and unions
• Australia: decision to freeze tariffs at 15% for 5 years after 2000
Copyright 2006 McGraw-Hill Australia Pty Ltd. PPTs t/a International Trade and Investment: An Asia-Pacific Perspective 2e by Gionea. Slides prepared by John Gionea..
16–26
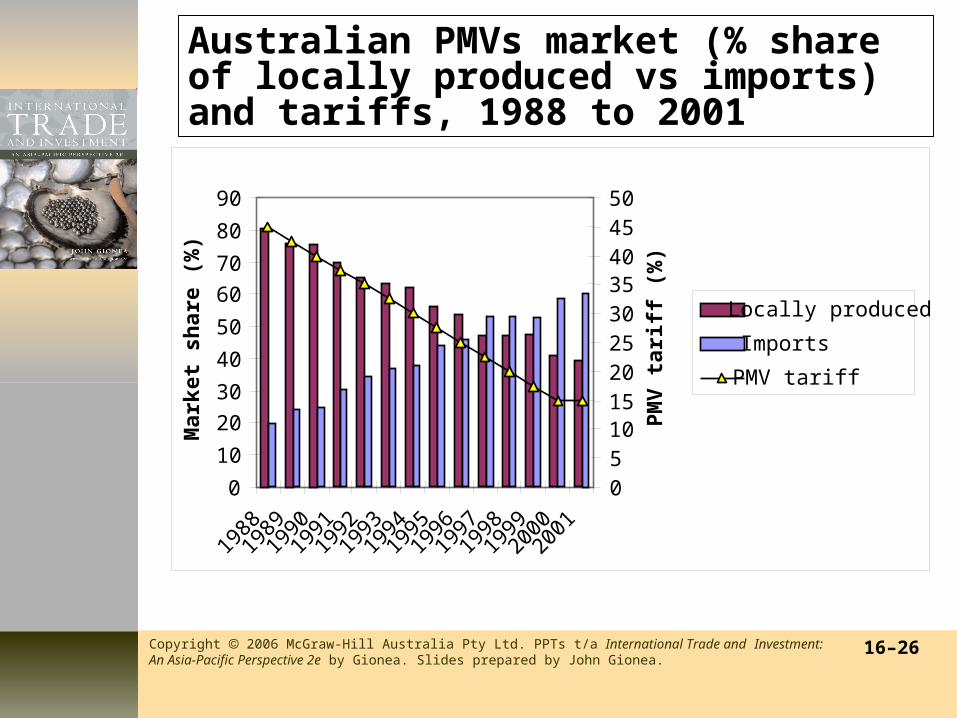
Australian PMVs market (% share of locally produced vs imports) and tariffs, 1988 to 2001
0
10
20
30
40
50
60
70
80
90
198819
8919
9019
9119
9219
9319
9419
9519
9619
9719
9819
9920
0020
01
Mar
ket
shar
e (%
)
05101520253035404550
PM
V t
arif
f (%
)
Locally produced
Imports
PMV tariff

Copyright 2006 McGraw-Hill Australia Pty Ltd. PPTs t/a International Trade and Investment: An Asia-Pacific Perspective 2e by Gionea. Slides prepared by John Gionea..
16–27
1996
UK, 3%
Germany, 4%
Middle East, 6%
Japan, 9%
NAFTA/US, 18%
New Zealand,
25%
Rest of the world, 14%
South Korea, 11%
ASEAN, 10%
2001
NAFTA, 23%
Middle East, 37%
New Zealand,
15%
South Korea, 8%
Japan, 3%
Indonesia, 3%
UK, 2%Rest of the world, 8%
Australian automotive exports by destination, %, 1996, 2001
Source: Compiled from Industry Commission Inquiry Report, The Automotive Industry, 1997 and Commonwealth Department of Industry, Tourism and Resources, Key Automotive Statistics 2002, 2003, viewed 15 May 2004, <http://www.industry.gov.au/assets/documents/ itrinternet/ automotive_keystats2003.pdf>
Copyright 2006 McGraw-Hill Australia Pty Ltd. PPTs t/a International Trade and Investment: An Asia-Pacific Perspective 2e by Gionea. Slides prepared by John Gionea..
16–28
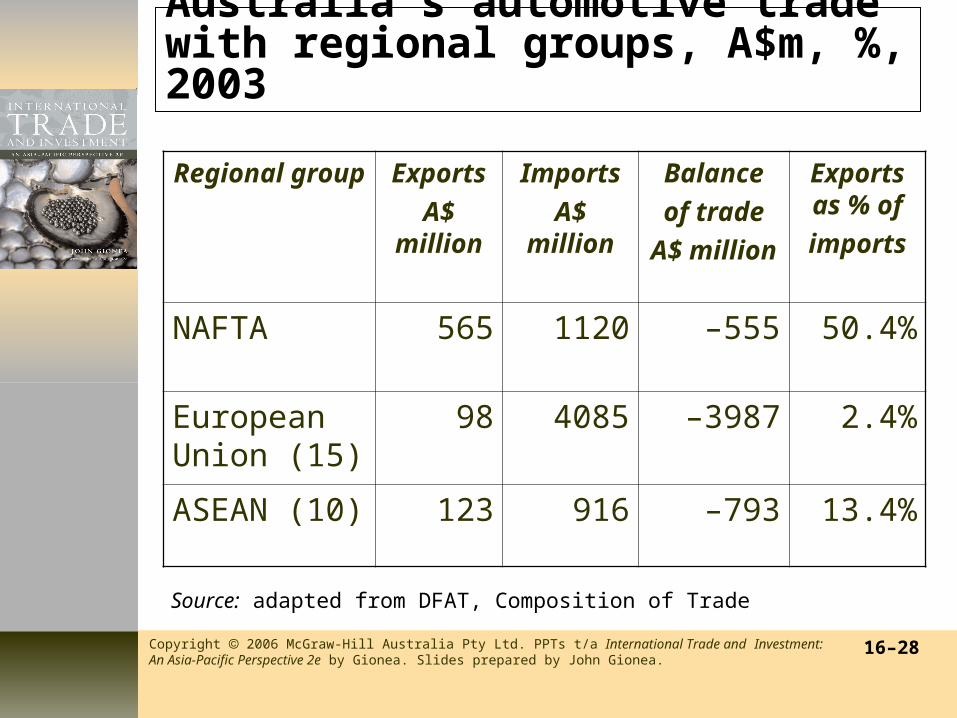
Australia’s automotive trade with regional groups, A$m, %, 2003
Regional group
Exports
A$ million
Imports
A$ million
Balance
of trade
A$ million
Exports as % of
imports
NAFTA 565 1120 –555 50.4%
European Union (15)
98 4085 –3987 2.4%
ASEAN (10) 123 916 –793 13.4%
Source: adapted from DFAT, Composition of Trade

Copyright 2006 McGraw-Hill Australia Pty Ltd. PPTs t/a International Trade and Investment: An Asia-Pacific Perspective 2e by Gionea. Slides prepared by John Gionea..
16–29
Future MNEs’ business strategies
• Manufacturing flexibility
• Being profitable at lower volumes
• More production alliances and joint ventures
• Rationalisation of components supplies
• Emphasis on design and marketing
Copyright 2006 McGraw-Hill Australia Pty Ltd. PPTs t/a International Trade and Investment: An Asia-Pacific Perspective 2e by Gionea. Slides prepared by John Gionea..
16–30
Future of independent automotive suppliers
• More opportunities in supply of parts
• Rationalisation and specialisation
• Subcontracting to big companies
• Direct investment in areas of growth(East Asia and Latin America)
• Impact of new technologies: the electric car; the hydrogen-fuelled car
Copyright 2006 McGraw-Hill Australia Pty Ltd. PPTs t/a International Trade and Investment: An Asia-Pacific Perspective 2e by Gionea. Slides prepared by John Gionea..
16–31
Telecommunications industry
Copyright 2006 McGraw-Hill Australia Pty Ltd. PPTs t/a International Trade and Investment: An Asia-Pacific Perspective 2e by Gionea. Slides prepared by John Gionea..
16–32
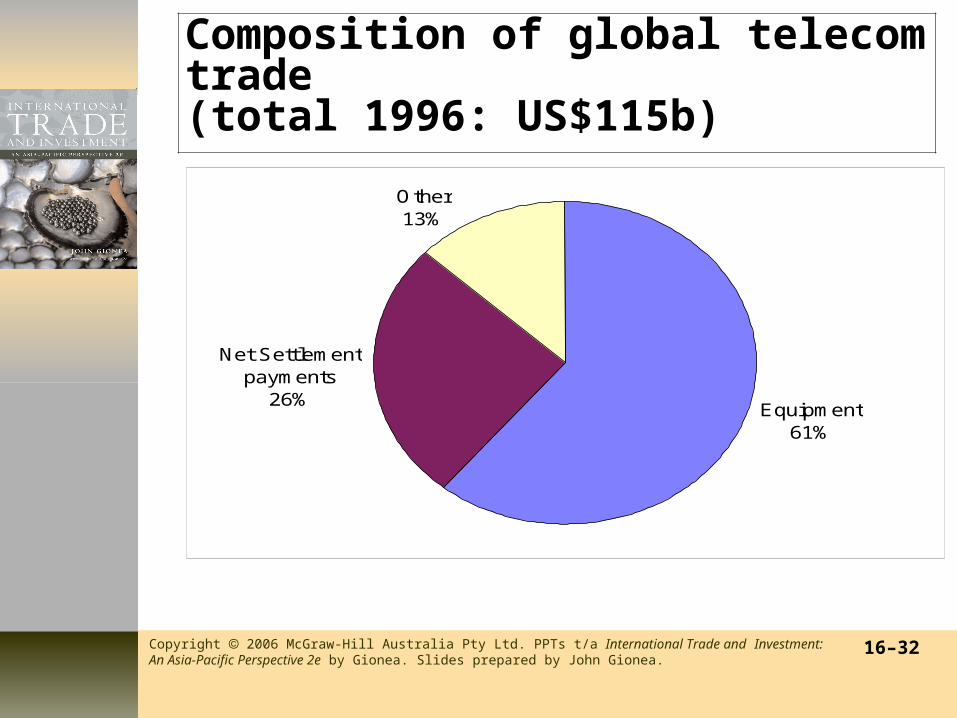
Composition of global telecom trade(total 1996: US$115b)
Equipment61%
Net Settlement payments
26%
Other13%

Copyright 2006 McGraw-Hill Australia Pty Ltd. PPTs t/a International Trade and Investment: An Asia-Pacific Perspective 2e by Gionea. Slides prepared by John Gionea..
16–33
Telecom privatisations,1984–1996% share by region
Asia-Pacific54%
West Europe31%
E.Europe2%
Latin America12%
Other 1%
Total value: US$158.5b
Source: based on ITU
Copyright 2006 McGraw-Hill Australia Pty Ltd. PPTs t/a International Trade and Investment: An Asia-Pacific Perspective 2e by Gionea. Slides prepared by John Gionea..
16–34
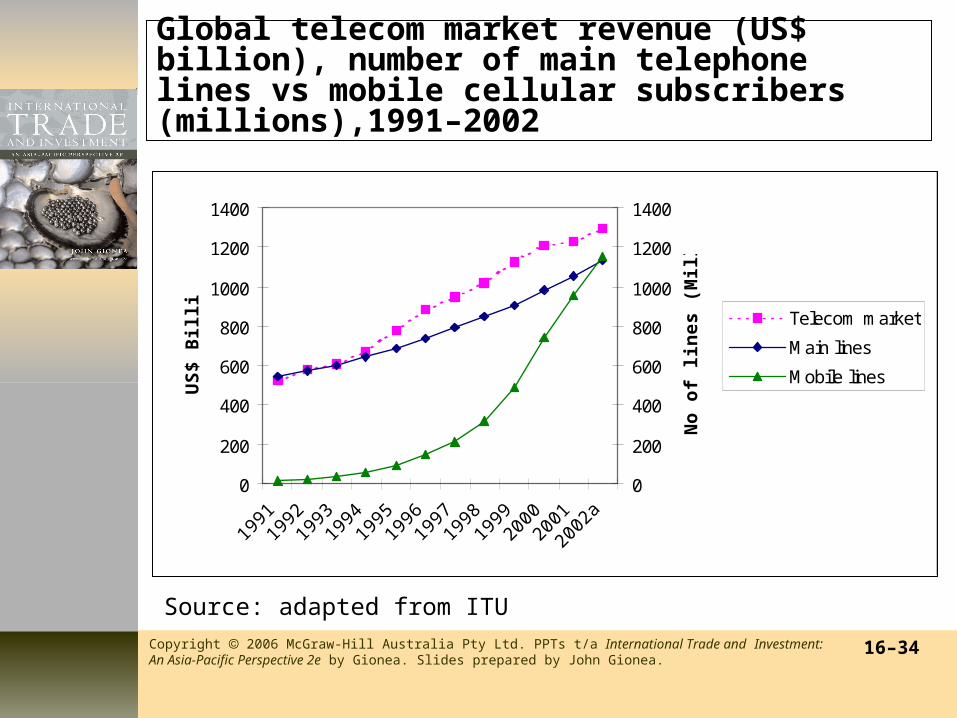
Global telecom market revenue (US$ billion), number of main telephone lines vs mobile cellular subscribers (millions),1991–2002
0
200
400
600
800
1000
1200
1400
1991
1992
1993
1994
1995
1996
1997
1998
1999
2000
2001
2002
a
US
$ B
illi
on
0
200
400
600
800
1000
1200
1400
No
of
lin
es (
Mil
lio
ns)
Telecom market
Main lines
Mobile lines
Source: adapted from ITU
Copyright 2006 McGraw-Hill Australia Pty Ltd. PPTs t/a International Trade and Investment: An Asia-Pacific Perspective 2e by Gionea. Slides prepared by John Gionea..
16–35
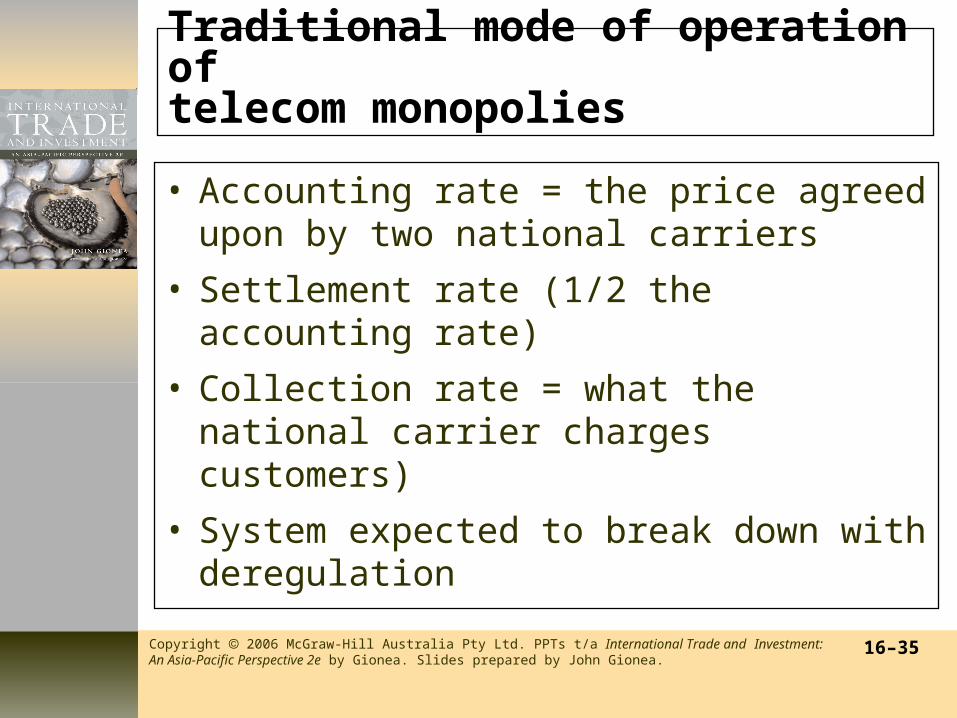
Traditional mode of operation of telecom monopolies
• Accounting rate = the price agreed upon by two national carriers
• Settlement rate (1/2 the accounting rate)
• Collection rate = what the national carrier charges customers)
• System expected to break down with deregulation
Copyright 2006 McGraw-Hill Australia Pty Ltd. PPTs t/a International Trade and Investment: An Asia-Pacific Perspective 2e by Gionea. Slides prepared by John Gionea..
16–36
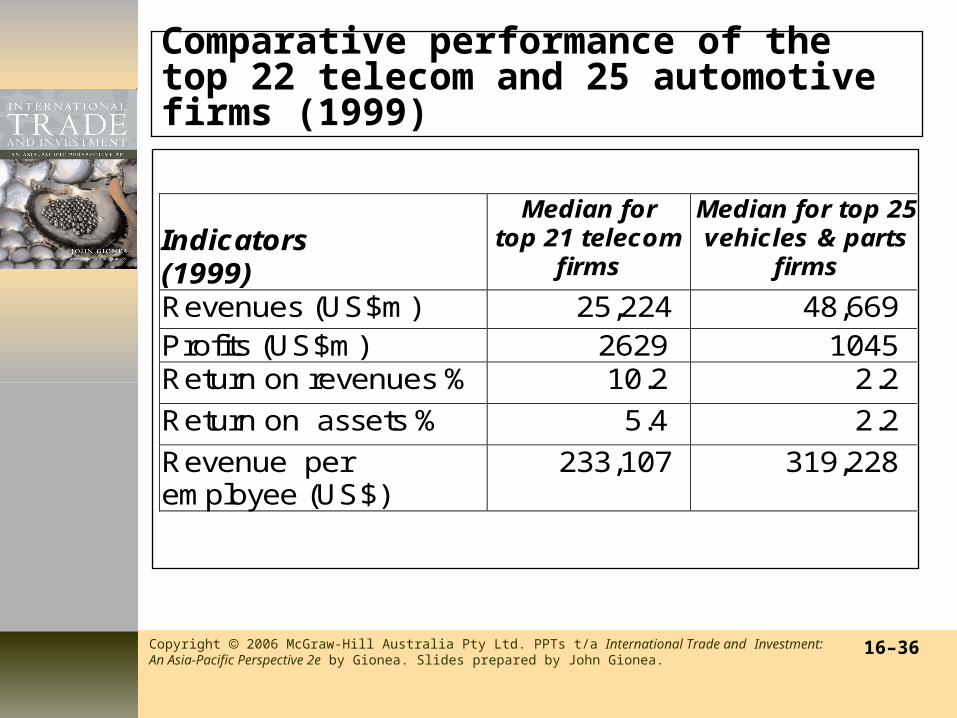
Comparative performance of the top 22 telecom and 25 automotive firms (1999)
Indicators (1999)
Median for top 21 telecom
firms
Median for top 25 vehicles & parts
firms
Revenues (US$m) 25,224 48,669 Profits (US$m) 2629 1045 Return on revenues % 10.2 2.2
Return on assets % 5.4 2.2
Revenue per employee (US$)
233,107 319,228
Copyright 2006 McGraw-Hill Australia Pty Ltd. PPTs t/a International Trade and Investment: An Asia-Pacific Perspective 2e by Gionea. Slides prepared by John Gionea..
16–37
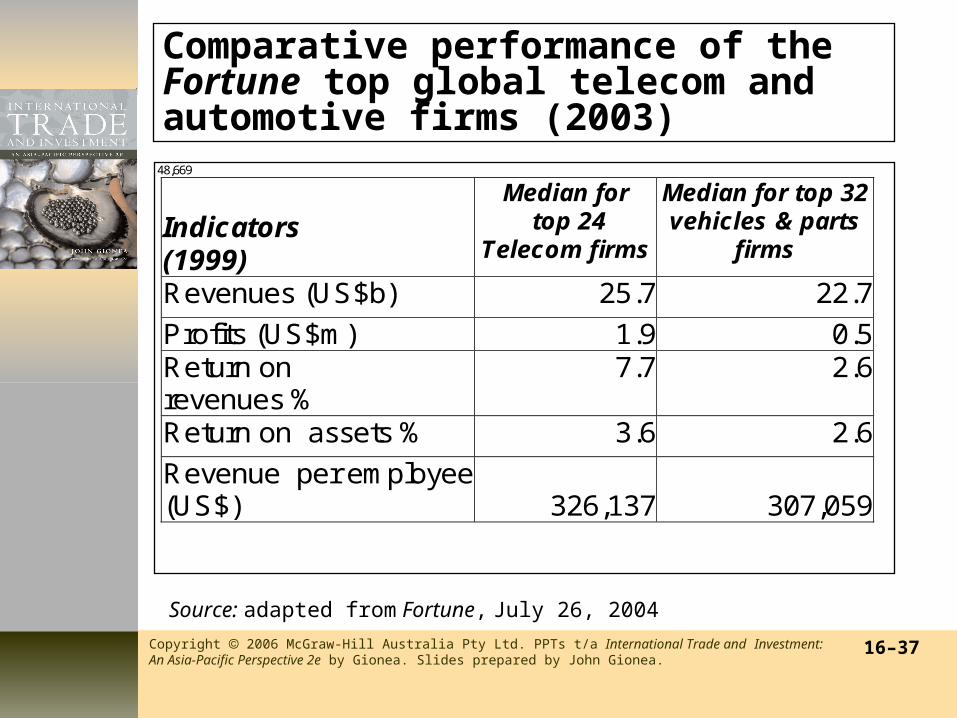
Comparative performance of the Fortune top global telecom and automotive firms (2003)
48,669
Indicators (1999)
Median for top 24
Telecom firms
Median for top 32 vehicles & parts
firms
Revenues (US$b) 25.7 22.7
Profits (US$m) 1.9 0.5 Return on revenues %
7.7 2.6
Return on assets % 3.6 2.6
Revenue per employee (US$)
326,137
307,059
Source: adapted from Fortune, July 26, 2004
Copyright 2006 McGraw-Hill Australia Pty Ltd. PPTs t/a International Trade and Investment: An Asia-Pacific Perspective 2e by Gionea. Slides prepared by John Gionea..
16–38
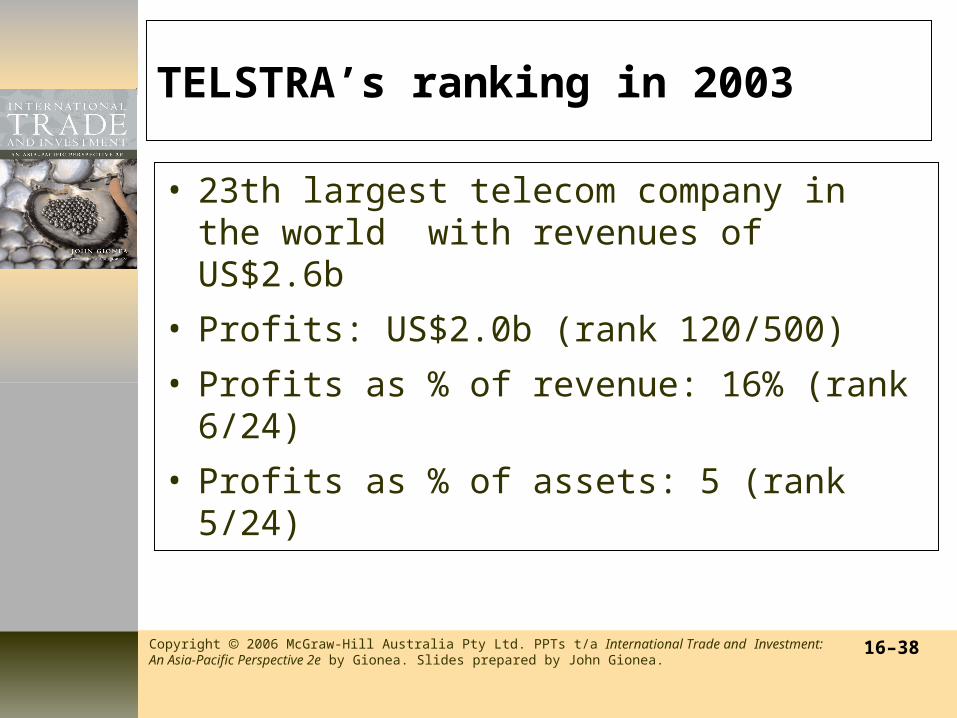
TELSTRA’s ranking in 2003
• 23th largest telecom company in the world with revenues of US$2.6b
• Profits: US$2.0b (rank 120/500)
• Profits as % of revenue: 16% (rank 6/24)
• Profits as % of assets: 5 (rank 5/24)