Embed Size (px)
Citation preview
Chapter 2Air Quality andHealth Effects
South Coast Air Quality Management DistrictCleaning the air that we breathe...TM
CHAPTER 2
AIR QUALITY AND HEALTH EFFECTS
Introduction
Ambient Air Quality Standards
Current Air Quality
Comparison to Other U.S. Areas
Summary
Chapter 2: Air Quality and Health Effects
2 - 1
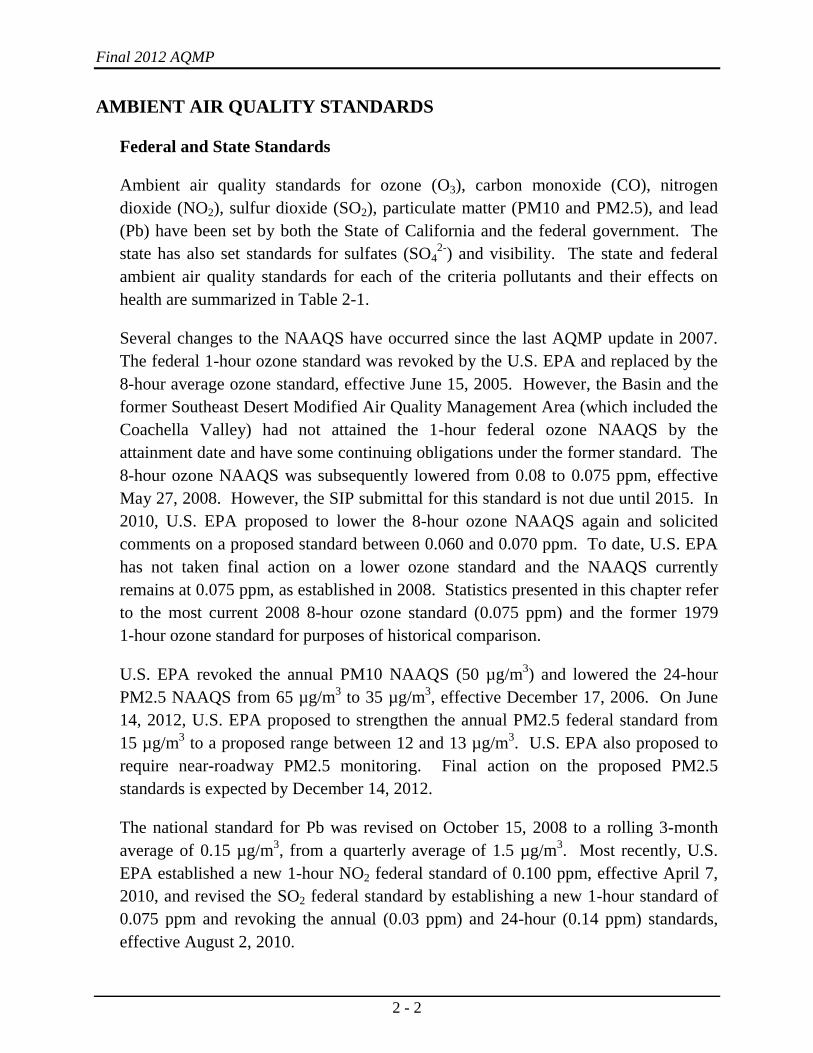
INTRODUCTION
In this chapter, air quality is summarized for the year 2011, along with prior year
trends, in both the South Coast Air Basin (Basin) and the Riverside County portion of
the Salton Sea Air Basin (SSAB), primarily the Coachella Valley, as monitored by the
South Coast Air Quality Management District (District). The District’s 2011 air
quality is compared to national ambient air quality standards (NAAQS). Nationwide
air quality data for 2011 is also briefly summarized in this chapter, comparing air
quality in the Basin to that of other U.S. and California urban areas. Health effects of
the criteria air pollutants, that is, those that have NAAQS, are also discussed. More
detailed information on the health effects of air pollution can be found in Appendix I:
Health Effects.
Statistics presented in this chapter indicate the current attainment or non-attainment
status of the various NAAQS for the criteria pollutants to assist the District in
planning for future attainment. For ozone (O3) and fine particulate matter (PM2.5,
particles less that 2.5 microns in diameter), the main pollutants for which the U.S.
EPA has declared the Basin to be a nonattainment area, maps are included to spatially
compare the air quality throughout the Basin in 2011. The Los Angeles County
portion of the Basin is also currently a nonattainment area for the federal lead (Pb)
standard due to source-specific monitoring, but Pb air quality data and attainment has
been addressed separately in greater detail in the 2012 Lead SIP for Los Angeles
County. The Basin is a nonattainment area for the federal PM10 (particules less than
10 microns in diameter) standard, although a request to U.S. EPA to redesignate to
attainment is pending. The Coachella Valley is currently declared a nonattainment
area for both ozone and PM10 by U.S. EPA, although a request to redesignate to
attainment for PM10 is pending. Appendix II: Current Air Quality provides
additional information on current air quality and air quality trends, changes in the
NAAQS, the impact on the District’s attainment status for different pollutants, and air
quality compared to state standards, as well as more information on specific
monitoring station data.
There were some minor changes to the AQMD monitoring network since the 2007
AQMP, which included air quality data through 2005. New stations were added at
South Long Beach, close to the Ports of Los Angeles and Long Beach, and at
Temecula in southern Riverside County. In addition, the extent and frequency of
PM2.5 monitoring has been increased throughout the District.
Final 2012 AQMP
2 - 2
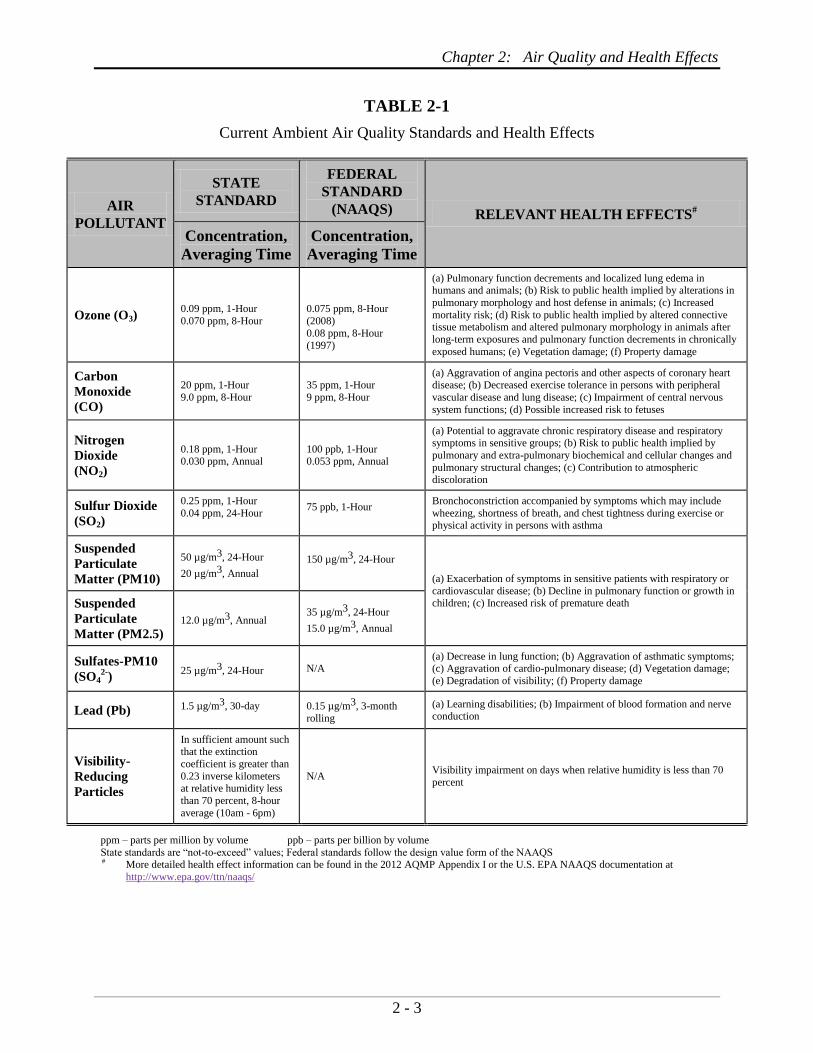
AMBIENT AIR QUALITY STANDARDS
Federal and State Standards
Ambient air quality standards for ozone (O3), carbon monoxide (CO), nitrogen
dioxide (NO2), sulfur dioxide (SO2), particulate matter (PM10 and PM2.5), and lead
(Pb) have been set by both the State of California and the federal government. The
state has also set standards for sulfates (SO42-
) and visibility. The state and federal
ambient air quality standards for each of the criteria pollutants and their effects on
health are summarized in Table 2-1.
Several changes to the NAAQS have occurred since the last AQMP update in 2007.
The federal 1-hour ozone standard was revoked by the U.S. EPA and replaced by the
8-hour average ozone standard, effective June 15, 2005. However, the Basin and the
former Southeast Desert Modified Air Quality Management Area (which included the
Coachella Valley) had not attained the 1-hour federal ozone NAAQS by the
attainment date and have some continuing obligations under the former standard. The
8-hour ozone NAAQS was subsequently lowered from 0.08 to 0.075 ppm, effective
May 27, 2008. However, the SIP submittal for this standard is not due until 2015. In
2010, U.S. EPA proposed to lower the 8-hour ozone NAAQS again and solicited
comments on a proposed standard between 0.060 and 0.070 ppm. To date, U.S. EPA
has not taken final action on a lower ozone standard and the NAAQS currently
remains at 0.075 ppm, as established in 2008. Statistics presented in this chapter refer
to the most current 2008 8-hour ozone standard (0.075 ppm) and the former 1979
1-hour ozone standard for purposes of historical comparison.
U.S. EPA revoked the annual PM10 NAAQS (50 µg/m3) and lowered the 24-hour
PM2.5 NAAQS from 65 µg/m3 to 35 µg/m
3, effective December 17, 2006. On June
14, 2012, U.S. EPA proposed to strengthen the annual PM2.5 federal standard from
15 µg/m3 to a proposed range between 12 and 13 µg/m
3. U.S. EPA also proposed to
require near-roadway PM2.5 monitoring. Final action on the proposed PM2.5
standards is expected by December 14, 2012.
The national standard for Pb was revised on October 15, 2008 to a rolling 3-month
average of 0.15 µg/m3, from a quarterly average of 1.5 µg/m
3. Most recently, U.S.
EPA established a new 1-hour NO2 federal standard of 0.100 ppm, effective April 7,
2010, and revised the SO2 federal standard by establishing a new 1-hour standard of
0.075 ppm and revoking the annual (0.03 ppm) and 24-hour (0.14 ppm) standards,
effective August 2, 2010.
Chapter 2: Air Quality and Health Effects
2 - 3
TABLE 2-1
Current Ambient Air Quality Standards and Health Effects
AIR
POLLUTANT
STATE
STANDARD
FEDERAL
STANDARD
(NAAQS) RELEVANT HEALTH EFFECTS#
Concentration,
Averaging Time
Concentration,
Averaging Time
Ozone (O3) 0.09 ppm, 1-Hour
0.070 ppm, 8-Hour
0.075 ppm, 8-Hour
(2008)
0.08 ppm, 8-Hour
(1997)
(a) Pulmonary function decrements and localized lung edema in humans and animals; (b) Risk to public health implied by alterations in
pulmonary morphology and host defense in animals; (c) Increased
mortality risk; (d) Risk to public health implied by altered connective tissue metabolism and altered pulmonary morphology in animals after
long-term exposures and pulmonary function decrements in chronically
exposed humans; (e) Vegetation damage; (f) Property damage
Carbon
Monoxide
(CO)
20 ppm, 1-Hour
9.0 ppm, 8-Hour
35 ppm, 1-Hour
9 ppm, 8-Hour
(a) Aggravation of angina pectoris and other aspects of coronary heart disease; (b) Decreased exercise tolerance in persons with peripheral
vascular disease and lung disease; (c) Impairment of central nervous
system functions; (d) Possible increased risk to fetuses
Nitrogen
Dioxide
(NO2)
0.18 ppm, 1-Hour 0.030 ppm, Annual
100 ppb, 1-Hour 0.053 ppm, Annual
(a) Potential to aggravate chronic respiratory disease and respiratory symptoms in sensitive groups; (b) Risk to public health implied by
pulmonary and extra-pulmonary biochemical and cellular changes and
pulmonary structural changes; (c) Contribution to atmospheric discoloration
Sulfur Dioxide
(SO2)
0.25 ppm, 1-Hour
0.04 ppm, 24-Hour
75 ppb, 1-Hour
Bronchoconstriction accompanied by symptoms which may include
wheezing, shortness of breath, and chest tightness during exercise or physical activity in persons with asthma
Suspended
Particulate
Matter (PM10)
50 µg/m3, 24-Hour
20 µg/m3, Annual
150 µg/m3, 24-Hour
(a) Exacerbation of symptoms in sensitive patients with respiratory or
cardiovascular disease; (b) Decline in pulmonary function or growth in children; (c) Increased risk of premature death Suspended
Particulate
Matter (PM2.5) 12.0 µg/m3, Annual
35 µg/m3, 24-Hour
15.0 µg/m3, Annual
Sulfates-PM10
(SO42-
) 25 µg/m3, 24-Hour N/A
(a) Decrease in lung function; (b) Aggravation of asthmatic symptoms; (c) Aggravation of cardio-pulmonary disease; (d) Vegetation damage;
(e) Degradation of visibility; (f) Property damage
Lead (Pb) 1.5 µg/m3, 30-day
0.15 µg/m3, 3-month
rolling
(a) Learning disabilities; (b) Impairment of blood formation and nerve conduction
Visibility-
Reducing
Particles
In sufficient amount such that the extinction
coefficient is greater than
0.23 inverse kilometers at relative humidity less
than 70 percent, 8-hour
average (10am - 6pm)
N/A Visibility impairment on days when relative humidity is less than 70
percent
ppm – parts per million by volume ppb – parts per billion by volume
State standards are “not-to-exceed” values; Federal standards follow the design value form of the NAAQS # More detailed health effect information can be found in the 2012 AQMP Appendix I or the U.S. EPA NAAQS documentation at
http://www.epa.gov/ttn/naaqs/
Final 2012 AQMP
2 - 4
U.S. EPA allows certain air quality data to be flagged in the U.S. EPA Air Quality
System (AQS) database and not considered for NAAQS attainment status when that
data is influenced by exceptional events, such as high winds, wildfires, volcanoes, or
some cultural events (Independence Day fireworks) that meet strict requirements. For
a few PM measurements in the Basin in 2007 and 2008, the District applied the U.S.
EPA Exceptional Events Rule to flag PM10 and PM2.5 data due to high wind natural
events, wildfires and Independence Day fireworks (the District has submitted the
required documentation and U.S EPA concurrence with these flags is pending). In the
Coachella Valley, PM10 data has been flagged for high wind natural events, under the
current Exceptional Events Rule and the previous U.S. EPA Natural Events Policy1.
All of the exceptional event flags through 2011 have been submitted by the District to
U.S. EPA’s AQS along with the data. The most recent of these are pending submittal
of the District’s final documentation for each event and all are pending U.S. EPA
concurrence. The pending PM10 redesignation request for the Coachella Valley may
hinge on U.S EPA’s concurrence with the exceptional event flags and the appropriate
treatment of these uncontrollable natural events.
In this chapter and in Appendix II, air quality statistics are presented for the maximum
concentrations measured at stations or in air basins, as well as for the number of days
exceeding state or federal standards. These statistics are instructive in regards to
trends and control effectiveness. However, it should be noted that an exceedance of
the concentration level of a federal standard does not necessarily mean that the
NAAQS was violated or that it would cause a nonattainment designation. The form
of the standard must also be considered. For example, for 24-hour PM2.5, the form of
the standard is the 98th
percentile measurement of all of the 24-hour PM2.5 samples at
each station. For 8-hour ozone, the form of the standard is the 4th
highest measured
8-hour average concentration at each station. For NAAQS attainment/nonattainment
decisions, the most recent 3 years of data are considered (1 year for CO and 24-hour
SO2), along with the form of the standard, and are typically averaged to calculate a
design value2 for each station. The overall design value for an air basin is the highest
1 The U.S. EPA Exceptional Events Rule, Treatment of Data Influence by Exceptional Events, became effective
May 21, 2007. The previous U.S. EPA Natural Events Policy for Particulate Matter was issued May 30, 1996. On
July 6, 2012, U.S. EPA released the Draft Guidance To Implement Requirements for the Treatment of Air Quality
Monitoring Data Influenced by Exceptional Events for public comment. 2 A design value is a statistic that describes the air quality status of a given area relative to the level and form of the
National Ambient Air Quality Standards (NAAQS). For most criteria pollutants, the design value is a 3-year
average and takes into account the form of the short-term standard (e.g., 98th
percentile, fourth high value, etc.)
Design values are especially helpful when the standard is exceedance-based (e.g. 1-hour ozone, 24-hour PM10, etc.)
because they are expressed as a concentration instead of an exceedance count, thereby allowing a direct comparison
to the level of the standard.
Chapter 2: Air Quality and Health Effects
2 - 5
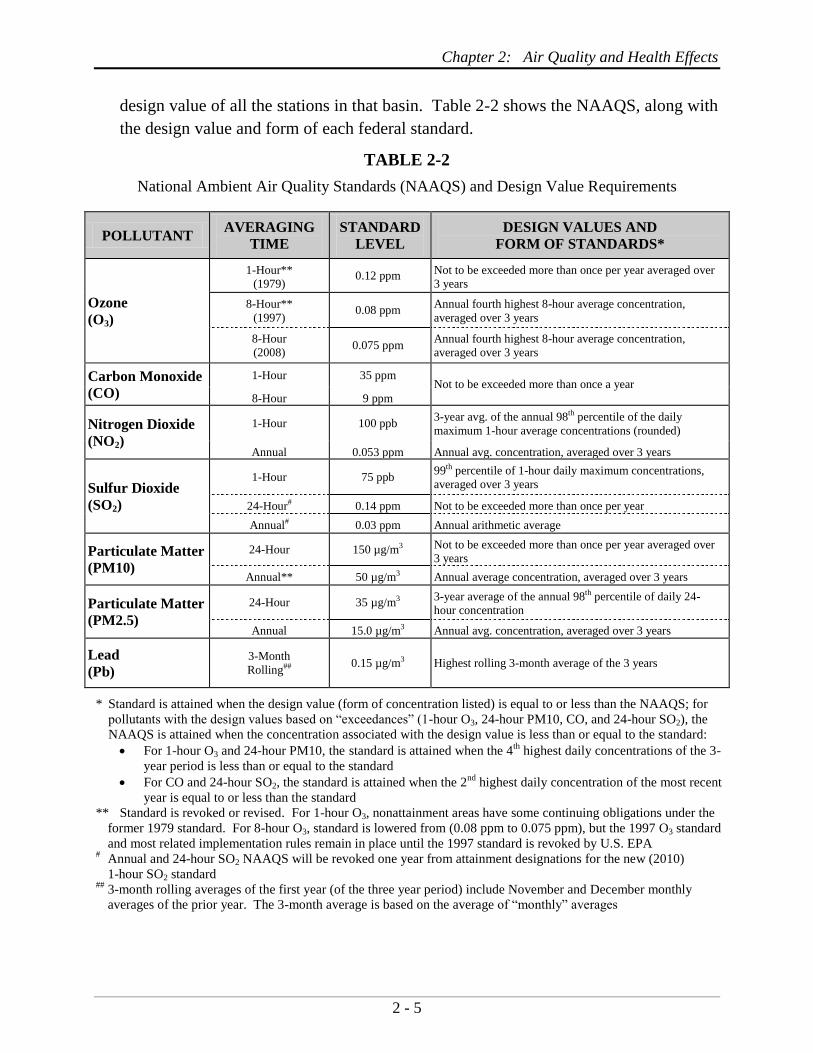
design value of all the stations in that basin. Table 2-2 shows the NAAQS, along with
the design value and form of each federal standard.
TABLE 2-2
National Ambient Air Quality Standards (NAAQS) and Design Value Requirements
POLLUTANT AVERAGING
TIME
STANDARD
LEVEL
DESIGN VALUES AND
FORM OF STANDARDS*
Ozone
(O3)
1-Hour**
(1979) 0.12 ppm
Not to be exceeded more than once per year averaged over
3 years
8-Hour**
(1997) 0.08 ppm
Annual fourth highest 8-hour average concentration,
averaged over 3 years
8-Hour
(2008) 0.075 ppm
Annual fourth highest 8-hour average concentration,
averaged over 3 years
Carbon Monoxide
(CO)
1-Hour 35 ppm Not to be exceeded more than once a year
8-Hour 9 ppm
Nitrogen Dioxide
(NO2)
1-Hour 100 ppb 3-year avg. of the annual 98th percentile of the daily
maximum 1-hour average concentrations (rounded)
Annual 0.053 ppm Annual avg. concentration, averaged over 3 years
Sulfur Dioxide
(SO2)
1-Hour 75 ppb 99th percentile of 1-hour daily maximum concentrations,
averaged over 3 years
24-Hour# 0.14 ppm Not to be exceeded more than once per year
Annual# 0.03 ppm Annual arithmetic average
Particulate Matter
(PM10)
24-Hour 150 µg/m3 Not to be exceeded more than once per year averaged over
3 years
Annual** 50 µg/m3 Annual average concentration, averaged over 3 years
Particulate Matter
(PM2.5)
24-Hour 35 µg/m3 3-year average of the annual 98th percentile of daily 24-
hour concentration
Annual 15.0 µg/m3 Annual avg. concentration, averaged over 3 years
Lead
(Pb) 3-Month
Rolling## 0.15 µg/m3 Highest rolling 3-month average of the 3 years
* Standard is attained when the design value (form of concentration listed) is equal to or less than the NAAQS; for
pollutants with the design values based on “exceedances” (1-hour O3, 24-hour PM10, CO, and 24-hour SO2), the
NAAQS is attained when the concentration associated with the design value is less than or equal to the standard:
For 1-hour O3 and 24-hour PM10, the standard is attained when the 4th
highest daily concentrations of the 3-
year period is less than or equal to the standard
For CO and 24-hour SO2, the standard is attained when the 2nd
highest daily concentration of the most recent
year is equal to or less than the standard
** Standard is revoked or revised. For 1-hour O3, nonattainment areas have some continuing obligations under the
former 1979 standard. For 8-hour O3, standard is lowered from (0.08 ppm to 0.075 ppm), but the 1997 O3 standard
and most related implementation rules remain in place until the 1997 standard is revoked by U.S. EPA # Annual and 24-hour SO2 NAAQS will be revoked one year from attainment designations for the new (2010)
1-hour SO2 standard ##
3-month rolling averages of the first year (of the three year period) include November and December monthly
averages of the prior year. The 3-month average is based on the average of “monthly” averages
Final 2012 AQMP
2 - 6
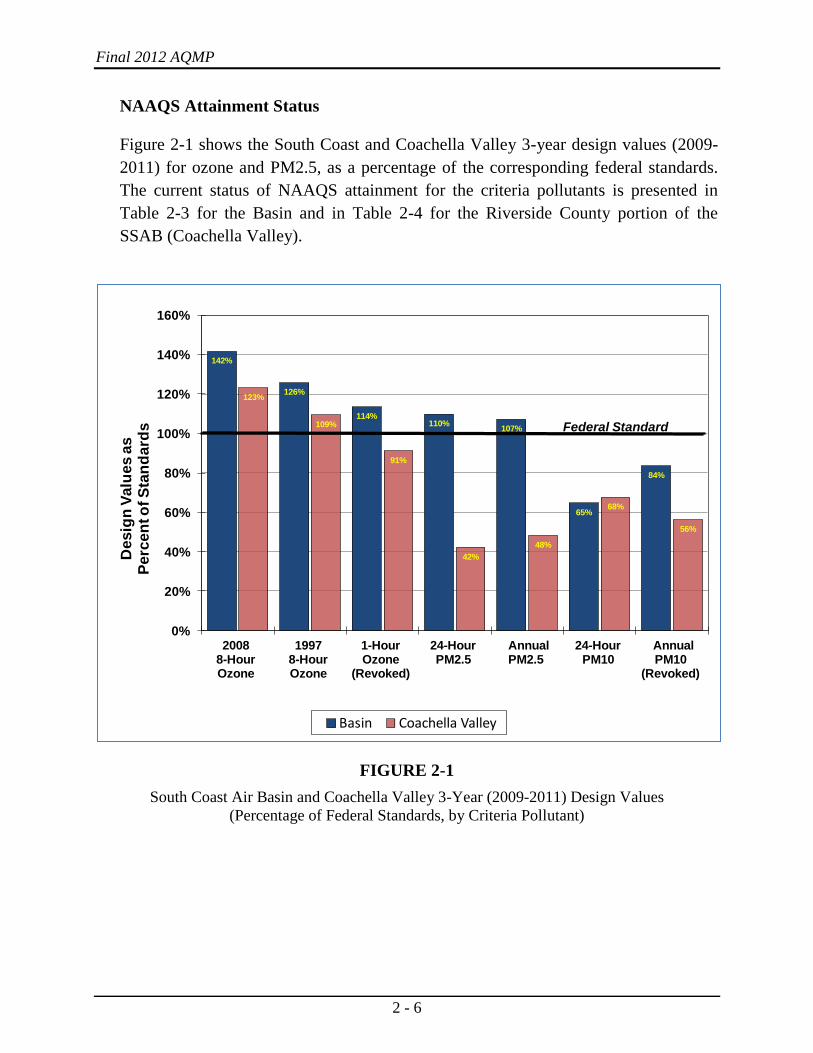
NAAQS Attainment Status
Figure 2-1 shows the South Coast and Coachella Valley 3-year design values (2009-
2011) for ozone and PM2.5, as a percentage of the corresponding federal standards.
The current status of NAAQS attainment for the criteria pollutants is presented in
Table 2-3 for the Basin and in Table 2-4 for the Riverside County portion of the
SSAB (Coachella Valley).
FIGURE 2-1
South Coast Air Basin and Coachella Valley 3-Year (2009-2011) Design Values
(Percentage of Federal Standards, by Criteria Pollutant)
142%
126%
114%110%
107%
65%
84%
123%
109%
91%
42%
48%
68%
56%
0%
20%
40%
60%
80%
100%
120%
140%
160%
20088-HourOzone
19978-HourOzone
1-HourOzone
(Revoked)
24-HourPM2.5
AnnualPM2.5
24-HourPM10
AnnualPM10
(Revoked)
Basin Coachella Valley
Desig
nV
alu
es a
s
Perc
en
t o
f S
tan
dard
s Federal Standard
Chapter 2: Air Quality and Health Effects
2 - 7
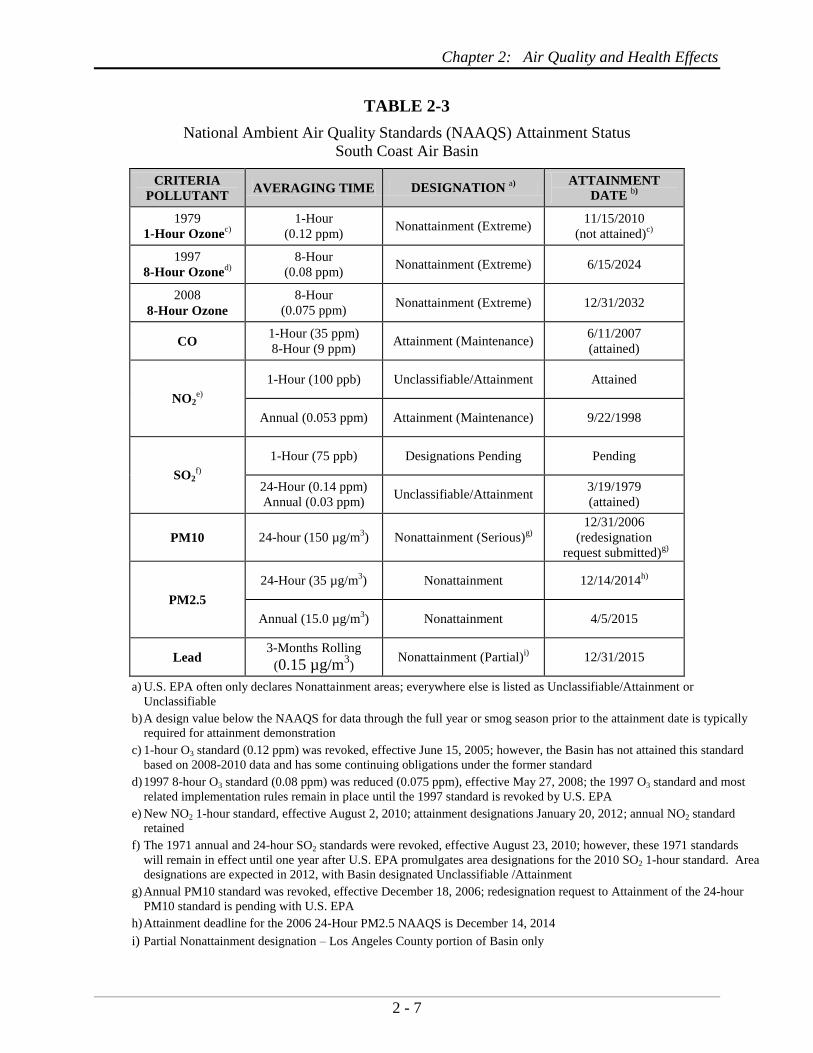
TABLE 2-3
National Ambient Air Quality Standards (NAAQS) Attainment Status
South Coast Air Basin
CRITERIA
POLLUTANT AVERAGING TIME DESIGNATION
a)
ATTAINMENT
DATE b)
1979
1-Hour Ozonec)
1-Hour
(0.12 ppm) Nonattainment (Extreme)
11/15/2010
(not attained)c)
1997
8-Hour Ozoned)
8-Hour
(0.08 ppm) Nonattainment (Extreme) 6/15/2024
2008
8-Hour Ozone
8-Hour
(0.075 ppm) Nonattainment (Extreme) 12/31/2032
CO 1-Hour (35 ppm)
8-Hour (9 ppm) Attainment (Maintenance)
6/11/2007
(attained)
NO2e)
1-Hour (100 ppb) Unclassifiable/Attainment Attained
Annual (0.053 ppm) Attainment (Maintenance) 9/22/1998
SO2f)
1-Hour (75 ppb) Designations Pending Pending
24-Hour (0.14 ppm)
Annual (0.03 ppm) Unclassifiable/Attainment
3/19/1979
(attained)
PM10 24-hour (150 µg/m3) Nonattainment (Serious)
g)
12/31/2006
(redesignation
request submitted)g)
PM2.5
24-Hour (35 µg/m3) Nonattainment 12/14/2014
h)
Annual (15.0 µg/m3) Nonattainment 4/5/2015
Lead 3-Months Rolling
(0.15 µg/m3)
Nonattainment (Partial)i) 12/31/2015
a) U.S. EPA often only declares Nonattainment areas; everywhere else is listed as Unclassifiable/Attainment or
Unclassifiable
b) A design value below the NAAQS for data through the full year or smog season prior to the attainment date is typically
required for attainment demonstration
c) 1-hour O3 standard (0.12 ppm) was revoked, effective June 15, 2005; however, the Basin has not attained this standard
based on 2008-2010 data and has some continuing obligations under the former standard
d) 1997 8-hour O3 standard (0.08 ppm) was reduced (0.075 ppm), effective May 27, 2008; the 1997 O3 standard and most
related implementation rules remain in place until the 1997 standard is revoked by U.S. EPA
e) New NO2 1-hour standard, effective August 2, 2010; attainment designations January 20, 2012; annual NO2 standard
retained
f) The 1971 annual and 24-hour SO2 standards were revoked, effective August 23, 2010; however, these 1971 standards
will remain in effect until one year after U.S. EPA promulgates area designations for the 2010 SO2 1-hour standard. Area
designations are expected in 2012, with Basin designated Unclassifiable /Attainment
g) Annual PM10 standard was revoked, effective December 18, 2006; redesignation request to Attainment of the 24-hour
PM10 standard is pending with U.S. EPA
h) Attainment deadline for the 2006 24-Hour PM2.5 NAAQS is December 14, 2014
i) Partial Nonattainment designation – Los Angeles County portion of Basin only
Final 2012 AQMP
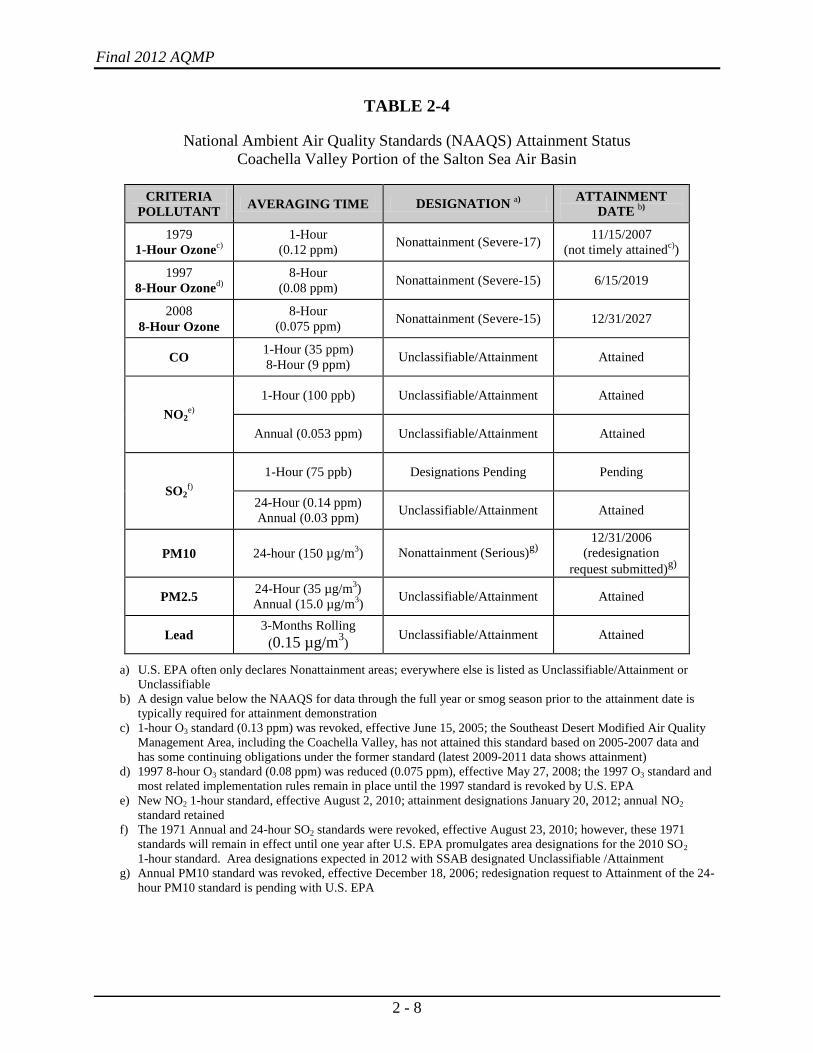
2 - 8
TABLE 2-4
National Ambient Air Quality Standards (NAAQS) Attainment Status
Coachella Valley Portion of the Salton Sea Air Basin
CRITERIA
POLLUTANT AVERAGING TIME DESIGNATION
a)
ATTAINMENT
DATE b)
1979
1-Hour Ozonec)
1-Hour
(0.12 ppm) Nonattainment (Severe-17)
11/15/2007
(not timely attainedc)
)
1997
8-Hour Ozoned)
8-Hour
(0.08 ppm) Nonattainment (Severe-15) 6/15/2019
2008
8-Hour Ozone
8-Hour
(0.075 ppm) Nonattainment (Severe-15) 12/31/2027
CO 1-Hour (35 ppm)
8-Hour (9 ppm) Unclassifiable/Attainment Attained
NO2e)
1-Hour (100 ppb) Unclassifiable/Attainment Attained
Annual (0.053 ppm) Unclassifiable/Attainment Attained
SO2f)
1-Hour (75 ppb) Designations Pending Pending
24-Hour (0.14 ppm)
Annual (0.03 ppm) Unclassifiable/Attainment Attained
PM10 24-hour (150 µg/m3) Nonattainment (Serious)
g)
12/31/2006
(redesignation
request submitted)g)
PM2.5 24-Hour (35 µg/m
3)
Annual (15.0 µg/m3)
Unclassifiable/Attainment Attained
Lead 3-Months Rolling
(0.15 µg/m3)
Unclassifiable/Attainment Attained
a) U.S. EPA often only declares Nonattainment areas; everywhere else is listed as Unclassifiable/Attainment or
Unclassifiable
b) A design value below the NAAQS for data through the full year or smog season prior to the attainment date is
typically required for attainment demonstration
c) 1-hour O3 standard (0.13 ppm) was revoked, effective June 15, 2005; the Southeast Desert Modified Air Quality
Management Area, including the Coachella Valley, has not attained this standard based on 2005-2007 data and
has some continuing obligations under the former standard (latest 2009-2011 data shows attainment)
d) 1997 8-hour O3 standard (0.08 ppm) was reduced (0.075 ppm), effective May 27, 2008; the 1997 O3 standard and
most related implementation rules remain in place until the 1997 standard is revoked by U.S. EPA
e) New NO2 1-hour standard, effective August 2, 2010; attainment designations January 20, 2012; annual NO2
standard retained
f) The 1971 Annual and 24-hour SO2 standards were revoked, effective August 23, 2010; however, these 1971
standards will remain in effect until one year after U.S. EPA promulgates area designations for the 2010 SO2
1-hour standard. Area designations expected in 2012 with SSAB designated Unclassifiable /Attainment
g) Annual PM10 standard was revoked, effective December 18, 2006; redesignation request to Attainment of the 24-
hour PM10 standard is pending with U.S. EPA
Chapter 2: Air Quality and Health Effects
2 - 9
In 2011, the Basin exceeded federal standards for either ozone or PM2.5 at one or
more locations on a total of 124 days, based on the current federal standards for 8-
hour ozone and 24-hour PM2.5. Despite substantial improvement in air quality over
the past few decades, some air monitoring stations in the Basin still exceed the
NAAQS for ozone more frequently than any other stations in the U.S. In 2011, three
of the top five stations in the nation most frequently exceeding the 8-hour federal
ozone NAAQS were located within the Basin (i.e., Central San Bernardino
Mountains, East San Bernardino Valley and Metropolitan Riverside County). In the
year 2011, the former 1-hour3 and current 8-hour average federal standard levels for
ozone were exceeded at one or more Basin locations on 16 and 106 days, respectively.
PM2.5 in the Basin has improved significantly in recent years, with 2010 and 2011
being the cleanest years on record. In 2011, only one station in the Basin
(Metropolitan Riverside County at Mira Loma) exceeded the annual PM2.5 NAAQS
and the 98th
percentile form of the 24-hour PM2.5 NAAQS, as well as the 3-year
design values for these standards. (Although other stations had 24-hour averages
exceeding the federal 24-hour PM2.5 standard concentration level in 2011, the 98th
percentile concentration did not exceed.) Basin-wide, the federal PM2.5 24-hour
standard level was exceeded in 2011 on 17 sampling days4.
The Basin and the Coachella Valley have technically met the PM10 NAAQS and
redesignation for attainment for the federal PM10 standard has been requested for
both. These requests are still pending with U.S. EPA at this time5.
The District is currently in attainment for the federal standards for SO2, CO, and NO2.
While the concentration level of the new 1-hour NO2 federal standard (100 ppb) was
exceeded in the Basin at two stations (Central Los Angeles and Long Beach, on the
same day) in 2011, the NAAQS NO2 design value has not been exceeded (the 3-year
average of the annual 98th
percentile of the daily 1-hour maximums). Therefore, the
Basin remains in attainment of the NO2 NAAQS. U.S. EPA requirements for future
3 The federal 1-hour O3 NAAQS has been revoked by U.S. EPA, although certain nonattainment areas, including the
Basin, may be still required to demonstrate attainment of that standard based on recent court decisions.
4 The number of PM exceedances may have been higher at some locations, since PM2.5 samples are collected every
3 days at most sites. However, seven sites sample every day, including the Basin maximum concentration stations.
PM10 filter samples are collected every 6 days, except at the design value maximum sites in the Basin and the
Coachella Valley at which samples are collected every 3 days. Daily PM10 data for the Basin maximum stations is
provided by supplementing the filter measurements with Federal Equivalent Method (FEM) continuous monitors.
The gaseous pollutants, including O3, NO2, SO2, and CO, are sampled continuously. 5 U.S. EPA has requested additional PM10 monitoring in the southeastern Coachella Valley for a 1-year period to
further assess windblown dust in that area. This project is currently ongoing.
Final 2012 AQMP
2 - 10
near-road NO2 measurements are not a part of the current ambient NO2 NAAQS
determinations.
U.S. EPA designated the Los Angeles County portion of the Basin (excluding the
high desert areas, and San Clemente and Santa Catalina Islands) as nonattainment for
the recently revised (2008) federal lead standard (0.15 µg/m3, rolling 3-month
average), due to the addition of source- specific monitoring under the new federal
regulation. This designation was based on two source-specific monitors in Vernon
and in the City of Industry exceeding the new standard in the 2007-2009 period of
data used. For the most recent 2009-2011 data period, only one of these stations
(Vernon) still exceeded the lead standard, with a maximum 3-month rolling average
of 0.67 µg/m3 occurring in 2009. In 2011, the rolling 3-month average at that site was
0.46 µg/m3.
The remainder of the Basin, outside the Los Angeles County nonattainment area, and
the Coachella Valley remain in attainment of the 2008 lead standard and no ambient
monitors exceed that are not source-oriented. For areas in attainment of the old 1978
lead standard (1.5 µg/m3, as a quarterly average), the old standard remained in effect
until one year after an area was designated for the 2008 standard. While the entire
Basin and the Coachella Valley have remained in attainment of the 1978 lead
standard, U.S. EPA’s current lead designations for the new standard became effective
on December 31, 2010; thus, the old standard is now superseded by the 2008 revised
NAAQS. A separate SIP revision addressing the 2008 lead standard has been
submitted to U.S. EPA.
CURRENT AIR QUALITY
In 2011, O3, PM2.5, NO2 and Pb exceeded federal standard concentration levels at
one or more of the routine monitoring stations in the Basin. An exceedance of the
concentration level does not necessarily mean a violation of the NAAQS, given that
the form of the standard must be considered. For example, the Basin did not violate
the federal NO2 standard, based on the form of the standard. Ozone and PM10
concentrations exceeded the federal standard concentration levels in the Coachella
Valley.
The PM2.5 2011 maximum 24-hour average (94.6 µg/m3, measured in the East San
Gabriel Valley area) and annual average (15.3 µg/m3, measured in the Metropolitan
Riverside County area) concentrations were 266 and 101 percent of the federal 24-
hour and annual average standard concentration levels, respectively. The highest 24-
Chapter 2: Air Quality and Health Effects
2 - 11
hour PM2.5 concentration in the Basin, mentioned above, was recorded on July 5,
2011, associated with Independence Day firework activities and has been flagged in
the U.S. EPA Air Quality System (AQS) database for exclusion for NAAQS
compliance consideration according to the U.S. EPA Exceptional Event Rule. The
next highest 24-hour average PM2.5 concentration was 65 µg/m3 recorded in Central
San Bernardino Valley. The PM2.5 federal standard was nearly exceeded on one day
in the Coachella Valley, during an exceptional event in which dust was entrained by
outflow from a large summertime thunderstorm complex over Arizona and Mexico,
transporting high concentrations of PM10 and PM2.5 into the Coachella Valley.
None of these three stations with the highest 24-hour average PM2.5 concentrations
had 98th
percentile concentrations exceeding the standard. Only the Metropolitan
Riverside County (Mira Loma) station had a 98th
percentile concentration over the 24-
hour federal standard.
The 2011 maximum PM10 24-hour average concentration measured in the South
Coast Air Basin was 152 µg/m3 in the Metropolitan Riverside County area, nearly
100% of the federal standard (but not exceeding it, since a concentration of 155 µg/m3
is needed to exceed the PM10 standard). This maximum 24-hour average
concentration was measured with a Federal Equivalent Method (FEM) continuous
monitor. The highest 24-hour PM10 concentration in the Basin measured with the
Federal Reference Method (FRM) filter sampler was 84 µg/m3 recorded in Central
San Bernardino Valley, 56 percent of the standard. The maximum annual average
PM10 concentration (42.3 µg/m3 in the Metropolitan Riverside County area) is 85
percent of the former (now revoked) federal annual average standard level. The two
routine AQMD monitoring stations in the Coachella Valley exceeded the 24-hour
PM10 federal standard on two days, both related to windblown dust generated by
thunderstorm activity. These two days have been flagged by the District in the U.S.
EPA AQS database for consideration under the Exceptional Event Rule.
The 2011 maximum ozone concentrations continued to exceed federal standards by
wide margins. Maximum 1-hour and 8-hour average ozone concentrations (0.160
ppm and 0.136 ppm, both recorded in the Central San Bernardino Mountains area)
were 128 and 181 percent of the former 1-hour and current 8-hour federal standards,
respectively. The Coachella Valley did not exceed the former 1-hour federal standard
in 2011, but the maximum 8-hour concentration (0.098 ppm) was 130 percent of the
current federal standard.
The maximum 1-hour average NO2 concentration in 2011 (110 ppb, measured in
Central Los Angeles) was 109 percent of the federal standard, exceeding the
Final 2012 AQMP
2 - 12
concentration level, but not the 98th
percentile form of the NAAQS. Lead
concentrations in 2011 were well below the recently (2008) revised federal standard at
all ambient monitoring sites not located near lead sources. However, the source-
specific monitoring site immediately downwind of a stationary lead source in the City
of Vernon recorded a maximum 3-month rolling average of 0.46 µg/m3, or 297
percent of the standard. Concentrations of other criteria pollutants (SO2 and CO)
remained well below the federal standards.
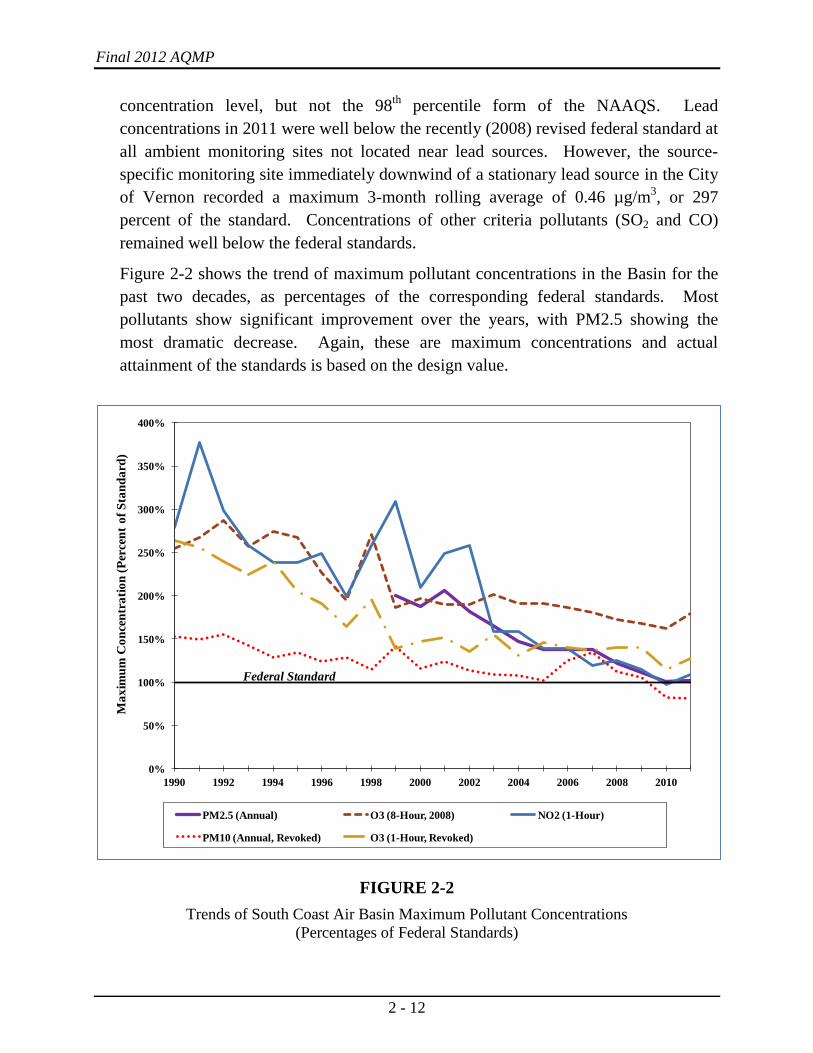
Figure 2-2 shows the trend of maximum pollutant concentrations in the Basin for the
past two decades, as percentages of the corresponding federal standards. Most
pollutants show significant improvement over the years, with PM2.5 showing the
most dramatic decrease. Again, these are maximum concentrations and actual
attainment of the standards is based on the design value.
FIGURE 2-2
Trends of South Coast Air Basin Maximum Pollutant Concentrations
(Percentages of Federal Standards)
0%
50%
100%
150%
200%
250%
300%
350%
400%
1990 1992 1994 1996 1998 2000 2002 2004 2006 2008 2010
Ma
xim
um
Co
nce
ntr
ati
on
(P
erce
nt
of
Sta
nd
ard
)
PM2.5 (Annual) O3 (8-Hour, 2008) NO2 (1-Hour)
PM10 (Annual, Revoked) O3 (1-Hour, Revoked)
Federal Standard
Chapter 2: Air Quality and Health Effects
2 - 13
Particulate Matter (PM2.5 and PM10) Specific Information
Health Effects, Particulate Matter
A significant body of peer-reviewed scientific research, including studies conducted
in Southern California, points to adverse impacts of particulate matter air pollution on
both increased illness (morbidity) and increased death rates (mortality). The 2009
U.S. EPA Integrated Science Assessment for Particulate Matter6 describes these
health effects and discusses the state of the scientific knowledge. A summary of
health effects information and additional references can also be found in the 2012
AQMP, Appendix I.
There was considerable controversy and debate surrounding the review of particulate
matter health effects and the consideration of ambient air quality standards when U.S.
EPA promulgated the initial PM2.5 standards in 19977. Since that time, numerous
additional studies have been published8. In addition, some of the key studies
supporting the 1997 standards were closely scrutinized and the analyses repeated and
extended. These reanalyses confirmed the initial findings associating adverse health
effects with PM exposures.
Several studies have found correlations between elevated ambient particulate matter
levels and an increase in mortality rates, respiratory infections, number and severity of
asthma attacks, and the number of hospital admissions in different parts of the United
States and in various areas around the world. In recent years, studies have reported an
association between long-term exposure to PM2.5 and increased mortality, reduction
in life-span, and an increased mortality from lung cancer.
Daily fluctuations in PM2.5 concentration levels have also been related to increased
mortality due to cardiovascular or respiratory diseases, hospital admissions for acute
respiratory conditions, school and kindergarten absences, a decrease in respiratory
function in normal children, and increased medication use in children and adults with
asthma. Long-term exposure to PM has been found to be associated with reduced
lung function growth in children. The elderly, people with pre-existing respiratory
6 U.S. EPA. (2009). Integrated Science Assessment for Particulate Matter (Final Report). U.S. Environmental
Protection Agency, Washington, DC, EPA/600/R-08/139F. 7 Vedal, S. (1997). Critical Review. Ambient Particles and Health: Lines that Divide. JAMA, 47(5):551-581.
8 Kaiser, J. (2005). Mounting Evidence Indicts Fine-Particle Pollution. Science, 307:1858-1861.
Enstrom, J.E. (2005), “Fine particulate air pollution and total mortality among elderly Californians, 1973–2002,”
Inhalation Toxicology 17:803–16
Final 2012 AQMP
2 - 14
and/or cardiovascular disease, and children appear to be more susceptible to the
effects of PM10 and PM2.5.
The U.S. EPA, in its most recent review, has concluded that long term exposure to
PM2.5 is causally related to increases in mortality rates. Despite this, skepticism
remains among some quarters whether exposures to PM2.5 in California are
responsible for increases in mortality.9 An expanded discussion of studies relating to
PM exposures and mortality is contained in Appendix I of this document.
Air Quality, PM2.5
The District began regular monitoring of PM2.5 in 1999 following the U.S. EPA's
adoption of the national PM2.5 standards in 1997. In 2011, PM2.5 concentrations
were monitored at 21 locations throughout the District, 20 of which had filter-based
FRM monitoring sites while one had only continuous monitoring. Six sites had
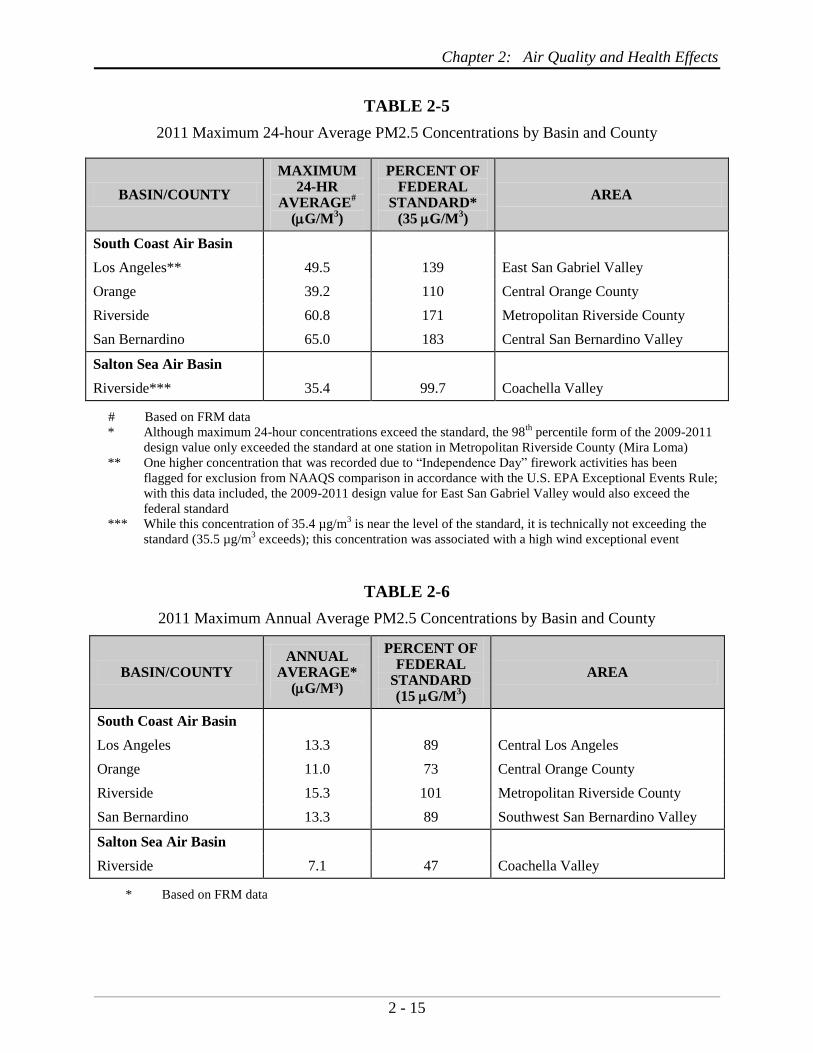
collocated, continuous monitoring in addition to the FRM samplers. The maximum
24-hour and annual average PM2.5 concentrations in 2011 are shown in Tables 2-5
and 2-6.
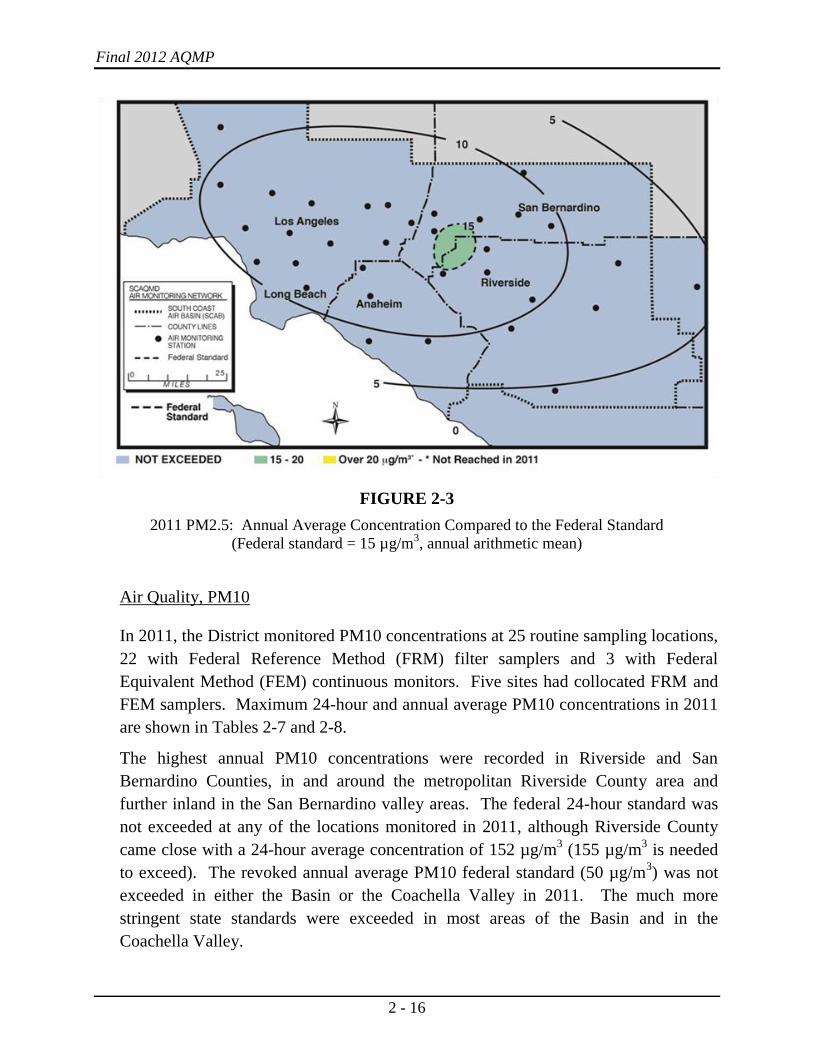
Figure 2-3 maps the distribution of annual average PM2.5 concentrations in different
areas of the Basin. Similar to PM10 concentrations, PM2.5 concentrations were
higher in the inland valley areas of metropolitan Riverside County (highest at the
Mira Loma Station). PM2.5 concentrations were also elevated in the metropolitan
area of Los Angeles County, but did not exceed the level of the annual federal
standard in 2011. Although maximum 24-hour concentrations exceed the standard,
the 98th
percentile form of the 2009-2011 design value only exceeded the standard at
one station in Metropolitan Riverside County (Mira Loma).
The higher PM2.5 concentrations in the Basin are mainly due to the secondary
formation of smaller particulates resulting from mobile, stationary and area source
emissions of precursor gases (i.e., NOx, SOx, NH4, and VOC) that are converted to
PM in the atmosphere. In contrast to PM10, PM2.5 concentrations were low in the
Coachella Valley area of SSAB. PM10 concentrations are normally higher in the
desert areas due to windblown and fugitive dust emissions; PM2.5 is relatively low in
the desert area due to fewer combustion-related emissions sources.
9 CARB Symposium: Estimating Premature Deaths from Long-term Exposure to PM2.5, February 26, 2010,
[http://www.arb.ca.gov/research/health/pm-mort/pm-mort-ws_02-26-10.htm].
Chapter 2: Air Quality and Health Effects
2 - 15
TABLE 2-5
2011 Maximum 24-hour Average PM2.5 Concentrations by Basin and County
BASIN/COUNTY
MAXIMUM 24-HR
AVERAGE#
(G/M3)
PERCENT OF FEDERAL
STANDARD* (35 G/M
3)
AREA
South Coast Air Basin
Los Angeles** 49.5 139 East San Gabriel Valley
Orange 39.2 110 Central Orange County
Riverside 60.8 171 Metropolitan Riverside County
San Bernardino 65.0 183 Central San Bernardino Valley
Salton Sea Air Basin
Riverside*** 35.4 99.7 Coachella Valley
# Based on FRM data
* Although maximum 24-hour concentrations exceed the standard, the 98th
percentile form of the 2009-2011
design value only exceeded the standard at one station in Metropolitan Riverside County (Mira Loma)
** One higher concentration that was recorded due to “Independence Day” firework activities has been
flagged for exclusion from NAAQS comparison in accordance with the U.S. EPA Exceptional Events Rule;
with this data included, the 2009-2011 design value for East San Gabriel Valley would also exceed the
federal standard
*** While this concentration of 35.4 µg/m3 is near the level of the standard, it is technically not exceeding the
standard (35.5 µg/m3 exceeds); this concentration was associated with a high wind exceptional event
TABLE 2-6
2011 Maximum Annual Average PM2.5 Concentrations by Basin and County
BASIN/COUNTY ANNUAL
AVERAGE* (G/M3)
PERCENT OF FEDERAL
STANDARD (15 G/M
3)
AREA
South Coast Air Basin
Los Angeles 13.3 89 Central Los Angeles
Orange 11.0 73 Central Orange County
Riverside 15.3 101 Metropolitan Riverside County
San Bernardino 13.3 89 Southwest San Bernardino Valley
Salton Sea Air Basin
Riverside 7.1 47 Coachella Valley
* Based on FRM data
Final 2012 AQMP
2 - 16
FIGURE 2-3
2011 PM2.5: Annual Average Concentration Compared to the Federal Standard
(Federal standard = 15 µg/m3, annual arithmetic mean)
Air Quality, PM10
In 2011, the District monitored PM10 concentrations at 25 routine sampling locations,
22 with Federal Reference Method (FRM) filter samplers and 3 with Federal
Equivalent Method (FEM) continuous monitors. Five sites had collocated FRM and
FEM samplers. Maximum 24-hour and annual average PM10 concentrations in 2011
are shown in Tables 2-7 and 2-8.
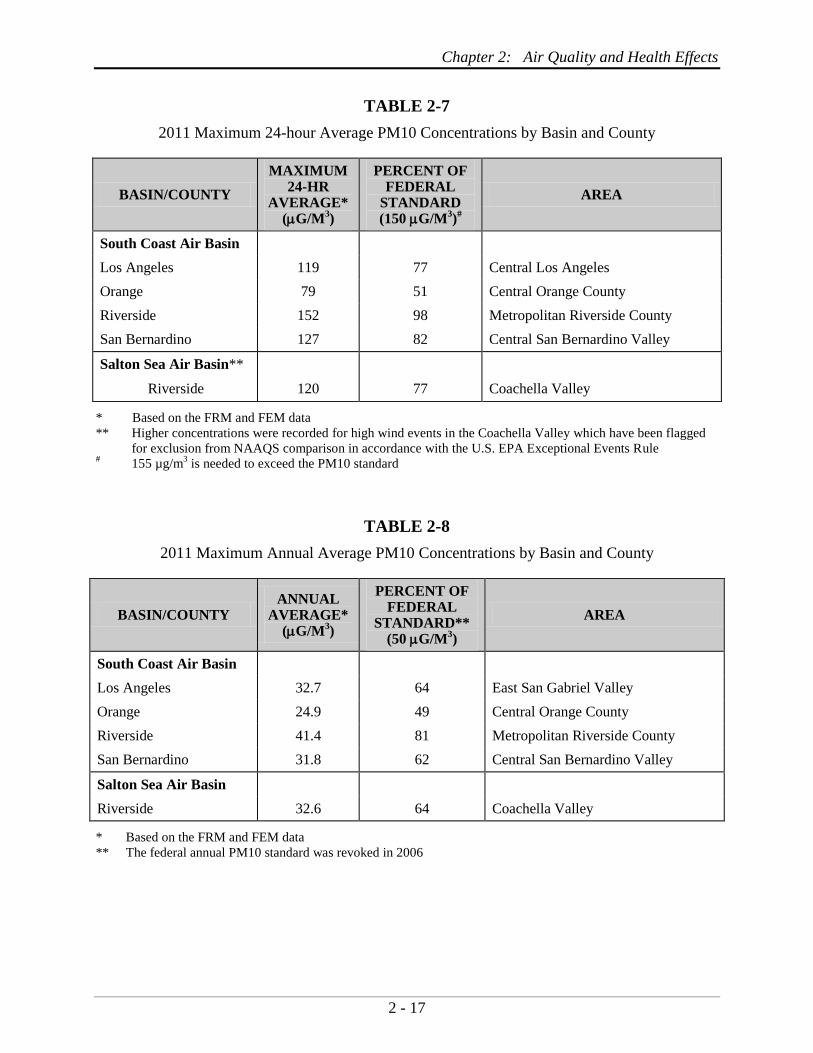
The highest annual PM10 concentrations were recorded in Riverside and San
Bernardino Counties, in and around the metropolitan Riverside County area and
further inland in the San Bernardino valley areas. The federal 24-hour standard was
not exceeded at any of the locations monitored in 2011, although Riverside County
came close with a 24-hour average concentration of 152 µg/m3 (155 µg/m
3 is needed
to exceed). The revoked annual average PM10 federal standard (50 µg/m3) was not
exceeded in either the Basin or the Coachella Valley in 2011. The much more
stringent state standards were exceeded in most areas of the Basin and in the
Coachella Valley.
Chapter 2: Air Quality and Health Effects
2 - 17
TABLE 2-7
2011 Maximum 24-hour Average PM10 Concentrations by Basin and County
BASIN/COUNTY
MAXIMUM 24-HR
AVERAGE* (G/M
3)
PERCENT OF FEDERAL
STANDARD (150 G/M
3)
#
AREA
South Coast Air Basin
Los Angeles 119 77 Central Los Angeles
Orange 79 51 Central Orange County
Riverside 152 98 Metropolitan Riverside County
San Bernardino 127 82 Central San Bernardino Valley
Salton Sea Air Basin**
Riverside 120 77 Coachella Valley
* Based on the FRM and FEM data
** Higher concentrations were recorded for high wind events in the Coachella Valley which have been flagged
for exclusion from NAAQS comparison in accordance with the U.S. EPA Exceptional Events Rule # 155 µg/m
3 is needed to exceed the PM10 standard
TABLE 2-8
2011 Maximum Annual Average PM10 Concentrations by Basin and County
BASIN/COUNTY ANNUAL
AVERAGE* (G/M
3)
PERCENT OF FEDERAL
STANDARD** (50 G/M
3)
AREA
South Coast Air Basin
Los Angeles 32.7 64 East San Gabriel Valley
Orange 24.9 49 Central Orange County
Riverside 41.4 81 Metropolitan Riverside County
San Bernardino 31.8 62 Central San Bernardino Valley
Salton Sea Air Basin
Riverside 32.6 64 Coachella Valley
* Based on the FRM and FEM data
** The federal annual PM10 standard was revoked in 2006
Final 2012 AQMP
2 - 18
Ozone (O3) Specific Information
Health Effects, O3
The adverse effects of ozone air pollution exposure on health have been studied for
many years, as is documented by a significant body of peer-reviewed scientific
research, including studies conducted in southern California. The 2006 U.S. EPA
document, Air Quality Criteria for Ozone and Related Photochemical Oxidants10
,
describes these health effects and discusses the state of the scientific knowledge and
research. A summary of health effects information and additional references can also
be found in the 2012 AQMP, Appendix I.
Individuals exercising outdoors, children, and people with preexisting lung disease,
such as asthma and chronic pulmonary lung disease, are considered to be the most
susceptible sub-groups to ozone effects. Short-term exposures (lasting for a few
hours) to ozone at levels typically observed in Southern California can result in
breathing pattern changes, reduction of breathing capacity, increased susceptibility to
infections, inflammation of the lung tissue, and some immunological changes.
Elevated ozone levels are associated with increased school absences and daily
hospital admission rates. An increased risk for asthma has been found in children
who participate in multiple sports and live in high ozone communities.
Ozone exposure under exercising conditions is known to increase the severity of the
above-mentioned observed responses. Animal studies suggest that exposures to a
combination of pollutants which include ozone may be more toxic than exposure to
ozone alone. Although lung volume and resistance changes observed after a single
exposure diminish with repeated exposures, biochemical and cellular changes appear
to persist, which can lead to subsequent lung structural changes.
Air Quality, O3
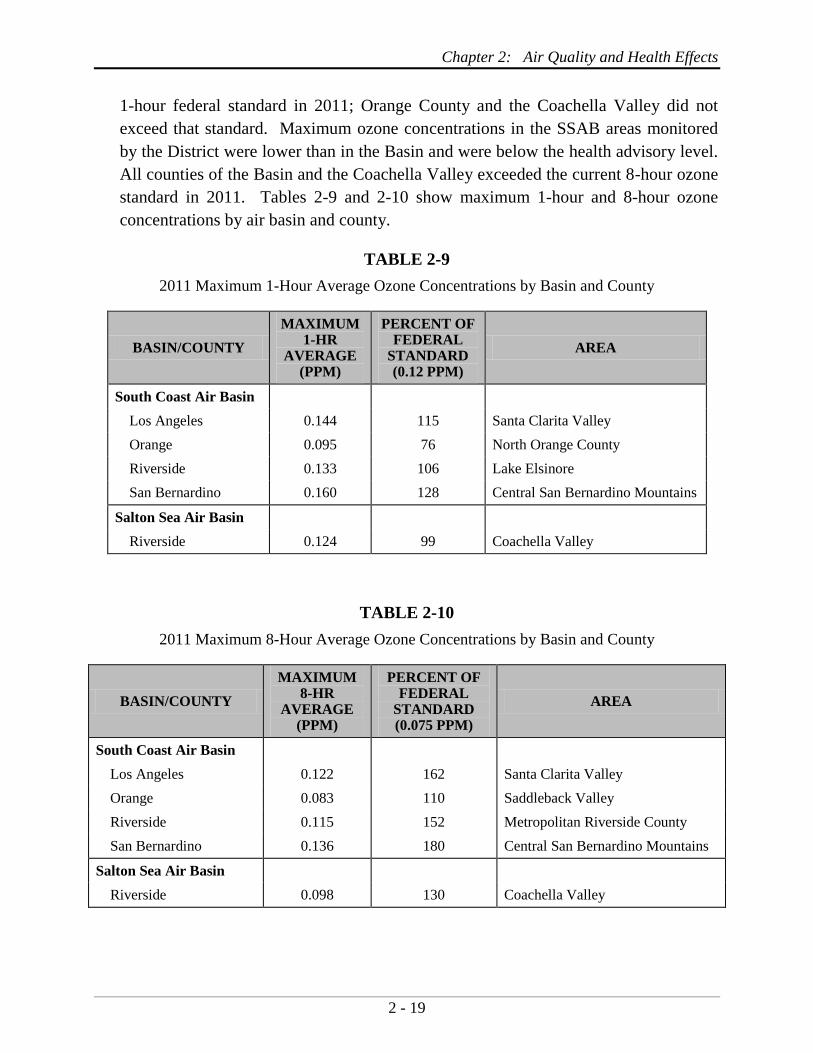
In 2011, the District regularly monitored ozone concentrations at 29 locations in the
Basin and the Coachella Valley portion of the SSAB. All areas monitored measured
1-hour average ozone levels well below the Stage 1 episode level (0.20 ppm), but the
maximum concentrations measured in the Basin exceeded the health advisory level
(0.15 ppm, 1-hour) in San Bernardino County. The maximum ozone concentrations
in Los Angeles, Riverside and San Bernardino Counties all exceeded the former
10
U.S. EPA. (2006). Air Quality Criteria for Ozone and Related Photochemical Oxidants (2006 Final). U.S.
Environmental Protection Agency, Washington, DC, EPA/600/R-05/004aF-cF.
Chapter 2: Air Quality and Health Effects
2 - 19
1-hour federal standard in 2011; Orange County and the Coachella Valley did not
exceed that standard. Maximum ozone concentrations in the SSAB areas monitored
by the District were lower than in the Basin and were below the health advisory level.
All counties of the Basin and the Coachella Valley exceeded the current 8-hour ozone
standard in 2011. Tables 2-9 and 2-10 show maximum 1-hour and 8-hour ozone
concentrations by air basin and county.
TABLE 2-9
2011 Maximum 1-Hour Average Ozone Concentrations by Basin and County
BASIN/COUNTY
MAXIMUM 1-HR
AVERAGE (PPM)
PERCENT OF FEDERAL
STANDARD (0.12 PPM)
AREA
South Coast Air Basin
Los Angeles 0.144 115 Santa Clarita Valley
Orange 0.095 76 North Orange County
Riverside 0.133 106 Lake Elsinore
San Bernardino 0.160 128 Central San Bernardino Mountains
Salton Sea Air Basin
Riverside 0.124 99 Coachella Valley
TABLE 2-10
2011 Maximum 8-Hour Average Ozone Concentrations by Basin and County
BASIN/COUNTY
MAXIMUM 8-HR
AVERAGE (PPM)
PERCENT OF FEDERAL
STANDARD (0.075 PPM)
AREA
South Coast Air Basin
Los Angeles 0.122 162 Santa Clarita Valley
Orange 0.083 110 Saddleback Valley
Riverside 0.115 152 Metropolitan Riverside County
San Bernardino 0.136 180 Central San Bernardino Mountains
Salton Sea Air Basin
Riverside 0.098 130 Coachella Valley
Final 2012 AQMP
2 - 20
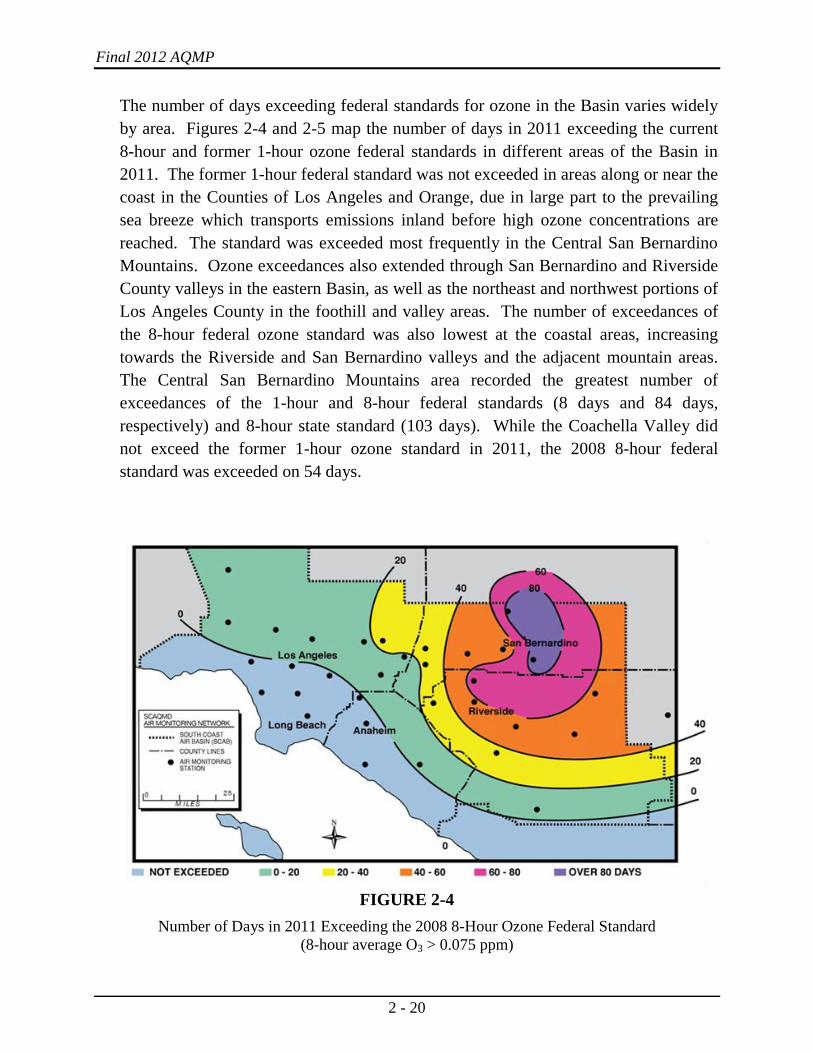
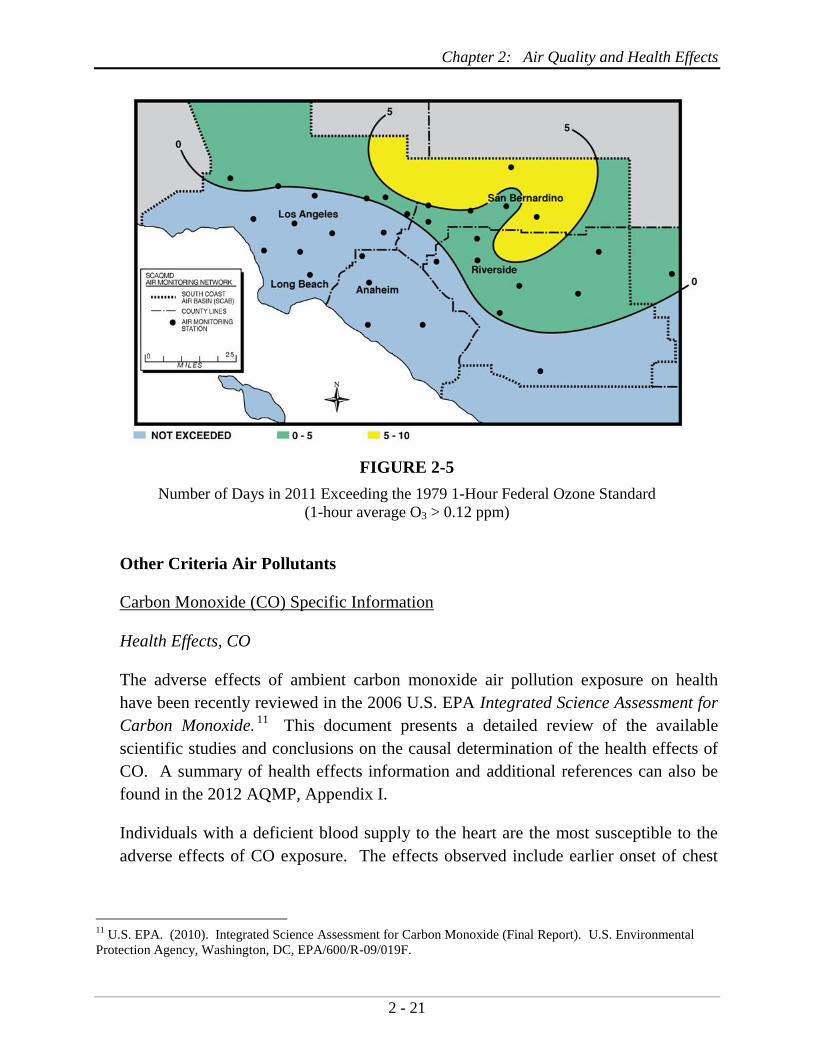
The number of days exceeding federal standards for ozone in the Basin varies widely
by area. Figures 2-4 and 2-5 map the number of days in 2011 exceeding the current
8-hour and former 1-hour ozone federal standards in different areas of the Basin in
2011. The former 1-hour federal standard was not exceeded in areas along or near the
coast in the Counties of Los Angeles and Orange, due in large part to the prevailing
sea breeze which transports emissions inland before high ozone concentrations are
reached. The standard was exceeded most frequently in the Central San Bernardino
Mountains. Ozone exceedances also extended through San Bernardino and Riverside
County valleys in the eastern Basin, as well as the northeast and northwest portions of
Los Angeles County in the foothill and valley areas. The number of exceedances of
the 8-hour federal ozone standard was also lowest at the coastal areas, increasing
towards the Riverside and San Bernardino valleys and the adjacent mountain areas.
The Central San Bernardino Mountains area recorded the greatest number of
exceedances of the 1-hour and 8-hour federal standards (8 days and 84 days,
respectively) and 8-hour state standard (103 days). While the Coachella Valley did
not exceed the former 1-hour ozone standard in 2011, the 2008 8-hour federal
standard was exceeded on 54 days.
FIGURE 2-4
Number of Days in 2011 Exceeding the 2008 8-Hour Ozone Federal Standard
(8-hour average O3 > 0.075 ppm)
Chapter 2: Air Quality and Health Effects
2 - 21
FIGURE 2-5
Number of Days in 2011 Exceeding the 1979 1-Hour Federal Ozone Standard
(1-hour average O3 > 0.12 ppm)
Other Criteria Air Pollutants
Carbon Monoxide (CO) Specific Information
Health Effects, CO
The adverse effects of ambient carbon monoxide air pollution exposure on health
have been recently reviewed in the 2006 U.S. EPA Integrated Science Assessment for
Carbon Monoxide.11
This document presents a detailed review of the available
scientific studies and conclusions on the causal determination of the health effects of
CO. A summary of health effects information and additional references can also be
found in the 2012 AQMP, Appendix I.
Individuals with a deficient blood supply to the heart are the most susceptible to the
adverse effects of CO exposure. The effects observed include earlier onset of chest
11
U.S. EPA. (2010). Integrated Science Assessment for Carbon Monoxide (Final Report). U.S. Environmental
Protection Agency, Washington, DC, EPA/600/R-09/019F.
Final 2012 AQMP
2 - 22
pain with exercise, and electrocardiograph changes indicative of worsening oxygen
supply delivery to the heart.
Inhaled CO has no known direct toxic effect on the lungs, but exerts its effect on
tissues by interfering with oxygen transport, by competing with oxygen to combine
with hemoglobin present in the blood to form carboxyhemoglobin (COHb). Hence,
people with conditions requiring an increased oxygen supply can be adversely
affected by exposure to CO. Individuals most at risk include patients with diseases
involving heart and blood vessels, fetuses, and patients with chronic hypoxemia
(oxygen deficiency) as seen at high altitudes.
Reductions in birth weight and impaired neurobehavioral development have been
observed in animals chronically exposed to CO resulting in COHb levels similar to
those observed in smokers. Recent studies have found increased risks for adverse
birth outcomes with exposure to elevated CO levels. These include pre-term births
and heart abnormalities.
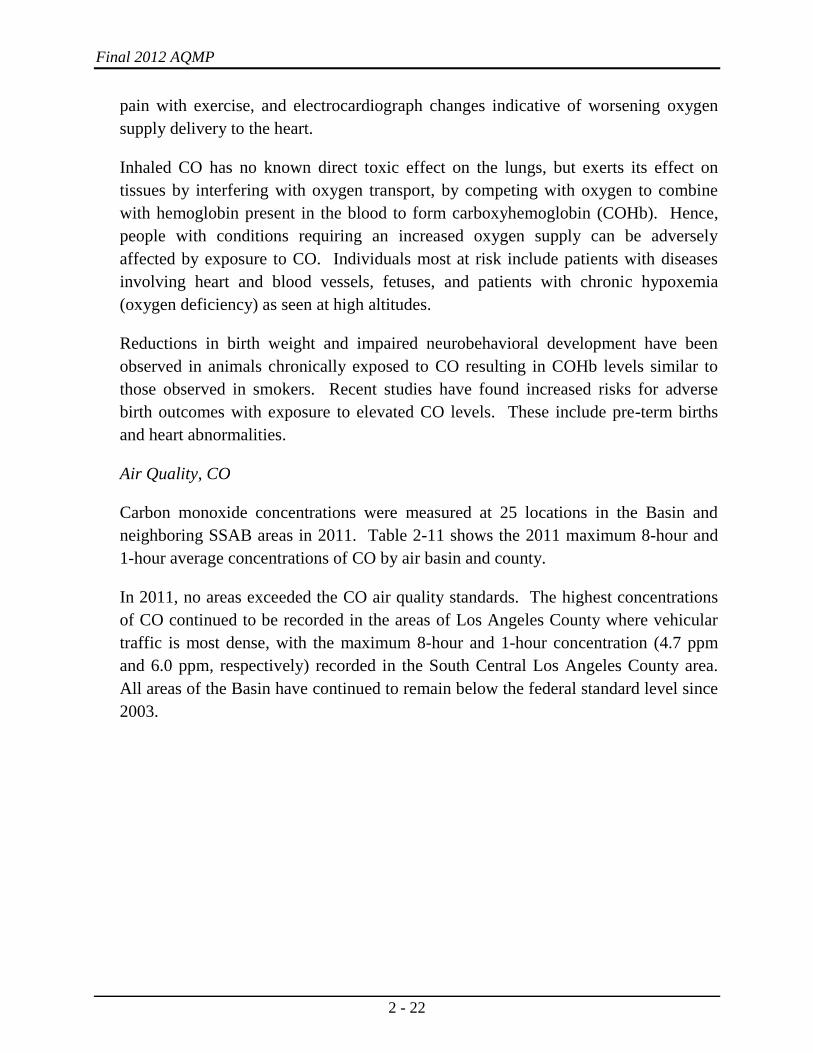
Air Quality, CO
Carbon monoxide concentrations were measured at 25 locations in the Basin and
neighboring SSAB areas in 2011. Table 2-11 shows the 2011 maximum 8-hour and
1-hour average concentrations of CO by air basin and county.
In 2011, no areas exceeded the CO air quality standards. The highest concentrations
of CO continued to be recorded in the areas of Los Angeles County where vehicular
traffic is most dense, with the maximum 8-hour and 1-hour concentration (4.7 ppm
and 6.0 ppm, respectively) recorded in the South Central Los Angeles County area.
All areas of the Basin have continued to remain below the federal standard level since
2003.
Chapter 2: Air Quality and Health Effects
2 - 23
TABLE 2-11
2011 Maximum 8-Hour and 1-Hour CO Concentrations by Basin and County
BASIN/COUNTY
MAXIMUM
8-HR
AVERAGE
(PPM)
PERCENT
OF
FEDERAL
STANDARD
(9 PPM)
MAXIMU
M
1-HR
AVERAGE
(PPM)
PERCENT
OF
FEDERAL
STANDARD
(35 PPM)
AREA
South Coast Air
Basin
Los Angeles 4.7 49 6.0 17 South Central L.A. County
Orange 2.2 23 3.4 10 North Coastal Orange County
Riverside 1.9 20 2.7 8 Metropolitan Riverside
County
San Bernardino 1.7 18 1.8 5 Central San Bernardino
Valley
Salton Sea Air
Basin
Riverside 0.6 6 3.0 8 Coachella Valley
Nitrogen Dioxide (NO2) Specific Information
Health Effects, NO2
The adverse effects of ambient nitrogen dioxide air pollution exposure on health have
been recently reviewed in the 2008 U.S. EPA Integrated Science Assessment for
Oxides of Nitrogen – Health Criteria12
. This document presents a detailed review of
the available scientific studies and conclusions on the causal determination of the
health effects of NO2, including evidence supporting the recently adopted short-term
NO2 standard (1-hour, 100 ppb). A summary of health effects information and
additional references can also be found in the 2012 AQMP, Appendix I.
Population-based studies suggest that an increase in acute respiratory illness,
including infections and respiratory symptoms in children (not infants), is associated
with long-term exposures to NO2 at levels found in homes with gas stoves, which are
higher than ambient concentrations found in Southern California. Increase in
resistance to air flow and airway contraction is observed after short-term exposure to
NO2 in healthy subjects. Larger decreases in lung functions are observed in
12
U.S. EPA. (2008). Integrated Science Assessment for Oxides of Nitrogen – Health Criteria (Final Report). U.S.
Environmental Protection Agency, Washington, DC, EPA/600/R-08/071.
Final 2012 AQMP
2 - 24
individuals with asthma and/or chronic obstructive pulmonary disease (e.g., chronic
bronchitis, emphysema) than in healthy individuals, indicating a greater susceptibility
of these sub-groups. More recent studies have found associations between NO2
exposures and cardiopulmonary mortality, decreased lung function, respiratory
symptoms, and emergency room asthma visits.
In animals, exposure to levels of NO2 that are considerably higher than ambient
concentrations results in increased susceptibility to infections, possibly due to the
observed changes in cells involved in maintaining immune functions. The severity of
lung tissue damage associated with high levels of ozone exposure increases when
animals are exposed to a combination of ozone and NO2.
Based on the review of the NO2 standards, U.S. EPA has established the 1-hour NO2
standard to protect the public health against short-term exposure. The standard is set
at 100 ppb 1-hour average, effective April 7, 2010.
Air Quality, NO2
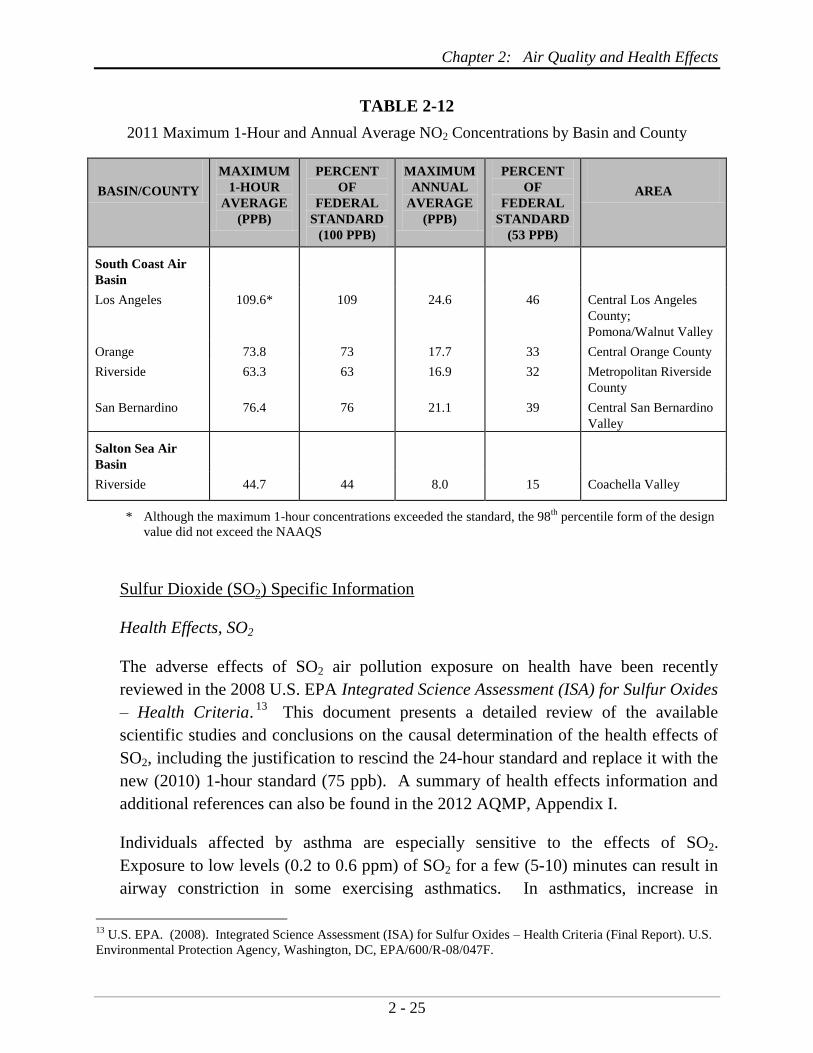
In 2011, NO2 concentrations were monitored at 25 locations, including one in the
Coachella Valley. The Basin has not exceeded the federal annual standard for NO2
(0.0534 ppm) since 1991, when the Los Angeles County portion of the Basin recorded
the last exceedance of the standard in any U.S. county. The recently established
1-hour average NO2 standard (100 ppb), however, was exceeded on one day in 2011
(but the 98th
percentile form of the standard was not exceeded). The higher relative
concentrations in the Los Angeles area are indicative of the concentrated emission
sources, especially motor vehicles. The maximum 1-hour and annual average
concentrations for 2011 are shown in Table 2-12, by basin and county.
Chapter 2: Air Quality and Health Effects
2 - 25
TABLE 2-12
2011 Maximum 1-Hour and Annual Average NO2 Concentrations by Basin and County
BASIN/COUNTY
MAXIMUM
1-HOUR
AVERAGE
(PPB)
PERCENT
OF
FEDERAL
STANDARD
(100 PPB)
MAXIMUM
ANNUAL
AVERAGE
(PPB)
PERCENT
OF
FEDERAL
STANDARD
(53 PPB)
AREA
South Coast Air
Basin
Los Angeles 109.6* 109 24.6 46 Central Los Angeles
County;
Pomona/Walnut Valley
Orange 73.8 73 17.7 33 Central Orange County
Riverside 63.3 63 16.9 32 Metropolitan Riverside
County
San Bernardino 76.4 76 21.1 39 Central San Bernardino
Valley
Salton Sea Air
Basin
Riverside 44.7 44 8.0 15 Coachella Valley
* Although the maximum 1-hour concentrations exceeded the standard, the 98th
percentile form of the design
value did not exceed the NAAQS
Sulfur Dioxide (SO2) Specific Information
Health Effects, SO2
The adverse effects of SO2 air pollution exposure on health have been recently
reviewed in the 2008 U.S. EPA Integrated Science Assessment (ISA) for Sulfur Oxides
– Health Criteria.13
This document presents a detailed review of the available
scientific studies and conclusions on the causal determination of the health effects of
SO2, including the justification to rescind the 24-hour standard and replace it with the
new (2010) 1-hour standard (75 ppb). A summary of health effects information and
additional references can also be found in the 2012 AQMP, Appendix I.
Individuals affected by asthma are especially sensitive to the effects of SO2.
Exposure to low levels (0.2 to 0.6 ppm) of SO2 for a few (5-10) minutes can result in
airway constriction in some exercising asthmatics. In asthmatics, increase in
13
U.S. EPA. (2008). Integrated Science Assessment (ISA) for Sulfur Oxides – Health Criteria (Final Report). U.S.
Environmental Protection Agency, Washington, DC, EPA/600/R-08/047F.
Final 2012 AQMP
2 - 26
resistance to air flow, as well as reduction in breathing capacity leading to severe
breathing difficulties, are observed after acute high exposure to SO2. In contrast,
healthy individuals do not exhibit similar acute responses even after exposure to
higher concentrations of SO2.
Animal studies suggest that even though SO2 is a respiratory irritant, it does not cause
substantial lung injury at ambient concentrations. However, very high levels of
exposure can cause lung edema (fluid accumulation), lung tissue damage, and
sloughing off of cells lining the respiratory tract.
Some population-based studies indicate that the mortality and morbidity effects
associated with fine particles show a similar association with ambient SO2 levels. In
these studies, efforts to separate the effects of SO2 from those of fine particles have
not been successful. It is not clear whether the two pollutants act synergistically or
one pollutant alone is the predominant factor.
Based on the review of the SO2 standards, U.S. EPA has established the 1-hour SO2
standard to protect the public health against short term exposure. The 1-hour average
standard is set at 75 ppb, revoking the existing annual (0.03 ppm) and 24-hour (0.14
ppm) standards, effective August 2, 2010.
Air Quality, SO2
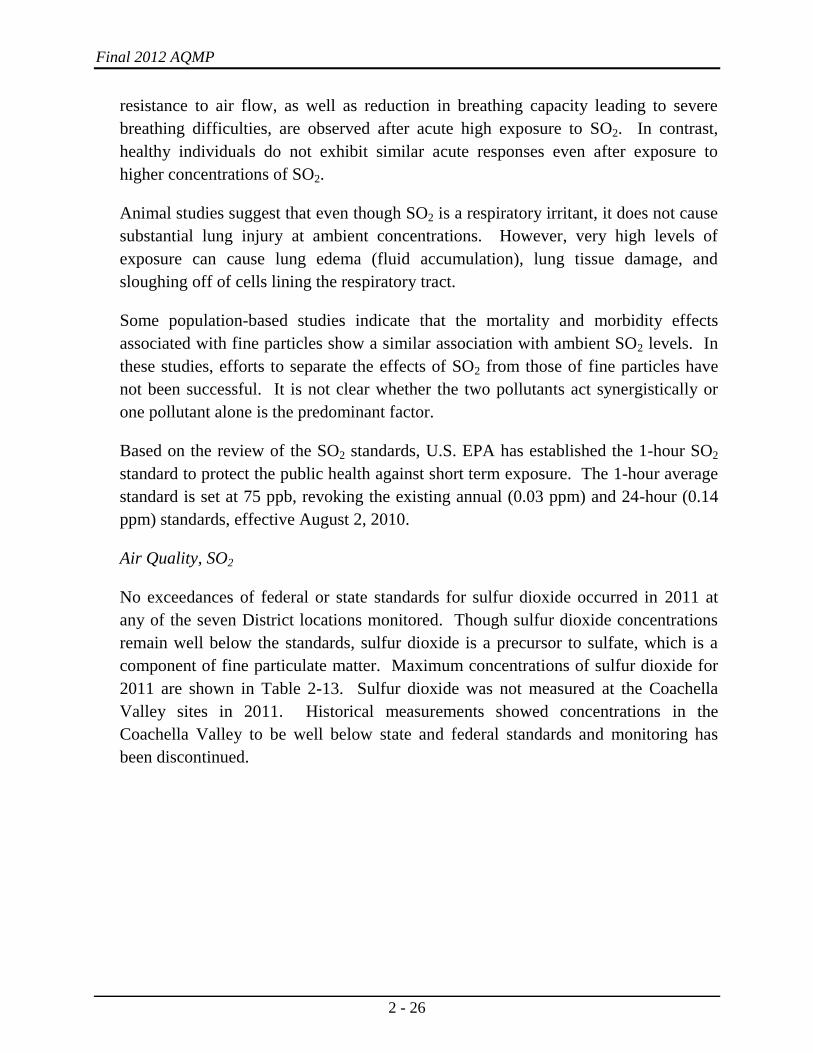
No exceedances of federal or state standards for sulfur dioxide occurred in 2011 at
any of the seven District locations monitored. Though sulfur dioxide concentrations
remain well below the standards, sulfur dioxide is a precursor to sulfate, which is a
component of fine particulate matter. Maximum concentrations of sulfur dioxide for
2011 are shown in Table 2-13. Sulfur dioxide was not measured at the Coachella
Valley sites in 2011. Historical measurements showed concentrations in the
Coachella Valley to be well below state and federal standards and monitoring has
been discontinued.
Chapter 2: Air Quality and Health Effects
2 - 27
TABLE 2-13
2011 Maximum 1-Hour Average SO2 Concentrations by Basin and County
BASIN/COUNTY
MAXIMUM 1-HR
AVERAGE (PPB)
PERCENT OF FEDERAL
STANDARD (75 PPB)
AREA
South Coast Air Basin
Los Angeles 43.4 57 South Coastal LA County
Orange 7.8 10 North Coastal Orange County
Riverside 51.2 68 Metropolitan Riverside County
San Bernardino 12.4 16 Central San Bernardino Valley
Salton Sea Air Basin
Riverside N.D. Coachella Valley
N.D. = No Data. Historical measurements and lack of emissions sources indicate concentrations are well
below standards
Sulfates (SO42-
) Specific Information
Health Effects, SO42-
In 2002, CARB reviewed and retained the state standard for sulfates, retaining the
concentration level (25 µg/m3) but changing the basis of the standard from a Total
Suspended Particulate (TSP) measurement to a PM10 measurement. In their 2002
staff report,14
CARB reviewed the health studies related to exposure to ambient
sulfates, along with particulate matter, and found an association with mortality and the
same range of morbidity effects as PM10 and PM2.5, although the associations were
not as consistent as with PM10 and PM2.5. The 2009 U.S. EPA Integrated Science
Assessment for Particulate Matter15
also contains a review of sulfate studies. A
summary of health effects information can also be found in the 2012 AQMP,
Appendix I.
Most of the health effects associated with fine particles and SO2 at ambient levels are
also associated with sulfates. Thus, both mortality and morbidity effects have been
observed with an increase in ambient sulfate concentrations. However, efforts to
14
CARB. (2002). Staff Report: Public Hearing to Consider Amendments to the Ambient Air Quality Standards for
Particulate Matter and Sulfates. California Air Resources Board, Sacramento, CA.
http://www.arb.ca.gov/regact/aaqspm/isor.pdf 15
U.S. EPA. (2009). Integrated Science Assessment for Particulate Matter (Final Report). U.S. Environmental
Protection Agency, Washington, DC, EPA/600/R-08/139F.
Final 2012 AQMP
2 - 28
separate the effects of sulfates from the effects of other pollutants have generally not
been successful.
Clinical studies of asthmatics exposed to sulfuric acid suggest that adolescent
asthmatics are possibly a subgroup susceptible to acid aerosol exposure. Animal
studies suggest that acidic particles such as sulfuric acid aerosol and ammonium
bisulfate are more toxic than non-acidic particles like ammonium sulfate. Whether
the effects are attributable to acidity or to particles remains unresolved.
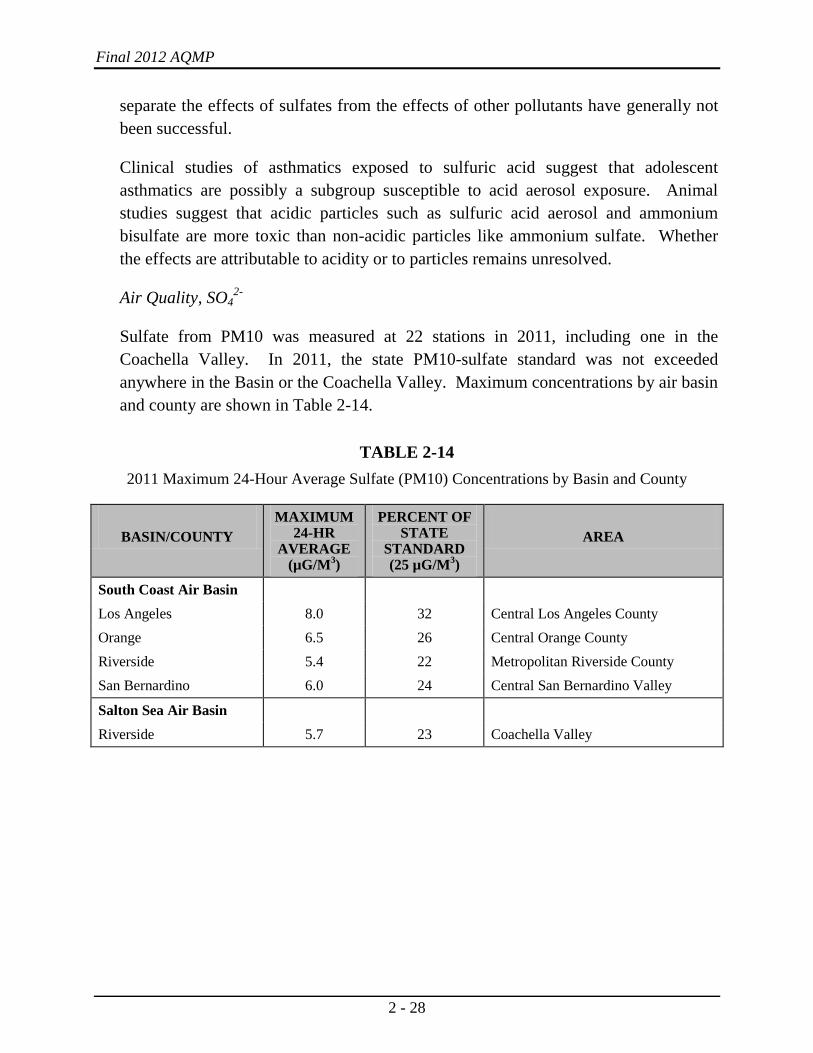
Air Quality, SO42-
Sulfate from PM10 was measured at 22 stations in 2011, including one in the
Coachella Valley. In 2011, the state PM10-sulfate standard was not exceeded
anywhere in the Basin or the Coachella Valley. Maximum concentrations by air basin
and county are shown in Table 2-14.
TABLE 2-14
2011 Maximum 24-Hour Average Sulfate (PM10) Concentrations by Basin and County
BASIN/COUNTY
MAXIMUM 24-HR
AVERAGE (µG/M
3)
PERCENT OF STATE
STANDARD (25 µG/M
3)
AREA
South Coast Air Basin
Los Angeles 8.0 32 Central Los Angeles County
Orange 6.5 26 Central Orange County
Riverside 5.4 22 Metropolitan Riverside County
San Bernardino 6.0 24 Central San Bernardino Valley
Salton Sea Air Basin
Riverside 5.7 23 Coachella Valley
Chapter 2: Air Quality and Health Effects
2 - 29
Lead (Pb) Specific Information
Health Effects, Pb
The adverse effects of ambient lead exposures on health have been reviewed in the
2006 U.S. EPA document, Air Quality Criteria for Lead (2006) Final Report.16
This
document presents a detailed assessment of the available scientific studies and
presents conclusions on the causal determination of the health effects of lead,
including the justification to lower the federal lead standard.
Fetuses, infants, and children are more sensitive than others to the adverse effects of
lead exposure. Exposure to low levels of lead can adversely affect the development
and function of the central nervous system, leading to learning disorders,
distractibility, inability to follow simple commands, and lower intelligence quotient.
In adults, increased lead levels are associated with increased blood pressure.
Lead poisoning can cause anemia, lethargy, seizures, and death. It appears that there
are no direct effects of lead on the respiratory system. Lead can be stored in the bone
from early-age environmental exposure, and elevated blood lead levels can occur due
to breakdown of bone tissue during pregnancy, hyperthyroidism (increased secretion
of hormones from the thyroid gland), and osteoporosis (breakdown of bony tissue).
Fetuses and breast-fed babies can be exposed to higher levels of lead because of
previous environmental lead exposure of their mothers.
Air Quality, Pb
Based on the review of the NAAQS for lead, U.S. EPA has established a new
standard of 0.15 µg/m3 for a rolling 3-month average, effective October 15, 2008
(measured from total suspended particulates, TSP). Except for the source-specific
monitoring that is now required under the new standard, there have been no violations
of the lead standards at the District’s regular air monitoring stations since 1982, as a
result of removal of lead from gasoline. However, monitoring at two stations
immediately adjacent to stationary sources of lead have recorded exceedances of the
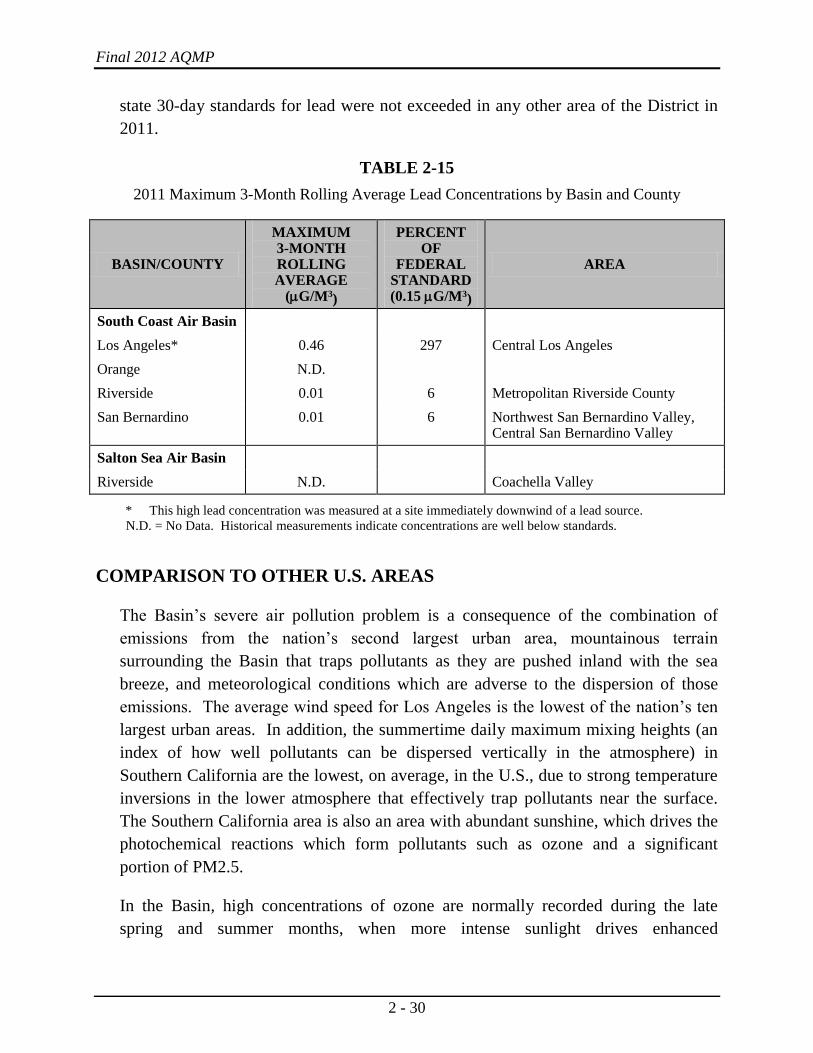
standards in localized areas of the Basin in more recent years. Table 2-15 shows the
maximum 3-month rolling average concentrations recorded in 2011. In 2011, lead
concentrations in the Basin exceeded the new 3-month rolling average standard (0.15
µg/m3) at one source-specific monitoring site in Los Angeles County, located
immediately downwind of a stationary lead source. The federal rolling 3-month and
16
U.S. EPA. (2006). Air Quality Criteria for Lead (2006) Final Report. U.S. Environmental Protection Agency,
Washington, DC, EPA/600/R-05/144aF-bF, 2006.
Final 2012 AQMP
2 - 30
state 30-day standards for lead were not exceeded in any other area of the District in
2011.
TABLE 2-15
2011 Maximum 3-Month Rolling Average Lead Concentrations by Basin and County
BASIN/COUNTY
MAXIMUM 3-MONTH ROLLING AVERAGE
(G/M3)
PERCENT OF
FEDERAL STANDARD (0.15 G/M3
)
AREA
South Coast Air Basin
Los Angeles* 0.46 297 Central Los Angeles
Orange N.D.
Riverside 0.01 6 Metropolitan Riverside County
San Bernardino 0.01 6 Northwest San Bernardino Valley, Central San Bernardino Valley
Salton Sea Air Basin
Riverside N.D. Coachella Valley
* This high lead concentration was measured at a site immediately downwind of a lead source.
N.D. = No Data. Historical measurements indicate concentrations are well below standards.
COMPARISON TO OTHER U.S. AREAS
The Basin’s severe air pollution problem is a consequence of the combination of
emissions from the nation’s second largest urban area, mountainous terrain
surrounding the Basin that traps pollutants as they are pushed inland with the sea
breeze, and meteorological conditions which are adverse to the dispersion of those
emissions. The average wind speed for Los Angeles is the lowest of the nation’s ten
largest urban areas. In addition, the summertime daily maximum mixing heights (an
index of how well pollutants can be dispersed vertically in the atmosphere) in
Southern California are the lowest, on average, in the U.S., due to strong temperature
inversions in the lower atmosphere that effectively trap pollutants near the surface.
The Southern California area is also an area with abundant sunshine, which drives the
photochemical reactions which form pollutants such as ozone and a significant
portion of PM2.5.
In the Basin, high concentrations of ozone are normally recorded during the late
spring and summer months, when more intense sunlight drives enhanced
Chapter 2: Air Quality and Health Effects
2 - 31
photochemical reactions. In contrast, higher concentrations of carbon monoxide are
generally recorded in late fall and winter, when nighttime radiation inversions trap the
emissions at the surface. High PM10 and PM2.5 concentrations can occur throughout
the year, but occur most frequently in fall and winter in the Basin. Although there are
changes in emissions by season, the observed variations in pollutant concentrations
are largely a result of seasonal differences in weather conditions.
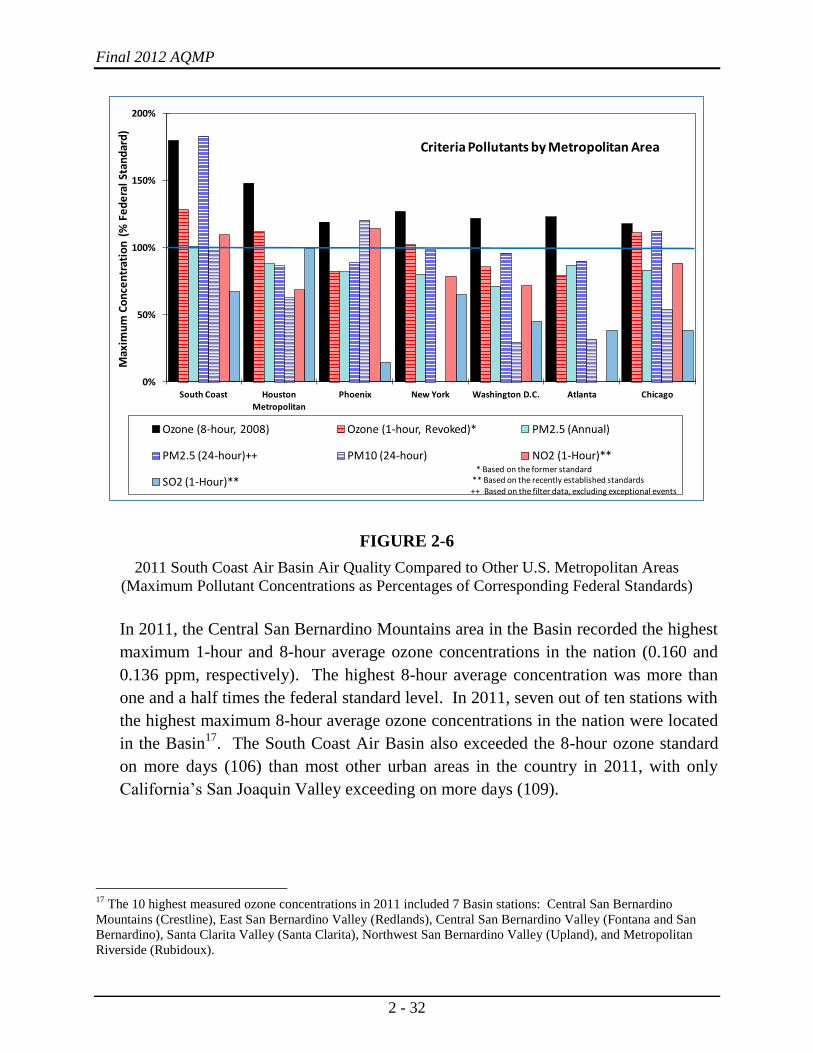
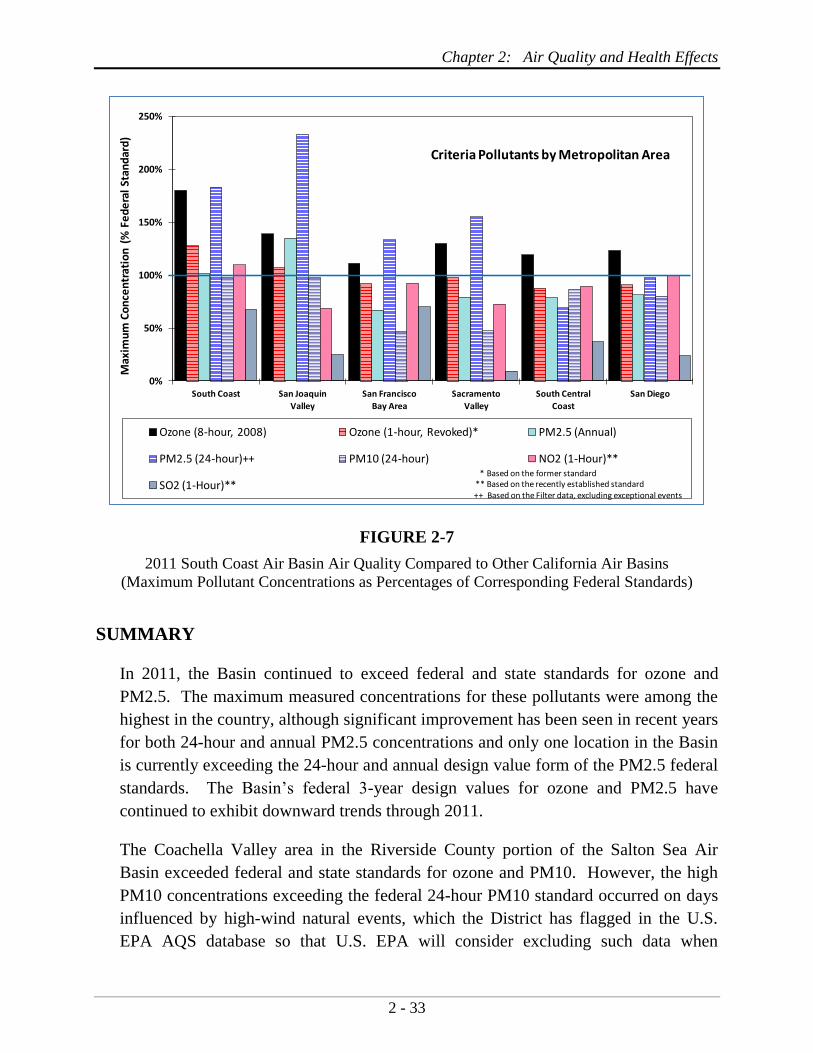
Figures 2-6 and 2-7 show maximum pollutant concentrations in 2011 for the South
Coast Air Basin compared to other urban areas in the U.S. and California,
respectively. Maximum concentrations in all of these areas exceeded the federal
8-hour ozone standard. The annual PM2.5 standard was exceeded in the Basin and in
one other California air basin (San Joaquin Valley). The 24-hour PM2.5 standard,
however, was exceeded in a few of the other large U.S. urban areas and in many
California air basins. The 24-hour PM10 standard was exceeded in one of the U.S.
urban areas shown (Phoenix), although potential flagging of exceptional events may
affect the treatment of that data. It is important to note that maximum pollutant
concentrations do not necessarily indicate potential nonattainment designations, as the
design values that are used for attainment status are based on the form of the standard.
Nitrogen dioxide concentrations exceeded the recently established 1-hour standard in
the Basin and Phoenix (on one day each). Denver, Colorado (not shown in Figure
2-7), was the only other U.S. urban area exceeding the NO2 standard in 2011. Sulfur
dioxide concentrations were below the recently established 1-hour federal standard in
the Basin and all of the urban areas shown in Figures 2-6 and 2-7. However, the SO2
standard was exceeded in other U.S. areas, with the highest concentrations recorded in
Hawaii, due to volcano emissions. The CO standards were not exceeded in the U.S.
in 2011.
Final 2012 AQMP
2 - 32
FIGURE 2-6
2011 South Coast Air Basin Air Quality Compared to Other U.S. Metropolitan Areas
(Maximum Pollutant Concentrations as Percentages of Corresponding Federal Standards)
In 2011, the Central San Bernardino Mountains area in the Basin recorded the highest
maximum 1-hour and 8-hour average ozone concentrations in the nation (0.160 and
0.136 ppm, respectively). The highest 8-hour average concentration was more than
one and a half times the federal standard level. In 2011, seven out of ten stations with
the highest maximum 8-hour average ozone concentrations in the nation were located
in the Basin17
. The South Coast Air Basin also exceeded the 8-hour ozone standard
on more days (106) than most other urban areas in the country in 2011, with only
California’s San Joaquin Valley exceeding on more days (109).
17
The 10 highest measured ozone concentrations in 2011 included 7 Basin stations: Central San Bernardino
Mountains (Crestline), East San Bernardino Valley (Redlands), Central San Bernardino Valley (Fontana and San
Bernardino), Santa Clarita Valley (Santa Clarita), Northwest San Bernardino Valley (Upland), and Metropolitan
Riverside (Rubidoux).
0%
50%
100%
150%
200%
South Coast Houston
Metropolitan
Phoenix New York Washington D.C. Atlanta Chicago
Max
imu
m C
on
cen
trat
ion
(%
Fe
de
ral
Stan
dar
d)
Criteria Pollutants by Metropolitan Area
Ozone (8-hour, 2008) Ozone (1-hour, Revoked)* PM2.5 (Annual)
PM2.5 (24-hour)++ PM10 (24-hour) NO2 (1-Hour)**
SO2 (1-Hour)*** Based on the former standard
** Based on the recently established standards++ Based on the filter data, excluding exceptional events
Chapter 2: Air Quality and Health Effects
2 - 33
FIGURE 2-7
2011 South Coast Air Basin Air Quality Compared to Other California Air Basins
(Maximum Pollutant Concentrations as Percentages of Corresponding Federal Standards)
SUMMARY
In 2011, the Basin continued to exceed federal and state standards for ozone and
PM2.5. The maximum measured concentrations for these pollutants were among the
highest in the country, although significant improvement has been seen in recent years
for both 24-hour and annual PM2.5 concentrations and only one location in the Basin
is currently exceeding the 24-hour and annual design value form of the PM2.5 federal
standards. The Basin’s federal 3-year design values for ozone and PM2.5 have
continued to exhibit downward trends through 2011.
The Coachella Valley area in the Riverside County portion of the Salton Sea Air
Basin exceeded federal and state standards for ozone and PM10. However, the high
PM10 concentrations exceeding the federal 24-hour PM10 standard occurred on days
influenced by high-wind natural events, which the District has flagged in the U.S.
EPA AQS database so that U.S. EPA will consider excluding such data when
0%
50%
100%
150%
200%
250%
South Coast San Joaquin
Valley
San Francisco
Bay Area
Sacramento
Valley
South Central
Coast
San Diego
Max
imu
m C
on
cen
trat
ion
(%
Fe
de
ral
Stan
dar
d)
Criteria Pollutants by Metropolitan Area
Ozone (8-hour, 2008) Ozone (1-hour, Revoked)* PM2.5 (Annual)
PM2.5 (24-hour)++ PM10 (24-hour) NO2 (1-Hour)**
SO2 (1-Hour)*** Based on the former standard
** Based on the recently established standard++ Based on the Filter data, excluding exceptional events
Final 2012 AQMP
2 - 34
determining the NAAQS attainment status in accordance with U.S. EPA’s
Exceptional Events Rule. For the stations in the Coachella Valley, the federal 3-year
design values for 8-hour ozone have continued to exhibit downward trends through
2011.
The NO2 concentrations in Los Angeles County exceeded the recently established
short-term federal standard on one day at two locations, but did not exceed the
standards anywhere on any other day in the Basin. The 98th
percentile form of the
federal NO2 standard was not exceeded and the Basin’s attainment status remains
intact. The Los Angeles County portion of the Basin also exceeded the 3-month
rolling average Pb federal standard at one source-specific monitor adjacent to a Pb
source. A separate SIP revision has been submitted to address Pb violations.
Maximum concentrations for SO2, CO, and sulfate (measured from PM10) continued
to remain below the state and federal standards.