Embed Size (px)
Citation preview
CHAPTER 2
EXPERIMENTAL
2.1 List of Apparatus
a. Analytical balance, Mettler Toledo AB204-S, USA
b. UV/Vis Spectrophotometer, Lambda 25, Perkin Elmer Instruments, Serial No. 101
N1121004, USA
c. Drying Oven FCO-100, Whatman International Ltd., England
d. DR/2400 HACH Spectrophotometer, USA
e. pH meter, Multi-parameter analyzer, consort C533 version 2.2
f. Thermometer
g. Conductivity meter, Multi-parameter analyzer, consort C533 version 2.2
h. Winkler bottle; 300 mL
i. Volumetric flasks, Germany
j. Erlenmeyer flasks, Germany
k. Burette 50 mL, Germany
l. Filter papers, No.1, Whatman, Cat No. 1001 090, Whatman International Ltd.,
England
m. Micropipette, Finnpipette®, Thermo Labsystems, Finland
ÅÔ¢ÊÔ·¸Ô ìÁËÒÇÔ·ÂÒÅÑÂàªÕ§ãËÁèCopyright by Chiang Mai UniversityA l l r i g h t s r e s e r v e d
ÅÔ¢ÊÔ·¸Ô ìÁËÒÇÔ·ÂÒÅÑÂàªÕ§ãËÁèCopyright by Chiang Mai UniversityA l l r i g h t s r e s e r v e d
19
2.2 List of Chemicals
2.2.1 Analysis of dissolved oxygen (DO) and biochemical oxygen demand (BOD)
a. Manganese (II) sulfate solution (MnSO4.4H2O), E.Merck, pro analysi, Germany
b. Sodium hydroxide (NaOH, 40.00), Lab-Scan, Ireland
c. Sodium iodide (NaI, 149.89), 99%, Carlo Erba, Italy
d. Sodium azide (NaN3), E. Merck, pro analysi, Germany
e. Starch, E. Merck, pro analysi, Germany
f. Sodium thiosulfate 5-hydrate (Na2S2O3.5H2O), E. Merck, pro analysi, Germany
g. Sulfuric acid 95-97%, H2SO4, 5N, E. Merck, pro analysi, Germany
h. Potassium iodide (KI, 166) 99%-105%, AJAX, Australia
i. Potassium dichromate (K2Cr2O7). E. Merck, pro analysi, Germany
2.2.2 Nitrate-N parameter
I. APHA method 4500-NO3- B Ultraviolet spectrophotometric screening method
a. Standard Potassium nitrate (KNO3), E. Merck, pro analysi, Germany
b. Hydrochloric acid, HCl, 1 N solution, specific gravity 1.18, AnalaR, BDH
Chemicals Ltd., England
II. DIN 38405-D9 method
a. Standard Potassium nitrate (KNO3), E. Merck, pro analysi, Germany
b. Acid mixture
Sulfuric acid 95-97%, H2SO4, E. Merck, pro analysi, Germany
ÅÔ¢ÊÔ·¸Ô ìÁËÒÇÔ·ÂÒÅÑÂàªÕ§ãËÁèCopyright by Chiang Mai UniversityA l l r i g h t s r e s e r v e d
ÅÔ¢ÊÔ·¸Ô ìÁËÒÇÔ·ÂÒÅÑÂàªÕ§ãËÁèCopyright by Chiang Mai UniversityA l l r i g h t s r e s e r v e d
20
Orthophosphoric acid 85%, H3PO4, ACS-ISO-For analysis, Carlo Erba, Italy
c. Dimethyl phenol, C8H10O solution, ACROS organics, Belgium
d. Glacial Acetic Acid 99.5%, E. Merck, pro analysi, Germany
III. Pillow test, method 8039 by HACH® DR/2400
Permachem® reagents, Lot A5325, Cat. 14034-99 Pk/100. NitraVer® 5
Nitrate reagent for 25 mL sample. The reagent contains: Cadmium (7440-43-90),
Gentisic Acid (490-79-9), Magnesium Sulfate (10034-99-8), other components,
Potassium Phosphate monobasic (7778-77-0), Sulfanilic Acid (121-57-3), HACH,
USA.
2.2.3 o-Phosphate parameter
I. APHA method 4500-P E Ascorbic acid method
a. Potassium antimonyl tartrate solution, K(SbO)C4H4O6.½H2O, Fluka Chemika,
Switzerland
b. Ammonium molybdate solution, (NH4)6Mo7O24.4H2O, E. Merck, pro analysi,
Germany
c. Ascorbic acid, C6H8O6, 0.1 M, Carlo Erba, Italy
d. Standard Potassium hydrogen phosphate solution, KH2PO4, E. Merck, pro analysi,
Germany
e. Sulfuric acid, H2SO4, 5N, E. Merck, pro analysi, Germany
ÅÔ¢ÊÔ·¸Ô ìÁËÒÇÔ·ÂÒÅÑÂàªÕ§ãËÁèCopyright by Chiang Mai UniversityA l l r i g h t s r e s e r v e d
ÅÔ¢ÊÔ·¸Ô ìÁËÒÇÔ·ÂÒÅÑÂàªÕ§ãËÁèCopyright by Chiang Mai UniversityA l l r i g h t s r e s e r v e d
21
II. DIN 38405-D11 method
a. Ascorbic acid solution 10%, C6H8O6, Carlo Erba, Italy
b. Standard Potassium hydrogen phosphate solution, KH2PO4, E. Merck, pro analysi,
Germany
c. Molybdate-reagent solution
Hexa ammonium heptamolybdate, (NH4)5Mo7O24.4H2O, E. Merck, pro analysi,
Germany
Sulfuric acid solution 95-97%, (1:1), H2SO4, E. Merck, pro analysi, Germany
Potassium antimone (III)-oxide tartrate, K(SbO)C4H4O6.½H2O, Fluka Chemika,
Switzerland
III. Pillow test, method 8048 by HACH® DR/2400
Permachem® reagents, Lot A2032, Cat. 2125-99 Pk/100. PhosVer® 5
Phosphate reagent for 25 mL sample. The reagent contains: Ascorbic Acid (50-81-7),
Potassium Pyrosulfate (7790-62-7), Sodium Monlybdate (10 102-40 6), HACH, USA.
2.2.4 Ammonium-N parameter
I. APHA method 4500-NH3 F Phenate method
a. Phenol solution, C6H6O, E. Merck, pro analysi, Germany
b. Ethyl alcohol, CH2OH, Carlo Erba, Italy
c. Disodium pentacyano nitrosyl ferrate (Sodium nitroprusside), 0.5% w/v,
Na2Fe(CN)5NO.2H2O, AnalaR, BDH Chemicals Ltd., England
d. Tri sodium citrate dihydrate, C6H5O7Na3.2H2O, Carlo Erba, Italy
ÅÔ¢ÊÔ·¸Ô ìÁËÒÇÔ·ÂÒÅÑÂàªÕ§ãËÁèCopyright by Chiang Mai UniversityA l l r i g h t s r e s e r v e d
ÅÔ¢ÊÔ·¸Ô ìÁËÒÇÔ·ÂÒÅÑÂàªÕ§ãËÁèCopyright by Chiang Mai UniversityA l l r i g h t s r e s e r v e d
22
e. Sodium hydroxide (NaOH, 40.00), Lab-Scan, Ireland
f. Sodium hypochlorite, commercial solution, about 6% w/w, I.P. Manufacturing
Ltd., Thailand
g. Standard ammonium chloride solution, NH4Cl, E. Merck, pro analysi, Germany
II. DIN 38406-E5 method
a. Salycilate citrate solution
Sodium salicylate, C7H5O3Na, E. Merck, pro analysi, Germany
Tri sodium citrate dihydrate, C6H5O7Na3.2H2O, Carlo Erba, Italy
Disodium pentacyano nitrosyl ferrate, (Sodium nitroprusside),
Na2Fe(CN)5NO.2H2O, AnalaR, BDH Chemicals Ltd., England
b. Chloride reagent
Sodium hydroxide (NaOH, 40.00), Lab-Scan, Ireland
Sodium dichlorisocyanurate, C3N3Cl2O3Na.2H2O, Fluka Chemika, Switzerland
c. Standard ammonium sulphate solution, (NH4)2SO4, E. Merck, pro analysi,
Germany
III. Pillow test, method 8038, by HACH® DR/2400
The Nessler method was used Nessler reagent, mineral stabilizer and
polyvinyl alcohol, HACH, USA. The instruction was used PermaChem® pillow as
shown in Appendix A-6. The procedure explained of DR/2400 manual as shown in
Appendix A-7.
ÅÔ¢ÊÔ·¸Ô ìÁËÒÇÔ·ÂÒÅÑÂàªÕ§ãËÁèCopyright by Chiang Mai UniversityA l l r i g h t s r e s e r v e d
ÅÔ¢ÊÔ·¸Ô ìÁËÒÇÔ·ÂÒÅÑÂàªÕ§ãËÁèCopyright by Chiang Mai UniversityA l l r i g h t s r e s e r v e d
23
2.3 Sampling Site and Sampling Period
The study was conducted at the Ping River. Fifteen sampling sites of the Ping
River from the Chiang Dao district, Chiang Mai Province to Muang district,
Nakornsawan Province. Eight parameters including water temperature, pH,
conductivity, nitrate-N, ortho-phosphate, ammonium-N, saturated oxygen and
biochemical oxygen demand (BOD5) used to determine the water quality index were
analyzed. The water quality assessment has been performed during rainy (wet) and
winter (cool dry) seasons. Water samples have been taken bimonthly from June 2005
to December 2005. (In this work was taken water sample on November 2005 because
on October 2005 could not take by flood in the Ping River).
The sampling sites of the Ping River were listed as shown in Table 2.1. The
map and their pictures are shown in Figure 2.1 and Figure 2.2
ÅÔ¢ÊÔ·¸Ô ìÁËÒÇÔ·ÂÒÅÑÂàªÕ§ãËÁèCopyright by Chiang Mai UniversityA l l r i g h t s r e s e r v e d
ÅÔ¢ÊÔ·¸Ô ìÁËÒÇÔ·ÂÒÅÑÂàªÕ§ãËÁèCopyright by Chiang Mai UniversityA l l r i g h t s r e s e r v e d
24
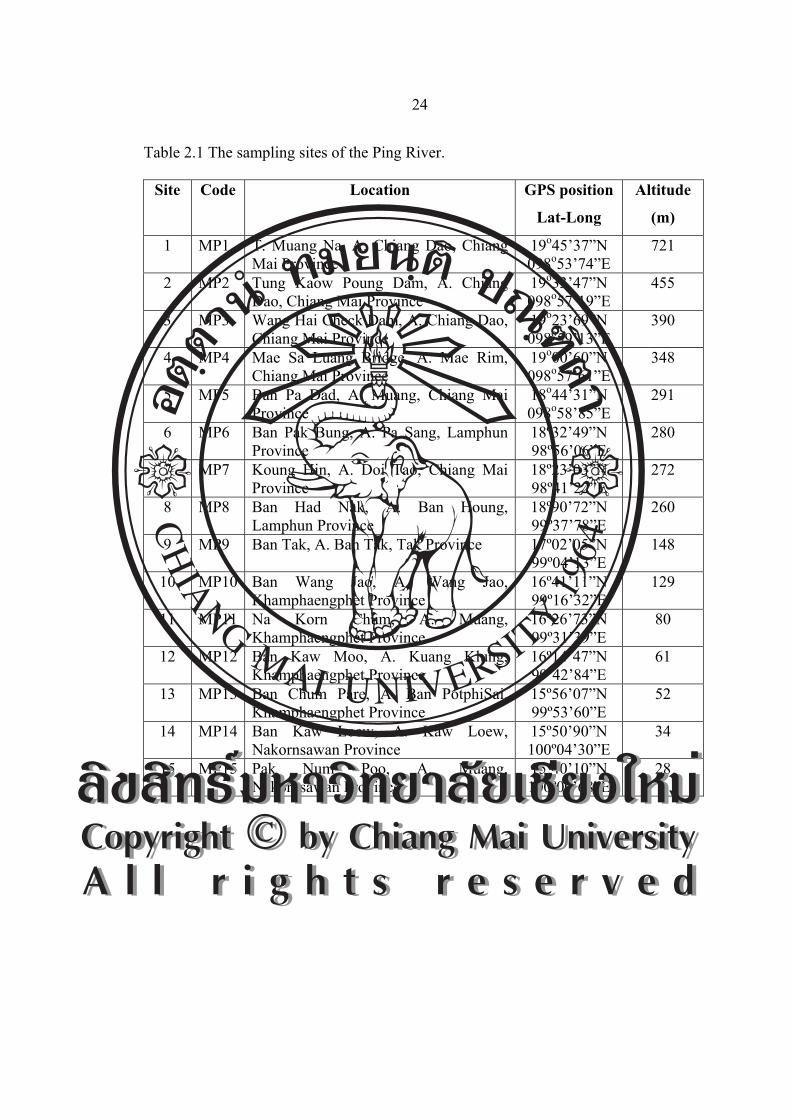
Table 2.1 The sampling sites of the Ping River.
Site Code Location GPS position
Lat-Long
Altitude
(m)
1 MP1 T. Muang Na, A. Chiang Dao, Chiang Mai Province
19o45’37”N 098o53’74”E
721
2 MP2 Tung Kaow Poung Dam, A. Chiang Dao, Chiang Mai Province
19o33’47”N 098o57’19”E
455
3 MP3 Wang Hai Check Dam, A. Chiang Dao, Chiang Mai Province
19o23’69”N 098o59’13”E
390
4 MP4 Mae Sa Luang Bridge, A. Mae Rim, Chiang Mai Province
19o00’60”N 098o57’61”E
348
5 MP5 Ban Pa Dad, A. Muang, Chiang Mai Province
18o44’31”N 098o58’85”E
291
6 MP6 Ban Pak Bung, A. Pa Sang, Lamphun Province
18º32’49”N 98º56’06”E
280
7 MP7 Koung Hin, A. Doi Tao, Chiang Mai Province
18º23’03”N 98º41’22”E
272
8 MP8 Ban Had Nak, A. Ban Houng, Lamphun Province
18º90’72”N 99º37’78”E
260
9 MP9 Ban Tak, A. Ban Tak, Tak Province 17º02’05”N 99º04’13”E
148
10 MP10 Ban Wang Jao, A. Wang Jao, Khamphaengphet Province
16º41’11”N 99º16’32”E
129
11 MP11 Na Korn Chum, A. Muang, Khamphaengphet Province
16º26’73”N 99º31’39”E
80
12 MP12 Ban Kaw Moo, A. Kuang Klung, Khamphaengphet Province
16º14’47”N 99º42’84”E
61
13 MP13 Ban Chum Pare, A. Ban PotphiSai, Khamphaengphet Province
15º56’07”N 99º53’60”E
52
14 MP14 Ban Kaw Loew, A. Kaw Loew, Nakornsawan Province
15º50’90”N 100º04’30”E
34
15 MP15 Pak Num Poo, A. Muang, Nakornsawan Province
15º40’10”N 100º00’68”E
28
ÅÔ¢ÊÔ·¸Ô ìÁËÒÇÔ·ÂÒÅÑÂàªÕ§ãËÁèCopyright by Chiang Mai UniversityA l l r i g h t s r e s e r v e d
ÅÔ¢ÊÔ·¸Ô ìÁËÒÇÔ·ÂÒÅÑÂàªÕ§ãËÁèCopyright by Chiang Mai UniversityA l l r i g h t s r e s e r v e d
25
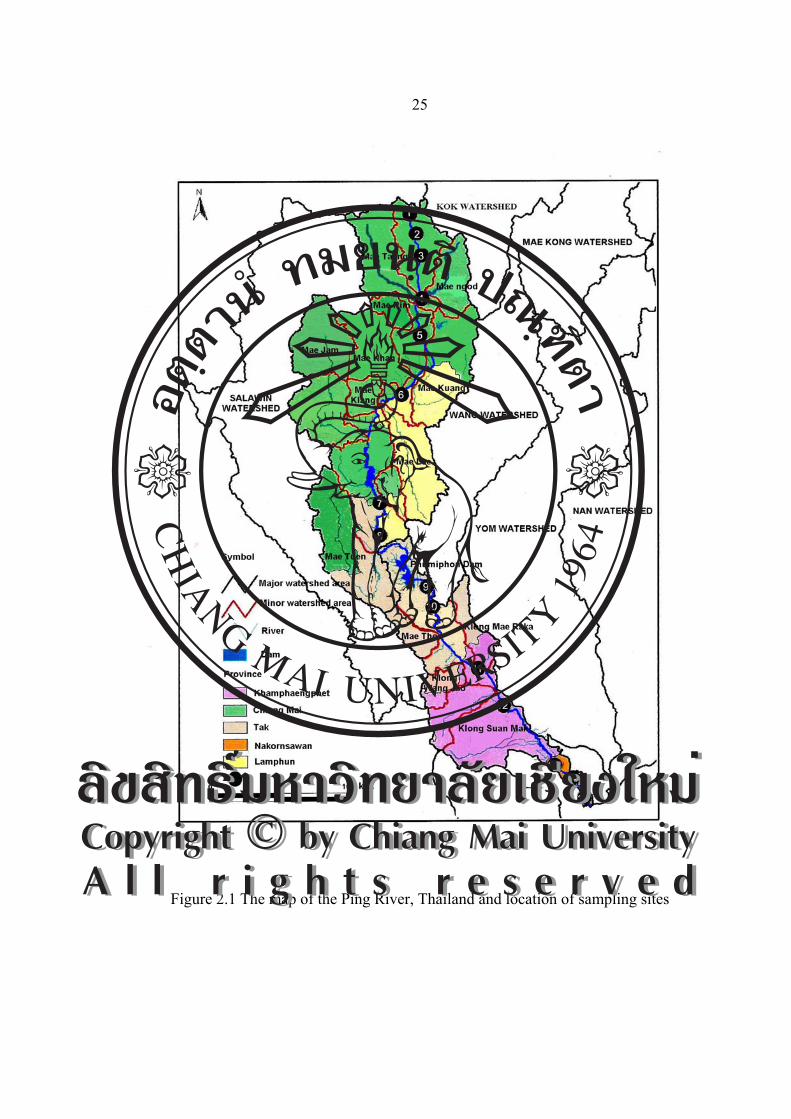
Figure 2.1 The map of the Ping River, Thailand and location of sampling sites
ÅÔ¢ÊÔ·¸Ô ìÁËÒÇÔ·ÂÒÅÑÂàªÕ§ãËÁèCopyright by Chiang Mai UniversityA l l r i g h t s r e s e r v e d
ÅÔ¢ÊÔ·¸Ô ìÁËÒÇÔ·ÂÒÅÑÂàªÕ§ãËÁèCopyright by Chiang Mai UniversityA l l r i g h t s r e s e r v e d
26
Description of the Sampling Sites
Sampling site 1, MP1: T. Muang Na, A. Chiang Dao, Chiang Mai Province
This sampling site is near the head water of the Ping River, the northern is the
border between Thailand and Myanmar at an altitude of 721 m above sea level. It was
located in deciduous forest with high percent canopy cover of trees and there were
many plants beside the stream which far from communities so it was less impact from
human activity. The stream width was 1-2 meters and approximately 10-15 cm depth.
The water current was moderate and it’s not change to during some parts of the year.
Sampling site 2, MP2: Tung Kaow Poung dam, A. Chiang Dao, Chiang Mai Province
This sampling site is a small dam at an altitude of 455 m above sea level; the
river width was 2-3 meters with 30-50 cm depth. The area around this sampling site
point was included rice fields and livestock area and pass from communities and some
part of the river use water for agriculture all year. The water current high speeds in
rainy season and beside the river were covered by grasses and plants.
Sampling site 3, MP3: Wang Hai check dam, A. Chiang Dao, Chiang Mai Province
This sampling site is the primitive dam for Lanna style since 1902 at an
altitude of 390 m above sea level. It’s made from the hard wood. It was located in the
forest with a very high percent canopy cover and was surrounding of Chiang Dao
Mountains and contain with high minerals and limestone. The substrates were boulder
and gravel, the water current has high speed in rainy season. In dry season the
sampling site was used for recreation.
ÅÔ¢ÊÔ·¸Ô ìÁËÒÇÔ·ÂÒÅÑÂàªÕ§ãËÁèCopyright by Chiang Mai UniversityA l l r i g h t s r e s e r v e d
ÅÔ¢ÊÔ·¸Ô ìÁËÒÇÔ·ÂÒÅÑÂàªÕ§ãËÁèCopyright by Chiang Mai UniversityA l l r i g h t s r e s e r v e d
27
Sampling site 4, MP4: Mae Sa Luang Bridge, A. Mae Rim, Chiang Mai Province
Sampling site is located in Amphoe Mae Tang and Amphoe Mae Rim at an
altitude of 348 m above sea level. The majorities of the activities beside the river were
agriculture, included Longan plantations. There was road construction near the site
and it had a land slide problem. The substrates of the river were silt and sand. The
water current was very high speed in rainy season it causes to land slide too. The river
width was 3-5 m and 60-30 cm depth.
Sampling site 5, MP5: Ban Pa Dad, A. Muang, Chiang Mai Province
This sampling site was conjunction with Mae Kha canal to the Ping River at
an altitude of 291 m above sea level. The Mae Kha canal was passed through many
community areas including agriculture areas and possessed livestock areas. The
sampling site was received water form household waste bit of packing cases from
canal-side stalls, plastic bags and other filth which lead to bad small and black color.
The type of substrate was silt and beside the river were many communities and big
market. The water current has very high speed in rainy season and river width was 6-8
m and 1-1.5 m depth.
Sampling site 6, MP6: Ban Pak Bung, A. Pa Sang, Lamphun Province
This sampling site was conjunction with Ping River and Kuang River at an
altitude of 280 m above sea level. The Kuang River was flow through large
communities and large industrial areas in Lamphun Province. Beside the river were
much agriculture such as Longan and Orange plantations and some aquatic plant. The
ÅÔ¢ÊÔ·¸Ô ìÁËÒÇÔ·ÂÒÅÑÂàªÕ§ãËÁèCopyright by Chiang Mai UniversityA l l r i g h t s r e s e r v e d
ÅÔ¢ÊÔ·¸Ô ìÁËÒÇÔ·ÂÒÅÑÂàªÕ§ãËÁèCopyright by Chiang Mai UniversityA l l r i g h t s r e s e r v e d
28
types of substrate were silt and sand, water current low speed, the river width was 8-
11 m and 1-2 m depth.
Sampling site 7, MP7: Koung Hin, A. Doi Tao, Chiang Mai Province
The sampling site was located at an altitude of 272 m above sea level. The
type of substrate was sand and in the rainy season had high sediment; it’s caused the
stream to be shallower. Beside the river were Longan plantation and many aquatic
plants which lead to low speed current. The river flow through the large communities
and at some part of the sampling site was point where local people used vehicles cross
the stream and fishing. The river width was 80-120 m and 40-50 cm depth. In the
rainy season there was very high speed water current.
Sampling site 8, MP8: Ban Had Nak, A. Ban Houng, Lamphun Province
This sampling site was located in the end of middle part of the Ping River
before water flow through Bhumiphon Dam at an altitude of 260 m above sea level.
The water current was low speed and beside the river were many activities such as
communities, agriculture areas and road construction. The type of substrate was sand
and collecting point width was 8-12 m and 80-90 cm depth.
Sampling site 9, MP9: Ban Tak, A. Ban Tak, Tak Province
This sampling site was the river flow out from Bhumiphon Dam and beside
the river were agriculture areas and communities and at an altitude of 148 m above
sea level. The type of substrate was sand, the water current very slow speed and very
ÅÔ¢ÊÔ·¸Ô ìÁËÒÇÔ·ÂÒÅÑÂàªÕ§ãËÁèCopyright by Chiang Mai UniversityA l l r i g h t s r e s e r v e d
ÅÔ¢ÊÔ·¸Ô ìÁËÒÇÔ·ÂÒÅÑÂàªÕ§ãËÁèCopyright by Chiang Mai UniversityA l l r i g h t s r e s e r v e d
29
shallow. The riparian zone of river was cover by high grasses and reeds. The river
width was 12-22 m and 40 cm depth.
Sampling site 10, MP10: Ban Wang Jao, A. Wang Jao, Khamphaengphet Province
The area around the sampling site was communities and agriculture areas,
included rice fields and corn plantations at an altitude of 129 m above sea level. The
sampling site was covered by many aquatic plants, small plants at the shore and some
bushes. The type of substrate was sand and the width was 20-32 m and 40-120 cm
depth.
Sampling site 11, MP 11: Na Korn Chum, A. Muang, Khamphaengphet Province
The sampling site was located at an altitude of 80 m above sea level. This
sampling site was located at the large village and the river flow through the city in the
town and many communities. Beside the river were restaurant and resorts which lead
to the water had high turbidity and water current very slow speed. The substrate
characters were sand and mud. The river width was 9-12 m and 1-2 m depth.
Sampling site 12, MP12: Ban Kaw Moo, A. Kuang Klung, Khamphaengphet Province
The sampling site was located at an altitude of 61 m above sea level. This
sampling site was located at the large village, agriculture areas, and included corn
plantations along the river. The substrate character was sand and beside the river was
covered by grasses and aquatic plants. The river width was 10-12 m and 40-160 cm
depth.
ÅÔ¢ÊÔ·¸Ô ìÁËÒÇÔ·ÂÒÅÑÂàªÕ§ãËÁèCopyright by Chiang Mai UniversityA l l r i g h t s r e s e r v e d
ÅÔ¢ÊÔ·¸Ô ìÁËÒÇÔ·ÂÒÅÑÂàªÕ§ãËÁèCopyright by Chiang Mai UniversityA l l r i g h t s r e s e r v e d
30
Sampling site 13, MP13: Ban Chum Pare, A. Ban PotphiSai, Khamphaengphet
Province
The sampling site was located at an altitude of 52 m above sea level. Some
parts of the sampling area were under a concrete bridge and some were covered by
small plants. There was road construction near the site and it had a land slide problem.
The substrates were silt and sand. The water current was high speed in rainy season.
Beside the river were grass fields for livestock, cows, buffaloes and goats. The river
width was 10-16 m and 80-260 cm depth.
Sampling site 14, MP14: Ban Kaw Loew, A. Kaw Loew, Nakornsawan Province
The sampling site was located at an altitude of 34 m above sea level. The areas
around the site were communities, restaurant and Chinese culture temple. The both of
river were covered by grass and aquatic plant. The substrates were sand and gravel.
The river width was 10-16 m and 80-260 cm depth
Sampling site 15, MP15: Pak Num Poo, A. Muang, Nakornsawan Province
The sampling site was the end the Ping River to conjunction with Yom and
Nan River to Chaopraya River at an altitude of 28 m above sea level. The river flow
through the city in the town, large communities, restaurant and resorts it causing
water had bad smell and water current very slow speed. The substrates were silt and
mud. The river width was 10-16 m and 80-260 cm depth.
ÅÔ¢ÊÔ·¸Ô ìÁËÒÇÔ·ÂÒÅÑÂàªÕ§ãËÁèCopyright by Chiang Mai UniversityA l l r i g h t s r e s e r v e d
ÅÔ¢ÊÔ·¸Ô ìÁËÒÇÔ·ÂÒÅÑÂàªÕ§ãËÁèCopyright by Chiang Mai UniversityA l l r i g h t s r e s e r v e d

31
MP1
MP2
MP3
MP4
MP5
MP6
Figure 2.2 The sampling site 1, 2, 3, 4, 5 and 6 of the study area
ÅÔ¢ÊÔ·¸Ô ìÁËÒÇÔ·ÂÒÅÑÂàªÕ§ãËÁèCopyright by Chiang Mai UniversityA l l r i g h t s r e s e r v e d
ÅÔ¢ÊÔ·¸Ô ìÁËÒÇÔ·ÂÒÅÑÂàªÕ§ãËÁèCopyright by Chiang Mai UniversityA l l r i g h t s r e s e r v e d
32
MP7
MP8
MP9
MP10
MP11
MP12
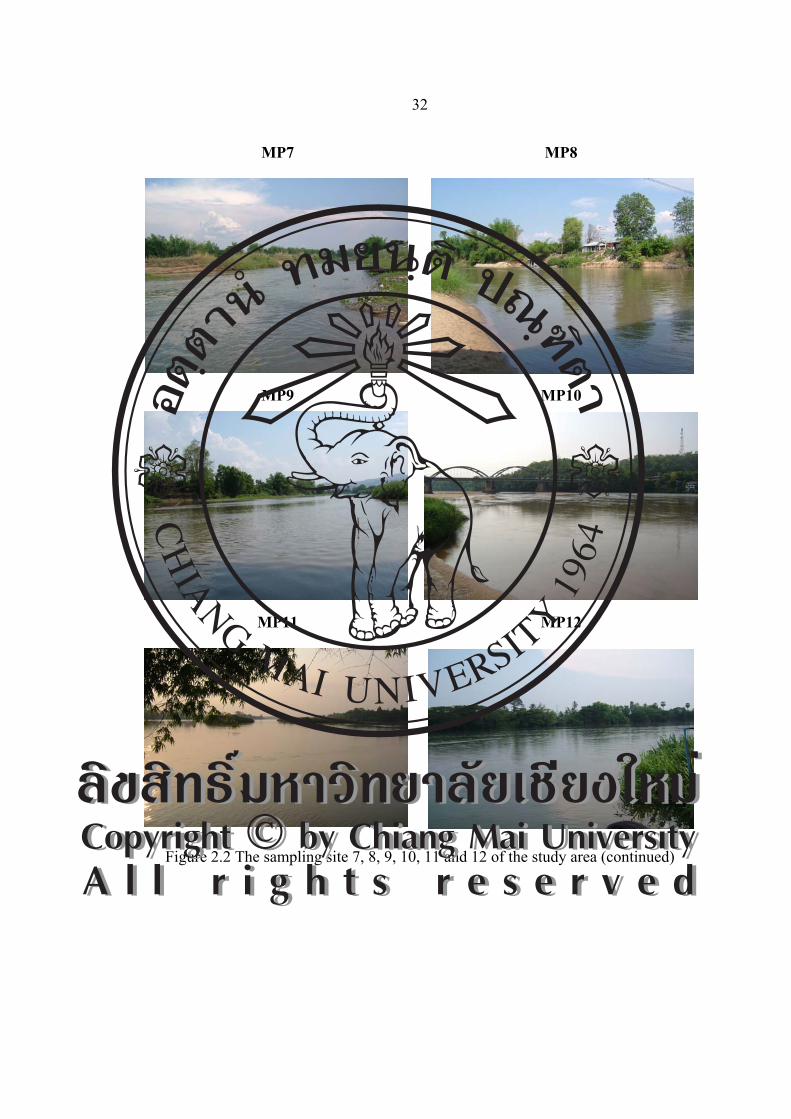
Figure 2.2 The sampling site 7, 8, 9, 10, 11 and 12 of the study area (continued)
ÅÔ¢ÊÔ·¸Ô ìÁËÒÇÔ·ÂÒÅÑÂàªÕ§ãËÁèCopyright by Chiang Mai UniversityA l l r i g h t s r e s e r v e d
ÅÔ¢ÊÔ·¸Ô ìÁËÒÇÔ·ÂÒÅÑÂàªÕ§ãËÁèCopyright by Chiang Mai UniversityA l l r i g h t s r e s e r v e d
33
MP13
MP14
MP15
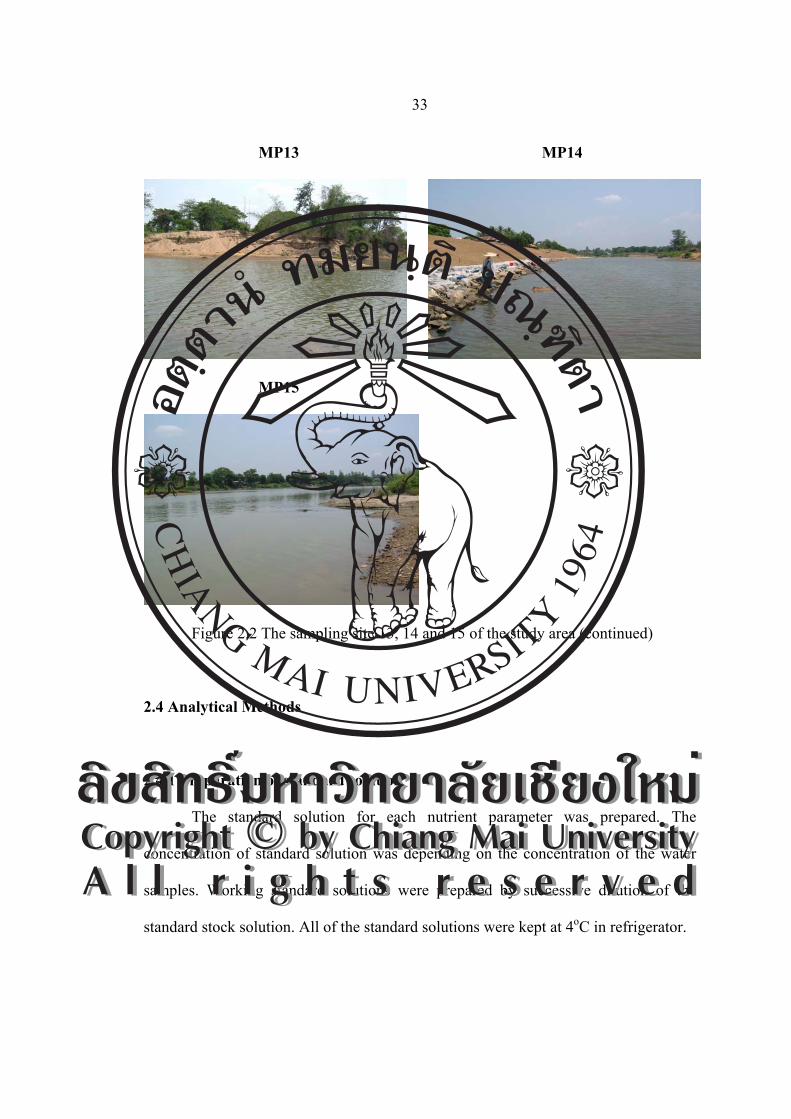
Figure 2.2 The sampling site 13, 14 and 15 of the study area (continued)
2.4 Analytical Methods
2.4.1 Preparation of standard solution
The standard solution for each nutrient parameter was prepared. The
concentration of standard solution was depending on the concentration of the water
samples. Working standard solutions were prepared by successive dilution of the
standard stock solution. All of the standard solutions were kept at 4oC in refrigerator.
ÅÔ¢ÊÔ·¸Ô ìÁËÒÇÔ·ÂÒÅÑÂàªÕ§ãËÁèCopyright by Chiang Mai UniversityA l l r i g h t s r e s e r v e d
ÅÔ¢ÊÔ·¸Ô ìÁËÒÇÔ·ÂÒÅÑÂàªÕ§ãËÁèCopyright by Chiang Mai UniversityA l l r i g h t s r e s e r v e d
34
2.4.2 Preparation of the reagents
I. Dissolved oxygen (DO) and biochemical oxygen demand (BOD5)
a) Manganese sulfate solution:
480 g MnSO4.4H2O, 400 g MnSO4.2H2O, or 364 g MnSO4.H2O were
dissolved in distilled water. The solutions were filtered and diluted to 1 L. The
manganese sulfate solution should not give a color with starch when added to an
acidified KI solution.
b) Alkali-iodide-azide reagent:
500 g NaOH (or 700 g KOH), and 135 g NaI, (or 150 g KI) were dissolved in
distilled water and diluted to 1 L. 10 g sodium azide, NaN3 was dissolved in 40 mL
distilled water and added to the potassium or sodium solution. Potassium and sodium
salts may be used interchangeably. This reagent should not show a color with starch
solution when diluted and acidified.
c) Sulfuric acid, H2SO4 conc.:
One mL of the H2SO4 is equivalent to about 3 mL alkali-iodide-azide reagent.
d) Starch solution:
Use either the aqueous solution or soluble starch powder mixtures. To prepare
the aqueous solution, 2 g laboratory-grade soluble starch and 0.2 g salicylic acid (as a
preservative) were dissolved in 100 mL hot distilled water.
ÅÔ¢ÊÔ·¸Ô ìÁËÒÇÔ·ÂÒÅÑÂàªÕ§ãËÁèCopyright by Chiang Mai UniversityA l l r i g h t s r e s e r v e d
ÅÔ¢ÊÔ·¸Ô ìÁËÒÇÔ·ÂÒÅÑÂàªÕ§ãËÁèCopyright by Chiang Mai UniversityA l l r i g h t s r e s e r v e d
35
e) Standard sodium thiosulfate titrant:
6.205 g Na2S2O3.5H2O was dissolved in distilled water. 1.5 mL 6N NaOH or
0.4 g NaOH pellet was diluted to 1,000 mL and was added into the sodium thiosulfate
solution. Standardization with bi-iodate solution.
f) Standard potassium bi-iodate solution, 0.0021 M:
812.4 mg KH (IO3)2 was dissolved and diluted in distilled water to 1,000 mL
in volumetric flask.
The procedure was explained in Appendix A-1 and A-2.
II. Nitrate-N parameter
A. APHA method 4500-NO3- B Ultraviolet spectrophotometric screening method
a) Standard Potassium nitrate, Nitrate stock solution:
Potassium nitrate (KNO3) was dried in an oven at 105 oC for 24 h. 0.7218 g
was dissolved and diluted in distilled water to 1,000 mL; 1.00 mL = 100 mg NO3- -N.
Two milliliter of CHCl3 per liter was used for preservative. This solution was stable
for 6 months.
b) Intermediate nitrate solution:
100 mL stock nitrate solution was diluted to 1000 mL with distilled water;
1.00 mL = 10.0 mg NO3- -N. Two milliliter of CHCl3 per liter was used for
preservative. This solution was stable for 6 months.
ÅÔ¢ÊÔ·¸Ô ìÁËÒÇÔ·ÂÒÅÑÂàªÕ§ãËÁèCopyright by Chiang Mai UniversityA l l r i g h t s r e s e r v e d
ÅÔ¢ÊÔ·¸Ô ìÁËÒÇÔ·ÂÒÅÑÂàªÕ§ãËÁèCopyright by Chiang Mai UniversityA l l r i g h t s r e s e r v e d
36
c) Hydrochloric acid, HCl, 1 N solution:
41.37 mL HCl was diluted in distilled water to 500 mL.
The procedure was explained in Appendix A-3.
B. DIN 38405-D9 method
a) Standard Potassium nitrate, Nitrate stock solution:
Stock solution of Potassium nitrate was prepared by dissolving 0.3609 g
dehydrated KNO3 (dry at 105 oC and cool down in desiccator) in distilled water and
adjusting the volume to 1 liter. This solution contains 0.05 mg Nitrate-N.
b) Acid mixture:
Sulfuric acid (d=1.84 g/mL) and phosphoric acid (d=1.71 g/mL) was diluted
and mixed in a ratio of 1:1 (v/v)
c) Dimethyl phenol solution:
1.2 g 2.6-dimethylphenol was diluted in 1 liter of glacial acetic acid. This
solution should be prepared weekly because unstable reagent.
The procedure was explained in Appendix A-3.
ÅÔ¢ÊÔ·¸Ô ìÁËÒÇÔ·ÂÒÅÑÂàªÕ§ãËÁèCopyright by Chiang Mai UniversityA l l r i g h t s r e s e r v e d
ÅÔ¢ÊÔ·¸Ô ìÁËÒÇÔ·ÂÒÅÑÂàªÕ§ãËÁèCopyright by Chiang Mai UniversityA l l r i g h t s r e s e r v e d
37
C. Pillow test
Analysis of water sample was used pillow test Nitra Ver 5 Nitrate reagent,
Cadmium Reduction method. Range of measure is 0.3 to 30.0 mg/L of NO3- -N. The
procedure was explained in Appendix A-8.
III. o-Phosphate parameter
A. APHA method 4500-P E Ascorbic acid method
a) Potassium antimonyl tartrate solution, K(SbO)C4H4O6.½H2O:
1.3715 g K(SbO)C4H4O6.½H2O were dissolved and diluted in 500 mL
distilled water in volumetric flask. The reagent should be store in a glass-stoppered
bottle.
b) Ammonium molybdate solution, (NH4)6Mo7O24.4H2O:
20 g (NH4)6Mo7O24.4H2O was dissolved in 500 mL distilled water. The
reagent should be store in a glass-stoppered bottle.
c) Ascorbic acid, C6H8O6, 0.1 M:
1.76 g ascorbic acid was dissolved in 100 mL distilled water. The solution is
stable for about 1 week at 4 oC.
ÅÔ¢ÊÔ·¸Ô ìÁËÒÇÔ·ÂÒÅÑÂàªÕ§ãËÁèCopyright by Chiang Mai UniversityA l l r i g h t s r e s e r v e d
ÅÔ¢ÊÔ·¸Ô ìÁËÒÇÔ·ÂÒÅÑÂàªÕ§ãËÁèCopyright by Chiang Mai UniversityA l l r i g h t s r e s e r v e d
38
d) Combined reagent:
50 mL 5N H2SO4, 5 mL potassium antimonyl tartrate solution, 15 mL
ammonium molybdate solution, and 30 mL ascorbic acid solution were mixed
together (Mix after addition of each reagent). Let all reagents reach room temperature
before they are mixed and mix in the order given. If turbidity forms in the combined
reagent, shake and let stand for a few minutes until turbidity disappears before
proceeding. The reagent is stable for 4 hours.
e) Standard Potassium hydrogen phosphate solution, KH2PO4:
219.5 mg anhydrous KH2PO4 were dissolved and diluted in distilled water to
1000 mL; 1.00 mL = 50.0 µg PO43- -P.
f) Sulfuric acid, H2SO4, 5N:
70 mL conc H2SO4 was diluted to 500 mL with distilled water.
The procedure was explained in Appendix A-4.
B. DIN 38405-D11 method
a) Standard Potassium hydrogen phosphate solution, Phosphate stock solution,
concentration of P is equal to 50 mg/L
0.2197 g dehydrated Potassium hydrogen phosphate, (dry at 105 oC) was
diluted into 1000 mL volumetric flask with 800 mL distilled water. 10 mL sulfuric
acid (III) was added in to solution and adjusted the volume with distilled water to the
mark.
ÅÔ¢ÊÔ·¸Ô ìÁËÒÇÔ·ÂÒÅÑÂàªÕ§ãËÁèCopyright by Chiang Mai UniversityA l l r i g h t s r e s e r v e d
ÅÔ¢ÊÔ·¸Ô ìÁËÒÇÔ·ÂÒÅÑÂàªÕ§ãËÁèCopyright by Chiang Mai UniversityA l l r i g h t s r e s e r v e d
39
b) Sulfuric acid (I), H2SO4 (d= 1.84 g/mL)
c) Sulfuric acid (II), H2SO4 (d= 1.51 g/mL)
250 mL sulfuric acid (I) was added carefully into 250 mL distilled water
(under cooling condition) and stir occasionally.
d) Ascorbic acid solution 10%:
10 g of Ascorbic acid, C6H8O6 was dissolved in 100 mL distilled water. Store
in refrigerator and the solution can keep for some weeks.
e) Molybdate-reagent solution:
13 g Hexa ammonium heptamolybdate, (NH4)5Mo7O24.4H2O was disolved in
100 mL distilled water, 300 mL sulfuric acid (II) was added into the solution. 0.35 g
of Potassium antimone (III)-oxide tartrate, K(SbO)C4H4O6.½H2O was dissolved in
100 mL distilled water and this solution was combined to the acidic molybdate
solution and mixes it well.
This Molybdate-reagent solution can be keep for at least 2 months.
The procedure was explained in Appendix A-4.
C. Pillow test
Analysis of water sample was used Phos Ver 3 reagent, the Ascorbic acid
method. Range of measure is 0.02 to 2.50 mg/L of PO43-. The procedure was
explained in Appendix A-9.
ÅÔ¢ÊÔ·¸Ô ìÁËÒÇÔ·ÂÒÅÑÂàªÕ§ãËÁèCopyright by Chiang Mai UniversityA l l r i g h t s r e s e r v e d
ÅÔ¢ÊÔ·¸Ô ìÁËÒÇÔ·ÂÒÅÑÂàªÕ§ãËÁèCopyright by Chiang Mai UniversityA l l r i g h t s r e s e r v e d
40
III. Ammonium-N parameter
A. APHA method 4500-NH3 F Phenate method
a) Phenol solution, C6H6O:
11.1 mL liquefied phenol (≥ 89 %) with 95% v/v were mixed with ethyl
alcohol to a final volume of 100 mL. This solution should be prepared weekly.
b) Disodium pentacyano nitrosyl ferrate (Sodium nitroprusside), 0.5% w/v,
Na2Fe(CN)5NO.2H2O:
0.5 g of sodium nitroprusside was dissoved in 100 mL deionized water. The
solution was store in amber bottle for up to 1 month.
c) Alkaline citrate:
200 g tri sodium citrate dihydrate, C6H5O7Na3.2H2O, and 10 g sodium
hydroxide, NaOH, were disolved in deionized water to 1000 mL.
d) Sodium hypochlorite, commercial solution, about 6% w/w.
This solution slowly decomposes once the seal on the bottle cap was broken.
Replace about every 2 months.
e) Oxidizing solution:
100 mL alkaline citrate solution was mixed with 25 mL sodium hypochlorite.
Prepare fresh daily.
ÅÔ¢ÊÔ·¸Ô ìÁËÒÇÔ·ÂÒÅÑÂàªÕ§ãËÁèCopyright by Chiang Mai UniversityA l l r i g h t s r e s e r v e d
ÅÔ¢ÊÔ·¸Ô ìÁËÒÇÔ·ÂÒÅÑÂàªÕ§ãËÁèCopyright by Chiang Mai UniversityA l l r i g h t s r e s e r v e d
41
f) Stock ammonium chloride solution:
3.819 g anhydrous NH4Cl (dried at 100 oC) was dissolved and diluted in
distilled water to 1000 mL; 1.00 mL = 1.00 mg N = 1.22 mg NH3.
The procedure was explained in Appendix A-5.
B. DIN 38406-E5 method
a) Salycilate citrate solution
130 g sodium salicylate, C7H5O3Na, and 130 g tri sodium citrate dihydrate,
C6H5O7Na3.2H2O were disolved in 800 mL distilled water and then was added 0.970
g disodium pentacyano nitrosylferrate, (Sodium nitroprusside), Na2Fe(CN)5NO.2H2O,
into the solution. The volume was adjusted with distilled water to 1000 mL in
volumetric flask. The solution can be kept in the dark condition at least for 2 weeks.
b) Chloride reagent
3.2 g sodium hydroxide, NaOH was disolved in 50 mL distilled water. The
solution was leaved to cool down at room temperature, and 0.2 g sodium
dichlorisocyanurate, C3N3Cl2O3Na.2H2O was added. The solution was adjusted to 100
mL with distilled water in volumetric flask.
c) Standard ammonium sulfate solution, (NH4)2SO4, concentration of ammonium is
equal to 0.1 g/L.
ÅÔ¢ÊÔ·¸Ô ìÁËÒÇÔ·ÂÒÅÑÂàªÕ§ãËÁèCopyright by Chiang Mai UniversityA l l r i g h t s r e s e r v e d
ÅÔ¢ÊÔ·¸Ô ìÁËÒÇÔ·ÂÒÅÑÂàªÕ§ãËÁèCopyright by Chiang Mai UniversityA l l r i g h t s r e s e r v e d
42
0.4717 g ammonium sulfate (dry at 105 oC) was dissolved with distilled water
and adjusts the volume to 1000 mL in volumetric flask. The solution can be kept in
glass container with cover for one week.
The procedure was explained in Appendix A-5.
C. Pillow test
Analysis of water sample was used Nessler method. The reagent of this
method was used Nessler reagent, mineral stabilizer and polyvinyl alcohol as
dispersing agent. Range of measure is 0.02 to 2.50 mg/L NH3-N.
Nessler reagent is toxic and corrosive. Pipette carefully, using a pipette filler.
Nessler reagent contains mercuric chloride. The procedure was explained in Appendix
A-10.
2.4.3 Spectrophotometer measurement condition
Molecular absorption spectrophotometry depends on the ability of dissolved
species to absorb radiant energy at a specific wavelength in the visible or ultraviolet
regions of the spectrum, to coverage needy leading the concentration of that species in
water sample. In order to measurement nutrient parameter in water sample both
APHA and DIN method were used specific wavelength. The summary of the
spectrophotometer condition of the methods were listed as shown in table 2.2
ÅÔ¢ÊÔ·¸Ô ìÁËÒÇÔ·ÂÒÅÑÂàªÕ§ãËÁèCopyright by Chiang Mai UniversityA l l r i g h t s r e s e r v e d
ÅÔ¢ÊÔ·¸Ô ìÁËÒÇÔ·ÂÒÅÑÂàªÕ§ãËÁèCopyright by Chiang Mai UniversityA l l r i g h t s r e s e r v e d
43
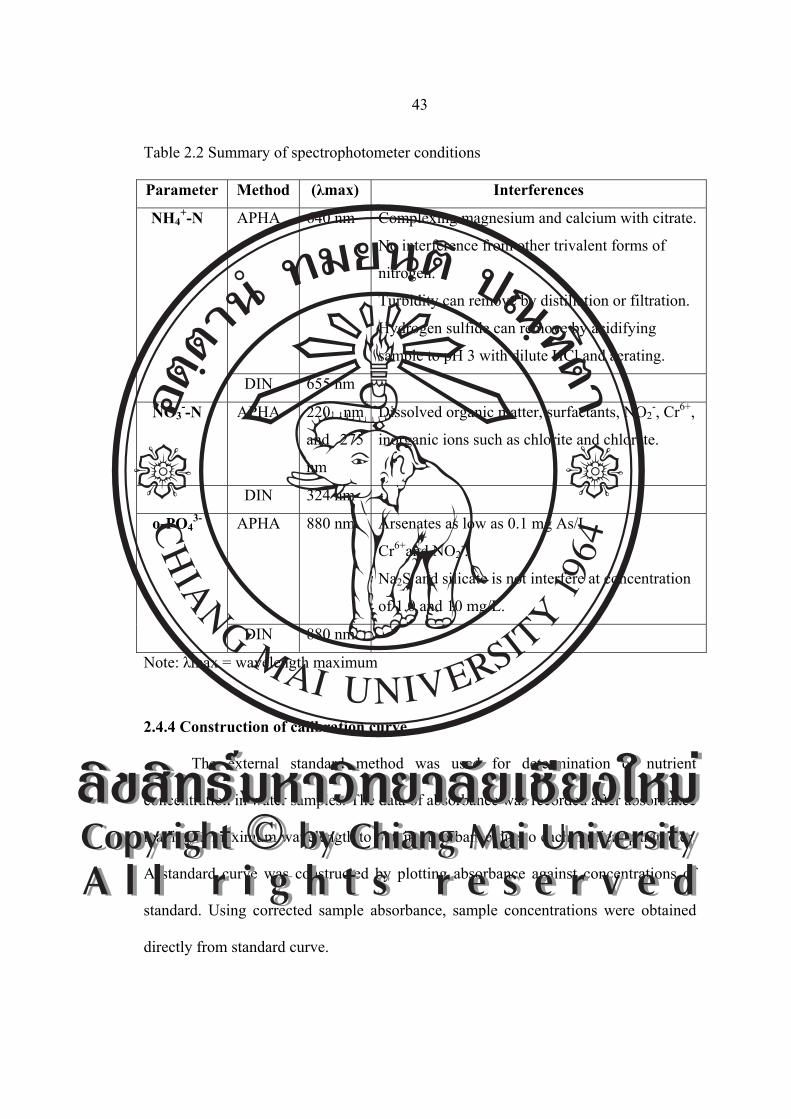
Table 2.2 Summary of spectrophotometer conditions
Parameter Method (λmax) Interferences
APHA 640 nm Complexing magnesium and calcium with citrate.
No interference from other trivalent forms of
nitrogen.
Turbidity can remove by distillation or filtration.
Hydrogen sulfide can remove by acidifying
sample to pH 3 with dilute HCl and aerating.
NH4+-N
DIN 655 nm -
NO3--N APHA 220 nm
and 275
nm
Dissolved organic matter, surfactants, NO2-, Cr6+,
inorganic ions such as chlorite and chlorate.
DIN 324 nm -
APHA 880 nm Arsenates as low as 0.1 mg As/L.
Cr6+and NO2-.
Na2S and silicate is not interfere at concentration
of 1.0 and 10 mg/L.
o-PO43-
DIN 880 nm -
Note: λmax = wavelength maximum
2.4.4 Construction of calibration curve
The external standard method was used for determination of nutrient
concentration in water samples. The data of absorbance was recorded after absorbance
reading at maximum wavelength to obtain absorbance due to each nutrient parameter.
A standard curve was constructed by plotting absorbance against concentrations of
standard. Using corrected sample absorbance, sample concentrations were obtained
directly from standard curve.
ÅÔ¢ÊÔ·¸Ô ìÁËÒÇÔ·ÂÒÅÑÂàªÕ§ãËÁèCopyright by Chiang Mai UniversityA l l r i g h t s r e s e r v e d
ÅÔ¢ÊÔ·¸Ô ìÁËÒÇÔ·ÂÒÅÑÂàªÕ§ãËÁèCopyright by Chiang Mai UniversityA l l r i g h t s r e s e r v e d
44
In this work calibration curves were constructed every time when a sample
analysis was conducted to ensure that any experimental errors were eliminated or
minimized as much as possible both APHA method and DIN method. The general
procedure was saw Appendix A-11
2.4.5 Pillow test
Pillow test is one of quick test. In this work, PermaChem® Pillows was used
and analyzed by DR/2400 portable Spectrophotometer HACH®. This method is the
one of commercial testing of water analysis from USA.
2.4.6 APHA method
In this work was used Standard Method for analysis in laboratory. Standard
Method for the Examination of Water and Wastewater which was published by the
American Public Health Association (APHA), the American Water Works
Association (AWWA), and the Water Environment Federation (WEF), is the standard
reference work for water analysis.
2.4.7 DIN method
DIN method was established under the Deutsche Einheitsverfahren zur
Wasser-, Abwasser- und Schlammuntersuchung. Abschnitt: D9, D11, E3, E5, H6.
Verlag Chemie. This method is the standard reference work water analysis from
Germany.
ÅÔ¢ÊÔ·¸Ô ìÁËÒÇÔ·ÂÒÅÑÂàªÕ§ãËÁèCopyright by Chiang Mai UniversityA l l r i g h t s r e s e r v e d
ÅÔ¢ÊÔ·¸Ô ìÁËÒÇÔ·ÂÒÅÑÂàªÕ§ãËÁèCopyright by Chiang Mai UniversityA l l r i g h t s r e s e r v e d
45
2.5 Efficiency of the Methods
2.5.1 Linearity range
A linearity study verifies that the response is linearly proportional to the
analyte concentration in the concentration range of sample solutions. Linearity data
are often judged from the coefficient of determination (r2) and the y intercept of the
linear regression line (Chistian, G.D., 1994).
The single standard solutions of ammonium-N, nitrate-N and phosphate-P in
ranges of 0.05-1.50 mg/L, 0.10-0.20 mg/L and 0.001-0.800 mg/L, respectively were
prepared both APHA and DIN methods by spectrophotometer and the calibration
curve of each standard was constructed by plotting the absorbance against the
concentration of each standard solution.
2.5.2 Detection limit (DL) for spectrophotometer
The limit of detection is the amount of analyte which can be reliably detected
under the stated experimental conditions. The limit of detection is analyte
concentration giving a signal equal to the blank signal, plus three standard deviations
of the blank.
The detection limit (DL) was checked by 2 methods. The first method was
done by read of the absorbance of 0.02 mg/L standard solution of NH4+; 0.02 mg/L
standard solution of PO43-, and 0.1 mg/L NO3
- by spectrophotometry. The second
method was done by using linear equation of standards solution of NH4+ (0.01 and
0.05 mg/L); NO3- (0.05 to 0.5 mg/L) and PO4
3- (0.01 to 0.035 mg/L) (Miller and
Miller, 1998).
ÅÔ¢ÊÔ·¸Ô ìÁËÒÇÔ·ÂÒÅÑÂàªÕ§ãËÁèCopyright by Chiang Mai UniversityA l l r i g h t s r e s e r v e d
ÅÔ¢ÊÔ·¸Ô ìÁËÒÇÔ·ÂÒÅÑÂàªÕ§ãËÁèCopyright by Chiang Mai UniversityA l l r i g h t s r e s e r v e d
46
Low and high concentrations of ammonium-N, nitrate-N and phosphate-P
standard solution were prepared and measured the absorbance using the
spectrophotometer to enable absorbance of the lowest concentration and high
concentration.
The detection limit was obtained by the use of linearity curve. According to
the IUPAC definition, DL is the amount or concentration (X) resulting in an analyte
signal (measured value) Y.
Y = YB + 3 SB …………………. (2.1)
Where, SB is the blank signal standard deviation with the related blank signal mean
value, YB.
Linear regression analysis used for validation of linearity is made under the
assumption that the y-values are normally distributed around the regression line with a
standard deviation Sy/x (see Appendix H). Provided this assumption is valid, Sy/x may
therefore be used instead of SB in the equation for calculation of DL. As estimate for
YB was also be obtained from the regression line as the Y-axis intercept value. The
values in equation 2.1 and combining with the linear equation Y = a+bX as
DL = b
aSax
y
−+ *3
……………………... (2.2)
DL =b
Sx
y*3 …………………………. (2.3)
Where b is the slope and a is the intercept of regression line with the y-axis. This
approach to be used, the factor of curvature, n, for the regression line should be
between 0.9 – 1.0 (Miller and Miller, 1988)
ÅÔ¢ÊÔ·¸Ô ìÁËÒÇÔ·ÂÒÅÑÂàªÕ§ãËÁèCopyright by Chiang Mai UniversityA l l r i g h t s r e s e r v e d
ÅÔ¢ÊÔ·¸Ô ìÁËÒÇÔ·ÂÒÅÑÂàªÕ§ãËÁèCopyright by Chiang Mai UniversityA l l r i g h t s r e s e r v e d
47
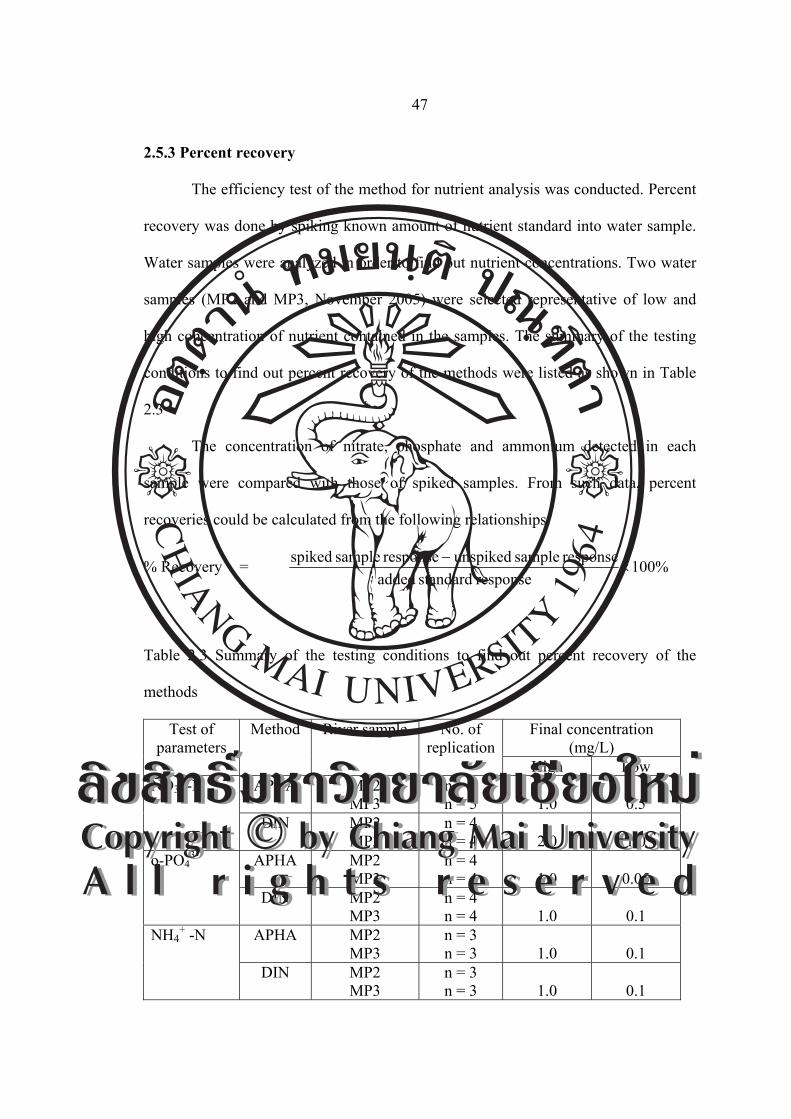
2.5.3 Percent recovery
The efficiency test of the method for nutrient analysis was conducted. Percent
recovery was done by spiking known amount of nutrient standard into water sample.
Water samples were analyzed in order to find out nutrient concentrations. Two water
samples (MP2 and MP3, November 2005) were selected representative of low and
high concentration of nutrient contained in the samples. The summary of the testing
conditions to find out percent recovery of the methods were listed as shown in Table
2.3
The concentration of nitrate, phosphate and ammonium detected in each
sample were compared with those of spiked samples. From such data, percent
recoveries could be calculated from the following relationships.
% Recovery = %100response standard added
response sample unspikedresponse sample spiked×
−
Table 2.3 Summary of the testing conditions to find out percent recovery of the
methods
Test of parameters
Method River sample No. of replication
Final concentration (mg/L)
High Low NO3
- -N APHA MP2 MP3
n = 5 n = 5
1.0
0.5
DIN MP2 MP3
n = 4 n = 4
2.0
1.0
o-PO43- APHA MP2
MP3 n = 4 n = 4
1.0
0.05
DIN MP2 MP3
n = 4 n = 4
1.0
0.1
NH4+ -N APHA MP2
MP3 n = 3 n = 3
1.0
0.1
DIN MP2 MP3
n = 3 n = 3
1.0
0.1
ÅÔ¢ÊÔ·¸Ô ìÁËÒÇÔ·ÂÒÅÑÂàªÕ§ãËÁèCopyright by Chiang Mai UniversityA l l r i g h t s r e s e r v e d
ÅÔ¢ÊÔ·¸Ô ìÁËÒÇÔ·ÂÒÅÑÂàªÕ§ãËÁèCopyright by Chiang Mai UniversityA l l r i g h t s r e s e r v e d
48
2.5.4 Quality check with Certified Reference Material (CRM) and artificial rain
sample
A CRM is a reference material with one or more component values certified
by technically valid procedure, accompanied by or traceable to a certified or other
documentation that is issued by a certifying body (ISO Guide, 1981). CRMs are
products of high added value and play a number of important roles in helping produce
reliable results: calibration and verification of measurement process, quality control,
verification of standardized methods and development and validation of new methods
(Burden, F.R. 2002). By using CRMs to calibrate and validate measurement systems,
the measurement will be comparable and traceable.
Certification is based on the analysis of sub samples from a homogeneous and
stable bulk sample containing the analytes (nutrients) in the required sample matrix
(Burden, F.R. 2002). Certified Reference Material (CRM) was used detected and
determinate errors in analytical methods. (Skoog, D.A., et al., 1999). Standard
reference materials can sometimes be prepared by synthesis. The overall composition
of a synthetic standard material must approximate closely the composition of the
samples to be analyzed (Skoog, D.A., et al., 1999).
CRMs are matrix-matched materials with assigned target values and assigned
ranges for each variable, reliable determined from data obtained by repeated analysis
(Bartram, J., and Balance, R., 1996).
The artificial rain provided by the Pollution Control Department (PCD) of
Thailand. The samples were part of the inter-laboratory comparison project (round
robin analysis of uniformly prepared artificial rain samples). Artificial rain samples
(serial number 088) number 031 and 032 were high and low concentrations,
ÅÔ¢ÊÔ·¸Ô ìÁËÒÇÔ·ÂÒÅÑÂàªÕ§ãËÁèCopyright by Chiang Mai UniversityA l l r i g h t s r e s e r v e d
ÅÔ¢ÊÔ·¸Ô ìÁËÒÇÔ·ÂÒÅÑÂàªÕ§ãËÁèCopyright by Chiang Mai UniversityA l l r i g h t s r e s e r v e d
49
respectively. Both samples were 100 times diluted by deionized water in three
replications. Each replication was three (3) times analyzed by the selected methods.
The Certified Reference Material was provided by Analytical Products Group,
Inc. (APG), Ohio-USA, Standard Nutrients, Lot Number 35947-35948, Order
Number 4023. The sample was 100 times diluted by deionized water in five
replications.
2.6 Comparison of the Methods for the Nutrient Analysis
2.6.1 Pillow test
a) Nitrate-N parameter, Method 8039 by HACH® DR/2400. In the Cadmium
Reduction method, Nitra Ver 5 Nitrate reagent was used
b) o-Phosphate parameter, Method 8048 by HACH® DR/2400. In the Ascorbic acid
method, Phos Ver 3 reagent was used.
c) Ammonium-N parameter, Method 8038, by HACH® DR/2400. In the Nessler
method, Nessler reagent, mineral stabilizer and polyvinyl alcohol were used.
2.6.2 APHA method
a) Ultraviolet spectrophotometric screening determination of Nitrate-N (NO3- -N)
The direct spectrophotometric measurement of nitrate at 220 nm is one of a
very few determinations in water analysis that relies directly on the absorption of
radiant energy by the constituent itself, with no color-forming reaction necessary.
This technique was used only for screening samples that have low organic matter
contents. Measurements of UV absorption at 220 nm enable rapid determination of
ÅÔ¢ÊÔ·¸Ô ìÁËÒÇÔ·ÂÒÅÑÂàªÕ§ãËÁèCopyright by Chiang Mai UniversityA l l r i g h t s r e s e r v e d
ÅÔ¢ÊÔ·¸Ô ìÁËÒÇÔ·ÂÒÅÑÂàªÕ§ãËÁèCopyright by Chiang Mai UniversityA l l r i g h t s r e s e r v e d
50
NO3-. Because dissolved organic matter also may absorb at 220 nm and NO3
- does not
absorb at 275 nm, a second measurement made at 275 nm may be used to correct the
NO3- value. This method was usually recommended only for quickly screening large
numbers of potable-water samples (Minear, R.A., 1984).
b) Colorimetric determination of ortho-phosphates (o-PO43-)
Molybdenum blue method is a method in acidic medium, ortho-phosphates
bond with ammonium molybdate to form molybdenic phosphoric acid. With the aid
of a reducing agent this forms phosphorus molybdenum blue compound.
Spectrophotometer measurement of dye intensity can be performed at 880 nm.
c) Colorimetric determination of Ammonium (NH4+-N)
The method can detect both NH4+ and NH3 forms of N. The method we will
use is called "the indophenols blue method" or "phenate method". It is based on the
reaction of NH3 in alkaline solution with phenate to produce a blue color (indophenols
blue) in the presence of a strong oxidizing agent, such as hypochlorite. Although the
reaction will proceed at room temperature, it can be sped up by heating the solution
(35 oC) and/or using a metal-containing catalyst such as sodium nitro ferricyanide
(nitroprusside) can be performed at 640 nm. Many modifications of this method are
available.
ÅÔ¢ÊÔ·¸Ô ìÁËÒÇÔ·ÂÒÅÑÂàªÕ§ãËÁèCopyright by Chiang Mai UniversityA l l r i g h t s r e s e r v e d
ÅÔ¢ÊÔ·¸Ô ìÁËÒÇÔ·ÂÒÅÑÂàªÕ§ãËÁèCopyright by Chiang Mai UniversityA l l r i g h t s r e s e r v e d
51
2.6.3 DIN method
a) Colorimetric determination of Nitrate nitrogen (NO3- -N)
In an acid solution, nitrate ions react to this reagent with approximately 10
minutes to produce yellowish-colored 4-nitro-2,6-dimethylphenol, and measure
absorbance yellowish colored on spectrophotometer with wavelength maximum 324
nm.
b) Colorimetric determination of ortho-Phosphates (o-PO43-)
The principle of this method is similar with APHA. Molybdenum blue method
is a method in acidic medium, ortho-phosphates bond with ammonium molybdate to
form molybdenic phosphoric acid. With the aid of a reducing agent this forms
phosphorus molybdenum blue compound. Spectrophotometer measurement of color
intensity can be performed at 880 nm.
c) Colorimetric determination of Ammonium nitrogen (NH4+-N)
The salicylate-dichloroisocyanurate procedure for colorimetric determination
of ammonia is more sensitive than the phenol-hypochlorite methods. This method is a
method based on the reaction of NH3 in alkaline solution with the sodium
nitroprusside was catalyzed. Spectrophotometer measurement of color intensity can
be performed at 655 nm.
2.6.4 Ion Chromatography (IC)
Ion chromatography is a separation technique, which was developed for
solving several specific analytical problems in aqueous systems. The separations of
ÅÔ¢ÊÔ·¸Ô ìÁËÒÇÔ·ÂÒÅÑÂàªÕ§ãËÁèCopyright by Chiang Mai UniversityA l l r i g h t s r e s e r v e d
ÅÔ¢ÊÔ·¸Ô ìÁËÒÇÔ·ÂÒÅÑÂàªÕ§ãËÁèCopyright by Chiang Mai UniversityA l l r i g h t s r e s e r v e d
52
ion chromatographic technique was based on an exchange of analyze ions with
counter ions the fixed ions of the ion exchanger. The various ionic species can be
separated on the basis of the different affinities to functional group on stationary
phase (Chistian, G.D., 1994). In this work, ion chromatograph was used for
confirmation of water sample analysis including anions (NO3- and PO4
3-) and cation
(NH4+).
Analysis condition of IC (Chirasathaworn, N. 2005)
Water samples were analyzed using ion chromatograph (DX300). IonPac
AS4A (4x250mm) and IonPac CS12 (4x250 mm) column were used for anion and
cation analysis, respectively. Analytes were anion (NO3- and PO4
3-) and cation
(NH4+). The analysis conditions for ion chromatography (IC) are concluded in Table
2.4.
ÅÔ¢ÊÔ·¸Ô ìÁËÒÇÔ·ÂÒÅÑÂàªÕ§ãËÁèCopyright by Chiang Mai UniversityA l l r i g h t s r e s e r v e d
ÅÔ¢ÊÔ·¸Ô ìÁËÒÇÔ·ÂÒÅÑÂàªÕ§ãËÁèCopyright by Chiang Mai UniversityA l l r i g h t s r e s e r v e d
53
Table 2.4 IC conditions for anion and cation analysis
Analysis item Anion Cation
Eluent (Mobile phase) 1.8 mM Na2CO3/1.7 mM
NaHCO3
20 mM methansulfonic
acid
Flow rate 1.5 mL/min 1.0 mL/min
Injection loop 25 µL 25 µL
Injection amount 100 µL 100 µL
Guard column Anion guard column, IonPac®
AG4A, 4 mm. (4x50 mm)
Cation separation column,
IonPac® CS12
(2x250 mm)
Suppressor Anion self regenerating
suppressor-I
Cation self regenerating
suppressor-I
Detector Conductivity Conductivity
2.7 Application of the Method with Analysis of Water Samples
2.7.1 Water sample storage
Water sample procedures, types of containers and container cleaning
procedures were followed the Standard Methods (APHA and AWWA, 1998). The
specification and condition of water sample storage were listed as shown in Table 2.5.
ÅÔ¢ÊÔ·¸Ô ìÁËÒÇÔ·ÂÒÅÑÂàªÕ§ãËÁèCopyright by Chiang Mai UniversityA l l r i g h t s r e s e r v e d
ÅÔ¢ÊÔ·¸Ô ìÁËÒÇÔ·ÂÒÅÑÂàªÕ§ãËÁèCopyright by Chiang Mai UniversityA l l r i g h t s r e s e r v e d
54
Table 2.5 The maximum storage recommended, type of containers, sampling size, and
preservation procedures for the sample condition storage.
Parameters Maximum storage recommended/regulatory(*)
Type of containers
Minimum sampling size
Preservation procedures
BOD5 8 h/8 h G, BOD bottle
300 mL Titration may be delayed after acidification
Nitrate-N 48 h/48 h (28 d for chlorinated samples)
P, G 100 mL Analyze as soon as possible or refrigerate
Ammonia-N 7 d/28 d P, G 500 mL Analyze as soon as possible or add H2SO4 to pH < 2, refrigerate
Phosphate-P 48 h/N.S G(A) 100 mL For dissolved phosphate filter immediately; refrigerate
Note: P = plastic (polyethylene or equivalent) G = glass G (A) = rinsed with 1+1 HNO3 N.S = not stated in cited reference (*) = EPA, Rules and Regulation Federal Register 49; No. 209, October 26, 1884
2.7.2 Analysis of the water samples
The following 8 parameters were measured:
I. Physical parameters:
a) Water temperature: the water temperature was measured at about 10 cm depth of
the water using thermometer.
ÅÔ¢ÊÔ·¸Ô ìÁËÒÇÔ·ÂÒÅÑÂàªÕ§ãËÁèCopyright by Chiang Mai UniversityA l l r i g h t s r e s e r v e d
ÅÔ¢ÊÔ·¸Ô ìÁËÒÇÔ·ÂÒÅÑÂàªÕ§ãËÁèCopyright by Chiang Mai UniversityA l l r i g h t s r e s e r v e d
55
b) Conductivity: Conductivity is the ability of water to conduct an electric current
and depends on the concentration of ions in solution. Conductivity of water was
measured at a depth of 10 cm using Multi-parameter analyzer consort C533 version
2.2. Data was recorded in milliSiemens/meter or µSiemens/cm. The measurement
should be made in situ, or in the field immediately after water sample has been
obtained, because conductivity changes with storage time.
c) pH: pH was measured using Multi-parameter analyzer consort C533 version 2.2.
The meter was calibrated with buffers before the field trip.
II. Chemical parameters:
a) Dissolved oxygen (DO): DO was measured by Azide modification method. The
data was recorded in mg/L or ppm. DO was converted to percentage of saturated
oxygen based on a table of relationship between temperature and saturated oxygen
(mg/L) at 760 mm Hg.
b) Biochemical oxygen demand (BOD5): An airtight BOD bottle was filled with
water sample and then incubated in a dark room at 20oC for 5 days. BOD5 was
evaluated by the difference between the initial and final DO concentrations. BOD5
was then calculated using the formula:
BOD5 = DOo – DO5 ………………………………. (2.4)
ÅÔ¢ÊÔ·¸Ô ìÁËÒÇÔ·ÂÒÅÑÂàªÕ§ãËÁèCopyright by Chiang Mai UniversityA l l r i g h t s r e s e r v e d
ÅÔ¢ÊÔ·¸Ô ìÁËÒÇÔ·ÂÒÅÑÂàªÕ§ãËÁèCopyright by Chiang Mai UniversityA l l r i g h t s r e s e r v e d
56
c) Nitrate-nitrogen: Nitrate in water sample was measured by three techniques, the
Cadmium Reduction method using Nitra Ver 5 Nitrate reagent (pillow test),
Ultraviolet Spectrophotometric Screening Method (APHA and AWWA, 1998) and
colorimetric method, Dimethyl phenol method (DIN,1996).
d) Phosphate phosphorus: Phosphate in water sample was measured by three
techniques, the Ascorbic Acid Method using Phos Ver 3 reagent (pillow test) by
colorimetric method, Ascorbic acid method (APHA and AWWA, 1998), and
Ascorbic acid method by colorimetric method (DIN, 1996).
e) Ammonia-nitrogen: Ammonia in water sample was measured by three techniques
of analysis, the Nessler technique (pillow test) by colorimetric method, Phenate
method (APHA and AWWA, 1998) and Salicylate-citrate method by colorimetric
method (DIN, 1996).
2.7.3 Water quality index and chemical index
In this work water samples were analyzed based on chemical investigations.
The data with the aid of a spectrophotometer and calibration absorbance curves
nitrate-N, phosphate-P, and ammonium-N. In addition to these parameters was
established the pH-value, electrical conductivity, temperature, saturated oxygen and
the consumption of oxygen by biological organisms over a five-day period (BOD5, in
completed darkness). Finally the water quality was calculated in accordance with the
guidelines of “BACH's method to determine the quality of water” (Jurgen, K. et al.,
2002).
ÅÔ¢ÊÔ·¸Ô ìÁËÒÇÔ·ÂÒÅÑÂàªÕ§ãËÁèCopyright by Chiang Mai UniversityA l l r i g h t s r e s e r v e d
ÅÔ¢ÊÔ·¸Ô ìÁËÒÇÔ·ÂÒÅÑÂàªÕ§ãËÁèCopyright by Chiang Mai UniversityA l l r i g h t s r e s e r v e d
57
Calculation of chemical index
A. Calculation of chemical index using equation
The values got from measurements in the same unit will be converted to q
values using table of the index-values (potential value) and exponents for the various
parameters (according to BACH)* (see Appendix C) of each parameter, which has its
own pattern and character. The q values and their weights will be put into equation
(1.3). Finally, chemical index is calculated.
The equation (1.3) is CI = qqq nw
n
wwxxx ........21
21
B. Calculation of chemical index using conservation tables
The measured value of each parameter can be converted to figure by using
transformation table (see Appendix E) conversion tables of measured values to sub-
index (q). Then the chemical index can be calculated by multiplying all 8 figures,
which were transformed from 8 parameters.
2.7.4 Classify water quality index of the Ping River
Raw data for each individual parameter, namely saturated oxygen, BOD5,
water temperature, ammonium nitrogen (NH4+-N), nitrate nitrogen (NO3
- -N),
phosphate phosphorus (PO433----P),, pH and conductivity were compared to conversion
tables of measured values to sub-index (q) in order to generate a water quality rating.
The final, arithmetic, weighted index is the result of squaring the sum of the products
of water quality ratings (qi) and weighting each individual parameter (wi) according to
the Table 1.1. The diagram of water quality index construction as shown in Appendix
D
ÅÔ¢ÊÔ·¸Ô ìÁËÒÇÔ·ÂÒÅÑÂàªÕ§ãËÁèCopyright by Chiang Mai UniversityA l l r i g h t s r e s e r v e d
ÅÔ¢ÊÔ·¸Ô ìÁËÒÇÔ·ÂÒÅÑÂàªÕ§ãËÁèCopyright by Chiang Mai UniversityA l l r i g h t s r e s e r v e d
58
The chemical classification of the Ping River was divided to seven classes as
shown in Tables 1.2. The general classification bases on water quality index, using
different weighting factors for 8 parameters. Classification of water bodies in this case
of the Ping River, according to the water quality based on parameter widely measured
in different sampling sites for each period of time (June to December 2005) and
accepted as good indicators of water quality.
In this work classification of water quality of the Ping River were classified
based on the chemical index. The classification and standard of surface water quality
is used in Thailand as a standard procedure for the classification of the quality of
rivers, canals, streams. This method is based mainly on pH, DO, BOD5, nitrate
nitrogen (NO3--N), ammonium nitrogen (NH4
+-N), etc.
2.8 Data Analysis
Statistic Package for Social Science for Windows (SPSSWIN) version 10 was
used for data analysis in this research. SPSSWIN consist of various statistical
procedures.
Analysis of Variance (ANOVA) one way was used to compare the mean of
results in each sampling site at each sampling period and differences between method
of analysis (Pillow test, APHA and DIN method).
The results of physico-chemical parameters were analyzed by Multivariate
Statistical Package (MVSP); Principal Component Analysis (PCA) had been used to
study relative proportion of physico-chemical parameters and each method for
nutrients parameter. Cluster analysis for physical and chemical parameters and
ÅÔ¢ÊÔ·¸Ô ìÁËÒÇÔ·ÂÒÅÑÂàªÕ§ãËÁèCopyright by Chiang Mai UniversityA l l r i g h t s r e s e r v e d
ÅÔ¢ÊÔ·¸Ô ìÁËÒÇÔ·ÂÒÅÑÂàªÕ§ãËÁèCopyright by Chiang Mai UniversityA l l r i g h t s r e s e r v e d
59
arrange to class in order to study the pattern of similarity and dissimilarity. The matrix
of months (sampling periods) and physico-chemical parameters were input (per site).
The analysis was done by selecting all parameters as variables and analysis for
cases sampling periods (months). In this work was used nutrients parameters data by
pillow test.
ÅÔ¢ÊÔ·¸Ô ìÁËÒÇÔ·ÂÒÅÑÂàªÕ§ãËÁèCopyright by Chiang Mai UniversityA l l r i g h t s r e s e r v e d
ÅÔ¢ÊÔ·¸Ô ìÁËÒÇÔ·ÂÒÅÑÂàªÕ§ãËÁèCopyright by Chiang Mai UniversityA l l r i g h t s r e s e r v e d