Embed Size (px)
Citation preview
Chapter 2
Five-Power-Law Creep
2.1 MACROSCOPIC RELATIONSHIPS
2.1.1 Activation Energy and Stress Exponents
In pure metals and Class M alloys (similar creep behavior similar to pure metals),
there is an established, largely phenomenological, relationship between the steady-
state strain-rate, _eess, (or creep rate) and stress, sss, for steady-state 5-power-law (PL)
creep:
_eess ¼ A0 exp �Qc=kT½ � sss=Eð Þn
ð3Þ
where A0 is a constant, k is Boltzmann’s constant, and E is Young’s modulus
(although, as will be discussed subsequently, the shear modulus, G, can also be used).
This is consistent with Norton’s Law [34]. The activation energy for creep, Qc, has
been found to often be about that of lattice self-diffusion, Qsd. The exponent n is
constant and is about 5 over a relatively wide range of temperatures and strain-rates
(hence ‘‘five-power-law’’ behavior) until the temperature decreases below roughly
0.5–0.6 Tm, where power-law-breakdown (PLB) occurs, and n increases and Qc
generally decreases. steady-state creep is often emphasized over primary or tertiary
creep due to the relatively large fraction of creep life within this regime.
The importance of steady-state is evidenced by the empirical Monkman–Grant
relationship [35]:
_eem00
ss tf ¼ kMG ð4Þ
where tf is the time to rupture and kMG is a constant.
A hyperbolic sine (sinh) function is often used to describe the transition from PL
to PLB.
_eess ¼ A1 exp �Qc=kT½ � sinh a1ðsss=E Þ½ �5
ð5Þ
(although some have suggested that there is a transition from 5 to 7-power-law
behavior prior to PLB [25,36], and this will be discussed more later). Equations (3)
and (5) will be discussed in detail subsequently. The discussion of 5-power-law
creep will be accompanied by a significant discussion of the lower temperature
companion, PLB.
As discussed earlier, time-dependent plasticity or creep is traditionally described
as a permanent or plastic extension of the material under fixed applied stress. This
13
is usually illustrated for pure metals or Class M alloys (again, similar quantitative
behavior to pure metals) by the constant-stress curve of Figure 1, which also
illustrates, of course, that creep plasticity can occur under constant strain-rate
conditions as well. Stage I, or primary creep, occurs when the material experiences
hardening through changes in the dislocation substructure. Eventually Stage II, or
secondary, or steady-state creep, is observed. In this region, hardening is balanced by
dynamic recovery (e.g., dislocation annihilation). The consequence of this is that the
creep-rate or plastic strain-rate is constant under constant true von Mises stress
(tension, compression or torsion). In a constant strain-rate test, the flow stress is
independent of plastic strain except for changes in texture (e.g., changes in the
average Taylor factor of a polycrystal), often evident in larger strain experiments
(such as e>1) [37–39]. It will be illustrated that a genuine mechanical steady-state is
achievable. As mentioned earlier, this stage is particularly important as large strains
can accumulate during steady-state at low, constant, stresses leading to failure.
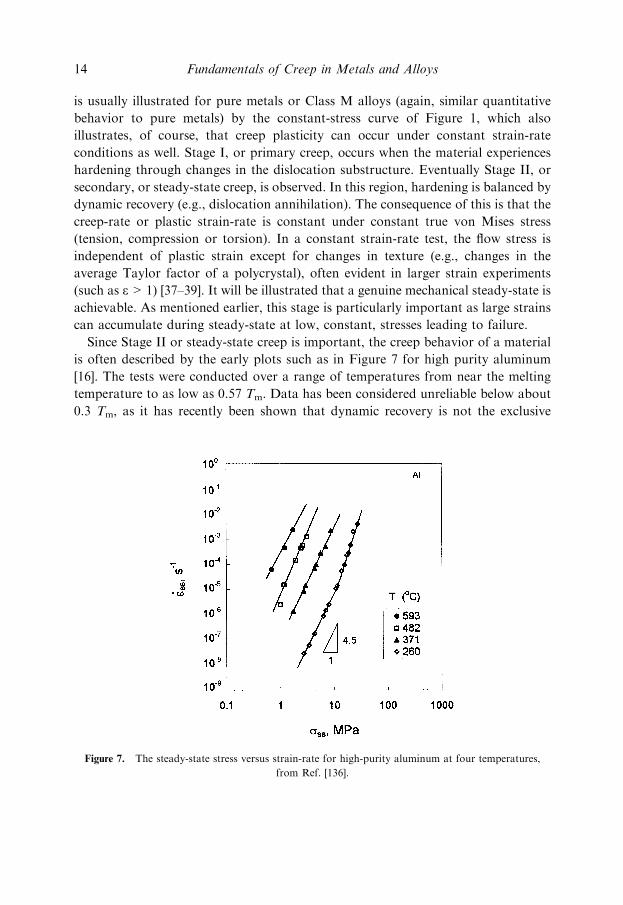
Since Stage II or steady-state creep is important, the creep behavior of a material
is often described by the early plots such as in Figure 7 for high purity aluminum
[16]. The tests were conducted over a range of temperatures from near the melting
temperature to as low as 0.57 Tm. Data has been considered unreliable below about
0.3 Tm, as it has recently been shown that dynamic recovery is not the exclusive
Figure 7. The steady-state stress versus strain-rate for high-purity aluminum at four temperatures,
from Ref. [136].
14 Fundamentals of Creep in Metals and Alloys
restoration mechanism [11], since dynamic recrystallization in 99.999% pure Al
has been confirmed. Dynamic recrystallization becomes an additional restoration
mechanism that can preclude a constant flow stress (for a constant strain-rate) or a
‘‘genuine’’ mechanical steady-state, defined here as a balance between dynamic
recovery and hardening. The plots in Figure 7 are important for several reasons.
First, the steady-state data are at fixed temperatures and it is not necessary for the
stress to be modulus-compensated to illustrate stress dependence [e.g., equation (3)].
Thus, the power-law behavior is clearly evident for each of the four temperature sets
of high-purity aluminum data without any ambiguity (from modulus compensation).
The stress exponent is about 4.5 for aluminum. Although this is not precisely five, it
is constant over a range of temperature, stress, and strain-rate, and falls within the
range of 4–7 observed in pure metals and class M alloys. This range has been
conveniently termed ‘‘five power’’. ‘‘Some have referred to Five-Power-Law Creep as
‘‘dislocation climb controlled creep’’, but this term may be misleading as climb
control appears to occur in other regimes such as Harper–Dorn, Superplasticity,
PLB, etc. We note from Figure 7 that slope increases with increasing stress and
the slope is no longer constant with changes in the stress at higher stresses (often
associated with lower temperatures). Again, this is power-law breakdown (PLB) and
will be discussed more later. The activation energy for steady-state creep, Qc,
calculations have been based on plots similar to Figure 7. The activation energy,
here, simply describes the change in (steady-state) creep-rate for a given substructure
(strength), at a fixed applied ‘‘stress’’ with changes in temperature. It will be
discussed in detail later; for at least steady-state, the microstructures of specimens
tested at different temperatures appears approximately identical, by common
microstructural measures, for a fixed modulus-compensated stress, sss/E or sss/G.
[Modulus compensation (modest correction) will be discussed more later]. For
a given substructure, s, and relevant ‘‘stress,’’ sss/E, (again, it is often assumed that a
constant sss/E or sss/G implies constant structure, s) the activation energy for creep,
Qc, can be defined by
Qc¼� k dðln _eessÞ=dð1=T Þ� �
sss=E,sð6Þ
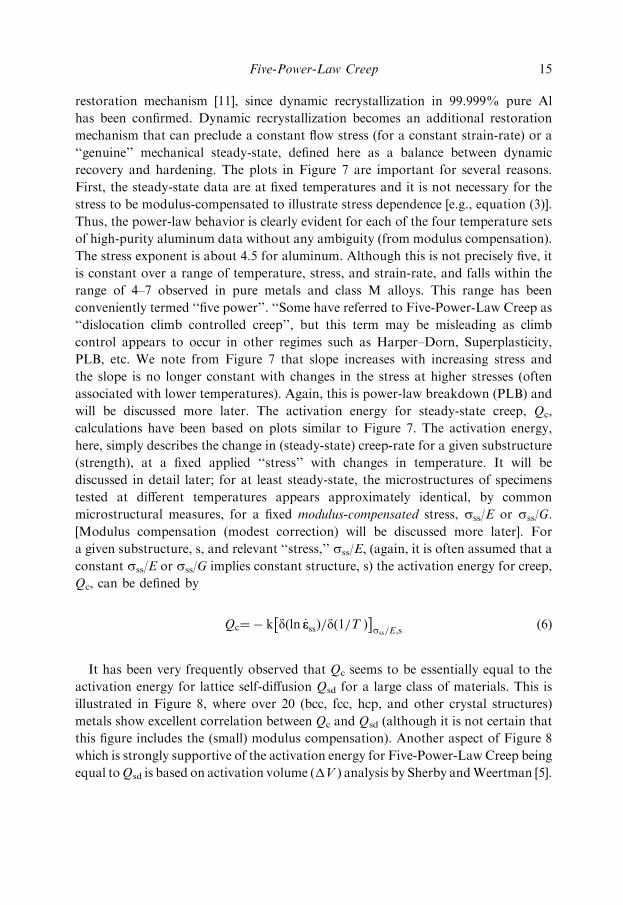
It has been very frequently observed that Qc seems to be essentially equal to the
activation energy for lattice self-diffusion Qsd for a large class of materials. This is
illustrated in Figure 8, where over 20 (bcc, fcc, hcp, and other crystal structures)
metals show excellent correlation between Qc and Qsd (although it is not certain that
this figure includes the (small) modulus compensation). Another aspect of Figure 8
which is strongly supportive of the activation energy for Five-Power-Law Creep being
equal toQsd is based on activation volume (�V ) analysis by Sherby andWeertman [5].
Five-Power-Law Creep 15
That is, the effect of (high) pressure on the creep rate ðq_eess=qPÞT ,sss=EðorGÞ ¼�Vc is the
same as the known dependence of self-diffusion on the pressure ðqDsd=qPÞT,sss=EðorGÞ.
Other more recent experiments by Campbell, Tao, and Turnbull on lead have shown
that additions of solute that affect self-diffusion also appear to identically affect the
creep-rate [40].
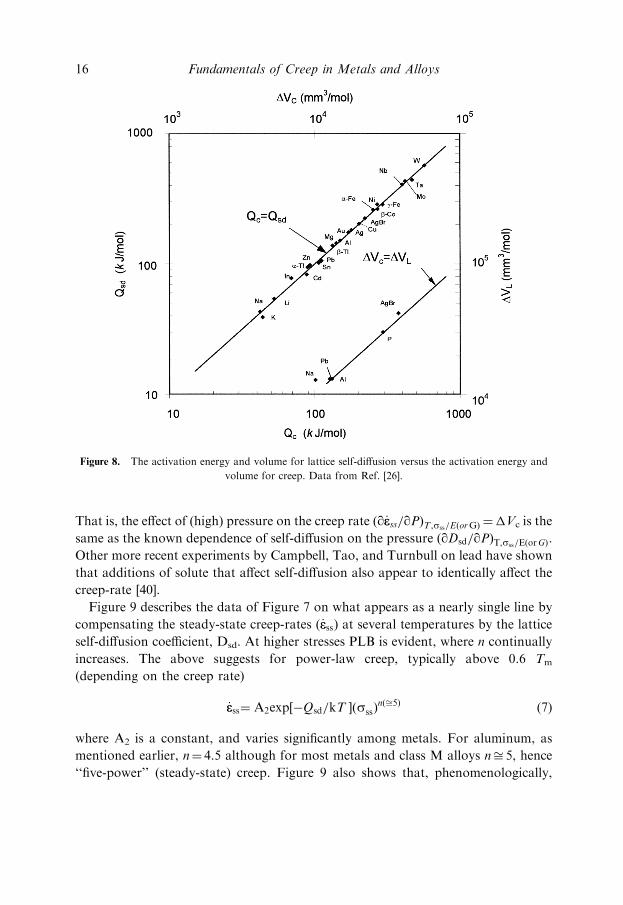
Figure 9 describes the data of Figure 7 on what appears as a nearly single line by
compensating the steady-state creep-rates (_eess) at several temperatures by the lattice
self-diffusion coefficient, Dsd. At higher stresses PLB is evident, where n continually
increases. The above suggests for power-law creep, typically above 0.6 Tm
(depending on the creep rate)
_eess¼ A2exp �Qsd=kT½ �ðsssÞnðffi5Þ
ð7Þ
where A2 is a constant, and varies significantly among metals. For aluminum, as
mentioned earlier, n¼ 4.5 although for most metals and class M alloys nffi 5, hence
‘‘five-power’’ (steady-state) creep. Figure 9 also shows that, phenomenologically,
Figure 8. The activation energy and volume for lattice self-diffusion versus the activation energy and
volume for creep. Data from Ref. [26].
16 Fundamentals of Creep in Metals and Alloys
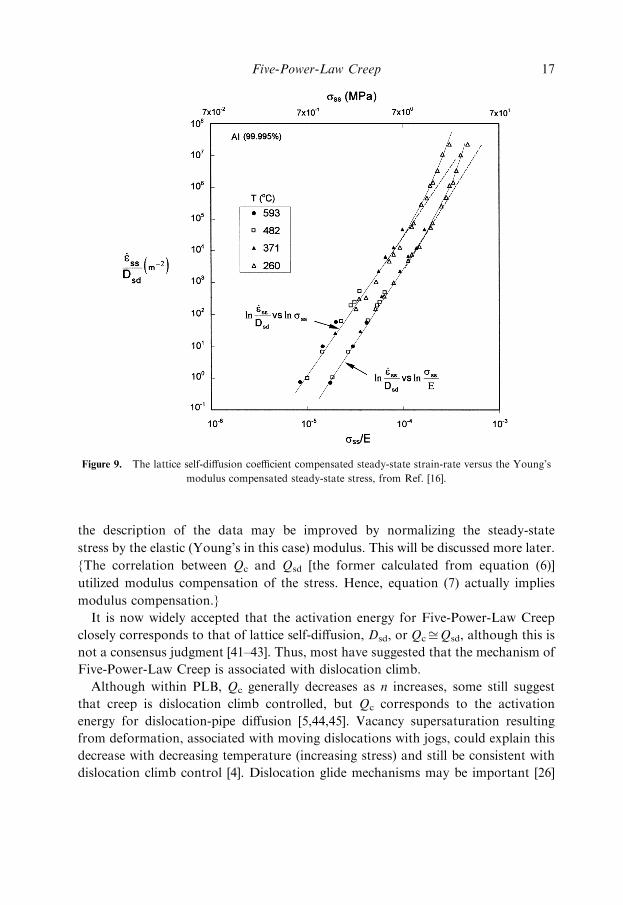
the description of the data may be improved by normalizing the steady-state
stress by the elastic (Young’s in this case) modulus. This will be discussed more later.
{The correlation between Qc and Qsd [the former calculated from equation (6)]
utilized modulus compensation of the stress. Hence, equation (7) actually implies
modulus compensation.}
It is now widely accepted that the activation energy for Five-Power-Law Creep
closely corresponds to that of lattice self-diffusion, Dsd, or QcffiQsd, although this is
not a consensus judgment [41–43]. Thus, most have suggested that the mechanism of
Five-Power-Law Creep is associated with dislocation climb.
Although within PLB, Qc generally decreases as n increases, some still suggest
that creep is dislocation climb controlled, but Qc corresponds to the activation
energy for dislocation-pipe diffusion [5,44,45]. Vacancy supersaturation resulting
from deformation, associated with moving dislocations with jogs, could explain this
decrease with decreasing temperature (increasing stress) and still be consistent with
dislocation climb control [4]. Dislocation glide mechanisms may be important [26]
Figure 9. The lattice self-diffusion coefficient compensated steady-state strain-rate versus the Young’s
modulus compensated steady-state stress, from Ref. [16].
Five-Power-Law Creep 17
and the rate-controlling mechanism for plasticity in PLB is still speculative. It will be
discussed more later, but recent studies observe very well-defined subgrain
boundaries that form from dislocation reaction (perhaps as a consequence of the
dynamic recovery process), suggesting that substantial dislocation climb is at least
occurring [11,12,46,47] in PLB. Equation (7) can be extended to additionally
phenomenologically describe PLB including changes in Qc with temperature and
stress by the hyperbolic sine function in equation (5) [44,48].
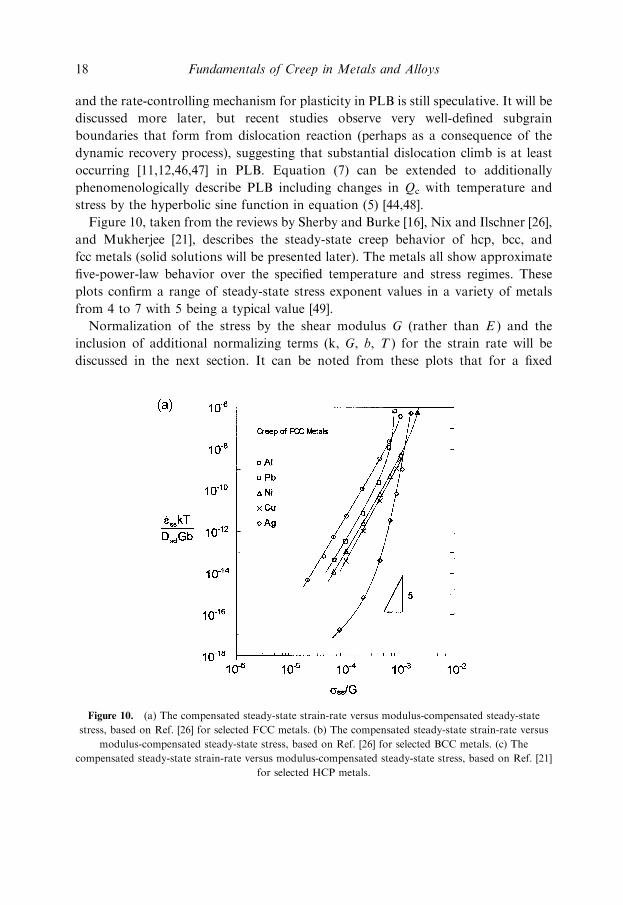
Figure 10, taken from the reviews by Sherby and Burke [16], Nix and Ilschner [26],
and Mukherjee [21], describes the steady-state creep behavior of hcp, bcc, and
fcc metals (solid solutions will be presented later). The metals all show approximate
five-power-law behavior over the specified temperature and stress regimes. These
plots confirm a range of steady-state stress exponent values in a variety of metals
from 4 to 7 with 5 being a typical value [49].
Normalization of the stress by the shear modulus G (rather than E ) and the
inclusion of additional normalizing terms (k, G, b, T ) for the strain rate will be
discussed in the next section. It can be noted from these plots that for a fixed
Figure 10. (a) The compensated steady-state strain-rate versus modulus-compensated steady-state
stress, based on Ref. [26] for selected FCC metals. (b) The compensated steady-state strain-rate versus
modulus-compensated steady-state stress, based on Ref. [26] for selected BCC metals. (c) The
compensated steady-state strain-rate versus modulus-compensated steady-state stress, based on Ref. [21]
for selected HCP metals.
18 Fundamentals of Creep in Metals and Alloys
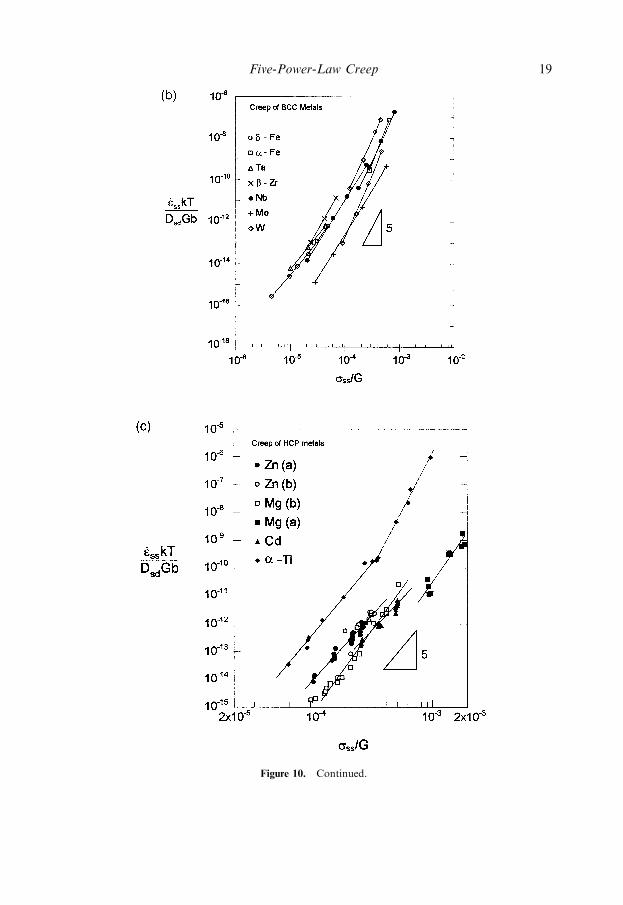
Figure 10. Continued.
Five-Power-Law Creep 19
steady-state creep-rate, the steady-state flow-stress of metals may vary by over two
orders of magnitude for a given crystal structure. The reasons for this will be dis-
cussed later. A decreasing slope (exponent) at lower stresses may be due to diffusional
creep or Harper–Dorn Creep [50]. Diffusional creep includes Nabarro–Herring [51]
and Coble [52] creep. These will be discussed more later, but briefly, Nabarro–
Herring consists of volume diffusion induced strains in polycrystals while Coble con-
sists of mass transport under a stress by vacancy migration via short circuit diffusion
along grain boundaries. Harper–Dorn is not fully understood [53–55] and appears to
involve dislocations within the grain interiors. There has been some recent contro-
versy as to the existence of diffusional creep [56–61], as well as Harper–Dorn [55].
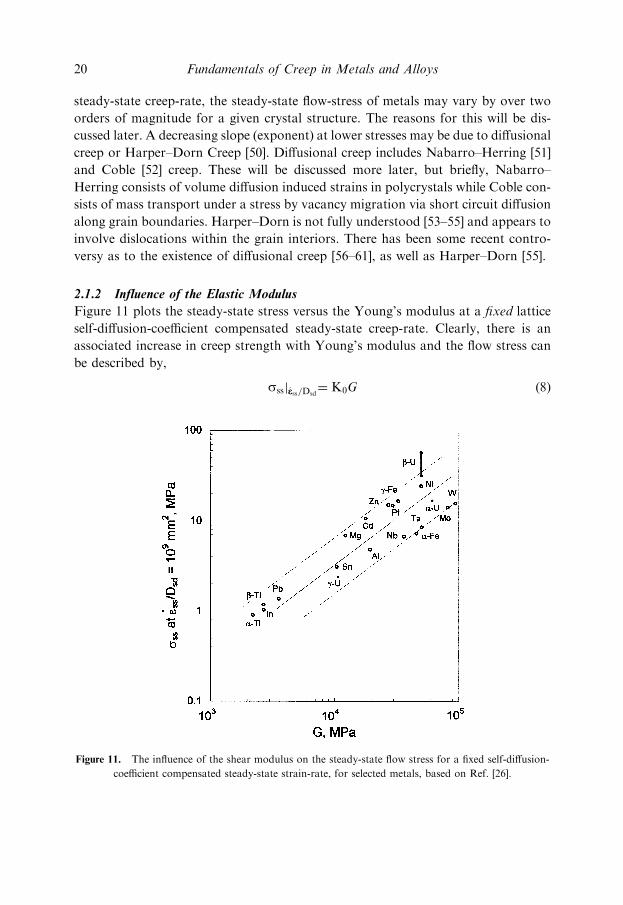
2.1.2 Influence of the Elastic Modulus
Figure 11 plots the steady-state stress versus the Young’s modulus at a fixed lattice
self-diffusion-coefficient compensated steady-state creep-rate. Clearly, there is an
associated increase in creep strength with Young’s modulus and the flow stress can
be described by,
sssj_eess=Dsd¼ K0G ð8Þ
Figure 11. The influence of the shear modulus on the steady-state flow stress for a fixed self-diffusion-
coefficient compensated steady-state strain-rate, for selected metals, based on Ref. [26].
20 Fundamentals of Creep in Metals and Alloys
where K0 is a constant. This, together with equation (7), can be shown to imply that
Five-Power-Law Creep is described by the equation utilizing modulus-compensation
of the stress, such as with equation (3),
_eess ¼ A3 exp½�Qsd=kT �ðsss=GÞ5
ð9Þ
where A3 is a constant. Utilizing modulus compensation produces less variability of
the constant A3 among metals, as compared to A2, in equation (7). It was shown
earlier that the aluminum data of Figure 9 could, in fact, be more accurately
described by a simple power-law if the stress is modulus compensated. The modulus
compensation of equation (9) may also be sensible for a given material as the
dislocation substructure is better related to the modulus-compensated stress rather
than just the applied stress. The constant A3 will be discussed more later. Sherby and
coworkers compensated the stress using the Young’s modulus, E, while most others
use the shear modulus, G. The choice of E versus G is probably not critical in terms
of improving the ability of the phenomenological equation to describe the data. The
preference by some for use of the shear modulus may be based on a theoretical
‘‘palatability’’, and is also used in this review for consistency.
Thus, the ‘‘apparent’’ activation energy for creep, Q0c, calculated from plots such
as Figure 7 without modulus compensation, is not exactly equal to Qsd even if
dislocation climb is the rate-controlling mechanism for Five-Power-Law Creep. This
is due to the temperature dependence of the Elastic Modulus. That is,
Q0c ¼ Qsdþ5k½dðlnGÞ=dð1=TÞ� ð10Þ
Thus, Q0c >QsdffiQc the magnitude being material and temperature dependent.
The differences are relatively small near 0.5 Tm but become more significant near the
melting temperature.
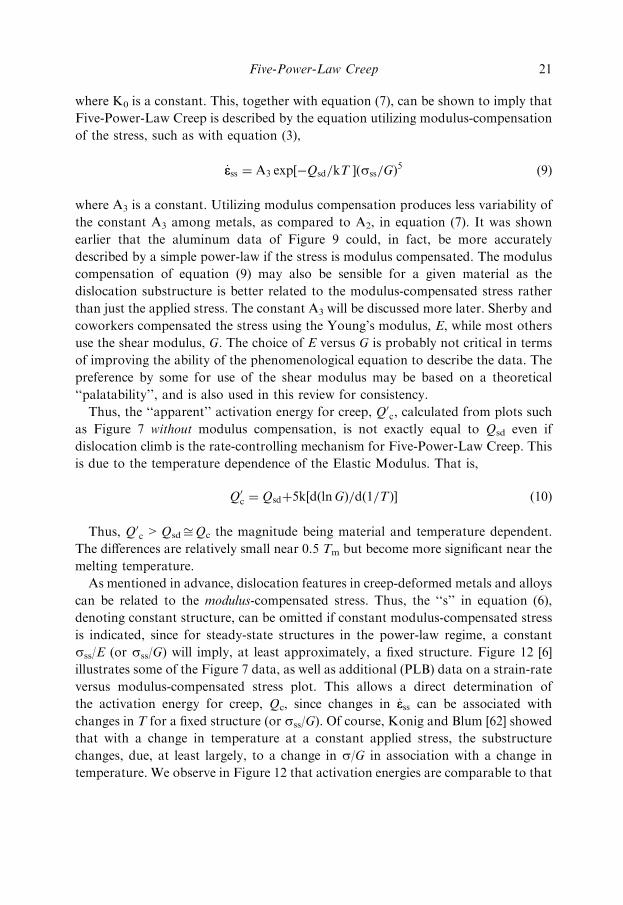
As mentioned in advance, dislocation features in creep-deformed metals and alloys
can be related to the modulus-compensated stress. Thus, the ‘‘s’’ in equation (6),
denoting constant structure, can be omitted if constant modulus-compensated stress
is indicated, since for steady-state structures in the power-law regime, a constant
sss/E (or sss/G) will imply, at least approximately, a fixed structure. Figure 12 [6]
illustrates some of the Figure 7 data, as well as additional (PLB) data on a strain-rate
versus modulus-compensated stress plot. This allows a direct determination of
the activation energy for creep, Qc, since changes in _eess can be associated with
changes in T for a fixed structure (or sss/G). Of course, Konig and Blum [62] showed
that with a change in temperature at a constant applied stress, the substructure
changes, due, at least largely, to a change in s/G in association with a change in
temperature. We observe in Figure 12 that activation energies are comparable to that
Five-Power-Law Creep 21
of lattice self-diffusion of aluminum (e.g., 123 kJ/mol [63]). Again, below about 0.6
Tm, or so, depending on the strain-rate, the activation energy for creep Qc begins
to significantly decrease below Qsd. This occurs at about PLB where n>5 (>4.5
for Al). Figure 13 plots steady-state aluminum data along with steady-state silver
activation energies [12,44]. Other descriptions of Qc vs T/Tm for Al [64] and Ni [65]
are available that utilize temperature-change tests in which constant structure is
assumed (but not assured) and s/G is not constant. The trends observed
are nonetheless consistent with those of Figure 13. The question as to whether
the activation energy for steady-state and primary (or transient, i.e., from one
steady-state to another) creep are identical does not appear established and this is
an important question. However, some [66,67] have suggested that the activation
energy from primary to steady-state does not change substantially. Luthy et al. [44]
and Sherby and Miller [68] present a Qc versus T/Tm plot for steady-state
deformation of W, NaCl, Sn and Cu that is frequently referenced. This plot suggests
Figure 12. The steady-state strain-rate versus the modulus-compensated stress for six temperatures.
This plot illustrates the effect of temperature on the strain-rate for a fixed modulus-compensated
steady-state stress (constant structure) leading to the calculation for activation energies for creep, Qc.
Based on [6].
22 Fundamentals of Creep in Metals and Alloys
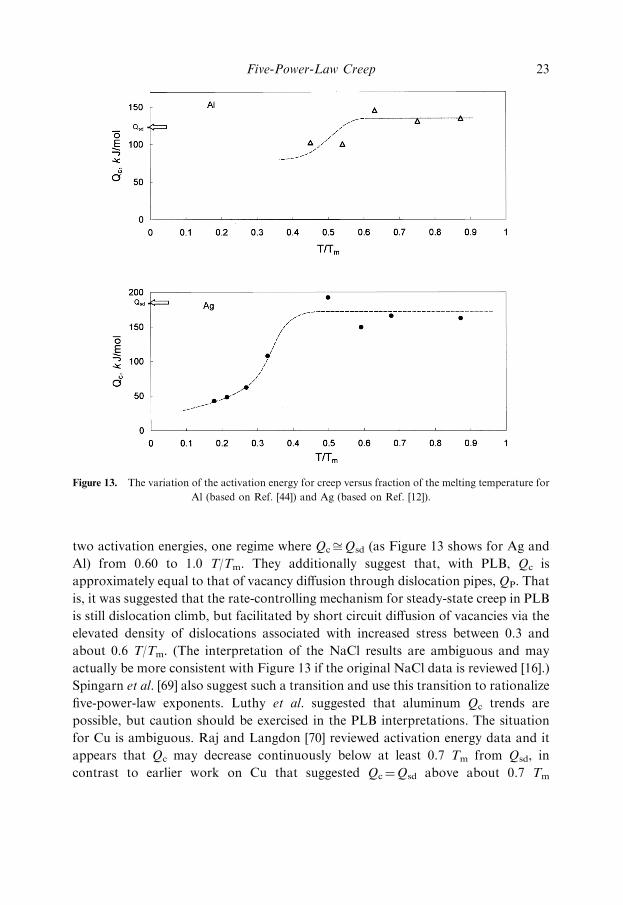
two activation energies, one regime where QcffiQsd (as Figure 13 shows for Ag and
Al) from 0.60 to 1.0 T/Tm. They additionally suggest that, with PLB, Qc is
approximately equal to that of vacancy diffusion through dislocation pipes, QP. That
is, it was suggested that the rate-controlling mechanism for steady-state creep in PLB
is still dislocation climb, but facilitated by short circuit diffusion of vacancies via the
elevated density of dislocations associated with increased stress between 0.3 and
about 0.6 T/Tm. (The interpretation of the NaCl results are ambiguous and may
actually be more consistent with Figure 13 if the original NaCl data is reviewed [16].)
Spingarn et al. [69] also suggest such a transition and use this transition to rationalize
five-power-law exponents. Luthy et al. suggested that aluminum Qc trends are
possible, but caution should be exercised in the PLB interpretations. The situation
for Cu is ambiguous. Raj and Langdon [70] reviewed activation energy data and it
appears that Qc may decrease continuously below at least 0.7 Tm from Qsd, in
contrast to earlier work on Cu that suggested Qc¼Qsd above about 0.7 Tm
Figure 13. The variation of the activation energy for creep versus fraction of the melting temperature for
Al (based on Ref. [44]) and Ag (based on Ref. [12]).
Five-Power-Law Creep 23
and ‘‘suddenly’’ decreases to QP. As mentioned earlier, the steady-state torsion
creep data of Luthy et al., on which the lower temperature activation energy
calculations were based, are probably unreliable. Dynamic recrystallization is
certainly occurring in their high purity aluminum along with probable (perhaps
20%) textural softening (decrease in the average Taylor factor, M) along with
adiabatic heating. Use of solid specimens also complicates the interpretation of
steady-state as outer portions may soften while inner portions are hardening. Lower
purity specimens could be used to avoid dynamic recrystallization, but Stage IV
hardening [11,13] may occur and may preclude (although sometimes just postpone) a
mechanical steady-state. Thus, steady-state, as defined here, as a balance between
dislocation hardening and, exclusively, dynamic recovery, is not relevant. Thus, their
activation energies as well as their steady-state stress values below about 0.4 T/Tm
are not used here. Weertman [25] suggested that the Sn results may show an
activation energy transition to a value of Qp over a range of elevated temperatures.
This transition occurs already at about 0.8 Tm and Qc values at temperatures less
than 0.6 Tm do not appear available. Quality activation energy measurements over a
wide range of temperatures both for steady-state and primary creep for a variety of
pure metals are surprisingly unavailable. Thus, the values of activation energy,
between 0.3 and 0.6 Tm (PLB), and the question as to whether these can be related to
the activation energy of dislocation pipe diffusion, are probably unsettled.
Sherby and Burke have suggested that vacancy supersaturation may occur at
lower temperatures where PLB occurs (as have others [71]). Thus, vacancy diffusion
may still be associated with the rate-controlling process despite a low, non-constant,
activation energy. Also, as suggested by others [9,26,41–43], cross-slip or the cutting
of forest dislocations (glide) may be the rate-controlling dislocation mechanisms
rather than dislocation climb.
2.1.3 Stacking Fault Energy and Summary
In the above, the steady-state creep rate for Five-Power-Law Creep was described by,
_eess¼ A4Dsdðsss=GÞ5
ð11Þ
where
Dsd¼Doexp ð�Qsd=kT Þ: ð12Þ
Many investigators [4,21,26,72] have attempted to decompose A4 into easily
identified constants. Mukherjee et al. [72] proposed that
_eess¼ A5ðDsdGb=kT Þðsss=GÞ5
ð13Þ
24 Fundamentals of Creep in Metals and Alloys
This review will utilize the form of equation (13) since this form has been more
widely accepted than equation (11). Equation (13) allows the expression of the power
law on a logarithmic plot more conveniently than equation (11), due to dimensional
considerations.
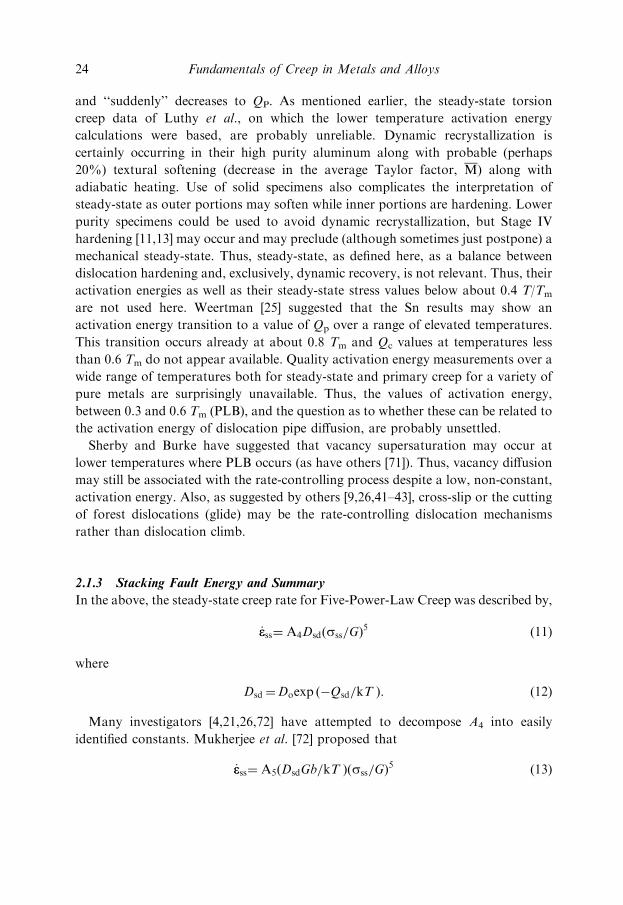
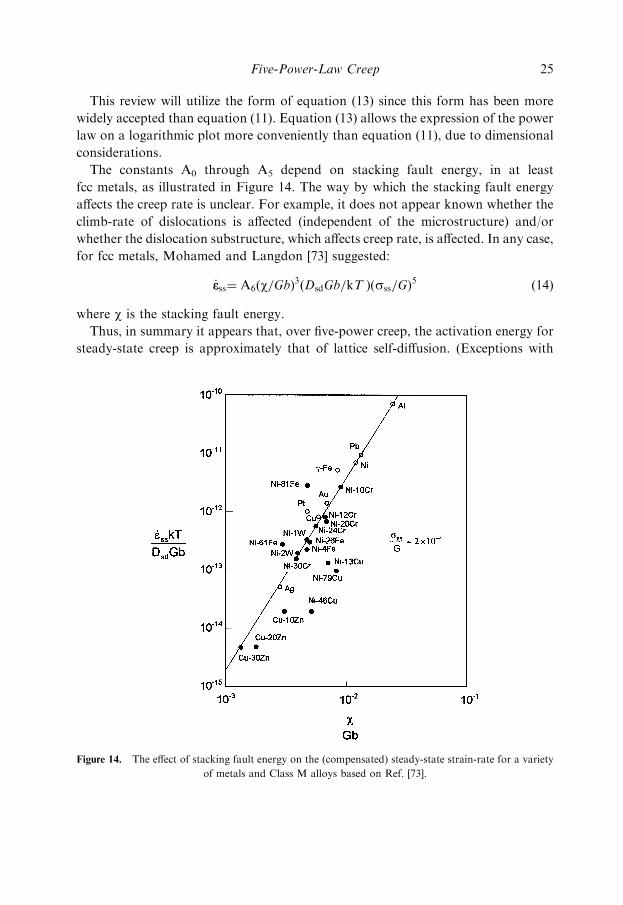
The constants A0 through A5 depend on stacking fault energy, in at least
fcc metals, as illustrated in Figure 14. The way by which the stacking fault energy
affects the creep rate is unclear. For example, it does not appear known whether the
climb-rate of dislocations is affected (independent of the microstructure) and/or
whether the dislocation substructure, which affects creep rate, is affected. In any case,
for fcc metals, Mohamed and Langdon [73] suggested:
_eess¼ A6ðw=GbÞ3ðDsdGb=kT Þðsss=GÞ
5ð14Þ
where w is the stacking fault energy.
Thus, in summary it appears that, over five-power creep, the activation energy for
steady-state creep is approximately that of lattice self-diffusion. (Exceptions with
Figure 14. The effect of stacking fault energy on the (compensated) steady-state strain-rate for a variety
of metals and Class M alloys based on Ref. [73].
Five-Power-Law Creep 25
pure metals above 0.5 T/Tm have been suggested. One example is Zr, where a glide
control mechanism [74] has been suggested to be rate controlling, but self-diffusion
may still be viable [75], just obscured by impurity effects.) This suggests that
dislocation climb is associated with the rate-controlling process for Five-Power-Law
Creep. The activation energy decreases below about 0.5 Tm, depending, of course,
on the strain-rate. There is a paucity of reliable steady-state activation energies for
creep at these temperatures and it is difficult to associate these energies with specific
mechanisms. The classic plot of effective diffusion coefficient Deff compensated strain
rate versus modulus-compensated stress for aluminum by Luthy et al. may be the
most expansive in terms of the ranges of stress and temperature. It appears in other
creep reviews [23,24] and may have some critical flaws. They modified equation (11)
to a Garofalo (hyperbolic sine) [48] equation to include PLB:
_eess¼ BDeff ½sinh a1ðsss=E Þ�5
ð15Þ
where a1 and B are constants. Here, again, Deff reflects the increased contribution of
dislocation pipe diffusion with decreasing temperature. Deff compensated strain-rate
utilizes a ‘‘composite’’ strain-rate controlled by lattice and dislocation pipe-diffusion.
The contributions of each of these to Deff depend on both the temperature and the
dislocation density (which at steady-state is non-homogeneous, as will be discussed).
Equation (15), above, was later modified by Wu and Sherby [53] for aluminum to
account for Internal stresses although a dramatic improvement in the modeling of
the data of 5-power-law and PLB was not obvious. The subject of Internal stresses
will be discussed later. Diffusion is not a clearly established mechanism for plastic
flow in PLB and Deff is not precisely known. For this reason, this text will avoid the
use of Deff in compensating strain-rate.
Just as PLB bounds the high-stress regime of Five-Power-Law Creep, a diffusional
creep mechanism or Harper–Dorn Creep may bound the low-stress portion of
five-power-law creep (for alloys, Superplasticity [2-power] or viscous glide [3-power]
may also be observed as will be discussed later). For pure aluminum, Harper–Dorn
Creep is generally considered to describe the low-stress regime and is illustrated in
Figure 15. The stress exponent for Harper–Dorn is 1 with an activation energy often
of Qsd, and Harper–Dorn is grain size independent. The precise mechanism for
Harper–Dorn Creep is not understood [53,54] and some have suggested that it may
not exist [55]. Figure 15, from Blum and Straub [76,77], is a compilation of high
quality steady-state creep in pure aluminum and describes the temperature range
from about 0.5 Tm to near the melting temperature, apparently showing three
separate creep regimes. It appears that the range of steady-state data for Al may be
more complete than any other metal. The aluminum data presented in earlier figures
are consistent with the data plotted by Blum and Straub. It is intended that this data
26 Fundamentals of Creep in Metals and Alloys

does not include the temperature/stress regime where Stage IV and recrystallization
may obfuscate recovery-controlled steady-state. This plot also (probably not critical
to the PLB transition) uses the same activation energy, Qsd, (142 kJ mol�1) [76]
over the entire stress/strain-rate/temperature regime. As discussed earlier, Qc
seems to decrease with decreasing temperature (increasing strain-rate) within PLB.
The aluminum data shows a curious undulation at sss/G¼ 2� 10�5, that is not
understood, although impurities were a proposed explanation [76].
There are other metallic systems for which a relatively large amount of data
from several investigators can be summarized. One is copper, which is illustrated in
Figure 16. The summary was reported recently in Ref. [78]. Again, a well-defined
‘‘five’’ power law regime is evident. Again, this data is consistent with the (smaller
quantity of reported) data of Figure 10. Greater scatter is evident here as compared
with Figure 15, as the results of numerous investigators were used and the purity
varied. Copper is a challenging experimental metal as oxygen absorption and
Figure 15. The compensated steady-state strain-rate versus the modulus-compensated steady-state stress
for 99.999 pure Al, based on Refs. [76,77].
Five-Power-Law Creep 27
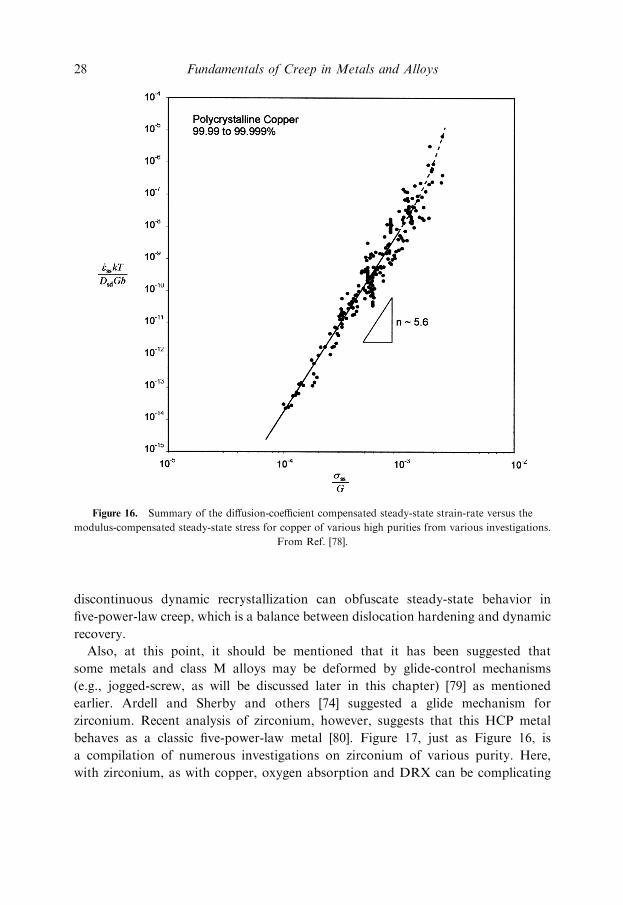
discontinuous dynamic recrystallization can obfuscate steady-state behavior in
five-power-law creep, which is a balance between dislocation hardening and dynamic
recovery.
Also, at this point, it should be mentioned that it has been suggested that
some metals and class M alloys may be deformed by glide-control mechanisms
(e.g., jogged-screw, as will be discussed later in this chapter) [79] as mentioned
earlier. Ardell and Sherby and others [74] suggested a glide mechanism for
zirconium. Recent analysis of zirconium, however, suggests that this HCP metal
behaves as a classic five-power-law metal [80]. Figure 17, just as Figure 16, is
a compilation of numerous investigations on zirconium of various purity. Here,
with zirconium, as with copper, oxygen absorption and DRX can be complicating
Figure 16. Summary of the diffusion-coefficient compensated steady-state strain-rate versus the
modulus-compensated steady-state stress for copper of various high purities from various investigations.
From Ref. [78].
28 Fundamentals of Creep in Metals and Alloys
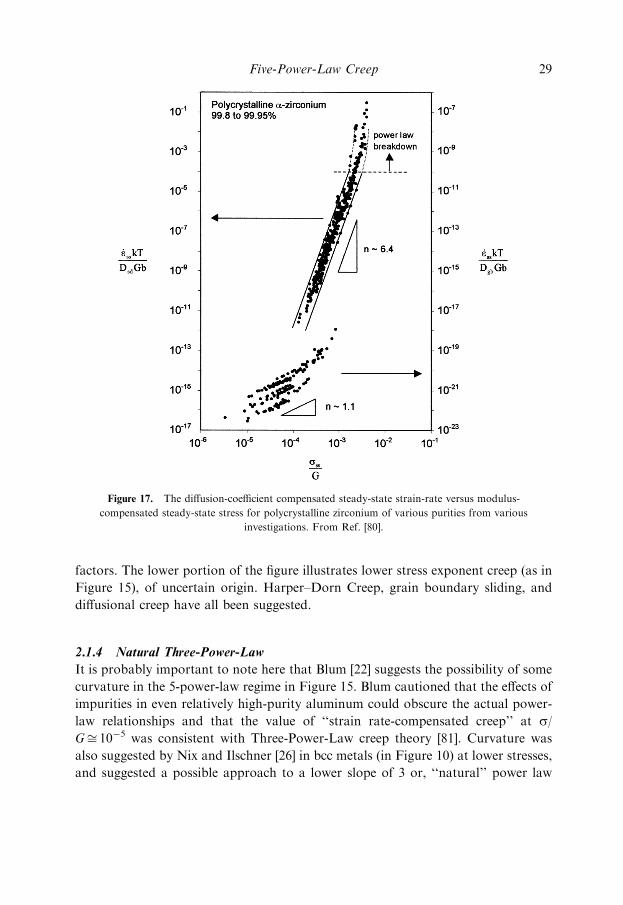
factors. The lower portion of the figure illustrates lower stress exponent creep (as in
Figure 15), of uncertain origin. Harper–Dorn Creep, grain boundary sliding, and
diffusional creep have all been suggested.
2.1.4 Natural Three-Power-Law
It is probably important to note here that Blum [22] suggests the possibility of some
curvature in the 5-power-law regime in Figure 15. Blum cautioned that the effects of
impurities in even relatively high-purity aluminum could obscure the actual power-
law relationships and that the value of ‘‘strain rate-compensated creep’’ at s/Gffi 10�5 was consistent with Three-Power-Law creep theory [81]. Curvature was
also suggested by Nix and Ilschner [26] in bcc metals (in Figure 10) at lower stresses,
and suggested a possible approach to a lower slope of 3 or, ‘‘natural’’ power law
Figure 17. The diffusion-coefficient compensated steady-state strain-rate versus modulus-
compensated steady-state stress for polycrystalline zirconium of various purities from various
investigations. From Ref. [80].
Five-Power-Law Creep 29
exponent consistent with some early arguments by Weertman [25] (although
Springarn, Barnett and Nix [69] earlier suggest that dislocation core diffusion may
rationalize five-power-law behavior). Both groups interpreted five-power behavior as
a disguised ‘‘transition’’ from Three-Power-Law to PLB. Weertman suggested that
five-power-law behavior is unexpected. The Three-Power-Law exponent, or so-called
natural law, has been suggested to be a consequence of
_ee¼ ð1=2Þ �vvbrm ð16Þ
where �vv is the average dislocation velocity and rm is the mobile dislocation
density. As will be discussed later in a theory section, the dislocation climb-
rate, which controls �vv, is proportional to s. It is assumed that s2/ rm (although
dislocation hardening is not assumed) which leads to 3-power behavior in
equation (16). This text will later attempt to illustrate that this latter equation has
no mandate.
Wilshire [82] and Evans and Wilshire [83] have described and predicted steady-
state creep rates phenomenologically over wide temperature regimes without
assumptions of transitions from one rate-controlling process to another across the
range of temperature/strain-rates/stresses in earlier plots (which suggested to include,
for example, Harper–Dorn Creep, Five-Power-Law Creep, PLB, etc). Although
this is not a widely accepted interpretation of the data, it deserves mention,
particularly as some investigators, just referenced, have questioned the validity
of five-power-law. A review confirms that nearly all investigators recognize that
power-law behavior in pure metals and Class M alloys appears to be generally fairly
well defined over a considerable range of modulus-compensated steady-state stress
(or diffusion coefficient-compensated steady-state creep rate). Although this value
varies, a typical value is 5. Thus, for this review, the designation of ‘‘Five-Power-Law
Creep’’ is judged meaningful.
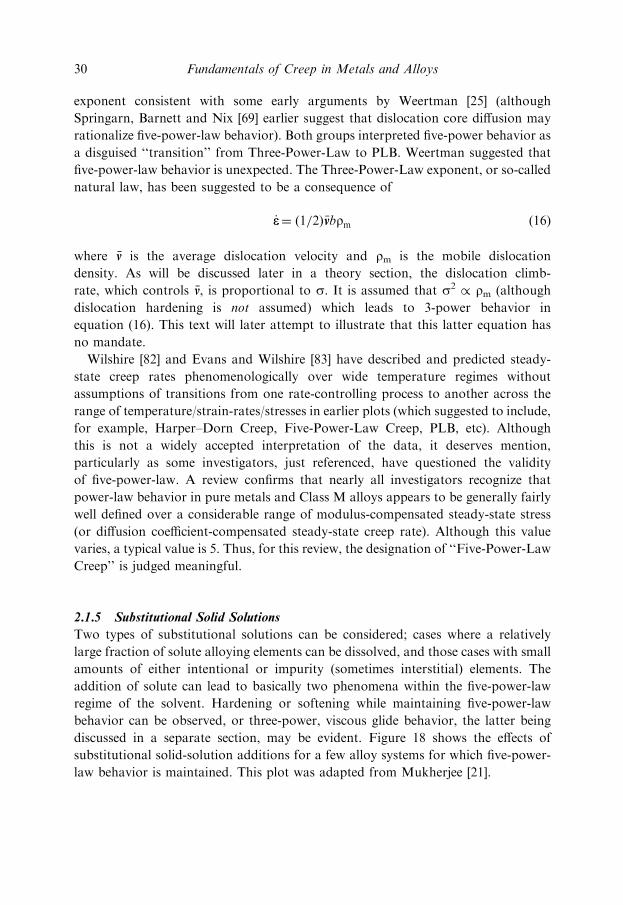
2.1.5 Substitutional Solid Solutions
Two types of substitutional solutions can be considered; cases where a relatively
large fraction of solute alloying elements can be dissolved, and those cases with small
amounts of either intentional or impurity (sometimes interstitial) elements. The
addition of solute can lead to basically two phenomena within the five-power-law
regime of the solvent. Hardening or softening while maintaining five-power-law
behavior can be observed, or three-power, viscous glide behavior, the latter being
discussed in a separate section, may be evident. Figure 18 shows the effects of
substitutional solid-solution additions for a few alloy systems for which five-power-
law behavior is maintained. This plot was adapted from Mukherjee [21].
30 Fundamentals of Creep in Metals and Alloys
2.2 MICROSTRUCTURAL OBSERVATIONS
2.2.1 Subgrain Size, Frank Network Dislocation Density, Subgrain
Misorientation Angle, and the Dislocation Separation within the Subgrain
Walls in Steady-State Structures
Certain trends in the dislocation substructure evolution have been fairly well
established when an annealed metal is deformed at elevated temperature (e.g., under
constant stress or strain-rate) within the five-power-law regime. Basically, on
commencement of plastic deformation, the total dislocation density increases and
this is associated with the eventual formation of low-misorientation subgrain walls.
Figure 18. The compensated steady-state strain-rate versus modulus-compensated steady-state stress for
a variety of Class M (Class I) alloys. Based on Ref. [21].
Five-Power-Law Creep 31
That is, in a polycrystalline aggregate, where misorientations, y (defined here as the
minimum rotation required to bring two lattices, separated by a boundary, into
coincidence), between grains are typically (e.g., cubic metals) 10–62�, the individual
grains become filled with subgrains. The subgrain boundaries are low-energy
configurations of the dislocations generated from creep plasticity.
The misorientations, yl, of these subgrains are generally believed to be low at
elevated temperatures, often roughly 1�. The dislocations within the subgrain
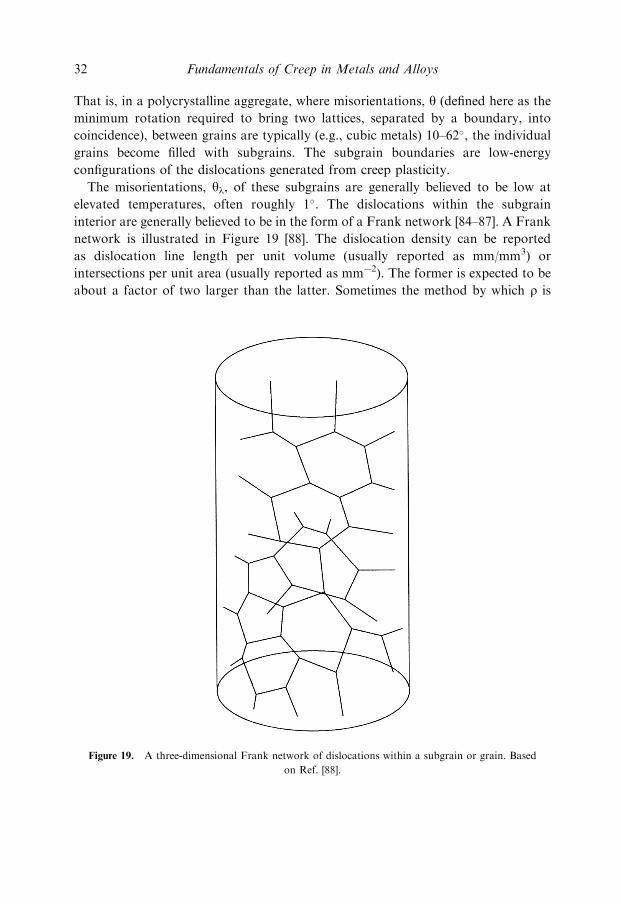
interior are generally believed to be in the form of a Frank network [84–87]. A Frank
network is illustrated in Figure 19 [88]. The dislocation density can be reported
as dislocation line length per unit volume (usually reported as mm/mm3) or
intersections per unit area (usually reported as mm�2). The former is expected to be
about a factor of two larger than the latter. Sometimes the method by which r is
Figure 19. A three-dimensional Frank network of dislocations within a subgrain or grain. Based
on Ref. [88].
32 Fundamentals of Creep in Metals and Alloys
determined is not reported. Thus, microstructurally, in addition to the average
grain size of the polycrystalline aggregate, g, the substructure of materials deformed
within the five-power-law regime is more frequently characterized by the average
Subgrain size l (often measured as an average intercept), the average misorientation
across subgrain boundaries, ylave , and the density of dislocations not associated
with subgrain boundaries, r. Early reviews (e.g., [16]) did not focus on the
dislocation substructure as these microstructural features are best investigated by
transmission electron microscopy (TEM). A substantial amount of early dislocation
substructure characterization was performed using metallographic techniques such
as polarized light optical microscopy (POM) and dislocation etch-pit analysis. As
TEM techniques became refined and widely used, it became clear that the optical
techniques are frequently unreliable, often, for example, overestimating Subgrain
size [89] partly due to a lack of ability (particularly POM) to detect lower-
misorientation-angle subgrain boundaries. Etch-pit-based dislocation density values
may be unreliable, particularly in materials with relatively high r values [90].
Unambiguous TEM characterization of the dislocation substructure is not trivial.
Although dislocation density measurements in metals may be most reliably
performed by TEM, several short-comings of the technique must be overcome.
Although the TEM can detect subgrain boundaries of all misorientations, larger
areas of thin (transparent to the electron beam) foil must be examined to statistically
ensure a meaningful average intercept, l. The dislocation density within a subgrain
may vary substantially within a given specimen. This variation appears independent
of the specimen preparation procedures. The number of visible dislocations can be
underestimated by a factor of two by simply altering the TEM imaging conditions
[91]. Furthermore, it has been suggested that in high stacking fault energy materials,
such as pure aluminum, dislocations may ‘‘recover’’ from the thin foil, leading, again,
to an underestimation of the original density [92,93]. As mentioned earlier, there
are at least two different means by which the dislocation density is reported; one
is the surface intersection technique where the density is reported as the number
of dislocation-line intersections per unit surface area of foil and another is the
dislocation line length per unit volume [91]. The latter is typically a factor of two
larger than the former. Misorientation angles of subgrain boundaries, yl, have
generally been measured by X-rays, selected area electron diffraction (SAED,
including Kikuchi lines) and, more recently, by electron backscattered
patterns (EBSP) [94] although this latter technique, to date, cannot easily detect
lower (e.g. <2�4�) misorientation boundaries. Sometimes the character of the
subgrain boundary is alternatively described by the average spacing of dislocations,
d, that constitute the boundary. A reliable determination of d is complicated by
several considerations. First, with conventional bright-field or weak-beam TEM,
there are limitations as to the minimum discernable separation of dislocations. This
Five-Power-Law Creep 33
appears to be within the range of d frequently possessed by subgrain boundaries
formed at elevated temperatures. Second, boundaries in at least some fcc metals
[95–97] may have 2–5 separate sets of Burgers vectors, perhaps with different
separations, and can be of tilt, twist, or mixed character. Often, the separation of
the most closely separated set is reported. Determination of yl by SAED requires
significant effort since for a single orientation in the TEM, only the tilt angle by
Kikuchi shift is accurately determined. The rotation component cannot be accurately
measured for small total misorientations. yl can only be determined using Kikuchi
lines with some effort, involving examination of the crystals separated by a boundary
using several orientations [42,43]. Again, EBSP cannot detect lower yl boundaries
which may comprise a large fraction of subgrain boundaries.
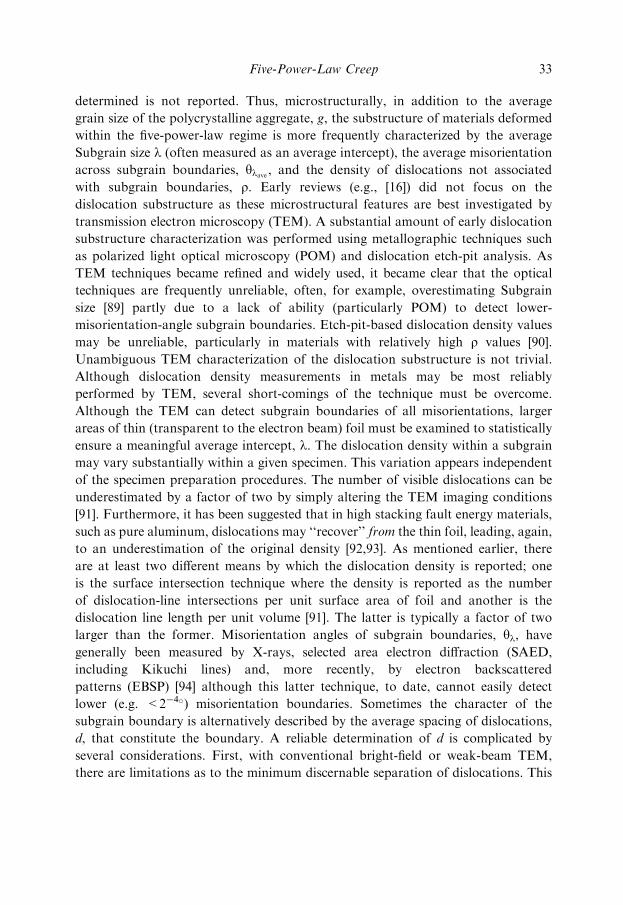
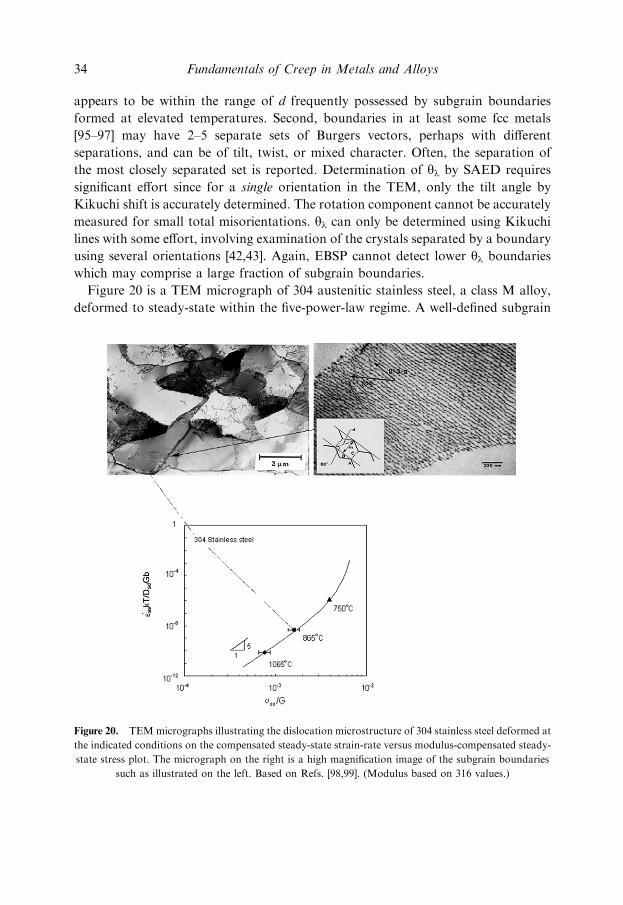
Figure 20 is a TEM micrograph of 304 austenitic stainless steel, a class M alloy,
deformed to steady-state within the five-power-law regime. A well-defined subgrain
Figure 20. TEMmicrographs illustrating the dislocation microstructure of 304 stainless steel deformed at
the indicated conditions on the compensated steady-state strain-rate versus modulus-compensated steady-
state stress plot. The micrograph on the right is a high magnification image of the subgrain boundaries
such as illustrated on the left. Based on Refs. [98,99]. (Modulus based on 316 values.)
34 Fundamentals of Creep in Metals and Alloys
substructure is evident and the subgrain walls are ‘‘tilted’’ to expose the sets of
dislocations that comprise the walls. The dislocations not associated with subgrain
walls are also evident. Because of the finite thickness of the foil (ffi 100 nm), any
Frank network has been disrupted. The heterogeneous nature of the dislocation
substructure is evident. A high magnification TEM micrograph of a hexagonal array
of screw dislocations comprising a subgrain boundary with one set (of Burgers
vectors) satisfying invisibility [98,99] is also in the figure.
It has long been observed, phenomenologically, that there is an approximate
relationship between the Subgrain size and the steady-state flow stress;
sss=G¼ C1ðlssÞ�1
ð17Þ
It should be emphasized that this relationship between the steady-state stress and
the Subgrain size is not for a fixed temperature and strain rate. Hence, it is not of a
same type of equation as, for example, the Hall–Petch relationship, which relates
the strength to the grain size, g, at a reference T and _ee. That is, equation (17) only
predicts the Subgrain size for a given steady-state stress which varies with the
temperature and strain rate. Some (e.g., [89,100]) have normalized the Subgrain size
in equation (17) by the Burgers vector, although this is not a common practice.
The subgrains contain a dislocation density in excess of the annealed values, and
are often believed to form a three-dimensional, Frank, network. The conclusion of a
Frank network is not firmly established for five-power creep, but indirect evidence
of a large number of nodes in thin foils [54,85,101–103] supports this common
contention [84,104–109]. Analogous to equation (17), there appears to be a
relationship between the density of dislocations not associated with subgrain
boundaries [17] and the steady-state stress:
sss=G¼ C2ðrssÞp
ð18Þ
where C2 is a constant and rss is the density of dislocations not associated with
subgrain boundaries. The dislocation density is not normalized by the Burgers vector
as suggested by some [18]. The exponent ‘‘p’’ is generally considered to be about 0.5
and the equation, with some confusion, reduces to:
sss=G¼ C3ffiffiffiffiffiffirssp
ð19Þ
As will be discussed in detail later in this text, this relationship between the steady-
state stress and the dislocation density is not independent of temperature and strain-
rate. Hence, it is not of a same type of microstructure-strength equation as the classic
Taylor relationship which is generally independent of strain-rate and temperature.
Five-Power-Law Creep 35
That is, this equation tells us the dislocation density not associated with subgrain
walls that can be expected for a given steady-state stress which varies with the
temperature and strain-rate, analogous to equation (17). However, the flow stress
associated with this density depends on _ee and T.
As mentioned in the discussion of the ‘‘natural stress exponent,’’ rss is sometimes
presumed equal, or at least proportional, to the mobile dislocation density, rm. Thisappears unlikely for a Frank network and the fraction mobile over some time
interval, dt, is unknown, and may vary with stress. In Al, at steady-state, rm may
only be about 1/3 r or less [107] although this fraction was not firmly established.
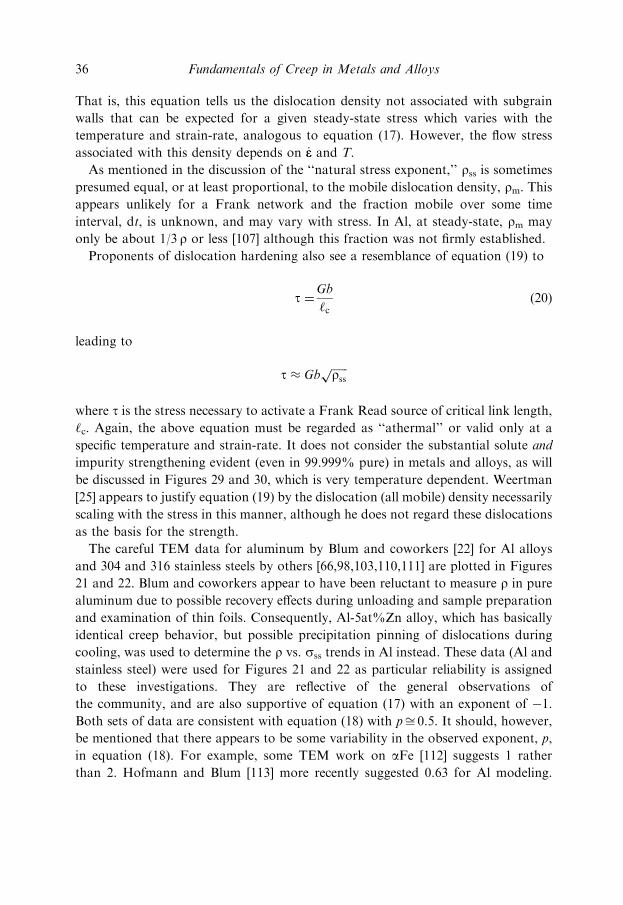
Proponents of dislocation hardening also see a resemblance of equation (19) to
t ¼Gb
‘cð20Þ
leading to
t � Gbffiffiffiffiffiffirssp
where t is the stress necessary to activate a Frank Read source of critical link length,
‘c. Again, the above equation must be regarded as ‘‘athermal’’ or valid only at a
specific temperature and strain-rate. It does not consider the substantial solute and
impurity strengthening evident (even in 99.999% pure) in metals and alloys, as will
be discussed in Figures 29 and 30, which is very temperature dependent. Weertman
[25] appears to justify equation (19) by the dislocation (all mobile) density necessarily
scaling with the stress in this manner, although he does not regard these dislocations
as the basis for the strength.
The careful TEM data for aluminum by Blum and coworkers [22] for Al alloys
and 304 and 316 stainless steels by others [66,98,103,110,111] are plotted in Figures
21 and 22. Blum and coworkers appear to have been reluctant to measure r in pure
aluminum due to possible recovery effects during unloading and sample preparation
and examination of thin foils. Consequently, Al-5at%Zn alloy, which has basically
identical creep behavior, but possible precipitation pinning of dislocations during
cooling, was used to determine the r vs. sss trends in Al instead. These data (Al and
stainless steel) were used for Figures 21 and 22 as particular reliability is assigned
to these investigations. They are reflective of the general observations of
the community, and are also supportive of equation (17) with an exponent of �1.
Both sets of data are consistent with equation (18) with pffi 0.5. It should, however,
be mentioned that there appears to be some variability in the observed exponent, p,
in equation (18). For example, some TEM work on aFe [112] suggests 1 rather
than 2. Hofmann and Blum [113] more recently suggested 0.63 for Al modeling.
36 Fundamentals of Creep in Metals and Alloys
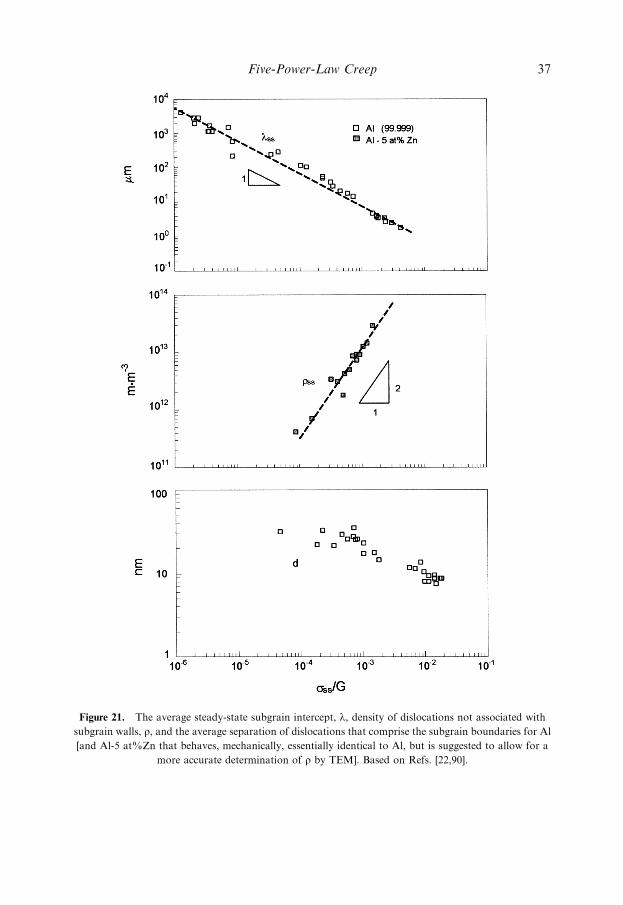
Figure 21. The average steady-state subgrain intercept, l, density of dislocations not associated with
subgrain walls, r, and the average separation of dislocations that comprise the subgrain boundaries for Al
[and Al-5 at%Zn that behaves, mechanically, essentially identical to Al, but is suggested to allow for a
more accurate determination of r by TEM]. Based on Refs. [22,90].
Five-Power-Law Creep 37
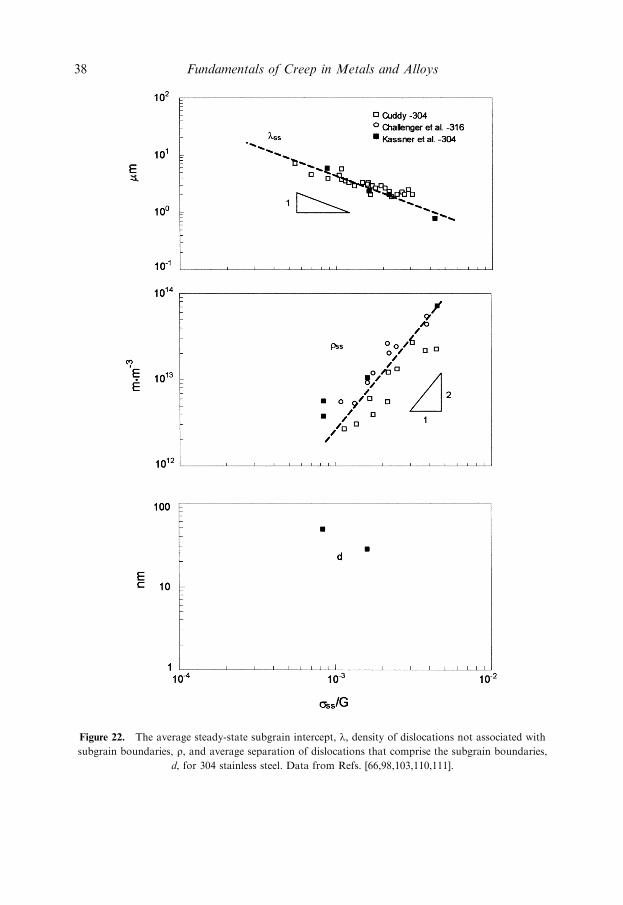
Figure 22. The average steady-state subgrain intercept, l, density of dislocations not associated with
subgrain boundaries, r, and average separation of dislocations that comprise the subgrain boundaries,
d, for 304 stainless steel. Data from Refs. [66,98,103,110,111].
38 Fundamentals of Creep in Metals and Alloys
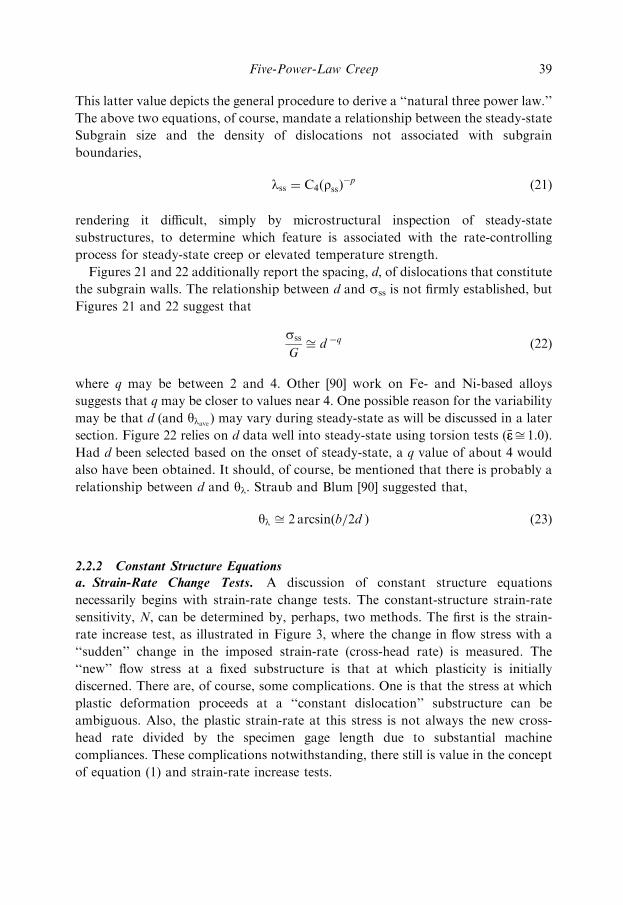
This latter value depicts the general procedure to derive a ‘‘natural three power law.’’
The above two equations, of course, mandate a relationship between the steady-state
Subgrain size and the density of dislocations not associated with subgrain
boundaries,
lss ¼ C4ðrssÞ�p
ð21Þ
rendering it difficult, simply by microstructural inspection of steady-state
substructures, to determine which feature is associated with the rate-controlling
process for steady-state creep or elevated temperature strength.
Figures 21 and 22 additionally report the spacing, d, of dislocations that constitute
the subgrain walls. The relationship between d and sss is not firmly established, but
Figures 21 and 22 suggest that
sss
Gffi d �q ð22Þ
where q may be between 2 and 4. Other [90] work on Fe- and Ni-based alloys
suggests that q may be closer to values near 4. One possible reason for the variability
may be that d (and ylave ) may vary during steady-state as will be discussed in a later
section. Figure 22 relies on d data well into steady-state using torsion tests (�eeffi 1.0).
Had d been selected based on the onset of steady-state, a q value of about 4 would
also have been obtained. It should, of course, be mentioned that there is probably a
relationship between d and yl. Straub and Blum [90] suggested that,
yl ffi 2 arcsinðb=2d Þ ð23Þ
2.2.2 Constant Structure Equations
a. Strain-Rate Change Tests. A discussion of constant structure equations
necessarily begins with strain-rate change tests. The constant-structure strain-rate
sensitivity, N, can be determined by, perhaps, two methods. The first is the strain-
rate increase test, as illustrated in Figure 3, where the change in flow stress with a
‘‘sudden’’ change in the imposed strain-rate (cross-head rate) is measured. The
‘‘new’’ flow stress at a fixed substructure is that at which plasticity is initially
discerned. There are, of course, some complications. One is that the stress at which
plastic deformation proceeds at a ‘‘constant dislocation’’ substructure can be
ambiguous. Also, the plastic strain-rate at this stress is not always the new cross-
head rate divided by the specimen gage length due to substantial machine
compliances. These complications notwithstanding, there still is value in the concept
of equation (1) and strain-rate increase tests.
Five-Power-Law Creep 39
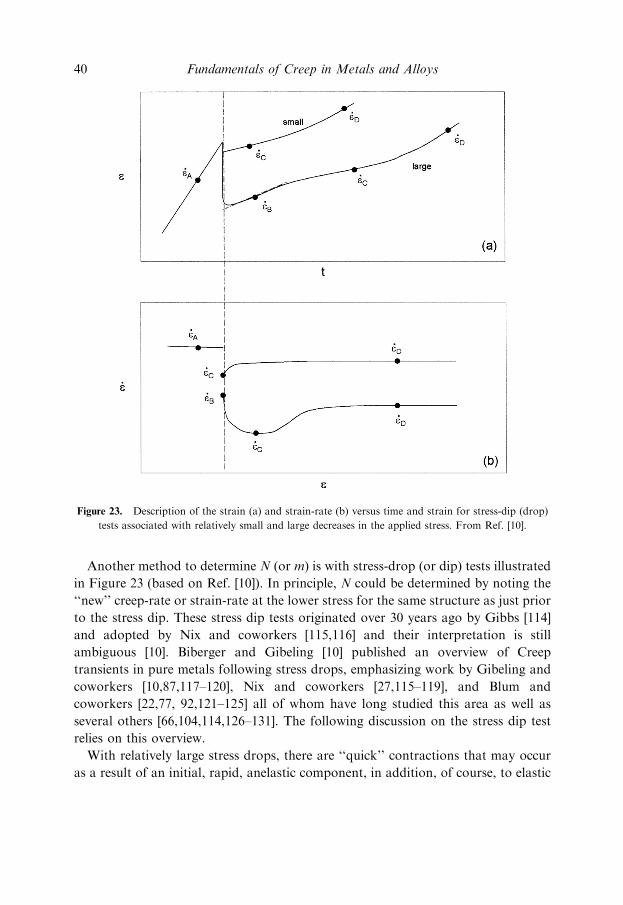
Another method to determine N (or m) is with stress-drop (or dip) tests illustrated
in Figure 23 (based on Ref. [10]). In principle, N could be determined by noting the
‘‘new’’ creep-rate or strain-rate at the lower stress for the same structure as just prior
to the stress dip. These stress dip tests originated over 30 years ago by Gibbs [114]
and adopted by Nix and coworkers [115,116] and their interpretation is still
ambiguous [10]. Biberger and Gibeling [10] published an overview of Creep
transients in pure metals following stress drops, emphasizing work by Gibeling and
coworkers [10,87,117–120], Nix and coworkers [27,115–119], and Blum and
coworkers [22,77, 92,121–125] all of whom have long studied this area as well as
several others [66,104,114,126–131]. The following discussion on the stress dip test
relies on this overview.
With relatively large stress drops, there are ‘‘quick’’ contractions that may occur
as a result of an initial, rapid, anelastic component, in addition, of course, to elastic
Figure 23. Description of the strain (a) and strain-rate (b) versus time and strain for stress-dip (drop)
tests associated with relatively small and large decreases in the applied stress. From Ref. [10].
40 Fundamentals of Creep in Metals and Alloys
contractions, followed by slower anelastic backflow [119]. Researchers in this area
tend to report a ‘‘first maximum’’ creep rate which occurs at ‘‘B’’ in Figure 23. It has
been argued that the plastic strain preceding ‘‘B’’ is small and that the dislocation
microstructure at ‘‘B’’ is essentially ‘‘identical’’ to that just prior to the stress drop.
Some investigators have shown, however, that the interior or network density, r,may be different [131]. Also, since the creep-rate decreases further to a minimum
value at ‘‘C’’ (in Figure 23), the creep at ‘‘B’’ has been, occasionally, termed
‘‘anomalous.’’ _eeC (point ‘‘C’’) has also been referred to as ‘‘constant structure,’’
probably, primarily, as a consequence that the Subgrain size, l, at ‘‘C’’ is probablyvery close to the same value as just prior to the stress drop, despite the observation
that the interior dislocation density, r, appears to change [4,6,120,125,132]. Thus,
with the stress dip test, the constant structure stress exponent, N, or related constant-
structure descriptors, such as the activation area, �a, or volume, �V0, [132,133] may
be ambiguous as the strain-rate immediately on unloading is negative, and the
material does not have a fixed substructure at definable stages such as at ‘‘B’’ and
‘‘C.’’ Eventually, the material ‘‘softens’’ to ‘‘D’’ as a consequence of deformation
at the lower stress, to the strain-rate that most investigators have concluded
corresponds to that which would have been obtained on loading the annealed metal
at same temperature and stress although this is not, necessarily, a consensus view,
e.g. [128,134]. Parker and Wilshire [134], for example, find that at lower
temperatures, Cu, with a stress drop, did not return to the creep-rate for the
uninterrupted test. Of course, it is unclear whether the rate would have eventually
increased to the uninterrupted rate with larger strains that can be precluded by
fracture in tensile tests.
The anelastic strains are very small for small stress-reductions and may not be
observed. The creep-rate cannot be easily defined until _eeC and an ‘‘anomalous’’ creep
is generally not observed as with large stress reductions. Again, the material
eventually softens to a steady-state at ‘‘D.’’
The stress-dip test appears to at least be partially responsible for the introduction
of the concept of an internal ‘‘backstress.’’ That is, the backflow associated with the
stress dip, observed in polycrystals and single crystals alike, has been widely
presumed to be the result of an Internal stress. At certain stress reductions, a zero
initial creep-rate can result, which would, presumably, be at an applied stress about
equal to the backstress [81,115,126,135]. Blum and coworkers [22,77,122,125,
135,136], Nix and coworkers [26,115–117], Argon and coworkers [18,137], Morris
and Martin [43,44], and many others [20,53,138] (to reference a few) have suggested
that the backflow or backstress is a result of high local Internal stresses that are
associated with the heterogeneous dislocation substructure, or subgrain walls.
Recent justification for high Internal stresses beyond the stress-dip test has included
X-ray diffraction (XRD) and convergent beam electron diffraction (CBED) [136].
Five-Power-Law Creep 41
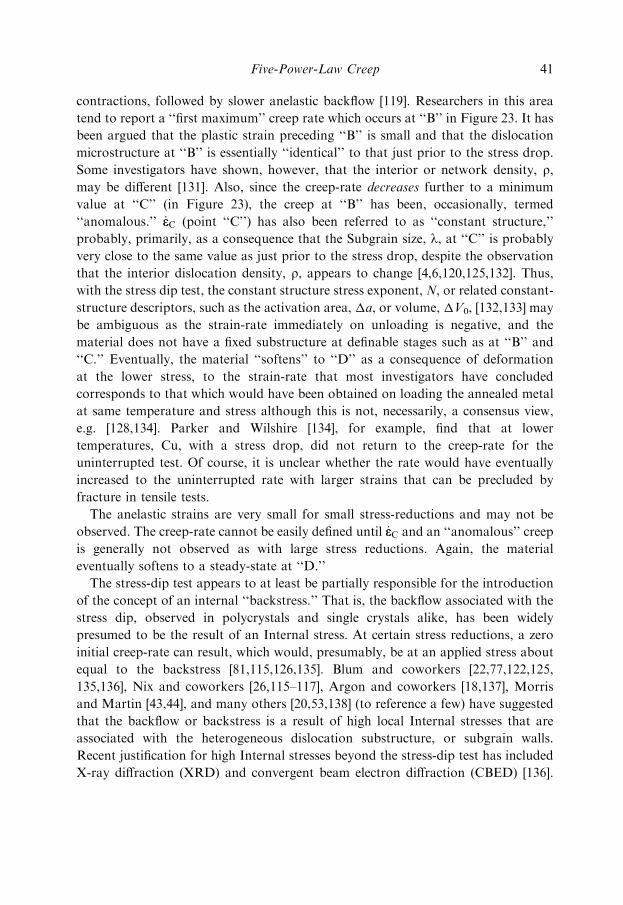
Gibeling and Nix [117] have performed stress relaxation experiments on aluminum
single crystals and found large anelastic ‘‘backstrains’’, which they believed
were substantially in excess of that which would be expected from a homogeneous
stress state [26,117,139]. This experiment is illustrated in Figure 24 for a stress
drop from 4 to 0.4MPa at 400�C. If a sample of cubic structure is assumed with only
one active slip system, and an orthogonal arrangement of dislocations, with a density
r, and all segments are bowed to a critical radius, then the anelastic unbowing strain
is about
gA ¼ffipb
ffiffiffirp
8ffiffiffi3p ð24Þ
Figure 18 suggests that gA from the network dislocations would be about 10�4,
about the same as suggested by Nix et al. [26,117,139]. The above equation only
assumes one-third of r are bowing as two-thirds are on planes without a resolved
shear stress. In reality, slip on {111} and {110} [130] may lead to a higher fraction of
bowed dislocations. Furthermore, it is known that the subgrain boundaries are
mobile. The motion may well involve (conservative) glide, leading to line tension
and the potential for substantial backstrain. It is known that substantial elastic
incompatibilities are associated with grain boundaries [140]. Although Nix et al.
suggest that backstrain from grain boundary sliding (GBS) is not a consideration
for single crystals, it has been later demonstrated that for single crystals of Al, in
creep, such as in Figure 24, high angle boundaries are readily formed in the absence
of classic Discontinuous dynamic recrystallization (DRX) [141,142]. These
incompatibility stresses may relax during (forward) creep, but ‘‘reactivate’’ on
Figure 24. The backstrain associated with unloading an aluminum single crystal from 4 to 0.4MPa at
400�C. From Ref. [117].
42 Fundamentals of Creep in Metals and Alloys
unloading, leading to strains that may be a fraction of the elastic strain. This may
explain large (over 500 microstrain) backflow observed in near a T i alloys after just
0.002 strain creep, where subgrains may not form [143], but fine grains are present.
The subject of Internal stress will be discussed more later. Substructural changes
(that almost surely occur during unloading) may lead to the backstrains, not a result
of long-range Internal stress, such as in Figure 24, although it is not clear how these
strains would develop. More recently, Muller et al. [125] suggested that subgrain
boundary motion after a stress-dip may be associated with ‘‘back’’ strain. Hence, the
‘‘back’’ strains of Figure 24 do not deny the possibility for a homogeneous stress
state. The arguments by Nix et al. still seem curious in view of the fact that such
anelastic backstrains, if a result only of Internal stresses from subgrains, as they
suggest, would seem to imply Internal stress value well over an order of magnitude
greater than the applied stress rather than the factor of that 3 Nix et al. suggest. It is
not known to the author of this review as to whether the results of Figure 21 have
been reproduced.
b. Creep Equations. Equations such as (14)
_eess ¼ A6 w=Gbð Þ3 DsdGb=kTð Þ sss=Gð Þ
5
are capable of relating, at a fixed temperature, the creep rate to the steady-state flow
stress. However, in associating different steady-state creep rates with (steady-state)
flow stresses, it must be remembered that the dislocation structures are different. This
equation does not relate different stresses and substructures at a fixed temperature
and strain rate as, for example, the Hall–Petch equation.
Sherby and coworkers reasoned that relating the flow stress to the (e.g., steady-
state) substructure at a fixed strain-rate and temperature may be performed with
knowledge of N (or m) in equation (1)
N ¼q ln _eeq lns
� �
T ,s
Sherby and coworkers suggested that the flow stress at a fixed elevated temperature
and strain-rate is predictable through [4,6]:
_ee ¼ A7ðl3Þ exp½�Qsd=kT �ðs=E Þ
Nð25Þ
for substructures resulting from steady-state creep deformation in the five-power
regime. It was suggested that Nffi 8. Steady-state (ss) subscripts are notably absent
in this equation. This equation is important in that the flow stress can be directly
related to the microstructure at any fixed (e.g., reference) elevated temperature and
Five-Power-Law Creep 43
strain-rate. Sherby and coworkers, at least at the time that this equation was
formulated, believed that subgrain boundaries were responsible for elevated-
temperature strength. Sherby and coworkers believed that particular value was
inherent in this equation since if equation (17),
sss
G¼ C1l
�1ss
were substituted into equation (25), then the well-established five-power-law
equation [equation (9)] results,
_eess ¼ A3 exp �Qsd=kT½ �sss
G
� �5
Equation (25) suggests that at a fixed temperature and strain-rate:
sE
���_ee,T¼ C5ðlÞ
�3=8ð26Þ
(Sherby normalized stress with the Young’s modulus although the shear modulus
could have been used.) This equation, of course, does not preclude the importance of
the interior dislocation network over the heterogeneous dislocation substructure (or
subgrain walls) for steady-state substructures (on which equation (25) was based).
This is because there is a fixed relationship between the steady-state Subgrain size
and the steady-state interior dislocation density. Equation (26) could be
reformulated, without a loss in accuracy, as
sG
���_ee,T¼ k2ðrÞ
�3p=8ffi�3=16ð27Þ
c. Dislocation Density and Subgrain-Based Constant-Structure Equations. Equation
(26) for subgrain strengthening does not have a strong resemblance to the well-
established Hall–Petch equation for high-angle grain-boundary strengthening:
sy
��_ee,T ¼ soþkyg
�1=2 ð28Þ
where sy
��_ee,T is the yield or flow stress (at a reference or fixed temperature and strain-
rate), and ky is a constant, g is the average grain diameter, and so is the single crystal
strength and can include solute strengthening as well as dislocation hardening.
[Of course, subgrain boundaries may be the microstructural feature associated with
elevated temperature strength and the rate-controlling process for creep, without
obedience to equation (28).] Nor does equation (27) resemble the classic dislocation
44 Fundamentals of Creep in Metals and Alloys
hardening equation [144]:
sy
��_ee,T ¼ s00 þ aMGbðrÞ1=2 ð29Þ
where syj_ee,T is the yield or flow stress (at a reference or fixed temperature and strain-
rate), s00 is the near-zero dislocation density strength and can include solute
strengthening as well as grain-size strengthening, and M is the Taylor factor, 1–3.7
and a is a constant, often about 0.3 at ambient temperature. (This constant will be
dependent upon the units of r, as line-length per unit volume, or intersections per
unit area, the latter being a factor of 2 lower for identical structure.) Both equations
(28) and (29) assume that these hardening features can be simply summed to obtain
their combined effect. Although this is reasonable, there are other possibilities [145].
Equation (29) can be derived on a variety of bases (e.g., bowing stress, passing stress
in a ‘‘forest’’ of dislocations, etc.), all essentially athermal, and may not always
include a s00 term.
Even with high-purity aluminum experiments (99.999% pure), it is evident in
constant strain-rate mechanical tests, that annealed polycrystal has a yield strength
(0.002 plastic strain offset) that is about one-half the steady-state flow stress [4,146]
that cannot be explained by subgrain (or dislocation) hardening; yet this is not
explicitly accounted in the phenomenological equations (e.g., equations 26 and 27).
When accounted, by assuming that s0 ðor s00Þ ¼ syjT ,_ee for annealed metals, Sherby
and coworkers showed that the resulting subgrain-strengthening equation that best
describes the data form would not resemble equation (28), the classic Hall–Petch
equation; the best-fit (1/l) exponent is somewhat high at about 0.7. Kassner and Li
[147] also showed that there would be problems with assuming that the creep
strength could be related to the Subgrain size by a Hall–Petch equation. The
constants in equation (28), the Hall–Petch equation, were experimentally determined
for high-purity annealed aluminum with various (HAB) grain sizes. The predicted
(extrapolated) strength (at a fixed elevated temperature and strain-rate) of aluminum
with grain sizes comparable to those of steady-state Subgrain sizes was substantially
lower than the observed value. Thus, even if low misorientation subgrain walls
strengthen in a manner analogous to HABS, then an ‘‘extra strength’’ in steady-
state, subgrain containing, structures appears from sources other than that provided
by boundaries. Kassner and Li suggested that this extra strength may be due to the
steady-state dislocation density not associated with the subgrains, and dislocation
hardening was observed. Additional discussion of grain-size effects on the creep
properties will be presented later.
The hypothesis of dislocation strengthening was tested using data of high-purity
aluminum as well as a Class M alloy, AISI 304 austenitic stainless steel (19Cr-10Ni)
Five-Power-Law Creep 45
[107,148]. It was discovered that the classic dislocation hardening (e.g., Taylor)
equation is reasonably obeyed if s00 is approximately equal to the annealed yield
strength. Furthermore, the constant a in equations (29), at 0.29, is comparable to
the observed values from ambient temperature studies of dislocation hardening
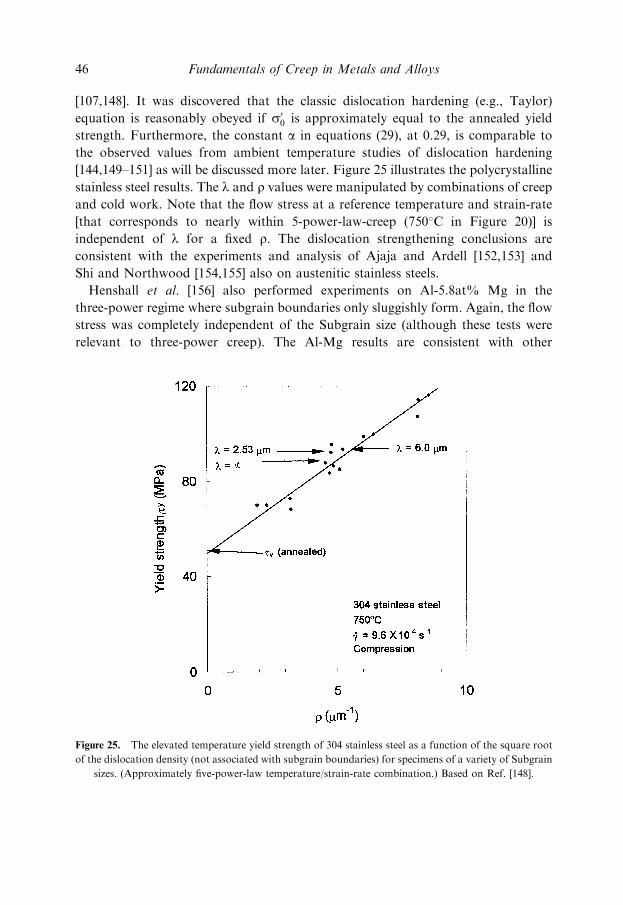
[144,149–151] as will be discussed more later. Figure 25 illustrates the polycrystalline
stainless steel results. The l and r values were manipulated by combinations of creep
and cold work. Note that the flow stress at a reference temperature and strain-rate
[that corresponds to nearly within 5-power-law-creep (750�C in Figure 20)] is
independent of l for a fixed r. The dislocation strengthening conclusions are
consistent with the experiments and analysis of Ajaja and Ardell [152,153] and
Shi and Northwood [154,155] also on austenitic stainless steels.
Henshall et al. [156] also performed experiments on Al-5.8at% Mg in the
three-power regime where subgrain boundaries only sluggishly form. Again, the flow
stress was completely independent of the Subgrain size (although these tests were
relevant to three-power creep). The Al-Mg results are consistent with other
Figure 25. The elevated temperature yield strength of 304 stainless steel as a function of the square root
of the dislocation density (not associated with subgrain boundaries) for specimens of a variety of Subgrain
sizes. (Approximately five-power-law temperature/strain-rate combination.) Based on Ref. [148].
46 Fundamentals of Creep in Metals and Alloys
experiments by Weckert and Blum [121] and the elevated temperature In situ TEM
experiments by Mills [157]. The latter experiments did not appear to show
interaction between subgrain walls and gliding dislocations. The experiments of
this paragraph will be discussed in greater detail later.
2.2.3 Primary Creep Microstructures
Previous microstructural trends in this review emphasized steady-state substructures.
This section discusses the development of the steady-state substructure during
primary creep where hardening is experienced. A good discussion of the pheno-
menological relationships that describe primary creep was presented by Evans and
Wilshire [28]. Primary creep is often described by the phenomenological equation,
‘ ¼ ‘o 1þ bt1=3
ew0t ð30Þ
This is the classic Andrade [158] equation. Here, P is the instantaneous gage length
of a specimen and P0 is the gage length on loading (apparently including elastic
deflection) and b and w0 are constants. This equation leads to equations of the form,
e ¼ at1=3þ ctþ dt4=3 ð31Þ
which is the common phenomenological equation used to describe primary creep.
Modifications to this equation include [159]
e ¼ at1=3þ ct ð32Þ
and [160]
e ¼ at1=3bt2=3þ ct ð33Þ
or
e ¼ atbþ ct ð34Þ
where [161]
0 < b < 1:
These equations cannot be easily justified, fundamentally [23].
For a given steady-state stress and strain-rate, the steady-state microstructure
appears to be independent as to whether the deformation occurs under constant
stress or constant strain-rate conditions. However, there are some differences
between the substructural development during a constant stress as compared to
constant strain-rate primary-creep. Figure 26 shows Al-5at%Zn at 250�C at a
Five-Power-Law Creep 47
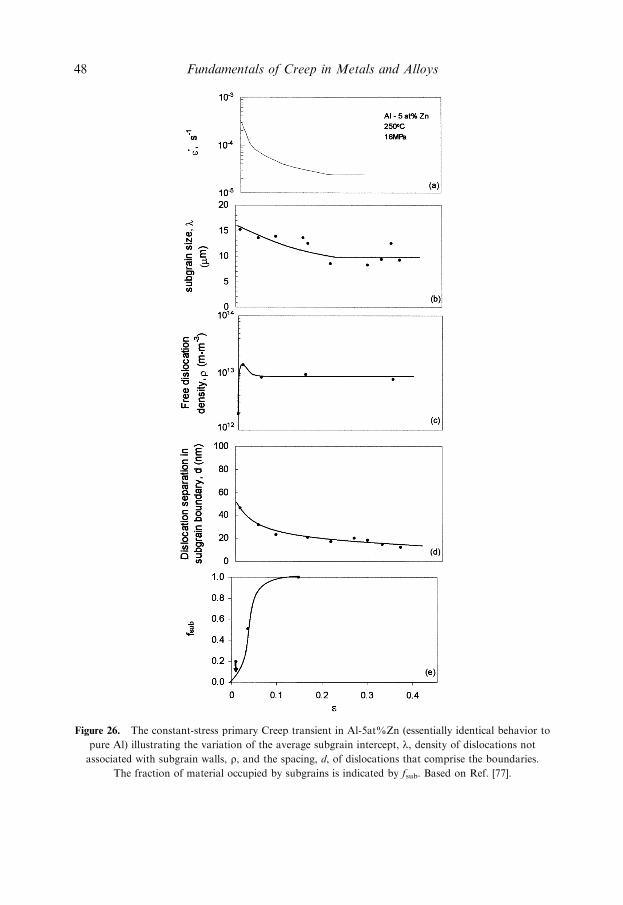
Figure 26. The constant-stress primary Creep transient in Al-5at%Zn (essentially identical behavior to
pure Al) illustrating the variation of the average subgrain intercept, l, density of dislocations not
associated with subgrain walls, r, and the spacing, d, of dislocations that comprise the boundaries.
The fraction of material occupied by subgrains is indicated by fsub. Based on Ref. [77].
48 Fundamentals of Creep in Metals and Alloys
constant stress of 16MPa [77]. Again, this is a class M alloy which, mechanically,
behaves essentially identical to pure Al. The strain-rate continually decreases to a
strain of about 0.2, where mechanical steady-state is achieved. The density of
dislocations not associated with subgrain boundaries is decreasing from a small
strain after loading (<0.01) to steady-state. This constant-stress trend with the
‘‘free’’ dislocation density is consistent with early etch pit analysis of Fe-3% Si [162],
and the TEM analysis 304 stainless steel [163], a-Fe [164] and Al [165,166]. Some
have suggested that the decrease in dislocation density in association with hardening
is evidence that hardening cannot be associated with dislocations and is undisputed
proof that subgrains influence the rate of plastic deformation [81]. However, as will
be discussed later, this may not be accurate. Basically, Kassner [107,149] suggested
that for constant-stress transients, the network dislocations cause hardening but the
fraction of mobile dislocations may decrease, leading to strain-rate decreases not
necessarily associated with subgrain formation. Figure 26 plots the average Subgrain
size only in areas of grains that contain subgrains. The volume of Al 5at.% Zn is not
completely filled with subgrains until steady-state, at effi 0.2. Thus, the Subgrain size
averaged over the entire volume would show a more substantial decrease during
primary creep. The average spacing, d, of dislocations that comprises subgrain walls
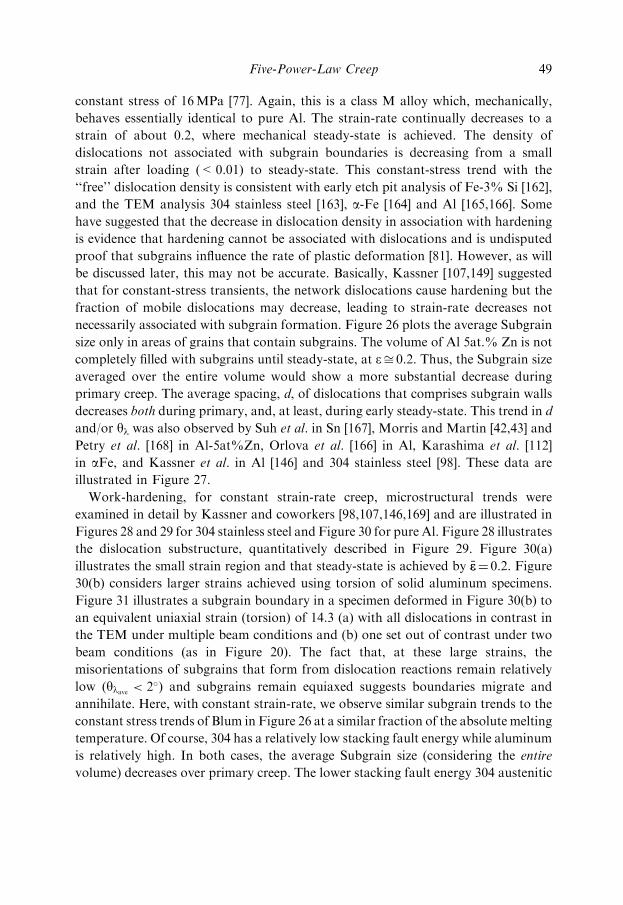
decreases both during primary, and, at least, during early steady-state. This trend in d
and/or yl was also observed by Suh et al. in Sn [167], Morris and Martin [42,43] and
Petry et al. [168] in Al-5at%Zn, Orlova et al. [166] in Al, Karashima et al. [112]
in aFe, and Kassner et al. in Al [146] and 304 stainless steel [98]. These data are
illustrated in Figure 27.
Work-hardening, for constant strain-rate creep, microstructural trends were
examined in detail by Kassner and coworkers [98,107,146,169] and are illustrated in
Figures 28 and 29 for 304 stainless steel and Figure 30 for pure Al. Figure 28 illustrates
the dislocation substructure, quantitatively described in Figure 29. Figure 30(a)
illustrates the small strain region and that steady-state is achieved by �ee¼ 0.2. Figure
30(b) considers larger strains achieved using torsion of solid aluminum specimens.
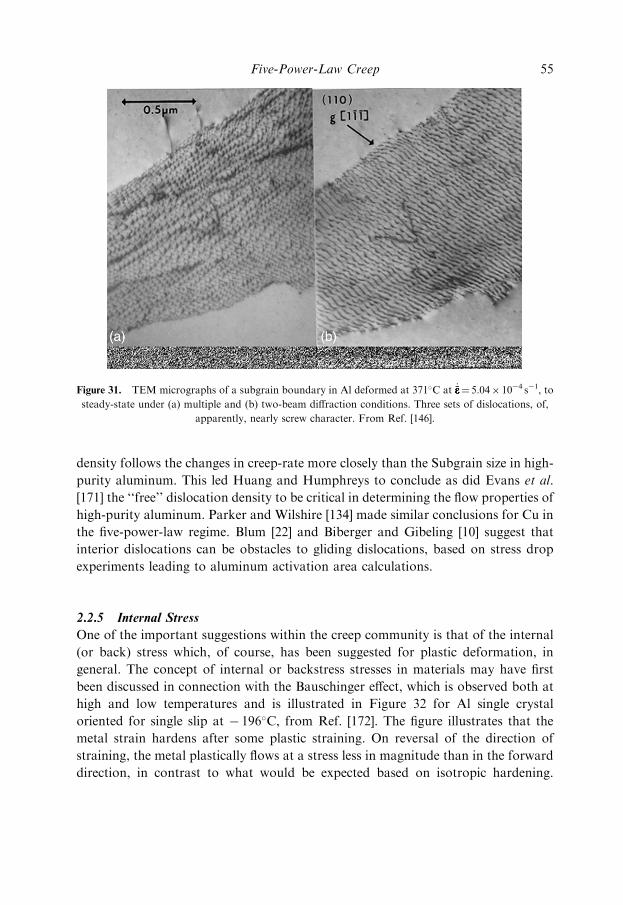
Figure 31 illustrates a subgrain boundary in a specimen deformed in Figure 30(b) to
an equivalent uniaxial strain (torsion) of 14.3 (a) with all dislocations in contrast in
the TEM under multiple beam conditions and (b) one set out of contrast under two
beam conditions (as in Figure 20). The fact that, at these large strains, the
misorientations of subgrains that form from dislocation reactions remain relatively
low ðylave < 2�Þ and subgrains remain equiaxed suggests boundaries migrate and
annihilate. Here, with constant strain-rate, we observe similar subgrain trends to the
constant stress trends of Blum in Figure 26 at a similar fraction of the absolute melting
temperature. Of course, 304 has a relatively low stacking fault energy while aluminum
is relatively high. In both cases, the average Subgrain size (considering the entire
volume) decreases over primary creep. The lower stacking fault energy 304 austenitic
Five-Power-Law Creep 49
stainless steel, however, requires substantially more primary creep strain (0.4 vs. 0.2)
to achieve steady-state at a comparable fraction of the melting temperature. It is
possible that the Subgrain size in 304 stainless steel continues to decrease during
steady-state. Under constant strain-rate conditions, the density of dislocations not
associated with subgrain boundaries monotonically increases with increased flow
stress for both austenitic stainless steel and high-purity aluminum. This is opposite
to constant-stress trends. Similar to the constant-stress trends, both pure Al and
304 stainless steel show decreasing d (increasing y) during primary and ‘‘early’’
steady-state creep. Measurements of ‘‘d ’’ were considered unreliable at strains
beyond 0.6 in Al and only misorientation angles are reported in Figure 30(b).
[It should be mentioned that HABs form by elongation of the starting grains
through geometric dynamic recrystallization, but these are not included in Figure
30(b). This mechanism is discussed in greater detail in a later section.]
Figure 27. The variation of the average misorientation angle across subgrain walls, ylave , and separation
of dislocations comprising subgrain walls with fraction of strain required to achieve steady-state, e/ess forvarious metals and alloys. y�l,ave and d* are values at the onset of steady-state.
50 Fundamentals of Creep in Metals and Alloys
2.2.4 Creep Transient Experiments
As mentioned earlier, Creep transient experiments have been performed by several
investigators [127,129,170] on high- and commercial-purity aluminum, where a
steady-state is achieved at a fixed stress/strain-rate followed by a change in the stress/
strain-rate. The strain-rate/stress change is followed by a creep ‘‘transient,’’ which
leads to a new steady-state with, presumably, the characteristic dislocation
substructure associated with an uninterrupted test at the (new) stress/strain-rate.
These investigators measured the Subgrain size during the transient and subsequent
mechanical steady-state, particularly following a drop in stress/strain-rate. Although
Ferriera and Stang [127] found, using less reliable polarized light optical
metallography (POM), that changes in l in Al correlate with changes in _ee followinga stress-drop, Huang and Humphreys [129] and Langdon et al. [170] found the
opposite using TEM; the l continued to change even once a new mechanical steady-
state was reached. Huang and Humphreys [129] and Langdon et al. [170] showed
that the dislocation microstructure changes with a stress drop, but the dislocation
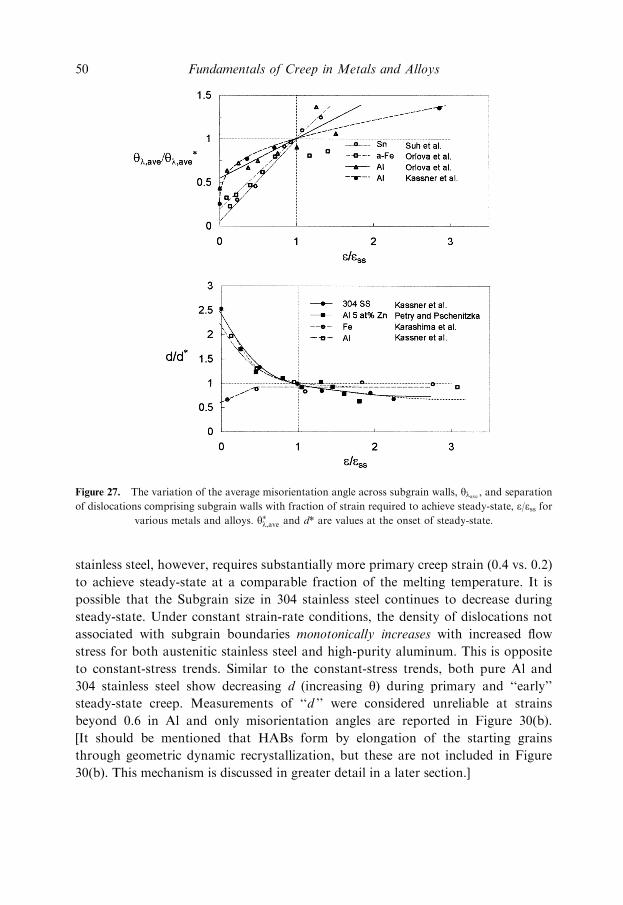
Figure 28. TEM micrographs illustrating the evolution of the dislocation substructure during primary
creep of AISI 304 stainless steel torsionally deformed at 865�C at _�ee�ee¼ 3.2� 10�5 s�1, to strains of 0.027 (a),
0.15 (b), 0.30 (c), and 0.38 (d).
Five-Power-Law Creep 51
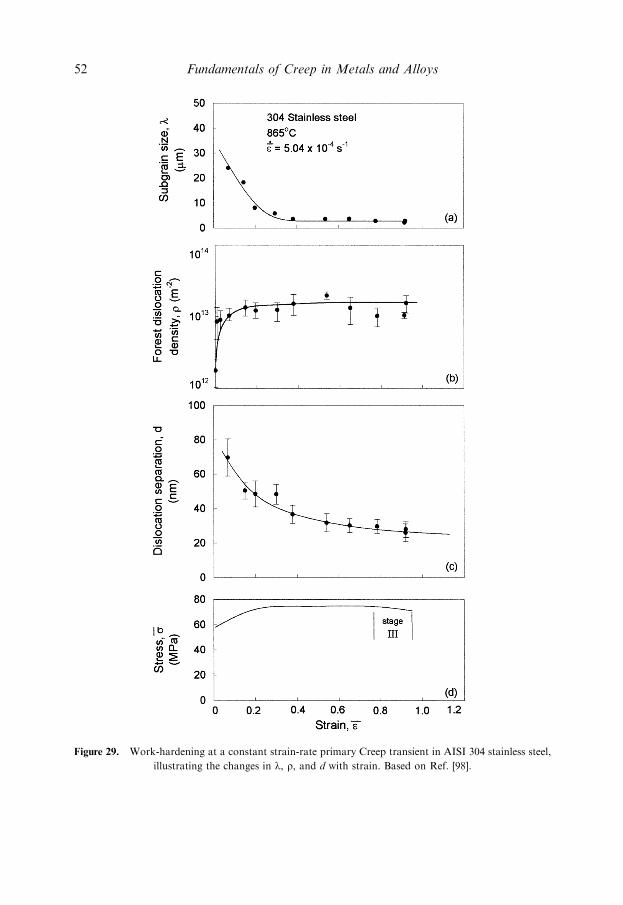
Figure 29. Work-hardening at a constant strain-rate primary Creep transient in AISI 304 stainless steel,
illustrating the changes in l, r, and d with strain. Based on Ref. [98].
52 Fundamentals of Creep in Metals and Alloys
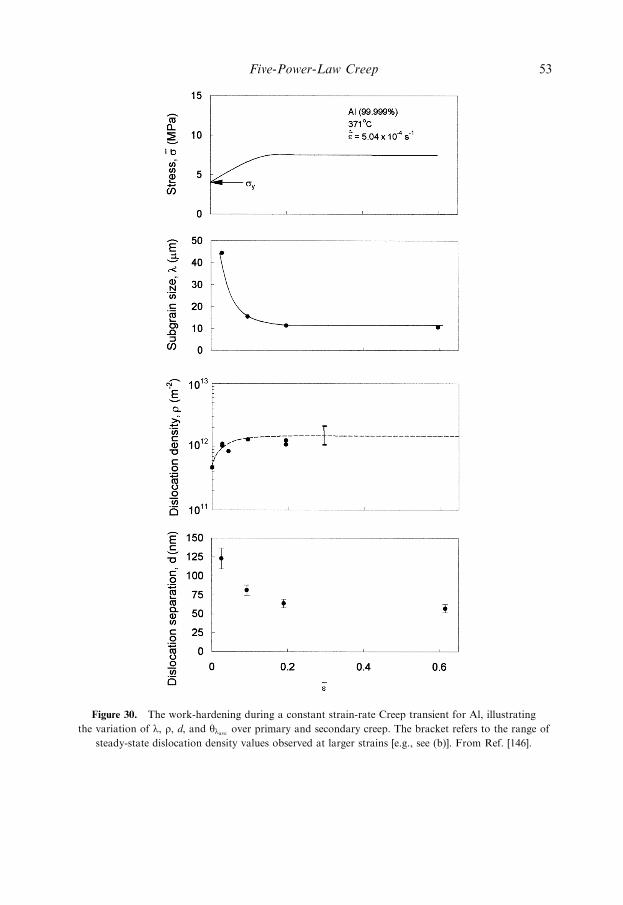
Figure 30. The work-hardening during a constant strain-rate Creep transient for Al, illustrating
the variation of l, r, d, and ylave over primary and secondary creep. The bracket refers to the range of
steady-state dislocation density values observed at larger strains [e.g., see (b)]. From Ref. [146].
Five-Power-Law Creep 53
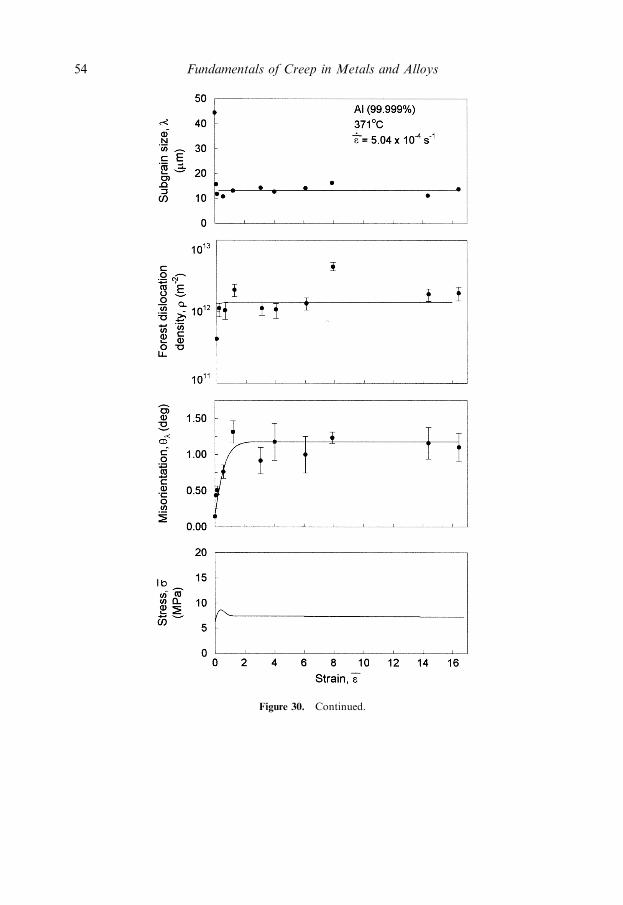
Figure 30. Continued.
54 Fundamentals of Creep in Metals and Alloys
density follows the changes in creep-rate more closely than the Subgrain size in high-
purity aluminum. This led Huang and Humphreys to conclude as did Evans et al.
[171] the ‘‘free’’ dislocation density to be critical in determining the flow properties of
high-purity aluminum. Parker and Wilshire [134] made similar conclusions for Cu in
the five-power-law regime. Blum [22] and Biberger and Gibeling [10] suggest that
interior dislocations can be obstacles to gliding dislocations, based on stress drop
experiments leading to aluminum activation area calculations.
2.2.5 Internal Stress
One of the important suggestions within the creep community is that of the internal
(or back) stress which, of course, has been suggested for plastic deformation, in
general. The concept of internal or backstress stresses in materials may have first
been discussed in connection with the Bauschinger effect, which is observed both at
high and low temperatures and is illustrated in Figure 32 for Al single crystal
oriented for single slip at � 196�C, from Ref. [172]. The figure illustrates that the
metal strain hardens after some plastic straining. On reversal of the direction of
straining, the metal plastically flows at a stress less in magnitude than in the forward
direction, in contrast to what would be expected based on isotropic hardening.
Figure 31. TEM micrographs of a subgrain boundary in Al deformed at 371�C at _�ee�ee¼ 5.04� 10�4 s�1, to
steady-state under (a) multiple and (b) two-beam diffraction conditions. Three sets of dislocations, of,
apparently, nearly screw character. From Ref. [146].
Five-Power-Law Creep 55
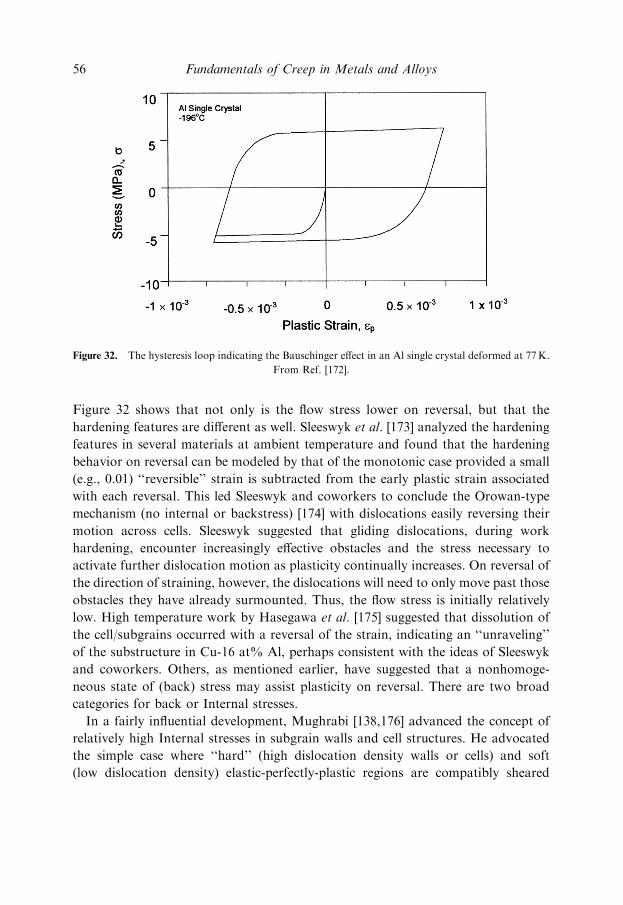
Figure 32 shows that not only is the flow stress lower on reversal, but that the
hardening features are different as well. Sleeswyk et al. [173] analyzed the hardening
features in several materials at ambient temperature and found that the hardening
behavior on reversal can be modeled by that of the monotonic case provided a small
(e.g., 0.01) ‘‘reversible’’ strain is subtracted from the early plastic strain associated
with each reversal. This led Sleeswyk and coworkers to conclude the Orowan-type
mechanism (no internal or backstress) [174] with dislocations easily reversing their
motion across cells. Sleeswyk suggested that gliding dislocations, during work
hardening, encounter increasingly effective obstacles and the stress necessary to
activate further dislocation motion as plasticity continually increases. On reversal of
the direction of straining, however, the dislocations will need to only move past those
obstacles they have already surmounted. Thus, the flow stress is initially relatively
low. High temperature work by Hasegawa et al. [175] suggested that dissolution of
the cell/subgrains occurred with a reversal of the strain, indicating an ‘‘unraveling’’
of the substructure in Cu-16 at% Al, perhaps consistent with the ideas of Sleeswyk
and coworkers. Others, as mentioned earlier, have suggested that a nonhomoge-
neous state of (back) stress may assist plasticity on reversal. There are two broad
categories for back or Internal stresses.
In a fairly influential development, Mughrabi [138,176] advanced the concept of
relatively high Internal stresses in subgrain walls and cell structures. He advocated
the simple case where ‘‘hard’’ (high dislocation density walls or cells) and soft
(low dislocation density) elastic-perfectly-plastic regions are compatibly sheared
Figure 32. The hysteresis loop indicating the Bauschinger effect in an Al single crystal deformed at 77K.
From Ref. [172].
56 Fundamentals of Creep in Metals and Alloys
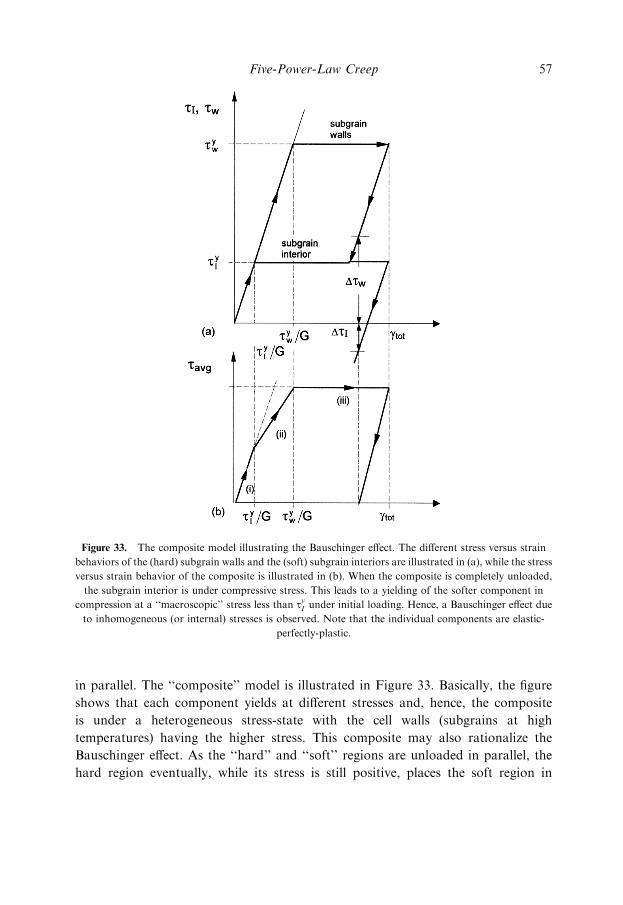
in parallel. The ‘‘composite’’ model is illustrated in Figure 33. Basically, the figure
shows that each component yields at different stresses and, hence, the composite
is under a heterogeneous stress-state with the cell walls (subgrains at high
temperatures) having the higher stress. This composite may also rationalize the
Bauschinger effect. As the ‘‘hard’’ and ‘‘soft’’ regions are unloaded in parallel, the
hard region eventually, while its stress is still positive, places the soft region in
Figure 33. The composite model illustrating the Bauschinger effect. The different stress versus strain
behaviors of the (hard) subgrain walls and the (soft) subgrain interiors are illustrated in (a), while the stress
versus strain behavior of the composite is illustrated in (b). When the composite is completely unloaded,
the subgrain interior is under compressive stress. This leads to a yielding of the softer component in
compression at a ‘‘macroscopic’’ stress less than tyI under initial loading. Hence, a Bauschinger effect due
to inhomogeneous (or internal) stresses is observed. Note that the individual components are elastic-
perfectly-plastic.
Five-Power-Law Creep 57
compression. Figure 30 indicates that when the ‘‘total’’ or ‘‘average’’ stress is zero,
the stress in the hard region is positive, while negative in the soft region. Thus, a
Bauschinger effect can be observed, where plasticity occurs on reversal at a lower
‘‘average’’ magnitude of stress than that on initial unloading. This leads to an
interpretation of an inhomogeneous stress-state and ‘‘back-stresses.’’ As will be
discussed subsequently, this ‘‘composite’’ model appears to have been embraced by
Derby and Ashby [177], Blum and coworkers [122,136,178], as well as others for
five-power-law creep.
In situ deformation experiments by Lepinoux and Kubin [179] and the well-known
neutron irradiation experiments by Mughrabi [138] find evidence for such Internal
stresses that are, roughly, a factor of 3 higher than the applied stress. These are based
on dislocation curvature measurements that assume fairly precise measurement
of elastic strain energy of a dislocation and that dislocation configurations are in
equilibrium, neither of which are satisfied.
More recent in situ reversed deformation experiments by Kassner and coworkers
(as well as other experiments), however, suggest that this conclusion may not be
firm [180].
Morris and Martin [42,43] concluded that dislocations are ejected from sources at
the subgrain boundary by high local stresses. High local stresses, perhaps a factor
of 20 higher than the applied stress, were concluded by observing the radius of
curvature of ‘‘ejecting dislocations’’ ‘‘frozen in place’’ (amazingly) by a precipitation
reaction in Al-5at%Zn on cooling from the creep temperature. As mentioned
earlier, stress-dip tests have often been interpreted to suggest Internal stresses
[112,115,116,135].
Another concept of backstress is related to dislocation configurations. This
suggestion was proposed by Argon and Takeuchi [137], and subsequently adopted
by Gibeling and Nix [117] and Nix and Ilschner [26]. With this model, the subgrain
boundaries that form from dislocation reaction, bow under action of the shear stress
and this creates relatively high local stresses. The high stresses in the vicinity of the
boundary are suggested to be roughly a factor of 3 larger than the applied stress.
On unloading, a negative stress in the subgrain interior causes reverse plasticity
(or anelasticity). There is a modest anelastic back-strain that is associated with this
backstress that is illustrated in Figure 24.
One of the most recent developments in this area of Internal stresses in creep-
deformed metals was presented by Straub and coworkers [136] and Borbely and
coworkers [181]. This work consisted of X-ray diffraction (XRD) and convergent
beam electron diffraction (CBED) of specimens creep tested to steady-state. Some
X-ray creep-experiments were performed in situ or under stress. The CBED was
performed at �196�C on unstressed thin (TEM) foils. Basically, both sets of
experiments are interpreted by the investigators to suggest that the lattice parameters
58 Fundamentals of Creep in Metals and Alloys
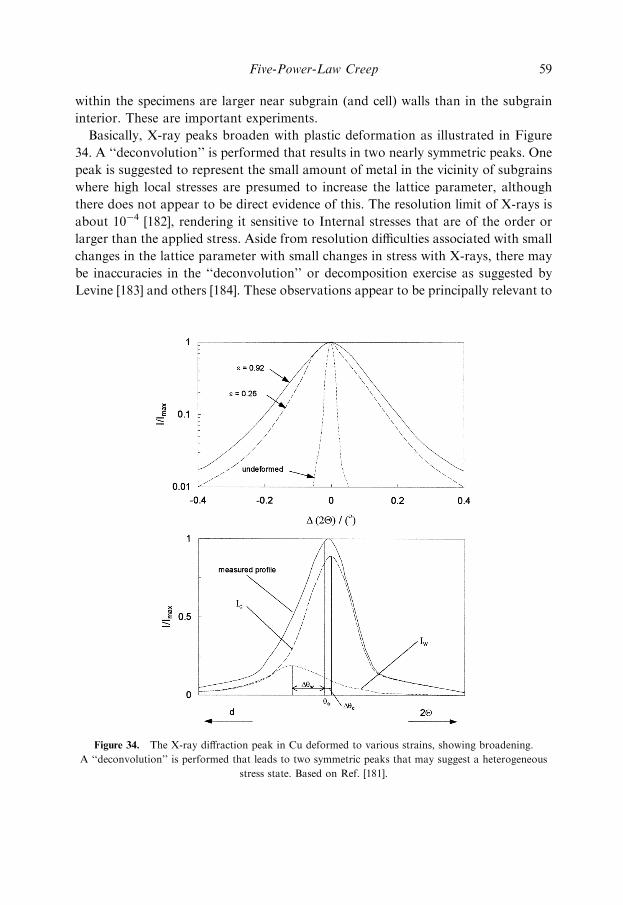
within the specimens are larger near subgrain (and cell) walls than in the subgrain
interior. These are important experiments.
Basically, X-ray peaks broaden with plastic deformation as illustrated in Figure
34. A ‘‘deconvolution’’ is performed that results in two nearly symmetric peaks. One
peak is suggested to represent the small amount of metal in the vicinity of subgrains
where high local stresses are presumed to increase the lattice parameter, although
there does not appear to be direct evidence of this. The resolution limit of X-rays is
about 10�4 [182], rendering it sensitive to Internal stresses that are of the order or
larger than the applied stress. Aside from resolution difficulties associated with small
changes in the lattice parameter with small changes in stress with X-rays, there may
be inaccuracies in the ‘‘deconvolution’’ or decomposition exercise as suggested by
Levine [183] and others [184]. These observations appear to be principally relevant to
Figure 34. The X-ray diffraction peak in Cu deformed to various strains, showing broadening.
A ‘‘deconvolution’’ is performed that leads to two symmetric peaks that may suggest a heterogeneous
stress state. Based on Ref. [181].
Five-Power-Law Creep 59
Cu, with other materials, such as Al, not generally evincing such asymmetry. CBED
can probe smaller areas with a 20 nm beam size rather than the entire sample as with
X-rays and is potentially more accurate. However, the results by Borbely et al. that
suggest high local stresses in the vicinity of subgrain boundaries in copper, based on
CBED, may be speculative. The results in Figure 3 of Ref. [181] are ambiguous.
Of course, there is always the limitation with performing diffraction experiments in
unloaded specimens, as any stress heterogeneities may relax before the diffraction
experiments are completed. Performing a larger number CBED on foils under load
would, although difficult, have been preferable. Recent CBED experiments by
Kassner et al. [185,186] on cyclically deformed Cu and unloaded Al single crystals
deformed at a temperature/strain-rate regime similar to Figure 30 did not detect the
presence of any residual stresses in the vicinity of dislocation heterogeneities.
The importance of the backstress concept also appears within the phenomen-
ological equations where the applied stress is decomposed. Nix and Ilschner [26]
attempted to rationalize power-law breakdown by suggesting that the backstress is
a decreasing fraction of the applied stress with decreasing temperature, particu-
larly below about 0.5 Tm. The decreasing fraction of backstress was attributed to
less-defined subgrains (cell walls) at decreasing stress leading to a dominating
contribution by a glide-controlled mechanism. However, it is now well established
that well-defined subgrains form with sufficient strain even at very low temperatures
[11,12,47].
2.3 RATE-CONTROLLING MECHANISMS
2.3.1 Introduction
The mechanism for plastic flow for Five-Power-Law Creep is generally accepted to be
diffusion controlled. Evidence in addition to the activation energy being essentially
equal to that of lattice self diffusion includes Sherby andWeertman’s analysis showing
that the activation volume for creep is also equal to that of self-diffusion [5]. More
recent elegant experiments by Campbell et al. [40] showed that impurity additions that
alter the self diffusivity also correspondingly affect the creep-rate. However, an
established theory for five-power-law creep is not available although there have been
numerous attempts to develop a fundamental mathematical description based on
dislocation-climb control. This section discusses some selected attempts.
a. Weertman [25,187–189]. This was one of the early attempts to fundamentally
describe creep by dislocation climb. Here, the creep process consists of glide of
dislocations across relatively large distances, �xxg, followed by climb at the rate-
controlling velocity, vc, over a distance, �xxc. The dislocations climb and annihilate at
60 Fundamentals of Creep in Metals and Alloys
a rate predictable by a concentration gradient established between the equilibrium
vacancy concentration,
cv ¼ c0 expð�Qv=kT Þ ð35Þ
and the concentration near the climbing dislocation.
The formation energy for a vacancy, QV, is altered in the vicinity of a dislocation
in a solid under an applied stress, s, due to work resulting from climb,
cdv ¼ c0expð�Qv=kT Þ expð�s�=kTÞ ð36Þ
where � is the atomic volume. Again, the (steady-state) flux of vacancies determines
the climb velocity,
vc ffi 2pD
b
� �ðs�=kT Þ‘nðR0=bÞ ð37Þ
where R0 is the diffusion distance, related to the spacing of dislocations [Weertman
suggests r nR0/bffi 3 rn 10].
Weertman approximates the average dislocation velocity, �vv,
�vv ffi vc �xxg= �xxc ð38Þ
_eess ¼ rmb �vv ð39Þ
Weertman assumes
rm ffisss
Gb
� �2ð40Þ
Weertman appears to suggest that the density of dislocations rffi rm and
dislocation interaction suggests that rm should scale with sss by equation (40).
This is also analogous to the phenomenological equation (19), leading to
_eess ¼ K6Dsd
b2ðG�=kT Þ
�xxg�xxc
� �sG
� �3ð41Þ
the classic ‘‘natural’’ or Three-Power-Law equation.
b. Barrett and Nix [190]. Several investigators considered Five-Power-Law Creep
as controlled by the non-conservative (climb) motion of (edge) jogs of screw
dislocations [112,190,191]. The models appear similar to the earlier description by
Five-Power-Law Creep 61
Weertman, in that climb motion controls the average dislocation velocity and that
the velocity is dictated by a vacancy flux. The flux is determined by the diffusivity
and the concentration gradient established by climbing jogs.
The model by Barrett and Nix [190] is reviewed as representative of these models.
Here, similar to the previous equation (39),
_ggss ¼ rms �vvb ð42Þ
where _ggss is the steady-state (shear) creep-rate from screws with dragging jogs and
rms is the density of mobile screw dislocations.
For a vacancy producing jog in a screw segment of length, j, the chemical dragging
force on the jog is:
f p ¼kT
b‘n
cp
cvð43Þ
where cp is the concentration of vacancies in the vicinity of the jogs. The jog is
considered a moving point source for vacancies, and it is possible to express cp as a
function of Dv, and the velocity of the jog, vp,
c�p � cv ¼vp
4pDvb2ð44Þ
where c�p is the steady-state vacancy concentration near the jog. Substitution of (44)
into (43) leads to
fp ¼kT
b‘n 1þ
vp
4pDvb2cv
� �ð45Þ
and with tbj¼ fp.
vp ¼ 4pDvb2cv exp
tb2jkT
� �� 1
� �ð46Þ
Of course, both vacancy producing and vacancy absorbing jogs are present but, for
convenience, the former is considered and substituting (46) into (42) yields
_ggss ¼ 4pDb2b
a0
� �rms exp
tb2jkT
� �� 1
� �ð47Þ
where a0 is the lattice parameter.
62 Fundamentals of Creep in Metals and Alloys
Barrett and Nix suggest that rms¼A8s3 (rather than r / s2) and _ggssffiA9t
4 is
obtained. One difficulty with the theory [equation (47)] is that all (at least screw)
dislocations are considered mobile. With stress drops, the strain rate is predicted to
decrease, as observed. However, rms is also expected to drop (with decreasing rss)with time and a further decrease in _ggss is predicted, despite the observation that _gg(and _ggss) increases.
c. Ivanov and Yanushkevich [192]. These investigators were among the first to
explicitly incorporate subgrain boundaries into a fundamental climb-control theory.
This model is widely referenced. However, the described model (after translation) is
less than very lucid, and other reviews of this theory [187] do not provide substantial
help in clarifying all the details of the theory.
Basically, the investigators suggest that there are dislocation sources within
the subgrain and that the emitted dislocations are obstructed by subgrain walls.
The emitted dislocations experience the stress fields of boundary and other emitted
dislocations. Subsequent slip or emission of dislocations requires annihilation of the
emitted dislocations at the subgrain wall, which is climb controlled. The annihilating
dislocations are separated by a mean height,
�hhm ¼ k3Gb
tð48Þ
where the height is determined by equating a calculated ‘‘backstress’’ to the applied
stress, t. The creep-rate
_eess ¼l2b �vvr0m
�hhmð49Þ
where r0m¼ 1/ �hhml2; where r0m is the number of dislocation loops per unit volume.
The average dislocation velocity
�vv ¼ k4Dvb2 expðtb3=kT � 1Þ ð50Þ
similar to Weertman’s previous analysis. This yields,
_eess ¼k5DsdbG
kT
tG
� �3ð51Þ
In this case, the third power is a result of the inverse dependence of the climb
distance on the applied stress. Modifications to the model have been presented by
Nix and Ilschner, Blum and Weertman [26,193–195].
Five-Power-Law Creep 63
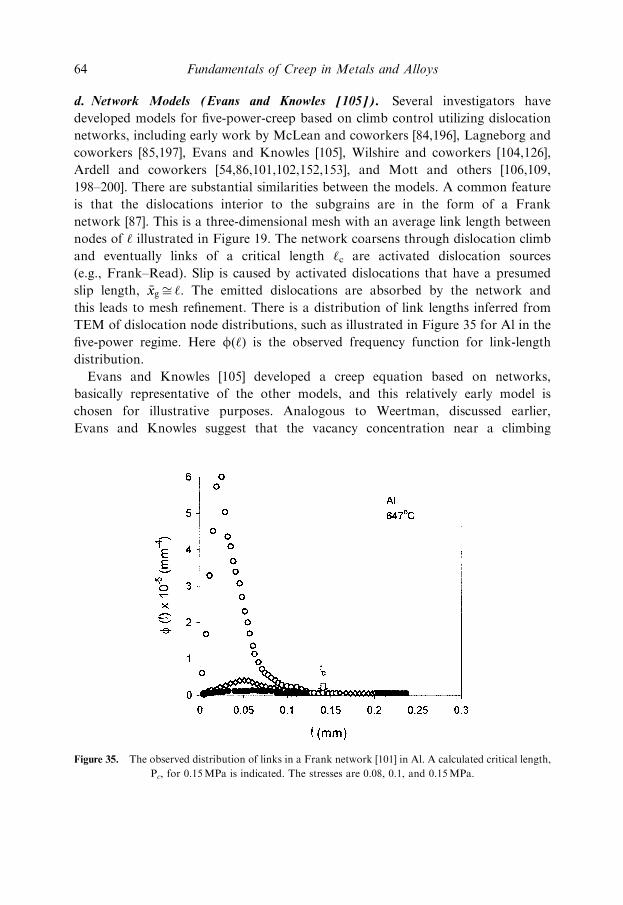
d. Network Models (Evans and Knowles [105]). Several investigators have
developed models for five-power-creep based on climb control utilizing dislocation
networks, including early work by McLean and coworkers [84,196], Lagneborg and
coworkers [85,197], Evans and Knowles [105], Wilshire and coworkers [104,126],
Ardell and coworkers [54,86,101,102,152,153], and Mott and others [106,109,
198–200]. There are substantial similarities between the models. A common feature
is that the dislocations interior to the subgrains are in the form of a Frank
network [87]. This is a three-dimensional mesh with an average link length between
nodes of ‘ illustrated in Figure 19. The network coarsens through dislocation climb
and eventually links of a critical length ‘c are activated dislocation sources
(e.g., Frank–Read). Slip is caused by activated dislocations that have a presumed
slip length, �xxgffi ‘. The emitted dislocations are absorbed by the network and
this leads to mesh refinement. There is a distribution of link lengths inferred from
TEM of dislocation node distributions, such as illustrated in Figure 35 for Al in the
five-power regime. Here f(‘) is the observed frequency function for link-length
distribution.
Evans and Knowles [105] developed a creep equation based on networks,
basically representative of the other models, and this relatively early model is
chosen for illustrative purposes. Analogous to Weertman, discussed earlier,
Evans and Knowles suggest that the vacancy concentration near a climbing
Figure 35. The observed distribution of links in a Frank network [101] in Al. A calculated critical length,
Pc, for 0.15MPa is indicated. The stresses are 0.08, 0.1, and 0.15MPa.
64 Fundamentals of Creep in Metals and Alloys
node or dislocation is
cDv ¼ cv expF�
bkT
� �ð52Þ
They show that the climb rate of nodes is faster than that of the links and the links
are, therefore, controlling. A flux of vacancies leads to a climb velocity
vv‘ ¼2pDFb
kT ‘n ‘=2bð Þð53Þ
very similar to that of Weertman’s analysis where, here, F is the total force per unit
length of dislocation favoring climb. Three forces are suggested to influence the total
force F; the climb force due to the applied stress (sb/2), elastic interaction forces
from other links (Gb2 /2p(1� n)‘), and a line tension (ffi Gb2 /‘) due to the fact that
with coarsening, the total elastic strain-energy decreases. This leads to the equation
for creep-rate utilizing the usual equation (‘¼ aGb/s) and assuming that the
contribution of dislocation pipe diffusion is not important,
_eess ¼4:2
ffiffiffi3p
s3ssb
a22G2kT
Dsd
‘nða2G=2sÞ
� �1þ
2
a21þ
1
2p 1� nð Þ
� �� �ð54Þ
This suggests about 3-power behavior. The dislocation line is treated as an ideal
vacancy source rather than each jog.
e. Recovery-Based Models. One shortcoming of the previously discussed models is
that a recovery aspect is not included, in detail. It has been argued by many (e.g.,
[81,201]) that steady-state, for example, reflects a balance between dislocation
hardening processes, suggested to include strain-driven network refinements,
subgrain-size refinement or subgrain-boundary mesh-size refinement, and thermally
activated softening processes that result in coarsening of the latter features.
Maruyama et al. [202] attempted to determine the microstructural feature
associated with the rate-controlling (climb) process for creep by examining the
hardening and recovery rates during transients in connection with the Bailey–
Orowan [203,204] equation,
_eess ¼rr
hrð55Þ
where rr¼ ds/dt is the recovery rate and hr¼ ds/de is the hardening rate.
The recovery rates in several single phase metals and alloys were estimated by
stress reduction tests, while work hardening rates were calculated based on the
Five-Power-Law Creep 65
observed network dislocation densities within the subgrains and the average
dislocation separation within the subgrain walls, d. Determinations of _eess were
made as a function of sss. The predictions of equation (35) were inconclusive in
determining whether a subgrain wall or network hardening basis was more
reasonable, although a somewhat better description was evident with the former.
More recently, Daehn et al. [205,206] attempted to formulate a more basic
objective of rationalizing the most general phenomenology such as five-power-law
behavior, which has not been successfully explained. Hardening rates (changes in the
[network] dislocation density) are based on experimentally determined changes in
r with strain at low temperatures,
rtþdt ¼ rt þMrrro
� �c
_ggdt ð56Þ
where Mr is the dislocation breeding constant, and c and ro are constants. Refine-
ment is described by the changes in a substructural length-scale ‘0 (r, d, or l) by,
d‘0
dt¼ �
Mr ð‘0oÞ
2cð‘Þ3�2c
2g02
� �_gg ð57Þ
where ‘0o is presumably a reference length scale, and g0 is a constant.
The flow stress is vaguely related to the substructure by
t ¼kk
b‘0ð58Þ
Daehn et al. note that if network strengthening is relevant, the above equation
should reduce to the Taylor equation although it is unclear that this group is really
including equation (29), or an ‘‘athermal’’ dislocation relationship without a s0 term.
Coarsening is assumed to be independent of concurrent plastic flow and diffusion
controlled
dð‘0Þmc ¼ KDdt ð59Þ
where mc and K are constants and D is the diffusivity. Constants are based on
microstructural coarsening observations at steady-state, refinement and coarsening
are equal and the authors suggest that
_gg ¼ BDtG
� �nð60Þ
results with n¼ 4–6.
66 Fundamentals of Creep in Metals and Alloys
This approach to understanding five-power behavior does seem particularly
attractive and can, potentially, allow descriptions of primary and transient creep.
2.3.2 Dislocation Microstructure and the Rate-Controlling Mechanism
Consistent with the earlier discussion, the details by which the dislocation climb-
control which is, of course, diffusion controlled, is specifically related to the creep-
rate, are not clear. The existing theories (some prominent models discussed earlier)
basically fall within two broad categories: (a) those that rely on the heterogeneous
dislocation substructure (i.e., the subgrain boundaries) and, (b) those that rely on the
more uniform Frank dislocation network (not associated with dislocation hetero-
geneities such as cells or subgrain walls).
a. Subgrains. The way by which investigators rely upon the former approach
varies but, basically, theories that rely on the dislocation heterogeneities believe that
one or more of the following are relevant:
(a) The subgrain boundaries are obstacles for gliding dislocations, perhaps
analogous to suggestions for high angle grain boundaries in a (e.g., annealed)
polycrystal described by the Hall–Petch relation. In this case, the misorientation
across the subgrain boundaries, which is related to the spacing of the dislocations
that constitute the boundaries, has been suggested to determine the effectiveness of
the boundary as an obstacle [207]. [One complication with this line of reasoning is
that it now appears well established that, although these features may be obstacles,
the mechanical behavior of metals and alloys during Five-Power-Law Creep appears
independent of the details of the dislocation spacing, d, or misorientation across
subgrain boundaries yl,ave as shown in Figure 27.]
(b) It has been suggested that the boundary is a source for Internal stresses, as
mentioned earlier. Argon et al. [137], Gibeling and Nix [117], Morris and Martin
[42,43], and Derby and Ashby [177] suggested that subgrain boundaries may bow
and give rise to an internal back stress that is the stress relevant to the rate-
controlling mechanism. Morris and Martin claim to have measured high local
stresses that were 10–20 times larger than the applied stress near Al-5at%Zn
subgrains formed within the five-power-law regime. Their stress calculations were
based on dislocation loop radii measurements. Many have suggested that subgrain
boundaries are important as they may be ‘‘hard’’ regions, such as, according to
Mughrabi [138], discussed earlier, extended to the case of creep by Blum and
coworkers in a series of articles (e.g., [136]). Basically, here, the subgrain wall is
considered three-dimensional with a high-yield stress compared to the subgrain or
cell interior. Mughrabi originally suggested that there is elastic compatibility
between the subgrain wall and the matrix with parallel straining. This gives rise to a
Five-Power-Law Creep 67
high internal backstress or Internal stress. These investigators appear to suggest that
these elevated stresses are the relevant stress for the rate-controlling process (often
involving dislocation climb) for creep, usually presumed to be located in the vicinity
of subgrain walls.
(c) Others have suggested that the ejection of dislocations from the boundaries
is the critical step [42,43,202]. The parameter that is important here is basically the
spacing between the dislocations that comprise the boundary which is generally
related to the misorientation angle across the boundary. Some additionally suggest
that the relevant stress is not the applied stress, but the stress at the boundary which
may be high, as just discussed in (b) above.
(d) Similar to (a), it has been suggested that boundaries are important in that they
are obstacles for gliding dislocations (perhaps from a source within the subgrain)
and that, with accumulation at the boundary (e.g., a pile-up at the boundary), a
backstress is created that ‘‘shuts off ’’ the source which is only reactivated once the
number of dislocations within a given pile-up is diminished. It has been suggested
that this can be accomplished by climb and annihilation of dislocations at the same
subgrain boundary [26,192–195]. This is similar to the model discussed in Section
4.1.3. Some suggest that the local stress may be elevated as discussed in (b) above.
b. Dislocations. Others have suggested that the rate-controlling process for creep
plasticity is associated with the Frank dislocation network within the subgrains such
as discussed in 2(C)1(d). That is, the strength associated with creep is related to
the details (often, the density) of dislocations in the subgrain interior [54,84–86,
98,101,102,104–106,108–110,129,146,152,153,155,196–200,208]. One commonly
proposed mechanism by which the dislocation network is important is that
dislocation sources are the individual links of the network. As these bow, they can
become unstable, leading to Frank–Read sources, and plasticity ensues. The density
of links that can be activated sources depends on the link length distribution and,
thus, related to the density of dislocation line length within the subgrains. The
generated dislocation loops are absorbed by the network, leading to refinement or
decreasing P. The network also ‘‘naturally’’ coarsens at elevated temperature and
plasticity is activated as links reach the critically ‘‘long’’ segment length, Pc. Hence,
climb (self-diffusion) control is justified. Some of the proponents of the importance
of the interior dislocation-density have based their judgments on experimental
evidence that shows that creep-strength (resistance) is associated with higher
dislocation density and appears independent of the Subgrain size [110,129,141,153].
c. Theoretical Strength Equations. In view of the different microstructural features
(e.g., l, d, ylave , r, ‘c) that have been suggested to be associated with the strength or
68 Fundamentals of Creep in Metals and Alloys
rate-controlling process for Five-Power-Law Creep, it is probably worthwhile to
assess strength associated with different obstacles. These are calculable from simple
(perhaps simplistic) equations. The various models for the rate-controlling, or
strength-determining process, are listed below. Numerical calculations are based
on pure Al creep deforming as described in Figure 30.
(i) The network stress tN. Assuming a Frank network, the average link length, ‘
(assumed here to be uniformffi ‘c)
tN ffiGb
‘ð61Þ
Using typical aluminum values for Five-Power-Law Creep (e.g., P 1/ffiffiffiffiffiffirssp
)
tNffi 5MPa (fairly close to tssffi 7MPa for Al at the relevant rss).(ii) If the critical step is regarded as ejection of dislocations from the subgrain
boundary,
tB ffiGb
dð62Þ
tBffi 80MPa, much higher (by an order of magnitude or so) than the applied stress.
(iii) If subgrain boundaries are assumed to be simple tilt boundaries with a single
Burgers vector, an attractive or repulsive force will be exerted on a slip dislocation
approaching the boundary. The maximum stress
tbd ffi0:44Gb
2ð1� nÞdð63Þ
from Ref. [88] based on Ref. [209]. This predicts a stress of about tbd¼ 50MPa,
again, much larger than the observed applied stress.
(iv) For dragging jogs resulting from passing through a subgrain boundary,
assuming a spacing ffi jffi d,
tj ffiEj
b2jð64Þ
from Ref. [88]. For Al, Ej, the formation energy for a jog, ffi 1 eV [88] and
tjffi 45MPa, a factor 6–7 higher than the applied stress.
(v) The stress associated with the increase in dislocation line length (jog or kinks)
to pass a dislocation through a subgrain wall (assuming a wall dislocation spacing, d )
Five-Power-Law Creep 69
from above, is expected to be
tL ffiGb3
b2dffi
Gb
dffi 80 MPa ð65Þ
over an order of magnitude larger than the applied stress.
Thus, it appears that stresses associated with ejecting dislocations from, or passing
dislocations through subgrain walls, are typically 30–80MPa for Al within the five-
power-law regime. This is roughly an order of magnitude larger than the applied
stress. Based on the simplified assumptions, this disparity may not be considered
excessive and does not eliminate subgrain walls as important, despite the favorable
agreement between the network-based (using the average link length, P) strength and
the applied stress (Internal stresses not considered). These calculations indicate why
some subgrain-based strengthening models utilize elevated Internal stresses. It must
be mentioned that care must be exercised in utilizing the above, athermal, equations
for time-dependent plasticity. These equations do not consider other hardening
variables (solute, etc.) that may be a substantial fraction of the applied stress, even
in relatively pure metals. Thus, these very simple ‘‘theoretical’’ calculations do not
provide obvious insight into the microstructural feature associated with the rate
controlling process, although a slight preference for network-based models might
be argued as the applied stress best matches network predictions for dislocation
activation.
2.3.3 In situ and Microstructure-Manipulation Experiments
a. In Situ Experiments. In situ straining experiments, particularly those of Calliard
and Martin [95], are often referenced by the proponents of subgrain (or
heterogeneous dislocation arrangements) strengthening. Here thin foils (probably
less than 1 mm thick) were strained at ambient temperature (about 0.32 Tm). It was
concluded that the interior dislocations were not a significant obstacle for gliding
dislocations, rather, the subgrain boundaries were effective obstacles. This is an
important experiment, but is limited in two ways: first, it is of low temperature (i.e.,
ffi 0.32 Tm) and may not be relevant for the five-power-law regime and second, in thin
foils, such as these, as McLean mentioned [84] long ago, a Frank network is
disrupted as the foil thickness approaches ‘. Henderson–Brown and Hale [210]
performed in situ high-voltage transmission electron microscope (HVEM) creep
experiments on Al–1Mg (class M) at 300�C, in thicker foils. Dislocations were
obstructed by subgrain walls, although the experiments were not described in
substantial detail. As mentioned earlier, Mills [157] performed in situ deformation
on an Al–Mg alloy within the three-power or viscous-drag regime and subgrain
boundaries were not concluded as obstacles.
70 Fundamentals of Creep in Metals and Alloys
b. Prestraining experiments. Work by Kassner et al. [98,110,111], discussed earlier,
utilized ambient temperature prestraining of austenitic stainless steel to, first,
show that the elevated temperature strength was independent of the Subgrain size
and, second, that the influence of the dislocation density on strength was reasonably
predicted by the Taylor equation. Ajaja and Ardell [152,153] also performed
prestraining experiments on austenitic stainless steels and showed that the creep rate
was influenced only by the dislocation density. The prestrains led to elevated r,without subgrains, and ‘‘quasi’’ steady-state creep rates. Presumably, this prestrain
led to decreased average and critical link lengths in a Frank network. [Although,
eventually, a new ‘‘genuine’’ steady-state may be achieved [211], this may not occur
over the convenient strain/time ranges. Hence, the conclusion of a ‘‘steady-state’’
being independent of the prestrain may be, in some cases, ambiguous.]
Others, including Parker and Wilshire [212], have performed prestraining
experiments on Cu showing that ambient temperature prestrain (cold work) reduces
the elevated temperature creep rate at 410�C. This was attributed by the investigators
as due to the Frank network. Well-defined subgrains did not form; rather, cell
walls observed. A quantitative microstructural effect of the cold work was not clear.
2.3.4 Additional Comments on Network Strengthening
Previous work on stainless steel in Figure 25 showed that the density of dislocations
within the subgrain interior or the network dislocations influence the flow stress at a
given strain rate and temperature. The hardening in stainless stress is shown to be
consistent with the Taylor relation if a linear superposition of ‘‘lattice’’ hardening
(to, or the stress necessary to cause dislocation motion in the absence of a dislocation
substructure) and the dislocation hardening (aMGbr1/2) is assumed. The Taylor
equation also applies to pure aluminum (with a steady-state structure), having both a
much higher stacking fault energy than stainless steel and an absence of substantial
solute additions.
If both the phenomenological description of the influence of the strength of
dislocations in high-purity metals such as aluminum have the form of the Taylor
equation and also have the expected values for the constants, then it would appear
that the elevated temperature flow stress is actually provided by the ‘‘forest
dislocations’’ (Frank network).
Figure 21 illustrates the well-established trend between the steady-state dislocation
density and the steady-state stress. From this and from Figure 15, which plots
modulus-compensated steady-state stress versus diffusion-coefficient compensated
steady-state strain-rate, the steady-state flow stress can be predicted at a reference
strain-rate (e.g., 5� 10�4 s�1), at a variety of temperatures, with an associated
steady-state dislocation density. If equation (29) is valid for Al as for 304 stainless
Five-Power-Law Creep 71
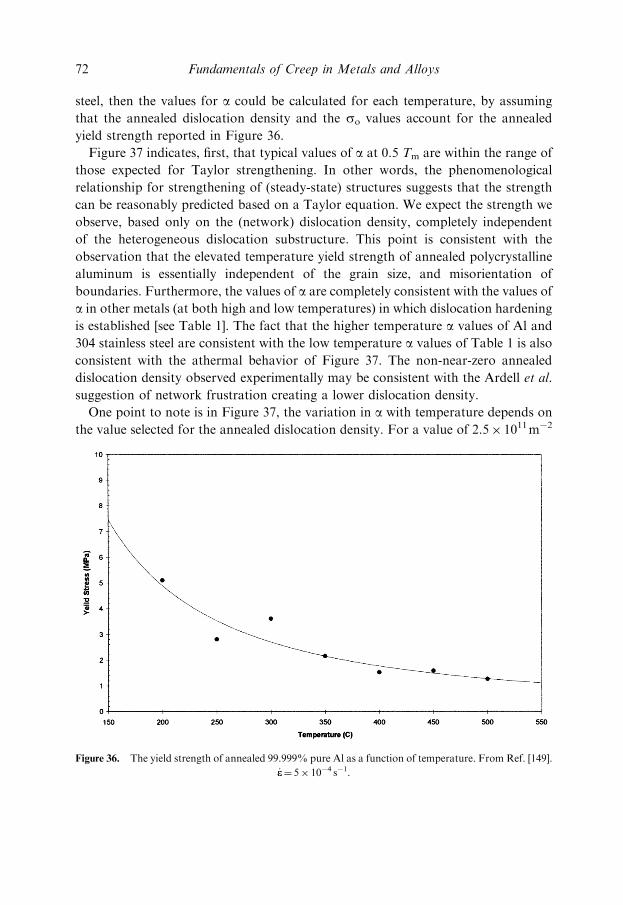
steel, then the values for a could be calculated for each temperature, by assuming
that the annealed dislocation density and the so values account for the annealed
yield strength reported in Figure 36.
Figure 37 indicates, first, that typical values of a at 0.5 Tm are within the range of
those expected for Taylor strengthening. In other words, the phenomenological
relationship for strengthening of (steady-state) structures suggests that the strength
can be reasonably predicted based on a Taylor equation. We expect the strength we
observe, based only on the (network) dislocation density, completely independent
of the heterogeneous dislocation substructure. This point is consistent with the
observation that the elevated temperature yield strength of annealed polycrystalline
aluminum is essentially independent of the grain size, and misorientation of
boundaries. Furthermore, the values of a are completely consistent with the values of
a in other metals (at both high and low temperatures) in which dislocation hardening
is established [see Table 1]. The fact that the higher temperature a values of Al and
304 stainless steel are consistent with the low temperature a values of Table 1 is also
consistent with the athermal behavior of Figure 37. The non-near-zero annealed
dislocation density observed experimentally may be consistent with the Ardell et al.
suggestion of network frustration creating a lower dislocation density.
One point to note is in Figure 37, the variation in a with temperature depends on
the value selected for the annealed dislocation density. For a value of 2.5� 1011m�2
Figure 36. The yield strength of annealed 99.999% pure Al as a function of temperature. From Ref. [149].
_ee¼ 5� 10�4 s�1.
72 Fundamentals of Creep in Metals and Alloys
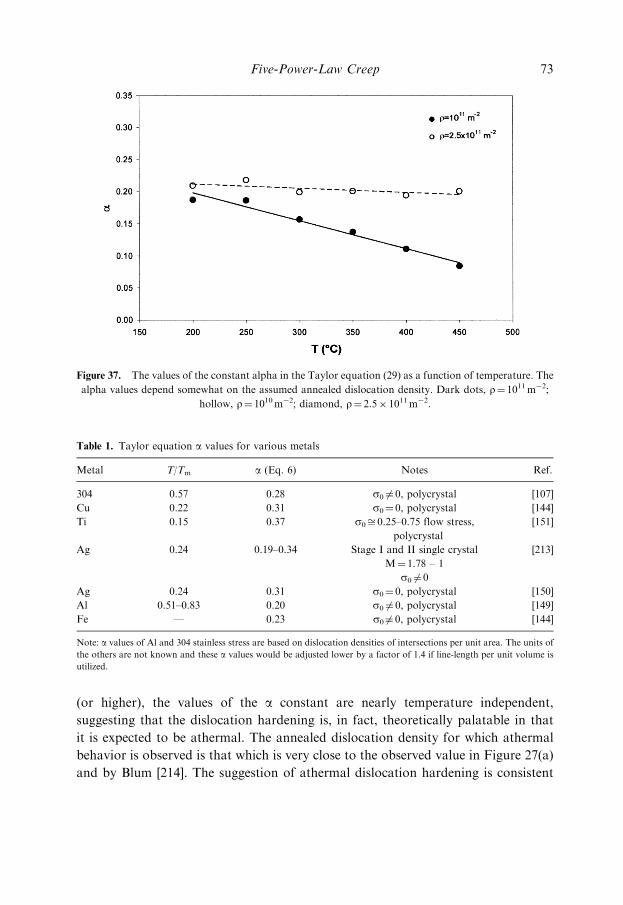
(or higher), the values of the a constant are nearly temperature independent,
suggesting that the dislocation hardening is, in fact, theoretically palatable in that
it is expected to be athermal. The annealed dislocation density for which athermal
behavior is observed is that which is very close to the observed value in Figure 27(a)
and by Blum [214]. The suggestion of athermal dislocation hardening is consistent
Figure 37. The values of the constant alpha in the Taylor equation (29) as a function of temperature. The
alpha values depend somewhat on the assumed annealed dislocation density. Dark dots, r¼ 1011m�2;
hollow, r¼ 1010m�2; diamond, r¼ 2.5� 1011m�2.
Table 1. Taylor equation a values for various metals
Metal T/Tm a (Eq. 6) Notes Ref.
304 0.57 0.28 s0 6¼ 0, polycrystal [107]
Cu 0.22 0.31 s0¼ 0, polycrystal [144]
Ti 0.15 0.37 s0ffi 0.25–0.75 flow stress,
polycrystal
[151]
Ag 0.24 0.19–0.34 Stage I and II single crystal [213]
M¼ 1.78 – 1
s0 6¼ 0
Ag 0.24 0.31 s0¼ 0, polycrystal [150]
Al 0.51–0.83 0.20 s0 6¼ 0, polycrystal [149]
Fe — 0.23 s0 6¼ 0, polycrystal [144]
Note: a values of Al and 304 stainless stress are based on dislocation densities of intersections per unit area. The units of
the others are not known and these a values would be adjusted lower by a factor of 1.4 if line-length per unit volume is
utilized.
Five-Power-Law Creep 73
with the model by Nes [215], where, as in the present case, the temperature
dependence of the constant (or fixed dislocation substructure) structure flow stress
is provided by the important temperature-dependent s0 term. It perhaps should be
mentioned that if it is assumed both that s0¼ 0 and that the dislocation hardening is
athermal [i.e., equation (19) is ‘‘universally’’ valid] then a is about equal to 0.53, or
about a factor of two larger than anticipated for dislocation hardening. Hence, apart
from not including a s0 term which allows temperature dependence, the alpha terms
appears somewhat large to allow athermal behavior.
The trends in dislocation density during primary creep have been less completely
investigated for the case of constant-strain-rate tests. Earlier work by Kassner et al.
[98,110,111] on 304 stainless steel found that at 0.57 Tm, the increase in flow stress
by a factor of three, associated with increases in dislocation density with strain, is
consistent with the Taylor equation. That is, the r versus strain and stress versus
strain give a s versus r that ‘‘falls’’ on the line of Figure 25. Similarly, the aluminum
primary transient in Figure 30(a) can also be shown consistent with the Taylor
equation. The dislocation density monotonically increases to the steady-state value
under constant strain-rate conditions.
Challenges to the proposition of Taylor hardening for Five-Power-Law Creep in
metals and Class M alloys include the microstructural observations during primary
creep under constant-stress conditions. For example, it has nearly always been
observed during primary creep of pure metals and Class M alloys that the density of
dislocations not associated with subgrain boundaries increases from the annealed
value to a peak value, but then gradually decreases to a steady-state value that is
between the annealed and the peak density [38,92,163–165] (e.g., Figure 26).
Typically, the peak value, rp, measured at a strain level that is roughly one-fourth of
the strain required to attain steady-state (ess/4), is a factor of 1.5–4 higher than the
steady-state rss value. It was believed by many to be difficult to rationalize hardening
by network dislocations if the overall density is decreasing while the strain-rate is
decreasing. Therefore, an important question is whether the Taylor hardening,
observed under constant strain-rate conditions, is consistent with this observation
[169]. This behavior could be interpreted as evidence for most of these dislocations
to have a dynamical role rather than a (Taylor) hardening role, since the initial
strain-rates in constant stress tests may require by the equation,
_ee ¼ ðb=MÞrmv ð66Þ
a high mobile (nonhardening) dislocation density, rm, that gives rise to high initial
values of total density of dislocations not associated with subgrain boundaries, r (v is
the dislocation velocity). As steady-state is achieved and the strain-rate decreases, so
does rm and in turn, r. [We can suggest that rhþ rm¼ r, where r is the total density
74 Fundamentals of Creep in Metals and Alloys
of dislocations not associated with subgrain boundaries and rh are those dislocationsthat at any instant are part of the Frank network and are not mobile.]
More specifically, Taylor hardening during primary (especially during constant
stress) creep may be valid based on the following argument.
From equation (66) _ee ¼ rmvb=M: We assume [216]
v ¼ k7s1 ð67Þ
and, therefore, for constant strain-rate tests,
_eess ¼ k7b=M½ �rms ð68Þ
In a constant strain-rate test at yielding ð_ee ¼ _eessÞ, ep (plastic strain) is small, and
there is only minor hardening, and the mobile dislocation density is a fraction f 0m of
the total density,
f 0mrðep¼0Þ ¼ rmðep¼0Þ
therefore, for aluminum (see Figure 30a)
rmðep¼0Þ ¼ f 0m0:64rss ðbased on r at ep ¼ 0:03Þ ð69Þ
f 0m is basically the fraction of dislocations in the annealed metal that are mobile at
yielding (half the steady-state flow stress) in a constant strain-rate test. Also from
Figure 4 sy/sss¼ 0.53. Therefore, at small strains,
_eess ¼ f 0m0:34½k7b=M�rsssss ð70Þ
(constant strain-rate at ep¼ 0.03)
At steady-state, s¼sss and rm¼ f smrss, where f s
m is the fraction of the total
dislocation density that is mobile and
_eess ¼ f sm k7b=M½ �rsssss ð71Þ
(constant strain-rate at ep>0.20).
By combining equations (70) and (71) we find that fm at steady-state is about 1/3
the fraction of mobile dislocations in the annealed polycrystals ð0:34 f 0m ¼ f s
mÞ. This
suggests that during steady-state only 1/3, or less, of the total dislocations (not
associated with subgrain boundaries) are mobile and the remaining 2/3, or more,
participate in hardening. The finding that a large fraction are immobile is consistent
with the observation that increased dislocation density is associated with increased
strength for steady-state and constant strain-rate testing deformation. Of course,
there is the assumption that the stress acting on the dislocations as a function of
Five-Power-Law Creep 75
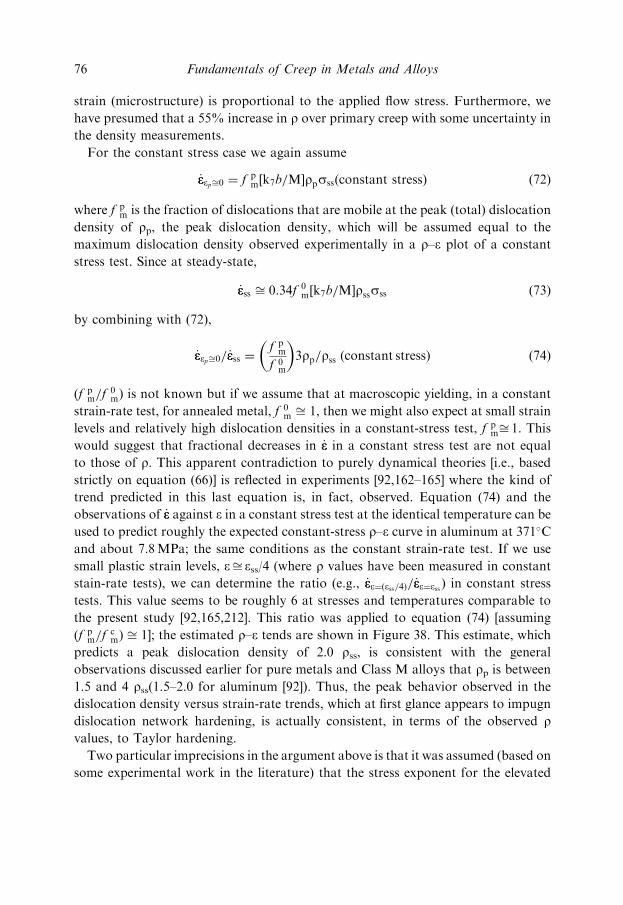
strain (microstructure) is proportional to the applied flow stress. Furthermore, we
have presumed that a 55% increase in r over primary creep with some uncertainty in
the density measurements.
For the constant stress case we again assume
_eeepffi0 ¼ f pm½k7b=M�rpsssðconstant stressÞ ð72Þ
where f pm is the fraction of dislocations that are mobile at the peak (total) dislocation
density of rp, the peak dislocation density, which will be assumed equal to the
maximum dislocation density observed experimentally in a r–e plot of a constant
stress test. Since at steady-state,
_eess ffi 0:34f 0m k7b=M½ �rsssss ð73Þ
by combining with (72),
_eeepffi0=_eess ¼f pm
f 0m
� �3rp=rss ðconstant stressÞ ð74Þ
ðf pm=f
0mÞ is not known but if we assume that at macroscopic yielding, in a constant
strain-rate test, for annealed metal, f 0m ffi 1, then we might also expect at small strain
levels and relatively high dislocation densities in a constant-stress test, f pmffi 1. This
would suggest that fractional decreases in _ee in a constant stress test are not equal
to those of r. This apparent contradiction to purely dynamical theories [i.e., based
strictly on equation (66)] is reflected in experiments [92,162–165] where the kind of
trend predicted in this last equation is, in fact, observed. Equation (74) and the
observations of _ee against e in a constant stress test at the identical temperature can be
used to predict roughly the expected constant-stress r–e curve in aluminum at 371�C
and about 7.8MPa; the same conditions as the constant strain-rate test. If we use
small plastic strain levels, effi ess/4 (where r values have been measured in constant
stain-rate tests), we can determine the ratio (e.g., _eee¼ðess=4Þ=_eee¼ess ) in constant stress
tests. This value seems to be roughly 6 at stresses and temperatures comparable to
the present study [92,165,212]. This ratio was applied to equation (74) [assuming
ðf pm=f
cmÞ ffi 1]; the estimated r–e tends are shown in Figure 38. This estimate, which
predicts a peak dislocation density of 2.0 rss, is consistent with the general
observations discussed earlier for pure metals and Class M alloys that rp is between1.5 and 4 rss(1.5–2.0 for aluminum [92]). Thus, the peak behavior observed in the
dislocation density versus strain-rate trends, which at first glance appears to impugn
dislocation network hardening, is actually consistent, in terms of the observed rvalues, to Taylor hardening.
Two particular imprecisions in the argument above is that it was assumed (based on
some experimental work in the literature) that the stress exponent for the elevated
76 Fundamentals of Creep in Metals and Alloys
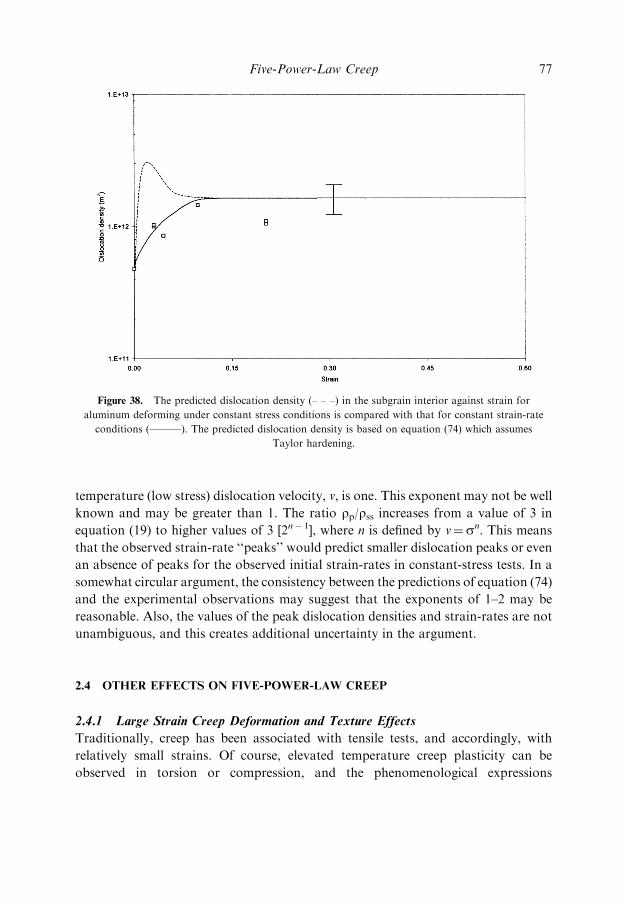
temperature (low stress) dislocation velocity, v, is one. This exponent may not be well
known and may be greater than 1. The ratio rp/rss increases from a value of 3 in
equation (19) to higher values of 3 [2n� 1], where n is defined by v¼sn. This means
that the observed strain-rate ‘‘peaks’’ would predict smaller dislocation peaks or even
an absence of peaks for the observed initial strain-rates in constant-stress tests. In a
somewhat circular argument, the consistency between the predictions of equation (74)
and the experimental observations may suggest that the exponents of 1–2 may be
reasonable. Also, the values of the peak dislocation densities and strain-rates are not
unambiguous, and this creates additional uncertainty in the argument.
2.4 OTHER EFFECTS ON FIVE-POWER-LAW CREEP
2.4.1 Large Strain Creep Deformation and Texture Effects
Traditionally, creep has been associated with tensile tests, and accordingly, with
relatively small strains. Of course, elevated temperature creep plasticity can be
observed in torsion or compression, and the phenomenological expressions
Figure 38. The predicted dislocation density (– – –) in the subgrain interior against strain for
aluminum deforming under constant stress conditions is compared with that for constant strain-rate
conditions (———). The predicted dislocation density is based on equation (74) which assumes
Taylor hardening.
Five-Power-Law Creep 77
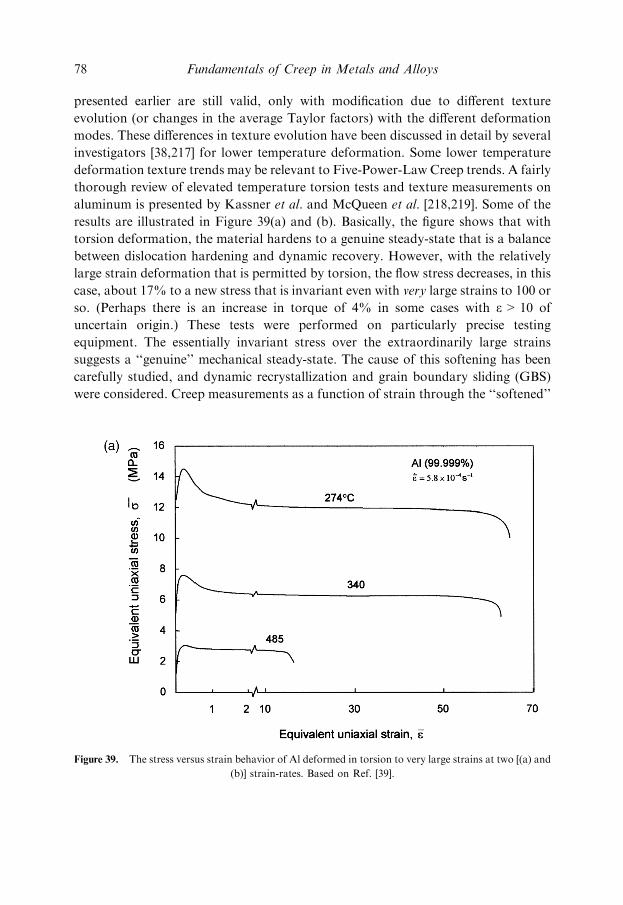
presented earlier are still valid, only with modification due to different texture
evolution (or changes in the average Taylor factors) with the different deformation
modes. These differences in texture evolution have been discussed in detail by several
investigators [38,217] for lower temperature deformation. Some lower temperature
deformation texture trends may be relevant to Five-Power-Law Creep trends. A fairly
thorough review of elevated temperature torsion tests and texture measurements on
aluminum is presented by Kassner et al. and McQueen et al. [218,219]. Some of the
results are illustrated in Figure 39(a) and (b). Basically, the figure shows that with
torsion deformation, the material hardens to a genuine steady-state that is a balance
between dislocation hardening and dynamic recovery. However, with the relatively
large strain deformation that is permitted by torsion, the flow stress decreases, in this
case, about 17% to a new stress that is invariant even with very large strains to 100 or
so. (Perhaps there is an increase in torque of 4% in some cases with e>10 of
uncertain origin.) These tests were performed on particularly precise testing
equipment. The essentially invariant stress over the extraordinarily large strains
suggests a ‘‘genuine’’ mechanical steady-state. The cause of this softening has been
carefully studied, and dynamic recrystallization and grain boundary sliding (GBS)
were considered. Creep measurements as a function of strain through the ‘‘softened’’
Figure 39. The stress versus strain behavior of Al deformed in torsion to very large strains at two [(a) and
(b)] strain-rates. Based on Ref. [39].
78 Fundamentals of Creep in Metals and Alloys
regime [220], and microstructural analysis using both polarized light optical (POM)
and transmission electron microscopy (TEM) [218] reveal that Five-Power-Law
Creep is occurring throughout the ‘‘softened’’ regime and that the modest decrease in
flow stress is due to a decrease in the average Taylor factor, M.
This has been confirmed by X-ray texture analysis [37] and is also consistent in
magnitude with theoretical texture modeling of deformation in torsion [38,217]. If
compression specimens are extracted from the torsion specimen deformed into the
‘‘softened’’ regime, the flow stress of the compression specimen is actually higher
than the torsion flow stress, again confirming the texture conclusion [218].
The microstructural evolution of specimens deformed to large strains, not
achievable in tension or compression, is quite interesting and has also been
extensively researched in some metals and alloys. The initial high angle grain
boundaries of the aluminum polycrystalline aggregate spiral about the torsion axis
with deformation within the five-power-law regime. At least initially, the total
number of grains in the polycrystalline aggregate remains constant and the grains
quickly fill with subgrains with low misorientation boundaries. The grains thin
until they reach about twice the average subgrain diameter with increasing strain
in torsion. Depending on the initial grain size and the steady-state Subgrain size,
this may require substantial strain, typically about 10. The high angle grain
Figure 39. Continued
Five-Power-Law Creep 79
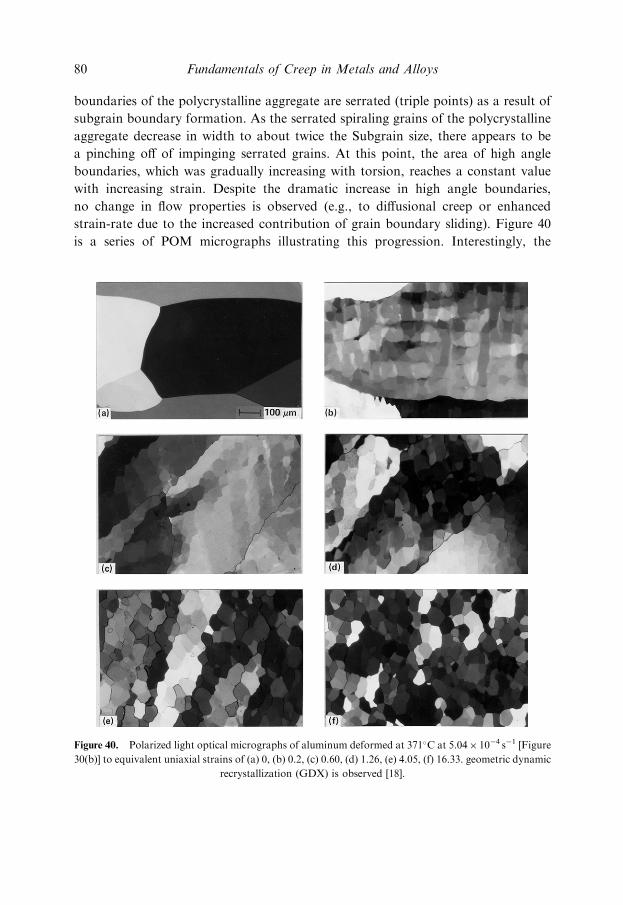
boundaries of the polycrystalline aggregate are serrated (triple points) as a result of
subgrain boundary formation. As the serrated spiraling grains of the polycrystalline
aggregate decrease in width to about twice the Subgrain size, there appears to be
a pinching off of impinging serrated grains. At this point, the area of high angle
boundaries, which was gradually increasing with torsion, reaches a constant value
with increasing strain. Despite the dramatic increase in high angle boundaries,
no change in flow properties is observed (e.g., to diffusional creep or enhanced
strain-rate due to the increased contribution of grain boundary sliding). Figure 40
is a series of POM micrographs illustrating this progression. Interestingly, the
Figure 40. Polarized light optical micrographs of aluminum deformed at 371�C at 5.04� 10�4 s�1 [Figure
30(b)] to equivalent uniaxial strains of (a) 0, (b) 0.2, (c) 0.60, (d) 1.26, (e) 4.05, (f) 16.33. geometric dynamic
recrystallization (GDX) is observed [18].
80 Fundamentals of Creep in Metals and Alloys
Subgrain size is about constant from the ‘‘peak’’ stress at about 0.2 strain to the
very large torsion strains. This, again, suggests that subgrain boundaries are mobile
and annihilate to maintain the equiaxed structure and modest misorientation.
Examination of those boundaries that form from dislocation reaction (excluding the
high-angle boundaries of the starting polycrystal) reveals that the average
misorientation at the onset of steady-state was, as stated earlier, only 0.5�. However,
by a strain of between 1 and 1.5 it had tripled to 1.5� [also see Figure 30(b)], but
appears to be fixed beyond this strain. This is, again, consistent with earlier work
referenced that indicates that ylave may increase (d decreases) during at least early
steady-state. Furthermore, at the onset of steady-state, nearly all of the subgrain
boundaries formed are low-yl dislocation boundaries. However, with very large
strain deformation there is an increase in high-angle boundary area (geometric
dynamic recrystallization or GDX). Nearly a third of the subgrain boundaries are
high-angle boundaries, but these appear to have ancestry back to the initial, or
starting, polycrystal. Notwithstanding, the flow stress is unchanged. That is, at a
strain of 0.2, at about 0.7 Tm and a modest strain-rate, the average Subgrain size is
about 13 mm and the average misorientation angle of subgrain boundaries is about
0.5�. If we increase the plastic strain by nearly two orders of magnitude to about 16,
the Subgrain size and interior or network dislocation density is unchanged, but we
have ‘‘replaced’’ nearly one-third of the subgrain facets with high-angle boundaries
(through GDX) and tripled the misorientation of the remaining one-third. However,
the flow stress is unchanged. This, again, suggests that the details of the subgrain
boundaries are not an important consideration in the rate-controlling process for
Five-Power-Law Creep.
Other elevated temperature torsion tests on other high stacking fault energy alloys
in the five-power-law regime have shown a similar softening as theoretically
predicted [221]. The cause of softening was not ascribed to texture softening by those
investigators but (probably incorrectly) rather to Continuous reactions (continuous
dynamic recrystallization) [222].
Recent work by Hughes et al. [141] showed that polycrystals deformed at elevated
temperature may form geometrically necessary boundaries (GNBs) from dislocation
reactions to accommodate differences in slip within a single grain. Whether these
form in association with GDX is unclear, although it appears that the grain
boundary area with large strain deformation is at least approximately consistent with
grain thinning. HABs, however, have been observed to form in single crystals at
elevated temperature from dislocation reaction [142] and the possibility that these
form from dislocation reaction in polycrystals should also be considered.
It should be also mentioned that it has been suggested that in at least Al and same
Al alloys [130], slip on {110} planes (or non-octahedral slip) can occur, leading to
nontraditional textures such as the cube {(001) type}.
Five-Power-Law Creep 81
2.4.2 Effect of Grain Size
First, of course, it has been suggested that with fine-grain size refinement, the
mechanism of plastic flow may change from five-power behavior to Coble creep
[52,223], which, as discussed earlier, is a diffusion creep mechanism relying on short-
circuit diffusion along grain boundaries. However, the role of high-angle grain
boundaries is less clear for Five-Power-Law Creep. Some work has been performed on
the Hall–Petch relationship in copper [224] and aluminum [147] at elevated
temperatures. Some results from these studies are illustrated in Figure 41. Basically,
both confirm that decreasing grain size results in increased elevated temperature
strength in predeformed copper and annealed aluminum (a constant dislocation
density for each grain size was not confirmed in Cu). The temperature and applied
strain rates correspond to Five-Power-Law Creep in these pure metals.
Interestingly, though, the effect of diminishing grain size may decrease with
increasing temperature. Figure 42 shows that the Hall–Petch constant, ky, for high-
purity aluminum significantly decreases with increasing temperature. The explana-
tion for this in unclear. First, if the effect of decreasing grain size at elevated
temperature is purely the effect of a Hall–Petch strengthening (e.g., not GBS), the,
explanation for decreasing Hall–Petch constant would require knowledge of the
precise strengthening mechanism. It is possible, for instance, that increased
strengthening with smaller grain sizes is associated with the increased dislocation
density in the grain interiors due to the activation of dislocation sources [225].
Therefore, thermal recovery may explain a decreased density and less pronounced
strengthening. This is, of course, speculative and one must be careful that other
effects such as grain boundary sliding are not becoming important. For example, it
has been suggested that in aluminum, grain boundary sliding becomes pronounced
above about 0.5 Tm [226,227]. Thus, it is possible that the decreased effectiveness of
high-angle boundaries in providing elevated temperature strength may be the result
of GBS, which would tend to decrease the flow stress. However, the initial Al grain
size decreased from about 250 mm to only about 30 mm through GDX in Figure 40,
but the flow properties at 0.7 Tm appear unchanged since the stress exponent, n, and
activation energy, Q, appear to be unchanged [218,220].
The small effect of grain size changes on the elevated-temperature flow properties
is consistent with some earlier work reported by Barrett et al. on Cu and Garafalo
et al. on 304 stainless steel, where the steady-state creep-rate appeared at least
approximately independent of the starting grain size in the former case and not
substantially dependent in the latter case [228,229]. Thus, it appears that decreasing
grain size has a relatively small effect on increasing the flow stress at high
temperatures over the range of typical grain sizes in single phase metals and alloys.
Figure 43 plots the effect of grain size on the yield stress of annealed
polycrystalline aluminum with the effect of (steady-state structure) Subgrain size
82 Fundamentals of Creep in Metals and Alloys
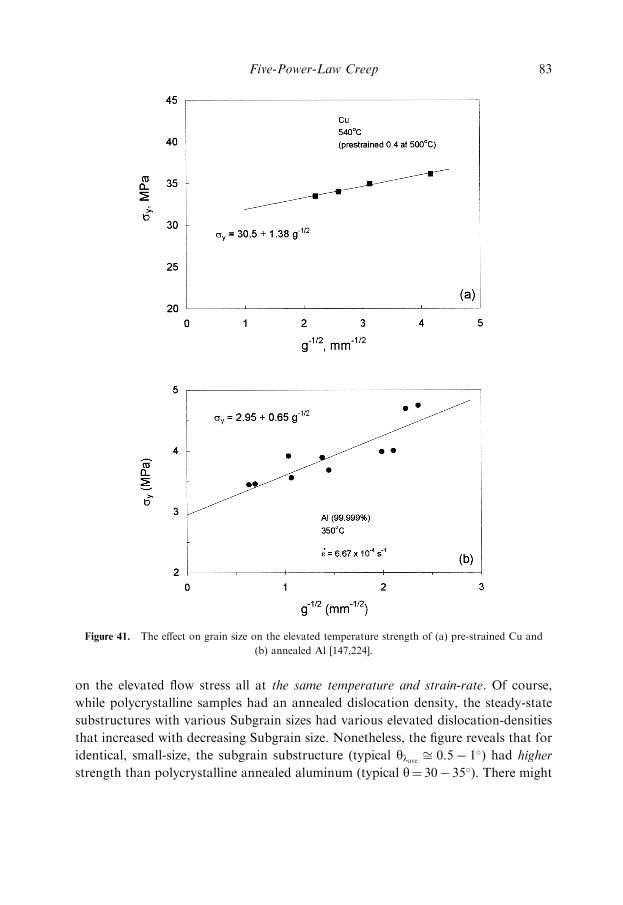
on the elevated flow stress all at the same temperature and strain-rate. Of course,
while polycrystalline samples had an annealed dislocation density, the steady-state
substructures with various Subgrain sizes had various elevated dislocation-densities
that increased with decreasing Subgrain size. Nonetheless, the figure reveals that for
identical, small-size, the subgrain substructure (typical ylave ffi 0:5� 1�) had higher
strength than polycrystalline annealed aluminum (typical y¼ 30� 35�). There might
Figure 41. The effect on grain size on the elevated temperature strength of (a) pre-strained Cu and
(b) annealed Al [147,224].
Five-Power-Law Creep 83
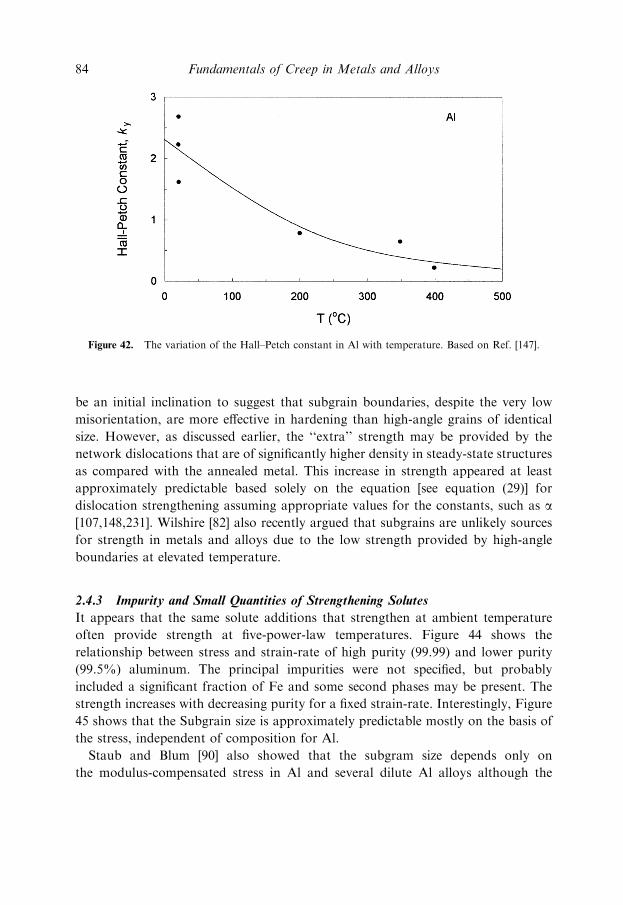
be an initial inclination to suggest that subgrain boundaries, despite the very low
misorientation, are more effective in hardening than high-angle grains of identical
size. However, as discussed earlier, the ‘‘extra’’ strength may be provided by the
network dislocations that are of significantly higher density in steady-state structures
as compared with the annealed metal. This increase in strength appeared at least
approximately predictable based solely on the equation [see equation (29)] for
dislocation strengthening assuming appropriate values for the constants, such as a[107,148,231]. Wilshire [82] also recently argued that subgrains are unlikely sources
for strength in metals and alloys due to the low strength provided by high-angle
boundaries at elevated temperature.
2.4.3 Impurity and Small Quantities of Strengthening Solutes
It appears that the same solute additions that strengthen at ambient temperature
often provide strength at five-power-law temperatures. Figure 44 shows the
relationship between stress and strain-rate of high purity (99.99) and lower purity
(99.5%) aluminum. The principal impurities were not specified, but probably
included a significant fraction of Fe and some second phases may be present. The
strength increases with decreasing purity for a fixed strain-rate. Interestingly, Figure
45 shows that the Subgrain size is approximately predictable mostly on the basis of
the stress, independent of composition for Al.
Staub and Blum [90] also showed that the subgram size depends only on
the modulus-compensated stress in Al and several dilute Al alloys although the
Figure 42. The variation of the Hall–Petch constant in Al with temperature. Based on Ref. [147].
84 Fundamentals of Creep in Metals and Alloys
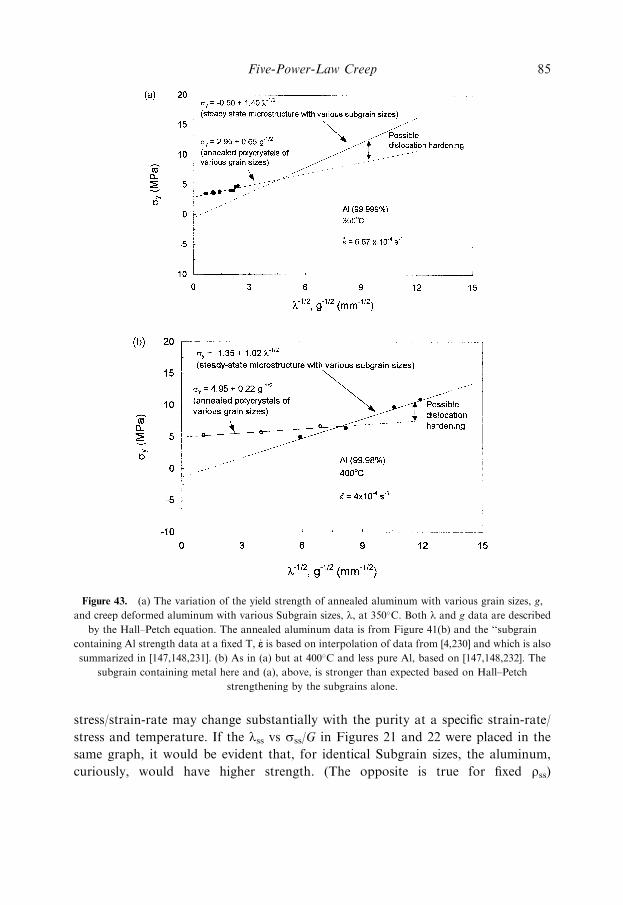
stress/strain-rate may change substantially with the purity at a specific strain-rate/
stress and temperature. If the lss vs sss/G in Figures 21 and 22 were placed in the
same graph, it would be evident that, for identical Subgrain sizes, the aluminum,
curiously, would have higher strength. (The opposite is true for fixed rss)
Figure 43. (a) The variation of the yield strength of annealed aluminum with various grain sizes, g,
and creep deformed aluminum with various Subgrain sizes, l, at 350�C. Both l and g data are described
by the Hall–Petch equation. The annealed aluminum data is from Figure 41(b) and the ‘‘subgrain
containing Al strength data at a fixed T, _ee is based on interpolation of data from [4,230] and which is also
summarized in [147,148,231]. (b) As in (a) but at 400�C and less pure Al, based on [147,148,232]. The
subgrain containing metal here and (a), above, is stronger than expected based on Hall–Petch
strengthening by the subgrains alone.
Five-Power-Law Creep 85
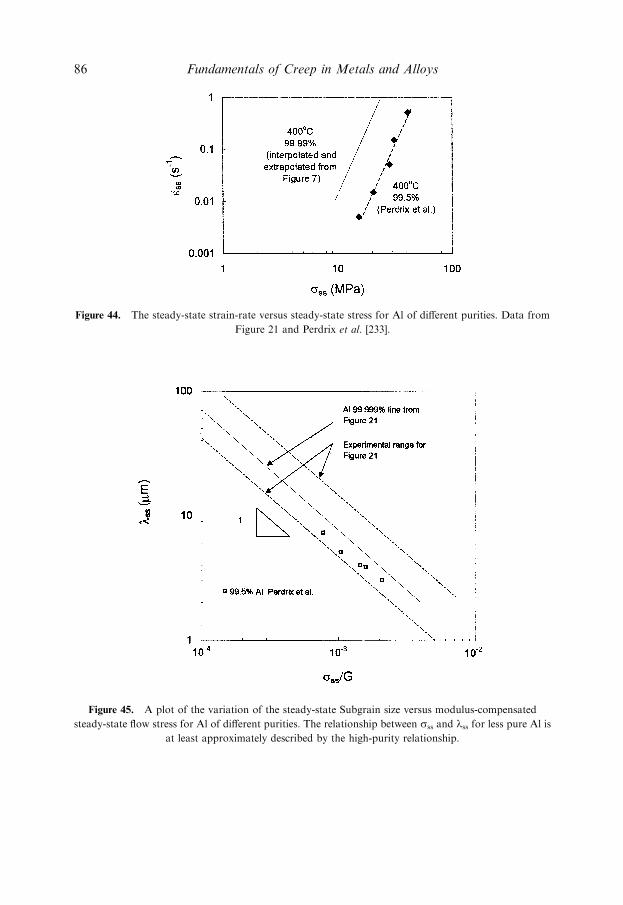
Figure 45. A plot of the variation of the steady-state Subgrain size versus modulus-compensated
steady-state flow stress for Al of different purities. The relationship between sss and lss for less pure Al is
at least approximately described by the high-purity relationship.
Figure 44. The steady-state strain-rate versus steady-state stress for Al of different purities. Data from
Figure 21 and Perdrix et al. [233].
86 Fundamentals of Creep in Metals and Alloys
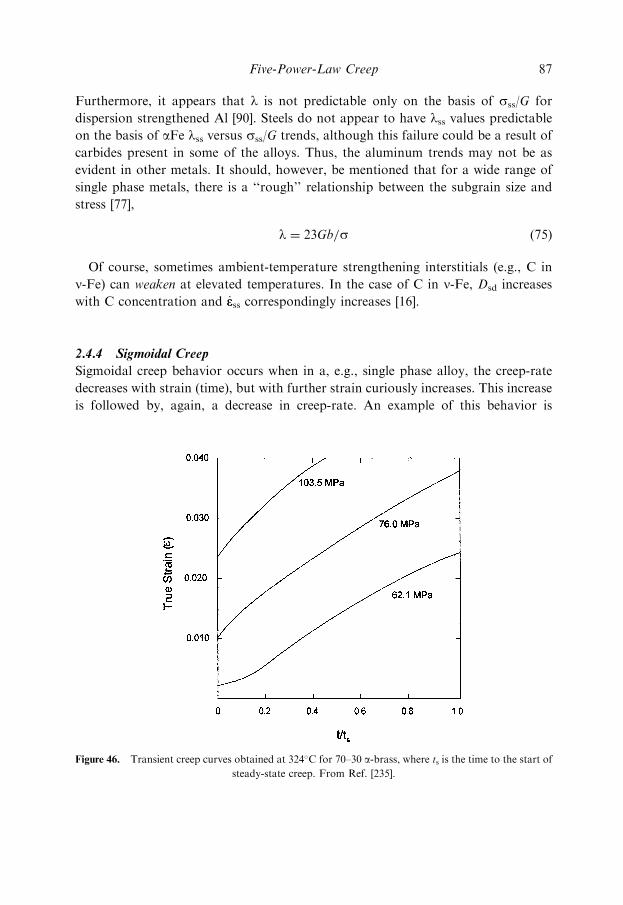
Furthermore, it appears that l is not predictable only on the basis of sss/G for
dispersion strengthened Al [90]. Steels do not appear to have lss values predictableon the basis of aFe lss versus sss/G trends, although this failure could be a result of
carbides present in some of the alloys. Thus, the aluminum trends may not be as
evident in other metals. It should, however, be mentioned that for a wide range of
single phase metals, there is a ‘‘rough’’ relationship between the subgrain size and
stress [77],
l ¼ 23Gb=s ð75Þ
Of course, sometimes ambient-temperature strengthening interstitials (e.g., C in
n-Fe) can weaken at elevated temperatures. In the case of C in n-Fe, Dsd increases
with C concentration and _eess correspondingly increases [16].
2.4.4 Sigmoidal Creep
Sigmoidal creep behavior occurs when in a, e.g., single phase alloy, the creep-rate
decreases with strain (time), but with further strain curiously increases. This increase
is followed by, again, a decrease in creep-rate. An example of this behavior is
Figure 46. Transient creep curves obtained at 324�C for 70–30 a-brass, where ts is the time to the start of
steady-state creep. From Ref. [235].
Five-Power-Law Creep 87
illustrated in Figure 46 taken from Evans and Wilshire of 70–30 a-brass [234,235].This behavior was also observed in the Cu–Al alloy described elsewhere [175] and
also in Zr of limited purity [236]. The sigmoidal behavior in all of these alloys
appears to reside within certain (temperature)/(stress/strain-rate) regimes. The
explanations for Sigmoidal creep are varied. Evans and Wilshire suggest that the
inflection is due to a destruction in short-range order in a-brass leading to higher
creep rates. Hasegawa et al. [175], on the other hand, suggest that changes in the
dislocation substructure in Cu–Al may be responsible. More specifically, the increase
in strain-rate prior to the inflection is associated with an increase in the total
dislocation density, with the formation of cells or subgrains. The subsequent
decrease is associated with cellular tangles (not subgrains) of dislocations. Evans and
Wilshire suggest identical dislocation substructures with and without sigmoidal
behavior, again, without subgrain formation. Warda et al. [236] attributed the
behavior in Zr to dynamic strain-aging. In this case oxygen impurities give rise to
solute atmospheres. Eventually, the slip bands become depleted and normal five-
power behavior resumes. Dramatic increases in the activation energy are suggested
to be associated with the sigmoidal behavior. Thus, the explanation for sigmoidal
behavior is unclear. One common theme may be very planar slip at the high
temperatures.
88 Fundamentals of Creep in Metals and Alloys