Embed Size (px)
Citation preview
Chapter 2
Measurements and Calculations
2-1 The Scientific Method
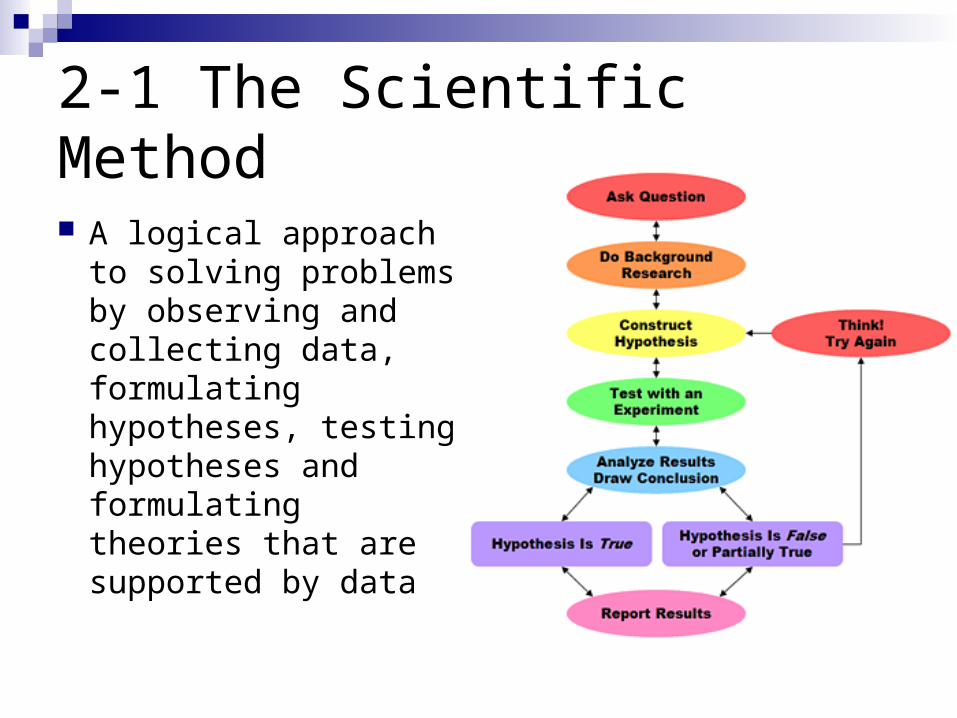
A logical approach to solving problems by observing and collecting data, formulating hypotheses, testing hypotheses and formulating theories that are supported by data
2-1 Observing and Collecting Data
Qualitative data – descriptive, what is it like?
The ice water was clear and colorless.
Quantitative data – numerical, how much?
The ice water was 4˚C.
The volume of the ice water was 125 mL.
2-1 System
A specific portion of matter in a given region of space that has been selected for study during an experiment or observation.
The scientist determines the system. Anything outside of the system is called
the surroundings.
2-1 Hypotheses, Models and Theories Scientists form hypotheses – a hypothesis is a testable
statement, if-then Scientists test hypotheses – a hypothesis is tested
through experimentation. If a hypothesis is not supported by data it must be
rejected. If a hypothesis is supported by experimental data, a
model is constructed – a model is an explanation of how data and events are related.
If a model successfully explains a phenomenon, it may become part of a theory – a theory is a broad generalization that explains a body of facts.
2-2 Units of Measurement
Measurements represent QUANTITIES. A quantity is anything that has magnitude,
size or amount. Length, width, temperature, mass, area,
volume and time are examples of quantities.
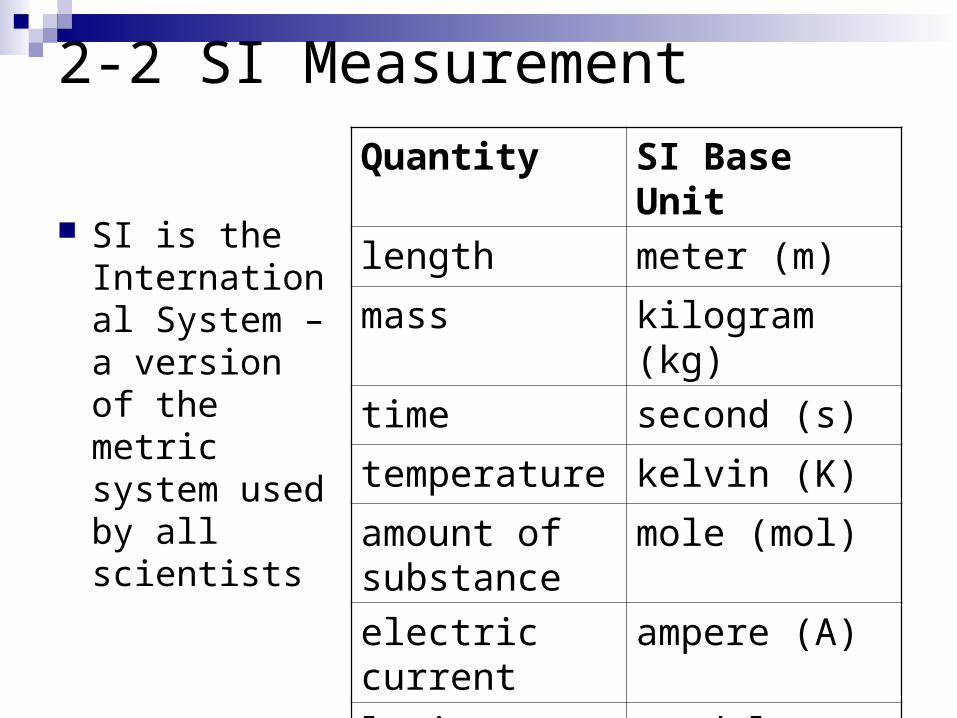
2-2 SI Measurement
SI is the International System – a version of the metric system used by all scientists
Quantity SI Base Unit
length meter (m)
mass kilogram (kg)
time second (s)
temperature kelvin (K)
amount of substance
mole (mol)
electric current ampere (A)
luminous intensity
candela (cd)
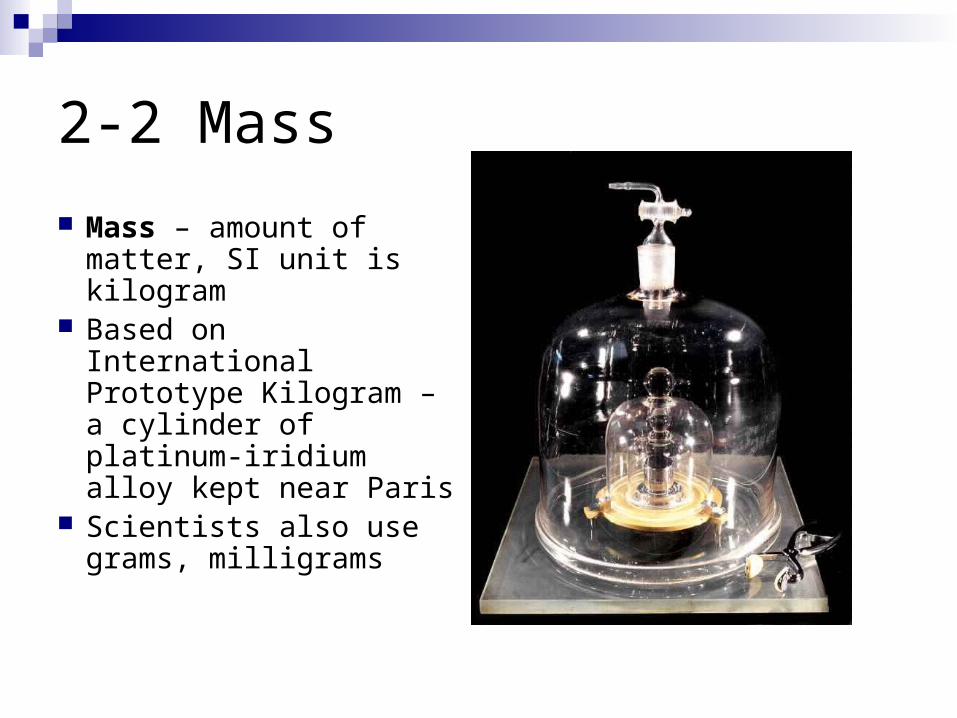
2-2 Mass
Mass – amount of matter, SI unit is kilogram
Based on International Prototype Kilogram – a cylinder of platinum-iridium alloy kept near Paris
Scientists also use grams, milligrams
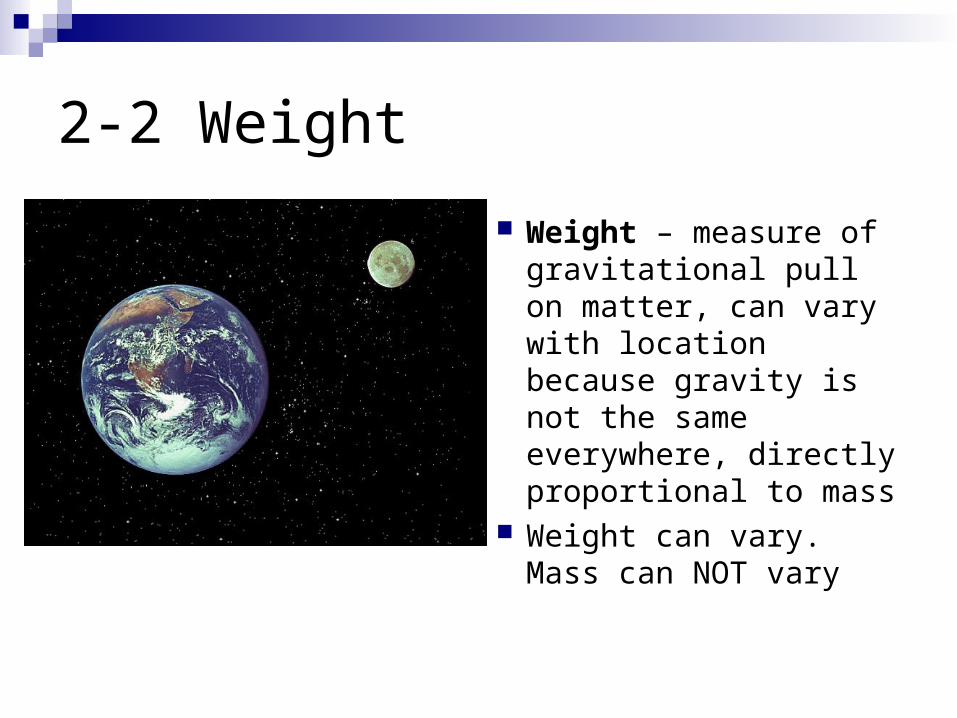
2-2 Weight
Weight – measure of gravitational pull on matter, can vary with location because gravity is not the same everywhere, directly proportional to mass
Weight can vary. Mass can NOT vary
2-2 Other Base Quantities
Length – distance between 2 points, SI base unit is meter, scientists also use decimeter, centimeter, millimeter
Temperature – hotness or coldness, average kinetic energy, SI base unit is degree kelvin, scientists also use degree Celsius
Time – interval between events, base unit is second
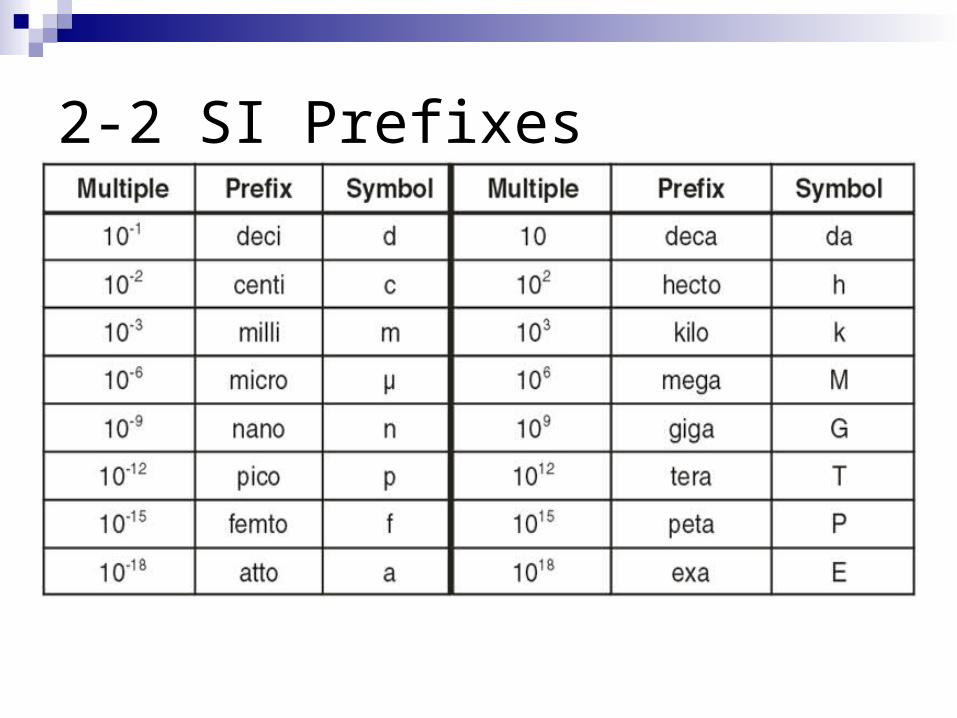
2-2 SI Prefixes
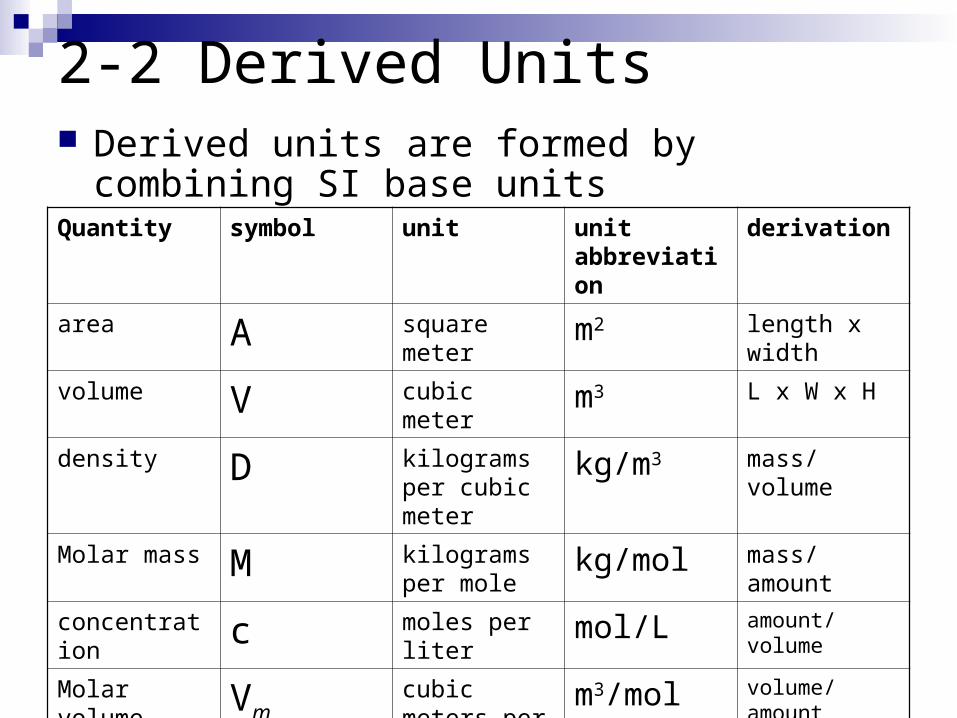
2-2 Derived Units Derived units are formed by combining SI base
unitsQuantity symbol unit unit
abbreviationderivation
area A square meter m2 length x width
volume V cubic meter m3 L x W x H
density D kilograms per cubic meter
kg/m3 mass/volume
Molar mass M kilograms per mole
kg/mol mass/amount
concentration c moles per liter mol/L amount/volume
Molar volume Vmcubic meters per mole
m3/mol volume/amount
energy E joule J force x length
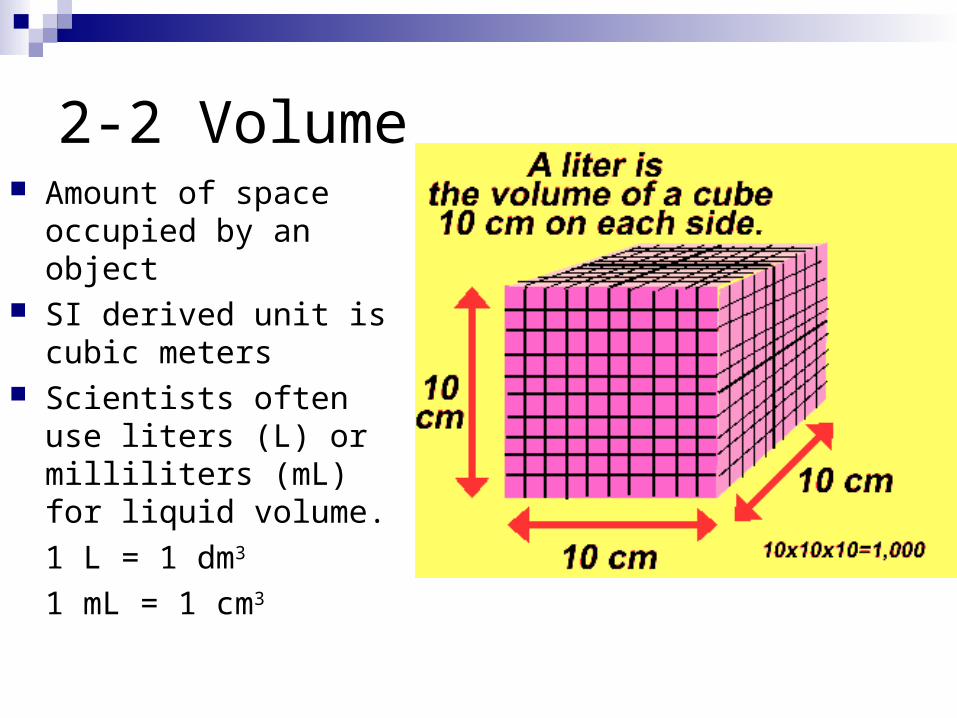
2-2 Volume Amount of space
occupied by an object SI derived unit is cubic
meters Scientists often use liters
(L) or milliliters (mL) for liquid volume.
1 L = 1 dm3
1 mL = 1 cm3
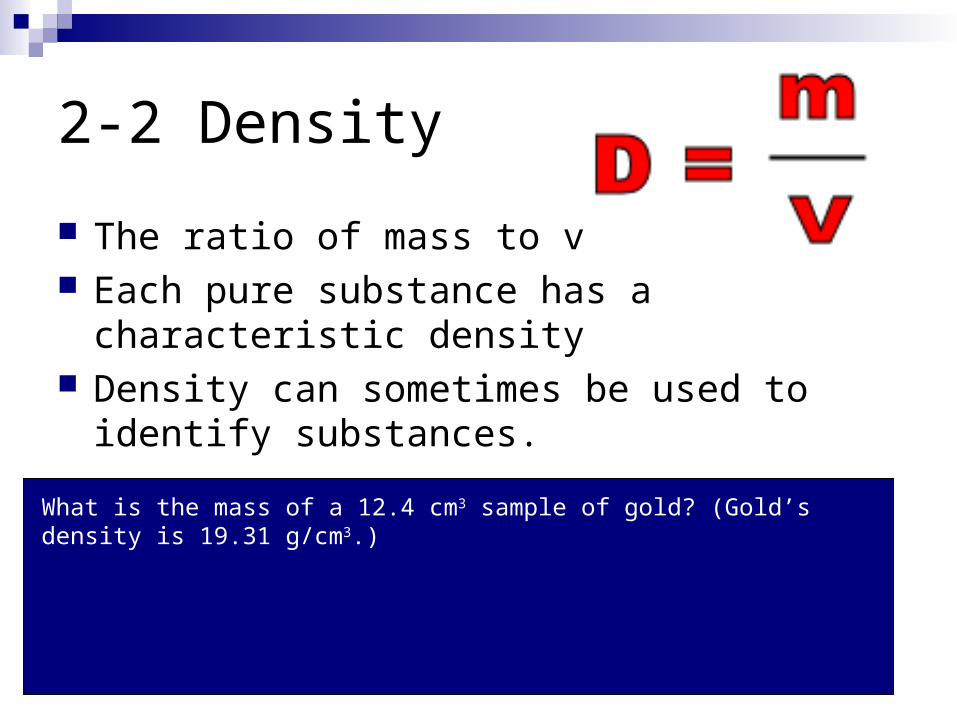
2-2 Density
The ratio of mass to volume Each pure substance has a characteristic
density Density can sometimes be used to identify
substances.
What is the mass of a 12.4 cm3 sample of gold? (Gold’s density is 19.31 g/cm3.)
2-2 Conversion Factors
A conversion factor is a ratio derived from the equality between two different units that can be used to convert from one unit to the other
example: 1 m = 10 dm

2-2 Using Conversion Factors
Express 5.712 g in milligrams and kilograms
2-2 Using Conversion Factors
Express 16.45 m in centimeters and kilometers.
2-2 Using Conversion Factors
Express 1500 cm3 in cubic meters.
2-2 Using Conversion Factors
Express 15 km/hr in meters per second.
2-2 Using Conversion Factors
Express 1.975 g/cm3 in kilograms per cubic meter.
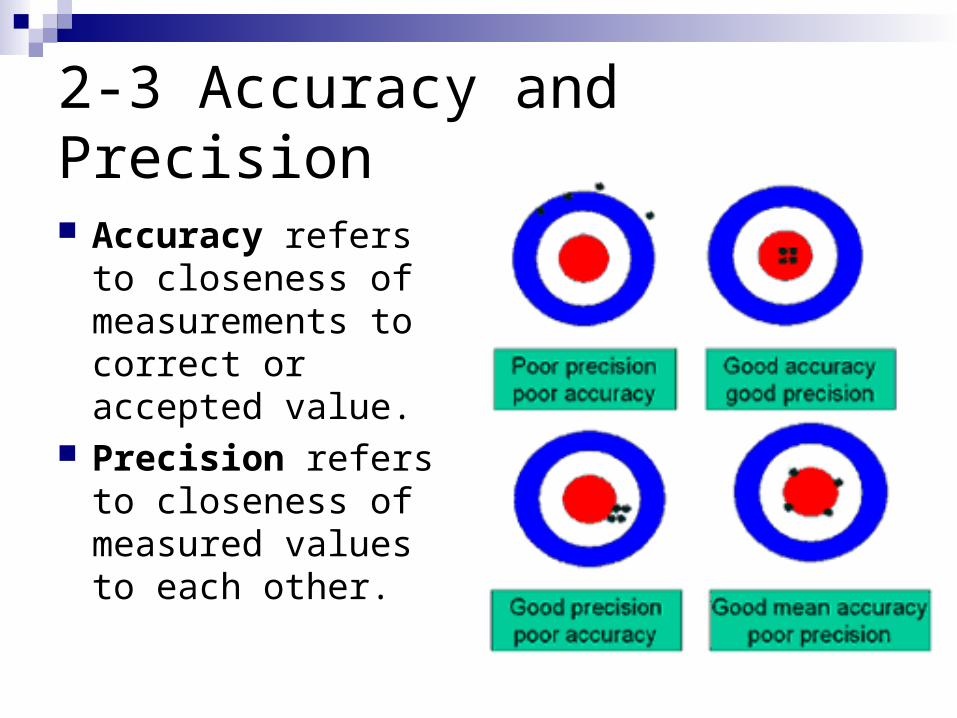
2-3 Accuracy and Precision
Accuracy refers to closeness of measurements to correct or accepted value.
Precision refers to closeness of measured values to each other.
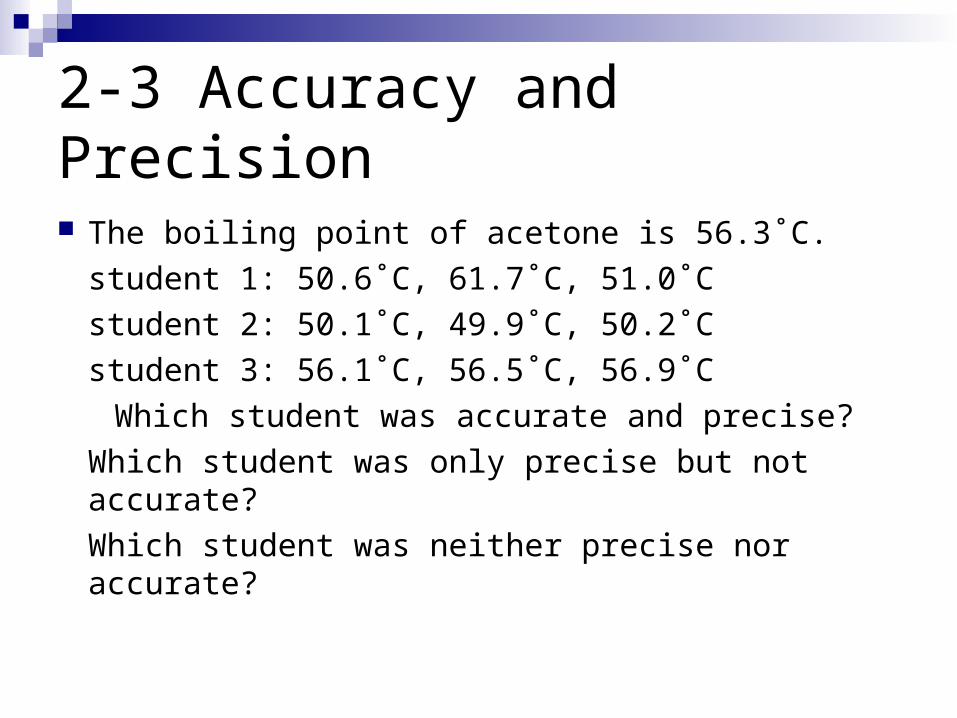
2-3 Accuracy and Precision
The boiling point of acetone is 56.3˚C.
student 1: 50.6˚C, 61.7˚C, 51.0˚C
student 2: 50.1˚C, 49.9˚C, 50.2˚C
student 3: 56.1˚C, 56.5˚C, 56.9˚C
Which student was accurate and precise?
Which student was only precise but not accurate?
Which student was neither precise nor accurate?
2-3 Percent Error
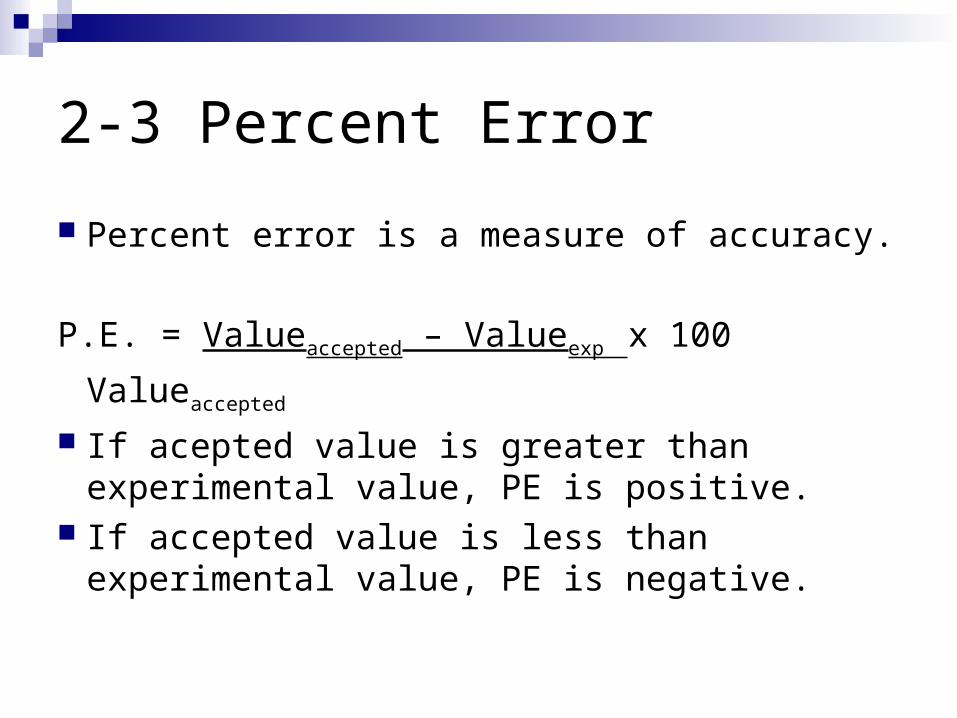
Percent error is a measure of accuracy.
P.E. = Valueaccepted – Valueexp x 100
Valueaccepted
If acepted value is greater than experimental value, PE is positive.
If accepted value is less than experimental value, PE is negative.
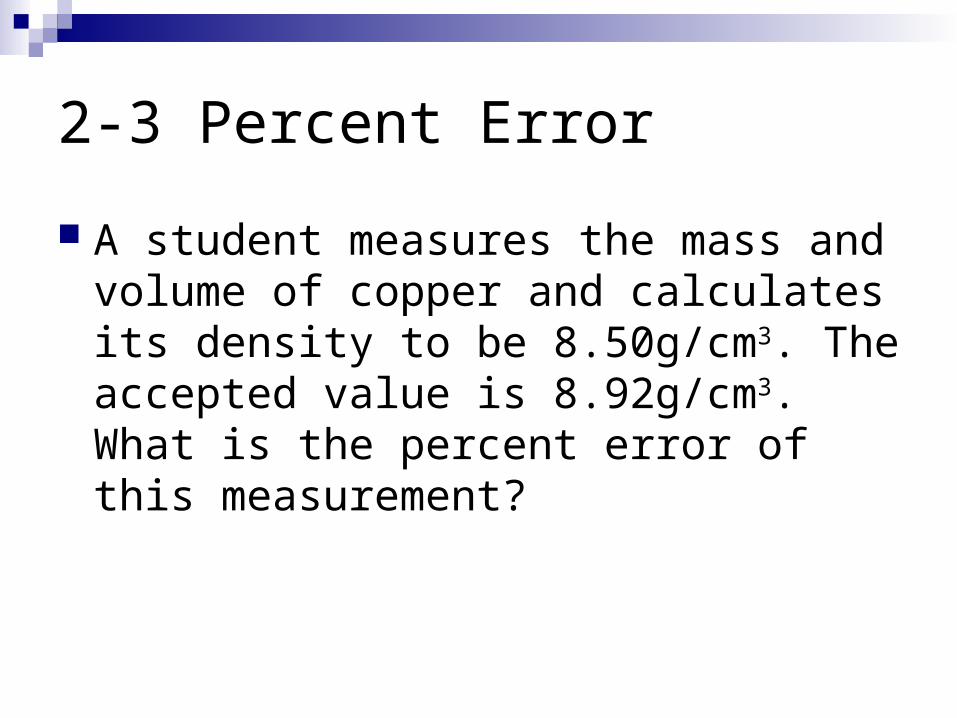
2-3 Percent Error
A student measures the mass and volume of copper and calculates its density to be 8.50g/cm3. The accepted value is 8.92g/cm3. What is the percent error of this measurement?
2-3 Significant Figures
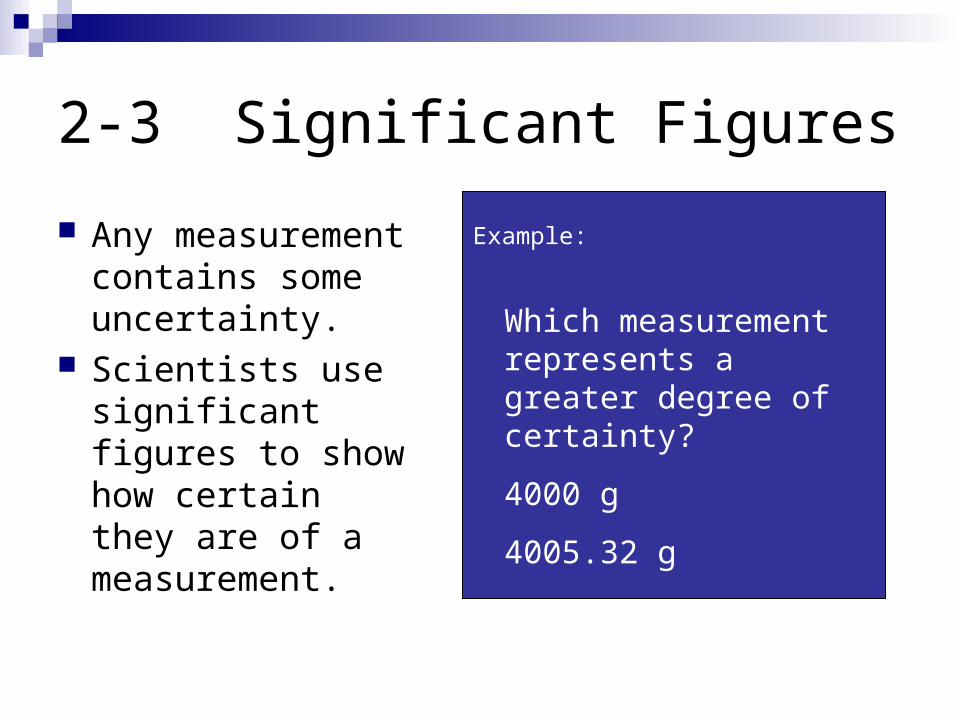
Any measurement contains some uncertainty.
Scientists use significant figures to show how certain they are of a measurement.
Which measurement represents a greater degree of certainty?
4000 g
4005.32 g
Example:
2-3 Significant Figures
Represent any position for which real measurement has been made, plus one final digit which is an estimated position
The number of significant figures you can record when measuring with an instrument depends on the sensitivity of the instrument
2-3 Significant Figures
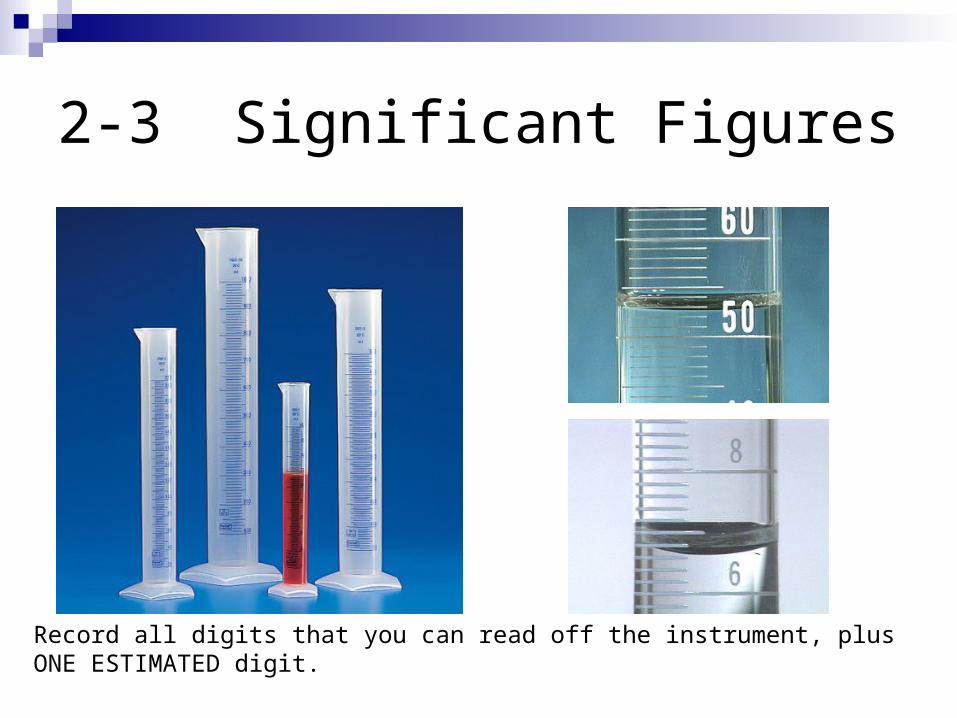
Record all digits that you can read off the instrument, plus ONE ESTIMATED digit.
2-3 Significant Figures
All nonzero digits are significant. Zeros between nonzero digits are
significant. Zeros in front of all nonzero digits are NOT
significant. Zeros at the end of a number and to the
right of a decimal point are significant.
2-3 Significant Digits
Determine the number of significant digits in the following measurements:804.05 g0.0144030 km1002 m400 mL30000. cm0.000625000 kg

2-3 Significant Figures and Calculations Addition/subtraction – go by smallest
number of decimal places Multiplication/division – go by smallest
number of significant figures
4.57 g
+ 3.2 g
7.77g 7.8 g
3.21 m
X 4.512 m
14.48352 m2 14.5 m2
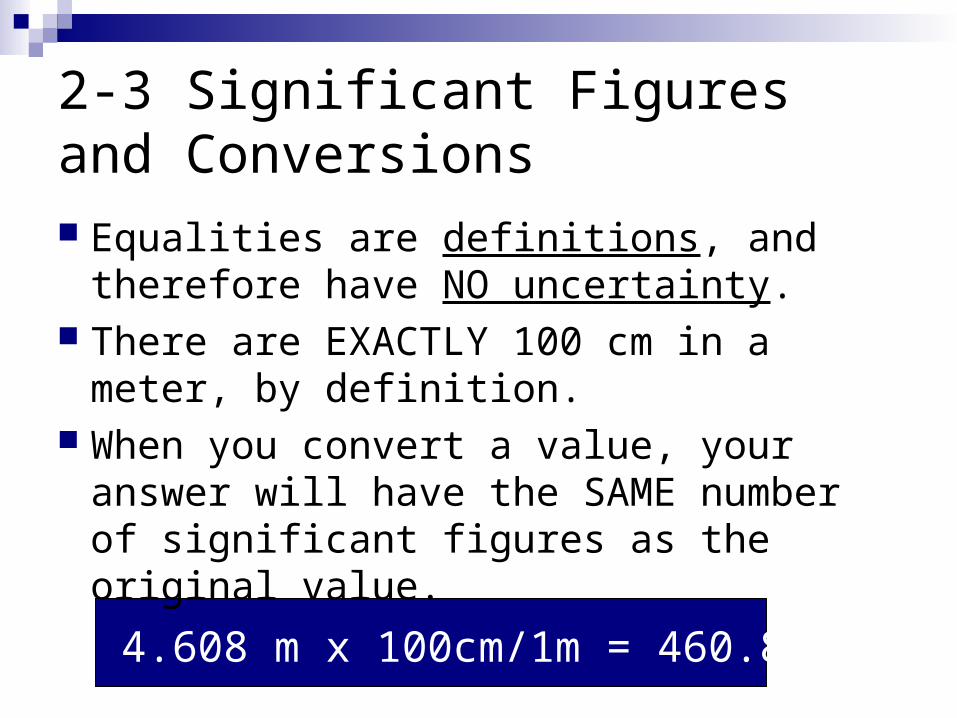
2-3 Significant Figures and Conversions Equalities are definitions, and therefore
have NO uncertainty. There are EXACTLY 100 cm in a meter,
by definition. When you convert a value, your answer
will have the SAME number of significant figures as the original value.
4.608 m x 100cm/1m = 460.8 cm
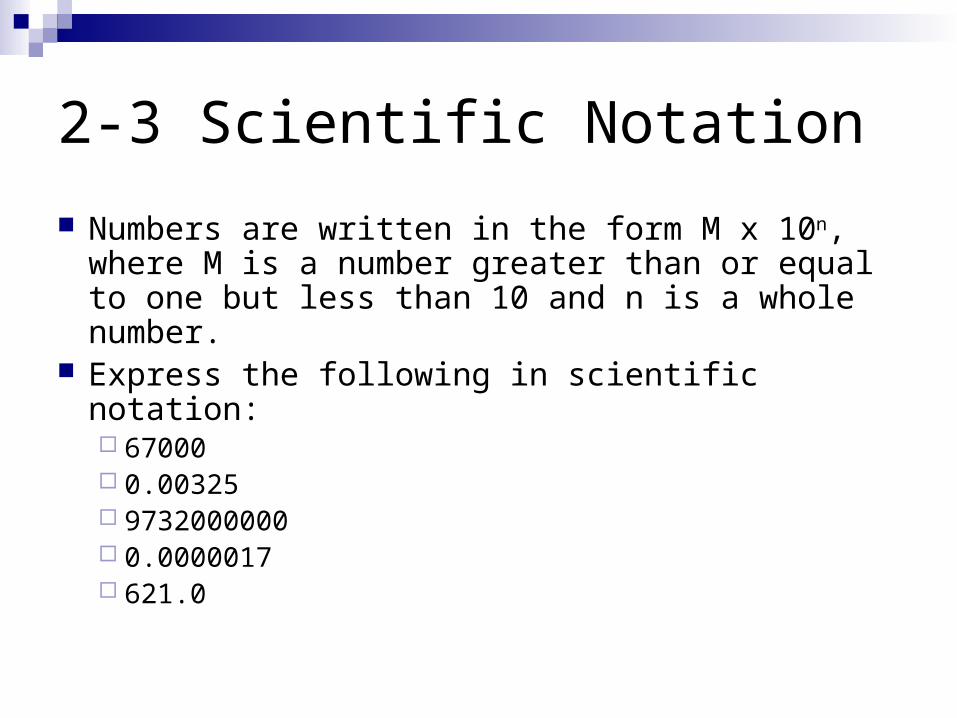
2-3 Scientific Notation
Numbers are written in the form M x 10n, where M is a number greater than or equal to one but less than 10 and n is a whole number.
Express the following in scientific notation: 67000 0.00325 9732000000 0.0000017 621.0
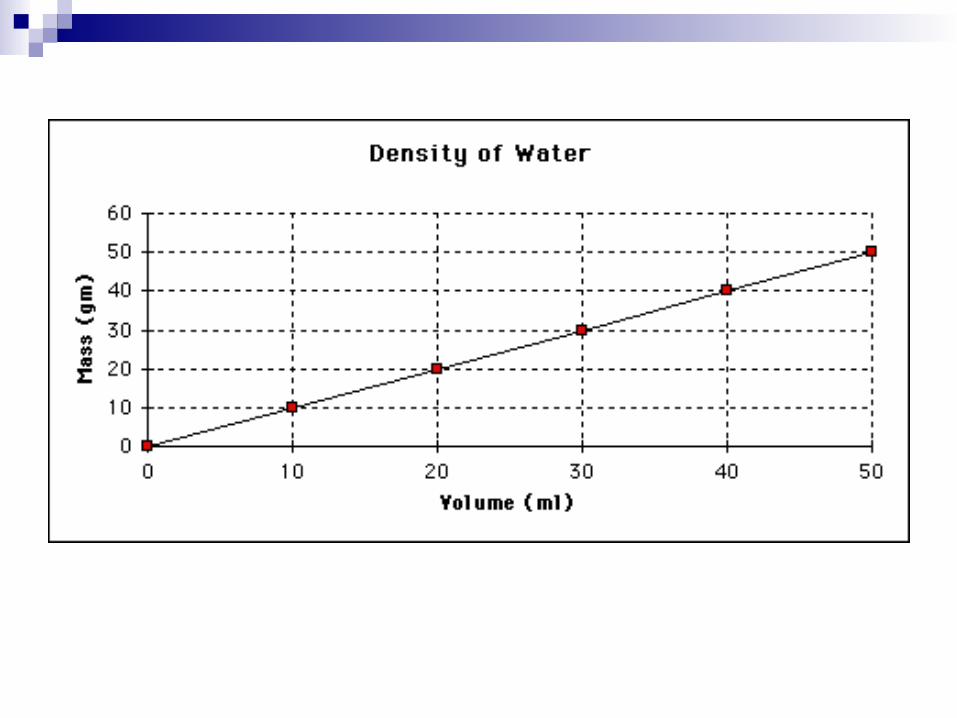
2-3 Direct Proportions
Two quantities are directly proportional to each other if dividing one by the other gives a constant value y/x = k
k is the proportionality constant Ratio between the variables remains constant Rearrange to get y = kx (straight line) Therefore, a graph of a directly proportional
relationship will be linear. (e.g. density)
2-3 Inverse Proportions
Two quantities are inversely proportional to each other if their product is a constantxy = k
k is the proportionality constant A graph of an inversely proportional relationship
produces a curve called a hyperbola
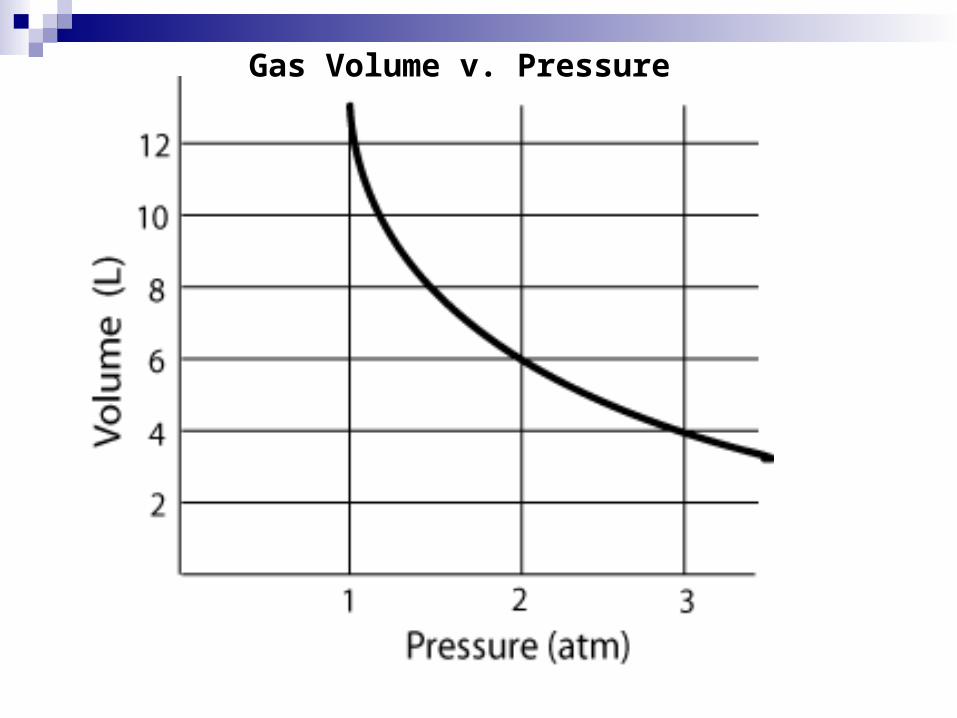
Gas Volume v. Pressure