Embed Size (px)
Citation preview
T. J. Brukilacchio, Ph.D. Thesis 2003
8
Chapter 2
Review of Diffuse Optical Tomography:
Theory and Tissue Optics
The propagation of photons through turbid media such as biological tissue can be
modeled as a diffusion process [1-20]. The direction and polarization state of photons
entering the tissue quickly becomes randomized by multiple scattering events. A pulse of
photons on the order of a picosecond incident on a slab, will be spread out in time due to
the diffusion of photons as it propagates through and exits the slab. The resulting
temporal point spread function (TPSF) can be modeled by the diffusion approximation to
the radiative transport equation. Analytical models have been developed for simple
geometries such as the infinite homogeneous slab with boundary conditions applicable to
breast imaging in transmission [1-3,6]. This chapter begins with a review of the theory of
diffuse optical tomography as it applies to optical breast imaging in the time-domain in
the transmission geometry.
An understanding of the anatomy specific to normal breast tissue and of benign and
cancerous lesions of the breast is important for accurate modeling and assessment of
optical breast imaging. Section 2.2 reviews the important distinctions between different
types of tissue that comprise the human female breast. The features of benign and
cancerous tumors of the breast are discussed along with anticipated optical contrast
associated with the tumors and neighboring tissues. The primary chromophores relevant
to optical imaging of the breast in the near infrared are discussed. It has been shown that
T. J. Brukilacchio, Ph.D. Thesis 2003
9
the effects of lipids and water on the absorption coefficient should not be neglected due
to their relative abundance in the breast along with the generally lower concentrations of
hemoglobin relative to other tissue types [23,24].
2.1 Theory of Diffuse Optical Tomography
The diffusion approximation to the radiative transport equation is the most widely
used model to describe the migration of light through biological tissues. The Time-
Domain Optical Breast Imaging System described in this dissertation is based on a slab
geometry. Thus, time-dependant solutions to the diffusion approximation are discussed
for the homogeneous infinite slab along with the relative merits of various boundary
conditions. The challenge of DOT is that of imaging heterogeneities in the tissue that
may be due to functional changes in the tissue indicative of cancer or benign lesions. The
homogenous solutions of the diffusion approximation can be used in a perturbation
approach to derive approximate analytical solutions to the heterogeneous problem. The
linear first Born approximation that has been widely used in optical tomography is
reviewed. This section closes with a discussion of the inverse problem and image
reconstruction techniques.
2.1.1 The Radiative Transfer Equation
The most general model for light transport that may be given is the theory of
radiative transfer, or photon transport theory, which has been extensively studied in
atmospheric physics, and in neutron transport [1,2].
The radiative transfer equation, also referred to as the Boltzmann transport equation,
is the expression of the balance of energy inside a volume element of the scattering
medium. Generally, only elastic scattering is considered, that is a scattering event
T. J. Brukilacchio, Ph.D. Thesis 2003
10
changes the direction of the photon, not the frequency [3]. This also implies that the
absorbed energy is completely lost in the sense that it is converted to kinetic energy
manifest as heat. The equation describes the behavior of the specific intensity I(r, t, s )
with units of Wm-2sr-1, i.e., the energy moving in the direction s , per unit solid angle, per
unit time, and per unit area normal to the s direction. The radiative transfer equation can
be obtained by considering the total space and time variation of the radiance along a
direction s in an elementary volume and making this equal to the variation of specific
intensity due to scattering and absorption inside the medium. The final equation for the
time-dependent case [1-4] is
( ) ( ) ( ) ( ) ( ) ( )4
1 ˆ ˆ ˆ ˆ ˆˆ ˆ ˆ ˆ, t,s , t,s , t,s , ' , t,s ' , t,s4
ttI s I I p s s I ds S
t π
µµυ π
∂+ ⋅∇ = − + +
∂ ∫r r r r r (2.1)
where υ is the speed of light inside the diffusing medium defined by υ =c/n, where c is
the speed of light in vacuum and n is the effective index of the medium, µt = µs + µa is the
extinction coefficient where µs and µa are the scattering and absorption coefficients
respectively (the inverse of µs and µa represent the mean path between two consecutive
scattering events and the mean path between two absorption events, respectively),
S(r, t, s ) is the source term representing the spatial and angular distribution of the source
in units of Wm-3sr-1, and ( )'ˆ,ˆ ssp is the scattering function that defines the probability of a
photon moving in the direction s to be scattered into direction 's . The scattering function
was normalized according to [3]
( )t
ssdsspµπµ
π
4'ˆ'ˆ,ˆ4
=∫ . (2.2)
If the source term is assumed to be a Dirac delta function, the solution represents the
Green’s function of the problem from which the solution for a generic source can be
T. J. Brukilacchio, Ph.D. Thesis 2003
11
obtained with convolution integrals. In the time-domain, the Green’s function is referred
to as the Temporal Point Spread Function (TPSF) having a damped exponential form that
is limited by the absorption coefficient. The source term of unit strength is thus
represented by
( ) ( ) ( ) ( )ˆ ˆ, t,sS s tδ δ δ=r r (2.3).
If ( ) 0ˆ, t,sa
I µ =r is a solution of Equation (2.1) for a nonabsorbing medium with the
source term described by a Dirac delta function, then
( ) ( ) ( ) 0ˆ ˆ, t,s exp , t,saaI t I µµ υ == −r r (2.4)
is the solution to the same equation when the absorption coefficient (independent of r) is
µa. The validity can be checked [4] by substitution of Equation (2.4) into Equation (2.1)
with the assumption that the source term is zero except at r = 0, giving
( ) ( ) ( ) ( ) ( )0 0 0 04
1 ˆ ˆ ˆ ˆˆ ˆ ˆ ˆ, t,s , t,s , t,s , ' , t,s '4
ttI s I I p s s I ds
t π
µµυ π
∂+ ⋅∇ = − +
∂ ∫r r r r (2.5)
where the zero subscript has been used to denote the solution for µa = 0. Thus, the time-
dependent impulse response of a homogeneous medium has two separable parts [4]: one
that is determined by the scattering coefficient [ ( )0 ˆ, t,sI r ] and one that is determined by
the medium absorption [ ( )exp a tµ υ− ]. Diffusion theory is derived from transport theory
and would therefore be expected to have the same transformation property [4]. This
property is made use of in the next section for which the diffusion approximation to the
radiative transport equation is introduced.
T. J. Brukilacchio, Ph.D. Thesis 2003
12
2.1.2 Diffusion Approximation to the Radiative Transport Equation
The radiative transport equation is complicated and it is almost impossible to obtain
analytical solutions with a degree of generality that can be applied to solving real
problems. Numerical methods or analytical approximations are generally used. The
analytical model most widely used is the diffusion approximation. The radiative
transport equation can be simplified by an expansion in spherical harmonics [1,4]. The
result is a set of (N+1)2 coupled partial differential equations known as the PN
approximation. For odd N, such equations may be reduced to a single (N+1)th-order
differential equation. The P1 approximation to the radiative transport equation is
generally referred to as the diffusion approximation given by
( ) ( )2 , t , taD St
υµ υ∂ − ∇ + + Φ = ∂ r r (2.6)
where ( )/ 3 'sD υ µ= is the photon diffusion coefficient [cm2/s], 'sµ is the reduced
scattering coefficient [cm-1], which is the reciprocal of the random walk length, that is the
average length for a photon’s direction to become random, ( ), tΦ r is the photon fluence
rate [Wcm-2], and ( ), tS r is the source term [Wcm-3]. The scattering coefficient and the
reduced scattering coefficient are related by
( )' 1s s gµ µ= − (2.7)
where g is the single-scattering anisotropy factor, which is a measure of the fraction of
photons scattered in the forward direction [3] given by
( )( ) ( )
( )4
4
ˆ ˆ ˆ ˆ ˆ' ' 'cos
ˆ ˆ ˆ' '
s s p s s dsg
p s s dsπ
π
θ⋅ ⋅
= =⋅
∫
∫ (2.8).
T. J. Brukilacchio, Ph.D. Thesis 2003
13
Typical tissues, such as breast, scatter predominately in the forward direction with a
value of g on the order of 0.9 [5]. Thus for a scattering length in the breast on the order
of 0.100 mm, the random walk step would be 1 mm, meaning that it takes about 10
scattering events for the photon direction to become random relative to its initial
direction. The P1 approximation is valid when the albedo ( )/s s ac µ µ µ= + is close to
unity, i.e., 'a sµ µ , the normalized scattering function is not too anisotropic, and the
source-detector separation is large compared to the random walk length [4].
Many authors show a dependency of the diffusion coefficient on the absorption
coefficient as ( )/ 3 's aD υ µ µ= + [2,6,8,9]. The diffusion coefficient independent of µa
was first considered by Furustu in 1980 and Furutsu and Yamada in 1994 [3]. More
recently, Durduran in 1997 [10] and Contini in 1997 [3] compared solutions of the
radiative transport equation obtained by Monte Carlo simulations, showing that for large
values of µa , better agreement is obtained when the diffusion coefficient independent of
µa is assumed. This is also consistent with the assumption of the P1 approximation that µa
<< µs’.
In practical applications such as measurements on biological tissues, the photon
fluence ( ), tφ r is not measured directly. The measurable quantity is given by a
directional component of the photon current density J [photons/cm2/sec] as a statement of
Fick’s law according to [2,3]
( ) ( ), t , tD φ= − ∇r rJ (2.9)
where Fick’s law states that photons propagate predominately from areas of higher to
lower photon density. In the case of measuring the transmitted intensity of breast tissue
T. J. Brukilacchio, Ph.D. Thesis 2003
14
compressed between plates, we are interested in the transmission, which is related to
Equation (2.9) by
( ) ( ), t , ,D z d tρ φ ρ= − ∇ =T (2.10)
where ρ is the distance in the plane of the slab from the source and d is the thickness of
the slab.
2.1.3 Solutions of the Diffusion Equation for a Slab
The boundary conditions particular to slab geometry are used to find the Green’s
function solution to the time-dependent diffusion equation for the transmission case. The
boundary conditions must take proper account of the air-tissue interface. They cannot be
expressed exactly in closed analytical form, so three basic approximations have been
used with varying degrees of complexity and validity [2,3,6]. The most complex
boundary condition is known as the partial current boundary condition (PCB). The PCB
makes the reasonable assumption that the photons leaving the scattering medium through
the air-tissue interface do not return to the medium. This implies that the total diffuse
flux inwardly directed should be equal to zero at the surface. The solutions are rather
complex and have shown no significant advantage over the simpler, but more
approximate, extrapolated boundary condition (EBC). The EBC approximates the PCB,
assuming linear behavior of the average diffuse intensity around the geometrical
boundaries. The EBC assumes the average diffuse intensity to be zero at an extrapolated
boundary outside the turbid medium at a distance ze given by
2eDz Aυ
= (2.11)
T. J. Brukilacchio, Ph.D. Thesis 2003
15
where the coefficient A takes account of the Fresnel reflection at the air-tissue interface
and is given by [3]
( ) ( ) ( )( ) ( ) ( )∫
∫−
+= π
π
θθθθ
θθθθ2
0
2
0
2
sincos21
sincos31
iiii
iiii
dR
dRA (2.12)
where the Fresnel reflection coefficient for unpolarized light is given by
( ) ( ) ( )( ) ( )
( ) ( )( ) ( )
+−
+
+−
=22
coscoscoscos
coscoscoscos
21
ti
ti
ti
ti
nn
nnR
θθθθ
θθθθθ (2.13)
and where n = n2/n1 is the relative refractive index, which is the ratio between the
refractive index of the medium and that of the external medium, iθ is the angle of
incidence of the radiation and )]sin(arcsin[ it n θθ = is the refracted angle. The integrals in
Equation (2.12) are complex, but have been fit by Contini et al. to have the form
32 355814.7376699064.592300214.2641332889.504 nnnAfit −+−= (2.14)
7654 8047.64956547.610357945.246353041.5507 nnnn −+−
The error between the exact calculation of A and Afit has been shown to be far below
0.05% for values of n ranging between 1.0 and 1.6. The zero boundary condition (ZBC)
is the most simple and approximate of the three and assumes the average diffuse intensity
equal to zero at the physical boundary. With the ZBC it is not possible to take proper
account of the effect of reflection at the boundary.
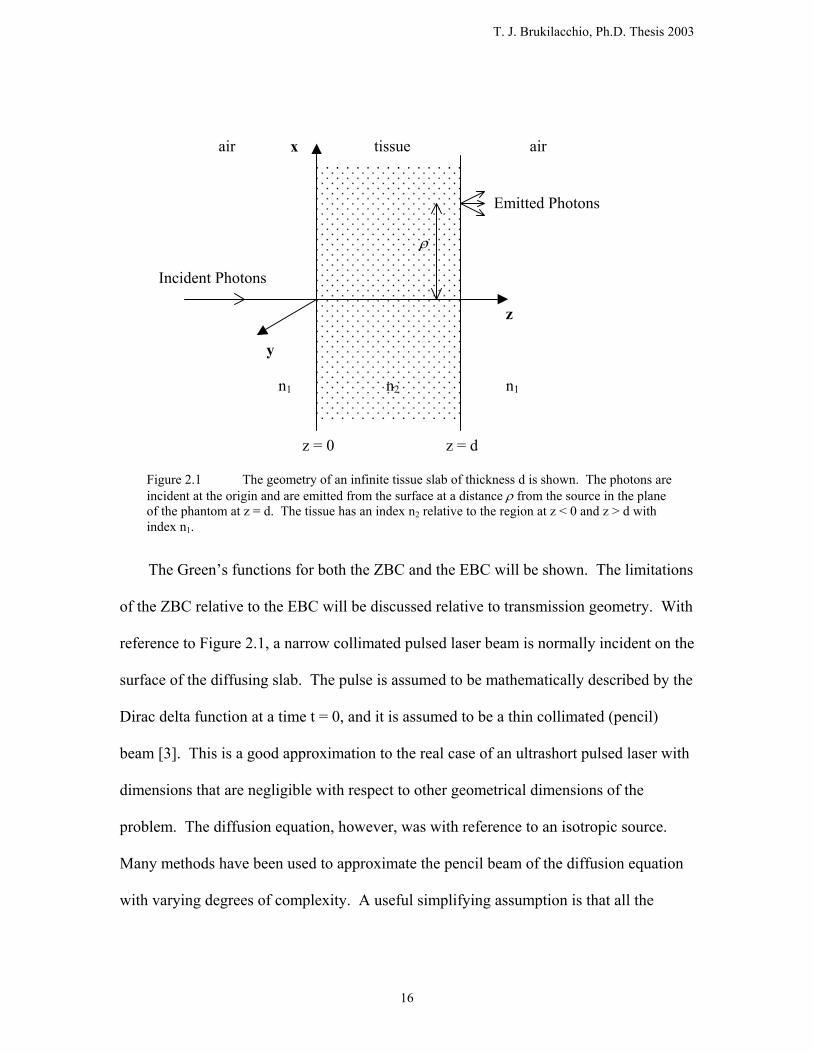
The geometry applicable to an infinite slab is pictured in Figure 2.1. The photons are
incident on the surface of the slab at z = 0. The scattered photons are remitted from the
surface of the slab of thickness d, a distance ρ from the z-axis. The index of refraction of
the slab is n2 and that of the surrounding medium, n1.
T. J. Brukilacchio, Ph.D. Thesis 2003
16
The Green’s functions for both the ZBC and the EBC will be shown. The limitations
of the ZBC relative to the EBC will be discussed relative to transmission geometry. With
reference to Figure 2.1, a narrow collimated pulsed laser beam is normally incident on the
surface of the diffusing slab. The pulse is assumed to be mathematically described by the
Dirac delta function at a time t = 0, and it is assumed to be a thin collimated (pencil)
beam [3]. This is a good approximation to the real case of an ultrashort pulsed laser with
dimensions that are negligible with respect to other geometrical dimensions of the
problem. The diffusion equation, however, was with reference to an isotropic source.
Many methods have been used to approximate the pencil beam of the diffusion equation
with varying degrees of complexity. A useful simplifying assumption is that all the
n1 n2 n1
x
y
z
z = 0 z = d
ρ
air air tissue
Incident Photons
Emitted Photons
Figure 2.1 The geometry of an infinite tissue slab of thickness d is shown. The photons are incident at the origin and are emitted from the surface at a distance ρ from the source in the plane of the phantom at z = d. The tissue has an index n2 relative to the region at z < 0 and z > d with index n1.
T. J. Brukilacchio, Ph.D. Thesis 2003
17
incident photons are initially scattered isotropically at a depth z0 = 1/µs’ below the
surface.
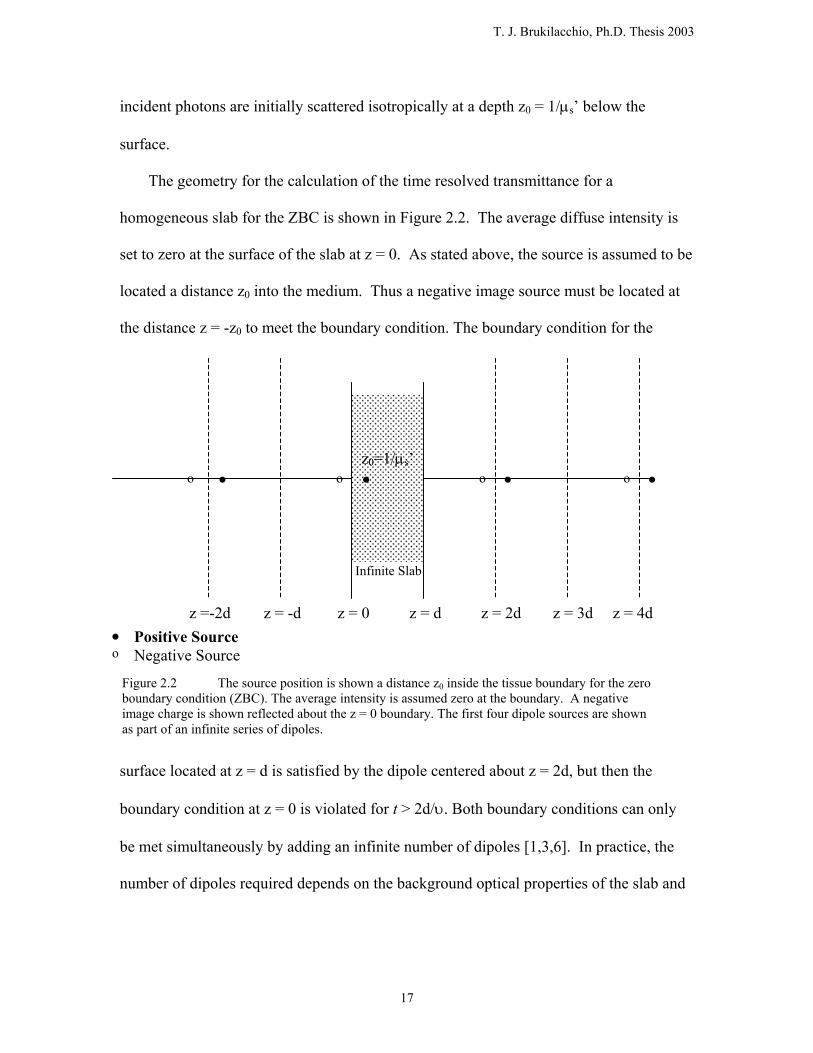
The geometry for the calculation of the time resolved transmittance for a
homogeneous slab for the ZBC is shown in Figure 2.2. The average diffuse intensity is
set to zero at the surface of the slab at z = 0. As stated above, the source is assumed to be
located a distance z0 into the medium. Thus a negative image source must be located at
the distance z = -z0 to meet the boundary condition. The boundary condition for the
surface located at z = d is satisfied by the dipole centered about z = 2d, but then the
boundary condition at z = 0 is violated for t > 2d/υ. Both boundary conditions can only
be met simultaneously by adding an infinite number of dipoles [1,3,6]. In practice, the
number of dipoles required depends on the background optical properties of the slab and
oo .
z = 0 z = d z = -d z = 2d z =-2d Positive Source Negative Source
. o
Infinite Slab
z0=1/µs’
Figure 2.2 The source position is shown a distance z0 inside the tissue boundary for the zero boundary condition (ZBC). The average intensity is assumed zero at the boundary. A negative image charge is shown reflected about the z = 0 boundary. The first four dipole sources are shown as part of an infinite series of dipoles.
o . .
z = 3d z = 4d
o .
T. J. Brukilacchio, Ph.D. Thesis 2003
18
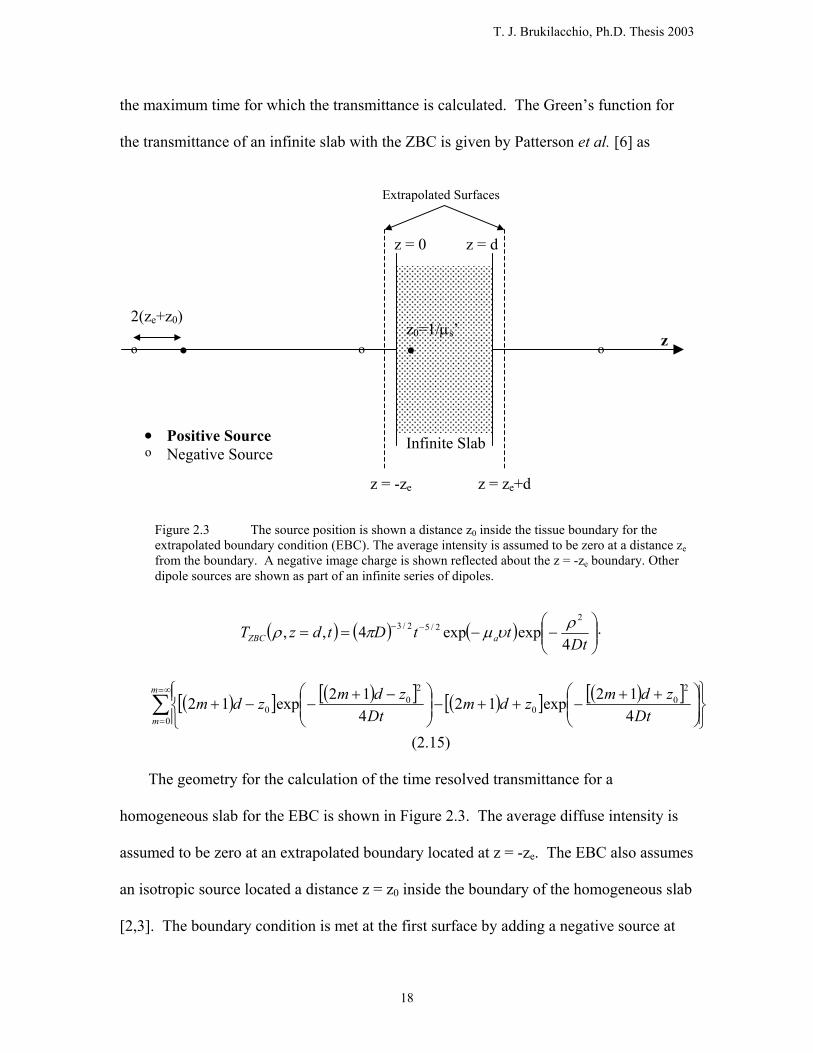
the maximum time for which the transmittance is calculated. The Green’s function for
the transmittance of an infinite slab with the ZBC is given by Patterson et al. [6] as
( ) ( ) ( ) ⋅
−−== −−
DtttDtdzT aZBC 4
expexp4,,2
2/52/3 ρυµπρ
( )[ ] ( )[ ] ( )[ ] ( )[ ]∑∞=
=
++−++−
−+−−+
m
m Dtzdmzdm
Dtzdmzdm
0
20
0
20
0 412exp12
412exp12
(2.15)
The geometry for the calculation of the time resolved transmittance for a
homogeneous slab for the EBC is shown in Figure 2.3. The average diffuse intensity is
assumed to be zero at an extrapolated boundary located at z = -ze. The EBC also assumes
an isotropic source located a distance z = z0 inside the boundary of the homogeneous slab
[2,3]. The boundary condition is met at the first surface by adding a negative source at
. o o o .
z = 0 z = d
z = -ze z = ze+d
2(ze+z0)
Positive Source Negative Source
. o
z
Extrapolated Surfaces
Infinite Slab
z0=1/µs’
Figure 2.3 The source position is shown a distance z0 inside the tissue boundary for the extrapolated boundary condition (EBC). The average intensity is assumed to be zero at a distance zefrom the boundary. A negative image charge is shown reflected about the z = -ze boundary. Other dipole sources are shown as part of an infinite series of dipoles.
T. J. Brukilacchio, Ph.D. Thesis 2003
19
the position z = -(ze+z0). Like for the case of the ZBC, the boundary conditions are not
met with just one dipole, but with an infinite number located at
( ) 0, 22 zzdmz em ++=+ for positive sources, and (2.16)
( ) 0, 222 zzzdmz eem −−+=− for negative sources
where ( ),.....2,1,0 ±±=m .
The transmittance of an infinite slab with the EBC is given by Contini et al. [3] as
( ) ( ) ( ) ⋅
−−== −−
DtttDtdzT aEBC 4
expexp4,,2
2/52/3 ρυµπρ
∑∞=
−∞=
−−
−
m
m
mm
mm Dt
zz
Dtz
z4
exp4
exp2
,2,2
2,1
,1 (2.17)
where
( ) 0,1 421 zmzmdz em −−−=
( ) ( ) 0,2 2421 zzmmdz em +−−−=
where ( ),.....2,1,0 ±±=m .
Contini et al. [3] showed that there are significant differences between the results of the
ZBC and the EBC in the case of transmittance through an infinite slab. The TPSF for the
ZBC (independent of n) showed and intensity significantly lower, the maximum occurs at
shorter times, and the slope at longer times is larger with respect to the EBC. It has been
shown for the EBC that µs’ may be overestimated by 10-20% and values of µa
underestimated by the order of 10% for conditions typical for a compressed breast. It is
clear that a reliable model for inversion procedures should account for the effect of
reflections at the boundary for the case of transmission measurements on a diffusing slab.
T. J. Brukilacchio, Ph.D. Thesis 2003
20
The differences between the results of the boundary conditions can be explained by the
redistribution of photons inside the slab due to reflections at the boundaries. For the case
of n = 1.4, more than 50% of the photons are reflected if an isotropic distribution for the
radiance is assumed. These photons continue to migrate through the slab. Thus, the
probability of photons exiting at longer distances and longer times is increased over the
ZBC.
For the case of reflection, there are significant differences in the intensity between
the ZBC and the EBC. The shapes, however, are substantially similar [3]. In practice, it
is difficult to measure absolute intensity, so in addition to fitting for the optical
properties, one would fit for the zero time and amplitude of the TPSF, i.e., source-
detector weight fitting. This implies that it is the shape and not the magnitude of the
TPSF that is important in the determination of the optical properties. Thus, for the case
of reflection, the ZBC results will be nearly indistinguishable from those of the EBC case
for large source-detector separations. The ZBC will deviate sooner, however, than the
EBC from the actual value as the source-detector separation becomes small.
2.1.4 The Heterogeneous Solution of the Diffusion Equation by the Perturbation
Approach.
The analysis of the above sections assumed a homogeneous scattering and absorbing
medium. Perturbation analysis represents a widely used method for evaluating small
heterogeneities buried within an otherwise homogeneous medium [4,5,11-13]. A first
order perturbation treatment of the diffusion equation indicates that a localized change in
absorption or scattering behaves like a new source term for which the effect can be
T. J. Brukilacchio, Ph.D. Thesis 2003
21
determined by a Green’s function approach. The perturbation to the photon distribution
is expressed as an integration over the areas where the changes in absorption or scattering
have occurred. The general condition of validity for this approximation is that the
perturbation should not vary significantly from the background optical properties.
The homogeneous diffusion approximation given in Equation (2.6)
( ) ( )0
20 , t , taD S
tυµ φ υ∂ − ∇ + + = ∂
r r (2.18)
where the zero subscripts denote the homogeneous diffusion and absorption coefficients,
can be written to take account of the dependency of the diffusion coefficient and
absorption coefficient on position by considering that small perturbations ( )aδµ r and
( )Dδ r in the absorption coefficient and the diffusion coefficient, respectively, result in a
change ( ), tδφ r in the photon fluence such that
( ) ( ) ( ) ( ) ( )20 0 , t , t , ta aD D S
tδ υ µ δµ φ δφ υ∂ − + ∇ + + + + = ∂
r r r r r . (2.19)
Subtraction of Equation (2.18) from Equation (2.19) gives
( ) ( ) ( ) ( ) ( )20 0 , t , t , ta aD D
tυµ δφ δ υδµ φ δφ∂ − ∇ + + = ∇ ⋅ ∇ − ⋅ + ∂
r r r r r . (2.20)
This perturbation equation is analogous to the diffusion Equation (2.18). The source term
now depends on the strength and distribution of the perturbation. The first Born
approximation consists of dropping the ( ), tδφ r from the source term under the condition
that ( ) ( ), t , tδφ φr r . The perturbation can be shown to have the form [11]
( ) ( ) ( ), t , t , ta Dδφ δφ δφ= +r r r (2.21)
where
T. J. Brukilacchio, Ph.D. Thesis 2003
22
( ) ( ) ( ) ( )t
0 d 0 s0
', t ' G ', t - t' ' - , ' '
Da
a d G t dtυδµ
δφ
= −
∫ ∫r
r r r r r r (2.22)
and
( ) ( ) ( ) ( )t
0 d 0 s0
', t ' G ', t - t' ' - , ' '
DD
Dd G t dt
υδδφ
= ∇ − ⋅∇
∫ ∫
rr r r r r r (2.23)
where G0 represents the Green’s function for a homogeneous slab given by [3]
( ) ( ) ( )2
3/ 2 d0 , t 4 exp exp
4aG Dt tDt
υ π µ υ− = − −
rr
( ) ( )2 2, ,exp exp
4 4
mm m
m
z z z zDt Dt
=+∞+ −
=−∞
− − − − −
∑ (2.24)
where the summation over positive and negative dipole image sources is given by
( ), 02 2m ez m d z z+ = + + for positive sources,
( ), 02 2 2m e ez m d z z z− = + − − for negative sources,
( )0, 1, 2,......m = ± ± . (2.25)
The source pulse of light is assumed to be at time t = 0. The detector, source and voxel
position vectors are given by rd , rs and r’, respectively.
Within the Born approximation, changes in absorption and scattering effect the
distribution of light both linearly and independently [11]. A heterogeneity of finite
volume is expected to saturate at a finite level as it differs more and more from the
background optical properties. This behavior is inconsistent with the linear dependency
predicted by Equation (2.21). The Born approximation thus overestimates the change
T. J. Brukilacchio, Ph.D. Thesis 2003
23
( ), tδφ r resulting from large perturbations from the background properties. This
accuracy can be improved through iterative approaches [5].
The forward problem can be simplified by pre-calculating the “Forward Matrices” Aa
for absorption and AD for scattering as
( ) ( ) ( )d s 0 d 0 s0
, , ', t ', t - t' ' - , ' 't
aA G G t dt= −∫r r r r r r r (2.26)
( ) ( ) ( )d s 0 d 0 s0
, , ', t ', t - t' ' - , ' 't
DA G G t dt= ∇ − ⋅∇∫r r r r r r r (2.27)
for all values of rd, rs, r’, and t. The calculation assumes a priori knowledge of the
background optical properties. The forward matrix must take into account the impulse
response of the measurement system and can do so by convolution. The fluence
attributable to the heterogeneity will now be given by
( ) ( ) ( )d s, t ' ' ' , , ', ta a ar dr Aδφ δµ= −∫r r r r r (2.28)
( ) ( ) ( )d s, t ' ' ' , , ', tD Dr D dr Aδφ δ= −∫r r r r r (2.29)
The magnitude of the scattered field for both absorption and scattering depend on the
product of the heterogeneity volume and δµa or δD, respectively [4]. Thus, it is not
possible to determine both the size and magnitude of the heterogeneity simultaneously in
the linear approximation. Boas points out that in general, at least three moments need to
be detectable to permit full characterization of the heterogeneity [14].
T. J. Brukilacchio, Ph.D. Thesis 2003
24
2.1.5 The Inverse Problem and Image Reconstruction
The Equations (2.28) and (2.29) for the fluence resulting from an absorption or
scattering heterogeneity can be discretized to yield the following system of linear
equations
( )( )
( )( )
( )( )
d s
d s
, t , , ', t , t, t , , ', t , t
a a a
D D
AA D
δφ δµδφ δ
=
r r r r rr r r r r
. (2.30)
This linear system is ill-posed and underdetermined. Therefore, some type of
regularization or stabilization technique is required. Several techniques have been
implemented including algebraic approaches consisting of the Algebraic Reconstruction
Technique (ART) and a modification of ART referred to as the Simultaneous Iterative
Reconstruction Technique (SIRT), subspace approaches including Truncated Singular
Value Decomposition (TSVD) and Truncated Conjugate Gradient (TCG), and
regularization approaches such as the classic Tikhonov regularization [4].
The Time-Domain Breast Imaging System makes use of the SIRT algebraic method.
The large number of measurements resulting from the multiple time gates makes matrix
inversion techniques impractical due to computer memory limitations. SIRT is a
variation of ART that sequentially projects estimates onto a hyperplane defined by a
particular row of the linear system [5,15]. In general, SIRT generates smoother
reconstruction of the object function relative to ART, as it averages over a number of
projections. This comes, however, at the expense of slower convergence. The SIRT
algorithm can be expressed as
i-1 ji i-1 j
j j
jb −= −
T
T
x ax x a
a a (2.31)
T. J. Brukilacchio, Ph.D. Thesis 2003
25
for the linear system ˆ⋅a x = b , where bj represents the set of measurements, aj represent
the A weights of the forward matrix, and xi represent the set of unknown object functions.
One of the primary advantages of using algebraic techniques instead of matrix inversion
is that hard constraints can be used, given some a priori knowledge, such as the
reconstructed absorption should always be positive. For instance, at the end of each
SIRT iteration, any voxel with negative absorption could be assigned a zero magnitude.
As mentioned, above, the δµa and δD – volume products are conserved within the first
Born approximation. The SIRT algorithm moves through a family of solutions with
increasing absorption or scattering with decreasing volume as the number of iterations
increases [5]. Thus, one must make some reasonable guess as to when the number of
iterations both maximizes the contrast-to-noise ratio and is representative of expected
size and optical properties. One tool that has been shown to help is the L-Curve analysis,
which plots the residual between the measured and theoretical optical properties and the
image norm.
2.2 Breast Tissue Anatomy and Optical Properties
The anatomy of the female breast is described to derive insight into tissue structures
and characteristics that may provide optical contrast. Both benign and cancerous lesions
of the breast are described along with the four primary chromophores relevant to optical
imaging. The breast tissue is shown to have low concentrations of hemoglobin relative to
other tissue types. The concentrations of lipids and water are shown to be in relative
abundance in the breast. Thus, errors would arise in the determination of blood volume
T. J. Brukilacchio, Ph.D. Thesis 2003
26
and oxygen saturation if lipids and water were to be ignored as they often can be in other
tissue types.
2.2.1 Breast Tissue Anatomy
The human female breast has a very complex anatomy and physiology that can be
quite variable depending on age, hormonal status, lifestyle and genetic background [21-
24]. Thus, it is difficult to define “normal” breast tissue, as the organ is constantly
changing. Some generalizations can be made, such as changes that occur with age. This
discussion begins with the anatomy of the “normal” pre-menopausal female breast,
followed by a discussion of changes that occur due to menopause. The sources of optical
contrast for both absorption and scattering are described. This section concludes with a
discussion of both the benign and cancerous lesions that can occur along with their
associated optical contrast.
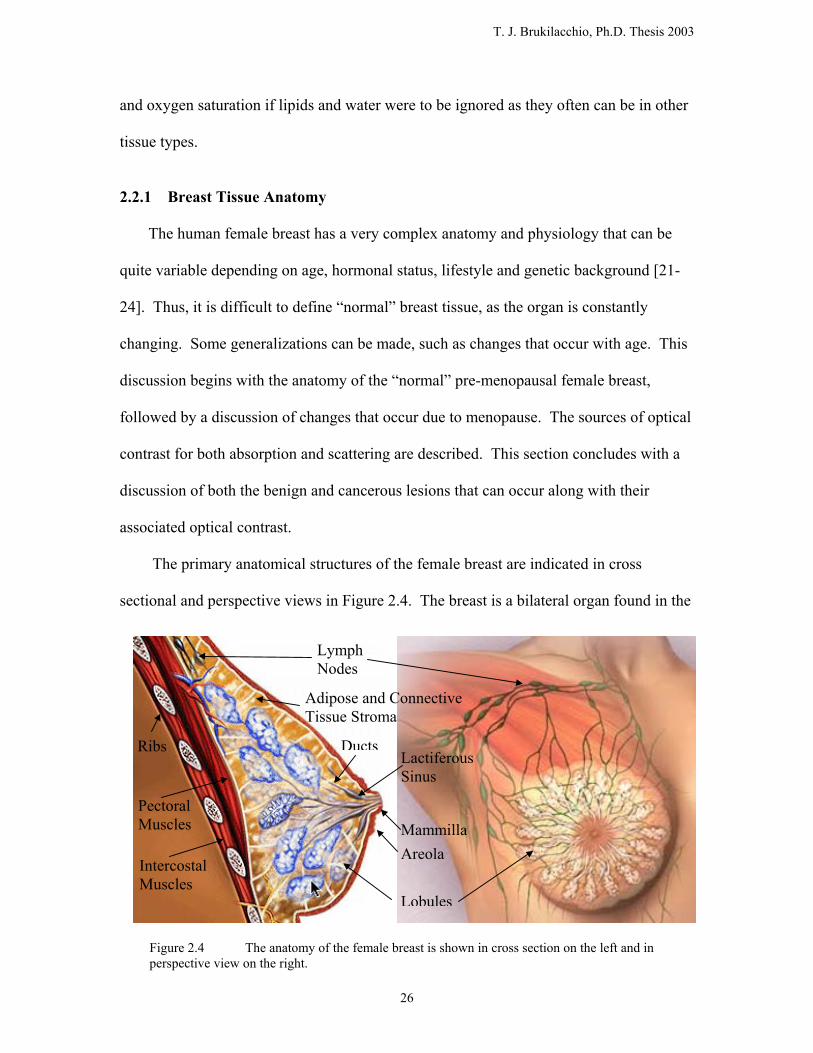
The primary anatomical structures of the female breast are indicated in cross
sectional and perspective views in Figure 2.4. The breast is a bilateral organ found in the
Intercostal Muscles
Ribs
Pectoral Muscles Mammilla
Areola
Lobules
DuctsLactiferous Sinus
Adipose and Connective Tissue Stroma
Lymph Nodes
Figure 2.4 The anatomy of the female breast is shown in cross section on the left and in perspective view on the right.
T. J. Brukilacchio, Ph.D. Thesis 2003
27
skin and subcutaneous tissues of the anterior chest [21,22]. The skin consists of two
primary layers. The superficial epidermis contains keratins and melanin. The underlying
dense collagenous dermis contains a rich plexus of dermal blood and lymphatic vessels
that lie close to the skin surface. Adipose tissue (fat) lies beneath the skin, which covers,
surrounds, and intermixes with the light pinkish-tan breast glandular tissue and its white
fibrous tissue stroma (Copper’s ligaments). Adipose tissue is bright yellow in adult
humans due to the accumulation of carotene in the lipids and fat cells. The breast is
generally well supplied with blood, but more vessels are found in the glandular than in
the fibrous or adipose stroma. Lymphatic vascular channels course through the skin and
breast tissues draining interstitial (edema) fluids in both the normal and diseased breast.
Additionally, the breast tissue and skin are supplied with numerous small nerves.
The lobule is the basic functional unit of the glandular breast and is formed of
convoluted tubular ducts surrounded by an ellipsoidal volume of loose fibrous connective
tissue [21,22]. Lobules vary in size from about 0.05 to 0.3 -0.5 cm in the greatest
dimension depending on hormonal status. Clusters of lobules empty into interlobular
ducts and then into larger extralobular ducts. The lobular clusters and their associated
duct systems form into 15 – 20 lobes. Each of the lobes is drained by one large
lactiferous duct that travels to the mammilla (nipple) for the discharge of milk in the
lactating breast. The Cooper’s ligaments consist of bands of dense fibrous collagenous
tissue that form a 3-dimensional scaffolding extending from the dermis to the
subcutaneous facia, a thin fibrous sheet separating the breast tissue from the underlying
muscles of the chest. Adipose tissues are intermixed in varying amounts within the
glandular breast stroma, depending on a patients body mass index (BMI), age, genetics
T. J. Brukilacchio, Ph.D. Thesis 2003
28
and lifestyle. The BMI scale is determined by dividing the body mass (Kg) by height
squared (m). Numbers between 20 and 25 are considered normal [23]. There is a general
increasing trend in breast lipid mass density with increasing BMI.
The lobular ducts are lined with a two-cell layer of glandular epithelium, which
along with the surrounding loose fibrous stroma, undergoes considerable changes in
response to hormones produced during the 28-day menstrual cycle or in pregnancy and
lactation. Blood flow can increase by 50% at the time of ovulation (midcycle) and
remains high until menstruation. Some women experience as much as a 20%
enlargement of their breasts by the end of their monthly cycle. This enlargement resolves
during the period of menstrual bleeding when ovarian hormones are at their lowest levels.
The lobules become enlarged during pregnancy by ductal proliferation and
differentiation into secretory units in response to continued high levels of hormones
produced by the ovary, pituitary and placenta [21]. The glandular breast volume is more
dominant than that of the compressed fibrous and fat stroma by the time the baby is born.
The large lobular clusters become engorged with milk during lactation. The glandular
breast volume continues to dominate as long as lactation continues.
The breast lobules atrophy over a long period due to the cessation of ovarian
hormonal function associated with menopause (45-55 years of age), unless the woman
takes exogenous hormones (estrogen and progesterone) [21]. The average total volume
of the lobular component shrinks from a peak of 25 – 35% at 35 years of age to less than
5% after 60 years of age. The relative fat and fibrous stroma volumes remain variable
after menopause, but there is a general increase in both components with a predominance
of adipose tissue after 60 years of age.
T. J. Brukilacchio, Ph.D. Thesis 2003
29
2.2.2 The Nature of Scattering in Breast Tissue
The scattering of visible and near-infrared photons in breast tissue is a consequence
of localized differences in the index of refraction of cellular and extracellular components
[21,25]. Cellular components include membrane-bound subcellular organelles such as
the nuclei (6 – 8 µm in noncancerous breast epithelial cells), mitochondria (< 1 µm),
secretory vacuoles (1 – 10 µm), and other similarly sized intracytoplasmic granules.
These components influence scattering due to differences in refractive index at
membrane interfaces. The macroscopic average refractive index of most tissues lies
between 1.38 and 1.41 in the near infrared [25]. Adipose tissue, however, has a refractive
index of approximately 1.46. Microscopically, the refractive index of tissue varies
spatially, with a lower refractive index in the cytosol, which is primarily an aqueous
solution of salts and proteins with n = 1.38, and higher in the membrane structures with n
= 1.48, consisting of phospholipid bilayers. The majority of scattering has been shown
by Mie theory to be due to structures within the cell as opposed to the cell membrane
[25]. The cell membrane has been shown to be responsible for the scattering at small
angles, the nucleus for slightly larger angles, while the more isotropic scattering is due to
small organelles within the cell, such as mitochondria. Scattering decreases with
increasing wavelength to varying degrees depending on the size of the scattering centers.
The scattering power (exponent dependence on the wavelength) is bounded between
about slightly over 1 for Mie theory (scattering center size on order of wavelength) and 4
for Rayleigh scattering (scattering center size much less than the wavelength), although
on average the exponent is closer to 1. Scattering by tissue is generally quite anisotropic
(forward scattering) due to the size and elongated shape of the scattering centers.
T. J. Brukilacchio, Ph.D. Thesis 2003
30
2.2.3 Absorption in Breast Tissues
The most important absorbers (chromophores) in the human breast are hemoglobin,
melanin, water, lipids, carotene, proteins and DNA [21,23,25]. In the near infrared part of
the spectrum, carotene, proteins and DNA have negligible absorption. The epidermal
cells, located at the junction of the epidermis and dermis, contain melanin densely packed
into organelles called melanosomes. Melanin is a highly absorptive pigment that is
particularly prominent in patients with dark skin. It is difficult to measure absolute
intensity for any given source and detector pair in optical tomography, so source and
detector weights are generally fitted for in the reconstruction algorithms. The extinction
coefficient of melanin is relatively flat in the near infrared with no observed peaks and
decreases somewhat with increasing wavelength [25]. Since melanin is substantially
localized in the outer dermal layers of the breast, its attenuating effect could be fit for in
much the same way that attenuation due to differences in optical fiber transmission or
detector-to-detector sensitivity are fit for. This leaves hemoglobin, lipids, and water as
the primary chromophores in the physiological window between about 650 and 1000 nm.
Lying just beneath the epidermis is a vascular, blood-rich dermis in which small
arteries, veins, and capillaries form dense networks close to the epidermis. Thus, both
melanin and hemoglobin are concentrated in well-defined layers within the first 1 to 2
mm of the skin surface. Thus, the effects of the hemoglobin in this superficial layer can
be corrected for, as was melanin, because the fitting parameters are wavelength
dependent.
The upper layer of adipose tissue lies just below the dermis. The blood supply and
flow is greater in the deeper lying glandular areas in comparison to the adipose tissue.
T. J. Brukilacchio, Ph.D. Thesis 2003
31
Blood flow in the glandular breast varies during the menstrual cycle, pregnancy, and
lactation [21]. The density of blood vessels decreases in the breast as a woman ages and
post-menopausal atrophy sets in.
2.2.4 Benign Breast Lesions
Fibroadenomas are the most frequent of benign breast tumors occurring in about
10% of adult women [21]. Fibroadenomas are firm, circumscribed, light tan nodules
formed as a result of proliferation of fibroblasts, fibrous breast lobular stroma, and to a
lesser extent, breast ducts [21,22]. They tend to appear first in young women, persisting
as the woman ages, sometimes fluctuating in size relative to age. Frequently,
fibroadenomas are surrounded by lesions of fibrocystic disease of the breast. Very
infrequently, fibroadenomas can harbor noninvasive or invasive carcinomas, cancers that
arise from the breast ductal epithelium. The most prominent fibroadenoma
chromophores would be water and hemoglobin. Essentially no adipose tissue is found in
fibroadenomas. Thus, relative to background optical properties, fibroadenomas would be
expected to have higher absorption and higher scattering.
Fibrocystic disease or fibrocystic change of the breast covers a broad spectrum of
benign localized or diffuse stromal and glandular alterations that can produce diffuse
masses, distinct tumors, and/or nonpalpable lesions. The greatest problem that
fibrocystic change presents to diagnostic imaging is that many of the ductal proliferative
lesions mimic the anatomic structure of cancers [21]. In fact, many cancers can be
obscured by the fibrocystic disease. The ‘dense breast’ that causes difficulty in X-ray
mammography is usually due to the dense fibrosis of fibrocystic change. Microscopic
T. J. Brukilacchio, Ph.D. Thesis 2003
32
calcifications can be present in fibrocystic disease although, most of the time, the
distribution and size of the calcifications are different from those of cancer calcifications.
In general, the most likely optical contrast due to fibrocystic disease would manifest as
increased scattering.
Benign fluid filled cysts that may be due to apocrine metaplasia of the lobular acinar
epithelium can range in size from microscopic to many cubic centimeters in volume [22].
The increased secretion of the cells is not balanced by increased resorption, resulting in
dilation of the lobule. The generally dark brown fluid found in the cysts contains
degenerated cells, secretions and blood that may or may not have distinctive absorption
properties. Cysts are likely to be characterized by significantly lower scatter, however,
relative to the background.
Lipomas are benign fat tumors comprised of mature adipose cells. These yellow
lesisons generally have similar scattering characteristics as the surrounding fat, but may
have more blood vessels, which could provide optical contrast relative to surrounding fat
[21].
2.2.5 Cancers of the Breast
Cancer is the culmination of a series of genetic events that lead to unchecked
proliferation of cells in a primary site followed by further genetic mutations that allow
these cells to invade into surrounding tissues, breech the walls of blood vessels and
lymphatics to travel to distant tissues and establish new growth (metastases) in these
distant tissues [22]. Cancer cells are not recognized as belonging to the host and will
thereby elicit immune responses. They can secrete various growth factors and cytokines
T. J. Brukilacchio, Ph.D. Thesis 2003
33
that stimulate host responses of inflammation, blood vessel proliferation (cancer related
angiogenesis) and fibrosis (desmoplasia). Some cancers, including breast carcinomas,
elicit substantial host responses. Tumors formed by these cancers can be as much as 90%
non-cancerous host cells and tissues with dense fibrous connective tissue predominating.
Thus, the diagnostically important chromophores of cancers can be found either in the
cancer cells themselves or in the tissues of the host response to the malignant growth.
Carcinoma is the most frequent cancer of the female breast and is derived from the
epithelium of the breast ducts and lobules. Ductal carcinomas are thought to have their
origin in the larger intra- and extra-lobular ducts, while lobular carcinomas are thought to
originate in the terminal lobular glandular ducts [21,22]. Carcinomas are also classified
according to their location. Carcinomas confined within the ducts and lobular glands are
called ductal carcinoma in situ (DCIS) and lobular carinoma in situ, respectively. In situ
carcinomas have not undergone genetic changes necessary for them to invade
surrounding tissue. The carcinomas are classified as infiltrating ductal carcinoma and
infiltrating lobular carcinoma depending on their diagnostic histological appearances,
once the cells have acquired the ability to invade. Frequently, in situ and invasive
carcinomas are found in the same cancer mass and can be present in several sites
throughout the same or opposite breast. About 85 to 90% of all infiltrating carcinomas
are infiltrating ductal carcinomas, with the balance comprised of infiltrating lobular
carcinomas [21].
It is likely that the success of optical diagnosis of breast carcinoma rests on the
alterations produced by the tissues of the host response rather than direct detection of
cancer cells [21]. The host responses include infiltrates of lymphocytes and other
T. J. Brukilacchio, Ph.D. Thesis 2003
34
inflammatory cells of immune response, desmoplasia with fibroblast proliferation and
fibrosis, angiogenesis in response to fibroblastic and vascular growth factor produced by
the carcinoma cells, and wound healing associated with hemorrhage. These responses
can lead to scattering and absorption contrast relative to normal tissues and hold the
promise of optical detection.
Angiogenesis is the formation of new blood vessels derived from surrounding
existing blood vessels stimulated by various growth factors due to the genetic mutations
of cancers [21]. The new vessels are generally concentrated on the periphery of the
lesion forming an intertwining network resembling densely branched bushes. These new
blood vessels are thin walled, dilated, lined by leaky endothelium that contains gaps
exposing underlying cancer and host cells, and inclined to degenerate, leading to necrosis
of the blood-deprived cancer. In situ and infiltrating ductal carcinomas as well as
infiltrating lobular carcinomas elicit angiogenesis. A dense layer of new capillaries is
stimulated to grow as a vascular cuff around the ducts containing the DCIS. In general,
vascular densities are increased at the periphery and within infiltrating ductal and lobular
carcinomas, but densities can show considerable variation. Thus, in general an increase
in blood volume and a decrease in oxygen saturation would be expected to be associated
with cancerous tumors [21,26-28].
2.2.6 Breast Tissue Chromophores
The wavelength dependent absorption coefficient of breast tissue is equal to the sum
of the products of all significant chromophore extinction coefficients ει [cm-1M-1] and
concentrations Ci [M] as
T. J. Brukilacchio, Ph.D. Thesis 2003
35
( ) ( ) i
i
ia Cλελµ ∑=1
(2.32)
where a dependency on wavelength λ is indicated for both the absorption and extinction
coefficients. The total mean transmittance T experienced at a particular wavelength
over a given mean path through tissue is given by the Beer-Lambert Law [29] as
( )LIIT aµexp/ 0 == (2.33)
where I is the final intensity after passing through the tissue, I0 is the initial intensity
incident on the tissue, and L is the mean path through the tissue, given by tυ for a
time-domain system where the time in brackets is the mean flight time of photons
through the tissue.
The total hemoglobin concentration [THC] is given by
[ ] [ ] [ ]HbOHbTHC += (2.34)
where [Hb] and [HbO] are the concentration of deoxy-hemoglobin and oxy-hemoglobin,
respectively [23]. Another important metabolic blood parameter is the oxygen saturation
defined by [23]
[ ][ ]THCHbOOSt =2 . (2.35)
Tumors are generally associated with angiogenisis and exhibit an increase in metabolism
and blood flow relative to normal tissue, especially at the tumor periphery. This would
be expected to result in a decrease in oxygen saturation and an increase in total
hemoglobin concentration. Thus, NIR imaging is expected to be sensitive to functional
changes indicative of tumor formation.
T. J. Brukilacchio, Ph.D. Thesis 2003
36
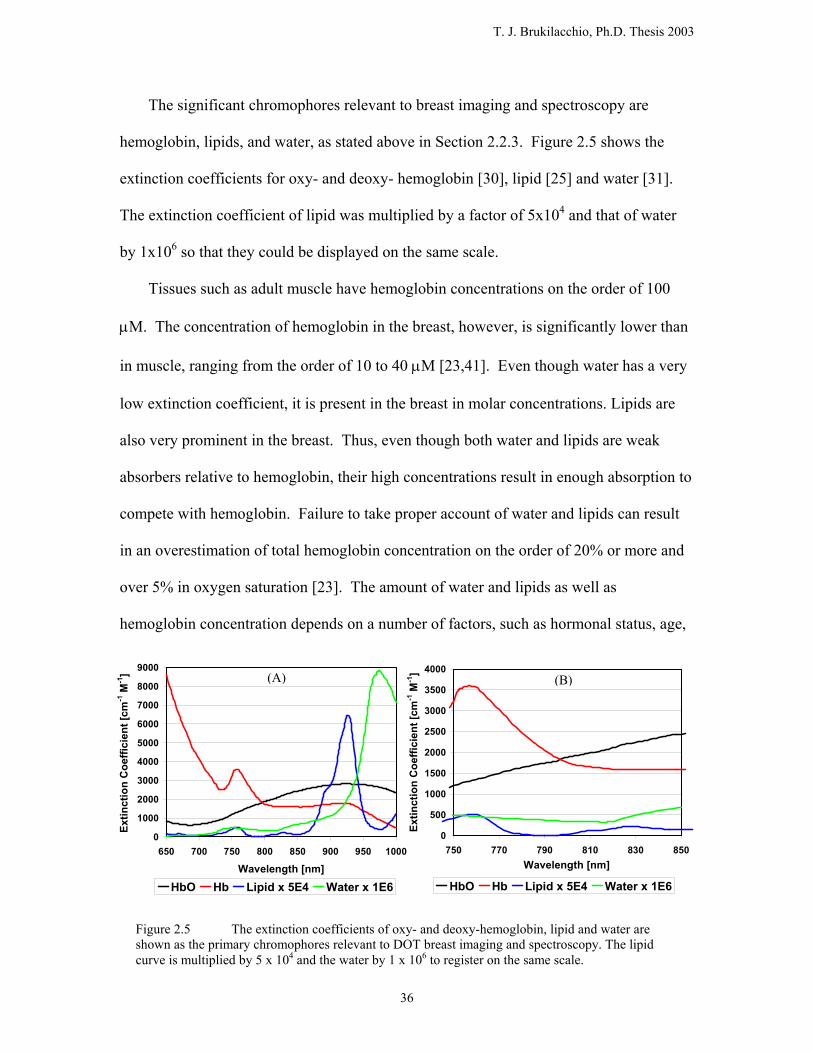
The significant chromophores relevant to breast imaging and spectroscopy are
hemoglobin, lipids, and water, as stated above in Section 2.2.3. Figure 2.5 shows the
extinction coefficients for oxy- and deoxy- hemoglobin [30], lipid [25] and water [31].
The extinction coefficient of lipid was multiplied by a factor of 5x10⁴ and that of water
by 1x10⁶ so that they could be displayed on the same scale.
Tissues such as adult muscle have hemoglobin concentrations on the order of 100
µM. The concentration of hemoglobin in the breast, however, is significantly lower than
in muscle, ranging from the order of 10 to 40 µM [23,41]. Even though water has a very
low extinction coefficient, it is present in the breast in molar concentrations. Lipids are
also very prominent in the breast. Thus, even though both water and lipids are weak
absorbers relative to hemoglobin, their high concentrations result in enough absorption to
compete with hemoglobin. Failure to take proper account of water and lipids can result
in an overestimation of total hemoglobin concentration on the order of 20% or more and
over 5% in oxygen saturation [23]. The amount of water and lipids as well as
hemoglobin concentration depends on a number of factors, such as hormonal status, age,
0
1000
2000
3000
4000
5000
6000
7000
8000
9000
650 700 750 800 850 900 950 1000
Wavelength [nm]
Extin
ctio
n C
oeffi
cien
t [cm
-1 M
-1]
HbO Hb Lipid x 5E4 Water x 1E6
0
500
1000
1500
2000
2500
3000
3500
4000
750 770 790 810 830 850Wavelength [nm]
Extin
ctio
n C
oeffi
cien
t [cm
-1 M
-1]
HbO Hb Lipid x 5E4 Water x 1E6
Figure 2.5 The extinction coefficients of oxy- and deoxy-hemoglobin, lipid and water are shown as the primary chromophores relevant to DOT breast imaging and spectroscopy. The lipid curve is multiplied by 5 x 10⁴ and the water by 1 x 10⁶ to register on the same scale.
(A) (B)
T. J. Brukilacchio, Ph.D. Thesis 2003
37
and menstruation [21-23]. Following ovulation, blood flow to the breast can increase by
up to 50%, the breast volume increases, and parenchymal water content changes by an
average of 25% during the latter half cycle. Tissue is typically about 60% water by mass,
and the mammary gland in particular may have 30-73% water by mass [23]. Lipids make
up about 19% of tissue by mass, and can range from 5-56% in the mammary gland.
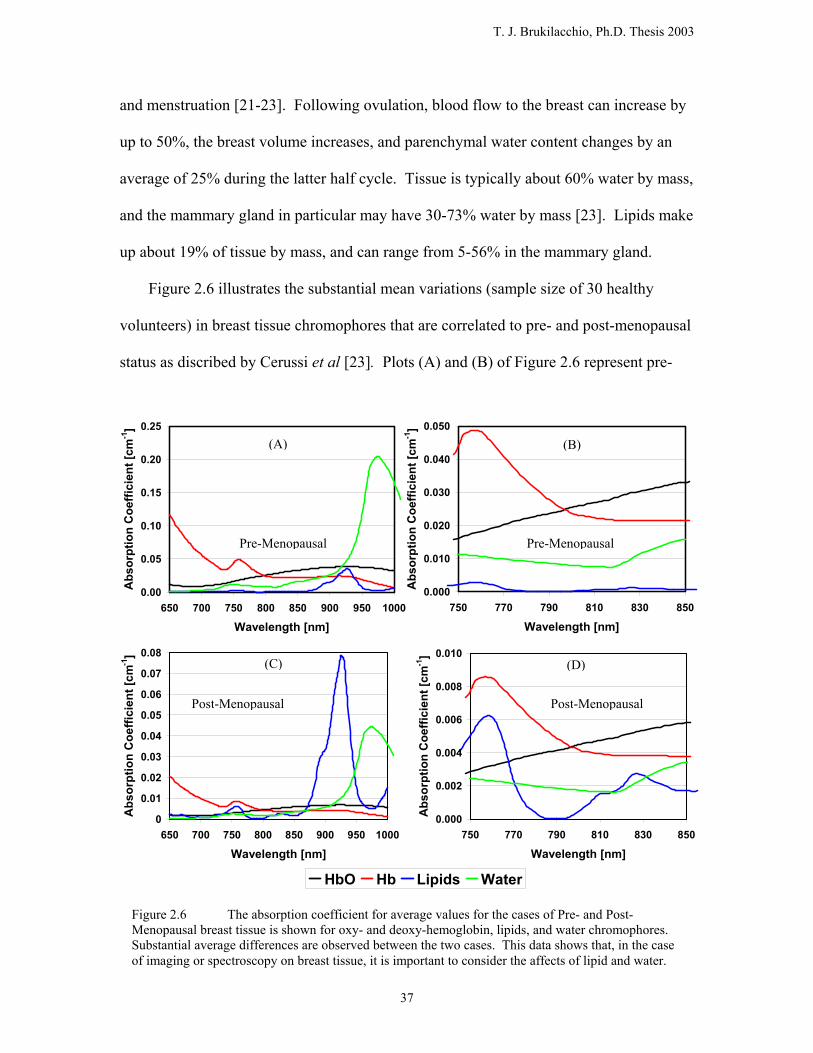
Figure 2.6 illustrates the substantial mean variations (sample size of 30 healthy
volunteers) in breast tissue chromophores that are correlated to pre- and post-menopausal
status as discribed by Cerussi et al [23]. Plots (A) and (B) of Figure 2.6 represent pre-
HbO Hb Lipids Water
0.00
0.05
0.10
0.15
0.20
0.25
650 700 750 800 850 900 950 1000
Wavelength [nm]
Abs
orpt
ion
Coe
ffici
ent [
cm-1
]
0.000
0.010
0.020
0.030
0.040
0.050
750 770 790 810 830 850
Wavelength [nm]
Abs
orpt
ion
Coe
ffici
ent [
cm-1
]
0
0.01
0.02
0.03
0.04
0.05
0.06
0.07
0.08
650 700 750 800 850 900 950 1000
Wavelength [nm]
Abs
orpt
ion
Coe
ffici
ent [
cm-1
]
0.000
0.002
0.004
0.006
0.008
0.010
750 770 790 810 830 850
Wavelength [nm]
Abs
orpt
ion
Coe
ffici
ent [
cm-1
]
(A) (B)
(C) (D)
Pre-Menopausal Pre-Menopausal
Post-Menopausal Post-Menopausal
Figure 2.6 The absorption coefficient for average values for the cases of Pre- and Post-Menopausal breast tissue is shown for oxy- and deoxy-hemoglobin, lipids, and water chromophores. Substantial average differences are observed between the two cases. This data shows that, in the case of imaging or spectroscopy on breast tissue, it is important to consider the affects of lipid and water.
T. J. Brukilacchio, Ph.D. Thesis 2003
38
menopausal status, representative of women typically under 50 years of age. Plots (C)
and (D) of Figure 2.6 represent post-menopausal status, typical of women over the age of
50. Pre-menopausal spectra show significantly higher concentrations of hemoglobin and
more water relative to lipids in comparison with post-menopausal spectra. The pre-
menopausal breast has a greater density of vascular glandular tissue in comparison to the
post-menopausal breast for which the glandular tissue begins to atrophy into fatty tissue
because of the cessation of ovarian estrogen production [21,23]. The data also indicates
an increase in oxygen saturation for post-menopausal breast tissue, which may be
indicative of reduced metabolic requirements. Cerussi et al. also point out that there is a
decrease in the mean scattering coefficient on the order of 30% for post-menopausal
relative to pre-menopausal tissue. This change in scattering would be consistent with a
change in breast structure associated with menopause. Cerussi et al. point out that the
wide variations in the data due to menstrual cycle differences and gynecological age,
decrease substantially around the age of 50 to 55. The study suggests that neglecting the
effect of water and lipids has the effect of making it appear that there is more oxygenated
blood in the breast tissue. The problem may be particularly acute for the case of the post-
menopausal breast as indicated by plot (D) of Figure 2.6.
The practical limitations of the instrumentation used to assess the optical properties
of breast tissue must be considered. In particular, the Time-Domain Breast Imaging
System of this dissertation is limited to wavelengths between 750 and 850 nm by the
range of the Spectra-Physics Ti:Sapphire laser. Additionally, many of the detector
systems used in DOT that employ photomultiplier technology fall off precipitously in
response beyond about 850 nm. With reference to plots (B) and (D) of Figure 2.6, the
T. J. Brukilacchio, Ph.D. Thesis 2003
39
lipid spectrum is shown to have an absorption peak very close to that of deoxy-
hemoglobin near 760 nm. Lipid also shows a minimum near 790 nm and another peak
near 825 nm. Water, on the other hand, has very little structure and is relatively flat in its
absorption spectrum over the 750 to 850 nm spectrum. Also, note that the relative
proportion of water in comparison with hemoglobin is similar for both the pre- and post-
menopausal breast. Franceschini et al. [32] have suggested a correction factor to the total
absorption coefficient in the breast, assuming a water concentration of 70%. While this
general approach seems reasonable for the case of the pre-menopausal breast, it may be
expected to lead to quantitative errors in the case of post-menopausal breast as indicated
in plot (D) of Figure 2.6. The practical limitations imposed by patient tolerance on
clinical measurement time, however, may restrict measurements to just two to three
wavelengths. Thus, it may not be feasible to derive concentrations of oxy- and deoxy-
hemoglobin, lipids, and water from measured data. In that case, the approach suggested
by Franceschini et al. may be the best general approach. The a priori knowledge of a
patients gynecological age could be used to apply some typical correction factor for both
lipids and water. This approach would not account for the significant variations observed
for pre-menopausal breasts, but it would likely offer improved quantitative accuracy over
the approach of totally neglecting the effects due to lipids and water in the breast.
One source of quantitative error in the calculated oxygen saturation values generally
overlooked in the literature is due to the presence of carboxyhemoglobin (HbCO).
Carbon monoxide has a significantly higher affinity for hemoglobin in comparison with
oxygen. It binds with hemoglobin and prevents association with oxygen, thereby
depressing the oxygen saturation. The extinction of HbCO is significantly reduced and
T. J. Brukilacchio, Ph.D. Thesis 2003
40
distinct from that of HbO in the near infrared. The fraction of hemoglobin in the form of
HbCO is generally sufficiently low, on the order of 1.5%, as to be negligible. For heavy
smokers, however, the fraction can be as high as 15% and can significantly affect the
determination of blood volume and saturation [33-35]. It can lead to an overestimation of
oxygen saturation in the case of a heavy smoker on the order of several percent.
Unfortunately, accurate quantification of HbCO would require a multi-wavelength, multi-
component analysis, which as mentioned above, is not always clinically feasible, given
limitations of maximum acquisition time and limitations of the instrumentation.
If the only two chromophores considered are oxy- and deoxy-hemoglobin [32,36-
38], then a minimum of two wavelengths are required for the determination of [Hb] and
[HbO]. From Equation (2.32)
[ ] [ ] 111 λλλ εεµ HbOHba HbOHb += (2.36)
[ ] [ ] 222 λλλ εεµ HbOHba HbOHb += (2.37)
where 1λµa and 2λµa are the absorption coefficients at wavelengths λ1 and λ2, respectively,
1λεHb and 2λεHb are the extinction coefficients for deoxy-hemoglobin at wavelengths λ1 and
λ2, respectively, and 1λεHbO and 2λεHbO are the extinction coefficients of oxy-hemoglobin at
wavelengths λ1 and λ2, respectively. This set of two equations and two unknowns is
easily solved for the concentrations of oxy- and deoxy-hemoglobin as
[ ]1221
1221
λλλλ
λλλλ
εεεεεµεµ
HbOHbHbOHb
HbOaHbOaHb−−
= (2.38)
[ ]1221
2112
λλλλ
λλλλ
εεεεεµεµ
HbOHbHbOHb
HbaHbaHbO−−
= . (2.39)
T. J. Brukilacchio, Ph.D. Thesis 2003
41
The total hemoglobin concentration [THC], i.e. blood volume, is readily determined from
Equation (2.34) and the oxygen saturation StO2, from Equation (2.35). Equation (2.32)
could readily be extended to include multiple wavelengths and multiple chromophores.
Multivariate linear regression and principal components analysis techniques can be used
to solve the system of linear equations, particularly when one analyte has an effect on
another, such as would be the case for the several forms of hemoglobin [33,34,39,40].
Optical tomography often does not determine the absolute concentrations of
hemoglobin or the absolute absorption coefficients, rather the change [ ]Hb∆ , [ ]HbO∆ ,
and aδµ [36]. The forward models assume a small perturbation of aδµ on an otherwise
homogeneous background. Errors in the determination of the background optical
properties could lead to significant errors in the reconstructed images [37].
The simplifying assumption that breast tissue is homogeneous limits the validity of
DOT. Some investigators have modeled structured layers [17,32], but even these models
can’t account for large asymmetric heterogeneous regions that may more accurately
reflect real breast tissues. More precise imaging will likely require more sophisticated
models in the future.
2.2.7 Optical Properties of Breast Tissue
A study of 52 healthy female breast tissues was measured in vivo in parallel plate
transmission geometry to establish data for the range of optical properties [41]. The
instrument was based on frequency-domain techniques at a modulation frequency of 140
MHz and wavelengths of 750, 786, and 830 nm. The absorption coefficients µa, varied
from just under 0.02 cm-1 to 0.08 cm-1, with a mean of 0.41 ± 0.025 cm-1 at 786 nm. The
T. J. Brukilacchio, Ph.D. Thesis 2003
42
reduced scattering coefficients µs’ varied from 4 to 14 cm-1 at 786 nm with a mean of 8.5
± 2.1 cm-1. Blood oxygen saturation varied from 50 to 80 % with a mean of 68 ± 8 %,
while blood volume ranged from 10 to 50 µM with a mean of 34 ± 9 µM. The study did
not supply information regarding the age, menstrual cycle or hormonal status of the
women or the degree of compression, so it is difficult to assess how these factors may
have skewed the data. Nevertheless, the data gives us an idea of the range of optical
constants that may encountered in a clinical setting.
2.3 Summary
The widely used diffusion approximation to the radiative transport equation was
discussed along with solutions specific to transmission through a slab applicable to breast
imaging. The well-known Born approximation was used as a perturbative approach to
derive analytical expressions for the scattered field due to small heterogeneities within a
homogeneous slab. Methods for solving the inverse problem using SIRT techniques
were also discussed.
The anatomy of the female breast was shown to be complex relative to the simple
model assumptions. Sources of optical contrast for both the healthy and diseased breast
were described. The absorption due to both water and lipids was shown to be significant
in optical breast imaging, particularly for the post-menopausal breast. A simple method
of determining hemoglobin saturation and volume based on as few as two wavelengths
was described.
Finally, ranges for optical properties of the breast were discussed. Knowledge of
these typical ranges is important to consider for the optimization of instrumentation
design.
T. J. Brukilacchio, Ph.D. Thesis 2003
43
Chapter 2 References
1. S. R. Arridge, M. Cope, and D. T. Delpy, “The theoretical basis for the determination of optical pathlengths in tissue: temporal and frequency analysis,” Phys. Med. Biol. 37, 1531-1560 (1992).
2. A. H. Hielscher, S. L. Jacques, L. Wang, and F. K. Tittel, “The influence of boundary conditions on the accuracy of diffusion theory in time-resolved reflectance spectroscopy of biological tissues,” Phys. Med. Biol. 40, 1957-1975 (1995).
3. D. Contini, F. Martlli, and G. Zaccanti, “Photon migration through a turbid slab described by a model based on diffusion approximation. I. Theory,” Appl. Opt. 36, 4587-4599 (1997).
4. D. A. Boas, “Diffuse photon probes of structural and dynamical properties of turbid media: Theory and biomedical applications,” Ph.D. Dissertation, University of Pennsylvania. 1996.
5. M. A. O’Leary, “Imaging with diffuse photon density waves,” Ph.D. Dissertation, University of Pennsylvania 1996.
6. M. S. Patterson, B. Chance, and B. C. Wilson, “Time resolved reflectance and transmittance for the non-invasive measurement of tissue optical properties,” Appl. Opt. 28, 2331-2336 (1989).
7. S. L. Jacques, “Time-resolved reflectance spectroscopy in turbid tissues,” IEEE Transactions on Biomedical Engineering 36, 1155-1161 (1989).
8. A. D. Klose and A. H. Hielscher, “Iterative reconstruction scheme for optical tomography based on the equation of radiative transfer,” Med. Phys. 26, 1698-1707 (1999).
9. J. Hebden and D. T. Delpy, “Enhanced time-resolved imaging with a diffusion model of photon transport,” Opt. Let. 19, 311-313 (1994).
10. T. Durduran, A. G. Yodh, B. Chance, and D. A. Boas, “Does the photon-diffusion coefficient depend on absorption?,” J. Opt. Soc. Am. A 14, 3358-3365 (1997).
11. M. Morin, S. Chatigny, A. Mailloux, Y. Painchaud, and P. Beaudry, “Time-domain perturbation analysis of a scattering slab, SPIE Proc. 3597, 67-78 (1999).
12. S. R. Arridge and J. C. Hebden, “Optical imaging in medicine: II. Modelling and reconstruction,” Phys. Med. Biol. 42, 841-853 (1997).
13. S.R. Arridge, “Chapter 1: Diffusion tomography in dense media,” from Scattering in Microscopic Physics and Chemical Physics: Practical Aspects of Visible and Non-Visible Light Scattering
14. D. A. Boas, “A fundamental limitation of linearized algorithms for diffuse optical tomography,” Opt. Expr. 1, 404-413 (1997).
15. D. A. Boas, T. Gaudette, G. Strangman, X. Cheng, J. J. A. Marota, and J. B. Mandeville, “The accuracy of near infrared spectroscopy and imaging during focal changes in cerebral hemodynamics,” NeuroImage 13, 76-90 (2001).
16. A. Kienle and M. S. Patterson, “Improved solutions of the steady-state and the time-resolved diffusion equations for reflectance from a semi-infinite turbid medium,” J. Opt. Soc. Am. A 14, 246-253 (1997).
T. J. Brukilacchio, Ph.D. Thesis 2003
44
17. F. Martelli, A. Sassaroli, and Y. Yamada, “Analytical solution of the time-dependent photon diffusion equation for a layered medium,” SPIE Proc. 3597, 79-89 (1999).
18. M. Lepore, I. Delfino, A. Ramaglia, F. Vigilante, and P. L. Indovina, “An experimental comparison between time-resolved transmittance and reflectance techniques for optical characterization of scattering media,” SPIE Proc. 3597, 414-422 (1999).
19. F. Gao, H. Zhao, and Y. Yamada, “Improvement of image quality in diffuse optical tomography by use of full time-resolved data,” App. Opt. 41, 778-791 (2002).
20. M. Lepore, G. Urso, R. Esposito, L. Bottalico, M. Esposito, M. D. Falco, I. Delfino, and P. L. Indovina, “Development of a time-domain tomographic system for optical imaging,” SPIE Optical Tomography and Spectroscopy of Tissue IV 4250, 419-428 (2001).
21. S. Thomsen and D. Tatman, “Physiological and pathological factors of human breast disease that can influence optical diagnosis,” Thomsen & Tatman: Human Breast Disease, Annals of New York Academy of Sciences, 171-193 (1997).
22. D. B. Kopans, Breast Imaging, Lippincott-Raven Publishers, Philadelphia, NY, 2nd Edition, 1998.
23. A. E. Cerussi, F. Bevilacqua, N. Shah, D. Jakubowski, A. J. Berger, R. Lanning, and B. J. Tromberg, “The effects of water and lipids on NIR optical breast measurements,” SPIE Optical Tomography and Spectroscopy of Tissue IV 4250, 419-428 (2001).
24. A. E. Cerussi, A. J. Berger, F. Bevilacqua, N. Shah, D. Jakubowski, J. Butler, R. F. Holcombe, and B. J. Tromberg, “Sources of absorption and scattering contrast for near-infrared optical mammography,” Acad. Rad. 8, 211-218 (2001).
25. C. Eker, “Optical characterization of tissue for medical diagnostics,” Doctoral Thesis, Lund Institute of Technology, 1999.
26. C. J. Gulledge and M. W. Dewhirst, “Tumor oxygenation: a matter of supply and demand,” Anticancer Research 16, 741-750 (1996).
27. V. Quaresima, S. J. Matcher, and M. Ferrari, “Identification and quantification of intrinsic optical contrast for near-infrared mammography,” PhotoChem. and PhotoBio. 67, 4-14 (1998).
28. E. M. C. Hillman, “Experimental and theoretical investigations of near infrared tomographic imaging methods and clinical applications,” Ph.D. Thesis, University College London, 2002.
29. M. Essenpreis, C. E. Elwell, M. Cope, P. van der Zee, S. R. Arridge, and D. T. Delpy, “Spectral dependence of temporal point spread functions in human tissues,” Appl. Opt. 32, 418-425 (1993).
30. Scott Prahl, Tabulated molar extinction coefficient for hemoglobin in water, Oregon Laser Medical Center, 1999.
31. K. F. Palmer and D. Williams, "Optical properties of water in the near infrared," J. Opt. Soc. Am., 64, 1107--1110, (1974).
32. M. A. Franceschini, E. Gratton, D. Hueber, and S. Fantini, “Near-infrared absorption and scattering spectra of tissues in vivo,” SPIE Optical Tomography and Spectroscopy of Tissue III 3597, 526-531 (1999).
T. J. Brukilacchio, Ph.D. Thesis 2003
45
33. A. Zwart, A. Buursma, E. J. van Kampen, B. Oeseburg, P. H. W. van der Ploeg, and W. G. Zijlstra, “A multi-wavelength spectrophotometric method for the simultaneous determination of five haemoblobin derivatives,” J. Clin. Chem. Biochem. 19, 457-463 (1981).
34. W. G. Zijlstra, A. Buursma, and W. P. Meeuwsen-van der Roest, “ Absorption spectra of human fetal and adult oxyhemoglobin, de-oxyhemoglobin, carboxyhemoglobin, and methemoglobin,” Clin. Chem. 37, 1633-1638 (1991).
35. A. Zwart, E. J. van Kampen, and W. G. Zijlstra, “Results of routine determination of clinically significant hemoglobin derivatives by multicomponent analysis,” Clin. Chem. 32, 972-978 (1986).
36. D. A.Boas, M. A. Franceschini, A. K. Dunn, G. Strangman, “Noninvasive imaging of cerebral activation with diffuse optical tomography,” Chapter 8, In Vivo Optical Imaging of Brain Function, CRC Press, 193-221 (2002).
37. X. Cheng and D. Boas, “Diffues optical tomography errors resulting from uncertainty in the background optical properties,” SPIE Optical Tomography and Spectroscopy of Tissue III 3597, 213-220 (1999).
38. H. Liu, B. Chance, A. H. Hielscher, S. L. Jacques, and F. K. Tittel, “Influence of blood vessels on the measurement of hemoglobin oxygenation as determined by time-resolved reflectance spectroscopy,” Am. Assoc. Phys. Med. 22, 1209-1217 (1995).
39. S. Yeh and O. S. Khalil, “Multivariate method for the determination of tissue optical properties from diffuse reflectance profiles,” SPIE Optical Tomography and Spectroscopy of Tissue III 3597, 213-220 (1999).
40. R. A. Johnson and D. W. Wichern, Applied Multivariate Statistical Analysis, Prentice-Hall Inc., Englewood Cliffs, NJ (1992).
41. R. Choe, T. Durduran, J. P. Culver, L. Zubkov, J. M. Giammarco, X. Intes, B. Chance, and A. G. Yodh, “Bulk optical properties of normal breast with endogeneous and exogeneous contrast,” SPIE Optical Tomography and Spectroscopy of Tissue IV 4250, 462-464 (2001).