Embed Size (px)
Citation preview

Chapter 3
Hydrography and water masses in the
Gulf of Aden
3.1 Introduction
As mentioned in Chapter1, the Gulf of Aden is the only passage for Red Sea Water
(RSW), one of the most saline water masses in the world oceans, into the Indian Ocean.
We have also seen in Chapter 2 that very little information is available on the hydrography
of the Gulf of Aden. The extensive exchange of water between the Red Sea, the Gulf of
Aden and the Arabian Sea, the strong evaporation and the monsoonal winds that blow
over the region, all assist in the formation of a complex vertical structure in the water
column of the Gulf of Aden [Khimitsa, 1968; Stirn et al., 1985].
Seasonal changes of the surface layer water characteristics described by Piechura and
Sobaih [1986]; Nasser [1992]; Maiyza and Mohamed [1993] give an account of the vari-
ability in the surface temperature of the Gulf of Aden. Most of the variability in the sea
surface temperature (SST) is seasonal. SST is highest (31–32 ◦C) during end of May and
beginning of June. In July–August it cools down to 29–30 ◦C, the degree of cooling de-
pends on the strength of summer monsoon. During the summer monsoon, the SST along

Hydrography and water masses in the Gulf of Aden 44
the Arabian coast, the region adjacent to the Gulf of Aden, reaches a minimum of 17 ◦C.
The heating of the surface takes place in September soon after the weakening of the sum-
mer monsoon winds over the gulf and the SST bounces back to 30 ◦C within a month.
It cools again in October-January (24–25 ◦C) in response to the winter monsoonal winds
and warms again during February–May in response to the spring warming that dominates
the region during this period.
Similar to the variability in SST the surface mixed layer also shows strong seasonality.
In summer, the mixed layer depth (MLD) decreases to less than 20 m and increases to
over 100 m in winter. Accordingly, the depth of thermocline also shoals and deepens in
summer and winter respectively; about 20–120 m in summer and 150–250 m in winter
[Piechura and Sobaih, 1986]. Seasonal changes in the subsurface water, though much
lower than in the surface water, are still distinguishable. The lowest temperature and
highest salinity of the subsurface layer were observed during the summer months and the
highest temperature and lowest salinity were observed during winter months [Piechura
and Sobaih, 1986].
A few studies have used the available hydrographic data to describe the water masses
in the Gulf of Aden. Rochford [1964] identified two water masses in the eastern Gulf of
Aden, namely, high salinity Arabian SeaWater (ASW at σt levels 23.5–24.0) and RSW (at
σt levels 27.0–27.4). Khimitsa [1968] identified four layers of water in the gulf based on
their physical and chemical properties. A top layer (50–100 m) of high salinity ((∼ 36.0–
36.5 psu) and high oxygen content, an intermediate layer, between 100–500 m, of lower
salinity (∼ 35.3 psu) and low oxygen content, another intermediate layer, between 500–
1000 m, of high salinity RSW (∼ 36.5–38.0 psu), and a layer near the bottom containing
the bottom water of low salinity (∼ 34.9–35.5 psu) and temperature. He suggested that
the water in the upper intermediate level enters the gulf from the south as a strong jet
between Cape Gvardafui and Socotra at depths ∼ 150 to 200 m. He attributed its origin
to the Southern Ocean bottom water. Piechura and Sobaih [1986] described three water

Hydrography and water masses in the Gulf of Aden 45
masses in the upper 1000 m of the gulf. They named them Surface Water, Subsurface
Water, and RSW. They suggested that the local heating and evaporation are the causative
factors for the formation of surface water, which is deeper in winter (200–300 m) and
shallower in summer (70–80 m). For the subsurface water, the highest temperature and
lowest salinity were found in winter. They suggested the subtropical front as the origin of
SubsurfaceWater. Nasser [1992] also identified three water masses in the upper 1000 m of
the northern Gulf of Aden, namely: Surface High Salinity Water, Subsurface Low Salinity
Water and RSW. He concluded that the Subsurface Low Salinity Water is transported in
the Gulf of Aden from the Somali basin during the summer monsoon. More recently,
Mohamed et al. [1996] and Mohammed [1997] identified four salinity maxima in the
gulf. They identified the first maximum between the σt levels 24.0 and 25.0, the second
between 25.0 and 26.0, the third between 26.0 and 27.0 and the fourth between 27.0 and
28.0. They identified the third maximum as a mixture of waters originating from the
Persian Gulf, the Timor Sea and Subtropical Subsurface and the fourth maximum as a
mixture of Red Sea Water, Antarctic Intermediate Water and Timor Sea Water. Most of
the other studies of the GA [Maillard and Soliman, 1986; Fedorov andMeshchanov, 1988;
Bower et al., 2000, 2002] dealt only with the outflow and spreading of RSW. Ozgokman
et al. [2003]; Peters and Johns [2005]; Peters et al. [2005] described the structure and
dynamics of the Red Sea outflow plume in the western Gulf of Aden.
All these studies were either localized in space or time or focused on the Red Sea out-
flow. None of them provided a comprehensive picture of the hydrographic structure and
the water masses in the Gulf of Aden as they evolved during the year nor provided a quan-
titative estimate. Furthermore, the temperature–salinity–σθ range of the water masses de-
fined by various authors often varied drastically depending on the limited data they had
used in their studies. As discussed in Chapter 2, the Gulf of Aden is a data sparse region
and hence a new climatology of hydrographic parameters was compiled. In this chapter1
1A major part of this chapter is based on the paper by Al Saafani, M. A. and S. S. C. Shenoi. Watermasses in the Gulf of Aden. J. Oceanogr., 63, 1, 1-14, 2007.

Hydrography and water masses in the Gulf of Aden 46
we have used this newly compiled temperature–salinity climatology to define the θ–S–σθ
(potential temperature-salinity-potential density) ranges of water masses rather than the
limited data used in the previous studies. Based on well demarcated boundaries of the
water masses, we have also calculated the volumes occupied by the water masses and
their changes during a year. Before we describe the water masses in the Gulf of Aden,
first we describe the hydrographic structure of the Gulf of Aden in the following section.
3.2 Hydrographic structure
In this section we will describe the horizontal and vertical distribution of temperature,
salinity and density in the Gulf of Aden on a month to month basis. Besides the distribu-
tion of properties at the horizontal surfaces, two vertical sections were also used for this
description; one along the east–west axis of the gulf and the other across the gulf along
48◦ E meridian.
During January, the distribution of temperature at the surface is uniform with ∼ 0.5–
1.0 ◦C difference between west and east; it is 25.5–26.0 ◦C in the west and about 25.0 ◦C
in the east (Figure 3.1a). Along the southern coast, from 47 to 51◦ E, the temperature is
cooler than that along the northern coast (∼ 1 ◦C) indicating upwelling along the southern
coast. Similarly, the distribution of salinity at the surface shows almost uniform salinity
of 36.0 psu over the entire gulf (Figure 3.1a). The horizontal distribution of density at the
surface follows the distribution of temperature with lower density in the west and higher
density in the eastern part of the gulf (Figure 3.1a).
Section 1 shows a mixed layer extending to about 80–100 m with temperature 25 to
26 ◦C decreasing from west to east, salinity 36.0 psu and σt 24.5 (Figure 3.1a). The
thermocline extends to about 200 m where temperature decreases from 25 ◦C to about
16 ◦C, whereas the halocline extends to about 120 m only. A layer of fresher water was
occupying the depths from 100–400 m with salinity of ∼ 35.6 psu (Figure 3.1a). In the

Hydrography and water masses in the Gulf of Aden 47
west, this layer was limited to 300 m due to the presence of high salinity RSW. The RSW
occupies a 700 m (400–1100 m) thick water column in the Gulf of Aden. In this layer,
the salinity increases with depth from about 35.8 psu at 400 m to ∼ 36.8 psu at 800 m in
the western part of the gulf. The salinity of this layer decreases towards the east. Deeper
than 1000 m, the temperature and salinity decreases gradually with depth.
Along Section 2, at 48◦ E, the mixed layer extends to about 80 m, with the southern
side cooler than the northern side (Figure 3.1a). The thermocline extends to about 200
m where the temperature decreases from 25 to 16 ◦C and salinity decreases from 36.0 at
the surface to 35.8 psu. The low salinity layer (< 35.6 psu) is seen along the southern
side between 100 and 300 m. The RSW extends to about 1000 m, with its core at about
700 m where the salinity exceeds 36.2 psu. Deeper than that the temperature and salinity
decrease with depth.
During February, the distribution of temperature at the surface is similar to that of
January; the northern coast of the gulf warmer than the southern coast by about 1 ◦C.
The SST along the southern coast is 24.5–25.0 ◦C and that along the northern coast is
25.5–26.0 ◦C (Figure 3.1b). The cooler patch of temperature seen to the east of the gulf
during January has cooled further during this month. The surface distribution of salinity
is almost uniform (36.0 psu) over the entire gulf (Figure 3.1b). To the east of the gulf, the
salinity along the eastern coast of Somali is less than that inside the gulf.
The vertical distribution of temperature and salinity along Section 1 shows that the
mixed layer extends to about 80–100 m with temperature between 25 and 26 ◦C, salinity
36.0 psu and σt 24.5 (Figure 3.1b). Along the eastern part of the section, the isotherms
and isohalines lift upward indicating the presence of cyclonic eddy. Similar to that during
January the thermocline extends to about 200 m where temperature decreases to about 16◦C. Whereas, the halocline extends to about 160 m only in the west and about 200 m in
the east. The intermediate low saline layer is seen between 160 m and 400 m, where it
extends in the east to about 600 m with salinity of ∼ 35.4 psu (Figure 3.1b). Also similar

Hydrography and water masses in the Gulf of Aden 48
Figure 3.1 (a) Horizontal (left panels) and vertical (middle and right panels) distributionof temperature, salinity, and density in the Gulf of Aden during January. The locations ofvertical sections are shown in the upper panel on the left.

Hydrography and water masses in the Gulf of Aden 49
Figure 3.1 (b) Same as 3.1a, but for February.

Hydrography and water masses in the Gulf of Aden 50
Figure 3.1 (c) Same as 3.1a, but for March.

Hydrography and water masses in the Gulf of Aden 51
to that during January, the RSW occupies about 700 m (400–1100 m) of the water column
in the Gulf of Aden. The salinity of this layer decreases towards the east. Deeper than
1000 m, the temperature and salinity decreases with depth gradually.
Section 2 shows a mixed layer shallower along the southern side, with cooler and
fresher water, than that in the north indicating the effect of the upwelling along the south-
ern coast (Figure 3.1b). Below the mixed layer, the thermocline extends to about 200 m
with the temperature decreasing from 25 to 16 ◦C and salinity decreasing from 36.0 at
the surface to 35.6 psu with a fresher patch in the southern side (< 35.6 psu occupying
depths from 140 to 300 m). This layer of fresher water extends to about 400 m. The RSW
is seen deeper, extending to about 1000 m, with its core between 600 and 800 m. Deeper
than that the temperature and salinity decrease with depth in the bottom layer.
During March, the surface layer temperature increases to 26 ◦C all over the gulf with
a uniform salinity of 36 psu. Salinity decreases in the eastern side especially along the
eastern Somali coast (Figure 3.1c); the density also decreases following the decrease in
salinity. The low salinity patch extends northward towards the mouth of the gulf.
The vertical distribution of temperature and salinity along Section 1 shows a shallower
mixed layer than that in January–February, the average depth is ∼ 60 m. The mixed layer
depth in the eastern side of the section is shallower than that in the west (Figure 3.1c).
The low saline layer extends from ∼ 200 m till ∼ 500 m in the east and ∼ 400 m in the
west; the salinity of this layer is ∼ 35.4 psu. Deeper than that, the RSW is seen between
400 and 1100 m (Figure 3.1c).
The shallower mixed layer is also seen in Section 2, where it extends only to about 60
m, with temperature ∼ 25–26 ◦C, and salinity ∼ 36.0 psu. The low saline layer extends
below the thermocline from about 180 m to 300 m with salinity < 35.6 psu along the
northern and southern sides.
During April–May, the mixed layer continues to shallow and warm up, where it is
about 40 m with temperature ∼ 27–28 ◦C, and salinity ∼ 36–36.4 psu during April (Fig-

Hydrography and water masses in the Gulf of Aden 52
ure 3.1d). It shallows further to 30 m with an increase in temperature to 29-30 ◦C during
May (Figure 3.1e). During both months, the salinity in the north and in the west is more
than that in the east (Figure 3.1d and e).
The shallowing of the mixed layer is seen more clearly from section 1 (Figure 3.1d
and e) with temperature decreasing by about 1–2 ◦C within the upper 40 m. The vertical
structure of salinity also shows the east–west variation of the mixed layer. The isotherms,
isohalines and isopycnals deepens in the eastern part of the section during May indicating
the presence of an anticyclonic eddy (see Chapter 4 for the details of circulation during
this month). Below the mixed layer, the low salinity layer extends from 200 m to about
500 m in the eastern part of the section, while in the west, due to the presence of the
RSW, it extends from 150 m to 300 m only. Similarly the RSW (salinity 36.6 psu) is seen
extending from 300 m to 1200 m in the western part of the section. In the eastern part, it
is seen between 400 m and 1000 m.
Section 2 also shows a vertical structure similar to Section 1, with the low saline layer
occupying a deeper water column along the southern side of the section during April
(Figure 3.1d).
During June, the surface layer temperature and salinity show more variations due to
the onset of the summer monsoon, with maximum temperature (31 ◦C) and salinity (36.6
psu) in the western and southern parts of the gulf (Figure 3.1f). Along the northern coast,
weak upwelling is seen as indicated by the decrease in temperature (27 ◦C) and salinity (∼
36.0 psu). The temperature and salinity also decrease towards the east along the Somali
coast (23 ◦C and 35.6 psu). This horizontal variation of the temperature and salinity
causes the horizontal variation in density.
The vertical structure along Section1 also shows a four layer structure similar to that
in May, with the surface layer shallowing further to about 20 m. The intermediate, low
saline layer is seen between 150 m and 400 m in the east and between 120 m and 220 m in
the west (with salinity of 35.6 psu) (Figure 3.1f). Below that, the RSW extends to∼ 1100

Hydrography and water masses in the Gulf of Aden 53
Figure 3.1 (d) Same as 3.1a, but for April.

Hydrography and water masses in the Gulf of Aden 54
Figure 3.1 (e) Same as 3.1a, but for May.

Hydrography and water masses in the Gulf of Aden 55
Figure 3.1 (f) Same as 3.1a, but for June.

Hydrography and water masses in the Gulf of Aden 56
m. Deeper than that, the temperature and salinity decreases gradually in the bottom layer.
Section 2 shows the uplifting of isotherms, isohalines and isopycnals along the northern
side indicating upwelling (Figure 3.1f).
During July–August, the summer monsoon strengthens the upwelling along the north-
ern coast of the gulf and along the Somali region (Figure 3.1g and h). The upwelling along
the northern coast of the gulf extends towards the west, where it is seen in three smaller
patches as reported by Piechura and Sobaih [1986]. The horizontal gradient of the tem-
perature at the surface is about 8 ◦C between north and south (Figure 3.1g and h). In
the western part of the gulf, the high salinity Red Sea Surface Water is seen along the
southern side with salinity > 36.6 psu.
The vertical structure of temperature and salinity is similar to that in June. The surface
mixed layer extends to about 20 m, with the uplifted thermocline extending to 160 m. The
temperature in the thermocline decreases from 29 ◦C at the surface to about 16 ◦C at 160
m (Figure 3.1g, section 1). The thermocline further shallows during August, where its
lower extent is seen at 140 m (Figure 3.1h). The low saline layer is also shallower than
that during June; it extends between 120 m and 400 m. Below that layer, the RSW is seen
between 400 and 1000 m. Section 2 also shows the upwelling along the northern side of
gulf.
During September, the strength of the summer monsoon is reduced inside the gulf,
but the region of low SST along the northern side still exists (Figure 3.1i). The surface
temperature over the gulf is about 30 ◦C all over the gulf except in the upwelling regions
along the northern coast. The high salinity region seen in the southern part of the western
gulf during August is still seen during this month indicating the continuation of the surface
Red Sea outflow (Figure 3.1i). The density inside the gulf is less than that to the east of
it due to the high temperature inside the gulf. The vertical structure is similar to that
in August except for the shallower low saline layer extending from ∼ 80 m to 300 m
(Figure 3.1i, Section 1 and 2).

Hydrography and water masses in the Gulf of Aden 57
Figure 3.1 (g) Same as 3.1a, but for July.

Hydrography and water masses in the Gulf of Aden 58
Figure 3.1 (h) Same as 3.1a, but for August.

Hydrography and water masses in the Gulf of Aden 59
Figure 3.1 (i) Same as 3.1a, but for September.

Hydrography and water masses in the Gulf of Aden 60
Figure 3.1 (j) Same as 3.1a, but for October.

Hydrography and water masses in the Gulf of Aden 61
Figure 3.1 (k) Same as 3.1a, but for November.

Hydrography and water masses in the Gulf of Aden 62
Figure 3.1 (l) Same as 3.1a, but for December.

Hydrography and water masses in the Gulf of Aden 63
During October, the surface layer is cooler than that during September by ∼ 1 ◦C,
where it is about 29 ◦C all over the gulf except for the cooler patch along the southern
coast (25 ◦C) between 46◦ E and 49◦ E and the warmer patch along the northern side
(30 ◦C) between 45◦ E and 47◦ E (Figure 3.1j). Similarly, the surface salinity along the
southern side is about 35.8 psu compared to 36.4 over the rest of the gulf (Figure 3.1j).
The vertical structure along Section 1 shows that the surface mixed layer deepened
compared to that during September (Figure 3.1j). The low salinity layer is seen between
80 and 400 m (Figure 3.1j). The RSW in the deeper layer extends to ∼1000 m. Sec-
tion 2 shows the uplifting of isotherms and isohalines along the southern side indicating
upwelling (Figure 3.1j).
During November, the surface mixed layer extends to ∼ 40 m with a temperature of
∼ 27 ◦C all over the gulf and salinity decreases from 36.4 psu in the west to < 36.0 psu
in the east (Figure 3.1k). Below the surface mixed layer, the thermocline extends to about
140 m, where the temperature decreases to ∼ 16 ◦C and salinity decreases to ∼ 35.6 psu.
This low salinity layer extends to about 400 m (Figure 3.1k). The RSW is seen extending
from ∼ 400 m to 1100 m with the core at ∼ 500 m in the west.
During December, the surface temperature cools down to ∼ 25 ◦C and the mixed layer
deepens to about 60 m due to the strengthening of winter. Along the southern coast, the
temperature is about 2 ◦C cooler than that along the northern coast due to the upwelling
along the southern coast. Similar to that in November, the salinity decreases from west
towards east. The low saline layer with salinity < 35.6 psu is seen extending from ∼ 120
m to about 400 m. Also the RSW extends till about 1100 m with its core seen between
600–800 m (Figure 3.1l, Section 1).
In general, the hydrographic structure in the Gulf of Aden shows a four layer structure.
The surface layer experiences strong seasonality in its characteristics and depth. The SST
is about 24–25 ◦C during winter (November–February) increasing to its maximum in
March to May. During summer (June–August), the SST decreases along the northern side

Hydrography and water masses in the Gulf of Aden 64
due to upwelling. In September, SST starts to rise again to ∼ 30 ◦C. Similarly, the mixed
layer depth decreases from ∼ 80 m during winter to about ∼ 20 m during summer. The
upwelling along the northern side during summer starts at the eastern side during June and
extends towards the west during July–August. The seasonal variation is also seen in the
intermediate low saline layer. It is cooler and more saline during summer than in winter.
The RSW layer extends from 400 m to ∼ 1100 m during most of the months.
3.3 Water masses
As described above, the Gulf of Aden hydrographic structure comprises four layers with
specific characteristics for each layer. In this section, we will describe the characteristic
of the four water masses associated with each of these layers and identify their origins.
A typical θ–S (potential temperature–salinity) curve for the Gulf of Aden (Figure 3.2)
clearly shows four distinct water masses similar to those reported by Khimitsa [1968]. The
upper three water masses also show similarities to those reported by Piechura and Sobaih
[1986] and Nasser [1992]. Mohamed et al. [1996] reported five water masses in the Gulf
of Aden, but the temperature–salinity–density ranges they used to define the water masses
varied drastically from those shown in Figure 3.2. The θ–S curve in Figure 3.2 shows high
saline surface water followed by low saline water in the intermediate levels and high saline
water below that. The bottom water is comparatively fresher than that in the upper water
column. Such θ–S curves constructed individually and collectively were then used for
further analysis.
3.3.1 T-S Characteristics
Figure 3.3 shows the θ–S diagrams constructed using temperature–salinity profiles avail-
able from the Gulf of Aden west of 51◦ E. The number of profiles available during a
month varied from 146 in December to 313 in January. Since the Gulf of Aden receives

Hydrography and water masses in the Gulf of Aden 65
Figure 3.2 Typical θ–S curve for the Gulf of Aden. Four water masses are identified fromthe profiles. The contour lines represent the σθ surfaces.
high saline Red Sea water in the west and moderately saline Arabian Sea water in the east,
we have divided the region into three sub–regions, namely: the western region (between
43.5◦ E and 45.0◦ E), the central region (between 45.0◦ E and 49.0◦ E), and the eastern
region (between 49.0◦ E and 51.0◦ E).
Four water masses are identifiable from the θ–S diagrams in Figure 3.3. They are: (i)
a salinity maximum near the surface between the σθ levels 22.20 kg m−3 and 24.80 kg
m−3; we call this water Gulf of Aden Surface Water (GASW); Khimitsa [1968] called
it Surface Aden Water. (ii) A salinity minimum between the σθ levels 26.20 and 26.90
kg m−3; we call this water Gulf of Aden Intermediate Water (GAIW); Khimitsa [1968]
called it Low Salinity Layer or Subsurface Salinity Minimum. (iii) A salinity maximum
between the σθ levels 26.90 and 27.50, which is easily identifiable as Red Sea Water
(RSW). Finally, (iv) a distinct water between the σθ levels 27.50 and 27.80; we call this
Gulf of Aden BottomWater (GABW); Khimitsa [1968] called this BottomWater. Among
the four water masses, the θ–S relationship is tightest for the bottom water mass, but the
potential temperature and salinity varies over a wider range (3 to 9 ◦C and 34.70 to 35.60

Hydrography and water masses in the Gulf of Aden 66
psu). The ranges of potential temperature and salinity for the four water masses are given
in Table 3.1. The histograms (Figure 3.4) show the distribution of potential temperature
and salinity within the four water masses. Histograms are useful for the identification
of potential temperature and salinity at the core of water mass. For example, the poten-
tial temperature and salinity of the GASW core is 25.5 ◦C and 36.0 psu. Similarly, the
potential temperature and salinity of the RSW core is 12.5 ◦C and 35.8 psu respectively.
Gulf of Aden Surface Water
The spatio–temporal variability of the salinity of the GASW that occupies the surface
layer is not more than 1.00 psu (Figures 3.1 and 3.3), but the potential temperature ranges
between 21.0 ◦C and 32.0 ◦C during summer and 22.0 ◦C and 26.0 ◦C during winter. The
cooler surface temperature during winter is due to the cool dry northeasterlies that blow
over the northern Arabian Sea and adjoining areas [Piechura and Sobaih, 1986]. Accord-
ingly, the lower limit of its σθ range also undergoes wide variations from 23.50 kg m−3
in January–February to 22.20 kg m−3 in June–July. GASW is seen in all three regions
of the gulf: western, central and eastern. The profile–to–profile variation in salinity is
maximum in the western region and minimum in the central region. Few profiles in the
western region showed salinities as high as 37.00 psu during August–September due to
high saline surface water outflow from the Red Sea during summer (Figure 3.1g, h and
i). Similarly, a few profiles in the eastern region showed lower salinities (35.5 psu) than
expected (Figure 3.3). Since the profiles observed over several years are included for this
analysis, inter–annual variability is also a reason for the large variations.
Gulf of Aden Intermediate Water
This water, identifiable by a salinity minimum, shows very little variability from month
to month compared to GASW (Figures 3.1 and 3.3). Its core, situated at σθ level 26.50,
is well defined throughout the year. On an average, the spatio–temporal variability in the

Hydrography and water masses in the Gulf of Aden 67
range of salinity and potential temperature is less than 0.75 psu and 3.0 ◦C. The salinity in
the eastern region is comparatively lower than that in the central one. The salinity profiles
in the western region show large variations (> 2 psu). Some of them must have occurred
due to the high salinity water that outflows from Bab el Mandab into the Gulf of Aden
[Maillard and Soliman, 1986; Murray and Johns, 1997; Al Saafani and Shenoi, 2004].
Table 3.1 Potential temperature-salinity-σθ and depth ranges of the water masses in theGulf of Aden.
Watermass θ(oC) S(psu) σθ(kgm−3) Depth(m)
GASW 21.0–32.0 35.4–36.8 22.20–24.80 0–100
GAIW 12.0–17.0 35.1–36.4 26.20–26.90 120–420
RSW 7.0–20.0 35.2–38.2 26.90–27.50 350–1050
GABW 3.0–9.0 34.7–35.6 27.50–27.80 1200–1600
Red Sea Water
This is the most prominent water mass in the Gulf of Aden and there is no ambiguity
about its origin. It outflows into the Gulf of Aden from the Red Sea through Bab el
Mandab strait; its core exists at σθ level 27.20. 68% of the observations showed salinities
in the range 35.30 to 36.00 psu and 32% of them showed salinity greater than 36.00 psu.
The profiles from the western region show salinities as high as 38.00 psu (see Figure 3.3
for January and May–July). In the central region, both potential temperature and salinity
showed large variability, especially during the summer months (May–September). The
outflow of RSW from the Red Sea undergoes a seasonal cycle in response to the monsoon
winds [Murray and Johns, 1997; Aiki et al., 2006]; the outflow is minimum at the end of
the summer monsoon season and maximum during the peak of winter. Hence, in addition
to the interannual variability, the seasonal variability in the θ–S could be associated with
the variability in the outflow of RSW from the Red Sea.

Hydrography and water masses in the Gulf of Aden 68
Figure 3.3 θ–S diagram for Gulf of Aden for all months. All available profiles from theGulf of Aden (west of 51◦ E) are included. Profiles from the region west of 45◦ E are inred (western region), those in the region between 45–49◦ E are in black (central region)and those from the region between 49◦ E and 51◦ E are in blue (eastern region). Numberof θ–S profiles available during each month is also indicated.

Hydrography and water masses in the Gulf of Aden 69
Figure 3.4 Histograms of potential density, potential temperature and salinity for GASW,GAIW, RSW and GABW. The histograms were constructed by counting the data valuesconstrained within the θ–S–σθ ranges given in Table 3.1

Hydrography and water masses in the Gulf of Aden 70
Gulf of Aden Bottom Water
The GABW is easily identifiable in the σθ range 27.50 to 27.80. Though this water
mass has a narrow σθ range, its potential temperature and salinity has wider ranges; the
potential temperature ranges between 3.0 and 9.0 ◦C and salinity between 34.70 and 35.60
psu (Figure 3.4). Being the bottom water, the temporal variability of the θ–S structure is
very low.
3.3.2 Horizontal distribution
The spatial distribution of θ–S profiles alone is insufficient to describe the variations in
the horizontal distribution of the water masses. Hence, maps of horizontal distribution
of water masses were prepared for two major seasons: the summer (August–September)
and the winter (January–February). Here we chose the last two months of the seasons
because the circulation effects on the water mass are best seen towards the end of the
season. The salinity at the core of the water mass is used as a tracer to describe the
horizontal distribution (Figure 3.5). The core is defined using the maximum/minimum
salinities. For example, for RSW we picked the maximum salinity between the σθ levels
26.90 and 27.50 and for GAIW we picked the minimum salinity between the σθ levels
26.20 and 26.90. As expected, the salinity of the core of RSW is higher in the west due
to the discharge from the Red Sea. The core of RSW flows within the depth range 600–
650 m except in a few pockets where it deepens to 700–800 m. This is consistent with
the description of Bower et al. [2000, 2005]. On an average, the core of RSW shallows
during summer, in the east, by about 50–100 m. The lowest salinity in the core is seen
near the Somali coast at around 49.0◦ E in both seasons. Low salinities are also seen near
the coast of Yemen in summer.
The salinity in the core of GAIW water increases towards the west. The salinity in
the core is considerably higher in the west due to mixing with high saline outflow from

Hydrography and water masses in the Gulf of Aden 71
the Red Sea [Khimitsa, 1968; Piechura and Sobaih, 1986]. The core shallows by at least
50 m during summer from its winter position, as described in the previous section. From
the pattern of salinity contours it appears that the GAIW spreads from east to west. The
salinity distribution in the core of GASW is very different from that for RSW and GAIW.
The core salinities are highest in the central region and lowest in the eastern region. In
summer, a large patch of high salinity, exceeding 36.10 psu, occupies the central region
between 45◦ E and 48◦ E. The large patch of high salinity is due to the anticyclonic eddy
that occupied the center of the Gulf of Aden during summer [Piechura and Sobaih, 1986]
(see Chapter 5 for details of the eddies in the gulf).
The structure of these water masses is also clearly seen in the vertical salinity section
running through the middle of the gulf (Figure 3.6). The GAIW and the GABW spread
from the east while the RSW spreads from the west.
3.3.3 Volumetric analysis
The volumes occupied by the water masses were estimated followingMontgomery [1958]
for an average θ–S profile in the Gulf of Aden. For this calculation the volume of the Gulf
of Aden was considered as∼ 4840× 1011 m3; this includes twenty 1◦ × 1◦ grids covering
a surface area of 242 × 109 m2 and average depth of 2000 m. All profiles of temperature
and salinity within 20 grids were averaged to generate one θ–S profile representing the
annual average profile. This average θ–S curve was then sliced in to 0.5 ◦C temperature
× 0.1 psu salinity grids (see Figure 3.7). The volume of each grid was then estimated
by multiplying their respective thicknesses by the surface area. The volumes of 0.5 ◦C
temperature × 0.1 psu salinity grids falling within the pre-defined bounds of the water
masses (based on θ–S–σθ ranges) were then added together to determine the total volume
of each water mass. As per the estimate, the volume of RSW in the gulf is about 1769.0×
1011 m3 while the volumes of GAIW and GABW are about 418.7 × 10¹¹ m3 and 1851.3
× 1011 m3 respectively. The volume of GASW is about 138.0 × 10¹¹ m3 only. In terms

Hydrography and water masses in the Gulf of Aden 72
Figure 3.5 Horizontal distribution of the water masses during winter (January–February)and summer (August–September). The salinity (psu) in the core layer of the water massis used to trace the spread of the water mass. The contours represent the depth of corelayer.

Hydrography and water masses in the Gulf of Aden 73
Figure 3.6 Vertical section of salinity (psu) along the east-west axis of the Gulf ofAden (along 12.5◦ N) (a) for winter (January–February) and (b) for summer (August–September). σθ contours are also shown.
of percentages, the RSW occupies ∼ 37% of the total volume of the Gulf of Aden while
GAIW and GABW occupy ∼ 9% and 38% respectively.
While the estimates based on the mean θ–S profile for the Gulf of Aden provided
the approximate volumes of water masses, they are inadequate to describe the temporal
and spatial variability. Estimates based on monthly mean θ–S profiles within 1◦ grids
spread over the Gulf of Aden would have been ideal to describe the spatial and temporal
variability. The data sparseness, however, prevents such estimates. Hence, mean θ–S
profiles were constructed for two seasons (summer and winter). Similarly, due to the
paucity of data in some of the 1◦ × 1◦ grids, the volume computations were carried out
over a 1◦ longitude band. A mean θ–S curve for a 1◦ longitude band was computed first
and then sliced in to 0.5 ◦C temperature × 0.1 psu salinity grids . Since the mean θ–S
profiles in several grids do not extend beyond 1200 m, it was not be possible to estimate
the volume of GABW. The volumes thus estimated for 1200 m deep water column along
the east–west axis of the Gulf of Aden are shown in Figure 3.8. During winter, the volume
of RSW is 100× 1011 m3 in the western grid and it is 72 × 1011 m3 in the eastern grid. In
the center, it is ∼ 88 × 1011 m3; the sharp decrease (∼ 72 × 1011 m3 ) occurs only in the
grids east of 49◦ E. During summer, though the volume of RSW remains more or less the
same (∼ 100× 1011 m3) in the west, it decreases gradually towards the east (Figure 3.8).

Hydrography and water masses in the Gulf of Aden 74
Figure 3.7 θ–S–V diagram constructed for an annual mean profile from the Gulf of Aden.The volumes (× 1011 m3) occupied by GASW, GAIW, RSW and GABW are marked indifferent shades. Thin lines represent the 0.5 ◦C × 0.1 psu θ–S grid. The θ–S grids usedto estimate volumes of water masses are shown in different shades. The σθ lines are alsoshown. Assuming an average depth of 2000 m, the total volume of Gulf of Aden is ∼4840 × 1011 m3.
GAIW is present more in the east (25 × 1011 m3) than that in the west (∼ 12 × 1011
m3) during winter. In summer, however, the east-west variation as well as its variability
in volume are low (∼ 18–20 × 1011 m3). The volume of GASW is about 10 × 1011 m3
in winter and about 6 × 10¹¹ m3 in summer. The east–west variability in the volume of
GASW during both seasons is negligible.
The volumes of all three water masses, the RSW, the GAIW and the GASW, are
higher during winter than in summer. The increase in volumes results in increased sea
level during winter. The seasonal cycle of sea level recorded by the tide gauge at Aden
show an increase of ∼ 35 cm during winter (see Figure 1.5 on page 15).
3.3.4 Percentage composition of Gulf of Aden water
TS–diagram continued to be a useful tool for the analysis of a variety of oceanographic
situations, many of which involved more than three water masses. When four or more

Hydrography and water masses in the Gulf of Aden 75
Figure 3.8 East–west variations in the volumes of water masses in the Gulf of Aden (×1011 m3). Meridonally (1◦ wide longitude bands) averaged θ–S profiles were used toestimate the volumes following the θ–S–V diagrams.
water masses are involved, the role of the assumption of vertical layering becomes more
crucial. In the case of the mixing of three water masses, there exists a unique solution to
any combination of temperature and salinity within the mixing triangle for the percentage
contribution of the three water masses involved. In the case of four or more water masses,
there exists a whole range of solutions, and the assumption of vertical layering is nec-
essary to select a particular solution [Tomczak, 1981a]. This vertical layering forms the
basis for a TS–diagram analysis which divides the TS–range, spanned over the four water
masses, into two triangles (Figure 3.9). The method of breaking down a given area on the
TS–diagram into a set of mixing triangles can be extended to any number of water types
if only three of them can have simultaneous contact at any point in space [Mamayev,
1975]. In most oceanic situations these conditions are met because the corresponding
water masses are layered vertically, and mixing between them is predominantly vertical.
The percentage composition of water masses in a water sample in the Gulf of Aden
was estimated following Tomczak [1981a,b]. The method is an extension of the set of
equations which forms the basis of the mixing triangle. Consider a situation where ’n’
water masses are contributing to the mixture of water at an oceanographic station. Then
a minimum of n-1 characteristics, the independent parameters, of the water masses are

Hydrography and water masses in the Gulf of Aden 76
necessary to describe them using the theory of a mixing triangle. Conserving the mass, the
relative contribution of any water mass to the water sample at a location can be determined
from the linear system of equations given as
AX = B (3.1)
where A is an n× n matrix of the parameter values for the n water masses, B is a vector of
n elements which contains n-1 observations, and X is a vector of n elements which gives
the relative contributions of the water masses. The elements of the last row in A and the
last element ofB are identically 1, to express the condition that all contributions must add
up to 100% of the observed volume of water. Since four water masses are to be considered
to describe the composition of water samples in the Gulf of Aden, three parameters were
considered, namely: potential temperature, salinity and oxygen. Consideration of oxygen
as one of the parameters might introduce an element of uncertainty in the estimate because
it is not a conservative tracer, especially in the shallow depths (depths < 200–300 m).
Nevertheless, we have used oxygen as one of the parameter in the absence of other suitable
information. Hence, the equation (3.1) becomes
x1T1+x2T2+x3T3+x4T4 = Tobs
x1S1+x2S2+x3S3+x4S4 = Sobs
x1O1+x2O2+x3O3+x4O4 = Oobs
x1+x2+x3+x4 = 1 (3.2)
Matrix A was defined using the thermohaline indices (Ti, Si, Oi) of the water mass i
(i = 1,2,3,4) before they entered and mixed in the Gulf of Aden (Table 3.2); ie., the θ–
S–O2 of the water mass when it was outside the Gulf of Aden. Mixing triangles were
used to determine the thermohaline indices (see for example Figure 3.9). GAIW and
GABW enter the gulf from the east, hence the profiles from the eastern region were used
to determine their thermohaline indices. Similarly, the profiles from the western region

Hydrography and water masses in the Gulf of Aden 77
were used to determine the thermohaline index for RSW before it entered the gulf. A
similar definition of thermohaline index for GASW could be ambiguous because that
does not have a definite source region. Part of the GASW forms inside the gulf due to
air–sea fluxes and part is advected into the Gulf of Aden either from the western Arabian
Sea and/or from the Red Sea. The surface flow in the Gulf of Aden inferred from the
climatology of sea level height anomalies estimated from the satellite altimetry is towards
the west during the winter and towards the east during the summer [Al Saafani and Shenoi,
2006] (also see the description of circulation in Chapter 4). Hence, the profiles from the
eastern (western) Gulf of Aden were used to determine the thermohaline index during
winter (summer).
Table 3.2 Thermohaline indices for the four water masses in the Gulf of Aden.
Watermass θ(oC) Salinity(psu) Oxygen(mlL−1)
GASW 27.00 36.10 5.00
GAIW 14.50 35.25 0.70
RSW 18.50 37.90 0.50
GABW 3.10 34.80 2.00
The percentage composition of water in the Gulf of Aden along the east–west axis of
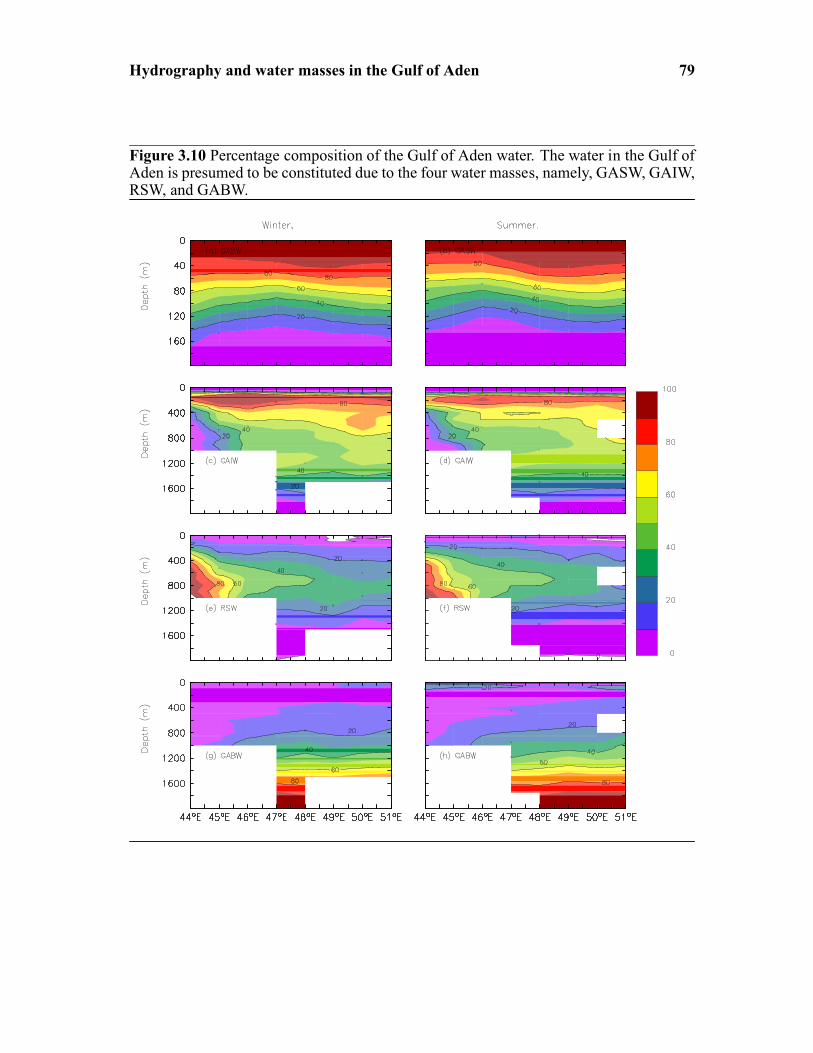
the gulf is shown in Figure 3.10. As expected, the percentage of water of Red Sea origin
reduces from 90% in the west (near Bab el Mandab) to less than 40% in the east (Fig-
ure 3.10e and f). The water in the bottom (deeper than 1100 m) as well as the surface and
intermediate (less than 400 m) levels also contains about 10–20% water of Red Sea ori-
gin. Similarly, the water that is responsible for the GAIW is maximum in the intermediate
levels; it also contributes to the water that is found in the deeper layers (deeper than 1200
m) and surface layers (less than 100 m). The presence of more of this water in the east
than in the west suggests that the water responsible for GAIW enters the Gulf from the
east. The water that is responsible for the GASW does not contribute much to the water

Hydrography and water masses in the Gulf of Aden 78
Figure 3.9 Typical mixing triangles for the western and eastern Gulf of Aden. They wereused to identify the thermohaline indices of water masses (see Table 3.2).
below 150 m. It is maximum (> 90%) in the surface layers (< 40 m), decreasing rapidly
towards the deeper layers. Most of this water also appears to enter the Gulf of Aden from
the east. The water that is responsible for the formation of GABW shows highest con-
centrations (∼ 90%) in the bottom layers and dilutes rapidly towards the upper layers (<
1200 m).
3.4 Discussion
Previous reports [Khimitsa, 1968; Piechura and Sobaih, 1986; Nasser, 1992; Mohamed
et al., 1996] used limited data sets to describe the hydrography and water mass in the
Gulf of Aden. Though they succeeded in identifying the water masses, they failed to give
an integrated picture of the presence of distinct water masses in the gulf. Moreover, the
definitions and nomenclature of the water masses varied among themselves, except for
the RSW.
As expected, the vertical hydrographic structure of the Gulf of Aden shows four layers,
surface layer, intermediate low saline layer, high saline RSW and bottom layer. The sur-
Hydrography and water masses in the Gulf of Aden 79
Figure 3.10 Percentage composition of the Gulf of Aden water. The water in the Gulf ofAden is presumed to be constituted due to the four water masses, namely, GASW, GAIW,RSW, and GABW.
Hydrography and water masses in the Gulf of Aden 80
face layer showed strong seasonal variations in its characteristics and depth. The SST was
about 24–25 ◦C during winter (November–February). It increased to reach a maximum
in May (31 ◦C). During summer (June–August) the SST decreased along the northern
side due to upwelling. In September, the SST started to rise again to ∼ 30 ◦C. Similarly,
the mixed layer depth decreased from ∼ 80 m during winter to ∼ 20 m during summer.
The seasonal variation was lesser in the intermediate low saline layer. It was cooler and
more saline during summer compared to that in winter. The upwelling along the northern
side during summer started in the eastern side during June and extended towards the west
during July–August as reported earlier [Piechura and Sobaih, 1986].
Similar to earlier studies (for example Khimitsa [1968]), four water masses were iden-
tified using the newly compiled hydrographic data set. Among them, the origin of RSW
is well known. Hence, we will focus on identifying the origins of the other three water
masses, the GASW, GAIW and GABW.
Being the surface water, seasonal as well as the monthly variabilities were highest
for the GASW. Though the core density is ∼ 1024.10 kg m−3, the lower limit of density
varied from 1023.50 kg m−3 in winter to 1022.20 kg m−3 in summer due to the increase in
temperature. The salinity of the core increased towards west (Figure 3.5 and Figure 3.6).
The θ–S–σθ structure of this water mass (core θ–S 26.0 ◦C–36.0 psu and σθ 24.1) is
similar to the salinity maximum D of Rochford [1964] and ASHSW described in Shenoi
et al. [1993]. The salinity maximum D or ASHSW forms in the surface of Arabian Sea
and spreads along the σθ level 23.8 (θ–S range 24.0–26.5 ◦C and 35.1–36.5 psu). The θ–S
range of GASW is 21.0–32.0 ◦C and 35.4–36.8 psu and the core σθ is ∼ 24.1 kg m−3.
In summer, the temperature of this surface water increases to 32 ◦C, while in winter, it
decreases to 26.0 ◦C. The θ–S profiles [Antonov et al., 1998; Boyer et al., 1998] for 4◦
× 4◦ region in the northwestern Arabian Sea (54–58◦ E, 10–14◦ N) for summer (July)
and winter (January) is shown in Figure 3.11. During winter, the characteristics of water
in the surface layers of northwestern Arabian Sea are similar to that of GASW, while

Hydrography and water masses in the Gulf of Aden 81
Figure 3.11 θ–S–Diagram during summer (July) solid–line and winter (January) dashed–line for 4◦ × 4◦ averaged profile (54–58◦ E, 10–14◦ N) in the western ArabianSea.Climatologies of Antonov et al. [1998] and Boyer et al. [1998] are used.
during summer the surface layer in the northwestern Arabian Sea was cooler than GASW
(Figure 3.11). The surface current is towards the west during winter and towards the
east during summer ([Khimitsa, 1968; Piechura and Sobaih, 1986]; also see Chapter 4
for details on circulation). Hence, during winter, a sizable amount of ASHSW enters
the Gulf of Aden from the east. Similarly, during summer, a sizable amount of surface
water from the Red Sea enters the gulf from the west. In addition, during both seasons,
some water forms locally due to precipitation and evaporation. Hence, during winter the
GASW forms as a mixture of locally formed water and ASHSW, while during summer it
is a mixture of locally formed water and Red Sea Surface Water.
In the intermediate layers (200–300 m), the GAIW, appears as a minimum in the
θ–S diagram at σθ level 26.5. Usually, a minimum occurs between two maxima and
it is unnecessary to trace its origin or determine the processes that actively depress the
salinity. However, this particular minimum does not appear to be the typical minimum
found between two maxima because (i) in the θ–S structure it appears as a distinct water

Hydrography and water masses in the Gulf of Aden 82
mass (Figure 3.3) and (ii) it is seen only at a particular σθ level and not spread over the
entire water column between the two maxima. Hence it is necessary to identify the source
of this minimum. Khimitsa [1968] suggested that the water in the intermediate level (150–
200 m) enters the gulf as a strong jet between Cape Gvardafui and Socotra. Mohamed
et al. [1996] identified the water between σθ levels 26.0 and 27.0 as a mixture of PGW,
Arabian Sea Water and Timor Sea water.
To identify the pathways of GAIW, a series of θ–S diagrams were constructed using
data from Antonov et al. [1998] and Boyer et al. [1998] for selected locations along three
paths: (i) from Gulf of Oman to Gulf of Aden (Figure 3.12a); (ii) from the western Ara-
bian Sea to the Gulf of Aden (Figure 3.12b); and (iii) from the equator to the Gulf of Aden
(Figure 3.12c). The θ–S profiles constructed along the path from the Gulf of Oman to the
Gulf of Aden show maxima at σθ = 26.5, corresponding to Persian Gulf Water (PGW),
up to station 3, which is situated outside the Gulf of Aden. From station 4 onwards, the
station situated just outside the Gulf of Aden, the maximum is replaced by a minimum
at σθ = 26.5 and its salinity decreases further at station 5, the entrance to the Gulf of
Aden (Figure 3.12a). The minimum is well marked at stations 6 and 7, inside the gulf.
Thus, PGW cannot be the source of GAIW. The sections made normal to the coast of
Oman [Morrison, 1997] also suggest very little flow of PGW towards the south along the
coast of Oman. Most of the PGW flows towards the east and later spreads towards south
following the eastern boundary of the Arabian Sea basin [Shenoi et al., 1993].
The θ–S curves at locations along the paths from the western Arabian Sea (west of
60◦ E) to the Gulf of Aden as well as that along the path from the equator to the Gulf
of Aden show the presence of salinity minima at around σθ= 26.5 (Figure 3.12b and c).
Hence, it is likely that the GAIW enters the gulf either from the south or from the east.
During summer, a well developed northward flow (Somali current) penetrates far deeper
with velocities above 50 cm s−1 at 300 m depth; it transports about 37±5 Sv of water off
the coast of Somalia [Beal and Chereskin, 2003]. Part of the Somali current system enters

Hydrography and water masses in the Gulf of Aden 83
the Gulf of Aden through the passage between Socotra and the Horn of Africa [Schott and
McCreary, 2001]. Fischer et al. [1996] estimated the total transport, west of Socotra, into
the Gulf of Aden during summer as 13–14 Sv. Figures 3.5, 3.6, and 3.10 also indicate the
east–to–west spread of GAIW. If the GAIW, which has a characteristic salinity minimum,
enters the gulf from the western Arabian Sea, especially through the Socotra passage, then
what is the source of low salinity water in the western Arabian Sea?
Three sources have been identified for the low salinity water in the western Arabian
Sea, the Somali basin. First, the low salinity water brought into the Somali basin by the
northern branch of the South Equatorial Current (SEC) [Swallow et al., 1983]; this brings
the water from the eastern equatorial Indian Ocean. Warren et al. [1966] recognized Bay
of Bengal as a likely source of fresh water for the Somali basin. Morrison [1997] reported
the presence of low saline Indian Central Water in the western Arabian Sea at σθ= 26.6.
However, Wyrtki [1971] suggested that the water of SEC in the lower thermocline (18.0–
19.0 ◦C) originates near the Indonesian archipelago and not from the Bay of Bengal. This
water flows at the density surface σθ= 25.0.
The second possibility is the low salinity Subtropical Subsurface Water (SSW), which
originates at the Subtropical Convergence in the southern hemisphere near 40◦ S [Quad-
fasel and Schott, 1982]. Warren et al. [1966] and Wyrtki [1971] showed that this water
penetrates as far as 10◦ N off East Africa and is partially responsible for the low salinity
in the intermediate layer of the northern Somali basin. In the Somali basin, in the density
range from σθ = 26.5 to 27.0, its core layer lies between 300 and 400 m. The temperature
varies between 8.0 and 15.0 ◦C and salinity between 34.8 and 35.5 psu [Quadfasel and
Schott, 1982]. This description of SSW matches well with the salinity minimum associ-
ated with GAIW. The salinity minimum that lies on the σθ level 26.5 in the Gulf of Aden
has a potential temperature range between 11.0 and 18.0 ◦C and salinity between 35.0
and 36.4 psu; its core layer lies between 200 and 300 m. The corresponding thermohaline
index (Table 3.2) was θ = 14.5 ◦C and S = 35.25 psu.

Hydrography and water masses in the Gulf of Aden 84
Figure 3.12 θ–S curves at selected locations in the western Arabian Sea (see the corre-sponding map on the right side for the location of profiles) during winter and summer.Climatologies of Antonov et al. [1998] and Boyer et al. [1998] were used. The locationof θ–S profiles were selected along the three probable pathways of the water that mightcontribute to the GAIW. (a) from Gulf of Oman to Gulf of Aden, (b) from the westernArabian sea to Gulf of Aden and (c) from the western equatorial Indian Ocean to Gulf ofAden.

Hydrography and water masses in the Gulf of Aden 85
The third possibility is the Antarctic Intermediate Water (AIW), which forms at the
Antarctic Convergence Zone at around 40–50◦ S, sinks and flows north. This water is
characterized by low salinity (< 34.3 psu) and high oxygen content (> 5.0 ml L−1); at its
source the core layer σθ is 27.4. Wyrtki [1971] reported its existence at 5◦ S and Quad-
fasel and Schott [1982] at 4◦ S at the depth rage 700–800 m. Tchernia [1980] suggested
that AIW could extend to the extreme northwest Indian Ocean at the Gulf of Aden and
Gulf of Oman, where it rises up to depths as shallow as 200–300 m in order to override
the relatively saline water spreading southwestward from the Arabian Sea. Hence, it is
possible that both SSW and AIW contribute to the existence of the salinity minimum in
the Gulf of Aden at intermediate levels.
The Socotra passage seems to be the main connection between the Gulf of Aden and
the Somali Basin. The passage also acts as the pathway for the southward migration
of RSW. A southward under–current below the northward Somali current in the latitude
band 8–12◦ N [Quadfasel and Schott, 1983; Schott and Fischer, 2000] transports the RSW
southward at depths ∼ 600–1000 m.
The GABW identified in the σθ range 27.5 to 27.8 occupies about 38% of the total
volume of the Gulf of Aden. Khimitsa [1968] identified this water with the water originat-
ing from the Southern Ocean. Since there is no production of bottom water in the Arabian
basin [Quadfasel et al., 1997] it is necessary to transport the bottom water from else-
where. Johnson et al. [1998] showed that approximately 1–1.7 Sv of Circumpolar Deep
Water (CDW) enters the Somali basin through Aminrante Passage at 8◦ S. The potential
density of this water is much higher (σθ > 28.5) than the GABW, and its representative
θ–S characteristic is 1.0–1.1 ◦C and 34.72–34.75 psu. Hence it is not possible to identify
the GABW with CDW. Another possibility is the water of southern origin, as noted in
the θ–S and θ–O2 curves of Johnson et al. [1998]. This water having θ ∼ 3 ◦C has low
salinity (34.70–34.72 psu) and a higher oxygen content (see figure 3 of Johnson et al.
[1998]). Although Johnson et al. [1998] do not specify the southern source of this water

Hydrography and water masses in the Gulf of Aden 86
it is possible that the AIW could be one among them because that also is characterized
by low salinity and high oxygen content. From Figures 3.12 and 3.13 it appears that this
water of southern origin spreads further north into the Gulf of Aden (between the σθ lev-
els 27.5 and 27.8). The θ–S (Figure 3.12) and the σθ–O2 curves (Figure 3.13) show lower
salinity and higher oxygen for this water (∼ 2.0 ml L−1 near the equator). The water of
southern origin that enters the Gulf of Aden from the south, through the Somali Basin,
ultimately mixes with the high saline RSW to produce the GABW with salinity more than
34.80 psu. The mixing of warm RSW with cooler water from the south leaves a wide
range of potential temperature (2–11 ◦C). The percentage compositions estimated based
on the mixing theory of water masses (Figure 3.10) suggest the presence of ∼ 10–20%
RSW in the GABW. Fedorov and Meshchanov [1988] and Mecking and Warner [1999]
have shown that some RSW remains relatively undiluted (at σθ > 27.5) as it flows out of
the Red Sea and descends in the western Gulf of Aden. Hence, the bottom water in the
western most Gulf of Aden could be the RSW itself.

Hydrography and water masses in the Gulf of Aden 87
Figure 3.13 As Figure 3.12, except that curves are for O2 vs σθ. This figure is also usedto trace the pathway of GABW.