Embed Size (px)
Citation preview


2 Teacher's Manual
TECH WORLD-6CHAPTER 1 : THE COMPUTER SYSTEM
A. 1. b 2. a 3. c 4. b 5. c B. 1. Optical Character Reader 2. Monitor 3. translater 4. BASIC 5. Machine C. 1. T 2. T 3. F 4. F 5. F D. 1. The bar Code reader is used to identify the product. 2. System software refers to programs designed to control the operation of a computer system. 3. A compiler is a program that translates a high level language program into a machine language program and an assembler translates an assembly language program into a machine language program. 4. (i) Word processers– WordPad, (ii) Graphic and presentation software–MS. PowerPoint, (iii) Database Managment system–MS. Access, (iv) Accounting package– Tally. 5. Super computer is the biggest and most powerful computer. It can process trillions of instructions per second.
CHAPTER 2 : MS WORD 2013 : USING MAIL MERGE
A. 1. a 2. a 3. a 4. c B. 1. Tab 2. Tick 3. Data source 4. Field 5. Viewing C. 1. F 2. T 3. F. 4. F 5. T D. 1. • Mail merge is a feature which is used to combine a data source with the main document. It saves much of time and efforts. 2. Data source Main Document, Merge field 3. Step (i) : Click on the Preview Results button, present on the Preview Results group on the mailing tab. Step (ii) : Click on the Next Record button in the Preview Results group to view the next record of the data source. 4. Step (i)- For creating a new mailing list, Type a new list select Radio button in the Mail merge task pane and under Select recipient section. Select the Create option. The New Address list
Tech World (6, 7 & 8) 3
dialog box will appear on the screen. Step (ii)- Click on the Customize Columns button to add or remove fields. Step (iii)- Enter the data in the given fields. Click on the New Entry button. Step (iv)- Enter three records of your friends. You will get a save address list dialog box. Step (v)- Give a name in the File Name: text box and click on the Save button. 5. Follow the steps given below to print the letters: Step (i)- Click on the Finish & Merge button in the Finish group on the Mailings tab. Click on the Print Documents option from the drop-down menu. OR Click on the Next: Complete the merge under 'step 5 of 6' section and then Print option present under the merge section. Step (ii)- The Merge to Printer dialog box appears on the screen. Specify the required print settings. click OK. Step (iii)- The Selected records get printed separately along with the letter.
CHAPTER 3 : MICROSOFT POWERPOINT 2016
A. 1. a 2. a 3. b 4. a 5. a B. 1. table 2. table style 3. Alignment 4. Top 5. Data sheet C. 1. F 2. T 3. F 4. T 5. F D. 1. To insert a table, Follow the given steps: Step (i)- Click on New Slide drop down arrow on Home tab add select Title and content layout. Step (ii)- Select Insert Table icon present on the slide. The Insert Table dialog box will be displayed. Step (iii)- Specify the number of columns and rows, then click OK. 2. Select rows/columns/cells → Click on Border (in the Table Style group on Design tab)→ Select All Borders option (from drop down menu) 3. Six alignment buttons are present on the tab-Align Text Left, Center, Align Text Right, Align Top, Center Vertically and Align Bottom. 4. Select table → Click Design Tab → Select rows or columns → Shading option (in Table Styles group) → Select a colour. 5.
4 Teacher's Manual
Chart is an efficient method for depicting data in a graphical or pictorial form. They make the display of comparisons, growth, relationships among data very easier.
CHAPTER 4 : ANIMATION OF TEXT AND OBJECTS
A. 1. (a) 2. (c) 3. (b) 4. (a) 5. (a) B. 1. transition effects 2. Action buttons 3. Speaker 4. Animation 5. Action C. 1. F 2. T 3. F 4. T 5. F D. 1. Animation is the ability to move text, graphic, charts, etc, in the direction of the slide that we like. It is useful when we want to emphasize on certain part of our presentation and also helps in deciding how to information in our presentation flows. It is possible to animate pictures, text, shapes and many other objects in powerpoint by using sound and visual effects. 2. To adding sound from a file, Follow the given steps: Step (i)- Choose the desired slide and click on the Audio Menu in the media group of the Insert Tab. A dialog box will apears. Step (ii)- Choose the required file from the desired location and click on Insert. Step (iii)- Now, a Speaker icon will appear on the slide and two tabs- Format and Playback will also appear under the Audio tools tabs on the Ribbon. Step (iv)- Choose either Automatically or on click from the drop down menu of the Start field in the Playback Tab. Step (v)- If automatically option is chosen, sound will start automatically as the slide appears and if on click is chosen, sound will start when we click. Step (vi)- Click to the Speaker icon to play the sound. 3. We can insert a link to a web page, file, slide in same presentation, slide in another presentation, etc. using by Action Buttons. In-built button shape that can be used to perform actions like play a sound, redirect to another
Tech World (6, 7 & 8) 5
slides etc, are called Action Buttons. Clicking such buttons will cause the action to occur. 4. To add transition effect follow the given steps: Step (i)- Choose the desired slides and click on transitions tab. Step (ii)- We will see Transition to this slide group on the Ribbion. Step (iii)- Click more and choose a transition effect from the options to see the current slides preview the choosen effect. Step (iv)- In the Transition to this slides group, choose effect option to choose an effect for the choosen transition. Step (v)- In the Sound option of timings group, Choose any sound effect and click on preview to hear the sound. Step (vi)- In the duration box of the timings group, enter the transition timing or check the on mouse click check box if we want to switch to the next slide on mouse click. Step (vii)- Check the After checkbox if we want our slides to move to the next automatically. Step (viii)- If we want to effect to apply to all slides, click on the Apply To All Options. Step (ix)- In the slides show tab, click on From Begining to view all slides with the applied effects. 5. The steps given below to import data from world: Step (i)- Open Microsoft Word from the Start menu. Go to the view tab and click on the Outline button in the Document views group. Step (ii)- Type some text as given in the image and click close outline view to come back to the print layout view. Step (iii)- Click on Types of computers and go to Home tab to apply Heading 1 from Styles group. Step (iv)- Choose Supercomputer and apply Heading 2. Step (v)- Choose Embedded and apply Heading 3. Step (vi)- Choose weather forecasting and apply heading 3. Step (vii)- Then, Apply Heading 2 on Mainframe. Similarly, Heading 2 is applied on Minicomputer and Microcomputer.
6 Teacher's Manual
Step (viii)- Click Save on Quick Access Toolbar. We will see that a save as dialog box appears. Write Types of Software in the space for file name and close MS word. Step (ix)- Next, open any existing presentation in MS Powerpoint. Go to the view tab and select the slide sorter button. Step (x)- Go to the Home Tab and choose new slide, Choose the slides from Outline option from the menu that appears. Step (xi)- We will see that an insert Outline dialog box appears. Locate the place where the word file types of Software is stored. Step (xii)- Choose the file and click on Insert. Step (xiii)- We will see the new slides will get inserted displaying text in the style that you choose and applied.
CHAPTER 5 : MICROSOFT EXCEL 2016
A. 1. a 2. b 3. b 4. b 5. b B. 1. Workbook 2. Workbook sheet 3. Formula 4. Range 5. Cell C. 1. F 2. F 3. T 4. F 5. F D. (1) • Workbook is the first window which is displayed on the screen. • A workbook is similar to a notebook that contains a lot of pages. 2. Cell is an intersection of a row and a column in a worksheet. Active cell is a thick black border will appear around a cell. 3. Workbook is the first window which is displayed on the screen. • A worksheet is where we can enter our data. 4. For renaming a worksheet, double-click on the Sheet tab that has to be renamed, type in the new name and press Enter. 5. Microsoft Excel supports the following data types- • Numbers • Text • Formulae
CHAPTER 6 : LEARNING TO EDIT A WORKSHEET
A. 1. c 2. b 3. b 4. c 5. c B. 1. Format 2. Edit 3. Cancel and Enter 4. Space 5. Auto fill C. 1. F 2. F 3. T 4. F 5. F D. 1. Edit
Tech World (6, 7 & 8) 7
Mode Step (i)- Choose the cell E7 and double-click inside it. We will see that the value is displayed in the formula bar. Step (ii)- The point of insertion will blink in the cell. Step (iii)- Also observe that the left side of Status bar shows the Edit mode. Place arrow to the required location and modify the data. Step (iv)- Press enter and we will see that the changes are made. Also, Edit mode will change to ready mode. 2. Sometimes, after making changes to a cell, we may want to undo our changes to revert back to previous value. We use the undo option of the Quick Access toolbar to undo our last action. If we wish to repeat the last action that we did using undo command, we can use the redo command of the Quick Access Toolbar. 3. Yes, Choose the First row /column and then select the others while simultaneously holding down the ctrl key. 4. A using Drag and Drop method, Step (i)- Choose the desired group of cell and take the mouse arrow to the edge of the choosen cells. Step (ii)- Your arrow will change to a move pointer symbol. Step (iii)- Next, drag the group of cells to the desired new position and released the mouse. We will see that the data has been moved. 5. Auto Fill Features of MS Excel can used to fill the cells with data aurtomatically. To use this Feature, follow the steps given below: Step (i)- As an example, write Monday in cell F1. Step (ii)- Take the mouse arrow to the lower right corner of the F1 cell. Step (iii)- We will observe that the arrow changes to a "+" cross. Step (iv)- Hold the left button of the mouse and drag till cell F7. Release the button. Step (v)- We will see that days Monday to Sunday will appear in the cells F2 to F7.
8 Teacher's Manual
CHAPTER 7 : ALGORITHM AND FLOWCHART
A. 1. b 2. a 3. b 4. a 5. a B. 1. Flow chart 2. Algorithm 3. Decision 4. Start stop 5. Flow lines C. 1. T 2. F 3. T 4. F 5. F D. 1. An algorithm is a set of sequential steps that are needed to solve any mathmatical or a logical problem. 2. (i) Decision Box is used for checking / applying a condition. 3. A Flow chart refers to the pictorial representation of steps and an algorithm is used for solving a specific problem. 4. Input/Output box is used for taking or giving output. 5. Flow lines or Connector lines shows direction of program flow.
CHAPTER 8 : AN INTRODUCTION TO QB64A. 1. a 2. a 3. b 4. b & c 5. b B. 1. constant 2. Bracket, exponential, Division, Multiplication, Addition and Substraction 3. numbers 4. Numbers 5. print C. 1. F 2. T 3. F 4. F 5. T D. 1. QBASIC 64 was developded by Microsoft to type, edit and run basic programs. QBASIC 64 has english like words and mathematical symbols for writing programs and the various instrucrtuions in QBASIC are called statements. Syntax is the set of rules that must be followed while writnig programs in a language. QB64 update version of QBASIC. 2. A named memory location which is used to store information temporarily and continues to hold this value till some other value is given to it is called a variable. These variables are two types: (i) Numeric Variables (ii) Alphabet or string Variable. 3. Numeric constants: Any number, that is integer or a real number, positive or negative is called a numeric constant and Alphanumeric or string constant is a set of characters and a string constant constist of many characters
Tech World (6, 7 & 8) 9
from A-Z, a-z, 0-9 and many special symbols like &, #, * etc. 4. The sequence in which operations are performed in a QBASIC expression is called Hierarchy of operations. We use the BEDMAS hierarchy of operations. 5. To save a program, follow the given steps: Step (i)– Go to the File menu. Step (ii)– Choose the Save As option. Step (iii)– Give the name you want to your program by writing it in the space for file name and press Enter. Step (iv)– Your file will be saved with extension .bas.
CHAPTER 9 : QB64 STATEMENTS
A. 1. b 2. b 3. a 4. b B. 1. question 2. table 3. Input 4. numeric 5. CLS C. 1. F 2. T 3. T 4. T D. 1 The Input statement is used to take a data item from the user and then store it in a variable. It also asks the user to enter data by displaying a question mark (?) on the screen during the execution of the program. 2. It is used to move the position of the print to the column specified by its argument. It is mostly used for printing tables.
Syntax: PRINT TAB (C); "CONSTANT/Variable/Expression" 3. The LET statement or the assignment statement assigns a value to a variable. Its use is optional. Syntax: [LET] < Variable Name >=< Value or Expression> LET X=3
4. Print with semi colon displays the variable one after another without leaving any space in between and Print with comma (,) statement displays the values one after the other with a lot of spaces in between (usually 14).
5. Syntax: PRINT(Variable), (Variable)...
LET A= 40
10 Teacher's Manual
LET B=60
C=A+B
PRINT A, B, "SUM", C
CHAPTER 10 : LOG ON FLASH CS3
A. 1 b 2. a 3. a 4. a 5. a B. 1. Stage 2. Menu Bar 3. Timeline 4. Frame 5. Ink bottle C. 1. T 2. T 3. T 4. F 5. T D. 1. Flash is an animation software package. It provides an easy way to create animations. 2. The stage is a rectangular workspace area where the contents are placed or drawings and movies are created. 3. (i) Rectangle Tool: It is used for creating square and other rectangular shapes. (ii) Polystar Tool: It is used to draw a polygon as well as figures. (iii) Line Tool: It works in the same way as the line tool in graphics software. It is used to draw straight lines. 4. Paint Bucket Tool is useful for filling enclosed areas of an object with colours in a single click. 5. Follow the steps given below: Step (i)– Click on Start button. Step (ii)– Choose All Programs. Step (iii)– Click on the Adobe Flash CS3 Professional. The Flash screen will be displayed Select Flash File (Action Script 3.0) Under Create New option. It wiil open a new blank file.
CHAPTER 11 : WORKINGWITH FLASH CS3
A. 1. c 2. c 3. a 4. c 5. a B. 1. Symbol 2. Shape 3. Library 4. Motion, Shapes tween 5. Motion quide tween C. 1. T 2. T 3. F 4. F 5. T D. 1. Symbols are reusable objects used for static images or animation. Symbols can either be created with the help of drawing tools or they can be imported from other sources. Symbols are stored in the library. When a symbol is
12 Teacher's Manual
send e-mail, follow the steps : (i) Go to Google.com and click Gmail. The Inbox may directly open or you may be asked to type in your password. (ii) To open an e-mail, click on it. (iii) To send an e-mail, click on compose. The New Message window opens. (iv) In the To box, type the e-mail address of the recipient. (v) In the Subject box, type a short word description of the message. (vi) Type the message in the message area. (vii) Click Send after completing the message. A copy of the message is stored in the Sent folder.
TECH WORLD-7CHAPTER 1 : COMPUTER SYSTEM
A. 1. a 2. c 3. b 4. a 5. a 6. b B. 1. utility software 2. Input, Process, Output 3. Application software 4. 2 5. 0, 1 C. 1. F 2. T 3. T 4. F 5. T D. 1. Operating system is a software that controls the octal activity of a computer system. Single-user operating system like DOS, Multi-user Operating System like UNIX and LINUX, Multi-tasking Operating System like Windows are the examples of Operating systems. 2. DBMS or Database Management System is a software used to handle the large amounts of data stored in a database. 3. A customized software is made as per the specific requirement of an organization. For example, software made for library management system would be different from that an airline reservation system. 4. Number system is a way to represent numbers. There are mainly four types of number system : (i) Decimal Number System, (ii) Binary number system, (iii) Octal number system, (iv) Hexa-decimal number system.
Tech World (6, 7 & 8) 13
5. In number system, the value of each digit in a number depends on the base. 6. The Open-source Initiative (OSI) is an organization dedicated to promote Open-software. Ubuntu and Android are the examples of open source software.
CHAPTER 2 : FORMULAS AND FUNCTIONS IN EXCEL
A. 1. a 2. c 3. a 4. a 5. a B. 1. Basic 2. Reference 3. three 4. Functions 5. addition C. 1. F 2. F 3. T 4. T 5. F D. 1. Formula is used for doing calculation which involve addition, subtraction, division and multiplication. It develops a relationship between multiple cells. 2. Step (i)– Right click on the Sheet 2 tab in the worksheet. Step (ii)– We will see a shortcut menu appears. Choose the Rename option. Step (iii)– The pointer appears in the Sheet 2 tab. Type the name of your choice. Press Enter 3. Multiple cells can be assigned to a formula by creating a range or reference. It can save a lot of time and effort. 4. Absolute reference is used when the cell address does not have to be changed on copying the formula to another cell. For making absolute reference of a formula, add dollar($) sign before the column or row number. For example =$B$1+$B$2.
5. (i) Functions should begin with ‘=’ sign. (ii) Function name should be a valid Excel name like Sum, Average. etc. (iii) Name of function should be followed by opening as well as closing parenthesis.
CHAPTER 3 : EXCEL AS DATABASE A. 1. a 2. a 3. b 4. a 5. a B. 1. Database 2. fields (columns), records (rows) 3. Field 4. Field name 5. Data validation C. 1. T 2. F 3. F 4. F 5. T D. 1. Database refers to a collection of
14 Teacher's Manual
data which is related to a particular subject, like maintaining of contact numbers and addresses. 2. Sorting is the process of arrangement of data in the ascending or decending order in a worksheet. We can sort the data present in the rows based on text, numbers, combination of text and numbers or date. 3. The Filter feature of MS Excel enables us to have a look at only those records which we wish to display. The rest of the data is hidden temporarily from the view. 4. Data Validation is required for resticiting the cell entries within a given range. 5. This option filters the data in more than one field on the basis of the specified criteria, copies the filtered records to a new location or finds unique records.
CHAPTER 4 : ADVANCED FEATURES OF EXCELA. 1. a 2. b 3. b 4. c 5. c B. 1. updated 2. Category name 3. Plot area 4. Goal Seek 5. Gridlines C. 1. T 2. F 3. F 4. T 5. T D. 1. Chart is an efficient method for depiciting data in a graphical or pictorial form.
2. Chart Area It include complete area and all object of a chart.
Category Axis (X axis) It is the horizantial axis. Has the data that is compared and presented.
Value Axis (Y axis) It is the vertical axis. Used for plotting values.
3. Bar Chart is used to display the data in the form of Long rectangular rods (known as bars). These rods are placed vertically/horizontally on the chart area. 4. Select the chart and follow the steps given below: Step (i)– Select the Layout tab and choose the Chart title option from the Labels
Tech World (6, 7 & 8) 15
group. Step (ii)– Click on the Centered overlay Title or Above Chart option. Step (iii)– A Chart Title text box will appear on the screen. Enter the text in it. Once you type the title, click outside the chart. 5. Goal Seek is an amazing feature of Excel that fixes a specific result for one cell by the adjusting a value in other cell.
CHAPTER 5 : WORKING WITH FLASH CS3
A. 1. a 2. c 3. b 4. b 5. c B. 1. Woprkspace 2. Stage 3. Menu 4. Frames 5. Timeline C. 1. T 2. T 3. T 4. F 5. T D. 1. Follow the steps given below to start Flash: Step (i)– Click on Start button. Step (ii)– Choose All Programs. Step (iii)– Click on the Adobe Flash CS3 Professional. The Flash screen will be displayed. Step (iv) Select Flash File (Action Script 3.0) under Create New option. It will open a new blank file. 2. Stage is a rectangular workspace area present at the centre where the contents are placed or drawings and movies are created. 3. Tools panel has four main parts: (i) The Tools Section–Contains tools which are needed for drawing, painting and selecting objects. (ii) The View Selection–Contains tools required for zooming and painting the application window. (iii) The Colors Selection– Contains modifiers for selecting colours for the shape which we draw with the helps of stroke and Fill Color picker. (iv) The options Selection–Displays the modifiers for the tools that are currently choosen. 4. Two types of gradients can be created using Flash. (i) Linear Gradient–It changes the colour from starting to end point in a straight line. (ii) Radial Gradient–It changes colour in a circular outward direction beginning from the focal point. 5. Follow the steps given
16 Teacher's Manual
below: Step (i)–Click on File>Import>Import to Stage.The Import dialog box will be displayed. Step (ii)– Browse and choose the file which has to be imported. click on open.
CHAPTER 6 : HOW LAYERS WORK
A. 1. c 2. a 3. c 4. c 5. a B. 1. Layers 2. Pencil icon 3. Logo 4. Onion Skin tool 5. F6 C. 1. T 2. F 3. F 4. T 5. F D. 1. Layer as transparent sheets which are stacked one over the other and can hold objects. Layers are used when we are developing a big animation film. 2. Follow the steps given below to add layers: Step (i)– Simply Click on the Insert Layer button at the bottom of your timeline will add a new layer. or Step (ii)– Go to Insert>Timeline>Layer. Step (iii)– You will see a new layer above the chosen layer. This new layer is now active layer. Step (iv)– Choose Sky as the new name for the new layer. 3. Layers can be hidden to view objects of other layer. We can hide layers individually or all at once. Follow the steps below: Step (i)– Above the layers, Click the Eye icon and a red cross will be visible in the eye column. Also, notice that all content has disappeared from the stage. Step (ii)– The content will reappear on the layer one by one clicking on each red cross symbol. 4. Follow the steps given below to rename a layer. Step (i)– The layer each has to be renamed is chosen by clicking on it. Step (ii)– The already existing name is double clicked and the new name is typed. Say the name given is "House". OR. Step (iii)– The layer name is right clicked and Properties is chosen from the context menu. Step (iv)– A Layer Properties dialog appears. Step (v)– The new name is typed into the name text box. Step (vi)– Click on OK.
Tech World (6, 7 & 8) 17
CHAPTER 7 : CONDITIONAL CONTROL STATEMENTS
A. 1. b 2. c 3. a 4. a 5. a B. 1. Variable 2. Go To 3. Constants 4. Control 5. integer, real C. 1. F 2. T 3. T 4. T 5. F D. 1. Control statements are used to chang the order of execution. 2. The GOTO statement is used to transfer the program control from one statement to other. 3. If...Then...Else is a conditional decision making statement. If the condition given after ‘If’ is found to be true, the statement after THEN is executed. If the condition is false, the Else statement gets executed. 4. Constants are the values which do not change while the program executes and a variable is named location in the computer memory which stores some data temporarily. 5. READ-DATA command is similar to INPUT statement. The only difference between this statement and INPUT is that INPUT statement needs data at the time of execution of program. Whereas READ-DATA statement take more than one data at a time by putting a comma, in between within program, before the execution starts.
CHAPTER 8 : LOOPING STATEMENTS
A. 1. a 2. b 3. b 4. a 5. b B. 1. For Next 2. Control 3. 7th 4. Next 5. Initial, Final C. 1. F 2. F 3. F 4. T 5. F D. 1. When we are writing a program, we might have to execute a set of statements multiple times. This can be achieved with the help of loops. Example: Suppose we take a control variable c. In our program, initially c is 0 and we increment c by 1 after each round is complete. That is, after first round, C=1. After second round, c become 2 and so on. After each round, c is checked against a fixed number say max.
18 Teacher's Manual
If c is less than max, another round is taken else, loop is terminated. Loops are advantageous because they decrease the number of instrucrtion we write in our program and thus save memory space and our time. 2. Using a large number of counter variables makes it very large and difficult to comprehend. This problem can be solved by using FOR...NEXT loop which can be used when a set of instructions. Syntax: FOR <Control Variable> = <Initial value>TO <Final value> Statement(s) Next <Control Variable>. 3. The STEP statement is used if we want to increment the value of the control variable in FOR...next by something other than 1.
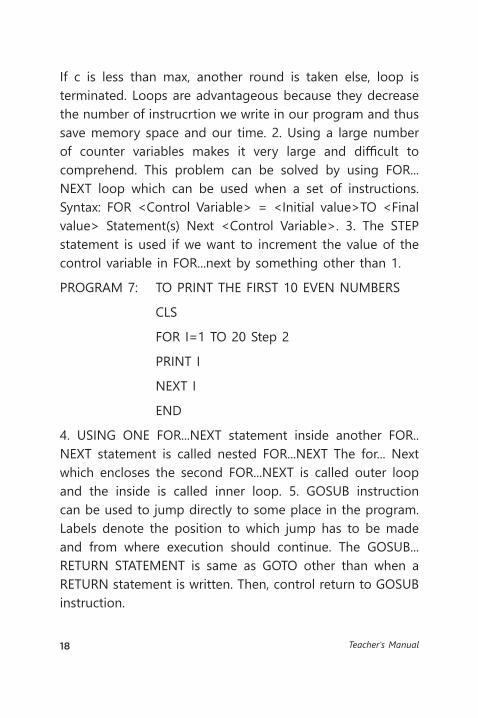
PROGRAM 7: TO PRINT THE FIRST 10 EVEN NUMBERS
CLS
FOR I=1 TO 20 Step 2
PRINT I
NEXT I
END
4. USING ONE FOR...NEXT statement inside another FOR..NEXT statement is called nested FOR...NEXT The for... Next which encloses the second FOR...NEXT is called outer loop and the inside is called inner loop. 5. GOSUB instruction can be used to jump directly to some place in the program. Labels denote the position to which jump has to be made and from where execution should continue. The GOSUB...RETURN STATEMENT is same as GOTO other than when a RETURN statement is written. Then, control return to GOSUB instruction.
Tech World (6, 7 & 8) 19
CHAPTER 9 : GRAPHICS IN QB64
A. 1. c 2. c 3. a 4. a 5. a B. 1. PSET 2. Line 3. Draw 4. Screen 5. Color C. 1. F 2. T 3. F 4. T 5. F D. 1. The SCREEN statement is used for specifying the screen resolution. The synatx is: 'SCREEN mode parameter'
Many Screen modes can be used in QBasic and QB64. 2. We can draw a line by using the pointer in the middle of the screen. The line is drawn in any direction with the use of specific characters. Letter D means line is downward direction, U means upwards, R means Right and L means Left. The syntax is: DRAW "DIRECTION <Length of direction>"
3. The CIRCLE Command is used for drawing a circle, ellipse or an arc of the circle. The syntax is: CIRCLE (x, y), r, p4. There are four types of diagonal statements that can be used for drawing lines in different directions diagonally. The statements are-
Step (i): E- allows the pointer to draw a line diagonally in upward directions and towards the right side.
Step (ii): F- draws a line diagonally in the downward direction.
Step (iii): G- draws a line diagonally in downward direction towards the left side.
Step (iv): H- draws a line diagonally in upward direction towards the left side.
5. LINE (X1, Y1)-(X2, Y2), COLOR
Here, (X1, Y1) and (X2, Y2) refers to the starting and ending coordinates of the line which is drawn in the colour that is specified.
20 Teacher's Manual
CHAPTER 10 : SERVICES OF THE INTERNET
A. 1. c 2. b 3. c 4. b 5. a 6. a B. 1. Internet forum 2. Blogging 3. 140 4. E-mail 5. One Drive C. 1. F 2. F 3. F 4. T 5. F 6. T D. 1. Micro blogging is becoming very popular in which users communicate their thoughts and ideas through short posts which are sent via SMS, emails, digital audio, web and other online mediums. Twitter and Tumblr are examples of such services. 2. When a contact is not needed any more, we can delete it from our contacts book. Follow the steps below: Step (i): Go to your contact list. Step (ii): Choose the contact you want to delete and click on it. Step (iii): Click on the More drop-down arrow. Step (iv): Choose the Delete contact option. 3. A collection of hardware, networks, storage, interfaces and services joined together to deliver various services a network or the internet is called a cloud.
We can use cloud computing to change, configure or access online applications. Also, cloud computing has resulted in a decrease in instance of copright violations and piracy beacuse users can now access authentic content by paying very little in a very secure and confidential manner. 4. An area for discussion on a website which allows people with similar interests to share ideas and information is called a Forum. In a Forum, people can send and reiceve message and reply to messege posted by others on a variety of subjects in a real time. 5. Microsoft offers an online storage facility which is called one drive. One drive was earlier called sky drive and was renamed in 2014 to one drive to signify that it is a single place where one can store all their data, pictures and videos completely free of cost. It also allows users to choose
Tech World (6, 7 & 8) 21
which they want to keep private, make public or share with their contacts.
CHAPTER 11 : YOUR COMPUTER UNDER ATTACK
A. 1. a 2. b 3. a 4. b 5. b B. 1. macro virus 2. executable 3. humen action 4. file infector 5. Torajan Horse C. 1. T 2. T 3. T 4. F 5. F D. 1. A computer virus is a program code written to deliberately enter a computer without the user’s permission or knowledge. The Virus attaches itself to other programs and each time the program runs, the virus reproduces by infecting other programs in the computer system. Just like as a biological virus spreads from one person to another. 2. When the file that contains the virus is opened or executed then the virus is activated. The active virus loads itself into the memory of a computer and looks to see if it can find any programs to infect. If the virus finds a program, it modifies the code and attached itself to the new program. 3. A Polymorphic virus changes its code envery time it infects a new file. So, a polymorphic virus may have hundreds of different forms. So, it is difficult to detect. 4. A virus is a program code written to deliberately enter a computer without the user’s permission. A worm is different from a virus because it is capable of running itself and does not neet a host program to run like virus. A Trojan Horse pretends to be a beneficial program at first glance but actually damages the computer once it is run. 5. (i) Install a good anti-virus software on your computer. (ii) Use floppies and CDs that are from a source known to you. (iii) Never open an e-mail from an unknown person.
22 Teacher's Manual
TECH WORLD-8CHAPTER 1 : NETWORK CONCEPTS
A. 1. b 2. c 3. b 4. a 5. a B. 1. Firewall 2. Hub 3. LAN 4. Topology 5. WORM C. 1. T 2. F 3. T 4. F 5. T D. 1. A computer network comprises of at least two computers that are connected to each other so as to enable sharing of data and to facilitate communication between the computers in the network. Computers have wide variety of uses and hence are used at almost every place from offices, shops, homes etc. This has not only lead to better communication and networking but also an increase in human productivity. 2. (i) Bus Topology: When a single cable is used to connect all the computers in a network it is known as Bus topology. (ii) Ring Topology: A closed ring like structure is formed in this topology hence the name ring topology every computer is connected to two other computers in this topology. (iii) Star Topology: This topology forms a star by connecting a computer in the center to all other computers in this type of topology. (iv) Mesh Topology: A mesh is formed when all computers in the topology are connected to one other. A full mesh topology is very expensive affair hence a partial mesh topology is generally used. 3. All computers in a computer network should have antivirus on them. As antivirus protects the computer from worms, Trojans and all other malware. It warns you when your computer is infected and also clean up and deactivate the malicious software. 4. A firewall protects the computer from any unauthorized access. Firewall can be introduced in the computer as a software or hardware or a combination of both. All the data that enters or leave the
Tech World (6, 7 & 8) 23
computer goes through firewall so that it can be examined and the computer be protected. 5. (i) Hub: This is basically a device that is used to connect all the computers in a network. Hub receives the data from a computer sending it and sends the packets to all the computers connected in the network. (ii) Switch: A switch is also used to connect the devices to a network. Switch is different from the hub as it directly sends the data meant for a computer to it and not to others. Switch has recorded addresses of all the computers with it.
E. 1. SERVER 2. NETWORK 3. NODE 4. HUB. 5. TOPOLOGY 6. SWITCH 7. MODEM 8. ETHERNET 9. ROUTER 10. SECURITY
CHAPTER 2 : INTRODUCRTION TO MS ACCESS 2016
A. 1. a 2. a 3. a 4. a 5. c B. 1. Table 2. DBMS 3. Database 4. Title Bar 5. Interface C. 1. F 2. F 3. T 4. F 5. T D. 1. A database is built up on tables and are used to store data. A table consists of rows and columns. 2. Records are rows in a table. The row is used to store complete information about an object or an item. 3. This is a filed or a combination of fields that are used to uniquely identify records in a table. This key can not have repetitive values and also cannot be left blank. 4. (i) Reduction in Data Redundancy (ii) Increased Consistency and Reduced Update on Errors (iii) Improved Data Access to Users (iv) Maintaining Standards 5. DBMS is the short form for Database Management System. DBMS is a software program which is used to extract, create or modify data from a database. Relational, hierarchical, network are models on which the DBMS is based. A DBMS which is based on relational data is used to store data in form of tables and is known as Relational Database Management System.
24 Teacher's Manual
CHAPTER 3 : ADVANCED FEATURES OF MS ACCESS 2016
A. 1. b 2. a 3. c 4. a 5. a B. 1. Query 2. Print command 3. four 4. Datesheet view 5. Print C. 1. T 2. F 3. F 4. F 5. F D. 1. The data that we create using tables and queries is presented in the form of a report. 2. A form constitutes textboxes and labels. We can work in different views in a form which are described below: • FORM VIEW • LAYOUT VIEW • DESIGN VIEW. 3. • Report View: This allows design related views only data can be viewed here.
• Print Preview: This preview shows just before actual printing how your data will look once it gets printed.
• Design View: No underlying data can be viewed here but only the structure of the report is available for viewing.
• Layout View: This view displays data and allows us to make changes.
4. The query feature in MS ACCESS is used to get a limited amount of data based on a specific search criteria that we enter from one or more tables. For this a query can be designed which will search for all the data available on the criteria that is requested by the user.
5. A form constitutes textboxes and labels. We can work in different views in a form which are described below: • FORM VIEW • LAYOUT VIEW • DESIGN VIEW.
CHAPTER 4 : INSERTING IMAGES AND CREATING LISTS IN HTML
A. 1. a 2. a 3. a 4. a 5. c B. 1. Ordered list 2. Unordered list 3. align 4. Alt 5. <oL> C. 1. F. 2. F 3. T 4. T 5. T D. 1. Images in a webpage are used to enhance how the webpage looks and
Tech World (6, 7 & 8) 25
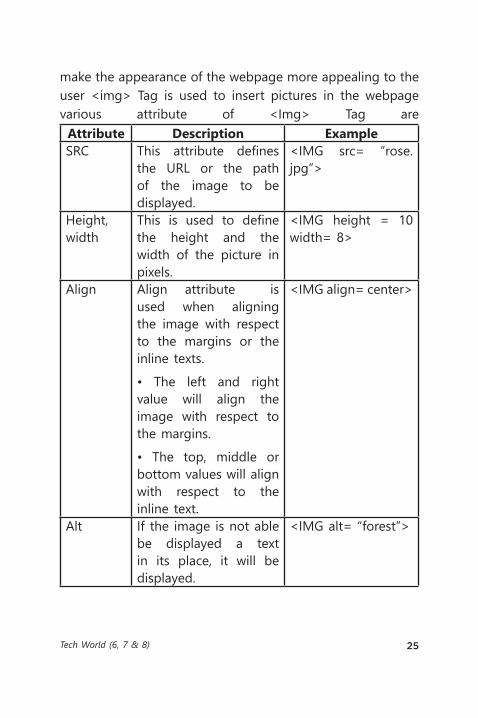
make the appearance of the webpage more appealing to the user <img> Tag is used to insert pictures in the webpage various attribute of <Img> Tag are
Attribute Description ExampleSRC This attribute defines
the URL or the path of the image to be displayed.
<IMG src= “rose.jpg”>
Height, width
This is used to define the height and the width of the picture in pixels.
<IMG height = 10 width= 8>
Align Align attribute is used when aligning the image with respect to the margins or the inline texts.• The left and right value will align the image with respect to the margins.• The top, middle or bottom values will align with respect to the inline text.
<IMG align= center>
Alt If the image is not able be displayed a text in its place, it will be displayed.
<IMG alt= “forest”>
26 Teacher's Manual
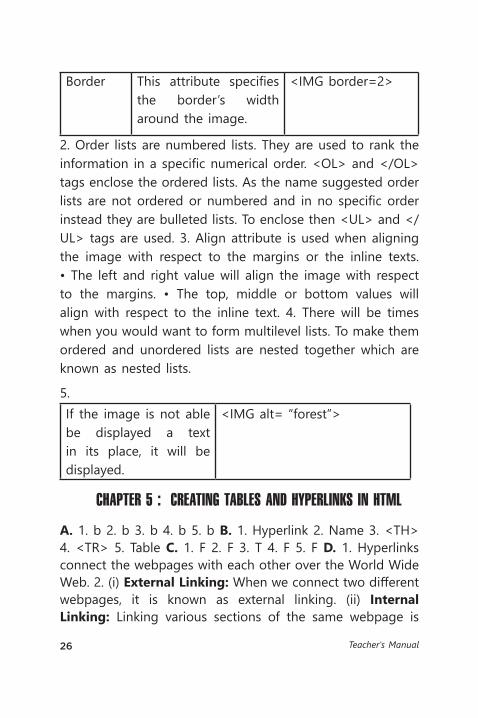
Border This attribute specifies the border’s width around the image.
<IMG border=2>
2. Order lists are numbered lists. They are used to rank the information in a specific numerical order. <OL> and </OL> tags enclose the ordered lists. As the name suggested order lists are not ordered or numbered and in no specific order instead they are bulleted lists. To enclose then <UL> and </UL> tags are used. 3. Align attribute is used when aligning the image with respect to the margins or the inline texts. • The left and right value will align the image with respect to the margins. • The top, middle or bottom values will align with respect to the inline text. 4. There will be times when you would want to form multilevel lists. To make them ordered and unordered lists are nested together which are known as nested lists.
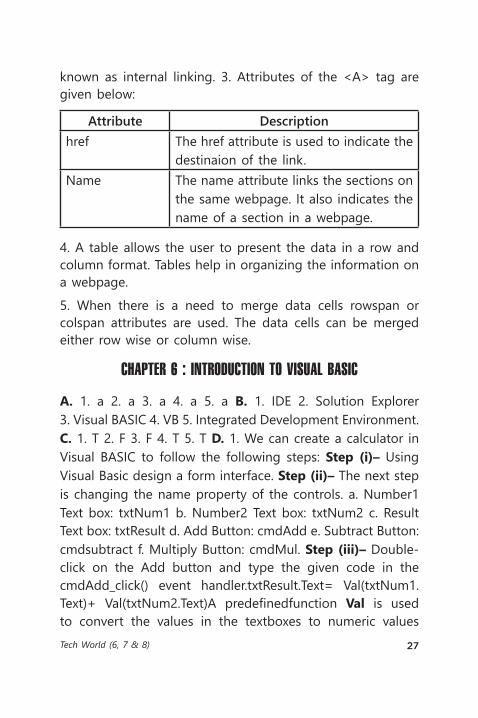
5. If the image is not able be displayed a text in its place, it will be displayed.
<IMG alt= “forest”>
CHAPTER 5 : CREATING TABLES AND HYPERLINKS IN HTML
A. 1. b 2. b 3. b 4. b 5. b B. 1. Hyperlink 2. Name 3. <TH> 4. <TR> 5. Table C. 1. F 2. F 3. T 4. F 5. F D. 1. Hyperlinks connect the webpages with each other over the World Wide Web. 2. (i) External Linking: When we connect two different webpages, it is known as external linking. (ii) Internal Linking: Linking various sections of the same webpage is
Tech World (6, 7 & 8) 27
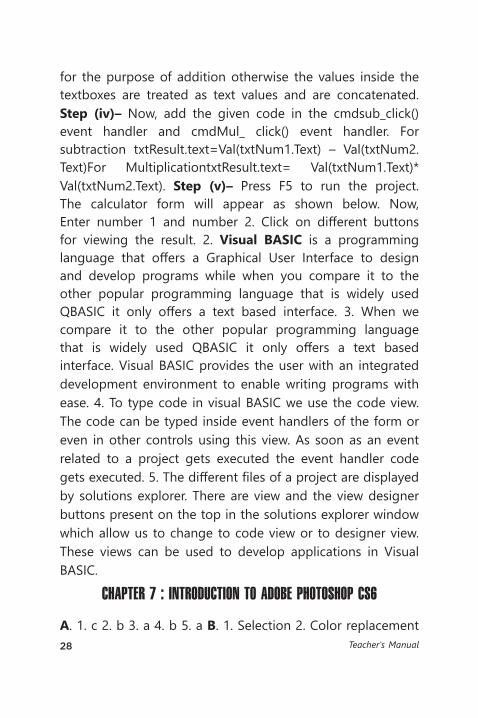
known as internal linking. 3. Attributes of the <A> tag are given below:
Attribute Descriptionhref The href attribute is used to indicate the
destinaion of the link.Name The name attribute links the sections on
the same webpage. It also indicates the name of a section in a webpage.
4. A table allows the user to present the data in a row and column format. Tables help in organizing the information on a webpage.5. When there is a need to merge data cells rowspan or colspan attributes are used. The data cells can be merged either row wise or column wise.
CHAPTER 6 : INTRODUCTION TO VISUAL BASIC
A. 1. a 2. a 3. a 4. a 5. a B. 1. IDE 2. Solution Explorer 3. Visual BASIC 4. VB 5. Integrated Development Environment. C. 1. T 2. F 3. F 4. T 5. T D. 1. We can create a calculator in Visual BASIC to follow the following steps: Step (i)– Using Visual Basic design a form interface. Step (ii)– The next step is changing the name property of the controls. a. Number1 Text box: txtNum1 b. Number2 Text box: txtNum2 c. Result Text box: txtResult d. Add Button: cmdAdd e. Subtract Button: cmdsubtract f. Multiply Button: cmdMul. Step (iii)– Double-click on the Add button and type the given code in the cmdAdd_click() event handler.txtResult.Text= Val(txtNum1.Text)+ Val(txtNum2.Text)A predefinedfunction Val is used to convert the values in the textboxes to numeric values
28 Teacher's Manual
for the purpose of addition otherwise the values inside the textboxes are treated as text values and are concatenated. Step (iv)– Now, add the given code in the cmdsub_click() event handler and cmdMul_ click() event handler. For subtraction txtResult.text=Val(txtNum1.Text) – Val(txtNum2.Text)For MultiplicationtxtResult.text= Val(txtNum1.Text)* Val(txtNum2.Text). Step (v)– Press F5 to run the project. The calculator form will appear as shown below. Now, Enter number 1 and number 2. Click on different buttons for viewing the result. 2. Visual BASIC is a programming language that offers a Graphical User Interface to design and develop programs while when you compare it to the other popular programming language that is widely used QBASIC it only offers a text based interface. 3. When we compare it to the other popular programming language that is widely used QBASIC it only offers a text based interface. Visual BASIC provides the user with an integrated development environment to enable writing programs with ease. 4. To type code in visual BASIC we use the code view. The code can be typed inside event handlers of the form or even in other controls using this view. As soon as an event related to a project gets executed the event handler code gets executed. 5. The different files of a project are displayed by solutions explorer. There are view and the view designer buttons present on the top in the solutions explorer window which allow us to change to code view or to designer view. These views can be used to develop applications in Visual BASIC.
CHAPTER 7 : INTRODUCTION TO ADOBE PHOTOSHOP CS6
A. 1. c 2. b 3. a 4. b 5. a B. 1. Selection 2. Color replacement
Tech World (6, 7 & 8) 29
3. Move 4. Color replacement 5. crop C. 1. F. 2. T. 3. F. 4. T. 5. F D. 1. Color Replacement Tool allows us to replace the colour of an image with the foreground colour. 2. Shape Tools: To draw shapes like rectangle, rounded rectangle, ellipse, polygon and line. Custom Shape Tool: There are a variety of preset shapes in Photoshop like a flower or a grid to use them we use this tool. 3. Step (i)– Starting Photoshop is very easy just drag the mouse pointer to the extreme left corner on the desktop. Step (ii)– Click on the Start button. Step (iii)– Now, click on All Apps. Click> Adobe Photoshop CS6. Step (iv)– Photoshop will open. 4. (i) Marquee Tools: With this tool we can select the different portions of an image in a specific shape. (ii) Lasso Tools: Lasso tools are used so that we can select the different parts of a picture either by drawing a free hand or a straight edged area. (iii) Magic Wand Tool: This tool is used to select those areas of an image that have a similar color. (iv) Quick Selection Tool: To make quick selections on the image we use this tool. (v) Crop Tool: There are some parts in an image that are unwanted to remove them we use the crop tool. (vi) Move Tool: This tool allows us to use the selected part of an image in a new location on that image. 5. Crop tool removes the unwanted parts of an usage whereas move tool allows to use the selected part of an usage into a new.
CHAPTER 8 : MORE FEATURE OF ADOBE PHOTOSHOPA. 1. a 2. a 3. a 4. a 5. a B. 1. Burn 2. Dodge 3. Blur 4. Clone stamp 5. Pattern stamp C. 1. T. 2. F. 3. F. 4. T. 5. T D. 1. Layer is used in Photoshop to work on an individual part or an element of an image. The composition of an
30 Teacher's Manual
image can be changed by changing the properties of layers. 2. The appearance of an image can be changed by adding special effects to it using filters. We can find the filters under the filter menu. 3. An image might be imperfect due to scratches, blemishes or marks on an image. To correct these imperfections we use the Healing brush tool. 4. Eraser tool is used to erase unwanted portion of an image. 5. Dodge and Burn Tool : These tools are used when images are to be lightened or darkened. The Dodge tool is used when lightening an image whereas the burn tool will darken them.
CHAPTER 9 : WINDOW MOVIE MAKERA. 1. b 2. c 3. b 4. b 5. a B. 1. Movie 2. Transition 3. Movie 4. Collection plane 5. WMX C. 1. F. 2. T. 3. F. 4. F. 5.T D. 1. Windows movie maker is a software that is designed by windows to allow users to edit audio or video files, arrange the content in the movie or create a movie altogether and even add sounds and transitions to it. 2. We can save our project for the following steps. Step (i)– Click on the file> Save movie file option. This will open the save movie wizard on the screen. Step (ii)– Choose a location where you want the file to be saved and then click on the next button. Step (iii)– Choose the name of the file and enter it also. Choose the folder where you would like to save it. Then click on the next button. Step (iv)– Choose your settings for saving the movie. The file gets saved by default in *wmv format but you can also save it in *avi or other formats. Now, click on the next button. 4. (i) Storyboard: This is also the view by default in windows movie maker. This can be found at the bottom of the screen. Storyboard has with it and displays all the pictures and the videos which are about to come in their proper sequence. (ii) Timeline: To switch to time
Tech World (6, 7 & 8) 31
line view we need to click on the show timeline button present above the storyboard. The timeline allows the user to review or modify clip timings in the movie. 5. (i) Movie Task Pane: This pane allows the user to perform functions like importing or adding videos or pictures to a project. We can also edit and add effects to a movie. (ii) Collections Pane: The toolbar has a collections tab clicking on which will open the collections pane. The collections pane has two part the left side and the right side. The left side has all the lists of collections whereas the right side has a selection of clips from the collection.
CHAPTER 10 : WORLD OF E-COMMERCEA. 1. a 2. c 3. c 4. b B. 1. E-commerce 3. Digits India Platform 4. E-learning 5. E-sign Frame work C. 1. T 2. T 3. F 4. T 5. F D. 1. Cloud computing is a technology that makes use of a network of remote servers available on the Internet to store, manage and process data, rather than a local server. This is very useful because of the following reasons : • We pay only for the services and not for the hardware and software. • We have online access to a broad range of applications. Services and hardware that otherwise may be very expensive. • We cut costs by renting software and applications. We don’t worry about buying software or upgrading from time-to-time. 2. E-commerce is the process of shopping online. We can buy or sell the goods online with the help of Internet. It includes online shopping, Online banking, trading of stocks, and honds, electronic ticket booking and so on. 3. (i) Swachh Bharat Misson : This app would be used by people and Government Organizations for achieving the goals of Swachh Bharat Mission. (ii) Attendence .gove. in : This website has been launched by the Government to maintain
32 Teacher's Manual
the attendence record of all Government employees on a real time basis. (iii) My.Gov.in : This is a platform to encourage citizen engagement in governance. The mobile App for My Gov Would bring these features to users on a mobile phone. 4. Cyber Safety : (i) Limit the amount of personal information you post. Always remember that the Internet is a public resource. (ii) Be selective about who you accept as a friend on a social netwok. Use strong passwords. (iii) Do not believe everything you read online. (iv) Type the address of your social networking site directly in your browser or use your personal book marks. 5. E-learning is the use of technology to enable people to learn anytime and anywhere. E-learning is a broad term. It includes all forms of technology used in learning and teaching.


![Microsoft PowerPoint - Chapter 2_PartB [Compatibility Mode]](https://img.pdfslide.net/doc/110x75/577cc7041a28aba7119fc588/microsoft-powerpoint-chapter-2partb-compatibility-mode.jpg)