Embed Size (px)
Citation preview
Chapter 3Numerically Summarizing
Data3.4
Measures of Location
The z-score represents the number of standard deviations that a data value is from the mean.
It is obtained by subtracting the mean from the data value and dividing this result by the standard deviation.
The z-score is unitless with a mean of 0 and a standard deviation of 1.
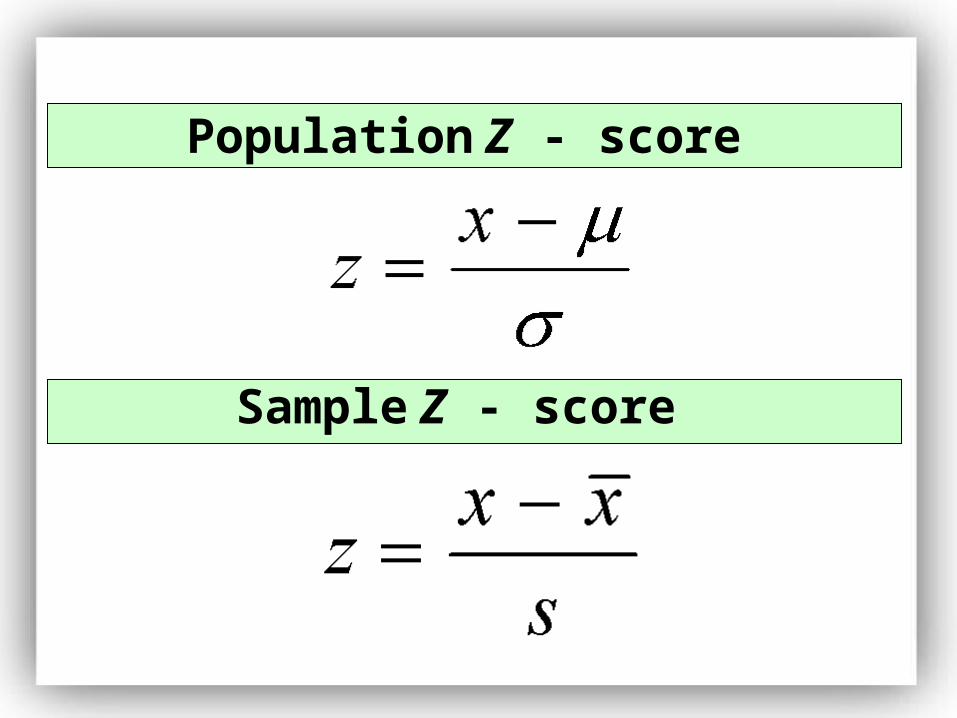
Population Z - score
Sample Z - score
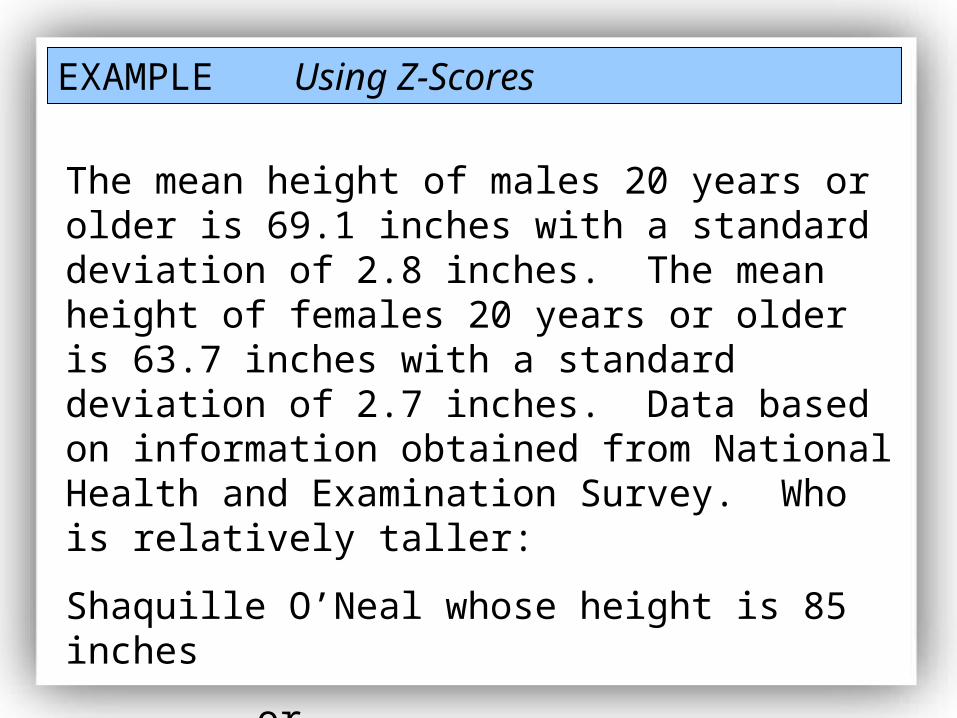
EXAMPLE Using Z-Scores
The mean height of males 20 years or older is 69.1 inches with a standard deviation of 2.8 inches. The mean height of females 20 years or older is 63.7 inches with a standard deviation of 2.7 inches. Data based on information obtained from National Health and Examination Survey. Who is relatively taller:
Shaquille O’Neal whose height is 85 inches
or
Lisa Leslie whose height is 77 inches.
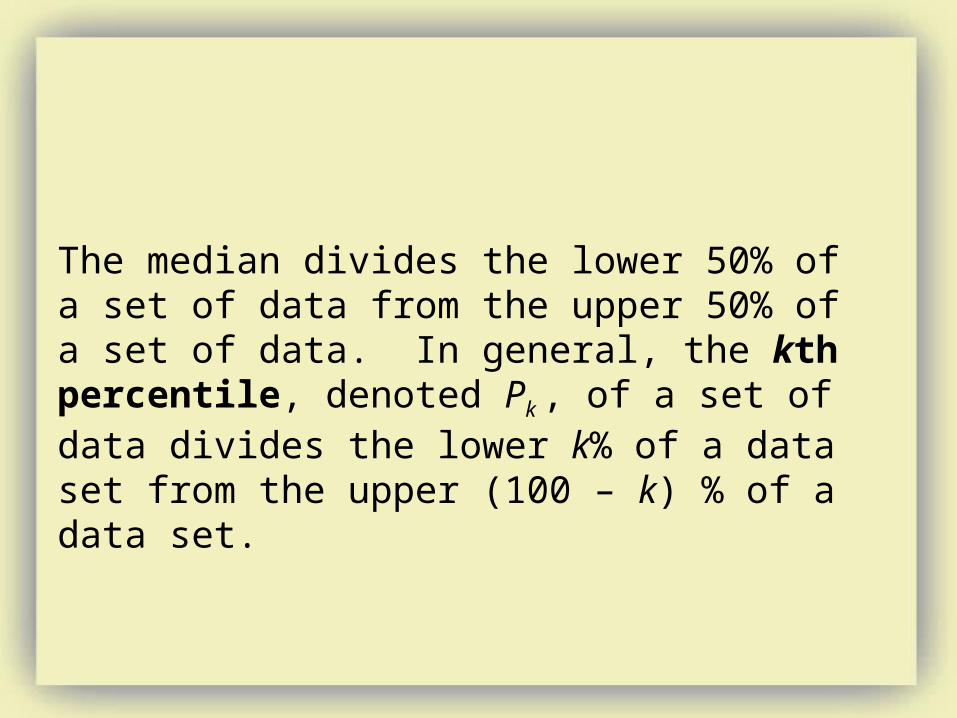
The median divides the lower 50% of a set of data from the upper 50% of a set of data. In general, the kth percentile, denoted Pk , of a set of data divides the lower k% of a data set from the upper (100 – k) % of a data set.
Computing the kth Percentile, Pk
Step 1: Arrange the data in ascending order.
Step 1: Arrange the data in ascending order.
Step 2: Compute an index i using the following formula:
where k is the percentile of the data value and n is the number of individuals in the data set.
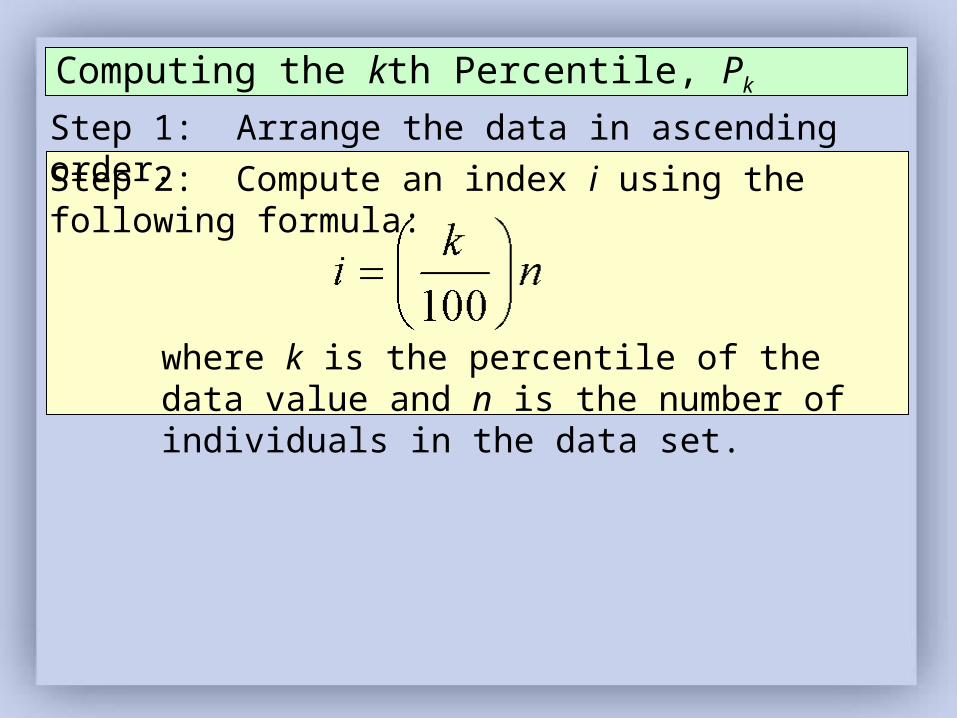
Computing the kth Percentile, Pk
Step 1: Arrange the data in ascending order.
Step 2: Compute an index i using the following formula:
where k is the percentile of the data value and n is the number of individuals in the data set.
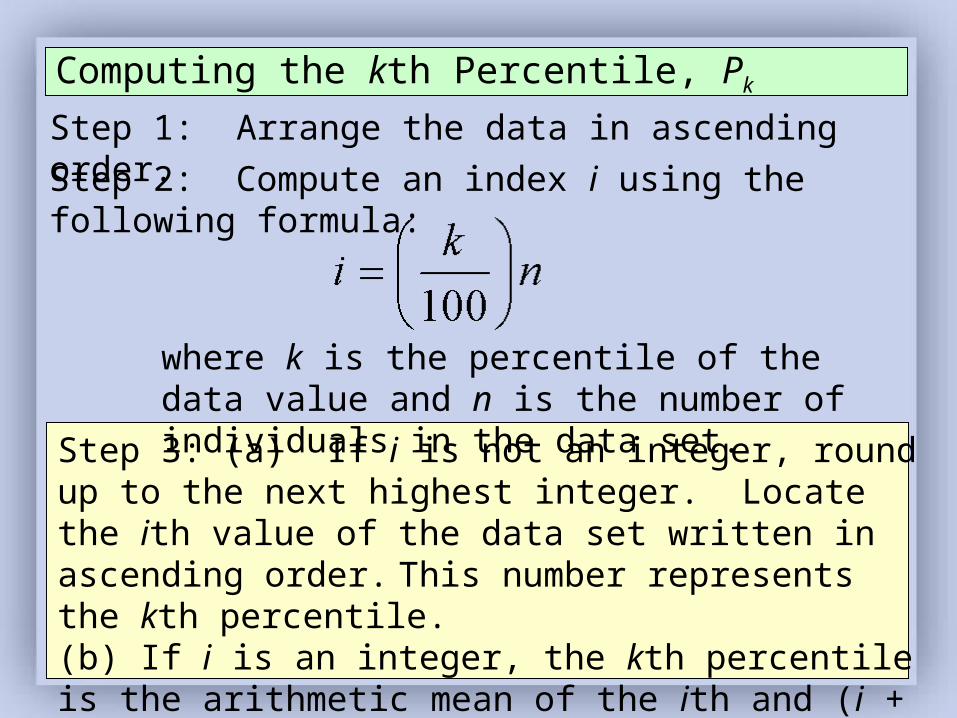
Step 3: (a) If i is not an integer, round up to the next highest integer. Locate the ith value of the data set written in ascending order. This number represents the kth percentile. (b) If i is an integer, the kth percentile is the arithmetic mean of the ith and (i + 1)st data value.
Computing the kth Percentile, Pk
EXAMPLE Finding a Percentile
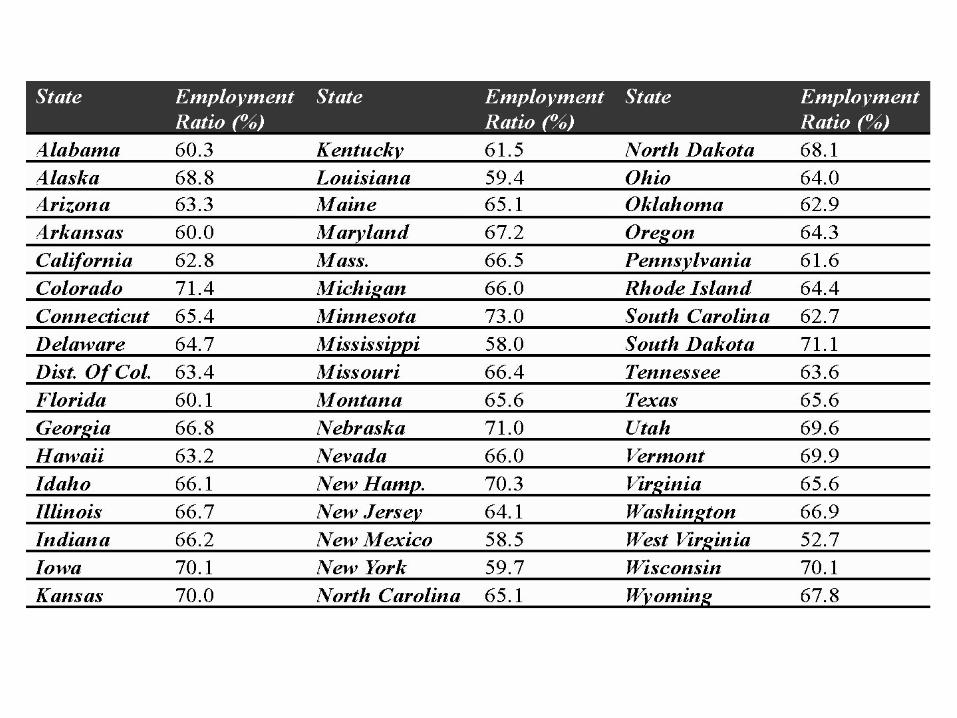
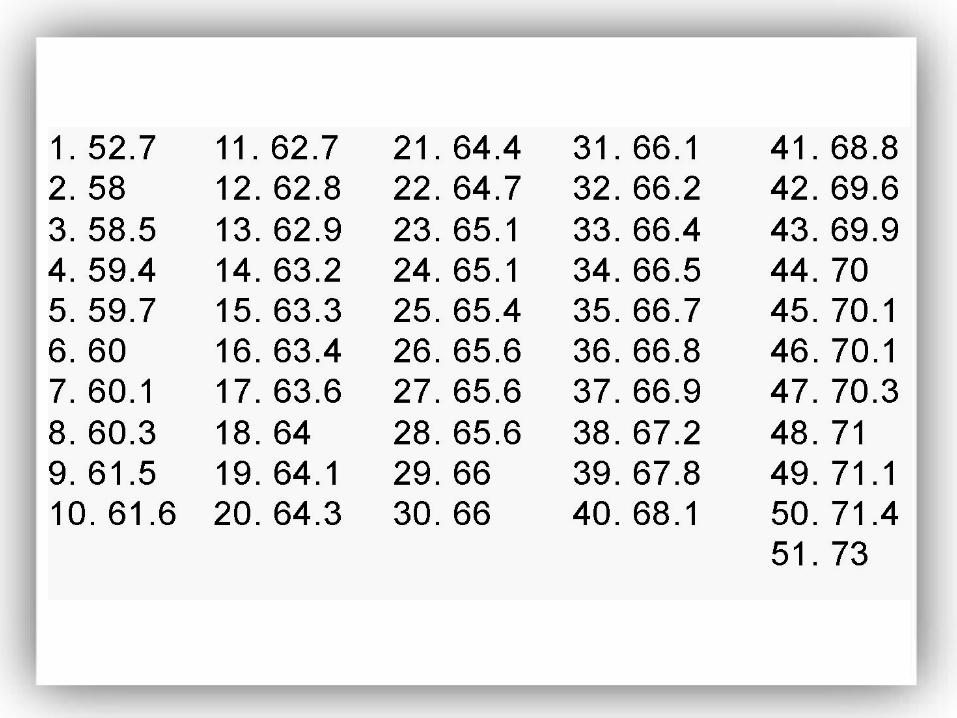
For the employment ratio data on the next slide, find the
(a) 60th percentile
(b) 33rd percentile
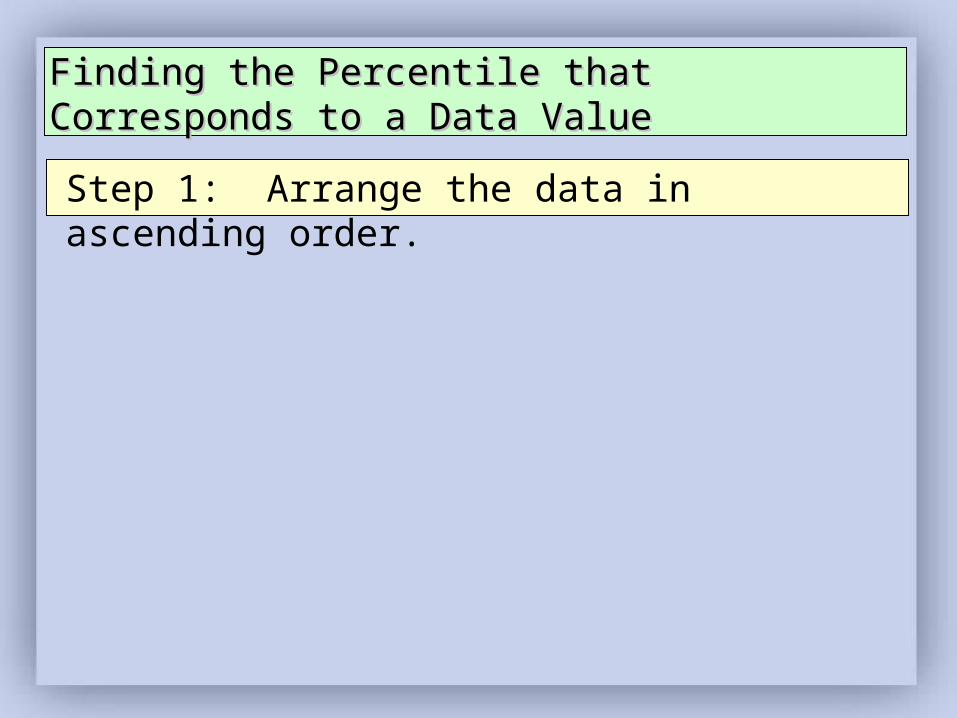
Finding the Percentile that Corresponds to a Data Finding the Percentile that Corresponds to a Data ValueValue
Step 1: Arrange the data in ascending order.
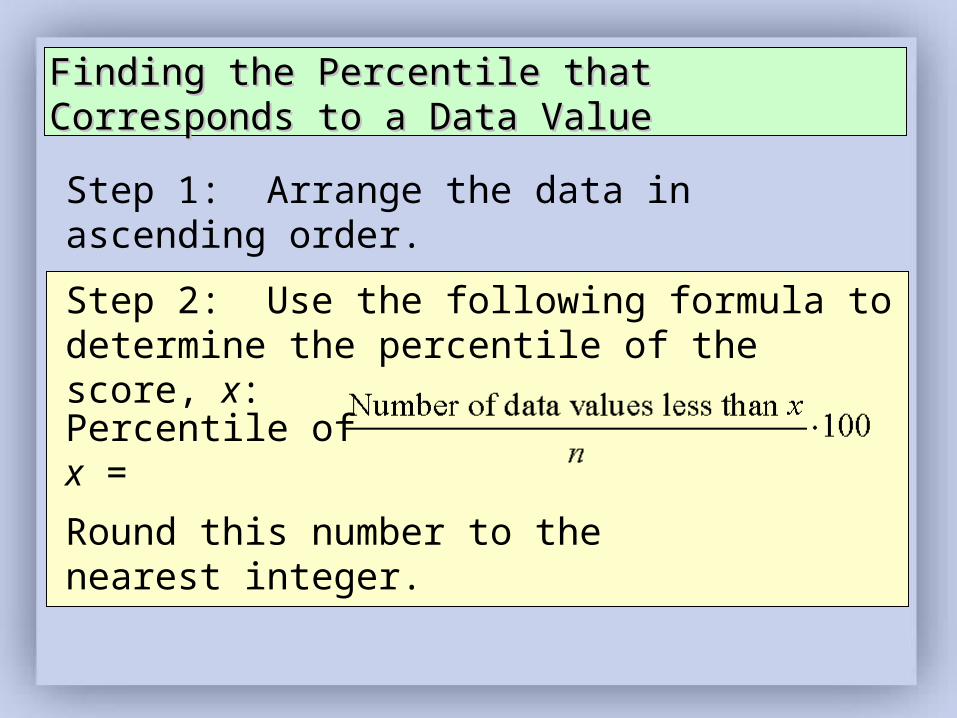
Step 2: Use the following formula to determine the percentile of the score, x:
Percentile of x =
Round this number to the nearest integer.
Finding the Percentile that Corresponds to a Data Finding the Percentile that Corresponds to a Data ValueValue
Step 1: Arrange the data in ascending order.
EXAMPLE Finding the Percentile Rank of a Data Value
Find the percentile rank of the employment ratio of Michigan.
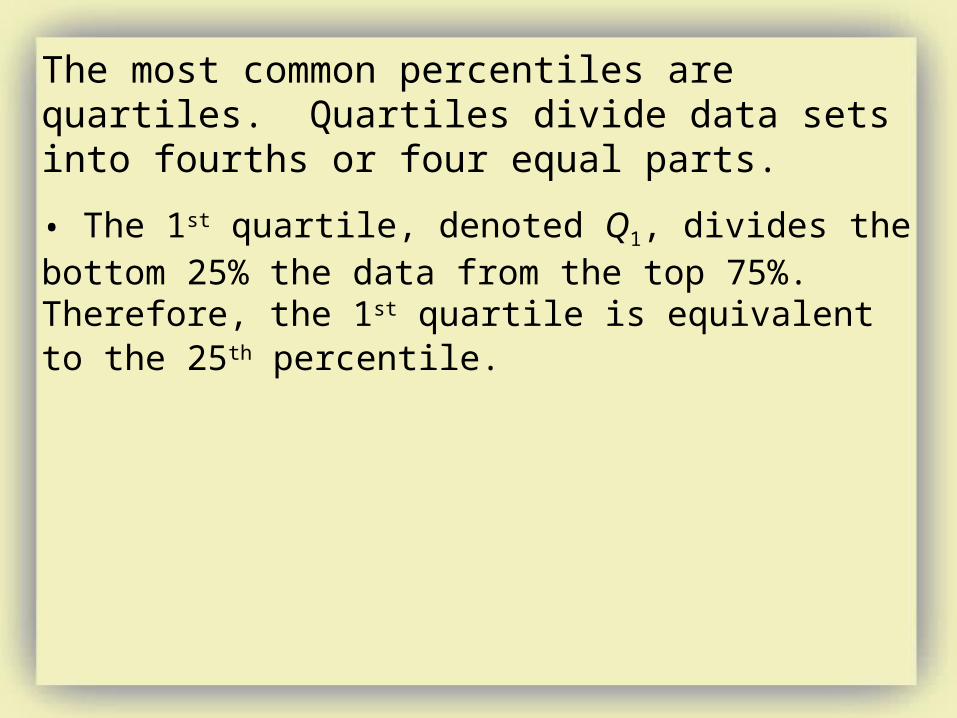
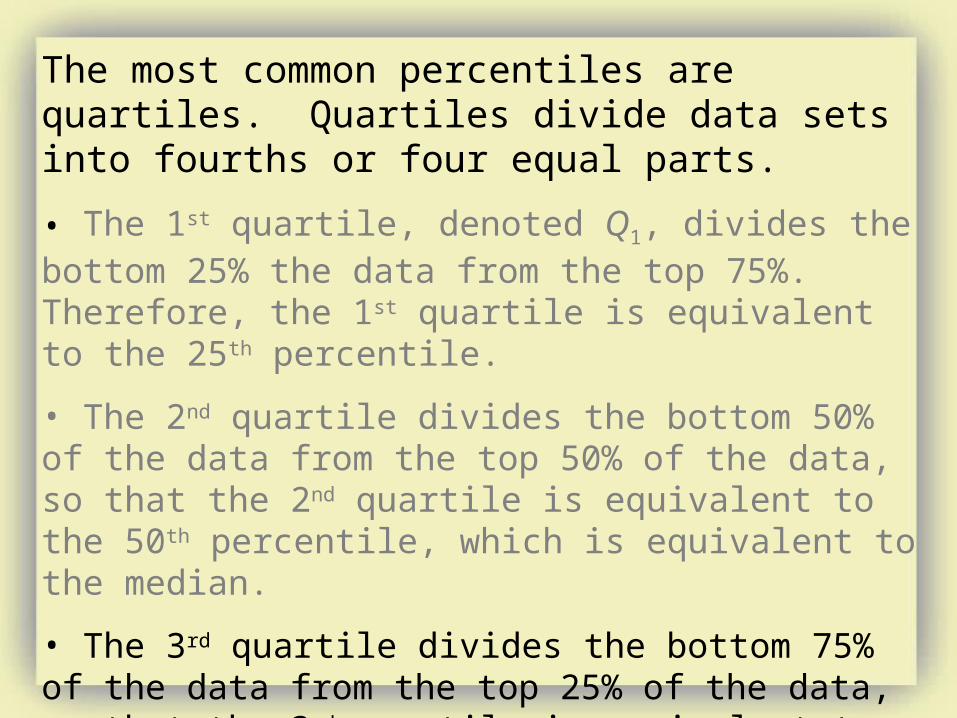
The most common percentiles are quartiles. Quartiles divide data sets into fourths or four equal parts.
• The 1st quartile, denoted Q1, divides the bottom 25% the data from the top 75%. Therefore, the 1st quartile is equivalent to the 25th percentile.
The most common percentiles are quartiles. Quartiles divide data sets into fourths or four equal parts.
• The 1st quartile, denoted Q1, divides the bottom 25% the data from the top 75%. Therefore, the 1st quartile is equivalent to the 25th percentile.
• The 2nd quartile divides the bottom 50% of the data from the top 50% of the data, so that the 2nd quartile is equivalent to the 50th percentile, which is equivalent to the median.
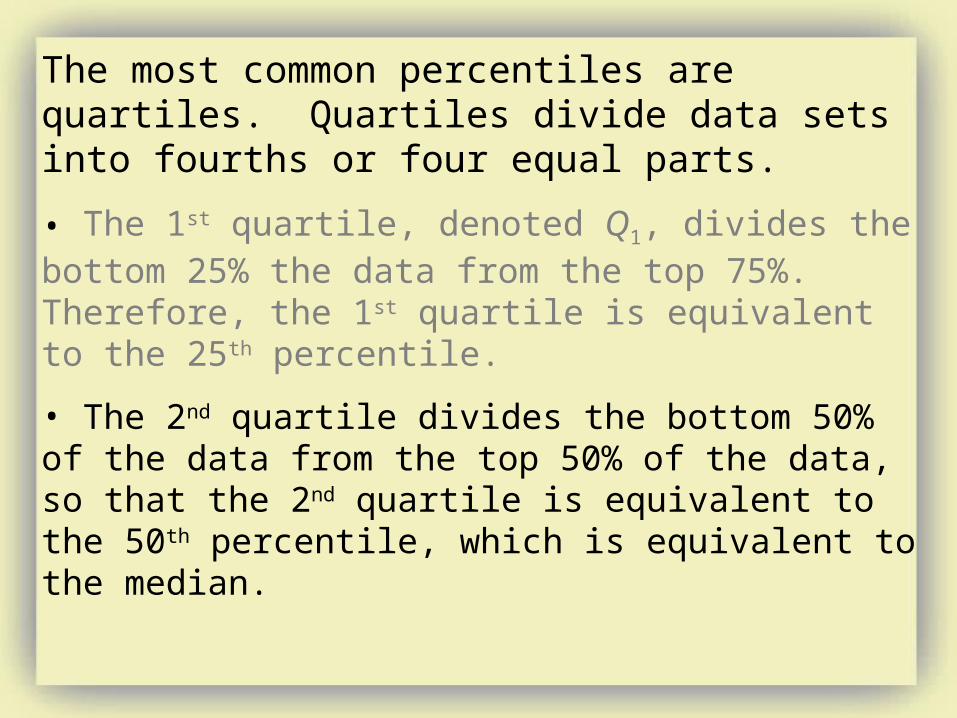
• The 3rd quartile divides the bottom 75% of the data from the top 25% of the data, so that the 3rd quartile is equivalent to the 75th percentile.

EXAMPLE Finding the Quartiles
Find the quartiles corresponding to the employment ratio data.
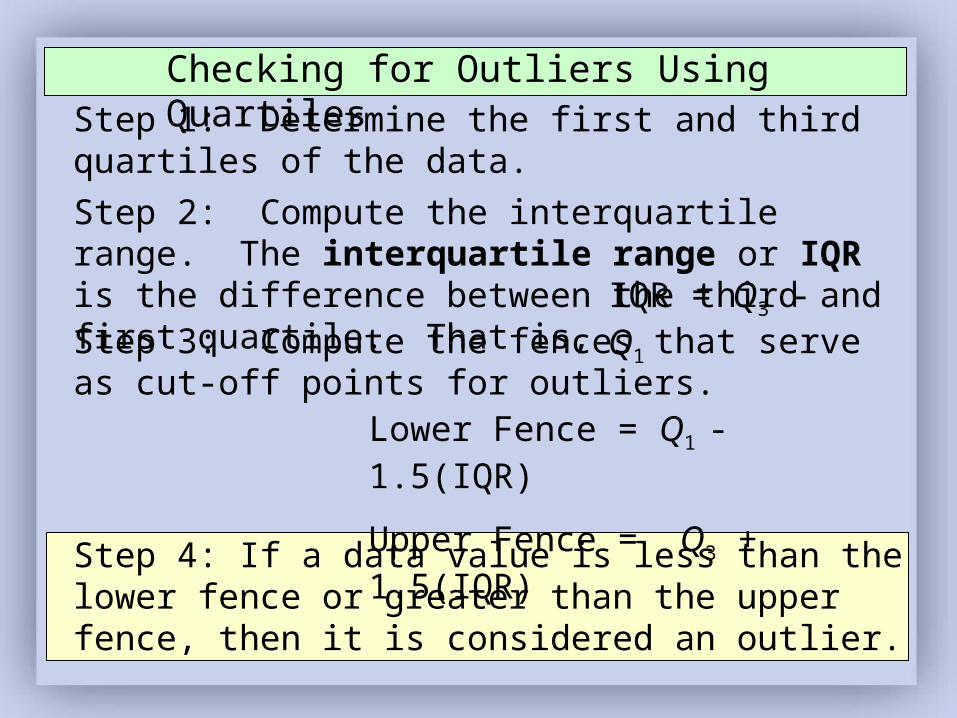
Checking for Outliers Using QuartilesStep 1: Determine the first and third quartiles of the data.
Step 1: Determine the first and third quartiles of the data.
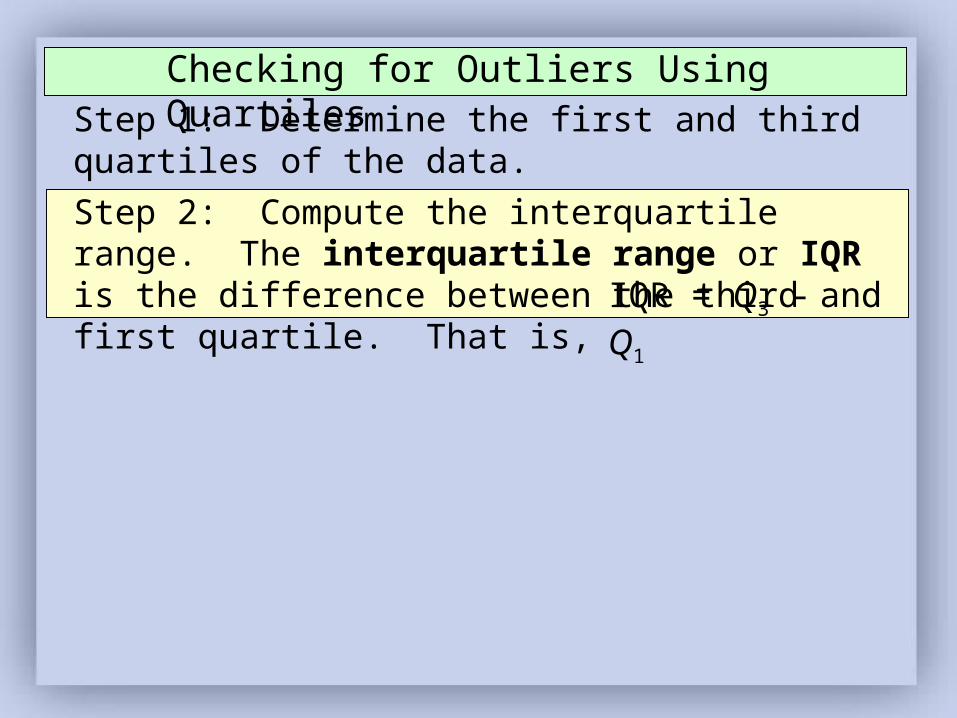
Step 2: Compute the interquartile range. The interquartile range or IQR is the difference between the third and first quartile. That is, IQR = Q3 - Q1
Checking for Outliers Using Quartiles
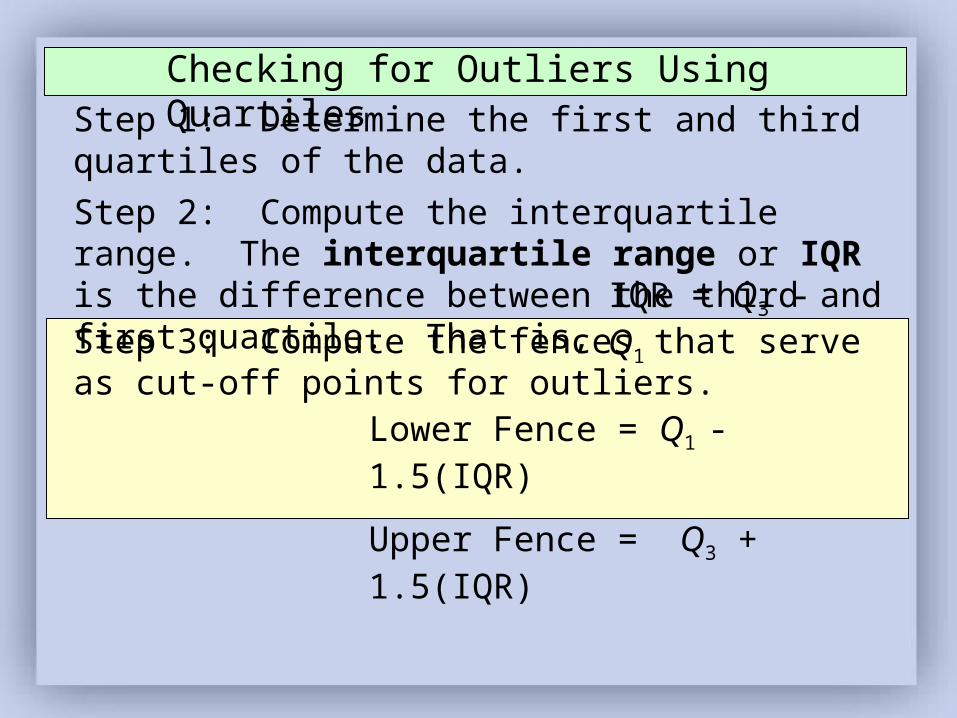
Step 3: Compute the fences that serve as cut-off points for outliers.
Lower Fence = Q1 - 1.5(IQR)
Upper Fence = Q3 + 1.5(IQR)
Step 1: Determine the first and third quartiles of the data.
Step 2: Compute the interquartile range. The interquartile range or IQR is the difference between the third and first quartile. That is, IQR = Q3 - Q1
Checking for Outliers Using Quartiles
Step 3: Compute the fences that serve as cut-off points for outliers.
Lower Fence = Q1 - 1.5(IQR)
Upper Fence = Q3 + 1.5(IQR)
Step 4: If a data value is less than the lower fence or greater than the upper fence, then it is considered an outlier.
Step 1: Determine the first and third quartiles of the data.
Step 2: Compute the interquartile range. The interquartile range or IQR is the difference between the third and first quartile. That is,
Checking for Outliers Using Quartiles
IQR = Q3 - Q1
EXAMPLE Checking for Outliers
Check the employment ratio data for outliers.
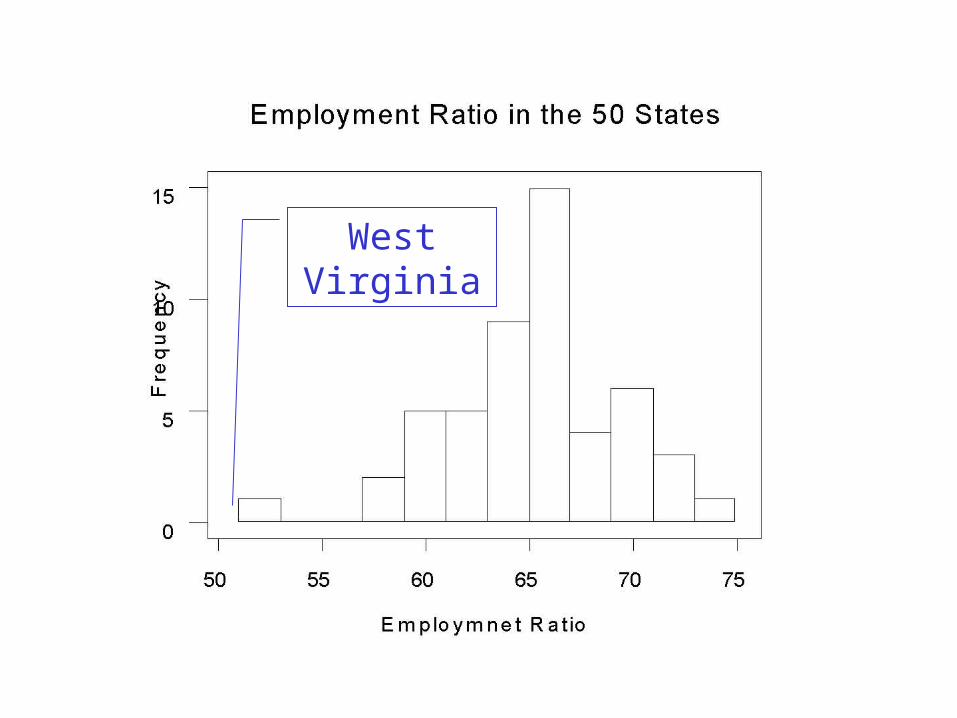
West Virginia