Embed Size (px)
Citation preview
2016 South Florida Environmental Report Chapter 3A
3A-1
Chapter 3A: Water Quality in the Everglades Protection Area
Paul Julian II1, Grover G. Payne2 and Shi Kui Xue3
SUMMARY This chapter is intended to (1) provide an assessment of water quality within the Everglades
Protection Area (EPA) during Water Year 2015 (WY2015) (May 1, 2014–April 30, 2015), (2) fulfill numerous reporting requirements of the Everglades Forever Act (EFA), (3) provide a preliminary assessment of total phosphorus (TP) criterion achievement, and (4) provide an annual update of the comprehensive overview of nitrogen and phosphorus concentrations and loads throughout the EPA. The information provided in this chapter is an update to Chapter 3A of the 2015 South Florida Environmental Report (SFER) – Volume I.
WATER QUALITY CRITERIA EXCURSION ANALYSIS The analyses and summaries presented provide a synoptic view of water quality conditions in
the EPA on a regional scale, including the Arthur R. Marshall Loxahatchee National Wildlife Refuge [LNWR, also known as Water Conservation Area (WCA-) 1], WCA-2, WCA-3, and Everglades National Park (ENP). For parameters with water quality criteria, regional analyses were conducted based on the frequency of exceedances of the applicable criteria, similar to the methods employed in the 1999 Everglades Interim Report, 2000–2004 Everglades Consolidated Reports, and 2005–2015 SFERs. For WY2015, water quality parameters that did not meet existing standards were classified based on excursion frequencies that were statistically tested using the binomial hypothesis test. These categories are (1) concern – any parameter with a criterion exceedance frequency statistically greater than 10 percent, (2) potential concern – any parameter with an exceedance frequency statistically greater than 5 percent but less than 10 percent, and (3) minimal concern – any parameter with an exceedance frequency less than 5 percent but greater than zero.
Similar to the last several years with a few exceptions, water quality was in compliance with existing state water quality criteria during WY2015. During WY2015, excursions of applicable Class III water quality criteria were observed for four parameters: dissolved oxygen (DO), alkalinity, pH, and specific conductance. Similar to previous periods, these excursions were localized to specific areas of the EPA, and all these parameters exhibited excursions in previous water years.
1Florida Department of Environmental Protection, Office of Ecosystems Projects, Fort Myers, FL 2Florida Department of Environmental Protection, Division of Environmental Assessment and Restoration,
Environmental Assessment and Standards Section, Tallahassee, FL 3The authors acknowledge Jeremy McBryan, Lawrence Gerry, Garth Redfield, Cheol Mo, Nenad Iricanin,
Richard Pfeuffer, John Madden, and Julianne LaRock (SFWMD), and Frank Powell and Edward Smith (FDEP) for providing valuable comments and suggestions to this document.
Chapter 3A Volume I: The South Florida Environment
3A-2
For WY2015, a summary of the DO, alkalinity, pH, specific conductance, and un-ionized ammonia excursions, as well as the status of pesticides, phosphorus, and nitrogen within the EPA, is presented below:
• Due to excursions of the site-specific alternative criterion, DO was classified as a potential concern for the interior portion of LNWR, WCA-2, WCA-3, and ENP. Inflow, outflow, and Rim Canal monitoring locations were assessed using the current Class III water quality standard. Inflow portions of LNWR, WCA-3, and ENP as well outflow portions of WCA-2 and WCA-3 were classified as a concern, LNWR outflow and WCA-2 inflow were classified as a minimal concern, and LNWR rim portion was classified as no concern.
• Alkalinity and pH criteria exceedances were observed in LNWR; however, the Florida Department of Environmental Protection (FDEP) considers the relatively low values to be representative of the range of natural conditions for this ecosystem. Therefore, they are not considered violations of state water quality standards. Exceedances of the pH criterion resulted in areas and regions being classified as a minimal concern, including WCA-2 and WCA-3 inflow regions.
• Specific conductance was categorized as a minimal concern for LNWR inflow and rim regions as well as WCA-2 inflow region.
• Unionized ammonia was categorized as a minimal concern for WCA-2 inflow region. • No exceedances of iron or turbidity were observed in the EPA. • No pesticides or pesticide breakdown products exceeded their respective toxicity
guideline concentrations, and no parameters exceeded state water quality standards. However, several pesticides or pesticide breakdown products were detected at levels above their method detection limit (MDL), including 2,4,5-T (trichlorophenoxyacetic acid), 2,4-D (dichlorophenoxyacetic acid), ametryn, atrazine, atrazine desethyl, diuron, imidacloprid, metolachlor, metribuzin, norflurazon, and silvex.
• TP concentrations were highest in WCA-3 inflows and lowest within ENP. Annual geometric mean inflow TP concentrations ranged from 9.0 micrograms per liter (µg/L) for ENP to 22.5 µg/L for WCA-3. Annual geometric mean TP concentrations at interior regions ranged from 4.1 µg/L in ENP to 9.0 µg/L in LNWR. Annual geometric mean TP concentrations for individual interior marsh monitoring stations ranged from less than 2.0 µg/L in some unimpacted portions of the marsh to 107.0 µg/L at sites that are highly influenced by canal inputs. Of the interior marsh sites, 72.9 percent exhibited annual geometric mean TP concentrations of 10.0 µg/L or less, with 84.8 percent of the marsh sites having annual geometric mean TP concentrations of 15.0 µg/L or less throughout the larger ambient monitoring network.
• Annual geometric mean inflow orthophosphate (OP) concentrations ranged from less than 2.0 µg/L for ENP to 2.0 µg/L for WCA-3. The annual geometric mean interior OP concentrations for all regions of the EPA were less than 2.0 µg/L.
• Similar to previous years’ reporting, the five-year (WY2011–WY2015) TP criterion assessment results indicate that unimpacted portions of each WCA passed all four parts of the compliance test. In contrast, impacted portions of each water body failed one or more parts of the test. The impacted portions of the WCAs routinely exceeded the annual and five-year network TP concentration limits of 11 µg/L and 10 µg/L, respectively.
• TP loads from surface sources, including internal transfers within the EPA, totaled approximately 65.2 metric tons, with a flow-weighted mean concentration (FWM) of 17 µg/L. Another 296 metric tons of TP are estimated to have entered the EPA through
2016 South Florida Environmental Report Chapter 3A
3A-3
atmospheric deposition. The 65.2 metric tons TP load in the surface inflows to the EPA represents a decrease of approximately 25 percent compared to the previous year (87.1 metric tons in WY2014).
• Annual geometric mean inflow total nitrogen (TN) concentrations ranged from 1.01 milligram per liter (mg/L) for ENP to 1.75 mg/L for LNWR. The annual geometric mean TN concentration at interior marsh regions ranged from 1.02 mg/L for ENP to 1.55 mg/L for WCA-2.
• TN loads from surface sources, including internal transfers within the EPA totaled approximately 6,458 metric tons, with a FWM concentration of 1.77 mg/L. Another 4,664 metric tons of TN are estimated to have entered the EPA through atmospheric deposition. The 6,458 metric tons TN load in the surface inflows to the EPA represent a decrease of approximately 20 percent compared to the previous year (6,458 metric tons in WY2014).
PURPOSE The primary purpose of this chapter is to provide an assessment of water quality within the
EPA during WY2015 and an update to the information provided in Chapter 3A of the 2014 SFER – Volume I. The chapter is intended to fulfill the EFA requirement for an annual report to “identify water quality parameters, in addition to phosphorus, which exceed state water quality standards or are causing or contributing to adverse impacts in the Everglades Protection Area.” In addition, this chapter provides an annual update of the comprehensive overview of nitrogen and phosphorus concentrations and loads throughout the EPA, along with an assessment of TP criterion achievement utilizing the protocol provided in the 2007 SFER – Volume I, Chapter 3C (Payne et al. 2007).
More specifically, this chapter and its associated appendices use water quality data collected during WY2015 to achieve the following objectives:
1. Summarize areas and times where water quality criteria are not being met and indicate trends in excursions over space and time.
2. Discuss factors contributing to excursions from water quality criteria and provide an evaluation of natural background conditions where existing standards may not be appropriate.
3. Present an updated review of pesticide and priority pollutant data made available during WY2015.
4. Present a preliminary TP criterion achievement assessment for different areas within the EPA for the most recent five-year period (WY2011–WY2015).
5. Summarize phosphorus and nitrogen concentrations measured in surface waters within different portions of the EPA.
6. Summarize the flow and phosphorus loads entering different portions of the EPA and describe spatial and temporal trends observed.
7. Describe and discuss factors contributing to any spatial and temporal trends observed.
Chapter 3A Volume I: The South Florida Environment
3A-4
METHODS A regional synoptic approach similar to that used for water quality evaluations in previous
SFERs was applied to phosphorus and nitrogen data for WY2015 to provide an overview of water quality status within the EPA. Consolidating regional water quality data provides the ability to analyze data over time but limits spatial analyses within each region. However, spatial analyses can be made between regions because the majority of inflow and pollutants enter the northern third of the EPA, and the net water flow is from north to south.
AREA OF INTEREST The EPA is a complex system of marsh areas, canals, and levees with inflow and outflow water
control structures that covers almost 2.5 million acres (1 acre = 0.405 hectare) of former Everglades marsh and currently is divided into large separate distinct shallow impoundments (Bancroft et al. 1992). In addition to rainfall inputs, surface water inflows regulated by water control structures from agricultural tributaries, such as the Everglades Agricultural Area (EAA) to the north and the C-139 basin to the west, feed the EPA. The EPA also receives surface water inflows originating from Lake Okeechobee to the north and from predominantly urbanized areas to the east. The timing and distribution of the surface inflows from the tributaries to the EPA are based on a complex set of operational decisions that account for natural and environmental system requirements, water supply for urbanized and natural areas, aquifer recharge, and flood control. The major features of the EPA and surrounding area are illustrated in Figure 1-1 of this volume.
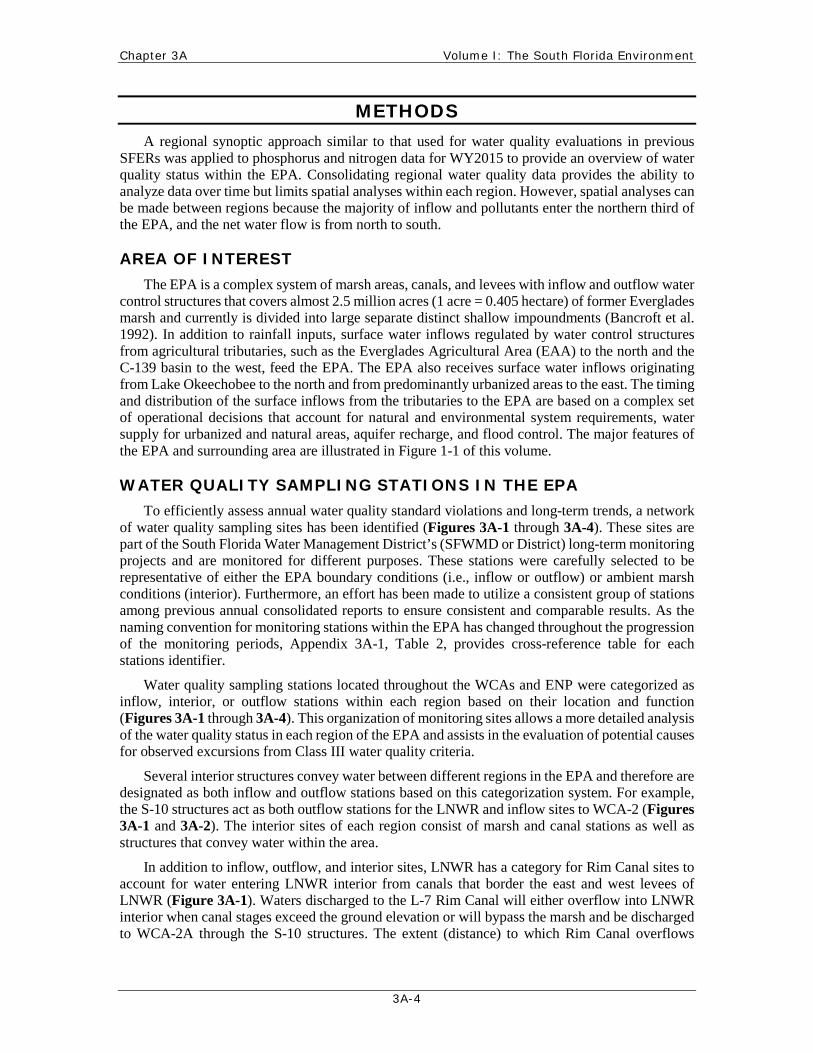
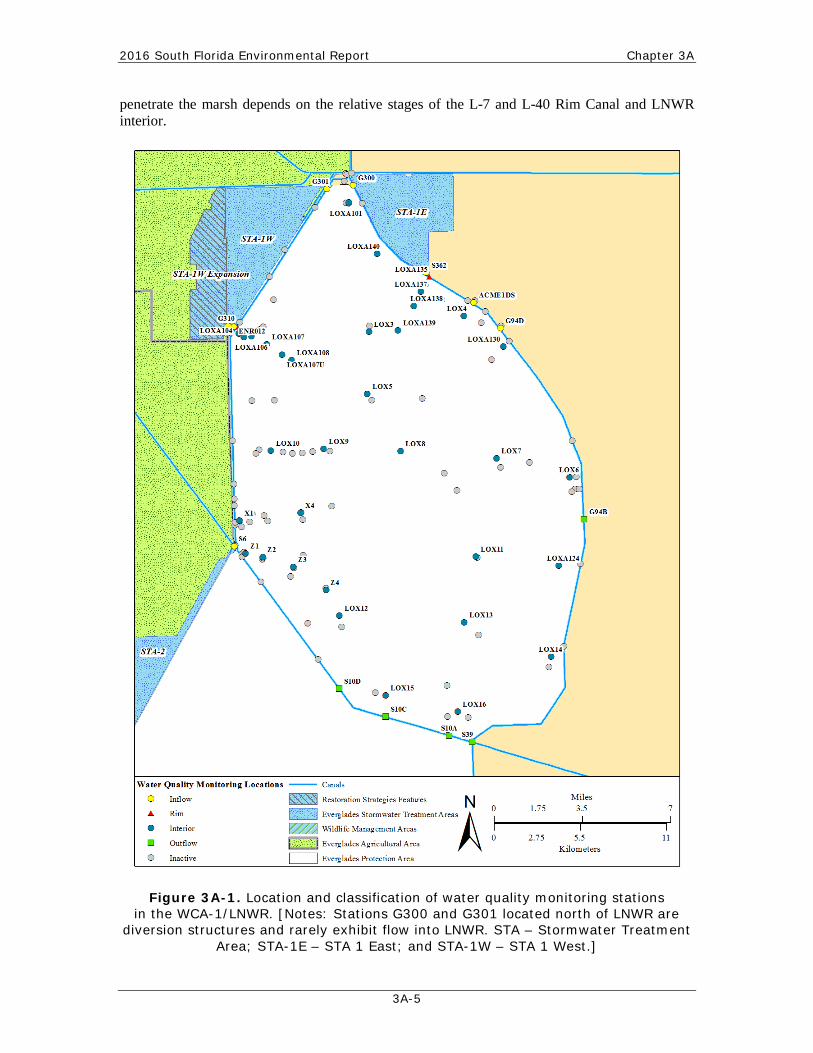
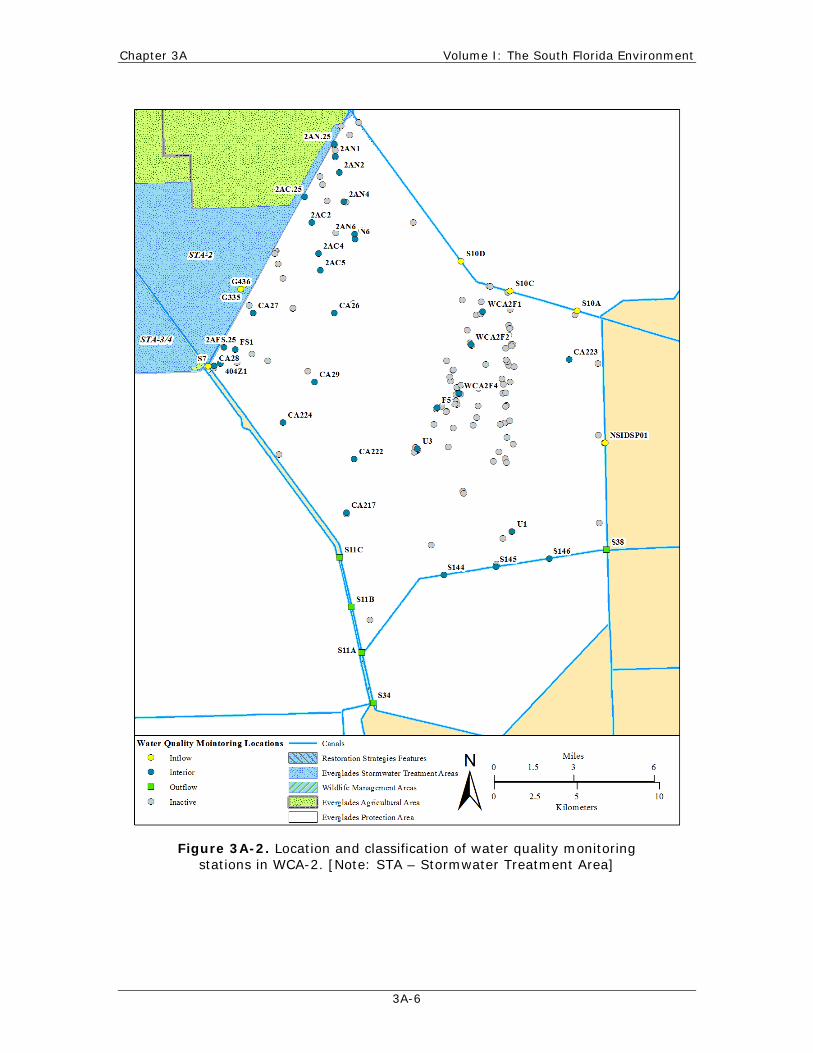
WATER QUALITY SAMPLING STATIONS IN THE EPA To efficiently assess annual water quality standard violations and long-term trends, a network
of water quality sampling sites has been identified (Figures 3A-1 through 3A-4). These sites are part of the South Florida Water Management District’s (SFWMD or District) long-term monitoring projects and are monitored for different purposes. These stations were carefully selected to be representative of either the EPA boundary conditions (i.e., inflow or outflow) or ambient marsh conditions (interior). Furthermore, an effort has been made to utilize a consistent group of stations among previous annual consolidated reports to ensure consistent and comparable results. As the naming convention for monitoring stations within the EPA has changed throughout the progression of the monitoring periods, Appendix 3A-1, Table 2, provides cross-reference table for each stations identifier.
Water quality sampling stations located throughout the WCAs and ENP were categorized as inflow, interior, or outflow stations within each region based on their location and function (Figures 3A-1 through 3A-4). This organization of monitoring sites allows a more detailed analysis of the water quality status in each region of the EPA and assists in the evaluation of potential causes for observed excursions from Class III water quality criteria.
Several interior structures convey water between different regions in the EPA and therefore are designated as both inflow and outflow stations based on this categorization system. For example, the S-10 structures act as both outflow stations for the LNWR and inflow sites to WCA-2 (Figures 3A-1 and 3A-2). The interior sites of each region consist of marsh and canal stations as well as structures that convey water within the area.
In addition to inflow, outflow, and interior sites, LNWR has a category for Rim Canal sites to account for water entering LNWR interior from canals that border the east and west levees of LNWR (Figure 3A-1). Waters discharged to the L-7 Rim Canal will either overflow into LNWR interior when canal stages exceed the ground elevation or will bypass the marsh and be discharged to WCA-2A through the S-10 structures. The extent (distance) to which Rim Canal overflows
2016 South Florida Environmental Report Chapter 3A
3A-5
penetrate the marsh depends on the relative stages of the L-7 and L-40 Rim Canal and LNWR interior.
Figure 3A-1. Location and classification of water quality monitoring stations
in the WCA-1/LNWR. [Notes: Stations G300 and G301 located north of LNWR are diversion structures and rarely exhibit flow into LNWR. STA – Stormwater Treatment
Area; STA-1E – STA 1 East; and STA-1W – STA 1 West.]
Chapter 3A Volume I: The South Florida Environment
3A-6
Figure 3A-2. Location and classification of water quality monitoring
stations in WCA-2. [Note: STA – Stormwater Treatment Area]
2016 South Florida Environmental Report Chapter 3A
3A-7
Figure 3A-3. Location and classification of water quality monitoring
stations in WCA-3. [Note: STA – Stormwater Treatment Area; FEB – Flow Equalization Basin.]
Chapter 3A Volume I: The South Florida Environment
3A-8
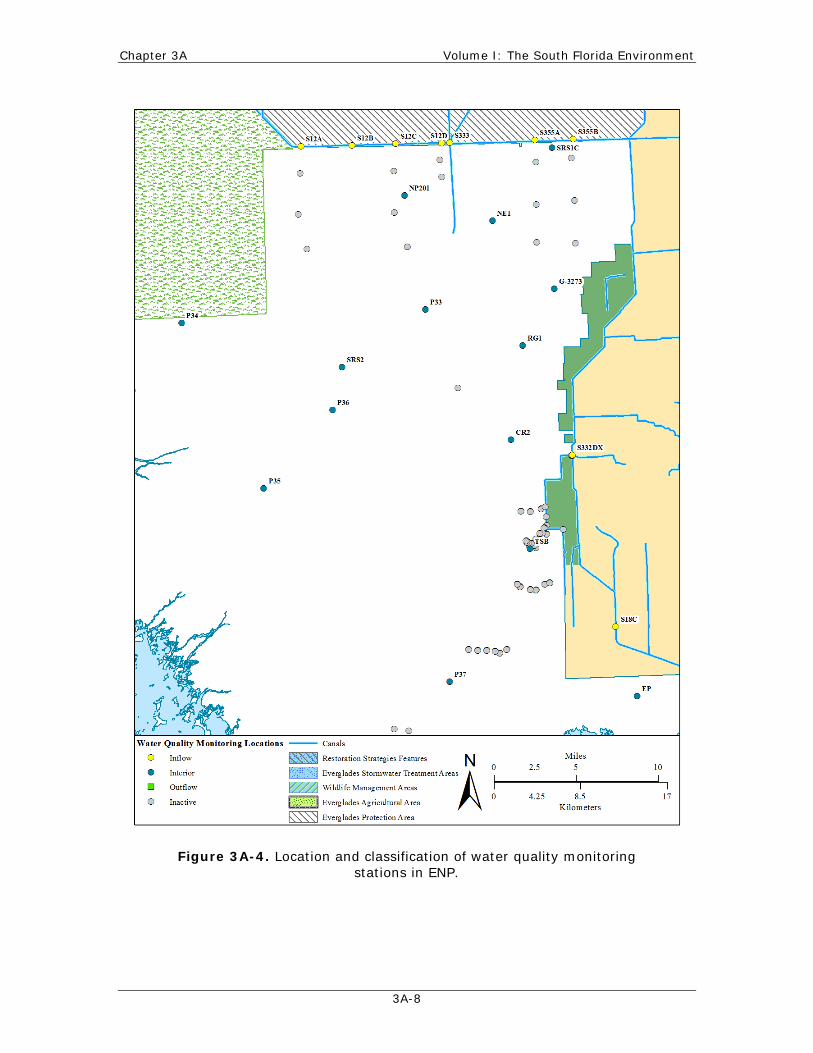
Figure 3A-4. Location and classification of water quality monitoring
stations in ENP.
2016 South Florida Environmental Report Chapter 3A
3A-9
Sampling frequency varies by site depending on site classification, parameter group, and hydrologic conditions (e.g., water depth and flow). Water control structures (inflows and outflows) were typically sampled biweekly when flowing; otherwise, sampling was performed monthly. Generally, interior monitoring stations were sampled monthly for most parameters reported in this chapter. Pesticide monitoring is conducted across the entire District at 15 sites on a biannual basis. An overview of the water quality monitoring projects, including project descriptions and objectives with limited site-specific information, is available on the District’s web site at www.sfwmd.gov/environmentalmonitoring.
ANALYSIS PERIODS As previously noted, the primary focus of this chapter is to summarize the status of water
quality within the EPA during WY2015 and describe trends or changes in water quality conditions over time. To accomplish this objective, comparisons are made across discrete periods that correspond to major restoration activities occurring within the EPA. The four periods are (1) the historical WY1979–WY1993 period (Baseline), which corresponds to the timeframe prior to implementation of the EAA Best Management Practices (BMPs) Program and the Everglades Construction Project (i.e., Everglades Nutrient Removal Project/Everglades Stormwater Treatment Areas, or STAs), (2) the intermediate WY1994–WY2004 period (Phase I), (3) the Phase II BMP/STA implementation period after WY2004 (i.e., WY2005–WY2014), and (4) the current water year, WY2015.
Phase I represents the period in which implementation of the EAA BMP Program was increasing, and all the initial Everglades STAs were constructed and became operational. The Phase II BMP/STA implementation period corresponds to when the performance of the BMPs and STAs were being optimized and enhanced. Additionally, during this period various restoration projects were being implemented under the Long-Term Plan for Achieving Water Quality Goals in the Everglades Protection Area (Miller 2003), Restoration Strategies Regional Water Quality Plan (SFWMD 2012), Comprehensive Everglades Restoration Plan (CERP) (USACE and SFWMD 1999), and other state or federal restoration projects. Because optimization, enhancement, and other restoration activities are expected to continue for years, the Phase II period will continue to expand in future SFERs to incorporate additional years of sampling. In addition, data for the current water year (WY2015) will be used to make comparisons with the historical periods and will be analyzed independently as the fourth period. Individual station assessments and certain mandated reporting (e.g., TP criterion achievement) were based on the previous five water years (WY2011–WY2015) rather than on the single year used for regional analysis. Reporting periods are specified in each section of this chapter.
WATER QUALITY DATA SOURCES The majority of the water quality data evaluated in this chapter were retrieved from the
District’s corporate environmental database, DBHYDRO (www.sfwmd.gov/dbhydro). Additionally, water quality data from the nutrient gradient sampling stations monitored by the District were obtained from the District’s Water Resources Division database.
DATA SCREENING AND HANDLING Water quality data were screened based on laboratory qualifier codes, consistent
with the FDEP Quality Assurance Rule [Chapter 62-160, Florida Administrative Code (F.A.C.)]. Any datum associated with a fatal qualifier (e.g. H, J, K, N, O, V, Q, Y, or ?) indicating a potential data quality problem was removed from the analysis (SFWMD 2015). Values that exceeded possible physical or chemical measurement constraints (e.g. if resulting pH is greater than 14) had temperatures well outside seasonal norms (e.g. 6 degrees Celsius in July) or represented data
Chapter 3A Volume I: The South Florida Environment
3A-10
transcription errors were excluded. Multiple samples collected at the same location on the same day were considered as one sample, with the arithmetic mean used to represent the sampling period.
Additional considerations in the handling of water quality data are the accuracy and sensitivity of the laboratory method used. For purposes of summary statistics presented in this chapter, data reported as less than the MDL were assigned a value of one-half the MDL unless otherwise noted. All data presented in this chapter, including historical results, were handled consistently with regard to screening and MDL replacement.
WATER QUALITY DATA PARAMETERS The District monitors 109 water quality parameters within the EPA (Payne and Xue 2012).
Given this chapter’s focus on water quality criteria, the evaluation was primarily limited to parameters with Class III criteria pursuant to the FDEP’s Surface Water Quality Standards Rule (Chapter 62-302, F.A.C.). The parameters evaluated in this chapter include 62 pesticides and the following water quality constituents:
• Alkalinity • Un-ionized ammonia • Total silver* • Dissolved Oxygen (in situ) • Sulfate • Total antimony* • Specific conductance (in situ) • Total Nitrogen • Total arsenic* • pH (in situ) • Total cadmium* • Total beryllium* • Total selenium* • Total iron • Total copper* • Total thallium* • Total lead* • Total Phosphorus • Total zinc* • Total nickel* • Ortho-Phosphorus • Turbidity
Parameters marked with an asterisk (*) were not measured in WY2015. However, these have been analyzed and reported in previous SFERs and, if measured in the future, will be analyzed and reported in future SFERs. Since WY2007 monitoring of metals entering the EPA have been eliminated due to the prevalence of metals beings observed below the established water quality standards identified in 62.302.530, F.A.C., and the lack of new sources.
WATER QUALITY CRITERIA EXCURSION ANALYSIS FDEP and the District have developed an excursion analysis protocol for use in the annual
SFER (Weaver and Payne 2005) to effectively provide a synoptic view of water quality criteria compliance on a regional scale [i.e., LNWR, WCA-2, WCA-3, and ENP]. The protocol was developed to balance consistency with previous versions of the report, other State of Florida ambient water quality evaluation methodologies [e.g., Impaired Waters 303(d) designations], and the United States Environmental Protection Agency (USEPA) exceedance frequency recommendations, as well as provide a concise summary for decision makers and the public. This methodology ensures results will be compatible with information from other sources provided to water managers.
A multi-tiered categorical system was used in this chapter to rank the severity of excursions from state water quality criteria (see Table 3A-2 later in this chapter). Categories were assigned based on sample excursion frequencies evaluated using a statistically valid assessment methodology (i.e., binomial hypothesis test) that accounted for uncertainty in monitoring data (Weaver and Payne 2005). Parameters without exceedances were categorized as no concern and are not discussed further in this chapter. Based on the results of the binomial test using a 90 percent confidence level, parameters with exceedance rates between 0 and 5 percent are classified as
2016 South Florida Environmental Report Chapter 3A
3A-11
minimal concern, those with exceedance rates between 5 and 10 percent are classified as potential concern, and those with exceedance rates greater than 10 percent are classified as concern.
Because exceedances of the pesticide criteria can result in more immediate and severe effects to aquatic organisms and human health, a 10 percent excursion frequency was not used in the assessment of pesticides as recommended by USEPA (USEPA 1997, 2002). Pesticides were evaluated under the assumption that the Class III criteria values represent instantaneous maximum concentrations for which any exceedance constitutes a non-attainment of designated use. Pesticides were categorized based on whether the parameter was detected at concentrations above the MDL (potential concern) or at concentrations exceeding Class III criteria or chronic toxicity values (concerns). Pesticides classified as concerns have a high likelihood of resulting in an impairment of the designated use of the water body. Classification of a pesticide as a potential concern signifies that the constituent is known to be present within the basin at concentrations reasonably known to be below levels that can result in adverse biologic effects but may result in a problem at some future date or in interaction with other compounds. The no concern category was used to designate pesticides that were not detected at sites within a given area.
The data sources as well as the data handling and evaluation methods employed in this chapter are identical to those used in previous SFERs. Greater detail concerning the methods used can be found in Weaver and Payne (2005) and Payne and Xue (2012).
PHOSPHORUS CRITERION ACHIEVEMENT ASSESSMENT An evaluation to determine achievement of the TP criterion was performed consistent with
assessment protocol presented by Payne et al. (2007), and the four-part test outlined below and specified in the FDEP’s Water Quality Standards for Phosphorus within the Everglades Protection Area (Chapter 62-302.540, F.A.C.). Achievement of the TP rule (i.e., 62-302.540 F.A.C.) is assessed for networks of impacted and unimpacted, spatially explicit monitoring locations in WCAs (i.e., WCA-1/LNWR, WCA-2, and WCA-3). Achievement of the phosphorus criterion is different for ENP than the established TP criterion for the EPA. As acknowledged by 62-302.530(4)(c), F.A.C., achievement of the TP criterion is assessed according to methods set forth in Appendix A of the Settlement Agreement (Case No. 88-1886-CIV-MORENO) until the Settlement Agreement is amended or terminated. Reports and supporting information related to TP assessments consistent with Appendix A of the Settlement Agreement can be found at http://www.sfwmd.gov/toc.
Achievement of the TP criterion is assessed by a four-part test for each WCA using two networks of stations: impacted and unimpacted. The parts of the achievement test are as follows:
1. The five-year geometric mean averaged across all stations is less than or equal to 10 µg/L.
2. The annual geometric mean averaged across all stations is less than or equal to 10 µg/L for three of five water years.
3. The annual geometric mean averaged across all stations is less than or equal to 11 µg/L.
4. The annual geometric mean at all individual stations is less than or equal to 15 µg/L.
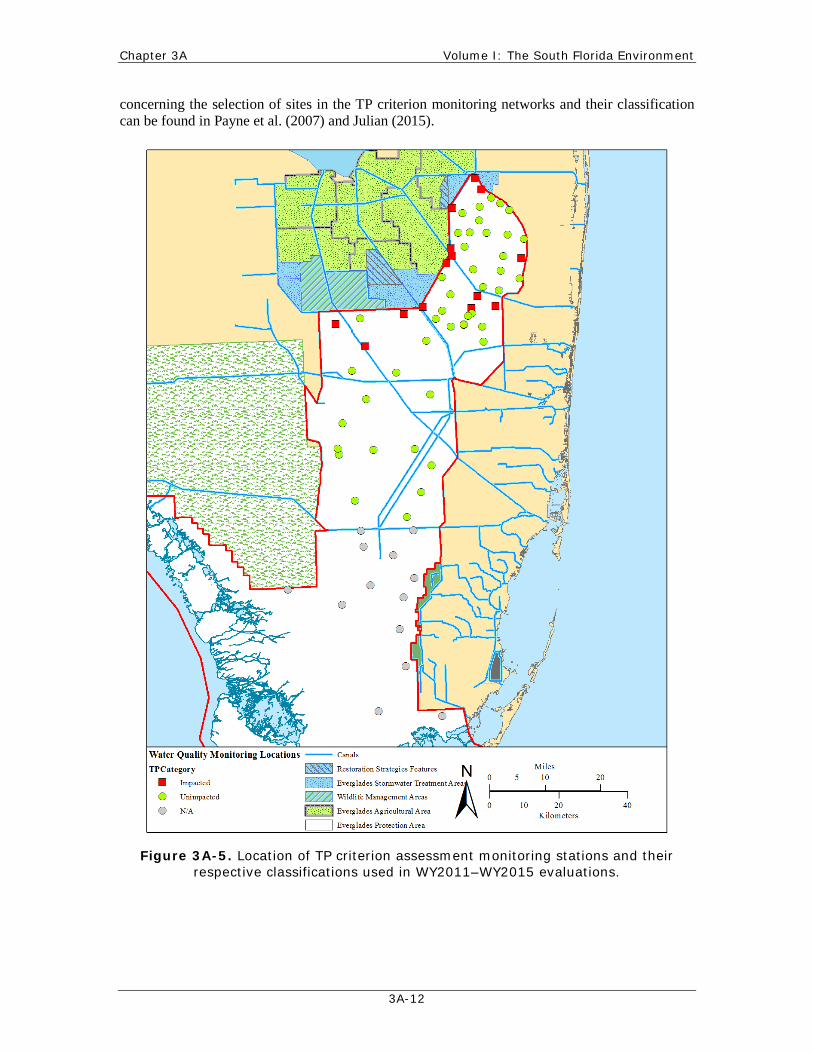
Data from the 58 sites TP criterion monitoring network for the most recent five-year period (i.e., WY2011–WY2015) were utilized in the evaluation. The location of the TP criterion network monitoring sites established pursuant to the TP criterion rule used for the TP criterion assessment along with their classification as “impacted” or “unimpacted” are provided in Figure 3A-5. Details
Chapter 3A Volume I: The South Florida Environment
3A-12
concerning the selection of sites in the TP criterion monitoring networks and their classification can be found in Payne et al. (2007) and Julian (2015).
Figure 3A-5. Location of TP criterion assessment monitoring stations and their respective classifications used in WY2011–WY2015 evaluations.
2016 South Florida Environmental Report Chapter 3A
3A-13
Data collection from the complete TP criterion monitoring network was initiated in January 2007. Due to the relatively recent inception of network monitoring, not all sites have data available for the full five-year assessment period. In addition, data availability is further limited for certain portions of the EPA due to extremely dry conditions that have prevailed during a number of years since WY2007. Because the results of the TP criterion compliance assessment presented in this chapter could be affected by these data limitations, this evaluation should be considered preliminary and the results cautiously interpreted. It is expected that future assessments will improve as additional data sets are added. Data were screened according to the quality assurance/quality control procedures described in the FDEP protocol available at http://www.dep.state.fl.us/everglades/files/criterion_ScreeningProtocol.pdf or http://www.dep.state.fl.us/water/wqssp/docs/swqdocs/data-quality-screening-protocol.pdf
STATISTICAL ANALYSIS Unless otherwise noted all inflow and outflow summary statistics (geometric mean, minimum,
maximum, etc.) were performed using data collected on flow events only. All valid data (i.e., non-qualified data) were used to compute summary statistics for all other regions (i.e., interior and rim). Trend analysis was performed on annual geometric mean TP and TN concentrations for inflow and interior regions of the EPA using the Kendall’s τ correlation analysis (Base stats R package) and Sen’s slope estimate (zyp R package). Trend analysis was performed on annual geometric mean TP for each monitoring station, with greater than three years of data using Kendall’s τ correlation analysis and Sen’s slope estimate. All statistical operations were performed with R© (Version 3.1.2, R Foundation for Statistical Computing, Vienna Austria). The critical level of significance was set at α = 0.05.
WATER YEAR 2015 WATER QUALITY RESULTS In WY2015, an average of 265 sampling days occurred throughout the EPA. WCA-3 had the
greatest number of sampling days, with 364 sampling days; 363 sampling days within ENP; 172 sampling days within LNWR; and 160 sampling days occurred within WCA-2. Very few samples collected during WY2015 resulted in qualified data; 1.7 percent (808 qualified samples from a total of 46,352 samples collected) of the data collected was removed due to fatal qualifiers. The dominant fatal qualifier was the J qualifier (estimated value).
WATER QUALITY CRITERIA EXCURSION ANALYSIS Summarized by region and classification, WY2015 data is included in Appendix 3A-1 of this
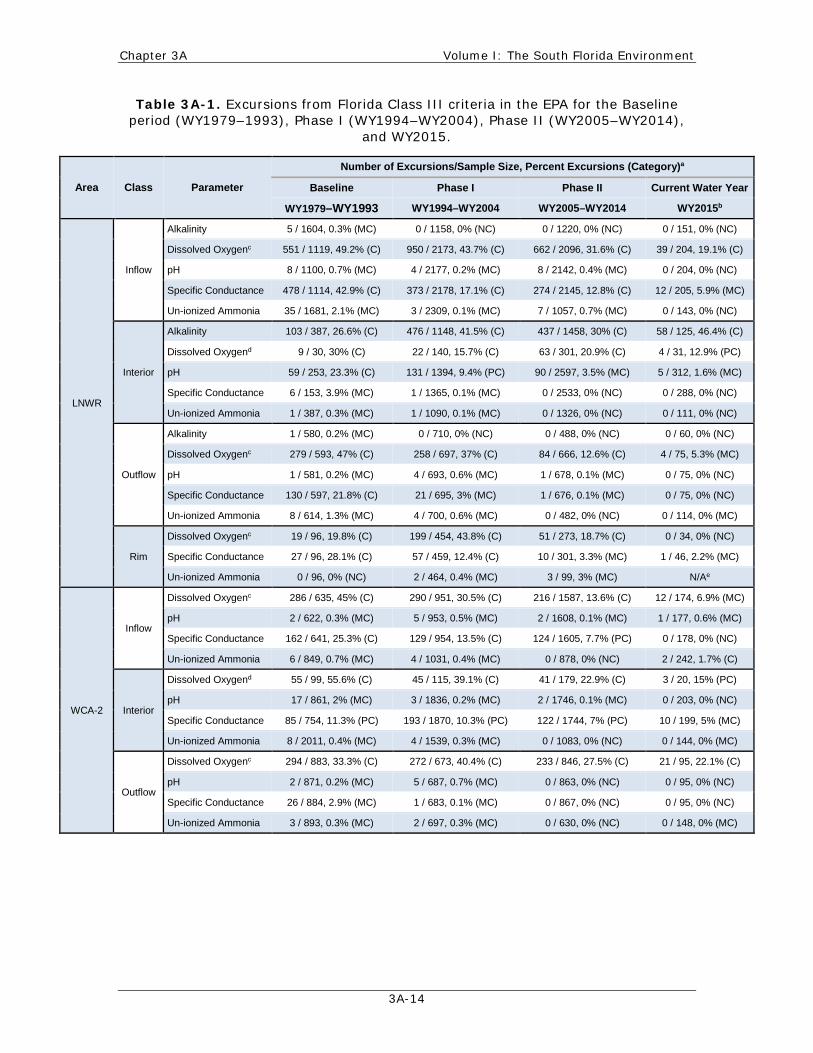
volume. Additionally, data for the last five water years (WY2011–WY2015) summarized by region, class, and monitoring station is presented in Appendix 3A-2. Comparisons of WY2015 water quality data with applicable Florida Class III water quality criteria resulted in excursions for four water quality parameters: DO, alkalinity, pH, and specific conductance (Table 3A-1). Similar to previous periods, these excursions were generally isolated to specific areas of the EPA.
Water quality parameters with exceedances of applicable criteria are discussed further below, with the excursion frequencies summarized for the Baseline through the current reporting periods (WY1979–WY1993, WY1994–WY2004, WY2005–WY2014, and WY2015) to evaluate the presence of any temporal trends (Table 3A-1). Meanwhile, sulfate (SO4
2-) summary statistics for the current water year summarized by region and classification is presented in Appendix 3A-1, and the last five water years summarized by monitoring station is provided in Appendix 3A-2. Historically, this chapter included a temporal and spatial trends analysis of SO4
2- concentrations in the EPA; however, considering the theoretical link between SO4
2- concentrations and mercury methylation, this information is covered in Chapter 3B of this volume.
Chapter 3A Volume I: The South Florida Environment
3A-14
Table 3A-1. Excursions from Florida Class III criteria in the EPA for the Baseline period (WY1979–1993), Phase I (WY1994–WY2004), Phase II (WY2005–WY2014),
and WY2015.
Area Class Parameter
Number of Excursions/Sample Size, Percent Excursions (Category)a
Baseline Phase I Phase II Current Water Year
WY1979–WY1993 WY1994–WY2004 WY2005–WY2014 WY2015b
LNWR
Inflow
Alkalinity 5 / 1604, 0.3% (MC) 0 / 1158, 0% (NC) 0 / 1220, 0% (NC) 0 / 151, 0% (NC)
Dissolved Oxygenc 551 / 1119, 49.2% (C) 950 / 2173, 43.7% (C) 662 / 2096, 31.6% (C) 39 / 204, 19.1% (C)
pH 8 / 1100, 0.7% (MC) 4 / 2177, 0.2% (MC) 8 / 2142, 0.4% (MC) 0 / 204, 0% (NC)
Specific Conductance 478 / 1114, 42.9% (C) 373 / 2178, 17.1% (C) 274 / 2145, 12.8% (C) 12 / 205, 5.9% (MC)
Un-ionized Ammonia 35 / 1681, 2.1% (MC) 3 / 2309, 0.1% (MC) 7 / 1057, 0.7% (MC) 0 / 143, 0% (NC)
Interior
Alkalinity 103 / 387, 26.6% (C) 476 / 1148, 41.5% (C) 437 / 1458, 30% (C) 58 / 125, 46.4% (C)
Dissolved Oxygend 9 / 30, 30% (C) 22 / 140, 15.7% (C) 63 / 301, 20.9% (C) 4 / 31, 12.9% (PC)
pH 59 / 253, 23.3% (C) 131 / 1394, 9.4% (PC) 90 / 2597, 3.5% (MC) 5 / 312, 1.6% (MC)
Specific Conductance 6 / 153, 3.9% (MC) 1 / 1365, 0.1% (MC) 0 / 2533, 0% (NC) 0 / 288, 0% (NC)
Un-ionized Ammonia 1 / 387, 0.3% (MC) 1 / 1090, 0.1% (MC) 0 / 1326, 0% (NC) 0 / 111, 0% (NC)
Outflow
Alkalinity 1 / 580, 0.2% (MC) 0 / 710, 0% (NC) 0 / 488, 0% (NC) 0 / 60, 0% (NC)
Dissolved Oxygenc 279 / 593, 47% (C) 258 / 697, 37% (C) 84 / 666, 12.6% (C) 4 / 75, 5.3% (MC)
pH 1 / 581, 0.2% (MC) 4 / 693, 0.6% (MC) 1 / 678, 0.1% (MC) 0 / 75, 0% (NC)
Specific Conductance 130 / 597, 21.8% (C) 21 / 695, 3% (MC) 1 / 676, 0.1% (MC) 0 / 75, 0% (NC)
Un-ionized Ammonia 8 / 614, 1.3% (MC) 4 / 700, 0.6% (MC) 0 / 482, 0% (NC) 0 / 114, 0% (MC)
Rim
Dissolved Oxygenc 19 / 96, 19.8% (C) 199 / 454, 43.8% (C) 51 / 273, 18.7% (C) 0 / 34, 0% (NC)
Specific Conductance 27 / 96, 28.1% (C) 57 / 459, 12.4% (C) 10 / 301, 3.3% (MC) 1 / 46, 2.2% (MC)
Un-ionized Ammonia 0 / 96, 0% (NC) 2 / 464, 0.4% (MC) 3 / 99, 3% (MC) N/Ae
WCA-2
Inflow
Dissolved Oxygenc 286 / 635, 45% (C) 290 / 951, 30.5% (C) 216 / 1587, 13.6% (C) 12 / 174, 6.9% (MC)
pH 2 / 622, 0.3% (MC) 5 / 953, 0.5% (MC) 2 / 1608, 0.1% (MC) 1 / 177, 0.6% (MC)
Specific Conductance 162 / 641, 25.3% (C) 129 / 954, 13.5% (C) 124 / 1605, 7.7% (PC) 0 / 178, 0% (NC)
Un-ionized Ammonia 6 / 849, 0.7% (MC) 4 / 1031, 0.4% (MC) 0 / 878, 0% (NC) 2 / 242, 1.7% (C)
Interior
Dissolved Oxygend 55 / 99, 55.6% (C) 45 / 115, 39.1% (C) 41 / 179, 22.9% (C) 3 / 20, 15% (PC)
pH 17 / 861, 2% (MC) 3 / 1836, 0.2% (MC) 2 / 1746, 0.1% (MC) 0 / 203, 0% (NC)
Specific Conductance 85 / 754, 11.3% (PC) 193 / 1870, 10.3% (PC) 122 / 1744, 7% (PC) 10 / 199, 5% (MC)
Un-ionized Ammonia 8 / 2011, 0.4% (MC) 4 / 1539, 0.3% (MC) 0 / 1083, 0% (NC) 0 / 144, 0% (MC)
Outflow
Dissolved Oxygenc 294 / 883, 33.3% (C) 272 / 673, 40.4% (C) 233 / 846, 27.5% (C) 21 / 95, 22.1% (C)
pH 2 / 871, 0.2% (MC) 5 / 687, 0.7% (MC) 0 / 863, 0% (NC) 0 / 95, 0% (NC)
Specific Conductance 26 / 884, 2.9% (MC) 1 / 683, 0.1% (MC) 0 / 867, 0% (NC) 0 / 95, 0% (NC)
Un-ionized Ammonia 3 / 893, 0.3% (MC) 2 / 697, 0.3% (MC) 0 / 630, 0% (NC) 0 / 148, 0% (MC)
2016 South Florida Environmental Report Chapter 3A
3A-15
Table 3A-1. Continued.
Area Class Parameter
Number of Excursions/Sample Size, Percent Excursions (Category)a
Baseline Phase I Phase II Current Water Year
WY1979–WY1993 WY1994–WY2004 WY2005–WY2014 WY2015b
WCA-3
Inflow
Dissolved Oxygenc 908 / 2113, 43% (C) 1271 / 3116, 40.8% (C) 2602 / 5925, 43.9% (C) 362 / 861, 42% (C)
pH 17 / 2089, 0.8% (MC) 15 / 3162, 0.5% (MC) 7 / 6020, 0.1% (MC) 1 / 879, 0.1% (MC)
Specific Conductance 58 / 2138, 2.7% (MC) 7 / 3147, 0.2% (MC) 13 / 6037, 0.2% (MC) 0 / 879, 0% (NC)
Un-ionized Ammonia 3 / 2206, 0.1% (MC) 6 / 2835, 0.2% (MC) 5 / 1975, 0.3% (MC) 0 / 527, 0% (MC)
Interior
Dissolved Oxygend 31 / 96, 32.3% (C) 44 / 133, 33.1% (C) 20 / 135, 14.8% (C) 1 / 11, 9.1% (PC)
pH 1 / 407, 0.2% (MC) 0 / 1935, 0% (NC) 1 / 1400, 0.1% (MC) 0 / 95, 0% (NC)
Specific Conductance 4 / 297, 1.3% (MC) 0 / 1946, 0% (NC) 0 / 1410, 0% (NC) 0 / 95, 0% (NC)
Un-ionized Ammonia 1 / 609, 0.2% (MC) 1 / 1486, 0.1% (MC) 0 / 1114, 0% (NC) 0 / 136, 0% (MC)
Outflow
Dissolved Oxygenc 778 / 1927, 40.4% (C) 953 / 2408, 39.6% (C) 756 / 2388, 31.7% (C) 120 / 292, 41.1% (C)
pH 24 / 1891, 1.3% (MC) 22 / 2632, 0.8% (MC) 2 / 2607, 0.1% (MC) 0 / 312, 0% (NC)
Specific Conductance 0 / 1952, 0% (NC) 0 / 2645, 0% (NC) 0 / 2599, 0% (NC) 0 / 312, 0% (NC)
Un-ionized Ammonia 0 / 1741, 0% (NC) 6 / 1695, 0.4% (MC) 0 / 629, 0% (NC) N/A
ENP
Inflow
Dissolved Oxygenc 911 / 2289, 39.8% (C) 1250 / 3031, 41.2% (C) 917 / 2986, 30.7% (C) 125 / 322, 38.8% (C)
pH 26 / 2252, 1.2% (MC) 33 / 3047, 1.1% (MC) 2 / 3022, 0.1% (MC) 0 / 325, 0% (NC)
Specific Conductance 0 / 2314, 0% (NC) 1 / 3019, 0% (MC) 0 / 3004, 0% (NC) 0 / 325, 0% (NC)
Un-ionized Ammonia 0 / 2114, 0% (NC) 23 / 2026, 1.1% (MC) 0 / 734, 0% (NC) N/A
Interior
Dissolved Oxygenc 1 / 69, 1.4% (MC) 5 / 105, 4.8% (MC) 5 / 101, 5% (MC) 3 / 9, 33.3% (C)
pH 9 / 459, 2% (MC) 27 / 1023, 2.6% (MC) 0 / 839, 0% (NC) 0 / 84, 0% (NC)
Un-ionized Ammonia 14 / 568, 2.5% (MC) 4 / 1007, 0.4% (MC) 1 / 628, 0.2% (MC) 0 / 57, 0% (NC)
a. Excursion categories of concern, potential concern, minimal concern and no concern are denoted by “C,” “PC,” “MC,” and “NC”, respectively. b. Due to low sample size, some of these estimates should be used with caution. c. DO for inflow, outflow, and Rim Canal sampling locations were assessed using the Florida Class III freshwater water quality standard identified in Section, 62-302.533, F.A.C. d. DO site-specific alternative criterion was used to assess water quality excursions. e. N/A – not applicable.
Chapter 3A Volume I: The South Florida Environment
3A-16
Dissolved Oxygen Marsh DO conditions within the EPA were assessed utilizing the Everglades DO site-specific
alternative criterion (SSAC) for all periods, even though the SSAC was developed and implemented during 2004. To be consistent among time periods, the DO SSAC was applied across all periods. Because a single-value criterion does not adequately account for the wide-ranging natural daily fluctuations observed in the Everglades marshes, the SSAC uses an algorithm that includes sample collection time and water temperature to model the observed natural sinusoidal diel cycle and seasonal variability (Weaver 2004). The DO SSAC was originally developed to assess DO conditions within the EPA (i.e., marsh interior stations); therefore, for this analysis DO SSAC was applied to interior monitoring locations. Compliance with the DO water quality standard for inflow, outflow, and Rim Canal monitoring locations was assessed using the Class III standard (discussed below); however, for informational purposes only, the DO SSAC was also applied to inflow, outflow, and Rim Canal monitoring locations and presented in Appendix 3A-3 of this volume. The SSAC is assessed based on a comparison between the annual average measured DO concentration and average of the corresponding DO limits. DO excursion results for WY2015 for individual stations are provided in Appendix 3A-3 of this volume.
During WY2015, eleven interior stations (LOXA104.5, LOXA130, Z1, Z2, FS1, WCA2F1, WCA2F2, CA318, NE1, P33, and P36) exceeded the DO SSAC. It should be noted that only one sample was collected at LOXA130. Interior marsh stations that failed to achieve the SSAC during WY2015 either reside within phosphorus-impacted areas or are heavily influenced by canal flow. Phosphorus impacted areas of the marsh have long-term surface water TP concentrations greater than 10 µg/L and sediment TP concentrations in excess of 500 milligrams per kilogram (mg/kg). The DO SSAC was originally developed to assess DO concentrations within the marsh and never intended to be applied to Rim Canal, inflow, and outflow monitoring locations. However, for comparison purposes only, the DO SSAC was applied to Rim Canal, inflow, and outflow monitoring locations (Appendix 3A-3, Table 1).
DO for inflow, outflow, and Rim Canal monitoring stations were assessed using the Class III freshwater water quality standard (authorized August 1, 2013), which states that “no more than 10 percent of the daily average percent DO saturation values shall be below 38 percent in the Everglades Bioregion for daily data (Section 62-302.533, F.A.C.) or for instantaneous data (discrete measurements) the percent DO saturation values shall not exceed the limit based on the calculated time-day specific translation” (FDEP 2013). For WY2015, several inflow, outflow, and rim stations (49 out of 69) exceeded the DO water quality standard. A detailed list of stations, summary statistics, and water quality standard pass/fail determination is presented in Appendix 3A-3, Table 2. For comparison purposes only, DO Class III (freshwater) water quality standard was applied to interior monitoring locations.
Inflow regions for LNWR, WCA-3, and ENP were classified as a concern for all periods. Inflows into WCA-2 have progressed from an area of concern during the Baseline and Phase I periods to potential concern during Phase II and minimal concern during the current water year. The Rim Canal region of LNWR also saw improvement and progressed from an area of concern during the Baseline, Phase I, and Phase II periods to an area of no concern during the current water year. Outflow regions for WCA-2, WCA-3, and ENP were classified as a concern for all periods, while outflow from LNWR has improved from a concern during the Baseline period to a minimal concern during the current water year. Excursion frequencies throughout the different periods (Baseline, Phase I, and Phase II) have in large part either been reduced or remained the same, with the exception of WCA-3 and ENP (Table 3A-1).
Unlike most other parameters, DO is not a direct pollutant. Instead, it is a secondary response parameter that reflects changes in other pollutants or physical or hydrologic changes in the system. FDEP recognizes that DO impairments in phosphorus-impacted areas are related to biological
2016 South Florida Environmental Report Chapter 3A
3A-17
changes caused by phosphorus enrichment (Weaver 2004). Phosphorus concentrations in excess of the numeric criterion produce a variety of system changes in the Everglades that ultimately depress the DO regime in the water column (Payne and Xue 2012). The District is actively implementing a comprehensive restoration program to lower TP concentrations within the phosphorus-impacted portions of the EPA. Over time, DO concentrations at the nutrient impacted sites are expected to continue to improve as phosphorus concentrations in surface water and sediment are reduced and biological communities recover.
Compliance with the DO SSAC is based on the annual average of the instantaneous (discrete) DO measurements for each site; sufficient annual average DO data is not available for a single year to confidently apply the binomial hypothesis test to the regional assessment units. Therefore, excursion categories for DO were assigned based on a five-year period of record (POR) (WY2011–WY2015). Using the DO SSAC, interior portions of LNWR, WCA-2 and WCA-3 were categorized as a concern and minimal concern for interior portions of ENP for the WY2011–WY2015 period. A summary of water quality monitoring data for the five-year POR period is presented in Appendix 3A-2, and analysis of the WY2015 data is provided in Appendix 3A-3 for each individual monitoring location. It should be noted that no definitive conclusions regarding differences in DO excursion rates between individual water years and previous periods can be made given the large disparity in sample sizes among periods.
Alkalinity and pH Alkalinity is the measure of water’s acid neutralization capacity and provides a measure of the
water’s buffering capacity. In most surface water bodies, the buffering capacity is primarily the result of the equilibrium between carbon dioxide (CO2), bicarbonate (HCO3
-), and carbonate ions (CO3
2-). The dissociation of calcium carbonate, magnesium carbonate, or other carbonate-containing compounds entering the surface water through weathering of carbonate-containing rocks and minerals (e.g., limestone and calcite) contributes to the water’s buffering capacity. Therefore, in certain areas that are influenced by canal inflows primarily composed of mineral-rich agricultural runoff and groundwater (such as ENP, WCA-2, and WCA-3), alkalinity concentrations are relatively high (Payne and Xue 2012). Conversely, areas such as LNWR interior, which receive their hydrologic load primarily through rainfall, have very low alkalinities. Alkalinity [i.e., calcium carbonate (CaCO3)] protects against dramatic pH changes, which can be lethal to sensitive organisms. The current Class III water quality criterion specifies that alkalinity shall not be lower than 20 mg/L of alkalinity as calcium carbonate.
Excursions from the alkalinity water quality criterion have historically occurred in LNWR interior (Payne and Xue 2012). During WY2015, alkalinity was designated as a concern for LNWR interior because of an excursion rate of 46.4 percent (Table 3A-1). However, as discussed above and in previous SFERs, LNWR interior is hydrologically dominated by rainfall, which is naturally low in alkalinity. As such, FDEP considers the low alkalinity values to be representative of the range of natural conditions within LNWR; therefore, these are not considered violations of state water quality standards. The excursion rate for alkalinity in LNWR interior during WY2015 was higher than the rates reported for the Baseline, Phase I, and Phase II periods (26.6, 41.5, and 29.5 percent, respectively). In WY2015, alkalinity excursions occurred at numerous stations including the following sites (number of exceedances for each site in parentheses): LOX7 and LOX8 (10); LOX11and LOX13 (8); LOX9 (7); LOX5 and LOX3 (5); LOX10 (4); and LOX14 (1).
pH is defined as the negative log(base10) of the hydrogen (H+) ion activity. Most organisms, especially aquatic life, function best in a pH ranging from 6.0 to 9.0, although individual species have specific ideal ranges. In WY2015, pH was considered a minimal concern for LNWR Interior, WCA-2, and WCA-3 inflows. For LWNR interior sites, pH levels occasionally fell slightly below the 6.0 minimum criteria at three of the monitoring locations. The pH excursions were recorded for
Chapter 3A Volume I: The South Florida Environment
3A-18
the following sites (number of excursions for each site provided in parentheses): LOX8 (3), LOX11 (1), LOX5 (1), and LOX7 (1). As pH excursions within LNWR interior generally occur at sites distanced from the influence of inflows and have been linked to natural low background alkalinity conditions, FDEP does not consider the pH excursions in this area to be a violation of state water quality standards.
Specific Conductance Specific conductance (conductivity) is a measure of water’s ability to conduct an electrical
current and is an indirect measure of the total concentration of ionized substances (e.g., Ca2+, Mg2+, Na+, Cl-, HCO3
-, and SO42-) in the water. Conductivity varies with the quantity and type of ions
present in solution. The current state water quality criteria for Class III fresh water allows for a 50 percent increase above background conditions in specific conductance or 1,275 microsiemens per centimeter (µS/cm), whichever is greater. This limit is meant to preserve natural background conditions and to protect aquatic organisms from stressful ion concentrations. Given that background conductivities are low within the EPA, excursions were calculated using the 1,275 µS/cm criterion (Payne and Xue 2012).
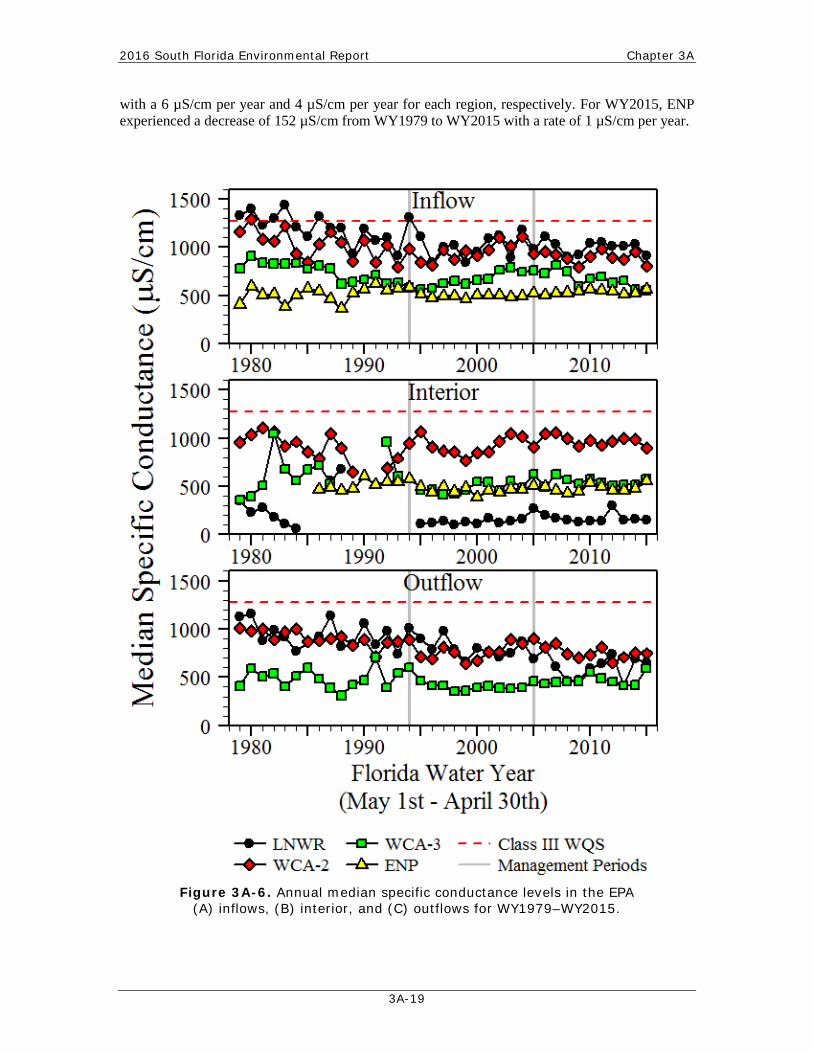
For WY2015, specific conductance was categorized as a potential concern for LNWR inflows and minimal concern for LNWR rim, WCA-2 inflow, and interior regions and minimal concern for the interior of ENP (Table 3A-1). Specific conductance excursion category for LNWR has improved since the last water year, moving from a category of concern to potential concern; this improvement could be due to improved water management as excursion frequencies have decreased at the structures, which typically exceed this water quality standard. Exceedances in LNWR occurred at the G-338 (2 excursions) and S-362 (10 excursions) inflow structures, which overall had 12 specific conductance measurements above 1,275 µS/cm as compared to WY2014, with a total of 18 exceedances recorded between these two stations. LNWR rim monitoring location LOXA135 observed one sample above the water quality standard during WY2015. In WCA-2, interior stations WCA2F3 (3); CA27 (2); and CA29, U3, WCA2F1, WCA2F4, and 2AN4 (1) exhibited exceedances in WY2015. Elevated conductivity levels at water control structures and stations near canal inflows may be explained by groundwater intrusion into canal surface waters (Payne and Xue 2012, Krest and Harvey 2003). This groundwater intrusion can occur due to seepage into canals via pump station operation (which can pull additional groundwater into surface water) and as a result of agricultural dewatering practices. However, improvements in water management and agricultural BMPs have reduced the occurrences of these high conductivity waters entering the EPA.
Specific conductance excursion frequency in LNWR inflows decreased from 42.9 to 17.1 percent during the Baseline and Phase I periods, respectively; a continued decrease to 12.8 percent during Phase II and 5.9 percent in WY2015 was observed. Excursion rates in WCA-2 inflows declined from 24.9 and 13.5 percent during the Baseline and Phase I periods, respectively, to 7.7 percent in Phase II and decreased to no observed excursion in WY2015. Excursion frequency in WCA-3 inflows steadily decreased throughout the Baseline, Phase I, and Phase II periods (2.7, 0.2, and 0.2 percent, respectively) and further decreased to no excursions during WY2015.
Overall, a steady long-term decrease in specific conductance within LNWR, WCA-2, WCA-3, and ENP inflows has occurred since WY1979 (Figure 3A-6). Median annual specific conductance levels in LNWR inflows have decreased approximately 424 µS/cm over the POR with a rate of approximately 9.5 µS/cm per year (across the entire POR). Similarly, across the sample period, specific conductance has decreased 356 µS/cm and 207 µS/cm in WCA-2 inflows and WCA-3 inflow, respectively. The rate of decrease is slightly lower than LNWR for WCA-2 and WCA-3
2016 South Florida Environmental Report Chapter 3A
3A-19
with a 6 µS/cm per year and 4 µS/cm per year for each region, respectively. For WY2015, ENP experienced a decrease of 152 µS/cm from WY1979 to WY2015 with a rate of 1 µS/cm per year.
Figure 3A-6. Annual median specific conductance levels in the EPA (A) inflows, (B) interior, and (C) outflows for WY1979–WY2015.
Chapter 3A Volume I: The South Florida Environment
3A-20
Un-ionized Ammonia Ammonia is the principal excretory product in aquatic animals and its mechanisms of toxicity
are relatively well understood (Armstrong et al. 1978, Thurston and Russo 1981, Neil et al. 2005). The toxic effects of ammonia to aquatic species are generally considered to be caused by the un-ionized fraction (NH3), rather than the ionic components (NH4
+), which exist in equilibrium. This equilibrium is highly dependent on pH, temperature, pressure, and salinity (Hampson 1977). The current Class III freshwater water quality standard states that the un-ionized ammonia concentration shall be less than or equal to 0.02 mg/L as ammonia (NH3), this criterion has been adopted by the state to protection aquatic life from the toxic effects of un-ionized ammonia and is not a nutrient-related criterion.
During WY2015, there was only one exceedances of the ammonia water quality standard observed at one WCA-2 inflow location (G-335; 0.042 mg/L). For WY2015, 29 percent of the calculated un-ionized ammonia concentrations were below the FDEP-approved target MDL of 0.4 µg/L [Subsection 62-4.246(4), F.A.C.)] for all areas and regions during WY2015. Historically, un-ionized ammonia was considered a minimal concern for most areas of the EPA during the Baseline, Phase I, and Phase II periods, with all areas showing improving with respect to percent exceedances occasionally water quality standard exceedances are observed (Table 3A-1).
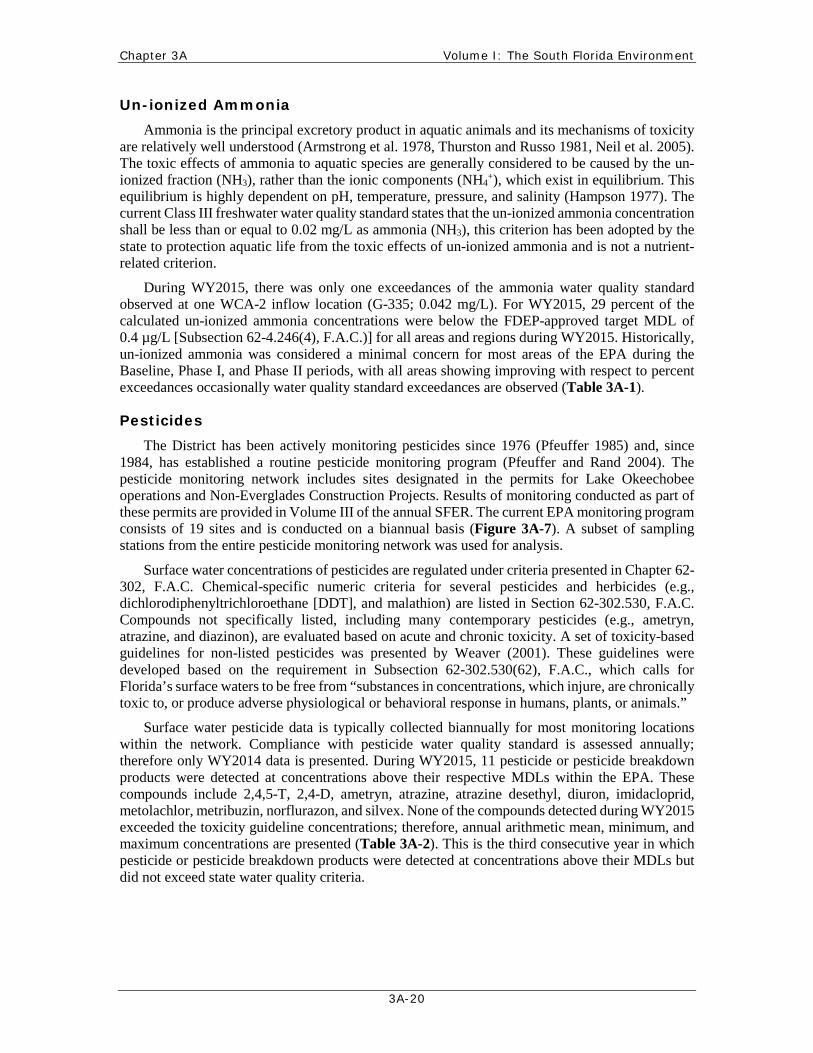
Pesticides The District has been actively monitoring pesticides since 1976 (Pfeuffer 1985) and, since
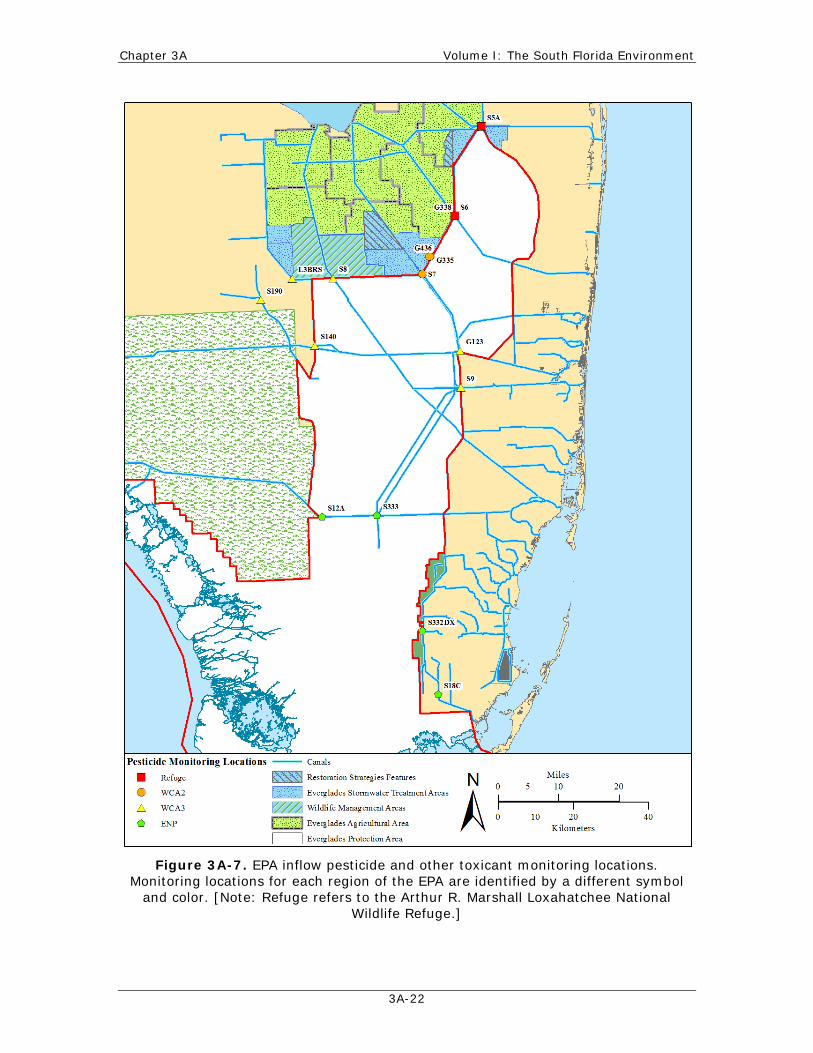
1984, has established a routine pesticide monitoring program (Pfeuffer and Rand 2004). The pesticide monitoring network includes sites designated in the permits for Lake Okeechobee operations and Non-Everglades Construction Projects. Results of monitoring conducted as part of these permits are provided in Volume III of the annual SFER. The current EPA monitoring program consists of 19 sites and is conducted on a biannual basis (Figure 3A-7). A subset of sampling stations from the entire pesticide monitoring network was used for analysis.
Surface water concentrations of pesticides are regulated under criteria presented in Chapter 62-302, F.A.C. Chemical-specific numeric criteria for several pesticides and herbicides (e.g., dichlorodiphenyltrichloroethane [DDT], and malathion) are listed in Section 62-302.530, F.A.C. Compounds not specifically listed, including many contemporary pesticides (e.g., ametryn, atrazine, and diazinon), are evaluated based on acute and chronic toxicity. A set of toxicity-based guidelines for non-listed pesticides was presented by Weaver (2001). These guidelines were developed based on the requirement in Subsection 62-302.530(62), F.A.C., which calls for Florida’s surface waters to be free from “substances in concentrations, which injure, are chronically toxic to, or produce adverse physiological or behavioral response in humans, plants, or animals.”
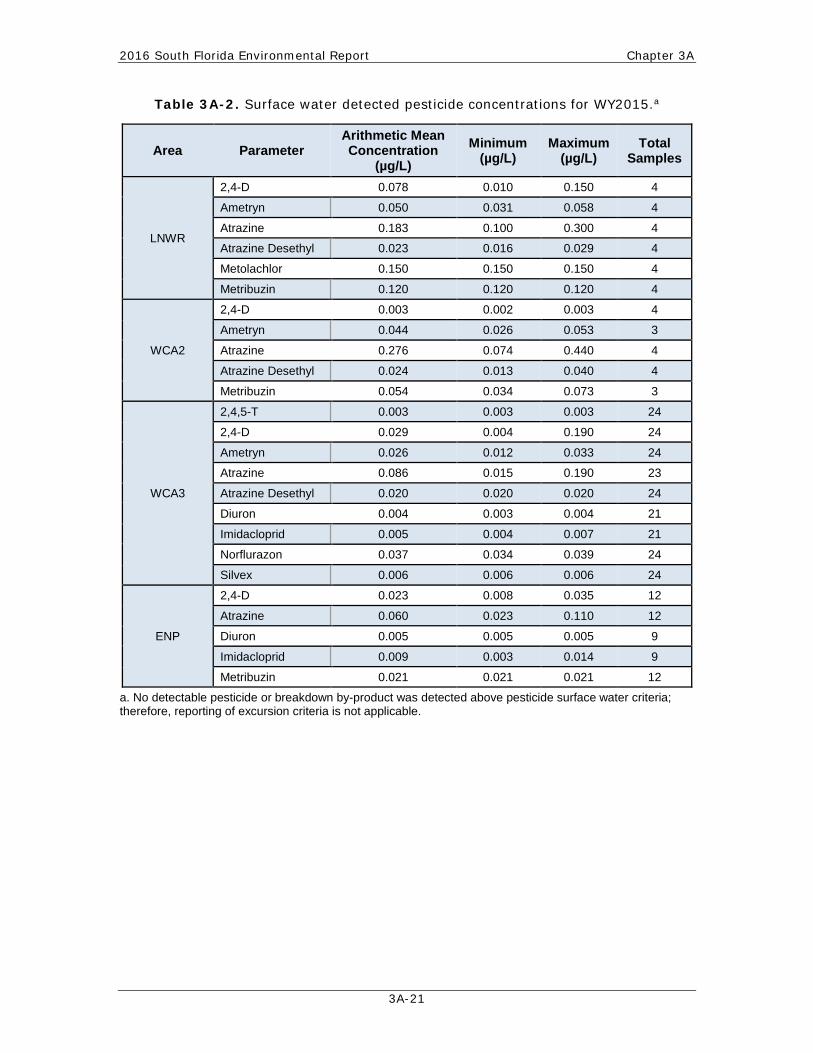
Surface water pesticide data is typically collected biannually for most monitoring locations within the network. Compliance with pesticide water quality standard is assessed annually; therefore only WY2014 data is presented. During WY2015, 11 pesticide or pesticide breakdown products were detected at concentrations above their respective MDLs within the EPA. These compounds include 2,4,5-T, 2,4-D, ametryn, atrazine, atrazine desethyl, diuron, imidacloprid, metolachlor, metribuzin, norflurazon, and silvex. None of the compounds detected during WY2015 exceeded the toxicity guideline concentrations; therefore, annual arithmetic mean, minimum, and maximum concentrations are presented (Table 3A-2). This is the third consecutive year in which pesticide or pesticide breakdown products were detected at concentrations above their MDLs but did not exceed state water quality criteria.
2016 South Florida Environmental Report Chapter 3A
3A-21
Table 3A-2. Surface water detected pesticide concentrations for WY2015.a
Area Parameter Arithmetic Mean Concentration
(µg/L) Minimum
(µg/L) Maximum
(µg/L) Total
Samples
LNWR
2,4-D 0.078 0.010 0.150 4
Ametryn 0.050 0.031 0.058 4
Atrazine 0.183 0.100 0.300 4
Atrazine Desethyl 0.023 0.016 0.029 4
Metolachlor 0.150 0.150 0.150 4
Metribuzin 0.120 0.120 0.120 4
WCA2
2,4-D 0.003 0.002 0.003 4
Ametryn 0.044 0.026 0.053 3
Atrazine 0.276 0.074 0.440 4
Atrazine Desethyl 0.024 0.013 0.040 4
Metribuzin 0.054 0.034 0.073 3
WCA3
2,4,5-T 0.003 0.003 0.003 24
2,4-D 0.029 0.004 0.190 24
Ametryn 0.026 0.012 0.033 24
Atrazine 0.086 0.015 0.190 23
Atrazine Desethyl 0.020 0.020 0.020 24
Diuron 0.004 0.003 0.004 21
Imidacloprid 0.005 0.004 0.007 21
Norflurazon 0.037 0.034 0.039 24
Silvex 0.006 0.006 0.006 24
ENP
2,4-D 0.023 0.008 0.035 12
Atrazine 0.060 0.023 0.110 12
Diuron 0.005 0.005 0.005 9
Imidacloprid 0.009 0.003 0.014 9
Metribuzin 0.021 0.021 0.021 12
a. No detectable pesticide or breakdown by-product was detected above pesticide surface water criteria; therefore, reporting of excursion criteria is not applicable.
Chapter 3A Volume I: The South Florida Environment
3A-22
Figure 3A-7. EPA inflow pesticide and other toxicant monitoring locations.
Monitoring locations for each region of the EPA are identified by a different symbol and color. [Note: Refuge refers to the Arthur R. Marshall Loxahatchee National
Wildlife Refuge.]
2016 South Florida Environmental Report Chapter 3A
3A-23
PHOSPHORUS AND NITROGEN Phosphorus and nitrogen are essential to the existence and growth of aquatic organisms in
surface waters. The EPA and, to a larger extent, the Everglades ecosystem is a phosphorus-limited system (Noe et al. 2001). The native flora and fauna in the Everglades are adapted to nutrient-poor conditions; therefore, relatively small additions of nutrients, especially phosphorus, have dramatic effects on the ecosystem.
Until the adoption of the numeric TP criteria, both phosphorus and nitrogen concentrations in EPA surface waters were only regulated by Class III narrative criterion. The narrative criterion specifies that nutrient concentrations in a water body cannot be altered to cause an imbalance in the natural populations of aquatic flora or fauna. Because of the importance of phosphorus in controlling natural biological communities, FDEP has numerically interpreted the narrative criterion, as directed by the EFA, to establish a long-term geometric mean of 10 µg/L TP for the EPA. Currently, nitrogen does not have a numeric criterion and is still regulated by only the narrative criteria.
In addition to presenting analyses of individual TP and TN concentrations, this section provides an evaluation of spatial and temporal trends in nutrient concentration and loads within the EPA as measured during WY2015 and compares the results with previous monitoring periods to provide an overview of the changes in nutrient levels within the EPA.
Total Phosphorus Concentrations One of the primary objectives of this chapter is to document temporal changes in TP levels
across the EPA using long-term geometric means to summarize and compare TP concentrations in accordance with the EFA and TP criterion rule requirements. The EFA and TP criterion were designed to provide long-term, ecologically protective conditions and require the use of geometric means due to the log-normal distribution of natural TP concentrations in the environment. The geometric mean employed by the criterion and the methodology used in this chapter to assess the nutrient concentrations account for short-term variability in water quality data, while providing more reliable, long-term values for evaluation and comparison of nutrient status.
Temporal changes in annual geometric mean TP concentrations during the POR from WY1979–WY2015 at both inflow and interior sites of LNWR, WCA-2, WCA-3, and ENP are shown in Figure 3A-8. Additionally, average geometric mean TP concentrations for the Baseline, Phase I, Phase II, and WY2015 periods for comparison are shown in Figure 3A-9. A descriptive statistics summary of TP concentrations measured within each portion of the EPA during the Baseline, Phase I, Phase II, and WY2015 periods is provided in Table 3A-3.
During the Baseline period, annual geometric mean TP concentrations at inflow and interior marsh sites across the EPA reached peak historic concentrations and were highly variable, as shown in Figure 3A-8. As the agricultural BMP and Everglades STA programs were initiated and became operational during the Phase I period, annual mean TP concentrations were reduced markedly and became less variable compared to levels observed during the Baseline period. Additionally, due to extreme climatic events and low water elevations during the mid-1980s, TP concentrations remained relatively high, while the 1990s experienced higher water levels and lower TP concentrations (McCormick et al. 1998; also, see Appendix 2-3 of this volume). Effectiveness of continued optimization and enhancement of BMPs and STAs on phosphorus concentrations and loads during Phase II has been difficult to assess due to climatic extremes that have occurred during this period.

Chapter 3A Volume I: The South Florida Environment
3A-24
Figure 3A-8. Annual geometric mean TP concentrations for inflow (left panel) and
interior (right panel) areas of LNWR, WCA-2, WCA-3, and ENP for the period WY1979–WY2015. Bars indicate geometric mean when flow, dash-line indicates
geometric mean irrespective of flow. The horizontal lines indicate the mean annual geometric mean TP concentrations for the Baseline (WY1979–WY1993), Phase I
(WY1994–WY2004), and Phase II (WY2005–WY2014) periods. [Note: Areas with no bars indicate data gaps. Additionally, for WY1987, LNWR interior annual geometric
mean TP concentrations reached 85 µg/L (outside the current scale).]
2016 South Florida Environmental Report Chapter 3A
3A-25
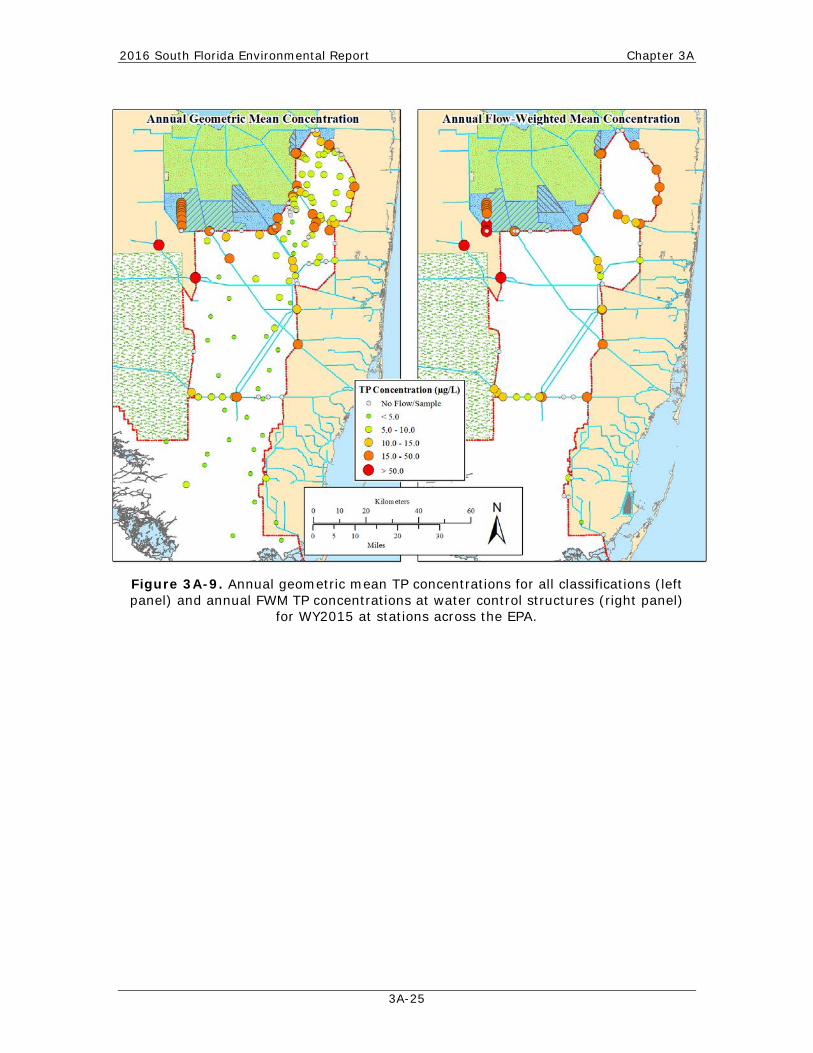
Figure 3A-9. Annual geometric mean TP concentrations for all classifications (left panel) and annual FWM TP concentrations at water control structures (right panel)
for WY2015 at stations across the EPA.
Chapter 3A Volume I: The South Florida Environment
3A-26
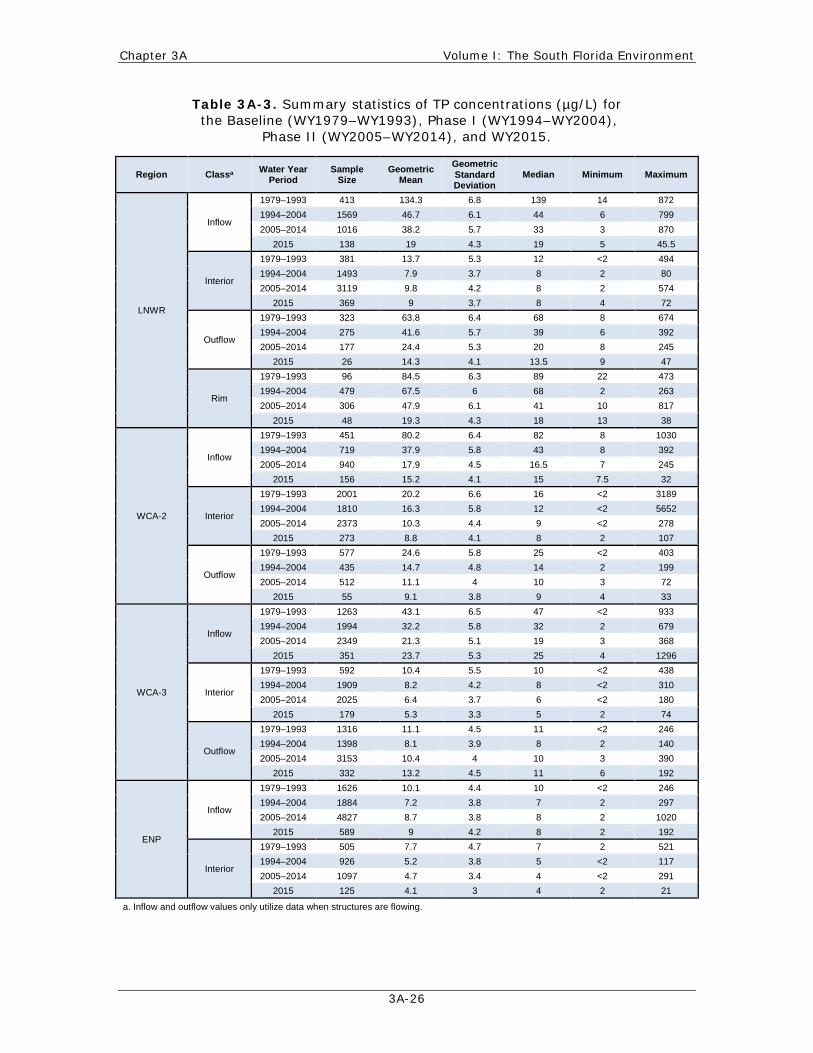
Table 3A-3. Summary statistics of TP concentrations (µg/L) for the Baseline (WY1979–WY1993), Phase I (WY1994–WY2004),
Phase II (WY2005–WY2014), and WY2015.
Region Classa Water Year Period
Sample Size
Geometric Mean
Geometric Standard Deviation
Median Minimum Maximum
LNWR
Inflow
1979–1993 413 134.3 6.8 139 14 872 1994–2004 1569 46.7 6.1 44 6 799 2005–2014 1016 38.2 5.7 33 3 870
2015 138 19 4.3 19 5 45.5
Interior
1979–1993 381 13.7 5.3 12 <2 494 1994–2004 1493 7.9 3.7 8 2 80 2005–2014 3119 9.8 4.2 8 2 574
2015 369 9 3.7 8 4 72
Outflow
1979–1993 323 63.8 6.4 68 8 674 1994–2004 275 41.6 5.7 39 6 392 2005–2014 177 24.4 5.3 20 8 245
2015 26 14.3 4.1 13.5 9 47
Rim
1979–1993 96 84.5 6.3 89 22 473 1994–2004 479 67.5 6 68 2 263 2005–2014 306 47.9 6.1 41 10 817
2015 48 19.3 4.3 18 13 38
WCA-2
Inflow
1979–1993 451 80.2 6.4 82 8 1030 1994–2004 719 37.9 5.8 43 8 392 2005–2014 940 17.9 4.5 16.5 7 245
2015 156 15.2 4.1 15 7.5 32
Interior
1979–1993 2001 20.2 6.6 16 <2 3189 1994–2004 1810 16.3 5.8 12 <2 5652 2005–2014 2373 10.3 4.4 9 <2 278
2015 273 8.8 4.1 8 2 107
Outflow
1979–1993 577 24.6 5.8 25 <2 403 1994–2004 435 14.7 4.8 14 2 199 2005–2014 512 11.1 4 10 3 72
2015 55 9.1 3.8 9 4 33
WCA-3
Inflow
1979–1993 1263 43.1 6.5 47 <2 933 1994–2004 1994 32.2 5.8 32 2 679 2005–2014 2349 21.3 5.1 19 3 368
2015 351 23.7 5.3 25 4 1296
Interior
1979–1993 592 10.4 5.5 10 <2 438 1994–2004 1909 8.2 4.2 8 <2 310 2005–2014 2025 6.4 3.7 6 <2 180
2015 179 5.3 3.3 5 2 74
Outflow
1979–1993 1316 11.1 4.5 11 <2 246 1994–2004 1398 8.1 3.9 8 2 140 2005–2014 3153 10.4 4 10 3 390
2015 332 13.2 4.5 11 6 192
ENP
Inflow
1979–1993 1626 10.1 4.4 10 <2 246 1994–2004 1884 7.2 3.8 7 2 297 2005–2014 4827 8.7 3.8 8 2 1020
2015 589 9 4.2 8 2 192
Interior
1979–1993 505 7.7 4.7 7 2 521 1994–2004 926 5.2 3.8 5 <2 117 2005–2014 1097 4.7 3.4 4 <2 291
2015 125 4.1 3 4 2 21
a. Inflow and outflow values only utilize data when structures are flowing.
2016 South Florida Environmental Report Chapter 3A
3A-27
TP concentrations during the early and mid-portions of the Phase II period were dramatically influenced by climatic extremes, including active hurricane seasons with intense rainfall and periods of extended drought with little or no rainfall and subsequent marsh dryout. In general, the greatest effect from climatic extremes was experienced during WY2005 and WY2006 when tropical activity (e.g. Hurricane Wilma) resulted in elevated inflow concentrations, in concert with storm damage to Everglades STA vegetative communities, which resulted in decreased STA nutrient removal for many months. Decreased rainfall in WY2005 led to prolonged periods of marsh dryout, which resulted in increased oxidation of the organic sediment and the subsequent release of phosphorus into the water column. This release, in turn, resulted in elevated TP concentrations at marsh sites across the EPA. In recent years, several storm events have influenced rainfall and inflow volumes to the EPA but not to the extent of the 2004–2005 hurricane seasons (WY2005 and WY2006).
During WY2006, much of the EPA experienced varying levels of recovery from the climatic events of WY2005. However, TP concentrations in portions of the EPA were again influenced by extended periods of limited rainfall and the subsequent marsh dryout during WY2007, WY2008, and portions of WY2009 (Figure 3A-8). As the Phase II BMP and STA implementation period is expanded, results will most likely be influenced less by single atypical years (e.g. WY2005), and the long-term effects of continuing restoration efforts will become more clear.
As documented in previous years, annual geometric mean TP concentrations measured during WY2015 exhibited a general north-south-concentration gradient with LNWR inflow concentrations achieving 19.0 µg/L TP (when flowing) and ENP inflows achieving 9.0 µg/L TP (when flowing). However, WCA-3 inflows were highest amongst all inflow regions of the EPA achieving a geometric mean TP concentration of 22.5 µg/L (when flowing). The north-to-south gradient results from phosphorus-rich canal discharges, which are composed primarily of agricultural runoff originating in the EAA that enter the northern portions of the EPA. Settling, sorption (both adsorption and absorption), biological assimilation, and other biogeochemical processes result in decreasing concentrations as the water flows southward through the marsh (Figure 3A-9). A detailed, site-specific summary of the TP concentrations for WY2015 is provided in Appendix 3A-4 of this volume.
Annual geometric mean inflow TP concentrations during WY2015 were 19.0 µg/L for LNWR, 15.2 µg/L for WCA-2, 22.5 µg/L for WCA-3, and 9.0 µg/L for ENP (Table 3A-3). Geometric mean TP concentrations have continued to decrease, with annual geometric mean concentrations during WY2015 being lower than values reported for WY2014 for LNWR and WCA-2 while WCA-3 and ENP inflow geometric means were greater (Figure 3A-8). Inflow TP concentrations in LNWR and WCA-2 generally continued to decrease following the elevated concentrations observed in WY2005.
During WY2015, LNWR inflow TP concentration was lower than the previous water year (WY2014; 26.6 µg/L), with a geometric mean of 19.0 µg/L. Furthermore, the geometric mean TP concentration during WY2015 was reduced compared to concentrations of 134.3 µg/L, 47.0 µg/L, and 38.2 µg/L for the Baseline, Phase I, and Phase II periods, respectively (Table 3A-3). Likewise, geometric mean TP concentrations in WCA-2 inflows have progressively decreased from 81.2 µg/L in the Baseline period to 38.0 µg/L in the Phase I, 18.0 µg/L in the Phase II period, and 15.2 µg/L in WY2015. WCA-3 inflow geometric mean TP concentrations have also exhibited a continual decrease, dropping from 43.0 µg/L in the Baseline period to 21.3 µg/L during Phase II; however, WY2015 experienced a slight increase relative to Phase II with a concentration of 22.5 µg/L. The lower TP concentrations in LNWR, WCA-2, and WCA-3 inflows over the four monitoring periods are likely the result of multiple variables, including improved treatment by STAs, tighter BMP control, lower stormwater volumes resulting from periods of limited rainfall, and a general recovery from the damage resulting from the WY2005 hurricanes. Meanwhile, ENP inflow TP
Chapter 3A Volume I: The South Florida Environment
3A-28
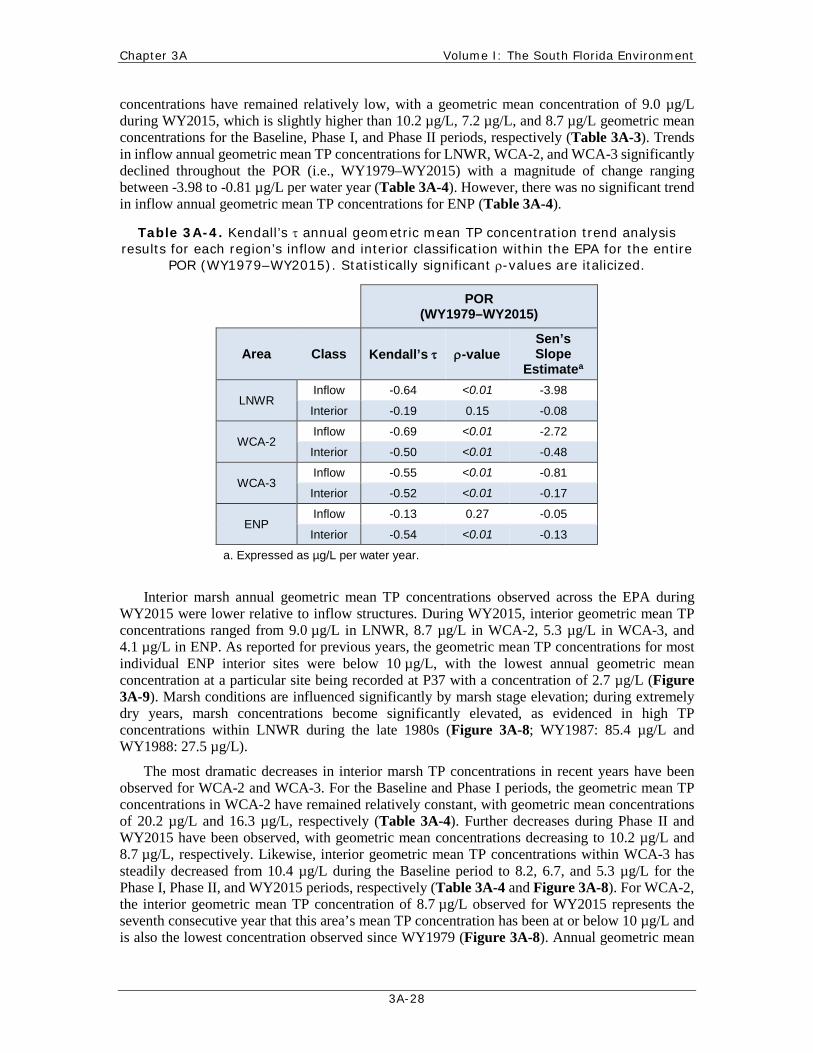
concentrations have remained relatively low, with a geometric mean concentration of 9.0 µg/L during WY2015, which is slightly higher than 10.2 µg/L, 7.2 µg/L, and 8.7 µg/L geometric mean concentrations for the Baseline, Phase I, and Phase II periods, respectively (Table 3A-3). Trends in inflow annual geometric mean TP concentrations for LNWR, WCA-2, and WCA-3 significantly declined throughout the POR (i.e., WY1979–WY2015) with a magnitude of change ranging between -3.98 to -0.81 µg/L per water year (Table 3A-4). However, there was no significant trend in inflow annual geometric mean TP concentrations for ENP (Table 3A-4).
Table 3A-4. Kendall’s τ annual geometric mean TP concentration trend analysis results for each region’s inflow and interior classification within the EPA for the entire
POR (WY1979–WY2015). Statistically significant ρ-values are italicized.
POR (WY1979–WY2015)
Area Class Kendall’s τ ρ-value Sen’s Slope
Estimatea
LNWR Inflow -0.64 <0.01 -3.98
Interior -0.19 0.15 -0.08
WCA-2 Inflow -0.69 <0.01 -2.72
Interior -0.50 <0.01 -0.48
WCA-3 Inflow -0.55 <0.01 -0.81
Interior -0.52 <0.01 -0.17
ENP Inflow -0.13 0.27 -0.05
Interior -0.54 <0.01 -0.13
a. Expressed as µg/L per water year.
Interior marsh annual geometric mean TP concentrations observed across the EPA during WY2015 were lower relative to inflow structures. During WY2015, interior geometric mean TP concentrations ranged from 9.0 µg/L in LNWR, 8.7 µg/L in WCA-2, 5.3 µg/L in WCA-3, and 4.1 µg/L in ENP. As reported for previous years, the geometric mean TP concentrations for most individual ENP interior sites were below 10 µg/L, with the lowest annual geometric mean concentration at a particular site being recorded at P37 with a concentration of 2.7 µg/L (Figure 3A-9). Marsh conditions are influenced significantly by marsh stage elevation; during extremely dry years, marsh concentrations become significantly elevated, as evidenced in high TP concentrations within LNWR during the late 1980s (Figure 3A-8; WY1987: 85.4 µg/L and WY1988: 27.5 µg/L).
The most dramatic decreases in interior marsh TP concentrations in recent years have been observed for WCA-2 and WCA-3. For the Baseline and Phase I periods, the geometric mean TP concentrations in WCA-2 have remained relatively constant, with geometric mean concentrations of 20.2 µg/L and 16.3 µg/L, respectively (Table 3A-4). Further decreases during Phase II and WY2015 have been observed, with geometric mean concentrations decreasing to 10.2 µg/L and 8.7 µg/L, respectively. Likewise, interior geometric mean TP concentrations within WCA-3 has steadily decreased from 10.4 µg/L during the Baseline period to 8.2, 6.7, and 5.3 µg/L for the Phase I, Phase II, and WY2015 periods, respectively (Table 3A-4 and Figure 3A-8). For WCA-2, the interior geometric mean TP concentration of 8.7 µg/L observed for WY2015 represents the seventh consecutive year that this area’s mean TP concentration has been at or below 10 µg/L and is also the lowest concentration observed since WY1979 (Figure 3A-8). Annual geometric mean
2016 South Florida Environmental Report Chapter 3A
3A-29
TP concentration trends throughout the interior portions of the EPA have significantly declined throughout the entire POR for all areas, except for LNWR, as indicated by the Kendall’s τ trend analysis ranging in a magnitude of change from -0.48 to -0.08 µg/L per water year (Table 3A-4). Based on this analysis, LNWR interior was not significantly different throughout the POR, presumably due to the extremely high values during the 1987–1988 period and the very high interannual variance (Figure 3A-8). The continued decreases in TP concentration observed in WCA-2 and WCA-3 likely reflect recovery from the recent climatic extremes, improved treatment of the inflows to these areas (which is supported by similar decreases in inflow concentrations), and enhanced conditions in the impacted portions of the marsh. This includes the area downstream of the S-10 structures, which is one of the area’s most highly impacted by historical phosphorus enrichment, where the quantity of discharge has been significantly reduced and the quality of the discharge has improved since STA-2 operations began.
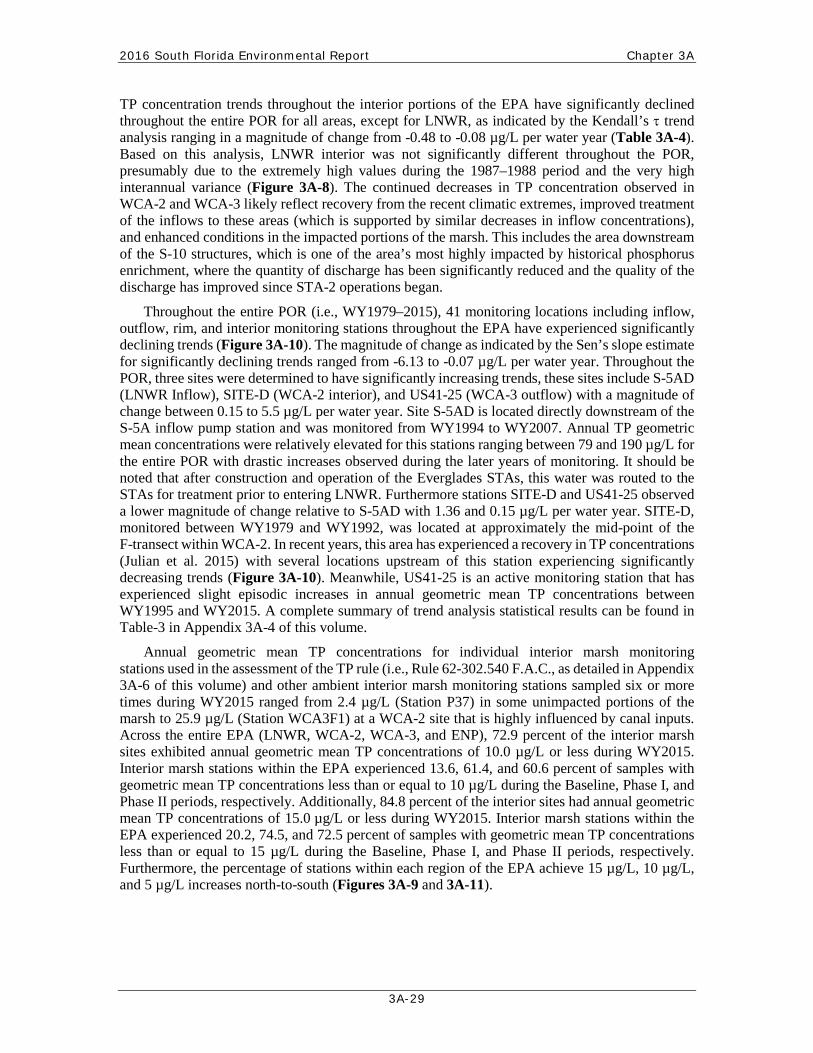
Throughout the entire POR (i.e., WY1979–2015), 41 monitoring locations including inflow, outflow, rim, and interior monitoring stations throughout the EPA have experienced significantly declining trends (Figure 3A-10). The magnitude of change as indicated by the Sen’s slope estimate for significantly declining trends ranged from -6.13 to -0.07 µg/L per water year. Throughout the POR, three sites were determined to have significantly increasing trends, these sites include S-5AD (LNWR Inflow), SITE-D (WCA-2 interior), and US41-25 (WCA-3 outflow) with a magnitude of change between 0.15 to 5.5 µg/L per water year. Site S-5AD is located directly downstream of the S-5A inflow pump station and was monitored from WY1994 to WY2007. Annual TP geometric mean concentrations were relatively elevated for this stations ranging between 79 and 190 µg/L for the entire POR with drastic increases observed during the later years of monitoring. It should be noted that after construction and operation of the Everglades STAs, this water was routed to the STAs for treatment prior to entering LNWR. Furthermore stations SITE-D and US41-25 observed a lower magnitude of change relative to S-5AD with 1.36 and 0.15 µg/L per water year. SITE-D, monitored between WY1979 and WY1992, was located at approximately the mid-point of the F-transect within WCA-2. In recent years, this area has experienced a recovery in TP concentrations (Julian et al. 2015) with several locations upstream of this station experiencing significantly decreasing trends (Figure 3A-10). Meanwhile, US41-25 is an active monitoring station that has experienced slight episodic increases in annual geometric mean TP concentrations between WY1995 and WY2015. A complete summary of trend analysis statistical results can be found in Table-3 in Appendix 3A-4 of this volume.
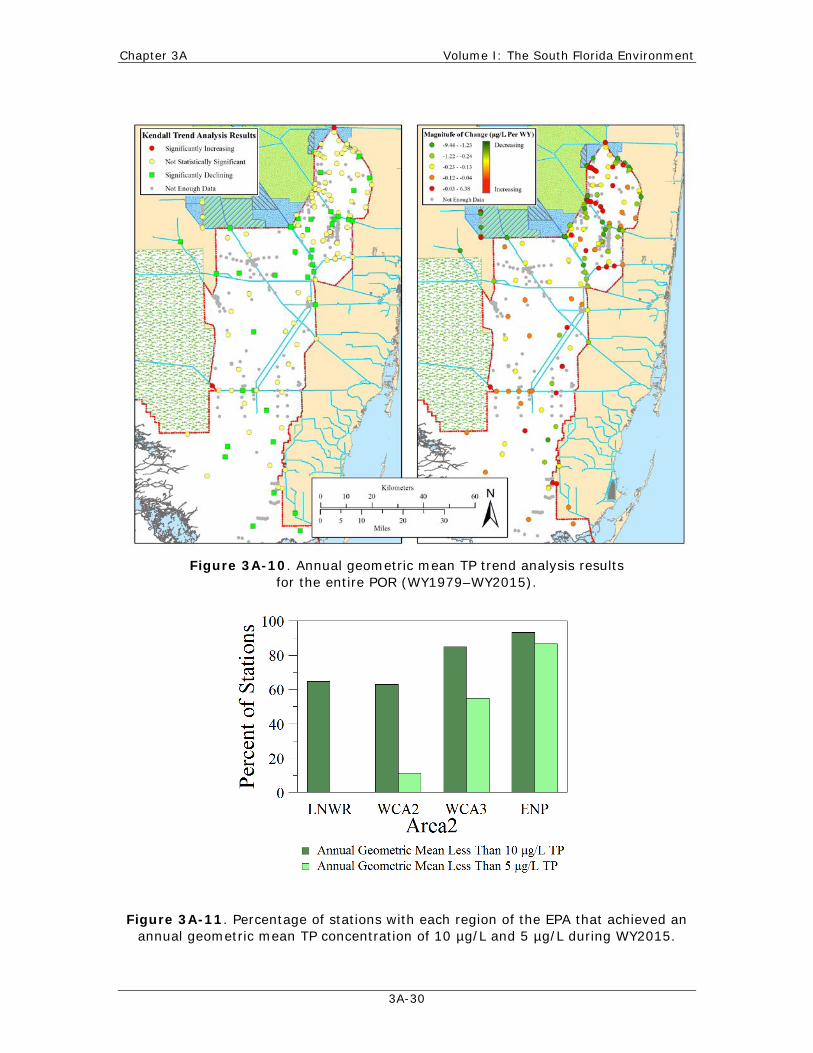
Annual geometric mean TP concentrations for individual interior marsh monitoring stations used in the assessment of the TP rule (i.e., Rule 62-302.540 F.A.C., as detailed in Appendix 3A-6 of this volume) and other ambient interior marsh monitoring stations sampled six or more times during WY2015 ranged from 2.4 µg/L (Station P37) in some unimpacted portions of the marsh to 25.9 µg/L (Station WCA3F1) at a WCA-2 site that is highly influenced by canal inputs. Across the entire EPA (LNWR, WCA-2, WCA-3, and ENP), 72.9 percent of the interior marsh sites exhibited annual geometric mean TP concentrations of 10.0 µg/L or less during WY2015. Interior marsh stations within the EPA experienced 13.6, 61.4, and 60.6 percent of samples with geometric mean TP concentrations less than or equal to 10 µg/L during the Baseline, Phase I, and Phase II periods, respectively. Additionally, 84.8 percent of the interior sites had annual geometric mean TP concentrations of 15.0 µg/L or less during WY2015. Interior marsh stations within the EPA experienced 20.2, 74.5, and 72.5 percent of samples with geometric mean TP concentrations less than or equal to 15 µg/L during the Baseline, Phase I, and Phase II periods, respectively. Furthermore, the percentage of stations within each region of the EPA achieve 15 µg/L, 10 µg/L, and 5 µg/L increases north-to-south (Figures 3A-9 and 3A-11).
Chapter 3A Volume I: The South Florida Environment
3A-30
Figure 3A-10. Annual geometric mean TP trend analysis results for the entire POR (WY1979–WY2015).
Figure 3A-11. Percentage of stations with each region of the EPA that achieved an annual geometric mean TP concentration of 10 µg/L and 5 µg/L during WY2015.
2016 South Florida Environmental Report Chapter 3A
3A-31
The higher percent of interior monitoring stations meeting the 10 and 15 µg/L limits observed for WY2015 reflects the continued recovery from recent climatic extremes, improved treatment of the inflows, and overall improvement in phosphorus conditions within the interior marsh due to ongoing restoration activities. Furthermore, this trend of improvement is apparent for stations used to assess the TP rule. Given the relatively constant location of interior monitoring sites in recent years, temporal comparison of statistics from individual sites can be used to distinguish changes in measured concentrations. However, it should be noted that since the existing monitoring network was not originally designed to allow results to accurately estimate the percentage of the marsh exceeding a TP concentration of 10.0 µg/L (or other thresholds), it is not appropriate to use the results for that purpose. Instead, a select group of stations have been established in recent years and identified so that comparison of TP concentrations to established threshold can be conducted.
Total Phosphorus Criterion Achievement Assessment The TP criterion rule specifies that while the federal Settlement Agreement (Case No. 88-1886-
CIV-MORENO) is in effect, compliance with the criterion in ENP will be assessed in accordance with the methodology specified in Appendix A of the Settlement Agreement using FWM TP concentrations at inflow sites instead of ambient marsh TP concentrations, as done in the other portions of the EPA. The Settlement Agreement assessments for ENP are conducted by the District and reported on a quarterly basis to satisfy other mandates and are not replicated here. The quarterly Settlement Agreement reports prepared by the District are available online at www.sfwmd.gov/toc.
In addition to establishing numeric TP criterion, Rule 62-302.540, F.A.C., also provides a four-part test to be used to determine achievement of the criterion. Each component must be achieved for a water body to be considered in compliance. Appendix 3A-6 of this volume provides results of the preliminary evaluation to assess TP criterion achievement using available data for the most recent five-year period, WY2011–WY2015, impacted TP rule station transition assessment, and TP rule POR trend analysis. As described previously, the results of this assessment were affected by data limitations in many parts of the EPA during some years caused in part by the extremely dry conditions that have prevailed throughout the area. Additionally, monitoring at nine new sites (added to the existing sites to form the TP criterion monitoring network) was not initiated until January 2007. During WY2015, 55 of the 58 TP criterion monitoring network sites had sufficient data (i.e., six or more samples and samples in the wet and dry seasons specified by the screening protocol referenced by the TP criterion rule, per Rule 62-302.540, F.A.C.) to be included in the TP criterion assessment. In contrast, only 30 of the 58 sites had a sufficient number of samples during WY2007, with less than 50 percent of LNWR and WCA-3 monitoring sites having the minimum number of samples required for inclusion in the TP criterion assessment.
During WY2015, an assessment of impacted TP rule stations was conducted based on guidance according to subparagraph 62-302.540(4)(d)2 F.A.C. in that individual stations in networks shall be deemed to be unimpacted for purposes of determining compliance assessment with the TP rule if the five-year geometric mean is less than or equal to 10 µg/L TP and the annual geometric mean is less than or equal to 15 µg/L TP. The detailed assessment can be found in Appendix 3A-6. As a result of the assessment, no stations were identified to transition from impacted to unimpacted based on additional data available from WY2015.
The results of the WY2011–WY2015 TP criterion assessment indicate that, even with the data limitations, the unimpacted portions of each WCA passed all four parts of the compliance test (as expected) and are therefore in compliance with the 10 µg/L TP criterion. Occasionally, individual sites within the unimpacted portions of the WCAs exhibited an annual site geometric mean TP concentration above 10 µg/L, as expected, but in no case did the values from any one unimpacted site influence or result in an exceedance of the annual or long-term network limits. None of the

Chapter 3A Volume I: The South Florida Environment
3A-32
annual geometric mean TP concentrations for the individual unimpacted sites during the WY2011–WY2015 period exceeded the 15 µg/L annual site limit.
In contrast, the impacted (i.e., phosphorus-enriched) portions of each water body failed one or more parts of the test and therefore exceeded the criteria. The impacted portions of the WCAs routinely exceeded the annual and five-year network TP concentration limits of 11 µg/L and 10 µg/L, respectively. During the WY2010–WY2014 period, numerous individual sites within the impacted areas exhibited annual geometric mean TP concentrations below the 15 µg/L annual site limit. In a few instances, the annual mean for individual impacted sites was below 10 µg/L; however, none of the impacted sites were consistently below the 10 µg/L long-term limit.
Total Phosphorus Loads Each year, the EPA receives variable amounts of surface water inflows based on the hydrologic
variability within the upstream basins. These regulated inflows contribute to the TP loading to the EPA system. Figure 3A-12 shows five-year (WY2011–WY2015) average annual flows, TP loads, and FWM TP concentrations to STAs and diversions from inflow tributaries and across the EPA. Approximately 152 metric tons per year of TP was delivered from upstream sources (Lake Okeechobee, EAA Basin, C-139 Basin, L-8 Basin/Reservoir, C-51W Basin, and other water conservation districts) over the last five years. About 26 metric tons per year of TP was delivered to the EPA after treatment by the Everglades STAs and 6 metric tons per year of TP was delivered to the EPA by diversion. Another 5 and 10 metric tons per year of TP was delivered to the EPA from the eastern and western Non-Everglades Construction Project basins, respectively. Figure 3A-12 shows five-year (WY2011–WY2015) average annual flows, TP loads, and FWM TP concentrations across the EPA. These data show that there is a concentration gradient from north (five-year average annual FWM TP concentration of 37 µg/L into WCA-1) to south (five-year average annual FWM TP concentration of 9 µg/L into ENP). Data for Figures 3A-12 and 3A-13 are presented in Appendix 3A-5, Tables 6 through 11. Table 3A-5 provides estimates of the inflow and TP load to each portion of the EPA for WY2015. Flows and TP loads are also provided for the Baseline (WY1979–WY1993), Phase I (WY1994–WY2004), and Phase II (WY2005–WY2014) periods for comparison.
In addition to inflow, atmospheric deposition contributes to the TP loading into the EPA. The long-term average range of TP atmospheric deposition to the WCAs is estimated between 82 and 146 metric tons per year. Atmospheric TP deposition rates are highly variable but not routinely monitored due to their high expense. The range (expressed spatially as 24 to 42 milligrams per square meter per year) is based on data obtained from long-term monitoring evaluated by the District (Redfield 2002).
Detailed estimates of TP loads by structure for WY2015 are presented in Appendix 3A-5 of this volume. This appendix summarizes contributions from all tributaries connecting to the EPA: Lake Okeechobee, EAA, C-139 Basin, other agricultural and urbanized areas, and Everglades STAs. In some cases, surface water inflows represent a mixture of water from several sources as it passes from one area to another before arriving in the EPA. For example, water discharged from Lake Okeechobee can pass through the EAA and then through an STA before arriving in the EPA. Similarly, runoff from the C-139 Basin can pass through STA-5/6 and STA-3/4 and then into the EAA before reaching the EPA.
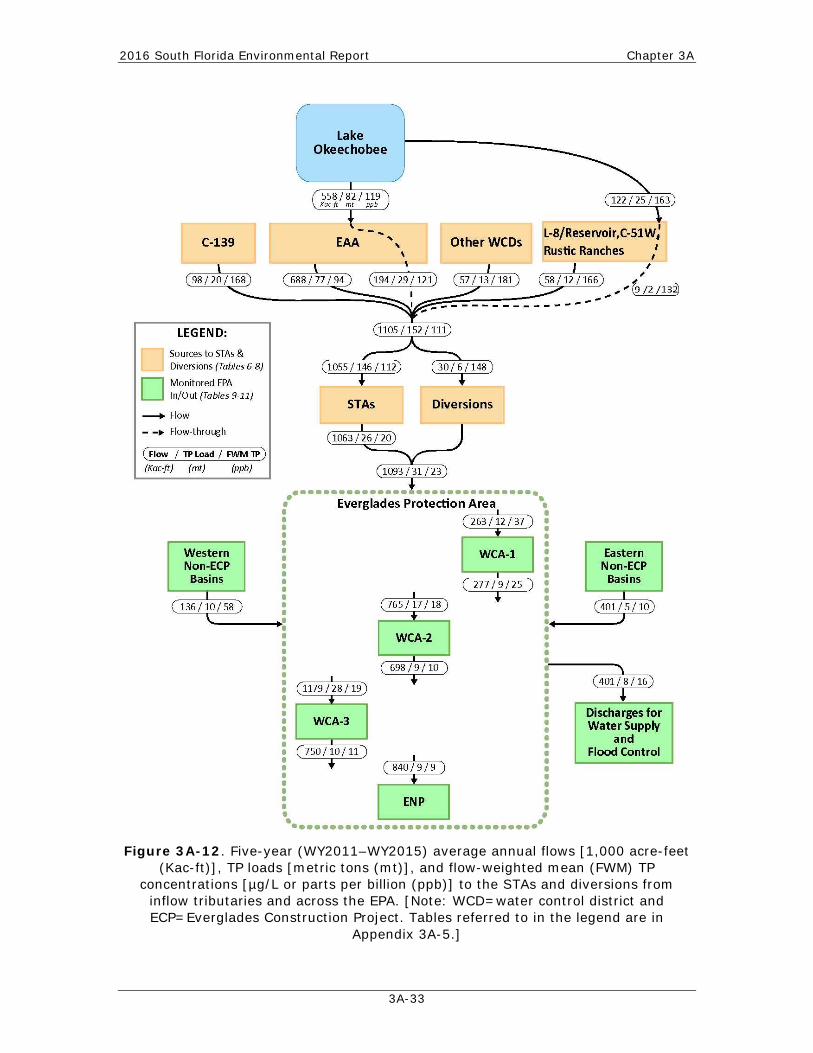
2016 South Florida Environmental Report Chapter 3A
3A-33
Figure 3A-12. Five-year (WY2011–WY2015) average annual flows [1,000 acre-feet (Kac-ft)], TP loads [metric tons (mt)], and flow-weighted mean (FWM) TP
concentrations [µg/L or parts per billion (ppb)] to the STAs and diversions from inflow tributaries and across the EPA. [Note: WCD=water control district and ECP=Everglades Construction Project. Tables referred to in the legend are in
Appendix 3A-5.]
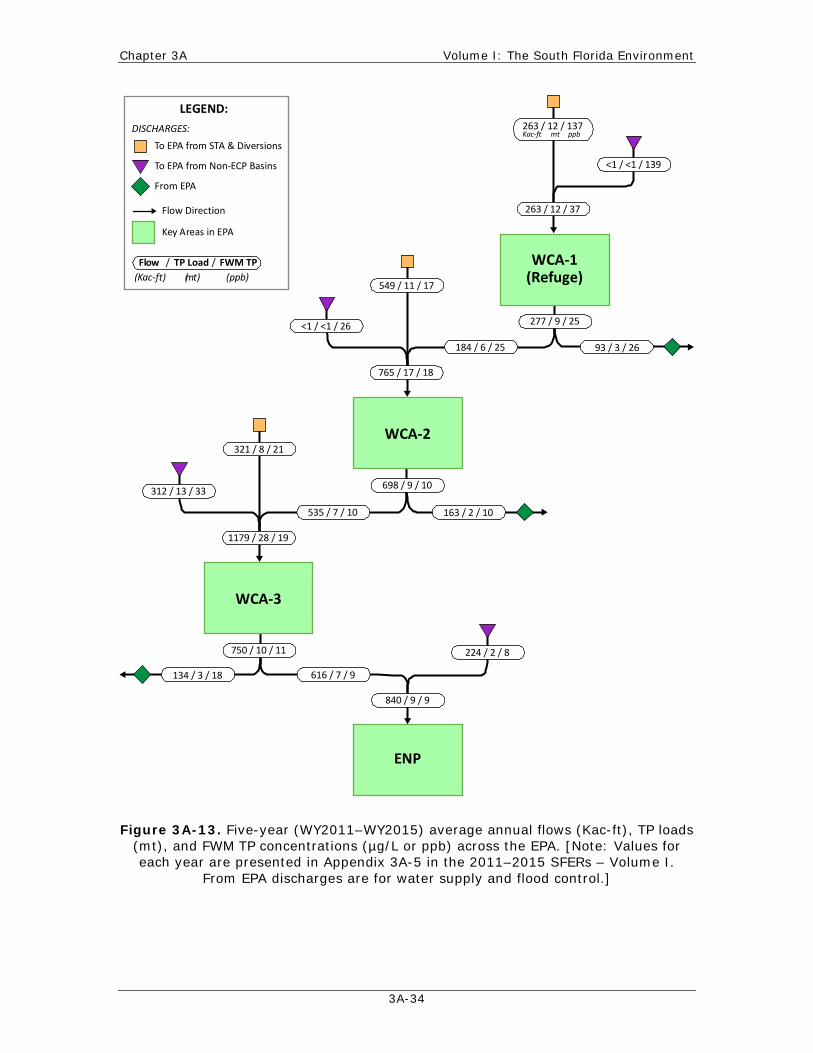
Chapter 3A Volume I: The South Florida Environment
3A-34
Figure 3A-13. Five-year (WY2011–WY2015) average annual flows (Kac-ft), TP loads (mt), and FWM TP concentrations (µg/L or ppb) across the EPA. [Note: Values for each year are presented in Appendix 3A-5 in the 2011–2015 SFERs – Volume I.
From EPA discharges are for water supply and flood control.]
ENP
224 / 2 / 8
134 / 3 / 18 616 / 7 / 9
750 / 10 / 11
840 / 9 / 9
WCA-3
163 / 2 / 10535 / 7 / 10
698 / 9 / 10
1179 / 28 / 19
321 / 8 / 21
312 / 13 / 33
WCA-2
93 / 3 / 26184 / 6 / 25
277 / 9 / 25
765 / 17 / 18
549 / 11 / 17
<1 / <1 / 26
WCA-1(Refuge)
263 / 12 / 37
<1 / <1 / 139
Kac-ft mt ppb263 / 12 / 137
Flow / TP Load / FWM TP (Kac-ft) (mt) (ppb)
Key Areas in EPA
Flow Direction
From EPA
To EPA from Non-ECP Basins
To EPA from STA & Diversions
DISCHARGES:
LEGEND:
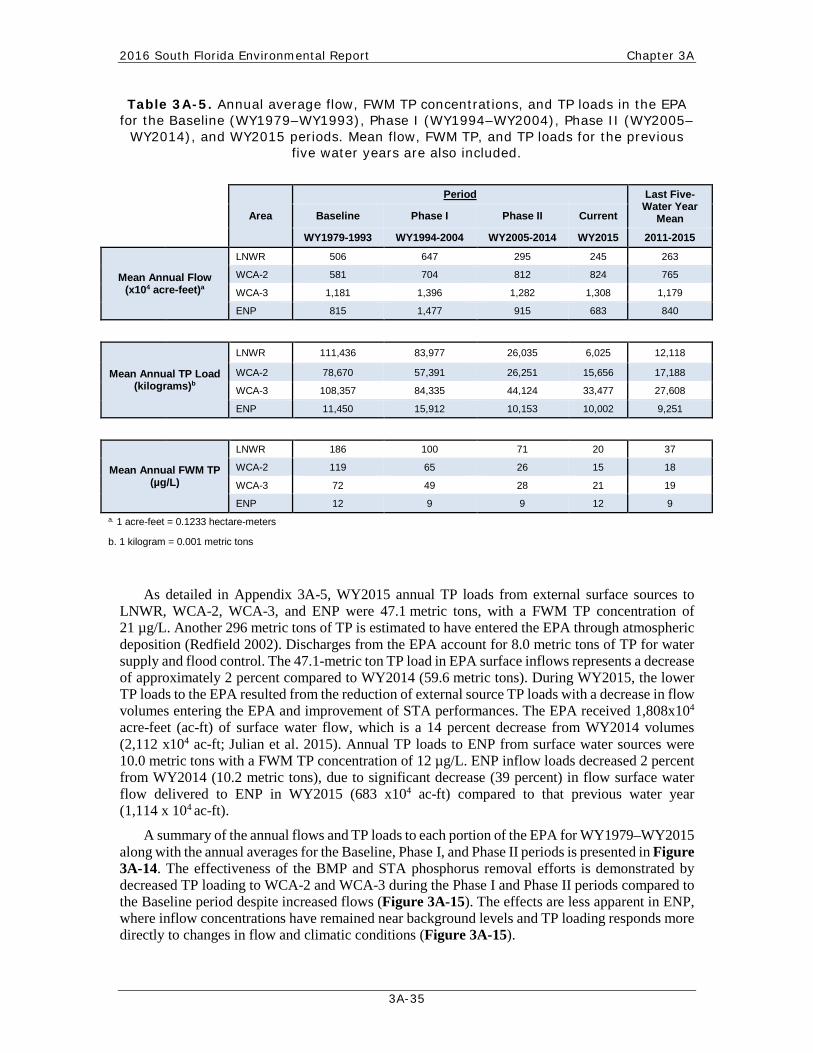
2016 South Florida Environmental Report Chapter 3A
3A-35
Table 3A-5. Annual average flow, FWM TP concentrations, and TP loads in the EPA for the Baseline (WY1979–WY1993), Phase I (WY1994–WY2004), Phase II (WY2005–
WY2014), and WY2015 periods. Mean flow, FWM TP, and TP loads for the previous five water years are also included.
Area
Period Last Five-Water Year
Mean Baseline Phase I Phase II Current
WY1979-1993 WY1994-2004 WY2005-2014 WY2015 2011-2015
Mean Annual Flow (x104 acre-feet)a
LNWR 506 647 295 245 263
WCA-2 581 704 812 824 765
WCA-3 1,181 1,396 1,282 1,308 1,179
ENP 815 1,477 915 683 840
Mean Annual TP Load (kilograms)b
LNWR 111,436 83,977 26,035 6,025 12,118
WCA-2 78,670 57,391 26,251 15,656 17,188
WCA-3 108,357 84,335 44,124 33,477 27,608
ENP 11,450 15,912 10,153 10,002 9,251
Mean Annual FWM TP (µg/L)
LNWR 186 100 71 20 37
WCA-2 119 65 26 15 18
WCA-3 72 49 28 21 19
ENP 12 9 9 12 9 a. 1 acre-feet = 0.1233 hectare-meters
b. 1 kilogram = 0.001 metric tons
As detailed in Appendix 3A-5, WY2015 annual TP loads from external surface sources to LNWR, WCA-2, WCA-3, and ENP were 47.1 metric tons, with a FWM TP concentration of 21 µg/L. Another 296 metric tons of TP is estimated to have entered the EPA through atmospheric deposition (Redfield 2002). Discharges from the EPA account for 8.0 metric tons of TP for water supply and flood control. The 47.1-metric ton TP load in EPA surface inflows represents a decrease of approximately 2 percent compared to WY2014 (59.6 metric tons). During WY2015, the lower TP loads to the EPA resulted from the reduction of external source TP loads with a decrease in flow volumes entering the EPA and improvement of STA performances. The EPA received 1,808x104 acre-feet (ac-ft) of surface water flow, which is a 14 percent decrease from WY2014 volumes (2,112 x104 ac-ft; Julian et al. 2015). Annual TP loads to ENP from surface water sources were 10.0 metric tons with a FWM TP concentration of 12 µg/L. ENP inflow loads decreased 2 percent from WY2014 (10.2 metric tons), due to significant decrease (39 percent) in flow surface water flow delivered to ENP in WY2015 (683 x104 ac-ft) compared to that previous water year (1,114 x 104 ac-ft).
A summary of the annual flows and TP loads to each portion of the EPA for WY1979–WY2015 along with the annual averages for the Baseline, Phase I, and Phase II periods is presented in Figure 3A-14. The effectiveness of the BMP and STA phosphorus removal efforts is demonstrated by decreased TP loading to WCA-2 and WCA-3 during the Phase I and Phase II periods compared to the Baseline period despite increased flows (Figure 3A-15). The effects are less apparent in ENP, where inflow concentrations have remained near background levels and TP loading responds more directly to changes in flow and climatic conditions (Figure 3A-15).
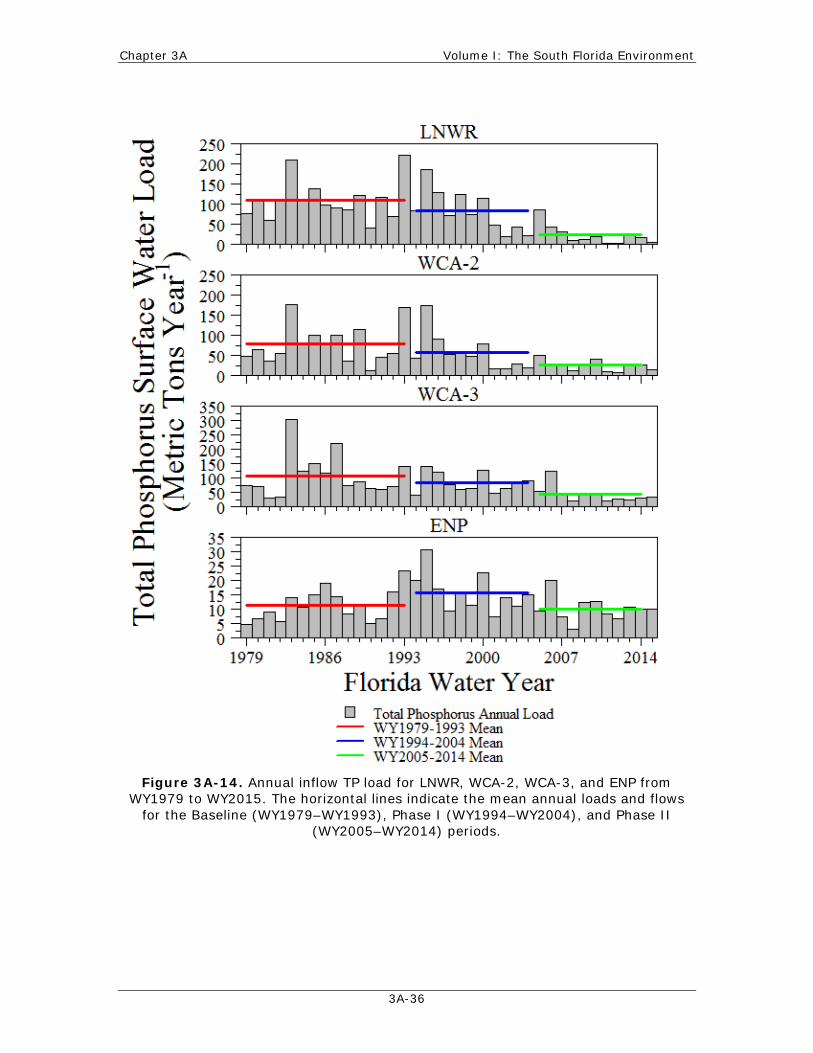
Chapter 3A Volume I: The South Florida Environment
3A-36
Figure 3A-14. Annual inflow TP load for LNWR, WCA-2, WCA-3, and ENP from
WY1979 to WY2015. The horizontal lines indicate the mean annual loads and flows for the Baseline (WY1979–WY1993), Phase I (WY1994–WY2004), and Phase II
(WY2005–WY2014) periods.
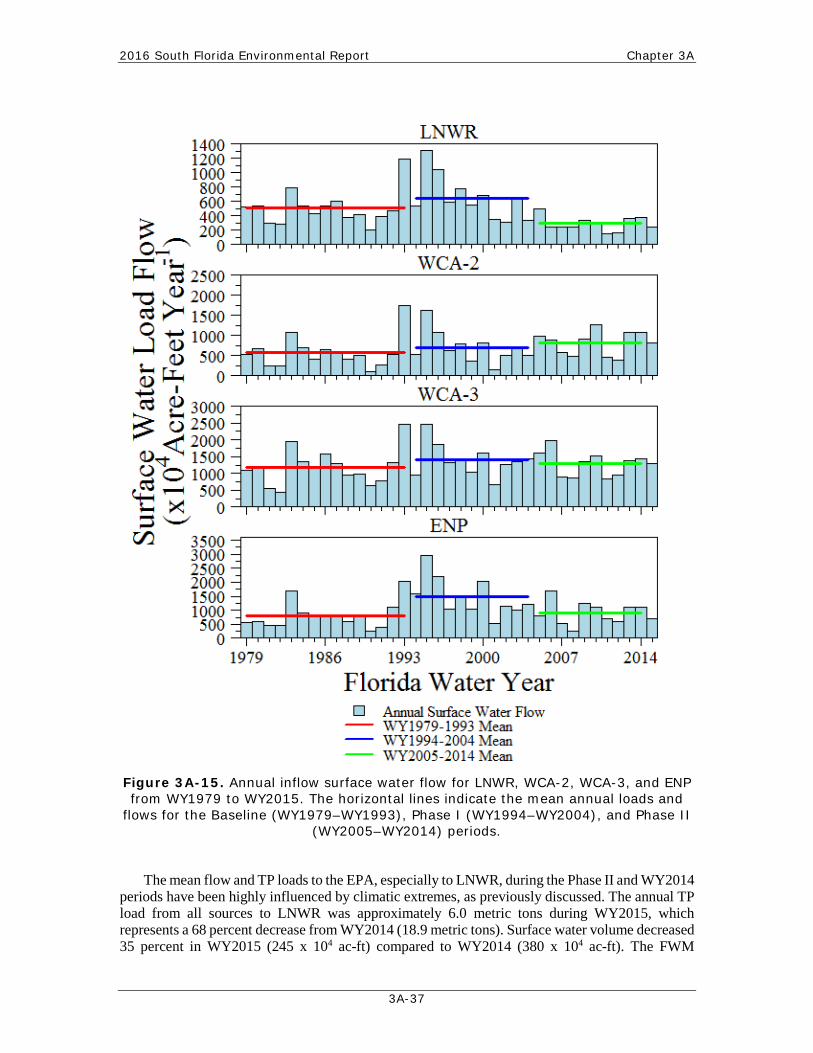
2016 South Florida Environmental Report Chapter 3A
3A-37
Figure 3A-15. Annual inflow surface water flow for LNWR, WCA-2, WCA-3, and ENP from WY1979 to WY2015. The horizontal lines indicate the mean annual loads and
flows for the Baseline (WY1979–WY1993), Phase I (WY1994–WY2004), and Phase II (WY2005–WY2014) periods.
The mean flow and TP loads to the EPA, especially to LNWR, during the Phase II and WY2014 periods have been highly influenced by climatic extremes, as previously discussed. The annual TP load from all sources to LNWR was approximately 6.0 metric tons during WY2015, which represents a 68 percent decrease from WY2014 (18.9 metric tons). Surface water volume decreased 35 percent in WY2015 (245 x 104 ac-ft) compared to WY2014 (380 x 104 ac-ft). The FWM
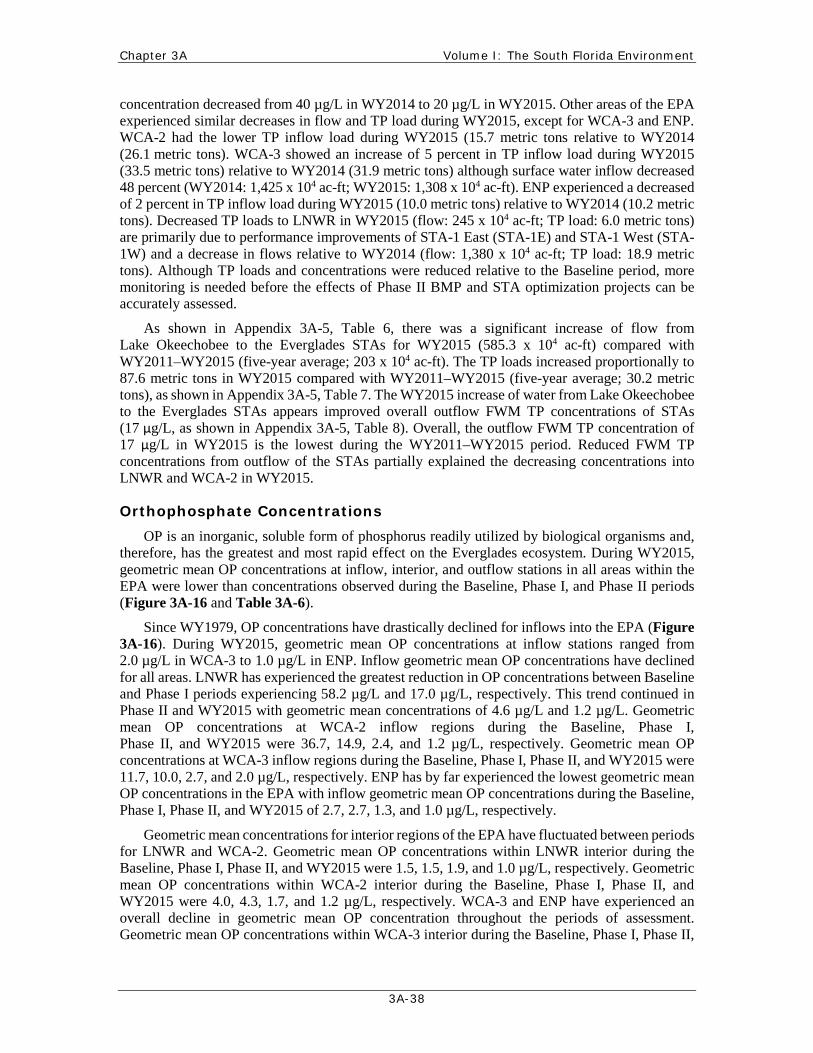
Chapter 3A Volume I: The South Florida Environment
3A-38
concentration decreased from 40 µg/L in WY2014 to 20 µg/L in WY2015. Other areas of the EPA experienced similar decreases in flow and TP load during WY2015, except for WCA-3 and ENP. WCA-2 had the lower TP inflow load during WY2015 (15.7 metric tons relative to WY2014 (26.1 metric tons). WCA-3 showed an increase of 5 percent in TP inflow load during WY2015 (33.5 metric tons) relative to WY2014 (31.9 metric tons) although surface water inflow decreased 48 percent (WY2014: 1,425 x 104 ac-ft; WY2015: 1,308 x 104 ac-ft). ENP experienced a decreased of 2 percent in TP inflow load during WY2015 (10.0 metric tons) relative to WY2014 (10.2 metric tons). Decreased TP loads to LNWR in WY2015 (flow: 245 x 104 ac-ft; TP load: 6.0 metric tons) are primarily due to performance improvements of STA-1 East (STA-1E) and STA-1 West (STA-1W) and a decrease in flows relative to WY2014 (flow: 1,380 x 104 ac-ft; TP load: 18.9 metric tons). Although TP loads and concentrations were reduced relative to the Baseline period, more monitoring is needed before the effects of Phase II BMP and STA optimization projects can be accurately assessed.
As shown in Appendix 3A-5, Table 6, there was a significant increase of flow from Lake Okeechobee to the Everglades STAs for WY2015 (585.3 x 10⁴ ac-ft) compared with WY2011–WY2015 (five-year average; 203 x 104 ac-ft). The TP loads increased proportionally to 87.6 metric tons in WY2015 compared with WY2011–WY2015 (five-year average; 30.2 metric tons), as shown in Appendix 3A-5, Table 7. The WY2015 increase of water from Lake Okeechobee to the Everglades STAs appears improved overall outflow FWM TP concentrations of STAs (17 µg/L, as shown in Appendix 3A-5, Table 8). Overall, the outflow FWM TP concentration of 17 µg/L in WY2015 is the lowest during the WY2011–WY2015 period. Reduced FWM TP concentrations from outflow of the STAs partially explained the decreasing concentrations into LNWR and WCA-2 in WY2015.
Orthophosphate Concentrations OP is an inorganic, soluble form of phosphorus readily utilized by biological organisms and,
therefore, has the greatest and most rapid effect on the Everglades ecosystem. During WY2015, geometric mean OP concentrations at inflow, interior, and outflow stations in all areas within the EPA were lower than concentrations observed during the Baseline, Phase I, and Phase II periods (Figure 3A-16 and Table 3A-6).
Since WY1979, OP concentrations have drastically declined for inflows into the EPA (Figure 3A-16). During WY2015, geometric mean OP concentrations at inflow stations ranged from 2.0 µg/L in WCA-3 to 1.0 µg/L in ENP. Inflow geometric mean OP concentrations have declined for all areas. LNWR has experienced the greatest reduction in OP concentrations between Baseline and Phase I periods experiencing 58.2 µg/L and 17.0 µg/L, respectively. This trend continued in Phase II and WY2015 with geometric mean concentrations of 4.6 µg/L and 1.2 µg/L. Geometric mean OP concentrations at WCA-2 inflow regions during the Baseline, Phase I, Phase II, and WY2015 were 36.7, 14.9, 2.4, and 1.2 µg/L, respectively. Geometric mean OP concentrations at WCA-3 inflow regions during the Baseline, Phase I, Phase II, and WY2015 were 11.7, 10.0, 2.7, and 2.0 µg/L, respectively. ENP has by far experienced the lowest geometric mean OP concentrations in the EPA with inflow geometric mean OP concentrations during the Baseline, Phase I, Phase II, and WY2015 of 2.7, 2.7, 1.3, and 1.0 µg/L, respectively.
Geometric mean concentrations for interior regions of the EPA have fluctuated between periods for LNWR and WCA-2. Geometric mean OP concentrations within LNWR interior during the Baseline, Phase I, Phase II, and WY2015 were 1.5, 1.5, 1.9, and 1.0 µg/L, respectively. Geometric mean OP concentrations within WCA-2 interior during the Baseline, Phase I, Phase II, and WY2015 were 4.0, 4.3, 1.7, and 1.2 µg/L, respectively. WCA-3 and ENP have experienced an overall decline in geometric mean OP concentration throughout the periods of assessment. Geometric mean OP concentrations within WCA-3 interior during the Baseline, Phase I, Phase II,
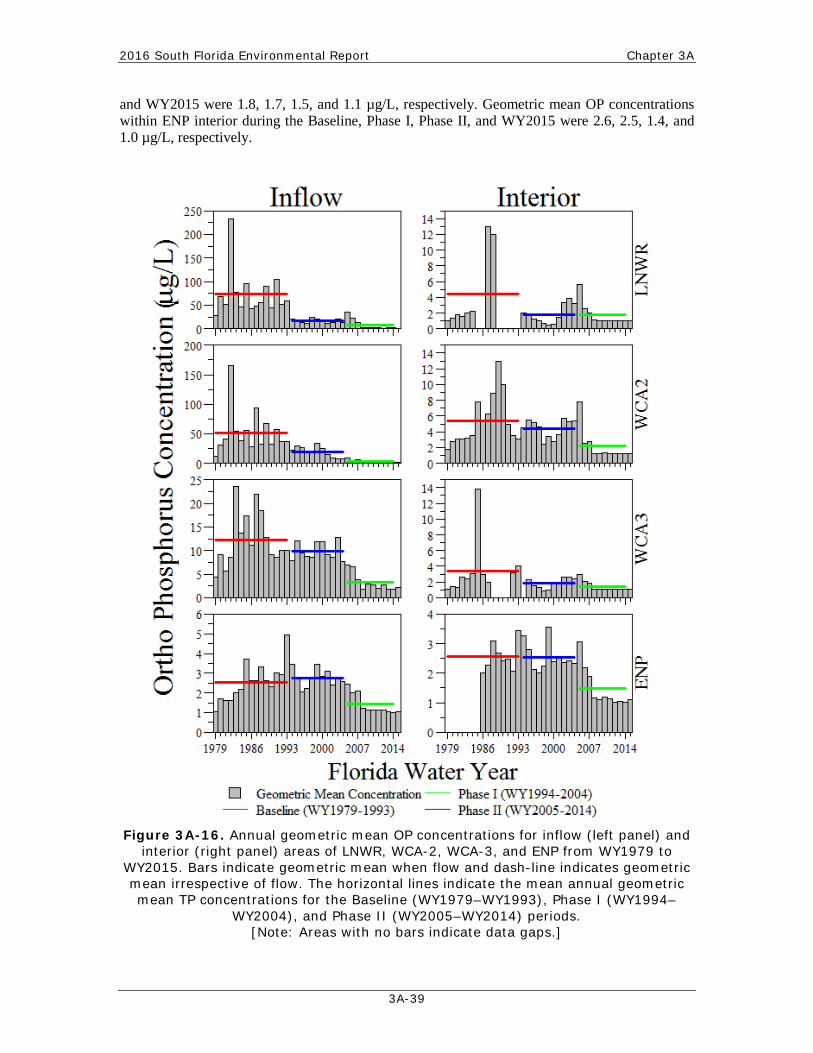
2016 South Florida Environmental Report Chapter 3A
3A-39
and WY2015 were 1.8, 1.7, 1.5, and 1.1 µg/L, respectively. Geometric mean OP concentrations within ENP interior during the Baseline, Phase I, Phase II, and WY2015 were 2.6, 2.5, 1.4, and 1.0 µg/L, respectively.
Figure 3A-16. Annual geometric mean OP concentrations for inflow (left panel) and
interior (right panel) areas of LNWR, WCA-2, WCA-3, and ENP from WY1979 to WY2015. Bars indicate geometric mean when flow and dash-line indicates geometric mean irrespective of flow. The horizontal lines indicate the mean annual geometric mean TP concentrations for the Baseline (WY1979–WY1993), Phase I (WY1994–
WY2004), and Phase II (WY2005–WY2014) periods. [Note: Areas with no bars indicate data gaps.]
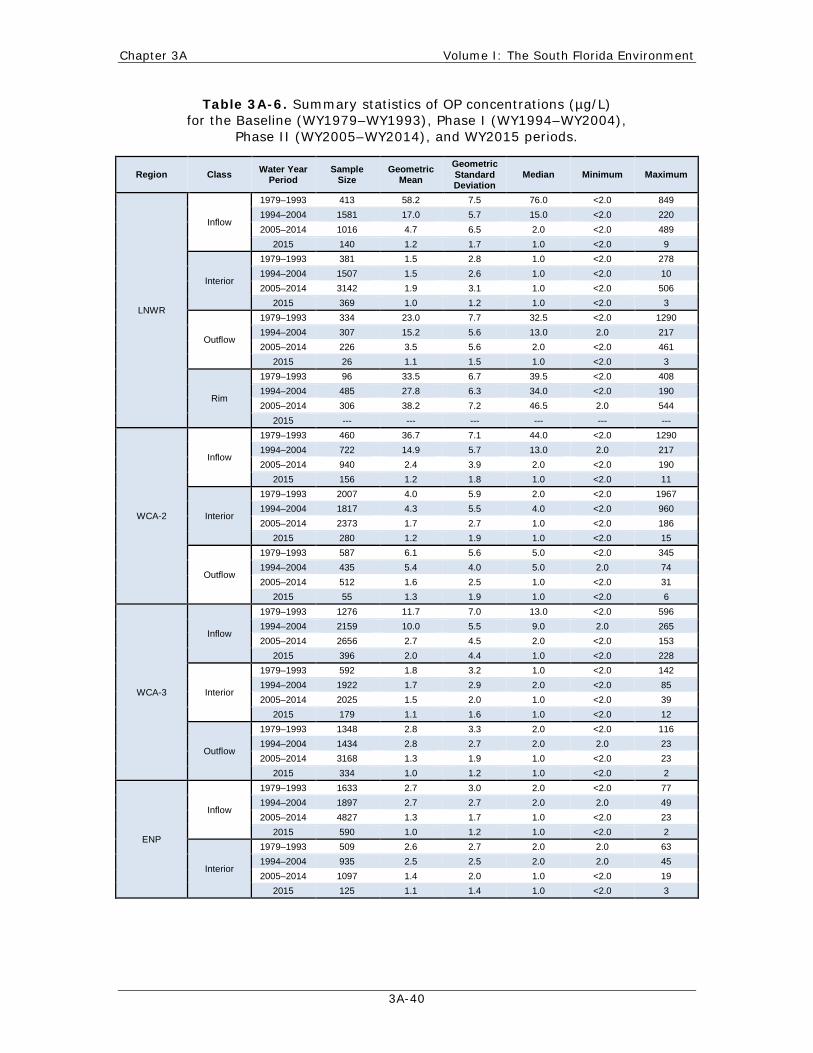
Chapter 3A Volume I: The South Florida Environment
3A-40
Table 3A-6. Summary statistics of OP concentrations (µg/L) for the Baseline (WY1979–WY1993), Phase I (WY1994–WY2004),
Phase II (WY2005–WY2014), and WY2015 periods.
Region Class Water Year Period
Sample Size
Geometric Mean
Geometric Standard Deviation
Median Minimum Maximum
LNWR
Inflow
1979–1993 413 58.2 7.5 76.0 <2.0 849 1994–2004 1581 17.0 5.7 15.0 <2.0 220 2005–2014 1016 4.7 6.5 2.0 <2.0 489
2015 140 1.2 1.7 1.0 <2.0 9
Interior
1979–1993 381 1.5 2.8 1.0 <2.0 278 1994–2004 1507 1.5 2.6 1.0 <2.0 10 2005–2014 3142 1.9 3.1 1.0 <2.0 506
2015 369 1.0 1.2 1.0 <2.0 3
Outflow
1979–1993 334 23.0 7.7 32.5 <2.0 1290 1994–2004 307 15.2 5.6 13.0 2.0 217 2005–2014 226 3.5 5.6 2.0 <2.0 461
2015 26 1.1 1.5 1.0 <2.0 3
Rim
1979–1993 96 33.5 6.7 39.5 <2.0 408 1994–2004 485 27.8 6.3 34.0 <2.0 190 2005–2014 306 38.2 7.2 46.5 2.0 544
2015 --- --- --- --- --- ---
WCA-2
Inflow
1979–1993 460 36.7 7.1 44.0 <2.0 1290 1994–2004 722 14.9 5.7 13.0 2.0 217 2005–2014 940 2.4 3.9 2.0 <2.0 190
2015 156 1.2 1.8 1.0 <2.0 11
Interior
1979–1993 2007 4.0 5.9 2.0 <2.0 1967 1994–2004 1817 4.3 5.5 4.0 <2.0 960 2005–2014 2373 1.7 2.7 1.0 <2.0 186
2015 280 1.2 1.9 1.0 <2.0 15
Outflow
1979–1993 587 6.1 5.6 5.0 <2.0 345 1994–2004 435 5.4 4.0 5.0 2.0 74 2005–2014 512 1.6 2.5 1.0 <2.0 31
2015 55 1.3 1.9 1.0 <2.0 6
WCA-3
Inflow
1979–1993 1276 11.7 7.0 13.0 <2.0 596 1994–2004 2159 10.0 5.5 9.0 2.0 265 2005–2014 2656 2.7 4.5 2.0 <2.0 153
2015 396 2.0 4.4 1.0 <2.0 228
Interior
1979–1993 592 1.8 3.2 1.0 <2.0 142 1994–2004 1922 1.7 2.9 2.0 <2.0 85 2005–2014 2025 1.5 2.0 1.0 <2.0 39
2015 179 1.1 1.6 1.0 <2.0 12
Outflow
1979–1993 1348 2.8 3.3 2.0 <2.0 116 1994–2004 1434 2.8 2.7 2.0 2.0 23 2005–2014 3168 1.3 1.9 1.0 <2.0 23
2015 334 1.0 1.2 1.0 <2.0 2
ENP
Inflow
1979–1993 1633 2.7 3.0 2.0 <2.0 77 1994–2004 1897 2.7 2.7 2.0 2.0 49 2005–2014 4827 1.3 1.7 1.0 <2.0 23
2015 590 1.0 1.2 1.0 <2.0 2
Interior
1979–1993 509 2.6 2.7 2.0 2.0 63 1994–2004 935 2.5 2.5 2.0 2.0 45 2005–2014 1097 1.4 2.0 1.0 <2.0 19
2015 125 1.1 1.4 1.0 <2.0 3
2016 South Florida Environmental Report Chapter 3A
3A-41
Since WY2007, annual geometric mean OP concentrations for interior locations have been low, with concentrations being less than 2.0 µg/L for all areas (Figure 3A-16). Sustained reduction of OP concentrations for both inflow and interior sites over the past several water years shows the continued recovery from the recent extreme climatic events, preferential removal of OP by the Everglades STAs, and effects of restoration activities to improve the overall phosphorus conditions in the interior marsh areas.
Total Nitrogen Concentrations Elevated concentrations of nitrogen in freshwater ecosystems are of concern due to the role of
nitrogen in eutrophication of freshwater systems, the effect on the oxygen content of receiving waters, and its potential toxicity to aquatic invertebrate and vertebrate species (Kadlec and Wallace, 2009, Saunders and Kalff 2001). However, the EPA and the greater Everglades ecosystem in general is a phosphorus-limited system, which means the growth of algae and macrophytes are limited by the quantity of the phosphorus input into the system. When nitrogen is limited, biota can offset this nitrogen limitation through fixation of atmospheric N2 (Noe et al. 2001).
One of the primary objectives of this chapter is to document temporal changes in TN concentrations across the EPA using long-term geometric means concentrations. Unlike TP, the concentration of TN in surface waters is not measured directly but is calculated as the sum of total Kjeldahl nitrogen (organic nitrogen + ammonia) and nitrite plus nitrate (NOx). The TN values for this chapter were calculated only for those samples for which both total Kjeldahl nitrogen and NOx results were available. Table 3A-9 provides a summary of the TN concentrations measured in the different portions of the EPA during the Baseline, Phase I, and Phase II periods, as well as WY2015.
As in previous years, TN concentrations during WY2015 exhibited a general north-to-south spatial gradient across the EPA (Figure 3A-16). This gradient likely reflects the higher concentrations associated with discharges to the northern portions of the system from agricultural areas and Lake Okeechobee. A gradual reduction in TN concentrations results from the assimilative processes in the marsh as water flows southward. The north-to-south gradient is apparent for inflow regions within the EPA with the highest geometric mean TN concentrations being observed in LNWR (1.8 mg/L), followed by WCA-2 (1.6 mg/L), WCA-3 (1.4 mg/L), and ENP inflows (1.0 mg/L). Interior geometric mean TN concentrations were reduced relative to inflow concentration within each region of the EPA most likely due to marsh assimilation. During WY2015, interior concentrations generally followed the north-to-south gradient with WCA-2 experiencing the highest geometric mean TN concentration of 1.5 mg/L, followed by LNWR (1.1 mg/L), WCA-3 (1.3 mg/L), and ENP (1.0 mg/L). In interior portions of the EPA, biota (i.e., bacteria, algae, and macrophytes) are generally highly limited by phosphorus but may become nitrogen-limited in areas enriched with phosphorus, such as areas in close proximity to canals and impacted areas (Noe et al. 2001). Therefore, assimilation of TN within WCA-2 marsh could be limited due to the relatively large portion of impacted areas (i.e., high phosphorus concentration). Since the implementation and enforcement of BMPs, changes in water management, and optimization of the Everglades STAs, the marsh condition within WCA-2 has improved. This is apparent as indicated by marsh phosphorus concentrations (see above) and the TP rule assessment (Appendix 3A-6) within WCA-2. Improvement of the marsh condition is also apparent in terms of interior geometric mean TN concentrations within WCA-2, with a steady decline in TN concentrations observed throughout the assessment periods (Table 3A-9). This improvement is not just isolated to WCA-2 but the entire EPA.
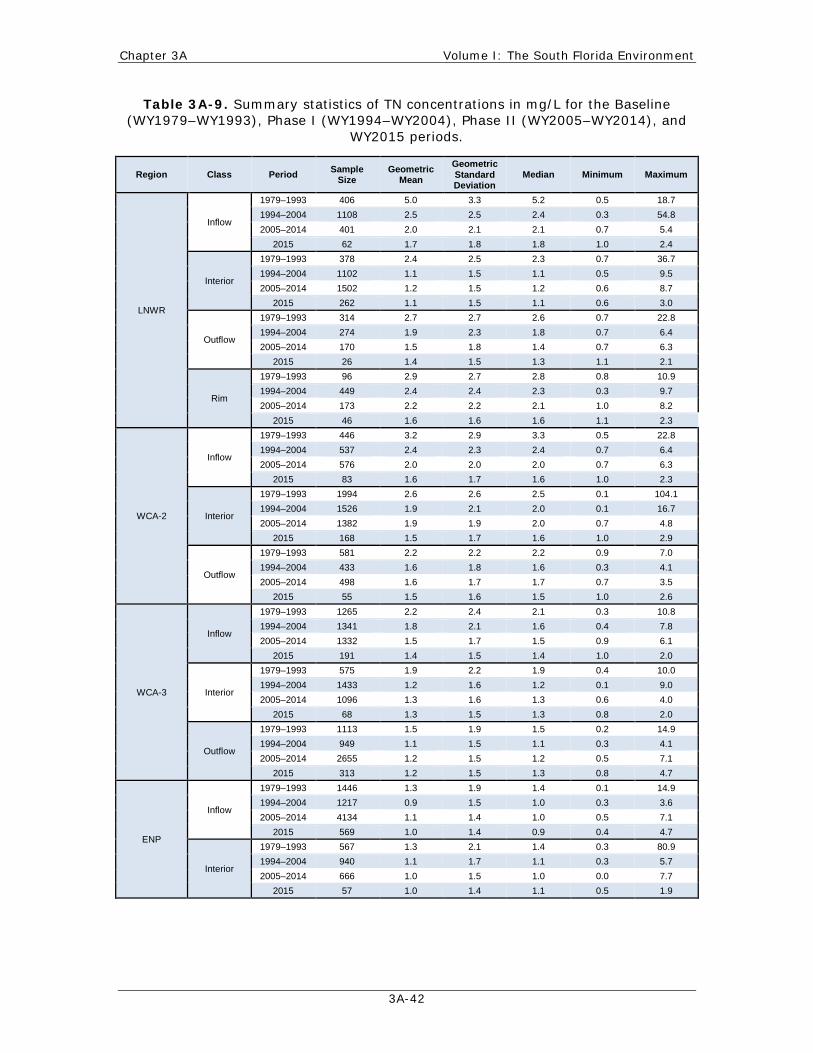
Chapter 3A Volume I: The South Florida Environment
3A-42
Table 3A-9. Summary statistics of TN concentrations in mg/L for the Baseline (WY1979–WY1993), Phase I (WY1994–WY2004), Phase II (WY2005–WY2014), and
WY2015 periods.
Region Class Period Sample Size
Geometric Mean
Geometric Standard Deviation
Median Minimum Maximum
LNWR
Inflow
1979–1993 406 5.0 3.3 5.2 0.5 18.7 1994–2004 1108 2.5 2.5 2.4 0.3 54.8 2005–2014 401 2.0 2.1 2.1 0.7 5.4
2015 62 1.7 1.8 1.8 1.0 2.4
Interior
1979–1993 378 2.4 2.5 2.3 0.7 36.7 1994–2004 1102 1.1 1.5 1.1 0.5 9.5 2005–2014 1502 1.2 1.5 1.2 0.6 8.7
2015 262 1.1 1.5 1.1 0.6 3.0
Outflow
1979–1993 314 2.7 2.7 2.6 0.7 22.8 1994–2004 274 1.9 2.3 1.8 0.7 6.4 2005–2014 170 1.5 1.8 1.4 0.7 6.3
2015 26 1.4 1.5 1.3 1.1 2.1
Rim
1979–1993 96 2.9 2.7 2.8 0.8 10.9 1994–2004 449 2.4 2.4 2.3 0.3 9.7 2005–2014 173 2.2 2.2 2.1 1.0 8.2
2015 46 1.6 1.6 1.6 1.1 2.3
WCA-2
Inflow
1979–1993 446 3.2 2.9 3.3 0.5 22.8 1994–2004 537 2.4 2.3 2.4 0.7 6.4 2005–2014 576 2.0 2.0 2.0 0.7 6.3
2015 83 1.6 1.7 1.6 1.0 2.3
Interior
1979–1993 1994 2.6 2.6 2.5 0.1 104.1 1994–2004 1526 1.9 2.1 2.0 0.1 16.7 2005–2014 1382 1.9 1.9 2.0 0.7 4.8
2015 168 1.5 1.7 1.6 1.0 2.9
Outflow
1979–1993 581 2.2 2.2 2.2 0.9 7.0 1994–2004 433 1.6 1.8 1.6 0.3 4.1 2005–2014 498 1.6 1.7 1.7 0.7 3.5
2015 55 1.5 1.6 1.5 1.0 2.6
WCA-3
Inflow
1979–1993 1265 2.2 2.4 2.1 0.3 10.8 1994–2004 1341 1.8 2.1 1.6 0.4 7.8 2005–2014 1332 1.5 1.7 1.5 0.9 6.1
2015 191 1.4 1.5 1.4 1.0 2.0
Interior
1979–1993 575 1.9 2.2 1.9 0.4 10.0 1994–2004 1433 1.2 1.6 1.2 0.1 9.0 2005–2014 1096 1.3 1.6 1.3 0.6 4.0
2015 68 1.3 1.5 1.3 0.8 2.0
Outflow
1979–1993 1113 1.5 1.9 1.5 0.2 14.9 1994–2004 949 1.1 1.5 1.1 0.3 4.1 2005–2014 2655 1.2 1.5 1.2 0.5 7.1
2015 313 1.2 1.5 1.3 0.8 4.7
ENP
Inflow
1979–1993 1446 1.3 1.9 1.4 0.1 14.9 1994–2004 1217 0.9 1.5 1.0 0.3 3.6 2005–2014 4134 1.1 1.4 1.0 0.5 7.1
2015 569 1.0 1.4 0.9 0.4 4.7
Interior
1979–1993 567 1.3 2.1 1.4 0.3 80.9 1994–2004 940 1.1 1.7 1.1 0.3 5.7 2005–2014 666 1.0 1.5 1.0 0.0 7.7
2015 57 1.0 1.4 1.1 0.5 1.9
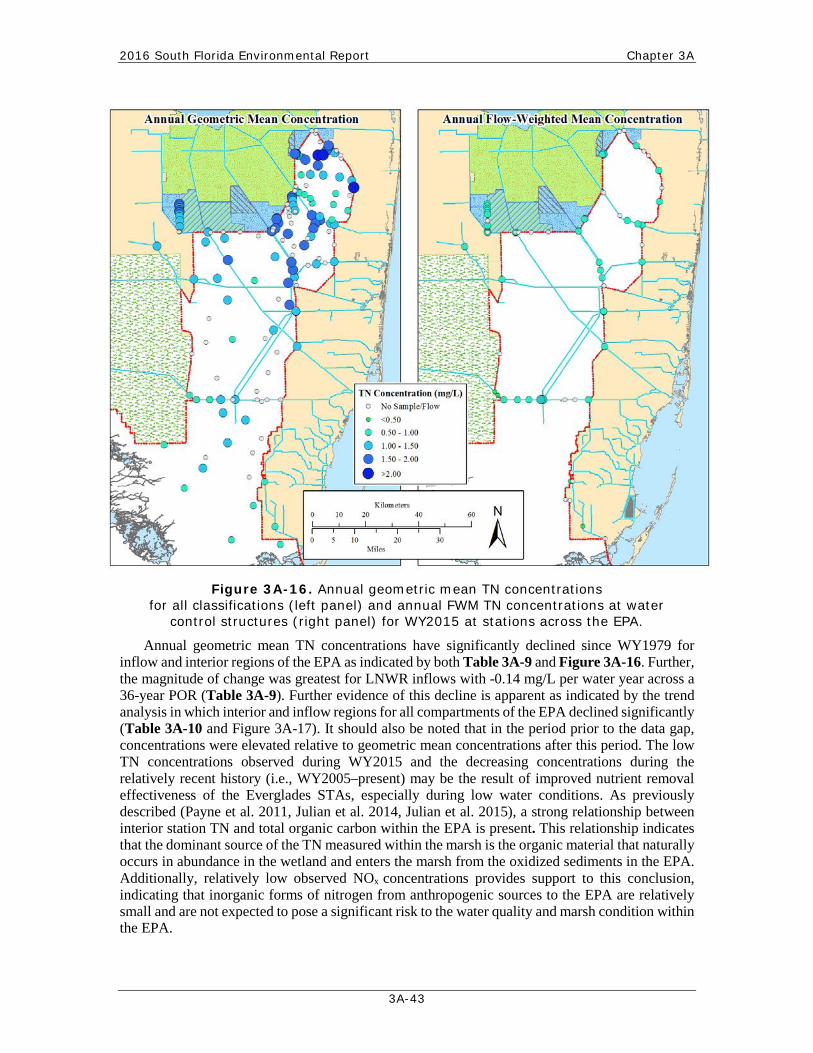
2016 South Florida Environmental Report Chapter 3A
3A-43
Figure 3A-16. Annual geometric mean TN concentrations for all classifications (left panel) and annual FWM TN concentrations at water
control structures (right panel) for WY2015 at stations across the EPA.
Annual geometric mean TN concentrations have significantly declined since WY1979 for inflow and interior regions of the EPA as indicated by both Table 3A-9 and Figure 3A-16. Further, the magnitude of change was greatest for LNWR inflows with -0.14 mg/L per water year across a 36-year POR (Table 3A-9). Further evidence of this decline is apparent as indicated by the trend analysis in which interior and inflow regions for all compartments of the EPA declined significantly (Table 3A-10 and Figure 3A-17). It should also be noted that in the period prior to the data gap, concentrations were elevated relative to geometric mean concentrations after this period. The low TN concentrations observed during WY2015 and the decreasing concentrations during the relatively recent history (i.e., WY2005–present) may be the result of improved nutrient removal effectiveness of the Everglades STAs, especially during low water conditions. As previously described (Payne et al. 2011, Julian et al. 2014, Julian et al. 2015), a strong relationship between interior station TN and total organic carbon within the EPA is present. This relationship indicates that the dominant source of the TN measured within the marsh is the organic material that naturally occurs in abundance in the wetland and enters the marsh from the oxidized sediments in the EPA. Additionally, relatively low observed NOx concentrations provides support to this conclusion, indicating that inorganic forms of nitrogen from anthropogenic sources to the EPA are relatively small and are not expected to pose a significant risk to the water quality and marsh condition within the EPA.
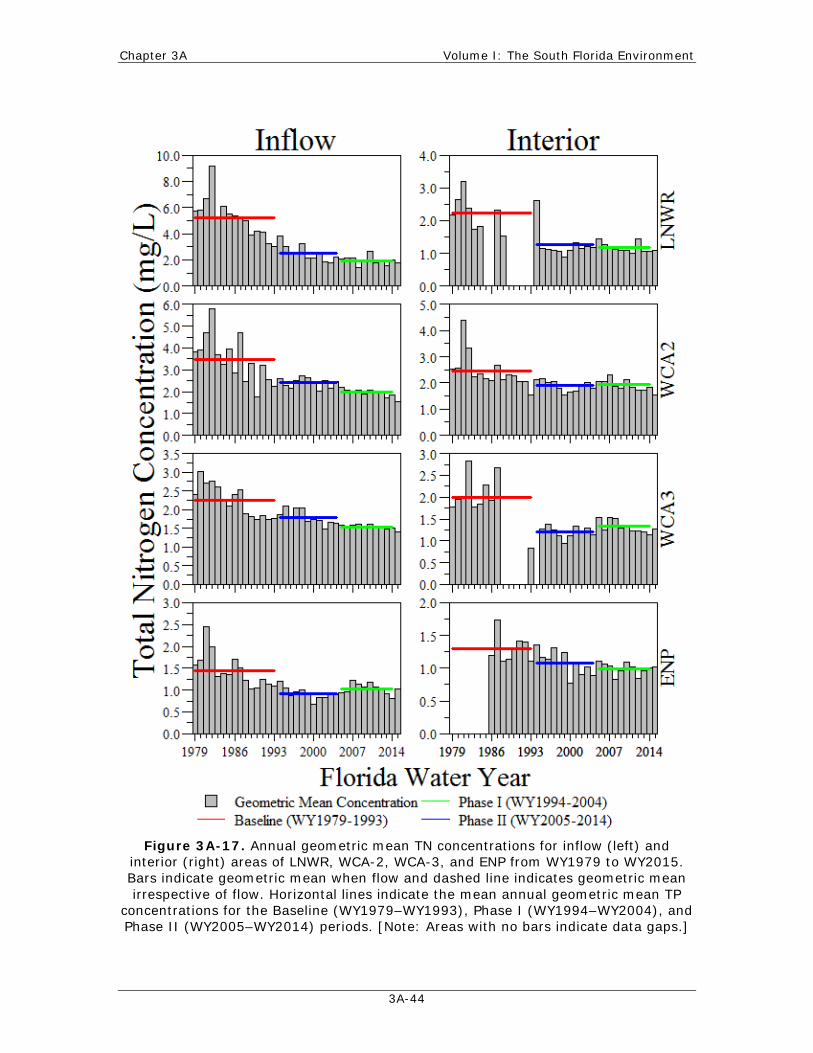
Chapter 3A Volume I: The South Florida Environment
3A-44
Figure 3A-17. Annual geometric mean TN concentrations for inflow (left) and interior (right) areas of LNWR, WCA-2, WCA-3, and ENP from WY1979 to WY2015. Bars indicate geometric mean when flow and dashed line indicates geometric mean irrespective of flow. Horizontal lines indicate the mean annual geometric mean TP
concentrations for the Baseline (WY1979–WY1993), Phase I (WY1994–WY2004), and Phase II (WY2005–WY2014) periods. [Note: Areas with no bars indicate data gaps.]
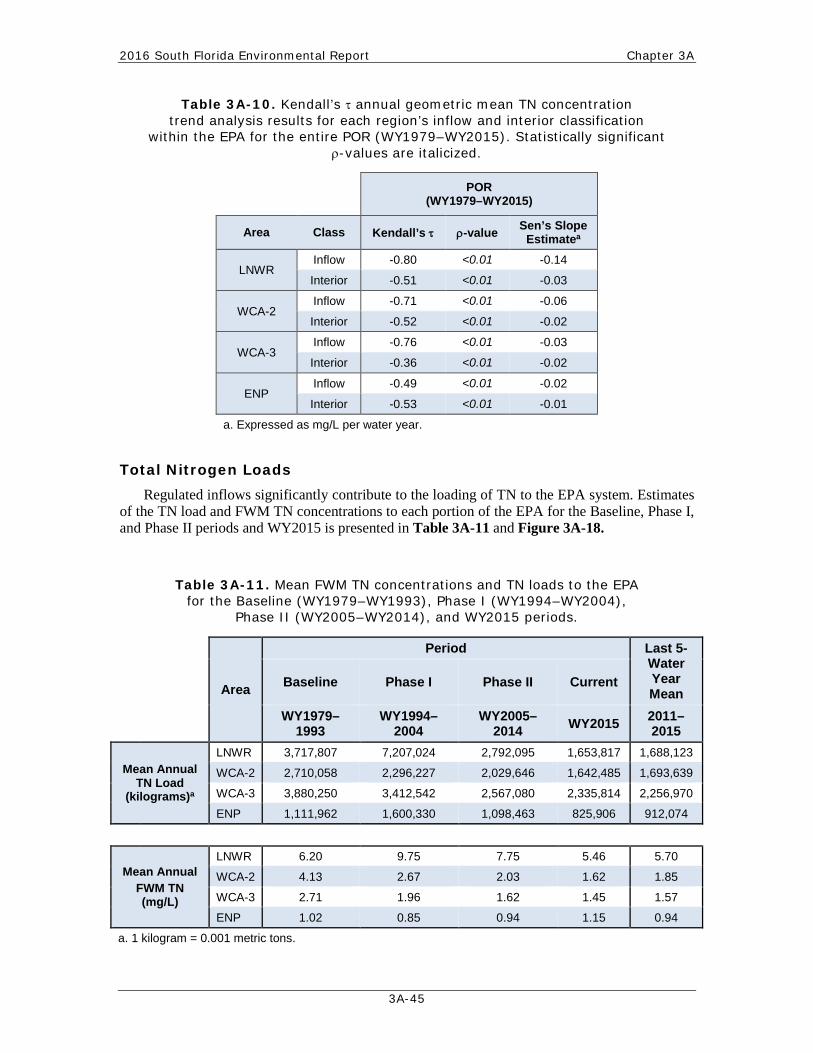
2016 South Florida Environmental Report Chapter 3A
3A-45
Table 3A-10. Kendall’s τ annual geometric mean TN concentration trend analysis results for each region’s inflow and interior classification
within the EPA for the entire POR (WY1979–WY2015). Statistically significant ρ-values are italicized.
POR (WY1979–WY2015)
Area Class Kendall’s τ ρ-value Sen’s Slope Estimatea
LNWR Inflow -0.80 <0.01 -0.14
Interior -0.51 <0.01 -0.03
WCA-2 Inflow -0.71 <0.01 -0.06
Interior -0.52 <0.01 -0.02
WCA-3 Inflow -0.76 <0.01 -0.03
Interior -0.36 <0.01 -0.02
ENP Inflow -0.49 <0.01 -0.02
Interior -0.53 <0.01 -0.01
a. Expressed as mg/L per water year.
Total Nitrogen Loads Regulated inflows significantly contribute to the loading of TN to the EPA system. Estimates
of the TN load and FWM TN concentrations to each portion of the EPA for the Baseline, Phase I, and Phase II periods and WY2015 is presented in Table 3A-11 and Figure 3A-18.
Table 3A-11. Mean FWM TN concentrations and TN loads to the EPA for the Baseline (WY1979–WY1993), Phase I (WY1994–WY2004),
Phase II (WY2005–WY2014), and WY2015 periods.
Area
Period Last 5-Water Year Mean
Baseline Phase I Phase II Current
WY1979–
1993 WY1994–
2004 WY2005–
2014 WY2015 2011–2015
Mean Annual TN Load
(kilograms)a
LNWR 3,717,807 7,207,024 2,792,095 1,653,817 1,688,123
WCA-2 2,710,058 2,296,227 2,029,646 1,642,485 1,693,639
WCA-3 3,880,250 3,412,542 2,567,080 2,335,814 2,256,970
ENP 1,111,962 1,600,330 1,098,463 825,906 912,074
Mean Annual FWM TN (mg/L)
LNWR 6.20 9.75 7.75 5.46 5.70
WCA-2 4.13 2.67 2.03 1.62 1.85
WCA-3 2.71 1.96 1.62 1.45 1.57
ENP 1.02 0.85 0.94 1.15 0.94
a. 1 kilogram = 0.001 metric tons.

Chapter 3A Volume I: The South Florida Environment
3A-46
In addition to inflow, atmospheric deposition contributes to the TN loading into the EPA. Atmospheric deposition is an important source of nutrients to oligotrophic ecosystems, furthermore meteorological conditions of South Florida are ideal for atmospheric deposition in that rainfall can scavenge aerosolized nitrogen from the atmosphere (Sutula et al., 2001). Atmospheric deposition rates can be highly variable ranging from approximately 0.005 grams per square meter per year (g/m2/yr) nitrogen in remote areas to > 2 g/m2/yr nitrogen in urban areas (Galloway et al. 2004). Since atmosphere TN deposition is highly variable and very expensive to monitor, routine monitoring is not conducted. Inglett et al. (2011) reported a TN deposition rate to the Everglades of 0.48 g/m2/yr nitrogen. This atmospheric deposition estimate does not address the influence of traffic density of the highways near or transecting the EPA (i.e., I-75, US-41, SR-27, etc.). Motor vehicle traffic is a very important source of atmospheric deposition of NOx and is influenced by traffic density (Jimenez et al. 2000). However with improved mileage mandated by the USEPA, the NOx emission rate will be potentially reduced.
Annual TN loads from surface water sources, including internal transfers within the EPA (i.e., LNWR to WCA-2 and WCA-2 to WCA-3) were 5,632 metric tons (5,632,116 kilograms per year (kg/yr)], with a FWM TN concentration of 1.93 mg/L during WY2015. Using the estimated TN deposition rate provided by Inglett et al. (2011), the northern portion of the EPA (i.e., LNWR, WCA-2, and WCA-3) can potentially receive up to 1,677 metric tons per year (metric tons/yr) of TN (1,676,922 kg/yr) from atmospheric deposition. In WY2015, discharges from the northern EPA account for 2,557 metric tons/yr (2,557,129 kg/yr) of TN, with a FWM TN concentration of 1.35 mg/L. The difference between total inflow and outflow load (1,565 metric tons TN, respectively) indicates that uptake and assimilation of nitrogen is occurring within the natural communities of the EPA, even though the surface water load is greater than the atmospheric deposition load. In comparison to last water years TN load (8,063 metric tons), WY2015 experienced 23 percent decrease in TN inflow load. This decrease is most likely was due to the decrease in surface water flows and atmospheric inputs.
During WY2015, annual TN loads from surface waters to ENP were 826 metric tons (825,906 kg/yr), with a FWM TN concentration of 1.15 mg/L. Based on the atmospheric deposition rate provided by Inglett et al. (2011), ENP can potentially receive up to 2,987 metric tons/yr of TN (2,986,506 kg/yr) from atmospheric deposition. Since the last water year, ENP observed a 13 percent increase in TN surface water inflow loads, while flows were lower during WY2015 relative to WY2014; this increase could be attributed to operational changes to the system.
As stated previously, mean flow and load to the EPA have been highly influence by climate extremes in past years. The annual TN load to LNWR was 1,653 metric tons during WY2015, representing a 22 percent decrease in TN inflow compared to WY2014 (2,416 metric tons). This trend is consistent for WCA-2 and WCA-3. WCA-2 received 1,642 metric tons during WY2015, representing a 32 percent decrease in TN inflow load compared to WY2014 (2,418 metric tons). WCA-3 received 2,336 metric tons during WY2015, representing a 16 percent decrease in TN inflow load from the previous water year (2,767 metric tons).
2016 South Florida Environmental Report Chapter 3A
3A-47
Figure 3A-18. Annual inflow TN loads for LNWR, WCA-2, WCA-3, and ENP from
WY1979 to WY2015. Horizontal lines indicate the mean annual loads and flows for the Baseline (WY1979–WY1993), Phase I (WY1994–WY2004), and Phase II
(WY2005–WY2014) periods. [Note that during WY1997 and WY1998, LNWR annual TN load reached 32,838 and 12,207 metric tons, respectively, which is outside the
current scale.]
Chapter 3A Volume I: The South Florida Environment
3A-48
LITERATURE CITED
Armstrong, D.A., D. Chippendale, A.W. Knight and J.E. Colt. 1978. Interaction of ionized and un-ionized ammonia on short-term survival and growth of prawn larvae, Macrobrachium rosenbergii. Biological Bulletin 154:15-31.
Bancroft, G.T., W. Hoffman, R.J. Sawicki and J.C. Ogden. 1992. The importance of the Water Conservation Areas in the Everglades to the endangered wood stork (Mycteria americana). Conservation Biology 6(3):392-398.
FDEP. 2013. Technical Support Document: Derivation of Dissolved Oxygen Criteria to Protection Aquatic Life in Florida’s Fresh and Marine Waters. DEP-SAS-001/13, Florida Department of Environmental Protection, Tallahassee, FL.
Galloway, J.N., F.J. Dentener, D.G. Capone, E.W. Boyer, R.W. Howarth, S.P. Seitzinger, G.P. Asner, C.C. Cleveland, P.A. Green, E.A. Holland, D.M. Karl, A.F. Michaels, J.H. Porter, A.R. Townsend and C.J. Vorosmarty. 2004. Nitrogen cycles: Past, present, and future. Biogeochemistry 70:153-226.
Hampson, B.L. 1977. Relationship between total ammonia and free ammonia in terrestrial and ocean waters. ICES Journal of Marine Science 37(2):117-122.
Inglett, P.W., V.H. Rivera-Monroy and J.R. Wozniak. 2011. Biogeochemistry of nitrogen across the Everglades landscape. Critical Reviews in Environmental Science and Technology 41(S1):187-216.
Jimenez, J.L., J.B. McManus, J.H. Shorter, D.D. Nelson, M.S. Zahniser, M. Koplow, G.J. McRae and C.E. Kolb. 2000. Cross road and mobile tunable infrared laser measurements of nitrous oxide emissions from motor vehicles. Chemosphere – Global Change Science 2:397-412.
Julian II, P. 2015. Appendix 3A-6: Water Year 2010-2014 Annual Total Phosphorus Criteria Compliance Assessment. In: 2015 South Florida Environmental Report – Volume I, South Florida Water Management District West Palm Beach, FL
Julian II, P., G. Payne and S. Xue. 2014. Chapter 3A: Status of Water Quality in the Everglades Protection Area. In: 2014 South Florida Environmental Report – Volume I, South Florida Water Management District, West Palm Beach, FL.
Julian II, P., G. Payne and S. Xue. 2015. Chapter 3A: Status of Water Quality in the Everglades Protection Area. In: 2015 South Florida Environmental Report – Volume I, South Florida Water Management District, West Palm Beach, FL.
Kadlec, R.H. and S.D. Wallace. 2009. Treatment Wetlands, 2nd Edition. CRC Press, Boca Raton, FL.
Krest, J.M. and J.W. Harvey. 2003. Using natural distributions of short-lived radium isotopes to quantify groundwater discharge and recharge. Limnology and Oceanography 48(1):290-298.
McCormick, P., S. Newman, S. Miao, R. Reddy, D. Gawlik, C. Fitz, T. Fontaine and D. Marley. 1999. Chapter 3: Ecological Needs of the Everglades. In: Everglades Interim Report, South Florida Water Management District, West Palm Beach, FL.
Miller, G.E. 2003. Everglades Protection Area Tributary Basins Long-Term Plan for Achieving Water Quality Goals (Final). South Florida Water Management District, West Palm Beach, FL.
2016 South Florida Environmental Report Chapter 3A
3A-49
Neil, L.L., R. Fotedar and C.C. Shelly. 2005. Effects of acute and chronic toxicity of unionized ammonia on mud crab, Scylla serrata (Forsskål, 1755) larvae. Aquaculture Research 36:927-932.
Noe, G.B., D.L. Childers and R.D. Jones. 2001. Phosphorus biogeochemistry and the impact of phosphorus enrichment: Why is the Everglades so unique? Ecosystems 4:603-624.
Pascoe, D., S.A. Evans and J. Woodworth. 1986. Heavy Metal Toxicity to Fish and the Influence of Water Hardness. Archives of Environmental Contamination and Toxicology 15:481-487.
Payne, G. and S. Xue. 2012. Chapter 3A: Status of Water Quality in the Everglades Protection Area. In: 2011 South Florida Environmental Report – Volume I, South Florida Water Management District, West Palm Beach, FL.
Payne, G., K. Weaver and S. Xue. 2007. Chapter 3C: Status of Phosphorus and Nitrogen in the Everglades Protection Area. In: 2007 South Florida Environmental Report – Volume I, South Florida Water Management District, West Palm Beach, FL.
Payne, G., S. Xue, K. Hallas and K. Weaver. 2011. Chapter 3A: Status of Water Quality in the Everglades Protection Area. In: 2011 South Florida Environmental Report – Volume I, South Florida Water Management District, West Palm Beach, FL.
Pfeuffer, R.J. 1985. Pesticide Residue Monitoring in Sediment and Surface Water within the South Florida Water Management District. Technical Publication 85-2, DRE 214, South Florida Water Management District, West Palm Beach, FL.
Pfeuffer, R.J. and G.M. Rand. 2004. South Florida Ambient Pesticide Monitoring Program. Ecotoxicology 13:195-205.
Redfield, G. 2002. Atmospheric Deposition Phosphorus: Concepts, Constraints and Published Deposition Rates for Ecosystem Management. Technical Publication EMA 403, South Florida Water Management District, West Palm Beach, FL.
Saunders, D.L. and J. Kalff. 2001. Nitrogen retention in wetlands, lakes and rivers. Hydrobiologia 443:205-212.
Thurston, R. and R.C. Russo. 1981. Ammonia toxicity to fishes. Effect of pH on the toxicity of the un-ionized ammonia species. Environmental Science and Technology 15(7):837-840.
SFWMD. 2012. Restoration Strategies Regional Water Quality Plan. South Florida Water Management District, West Palm Beach, FL.
SFWMD. 2015. Field Sampling Quality Manual. SFWMD-FIELD-QM-001-08.2, South Florida Water Management District, West Palm Beach, FL.
Sutula, M., J.W. Day, J. Cable and D. Rudnick. 2001. Hydrological and nutrient budgets of freshwater and estuarine wetlands of Taylor Slough in southern Everglades, Florida (U.S.A.). Biogeochemistry 56(3):287-310.
USACE and SFWMD. 1999. Central and Southern Florida Project Comprehensive Review Study. Final Integrated Feasibility Report and Programmatic Environmental Impact Statement. United States Army Corps of Engineers, Jacksonville, FL and South Florida Water Management District, West Palm Beach, FL.
Chapter 3A Volume I: The South Florida Environment
3A-50
USEPA. 1997. Guidelines for Preparation of the Comprehensive State Water Quality Assessments. EPA-841-B-97-003A and 002B, United States Environmental Protection Agency, Washington, DC.
USEPA. 2002. Consolidated Assessment and Listing Methodology, First Edition. United States Environmental Protection Agency, Washington, DC.
Weaver, K. 2004. Everglades Marsh Dissolved Oxygen Site-Specific Alternative Criterion Technical Support Document. Water Quality Standards and Special Projects Program, Division of Water Resource Management, Florida Department of Environmental Protection, Tallahassee, FL.
Weaver, K. 2001. Appendix 4-4: Evaluation of Chronic Toxicity Based Guidelines for Pesticides and Priority Pollutants in the Florida Everglades. In: 2001 Everglades Consolidated Report, South Florida Water Management District, West Palm Beach, FL.
Weaver, K. and G. Payne. 2005. Chapter 2A: Status of Water Quality in the Everglades Protection Area. In: 2005 South Florida Environmental Report – Volume I, South Florida Water Management District, West Palm Beach, FL.