Embed Size (px)
Citation preview
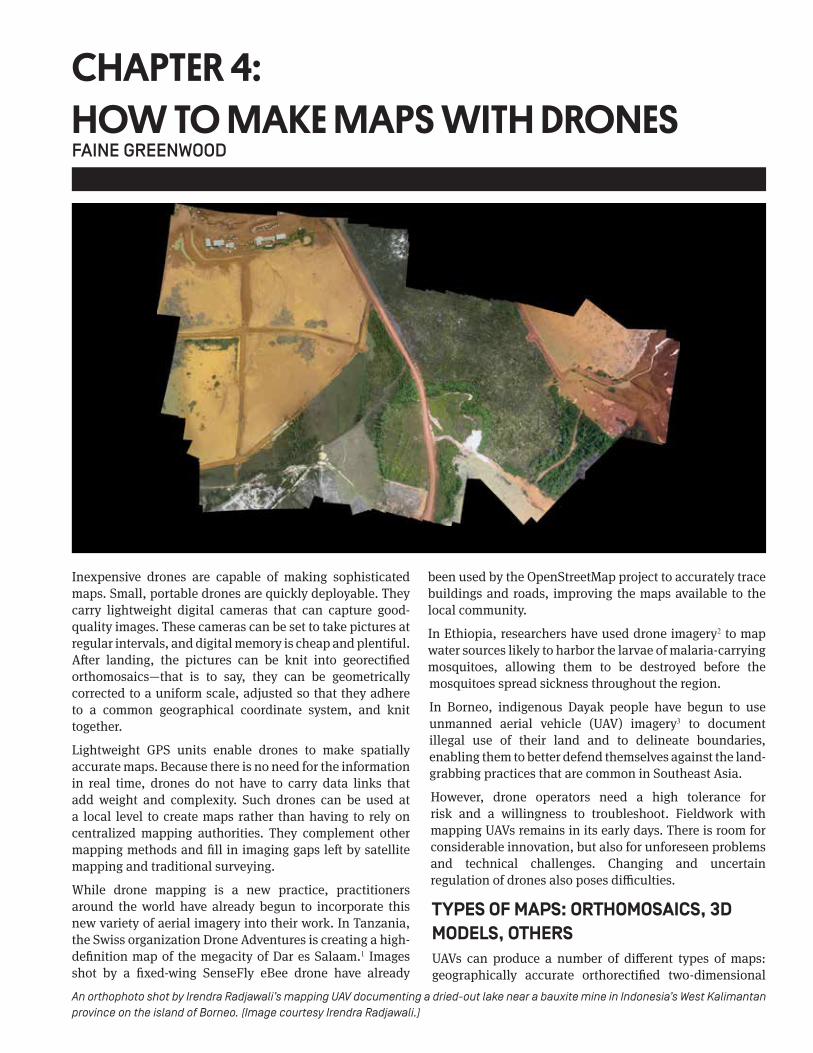
An orthophoto shot by Irendra Radjawali’s mapping UAV documenting a dried-out lake near a bauxite mine in Indonesia’s West Kalimantan province on the island of Borneo. (Image courtesy Irendra Radjawali.)
Inexpensive drones are capable of making sophisticated maps. Small, portable drones are quickly deployable. They carry lightweight digital cameras that can capture good-quality images. These cameras can be set to take pictures at regular intervals, and digital memory is cheap and plentiful. After landing, the pictures can be knit into georectified orthomosaics—that is to say, they can be geometrically corrected to a uniform scale, adjusted so that they adhere to a common geographical coordinate system, and knit together.
Lightweight GPS units enable drones to make spatially accurate maps. Because there is no need for the information in real time, drones do not have to carry data links that add weight and complexity. Such drones can be used at a local level to create maps rather than having to rely on centralized mapping authorities. They complement other mapping methods and fill in imaging gaps left by satellite mapping and traditional surveying.
While drone mapping is a new practice, practitioners around the world have already begun to incorporate this new variety of aerial imagery into their work. In Tanzania, the Swiss organization Drone Adventures is creating a high-definition map of the megacity of Dar es Salaam.1 Images shot by a fixed-wing SenseFly eBee drone have already
been used by the OpenStreetMap project to accurately trace buildings and roads, improving the maps available to the local community.
In Ethiopia, researchers have used drone imagery2 to map water sources likely to harbor the larvae of malaria-carrying mosquitoes, allowing them to be destroyed before the mosquitoes spread sickness throughout the region.
In Borneo, indigenous Dayak people have begun to use unmanned aerial vehicle (UAV) imagery3 to document illegal use of their land and to delineate boundaries, enabling them to better defend themselves against the land-grabbing practices that are common in Southeast Asia.
However, drone operators need a high tolerance for risk and a willingness to troubleshoot. Fieldwork with mapping UAVs remains in its early days. There is room for considerable innovation, but also for unforeseen problems and technical challenges. Changing and uncertain regulation of drones also poses difficulties.
TYPES OF MAPS: ORTHOMOSAICS, 3D MODELS, OTHERS UAVs can produce a number of different types of maps: geographically accurate orthorectified two-dimensional
CHAPTER 4:HOW TO MAKE MAPS WITH DRONESFAINE GREENWOOD
36 DRONES AND AERIAL OBSERVATION
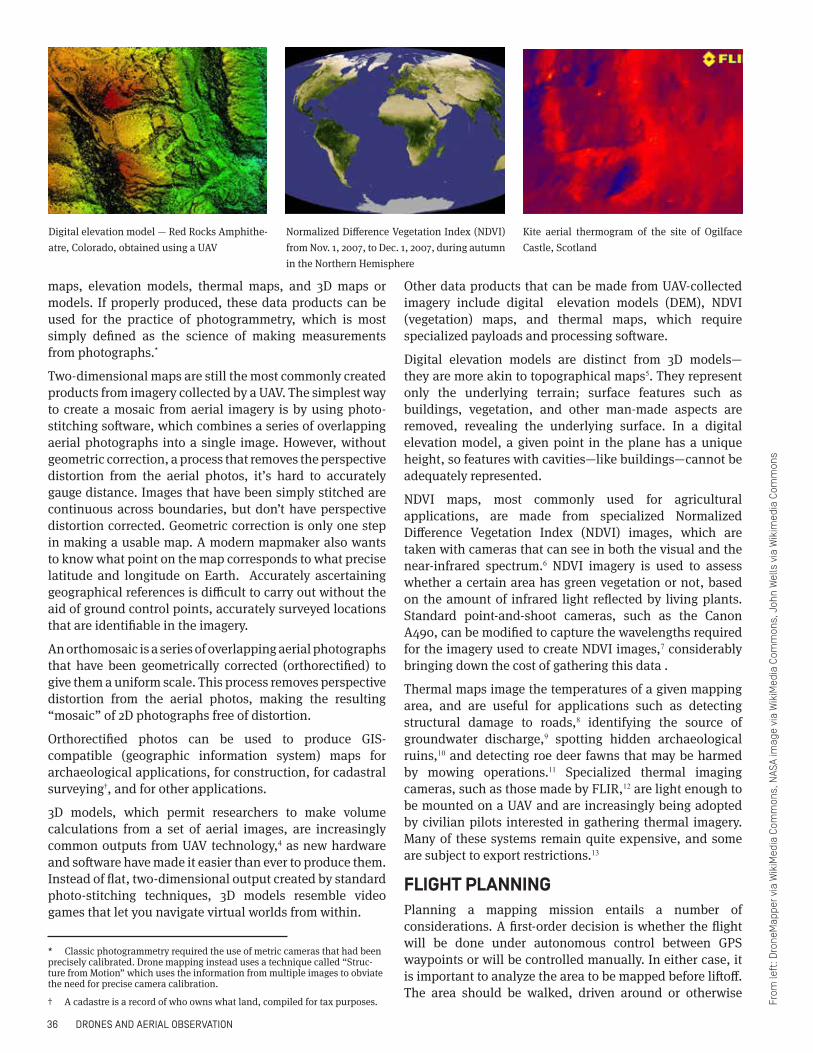
maps, elevation models, thermal maps, and 3D maps or models. If properly produced, these data products can be used for the practice of photogrammetry, which is most simply defined as the science of making measurements from photographs.*
Two-dimensional maps are still the most commonly created products from imagery collected by a UAV. The simplest way to create a mosaic from aerial imagery is by using photo-stitching software, which combines a series of overlapping aerial photographs into a single image. However, without geometric correction, a process that removes the perspective distortion from the aerial photos, it’s hard to accurately gauge distance. Images that have been simply stitched are continuous across boundaries, but don’t have perspective distortion corrected. Geometric correction is only one step in making a usable map. A modern mapmaker also wants to know what point on the map corresponds to what precise latitude and longitude on Earth. Accurately ascertaining geographical references is difficult to carry out without the aid of ground control points, accurately surveyed locations that are identifiable in the imagery.
An orthomosaic is a series of overlapping aerial photographs that have been geometrically corrected (orthorectified) to give them a uniform scale. This process removes perspective distortion from the aerial photos, making the resulting “mosaic” of 2D photographs free of distortion.
Orthorectified photos can be used to produce GIS-compatible (geographic information system) maps for archaeological applications, for construction, for cadastral surveying†, and for other applications.
3D models, which permit researchers to make volume calculations from a set of aerial images, are increasingly common outputs from UAV technology,4 as new hardware and software have made it easier than ever to produce them. Instead of flat, two-dimensional output created by standard photo-stitching techniques, 3D models resemble video games that let you navigate virtual worlds from within.
* Classic photogrammetry required the use of metric cameras that had been precisely calibrated. Drone mapping instead uses a technique called “Struc-ture from Motion” which uses the information from multiple images to obviate the need for precise camera calibration.
† A cadastre is a record of who owns what land, compiled for tax purposes.
Other data products that can be made from UAV-collected imagery include digital elevation models (DEM), NDVI (vegetation) maps, and thermal maps, which require specialized payloads and processing software.
Digital elevation models are distinct from 3D models—they are more akin to topographical maps5. They represent only the underlying terrain; surface features such as buildings, vegetation, and other man-made aspects are removed, revealing the underlying surface. In a digital elevation model, a given point in the plane has a unique height, so features with cavities—like buildings—cannot be adequately represented.
NDVI maps, most commonly used for agricultural applications, are made from specialized Normalized Difference Vegetation Index (NDVI) images, which are taken with cameras that can see in both the visual and the near-infrared spectrum.6 NDVI imagery is used to assess whether a certain area has green vegetation or not, based on the amount of infrared light reflected by living plants. Standard point-and-shoot cameras, such as the Canon A490, can be modified to capture the wavelengths required for the imagery used to create NDVI images,7 considerably bringing down the cost of gathering this data .
Thermal maps image the temperatures of a given mapping area, and are useful for applications such as detecting structural damage to roads,8 identifying the source of groundwater discharge,9 spotting hidden archaeological ruins,10 and detecting roe deer fawns that may be harmed by mowing operations.11 Specialized thermal imaging cameras, such as those made by FLIR,12 are light enough to be mounted on a UAV and are increasingly being adopted by civilian pilots interested in gathering thermal imagery. Many of these systems remain quite expensive, and some are subject to export restrictions.13
FLIGHT PLANNING Planning a mapping mission entails a number of considerations. A first-order decision is whether the flight will be done under autonomous control between GPS waypoints or will be controlled manually. In either case, it is important to analyze the area to be mapped before liftoff. The area should be walked, driven around or otherwise
From
left
: Dro
neM
appe
r via
Wik
iMed
ia C
omm
ons,
NAS
A im
age
via
Wik
iMed
ia C
omm
ons,
Joh
n W
ells
via
Wik
imed
ia C
omm
ons
Digital elevation model — Red Rocks Amphithe-atre, Colorado, obtained using a UAV
Normalized Difference Vegetation Index (NDVI) from Nov. 1, 2007, to Dec. 1, 2007, during autumn in the Northern Hemisphere
Kite aerial thermogram of the site of Ogilface Castle, Scotland
DRONES AND AERIAL OBSERVATION 37
evaluated before the mission starts so as to identify obstacles such as power lines, large trees, sensitive areas, or other potential pitfalls. Finally, it is good practice to use existing satellite imagery to plot out a flight before takeoff.
The decision of whether to use manual or autonomous control hinges on many factors, but perhaps the most important is to distinguish clearly between inspection or monitoring of events or conditions in real time, and gathering information in order to create a static record like a map or a 3D model after the flight is complete. Both types of missions can be flown in either manner, or indeed, in a hybrid of manual and automatic control, however, manual control is generally more useful for inspections (say beneath a bridge) that aim to react to information in real time, while autonomous control is, as a rule, more useful when one is trying to fly in a systematic pattern to create a map.
The majority of UAV mappers use autonomous control, though some pilots fly their missions entirely manually, relying on their own skill and judgment instead of trusting the computer. Pilots should know how to competently fly their UAV, even if they do plan to use it primarily for autonomous missions. UAVs should remain within the visual line of sight of pilots unless the pilots have sufficient experience, specific need, and regulatory approval to fly beyond their line of sight.*
* This is not a hard and fast rule; experience and need are certainly nec-essary conditions, but there may be circumstances under which regulatory approval is impossible but flight beyond the line of sight nevertheless makes
If something goes wrong with the autonomous system, the pilot should be able to take over manual control or engage an appropriate fail-safe, like an emergency parachute. At present, commercially available autopilots do not have sophisticated sense-and-avoid capabilities, and are limited to flying from one preset waypoint to another. (Algorithmic sense-and-avoid capabilities are, however, improving.)
Those who choose to fly their missions manually, in entirety or at least in part, say it is because software for autonomous flight is not always reliable under every condition. GPS interference, bad weather, or simple technical error can cause the UAV to behave erratically. Proponents of manual flight also note that it is easier to manually fly a UAV in particularly tight and unpredictable areas, such as below forest canopies or in busy urban areas, with manual control permitting changes in course and altitude to be made more quickly. Partisans of autopilots say that using an autopilot is in fact safer because it reduces the possibility of human error and of radio interference disrupting the signal between a manual controller on the ground and the drone.
Some countries require that UAV operators be able to take manual control at all times in case there is a software malfunction or other issue. It’s important to check the regulations in your planned area of operation before flying.
sense. So-called first-person view (FPV) systems that allow a drone operator to see from the drone’s perspective are growing in popularity. The capability of FPV systems for replacing direct visual observation is an area of acrimonious debate.
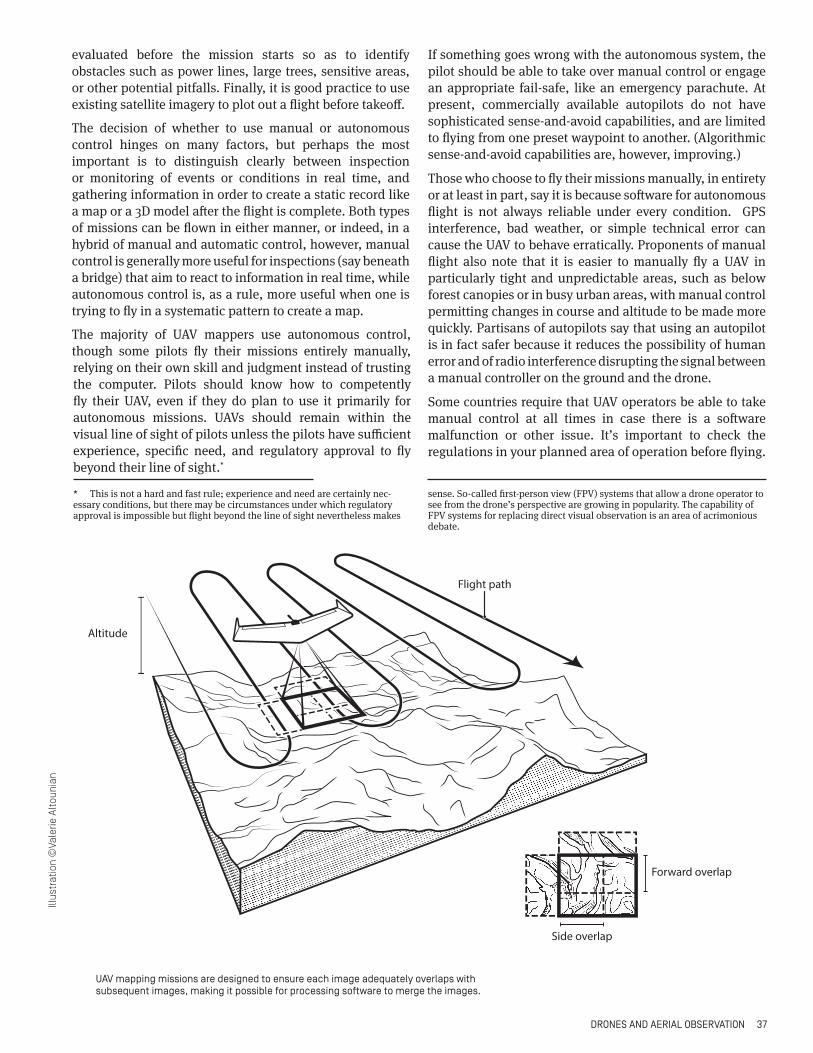
UAV mapping missions are designed to ensure each image adequately overlaps withsubsequent images, making it possible for processing software to merge the images.
Illust
ratio
n ©
Vale
rie A
ltoun
ian
Side overlap
Forward overlap
Altitude
Flight path
38 DRONES AND AERIAL OBSERVATION
DESIGNING A FLIGHT ROUTE The design of flight paths is an important component of UAV mapping. This is typically done using software packages; many drone manufacturers offer proprietary software with their drones. Mission Planner, an open-source software package, is the single most widely used solution. The functionality of several competing software packages is broadly similar.
UAV mapping missions are usually flown in a specific pattern of parallel lines, commonly described as “transects,” which are connected to a series of “waypoints”—think of a connect-the-dots pattern of parallel lines, or the pattern in which you might mow the lawn. A transect flight pattern is a method of ensuring that the UAV captures an adequate quantity of images that overlap to the degree required for the processing software to create a high-quality and accurate map.*
For maximum quality, some UAV mappers suggest flying two different overlapping patterns over the same area but at different heights.14 This method collects a large quantity of data and helps to resolve elevation variation problems, which result when tall geographic features throw off the scale of the rest of the image. Others recommend adjusting the altitude of the drone to keep a constant altitude above ground level, even as features on the ground vary in altitude.
To create a flight plan with transects using current software such as Mission Planner, the pilot first connects with the UAV’s flight controller via either a ground control radio attached by USB cable to a computer or tablet, or a direct USB link from the UAV to the computer.15 (Flight plans can also be generated on the computer and uploaded to the flight controller later). The pilot opens the software and defines an area to be mapped with a polygon, then specifies the camera model, the desired operational altitude, and how the camera will be triggered to take photographs.
Once these factors are entered, Mission Planner generates
* In some cases, one might want to map, say, a river or a road, in which case the flight pattern would be less of a grid and more of a single out-and-back path. Also, other applications in which covering a large area quickly is more important than systematic photograph overlap, for instance search and rescue, call for different patterns.
a series of transects with waypoints and displays the estimated ground sampling distance, required number of photographs, and other useful information. The user can then change the distance between each photo, the amount that photos will overlap, the altitude of operation, and other parameters. The software also attempts to compensate for the effects of wind.16
All these numbers can be experimented with before leaving for the flight area, making it relatively easy to plan. When complete, the mission file is saved to the computer and can also be saved to the UAV’s flight controller. If there is a working Internet connection available, missions can be planned at the site of the anticipated fieldwork. Otherwise, it’s possible to save the planned mission to the computer to access while in the field.
Once in the field, the operator can, by the flick of a switch on an RC transmitter or computer, launch the drone. During the mission, software displays in-flight data on computer or tablet screens, including altitude, GPS status, battery status, and ground signal status.
IMAGE OVERLAP UAV flight paths or mapping projects should be designed to ensure a sufficient amount of both forward and lateral photographic overlap, which will better allow post-processing software to identify common points between each image. There is no universally accepted overlap standard, as higher or lower figures may be appropriate for different situations, such as heavily forested areas or relatively featureless landscapes.
As an example, Walter Volkmann of Micro Aerial Projects suggests overlaps of 80 percent (forward) and 70 percent (lateral/side),17 which will produce enough overlapping photographs for post-processing software to work with. P. Barry and R. Coakley of Ireland’s Baseline Surveys18 suggest a “lawnmower track” pattern with an 80 percent forward and 80 percent lateral/side overlap. Pix4D on its website suggests at least 75 percent forward overlap and 60 percent lateral/side overlap.19
To achieve a certain image overlap, pilots need to balance the speed of flight with the interval at which the camera is taking pictures, as well as the altitude of the flight, the distance between the transects, and the internal geometry of the camera being used.20 Today’s flight planning software will automatically calculate all these figures for you, which is a considerable time-saver. It is, however, useful to know the underlying logic.
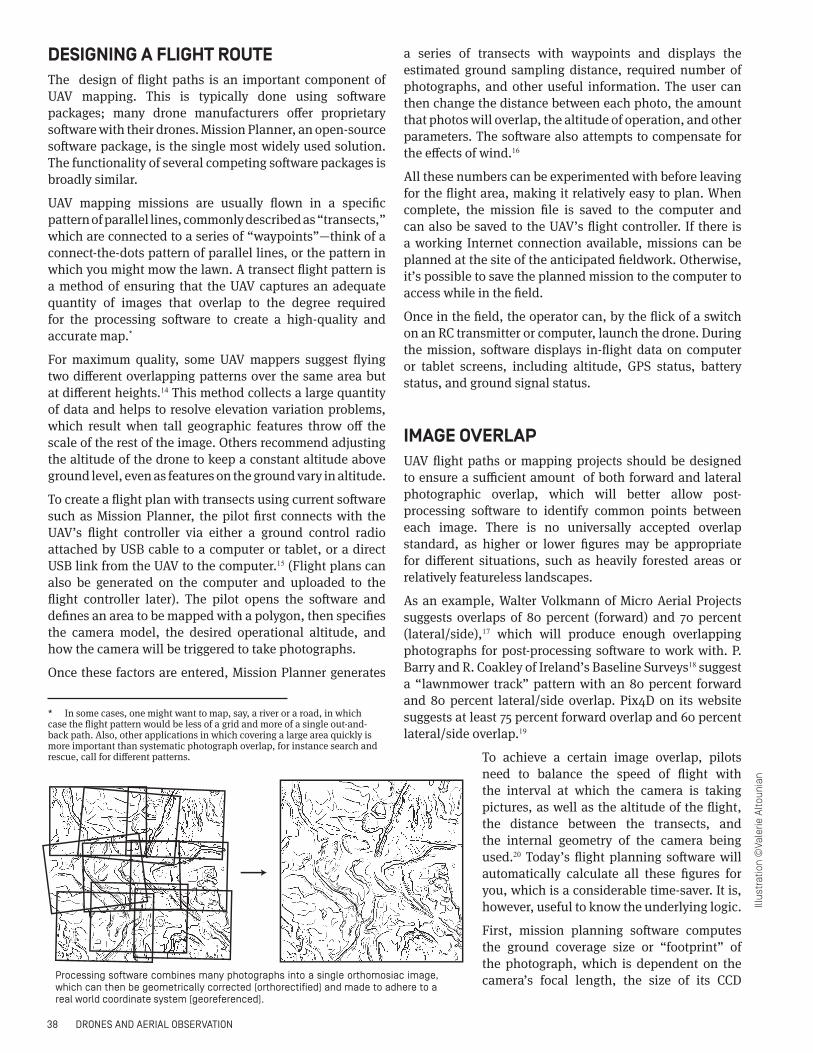
First, mission planning software computes the ground coverage size or “footprint” of the photograph, which is dependent on the camera’s focal length, the size of its CCD Processing software combines many photographs into a single orthomosiac image,
which can then be geometrically corrected (orthorectified) and made to adhere to a real world coordinate system (georeferenced).
Illust
ratio
n ©
Vale
rie A
ltoun
ian
DRONES AND AERIAL OBSERVATION 39
array (sensor), and how high the UAV is flying above ground level.21
From this ground coverage calculation, the software is able to work out how many flight paths will be needed to cover the area the user wants to map with the given camera, and will determine the spacing needed between these flight lines to ensure adequate overlap. The software then determines the minimum number of images needed to adequately cover this area, as well as the most suitable flight altitude to ensure adequate coverage as well as a sharp ground resolution.
As an example of these calculations, archaeologists from the University of Arkansas and the University of North Florida used a CineStar 8 octocopter UAV22 to carry out thermal mapping of New Mexico’s Blue J Chaco-period archaeological site in 2013. Using CineStar’s proprietary mission planning software, the archaeologists conducted their survey of the area with eight east-west oriented transects of 300 meters in length spaced 20 meters apart from one another, with the drone flying at 11.2 miles per hour.
The UAV flew at an altitude of 70 meters, giving the FLIR camera with its 19 mm focal length and 8.70 X 10.88 mm sensor an image footprint of approximately 32 X 40 meters, and a ground resolution between 6 and 7 centimeters. The FLIR thermal camera was aligned perpendicular to the flight path, reducing the number of transects required to cover the area.
In densely forested areas it is difficult for the processing software to find common points among overlapping photographs; in these situations, mapping UAV makers at SenseFly suggest designing flights with at least 85 percent frontal overlap and at least 70 percent side overlap.23 Higher overlap figures mean the UAV must take more flight paths, which will make the flight longer. They also mean that the UAV must take more pictures, which should be accounted for in processing time and in one’s computer storage space.
There is no real standard for how many images to take, although more images will improve overlap and help produce better results in post-processing. Shooting more pictures also allows more pictures to be safely thrown out, such as images that are blurred or obscured by a cloud. As an example, researchers from the University of Tasmania carrying out a mapping project used a Canon 550D mounted on a heavy-lift octocopter, which was set to automatically take a photograph every 1.5 seconds. During a test of this platform in April 2012, researchers shot 297 images covering 1.9 acres.
FLIGHT PLANNING FOR IMAGE QUALITY When it comes to mission planning, image resolution is an extremely important consideration, as collecting visual data is the entire point of the flight. Achieving good resolution in UAV photography depends on how high the drone is flying and the type (physical size and number of
pixels) of the digital sensor used—typically a CCD (charge-coupled device) or CMOS (complementary metal-oxide semiconductor)—as well as the focal length of the lens, shutter speed, aperture, ISO sensitivity, and other camera settings.
Though this sounds complex, the good news is that today’s mission planning software will do the calculations for you, with an interface enabling the user to specify the area to be mapped, then enter the image-quality requirements. The required image quality also varies widely. Some projects, such as archaeological surveys or aerial photography for cadastral surveying, require extremely clear images. On the other hand, say, in the aftermath of a natural disaster, image quality is less important than turnaround time. Here is an explanation of the concepts behind image resolution and drone flight planning.
Resolution in aerial photography is measured as ground sampling distance (GSD)—the length on the ground corresponding to the side of one pixel in the image, or the distance between pixel centers measured on the ground (these are equivalent). A larger GSD (10 cm) means that fewer details will be resolvable in the image and it will be of lower quality, while a smaller GSD (5 cm) means the exact opposite. GSD goes up as the drone flies higher and goes down as the drone flies lower. GSD is also affected by the camera’s focal length, as well as its pixel size.
As an example of GSD measurements in real-world mapping situations, researchers in Spain made a map using a MAVinci Sirius 1 fixed-wing UAV, paired with a Panasonic Lumix GX1 16 MP digital camera and 20 mm lens.24 To achieve the desired GSD of 3 cm for the entire mapping area, the UAV was flown at an average altitude of 185 meters (607 feet) above the surface. The researchers wanted to gather higher-resolution data of a certain area, so they lowered the altitude to 90 meters to achieve a GSD of 1.6 cm.
How do you determine GSD for your own mapping missions? The standard practice is to determine what resolution, or GSD, is desired, then choose an altitude as a function of the hardware setup. However, it’s possible to input the altitude, the size and number of pixels, and the focal length to determine which GSD a certain combination will deliver.
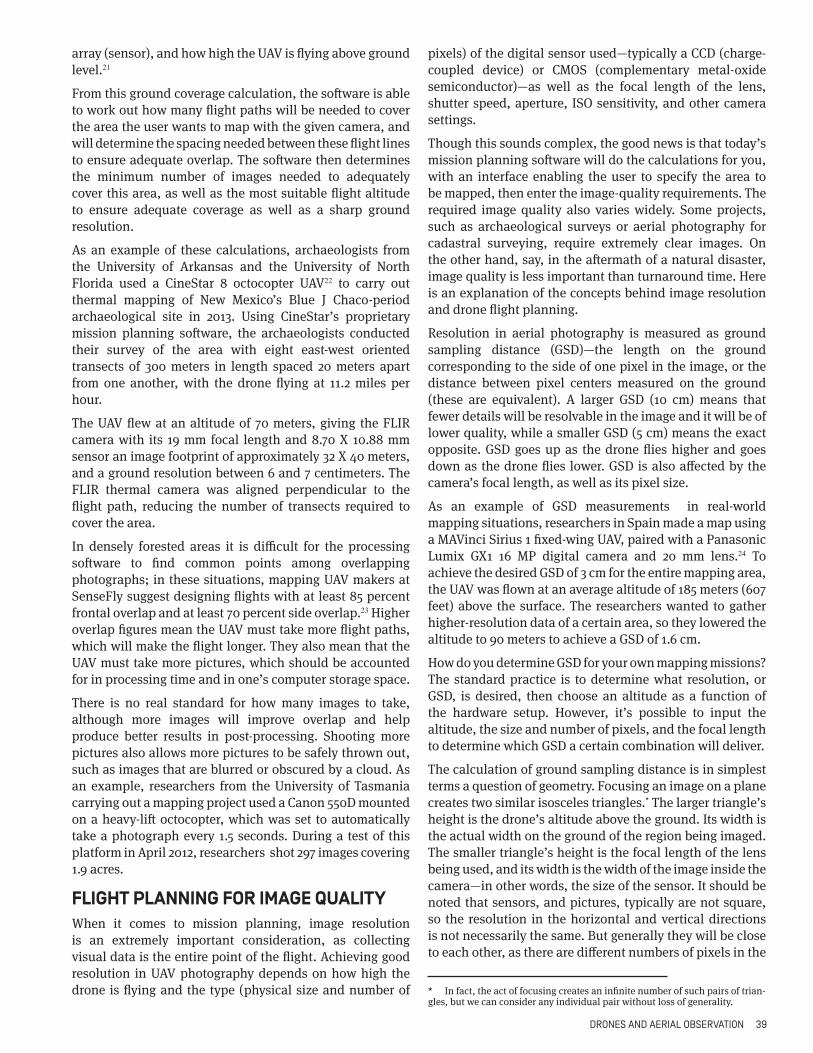
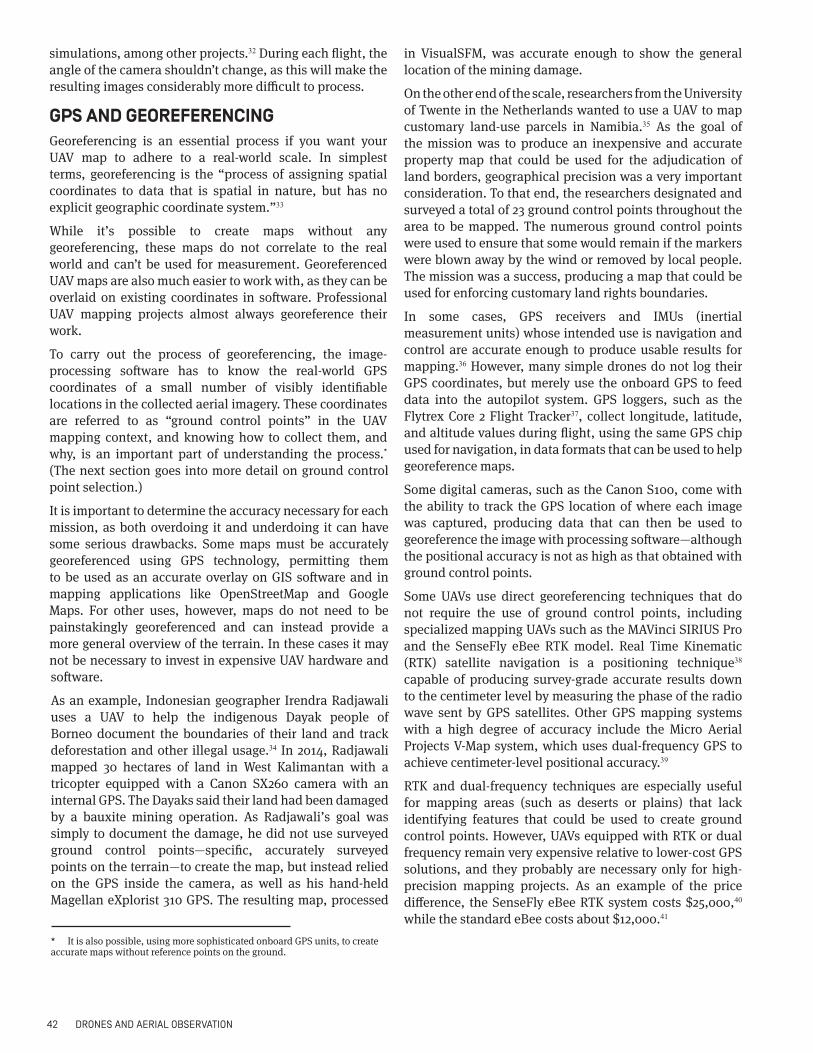
The calculation of ground sampling distance is in simplest terms a question of geometry. Focusing an image on a plane creates two similar isosceles triangles.* The larger triangle’s height is the drone’s altitude above the ground. Its width is the actual width on the ground of the region being imaged. The smaller triangle’s height is the focal length of the lens being used, and its width is the width of the image inside the camera—in other words, the size of the sensor. It should be noted that sensors, and pictures, typically are not square, so the resolution in the horizontal and vertical directions is not necessarily the same. But generally they will be close to each other, as there are different numbers of pixels in the
* In fact, the act of focusing creates an infinite number of such pairs of trian-gles, but we can consider any individual pair without loss of generality.
40 DRONES AND AERIAL OBSERVATION
vertical and horizontal directions, so it is usually acceptable to do this calculation for one direction only.
Commercial CCD and CMOS sensors range in size from about 6 mm on the diagonal for cheap point-and-shoot cameras to 28.4 mm for so-called APS-C sized sensors (typically found in DSLRs that cost around $1,000) to 48.3 mm for “full-frame” sensors, which are close in size to a negative of 35 mm film. The physical size of a pixel is simply the length (or width) of a sensor divided by the number of pixels the sensor is capturing in the vertical (or horizontal) direction.
Take, for instance, a Canon S100—an above-average point-and-shoot camera commonly used in UAV mapping because of its light weight and ability to take pictures at regular intervals.25 The S100 has a 1/1.7-inch sensor (7.6 mm by 5.7 mm) and can take pictures of up to 4,000 by 3,000 pixels. So the size of a pixel on the sensor is 0.0019 mm by 0.0019 mm.
By contrast, an expensive (and comparatively heavy) full-frame camera like a Nikon D600 has a pixel size of 0.00597 mm per side, about nine times bigger in area, or three times longer on each side.26 This does not, however, mean that you can fly three times as high and achieve the same results.
Put simply:
GSD = (pixel size x height above ground level) / focal length
An S100 lens, zoomed out, has a focal length of 5.2 mm (26 mm zoomed in). So if we wanted, say, to be able to resolve 1 cm-sized features on the ground using a zoomed-out S100, we would have to fly at
1 cm x 5.2 mm / 0.0019 mm = 27.3 m = 89.7 feet
Zooming the lens all the way in would allow comparable resolution images from an altitude five times as high.
All else being equal, larger pixels allow you to fly proportionately higher, although cameras with larger sensors also tend to be heavier, which decreases flight times. There’s another consideration: Larger pixels usually come with a larger total sensor area, which changes the effective focal length of the lens, varying with (roughly) the square root of the sensor area. A 5.2 mm focal length lens for a full-frame camera, if one existed, would give an extreme fisheye effect, which wouldn’t be of much use for making a map.
The equivalent of a 5.2 mm lens on a camera with a 1/1.7-inch sensor like a Canon S100 is a 24 mm lens on a full-frame camera like a Nikon D600.
In layman’s terms, this gives the same level of “zoom.” Repeating the calculation, to obtain a 1 cm GSD with the larger camera we get the necessary height of:
1 cm x 24 mm / 0.00597 mm = 40.2 m = 131.89 feet
However, the larger pixel size means the sensor will be more sensitive, allowing for a faster shutter speed in given light conditions and better image quality generally. In doing such calculations, one should always be mindful of the units of measurement, keeping an eye out for meters, centimeters, and millimeters, as well as conversions from metric. Some browser-based calculators will figure out GSD and pixel size for you.27
Of course, image quality is not purely a function of the theoretical resolution. A higher altitude won’t be useful if there are clouds between the camera and the ground. Also, images can be made blurry by the motion of the drone. DroneMapper suggests in its submission guidelines that “a good rule of thumb to use is the camera shutter speed should be set at no lower than the time to move one half of a pixel.”28 In practice, aiming for 1/1000 of a second or faster will be more than good enough, and if there is remaining
An image’s ground sampling distance (GSD) depends on the camera’s pixel size, the UAV’s altitude above the ground, and the camera’s focal length.
Illus
trat
ion
©Va
lerie
Alto
unia
n
Optics
Ground
Detector array
Ground sample distance (GSD)
Altitude
Focal length
Pixel pitch
DRONES AND AERIAL OBSERVATION 41
blur, reducing the speed of the UAV’s flight should help solve the problem.
Blur induced by the drone’s flight is just one factor; another is turbulence, which can be ameliorated by gimbal systems that stabilize the camera’s motion with respect to that of the airframe.
SENSORS Drone mappers use a wide range of cameras for their missions. Most cameras used for UAV mapping are lightweight and can be programmed to shoot pictures at regular intervals or controlled remotely. Some specialized devices that can be mounted on a UAV include LIDAR (light detection and ranging) sensors, infrared cameras equipped for thermal imaging, and air-sampling sensors.
The cameras required to carry out good mapping work are not necessarily the same as those used for professional video or photography work. Cameras with wide-angle lenses, like the GoPro, are very popular for video and photography uses. However, these lenses create distortion that isn’t ideal for mapping work and has to be edited out in post-processing, meaning they’re not well suited to this kind of project. The same fisheye consideration goes for the proprietary cameras that are paired with some commercial UAVs, such as the DJI Phantom Vision and Vision+ product line.
The internal GPS functionality of Canon’s lightweight S100 and SX260 models makes them particularly popular for UAV mapping.29 They can be used with the Canon Hack Development Kit,30 which can program the camera to take pictures at a certain interval or to take a picture based on distance or upon encountering a certain waypoint .
Mounting the camera to the drone can be accomplished in various ways. As drone mapping is generally performed at only one or two angles, gimbals may be relatively simple as compared to those used by filmmakers. Motorized gimbals provide image stabilization, which can help compensate for turbulence and produce clearer imagery. Gimbals are also used for changing the angle of the camera from vertical
(straight down) to oblique. Some mappers do not use gimbals at all or construct their own from other components.
ALTITUDE Altitude is an important consideration when flying a mapping UAV, both for practical purposes and in the interest of flying safely and legally. Although higher altitude results in lower resolution, it allows the UAV to fly tracks that are farther apart. Higher-altitude photography also can help reduce the distortion found in images of buildings and other objects on the ground. While lower-altitude photography increases the GSD and thus the image quality, it also increases the time required to map a certain area.
Aside from trade-offs in method, legality is a paramount consideration when picking an operating altitude. In many countries it is illegal to fly above 500 feet (400 feet in some cases) or 150 meters. Prudence should always be used when flying at higher altitudes, even if local regulations do not prohibit higher-altitude flight outright. It is the drone operator’s responsibility to make sure flights do not get in the way of manned aircraft.
VIEWSThe two aerial views most commonly used in UAV mapping are known as nadir (overhead) and oblique. Nadir photographs are shot directly above the subject, with the camera looking straight down. This is the perspective most associated with a traditional map. Oblique photographs are taken at an angle to the subject below, rather than from directly overhead. They can be taken from a high or a low angle, collecting information about the landscape that overhead photos cannot, and vice versa.
Photos taken from these two different angles can be combined in photogrammetry software (such as Agisoft PhotoScan or Pix4D31), creating imagery that gives users the ability to view and manipulate multiple perspectives in a single computer-generated model. Such three-dimensional modelscan be used for post-disaster damage assessment, accurate urban modeling, and creating more accurate flood
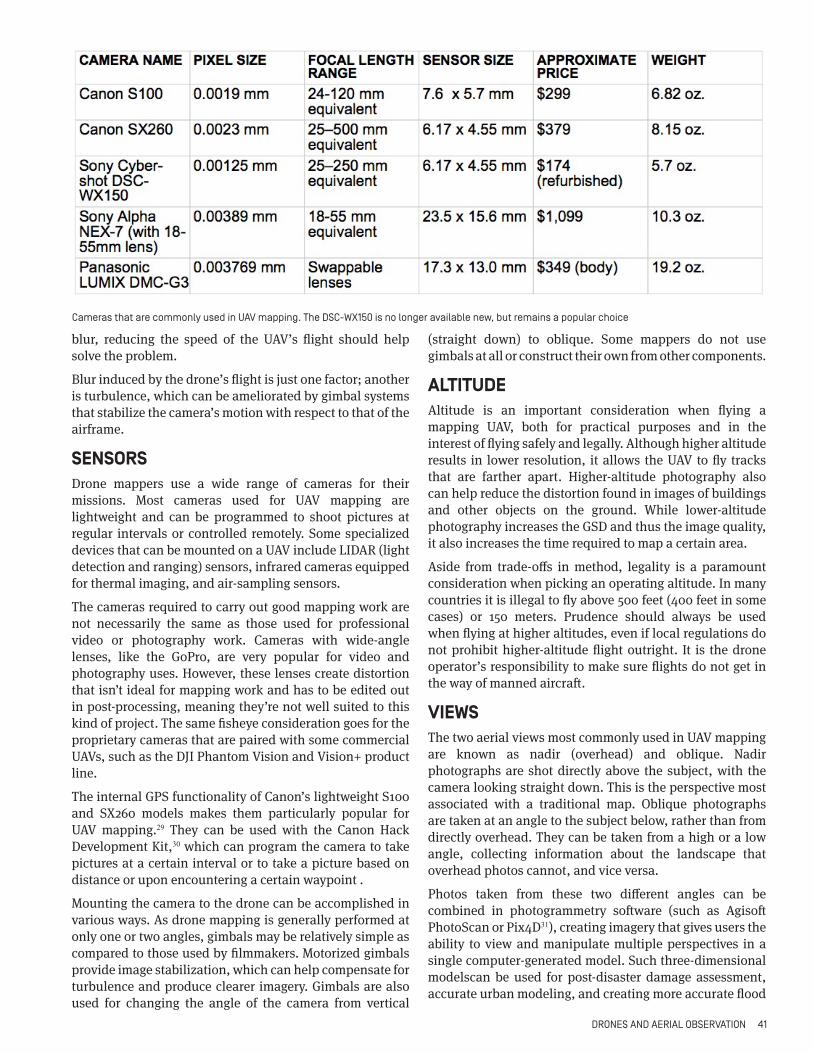
Cameras that are commonly used in UAV mapping. The DSC-WX150 is no longer available new, but remains a popular choice
42 DRONES AND AERIAL OBSERVATION
simulations, among other projects.32 During each flight, the angle of the camera shouldn’t change, as this will make the resulting images considerably more difficult to process.
GPS AND GEOREFERENCING Georeferencing is an essential process if you want your UAV map to adhere to a real-world scale. In simplest terms, georeferencing is the “process of assigning spatial coordinates to data that is spatial in nature, but has no explicit geographic coordinate system.”33
While it’s possible to create maps without any georeferencing, these maps do not correlate to the real world and can’t be used for measurement. Georeferenced UAV maps are also much easier to work with, as they can be overlaid on existing coordinates in software. Professional UAV mapping projects almost always georeference their work.
To carry out the process of georeferencing, the image-processing software has to know the real-world GPS coordinates of a small number of visibly identifiable locations in the collected aerial imagery. These coordinates are referred to as “ground control points” in the UAV mapping context, and knowing how to collect them, and why, is an important part of understanding the process.* (The next section goes into more detail on ground control point selection.)
It is important to determine the accuracy necessary for each mission, as both overdoing it and underdoing it can have some serious drawbacks. Some maps must be accurately georeferenced using GPS technology, permitting them to be used as an accurate overlay on GIS software and in mapping applications like OpenStreetMap and Google Maps. For other uses, however, maps do not need to be painstakingly georeferenced and can instead provide a more general overview of the terrain. In these cases it may not be necessary to invest in expensive UAV hardware and software.
As an example, Indonesian geographer Irendra Radjawali uses a UAV to help the indigenous Dayak people of Borneo document the boundaries of their land and track deforestation and other illegal usage.34 In 2014, Radjawali mapped 30 hectares of land in West Kalimantan with a tricopter equipped with a Canon SX260 camera with an internal GPS. The Dayaks said their land had been damaged by a bauxite mining operation. As Radjawali’s goal was simply to document the damage, he did not use surveyed ground control points—specific, accurately surveyed points on the terrain—to create the map, but instead relied on the GPS inside the camera, as well as his hand-held Magellan eXplorist 310 GPS. The resulting map, processed
* It is also possible, using more sophisticated onboard GPS units, to create accurate maps without reference points on the ground.
in VisualSFM, was accurate enough to show the general location of the mining damage.
On the other end of the scale, researchers from the University of Twente in the Netherlands wanted to use a UAV to map customary land-use parcels in Namibia.35 As the goal of the mission was to produce an inexpensive and accurate property map that could be used for the adjudication of land borders, geographical precision was a very important consideration. To that end, the researchers designated and surveyed a total of 23 ground control points throughout the area to be mapped. The numerous ground control points were used to ensure that some would remain if the markers were blown away by the wind or removed by local people. The mission was a success, producing a map that could be used for enforcing customary land rights boundaries.
In some cases, GPS receivers and IMUs (inertial measurement units) whose intended use is navigation and control are accurate enough to produce usable results for mapping.36 However, many simple drones do not log their GPS coordinates, but merely use the onboard GPS to feed data into the autopilot system. GPS loggers, such as the Flytrex Core 2 Flight Tracker37, collect longitude, latitude, and altitude values during flight, using the same GPS chip used for navigation, in data formats that can be used to help georeference maps.
Some digital cameras, such as the Canon S100, come with the ability to track the GPS location of where each image was captured, producing data that can then be used to georeference the image with processing software—although the positional accuracy is not as high as that obtained with ground control points.
Some UAVs use direct georeferencing techniques that do not require the use of ground control points, including specialized mapping UAVs such as the MAVinci SIRIUS Pro and the SenseFly eBee RTK model. Real Time Kinematic (RTK) satellite navigation is a positioning technique38 capable of producing survey-grade accurate results down to the centimeter level by measuring the phase of the radio wave sent by GPS satellites. Other GPS mapping systems with a high degree of accuracy include the Micro Aerial Projects V-Map system, which uses dual-frequency GPS to achieve centimeter-level positional accuracy.39
RTK and dual-frequency techniques are especially useful for mapping areas (such as deserts or plains) that lack identifying features that could be used to create ground control points. However, UAVs equipped with RTK or dual frequency remain very expensive relative to lower-cost GPS solutions, and they probably are necessary only for high-precision mapping projects. As an example of the price difference, the SenseFly eBee RTK system costs $25,000,40 while the standard eBee costs about $12,000.41
DRONES AND AERIAL OBSERVATION 43
GROUND CONTROL POINTS To get geospatially accurate survey-grade maps without expensive platforms like the eBee requires the use of ground control points. A ground control point, as previously mentioned, is a target in the desired mapping area with known coordinates, which can be used to find the coordinates of other locations on the map. A minimum number of ground control points (around five) is generally required by the software for the referencing process to function. More ground control points permit more accurate results. Ground control points cannot be clustered, but have to be scattered around the area to be mapped for best results; think of attaching a poster to a wall with thumbtacks.
Most commonly, UAV mappers who need very precise georeferencing will survey their ground control points with a professional-grade GNSS (global navigation satellite system) device, capable of locating coordinates with submeter accuracy. This device can use GPS or one of its competitors—the Russian GLONASS, European Galileo, or Chinese BeiDou. The surveyed points typically are marked before the UAV flight takes place, using easy-to-see aerial targets that later can be flagged inside of the processing software.
While ground control points are useful for increasing the accuracy of georeferencing, most photogrammetry software packages, such as Agisoft PhotoScan42 and Pix4D, can function without them. Instead they use GPS data collected by a GPS logger or by a GPS-enabled camera to create a reasonably geographically accurate image. As an example, a 2014 forest mapping project in the Democratic Republic of the Congo43 found that a DJI Phantom UAV equipped with a Canon S100 camera (with an internal GPS) was able to obtain position accuracy of about 5 meters.
There is another work-around for cameras that don’t have GPS functionality: With the location data collected by the UAV’s own GPS, which is stored in the flight log generated by the flight controller, it’s possible to match the time stamp of each photograph to the corresponding location of the UAV.44 A recent study with SenseFly’s swinglet CAM mini-UAV found that the accuracy of the resulting geotags was between 5 and 10 meters in position,45 which while not superb is likely adequate for some projects.
Without access to a survey-grade GNSS system that would permit them to take ground control points in the field, UAV mappers can also use ground control points taken from high-accuracy sources (such as laser scans and maps) that portray the same area, or gather them from Web map services like Google Earth or Bing. With these Web services, it’s possible to pick out features in the landscape that the drone mapped and to lay place marks46 within Google Earth, which can then be exported to photo-processing software. Additionally, mappers can buy pre-collected ground control points from services such as CompassData.47
3D MODELS3D models can be generated from either nadir imagery (shot vertically, straight down) or oblique imagery (from an angle to the side), but the most detailed models combine both into a single representation. To generate a 3D map, software requires hundreds of overlapping still images.
As an example of the usual 3D-model creation workflow, Agisoft PhotoScan* software48 first carries out the automatic process of photo alignment by searching for common points on photographs and matching them. It also deduces the position of the camera for each picture so that it can refine its camera calibration parameters.†
Once photo alignment is completed, the software generates a sparse point cloud with a set of associated camera positions and internal camera parameters. A point cloud is exactly what it sounds like—a set of points in 3D space, where each point, in addition to its coordinates, may have additional information such as color. A sparse point cloud is simply such a point cloud with relatively few points. A sparse cloud may be adequate to produce a less detailed 3D model that doesn’t need to be precisely georeferenced.
Agisoft PhotoScan requires this set of camera positions and an optimized sparse point cloud to advance in the process of producing a dense point cloud, which can often take as long as 15 hours on a reasonably high-powered laptop.
Next, the software builds a 3D polygonal “mesh” based on the dense point cloud, representing the surface of the object—think of a net thrown over a three-dimensional object. In the final step, the software lays texture taken from the original photographs over the 3D mesh, giving the original flat imagery a sense of depth and volume.
The final outcome is a detailed 3D model that can be used for a variety of specialized analyses, including archaeological research, the creation of flooding models, and disaster damage assessment.
* Agisoft PhotoScan and Pix4D dominate the market for paid map-creation software; various open-source solutions also exist and will be discussed in more detail later in this chapter.
† Camera calibration in 3D computer vision is a complex process. A good explanation is provided by Z. Zhang in ““Camera Calibration”, Chapter 2, pages 4-43, in G. Medioni and S.B. Kang, eds., Emerging Topics in Computer Vision, Prentice Hall Professional Technical Reference, 2004, http://research.microsoft.com/en-us/um/people/zhang/Papers/Camera%20Calibration%20-%20book%20chapter.pdf
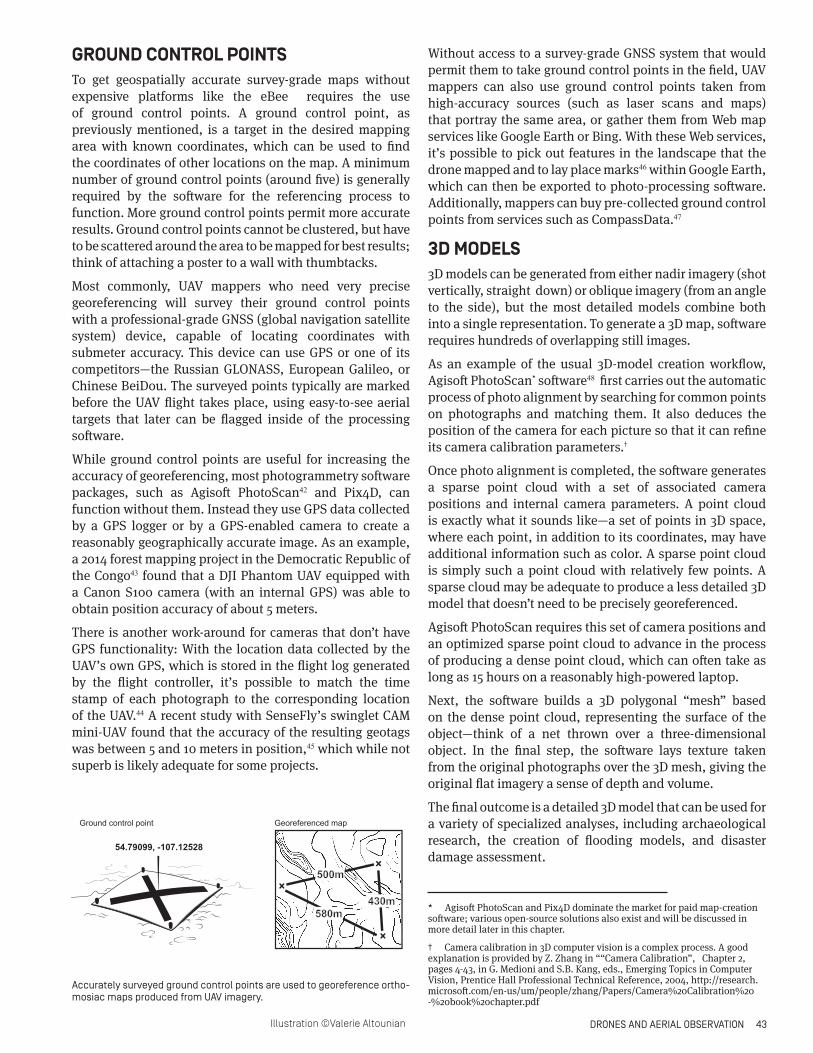
Accurately surveyed ground control points are used to georeference ortho-
mosiac maps produced from UAV imagery.
Illustration ©Valerie Altounian
Georeferenced mapGround control point
54.79099, -107.12528
500m
580m430m
44 DRONES AND AERIAL OBSERVATION
PROCESSING SOFTWARE “Having images is not the same as having a map,” observes UAV mapper Cristiano Giovando of the Humanitarian OpenStreetMap Team,49 and he’s right. Collected imagery must be processed on a computer to generate a map. Choosing a software package is highly dependent on your budget, the processing power you have available, and what you want to accomplish. There is some variety in the processing software used for UAV mapping, and the market is changing as UAVs increase in popularity.
As of this writing, Pix4D and Agisoft PhotoScan are the two most popular paid aerial imagery and photogrammetry processing choices, with relatively simple user interfaces and comprehensible manuals, as well as an established track record of use for professional aerial mapping applications. Both programs are regularly updated and improved upon, as the demand for UAV mapping and the market for photogrammetry software expand. However, paid photogrammetry software is expensive and can require considerable processing power to operate, which should be factored into mapping budgets. At the time of writing (July 2015), Pix4D was priced at $8,700 for a full license and could be rented for $3,500 a year.50 Agisoft PhotoScan cost $3,499 for the Professional Edition, while the less feature-rich Standard Edition was priced at $179.51
Open-source software is another possibility for aerial imagery post-processing, including MapKnitter from Public Lab, OpenDroneMap, and Visual Software from Motion
(VisualSFM). Microsoft ICE (Image Composite Editor) is an established choice for panoramic image stitching, alth-ough it does not create geometrically corrected orthophotos.
Such open-source and free software packages can be more difficult to use and may have fewer features than their paid counterparts, but they are nonetheless powerful enough to achieve useful results. The Flight Riot website (http://flightriot.com) provides a comprehensive over-view of open-source mapping software and associated techniques, with instructions on the proper use and selection of cameras, UAV plat-forms, and processing software.
Processing big batches of high-definition aerial imagery can be slow, and depending on how many images are being used, this can require a powerful computer processor. Some field workers will do low-quality image processing in the field to check that they have shot an adequate number of images with adequate overlap, then create a higher-quality model when they return to their computing workstations.
In particular for scientific applications requiring precision, care must be taken to avoid systematic errors created by processing software. For instance, the combination of radial lens distortion and many images taken from near-parallel directions can introduce an effect called “doming,” which makes a flat surface into a dome.52
SOFTWARE AT WORKDrone journalist Ben Kreimer used Agisoft PhotoScan to create a 3D model of an ancient Roman site in Turkey, using photographs he had shot with his Phantom 2 and a Canon SX260 camera.53 The software used 249 of these images to generate the model. With Kreimer’s MacBook Air with a 1.7 GHz Intel Core i7 processor, a solid-state hard drive, and 8 GB of RAM, Agisoft PhotoScan took eight hours to create the model. Another model, which involved 949 images, took about 30 hours to assemble with the same computer.
In another example of the photo processing process, Austin “Chad” Hill of the “Follow the Pots” project has a two-part workflow: one for fieldwork, the other for processing work back in the office.54 While in the field, Hill checks his photo
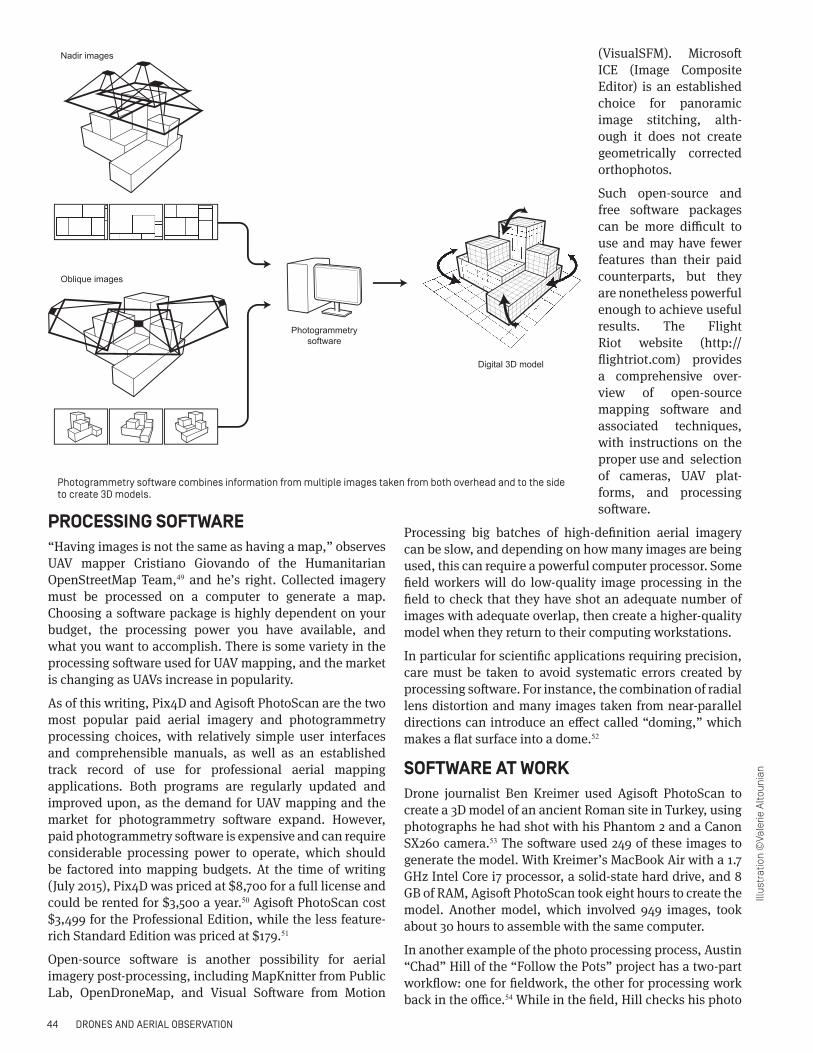
Photogrammetry software combines information from multiple images taken from both overhead and to the side to create 3D models.
Illust
ratio
n ©
Vale
rie A
ltoun
ian
Photogrammetry
software
Digital 3D model
Oblique images
Nadir images
DRONES AND AERIAL OBSERVATION 45
sets to ensure that his UAV has shot enough images to create a complete 3D model in Agisoft PhotoScan upon his return to his U.S. computing station. Hill uses a late-2011 13-inch MacBook Pro, run off a generator, to process images in Agisoft PhotoScan at the lowest quality level, allowing him to make sure that a later, higher-quality model won’t have any coverage “holes.” These “quick and dirty checks,” as he described them in an e-mail, can be processed in one to two hours with his laptop.
Back in the office, Hill uses an overclocked Haswell i7 processor with 32 GB of RAM and a modest GPU (graphics processor unit) to process UAV images in Agisoft PhotoScan, as well as to carry out GIS work with the resulting mapping products. Hill begins by processing the photos at a low level of quality in PhotoScan, which usually takes around two hours. He then carries out the georeferencing process, including identifying ground control points and checking for errors, and repeats the process at a higher quality level within the software. Per Hill, a drone photoset with a few hundred images can take as long as two days to process into final orthophotos and digital elevation models, with the computer running overnight.
Factoring in the time required to process data is an important consideration for fieldwork, as processing presents a technical barrier to projects that require a swift turnaround. To avoid unpleasant surprises, it is best to get a clear sense of how long processing will take with the computing equipment available before heading into the field.
Some companies now offer UAV mapping software that carries out real-time image processing on their servers, such as DroneDeploy, DroneMapper, and Airware. Outsourcing the computing power to process detailed UAV imagery lessens the lengthy processing time required by other photogrammetry software, and it can also provide output quickly while a team is still in the field.
However, using these services requires access to mobile data or the Internet, which is often unavailable in remote areas or during disasters. Some services, such as DroneDeploy, require the purchase of a separate unit that is mounted on the UAV to function. As an example of pricing for these services, DroneMapper, as of June 2015, charged $60 to process imagery equivalent to an area of about 3 square kilometers, or 740 acres.55
Technology will change. Faster processors will stitch together and georectify images more quickly. The acuity of photographic sensors will improve, as will the endurance and range of drones. Increasing levels of autonomy in both flight software and post-processing software will allow for the creation of cheap maps with increasingly less direct human intervention. However, the basic principles explained in this chapter—how a drone uses a camera to capture an image, how many of those images are combined with one another, and how they are georeferenced—will remain unchanged for the foreseeable future. §
ENDNOTES
1 Geoffrey Kateregga, “Updates from Dar es Salaam,” Humanitarian Open Street Map Team (HOT OSM), April 22, 2015, http://hotosm.org/updates/2015-04-22_updates_from_dar_es_salaam.
2 Dries Raymaekers, “UAV Mapping in Ethiopia,” DIY Drones, February 10, 2015, http://diydrones.com/profiles/blogs/uav-mapping-in-ethiopia-looking-for-malaria-hotspots.
3 Faine Greenwood, “Drones to the Rescue,” Future Tense (blog), Slate, June 3, 2015, http://www.slate.com/articles/technology/fu-ture_tense/2015/06/community_drones_helps_indonesia_s_dayaks_protect_their_land.html.
4 F. Remondino, L. Barazzetti, F. Nex, M. Scaioni, and D. Sarazzi, “UAV Photogrammetry For Mapping And 3D Modeling – Current Status And Future Perspectives,” International Archives of the Photogrammetry, Remote Sensing and Spatial Information Sciences XXXVIII-1/C22 (2011), http://www.researchgate.net/profile/Francesco_Nex/publication/263449506_UAV_PHOTOGRAMME-TRY_FOR_MAPPING_AND_3D_MODELING__CURRENT_STATUS_AND_FUTURE_PERSPECTIVES__Commission_I_ICWG_IV/links/0deec53adb7b6841bb000000.pdf.
5 David DiBiase, “8. Digital Elevation Model (DEM),” The Pennsylvania State University, John A. Dutton E-Education Institute, College of Earth and Mineral Sciences, 2014, https://www.e-education.psu.edu/geog482spring2/c7_p8.html.
6 “Measuring Vegetation (NDVI and EVI),” NASA Earth Observatory, http://earthobservatory.nasa.gov/Features/MeasuringVegeta-tion/measuring_vegetation_2.php.
7 geobduffy, “Open Source Single Camera NDVI – Vegetation Health Mapping,” FlightRiot.com, May 28, 2013, http://flightriot.com/vegetation-mapping-ndvi/.
8 “Thermal mapping highways and bridges in Czech Republic by UAV,” sUAS News, December 11, 2014, http://www.suasnews.com/2014/12/33316/thermal-mapping-highways-and-bridges-in-czech-republic-by-uav/.
9 Charles W. Culbertson, Thomas G. Huntington, James M. Caldwell, and Cara O’Donnell, Evaluation of Aerial Thermal Infrared Re-mote Sensing to Identify Groundwater-Discharge Zones in the Meduxnekeag River, Houlton, Maine, U.S. Geological Survey, Depart-ment of the Interior (Pembroke, NH, 2013) http://pubs.usgs.gov/of/2013/1168/pdf/ofr2013-1168.pdf.
46 DRONES AND AERIAL OBSERVATION
10 Jesse Casana, John Kantner, Adam Wiewel, and Jackson Cothren, “Archaeological aerial thermography: a case study at the Cha-co-era Blue J community, New Mexico,” Journal of Archaeological Science 45 (2014): 207-219.
11 Martin Israel, “A UAV-Based Roe Deer Fawn Detection System,” International Archives of the Photogrammetry, Remote Sensing and Spatial Information Sciences XXXVIII-1/C22 (2011), http://www.geometh.ethz.ch/uav_g/proceedings/israel.
12 “Sky-Watch Integrates FLIR Quark 640 into Small UAV,” FLIR, http://www.flir.com/cores/display/?id=61163.
13 Flir Infrared Camera Export Information, http://flir.com/instruments/display/?id=56189
14 “Aerial Data Collection Guidelines & Flight Planning,“ DroneMapper, https://s3.amazonaws.com/DroneMapper_US/documenta-tion/DroneMapper_AerialDataCollectionGuidelinesPlanning.pdf.
15 Brandon Basso, “Creating automatic mission plans for aerial surveying,” DIY Drones, October 1, 2013, http://diydrones.com/pro-files/blogs/how-to-plan-missions-for-aerial-survey.
16 “X8-M: Operation Manual,” 3D Robotics, 2014, http://3drobotics.com/wp-content/uploads/2014/10/X8M-Operation-Manual-v1.pdf.
17 Walter Volkmann and Grenville Barnes, “Virtual Surveying: Mapping and Modeling Cadastral Boundaries Using Unmanned Aerial Systems (UAS),” (paper presented at the XXV FIG Congress, Kuala Lumpur, Malaysia, June 16-21, 2014), http://www.fig.net/re-sources/proceedings/fig_proceedings/fig2014/papers/ts09a/TS09A_barnes_volkmann_7300.pdf.
18 P. Barry and R. Coakley, “Field Accuracy Test of RPAS Photogrammetry,” (paper presented at UAV-g 2013, Zurich, Switzerland, May 16, 2013), http://www.uav-g.org/Presentations/UAS_and_Photogrammetry/Barry_P-Field_Accuracy_Test.pdf.
19 “Step 1. Before Starting a Project > 1. Designing the Images Acquisition Plan > a. Selecting the Images Acquisition Plan Type,” Pix4D Support Site, April 24, 2015, https://support.pix4d.com/hc/en-us/articles/202557459-Step-1-Before-Starting-a-Project-1-De-signing-the-Images-Acquisition-Plan-a-Selecting-the-Images-Acquisition-Plan-Type.
20 Qassim A. Abdullah, “4.4 Designing Flight Route,” The Pennsylvania State University, John A. Dutton E-Education Institute, College of Earth and Mineral Sciences, 2014, https://www.e-education.psu.edu/geog597g/node/658.
21 Ibid.
22 Jesse Casana, John Kantner, Adam Wiewel, and Jackson Cothren, “Archaeological aerial thermography: a case study at the Cha-co-era Blue J community, New Mexico,” Journal of Archaeological Science 45 (2014): 207-219.
23 “Step 1. Before Starting a Project > 1. Designing the Images Acquisition Plan > a. Selecting the Images Acquisition Plan Type,” Pix4D Support Site.
24 Niels Anders, Rens Masselink, Saskia Keesstra, and Juha Suomalainen, “High-Res Digital Surface Modeling using Fixed-Wing UAV-based Photogrammetry,” (paper presented at Geomorphometry 2013, Nanjing, China, October 6, 2013), http://geomor-phometry.org/Anders2013.
25 Kelcey Smith and Andy Westlake, “Canon PowerShot S100 Review,” DPReview, December 2011, http://www.dpreview.com/re-views/canons100.
26 Barnaby Britton and Amadou Diallo, “Nikon D600 In-Depth Review,” DPReview, November 2012, http://www.dpreview.com/re-views/nikon-D600.
27 Daniel Scarnecchia, “Calculator for Photogrammetry,” GitHub, June 8, 2015, http://scarnecchia.github.io/GSD_calculator/.
28 “Guidelines,” DroneMapper, https://dronemapper.com/guidelines.
29 geobduffy, “Camera Setup for UAV,” FlightRiot.com, September 26, 2014, http://flightriot.com/camera-setup-for-uav/.
30 geobduffy, “New CHDK Scripts and Methods!!!,” FlightRiot.com, November 10, 2014, http://flightriot.com/3-chdk-scripts-op-tions/.
31 M.J. Smith, A.M. Hamruni, and A. Jamieson, “3-D urban modelling using airborne oblique and vertical imagery,” ISPRS Archives XXXVIII-1-4-7/W5 (2009).
32 Patrick Meier, “Assessing Disaster Damage from 3D Point Clouds,” iRevolutions, May 18, 2015, http://irevolution.net/2015/05/18/damage-from-3d-clouds/.
33 “Georeferencing of Scanned Maps & Spatial Adjustment of Vector Data,” The Map Collection, Yale University Library, http://www.library.yale.edu/MapColl/files/docs/Georeferencing%20of%20Scanned%20Maps.pdf.
34 Greenwood, “Drones to the Rescue.”
35 Mukendwa Mumbone, Rohan Bennet, Markus Gerke, and Walter Volkmann, “Innovations In Boundary Mapping: Namibia, Cus-tomary Lands And UAVs,” (paper presented at the 2015 World Bank Conference on Land and Poverty, Washington, DC, March 23-27, 2015), http://www.itc.nl/library/papers_2015/conf/bennett_inn.pdf.
36 K. N. Tahar, “Aerial Terrain Mapping Using Unmanned Aerial Vehicle Approach,” International Archives of the Photogrammetry, Remote Sensing and Spatial Information Sciences XXXIX-B7 (2012), http://www.int-arch-photogramm-remote-sens-spatial-inf-sci.net/XXXIX-B7/493/2012/isprsarchives-XXXIX-B7-493-2012.pdf.
37 “Flytrex Core 2 Flight Tracker For Phantom 2,” Dronefly, 2015, http://www.dronefly.com/product-p/flytrex.htm.
38 “Real-Time Kinematic (RTK),” NovAtel, http://www.novatel.com/an-introduction-to-gnss/chapter-4-advanced-gnss-concepts/real-time-kinematic-rtk/.
DRONES AND AERIAL OBSERVATION 47
39 “The 20 Hz V-Map System packaged by Micro Aerial Projects L.L.C for precise UAV-camera exposure positioning,” Micro Aerial Projects, July 2014, http://www.microaerialprojects.com/wp-content/uploads/2014/07/The-20Hz-V-Map-System-Jul14.pdf.
40 “EBEE TRK,” dronelife.com, http://dronelife.com/cms/product/eBee-RTK
41 Ben Coxworth, “senseFly to release eBee industrial UAV,” gizmag.com, January 17, 2013, http://www.gizmag.com/sensefly-ebee-uav/25851/
42 “First run tutorial: Orthophoto and DEM Generation with Agisoft PhotoScan Pro 1.0.0 (without Ground Control Points),” Agisoft, http://www.agisoft.com/pdf/PS_1.0.0%20-Tutorial%20(BL)%20-%20Orthophoto,%20DEM%20(without%20GCP).pdf.
43 J.Haarpaintner, M.Kohling, F. Enssle, P. Datta, A. Mazinga, and J. Likunda, “Validation of optical and SAR satellite-based forest maps with field data in the Mai Ndombe district, Dem. Rep. of Congo,” (paper presented at 2014 ForestSAT, Riva del Garda, Italy, November 4-7, 2014), http://www.researchgate.net/publication/268509699_Validation_of_optical_and_SAR_satellite-based_for-est_maps_with_field_data_in_the_Mai_Ndombe_district_Dem._Rep._of_Congo.
44 Stephen Gray, “UAV Survey: A Guide to Good Practice,” Archaeology Data Service/Digital Antiquity, http://guides.archaeology-dataservice.ac.uk/g2gp/AerialPht_UAV.
45 O. Küng, C. Strecha, A. Beyeler, J-C. Zufferey, D. Floreano, P. Fua, and F. Gervaix, “The Accuracy Of Automatic Photogrammetric Techniques On Ultra-light UAV Imagery,” International Archives of the Photogrammetry, Remote Sensing and Spatial Information Sciences XXXVIII-1/C22, http://www.geometh.ethz.ch/uav_g/proceedings/strecha.
46 “How to obtain the georeference using 2D or 3D GCPs taken from a Web Map Service server,” Pix4D Support Site, May 19, 2015, https://support.pix4d.com/hc/en-us/articles/202560149.
47 “Ground Control Points 101: What Are They, Why Do They Matter, How Are They Used?,” CompassData, http://www.compass-datainc.com/gcp101.htm.
48 “Agisoft PhotoScan User Manual: Professional Edition, Version 1.1,” Agisoft, 2014, http://www.agisoft.com/downloads/user-man-uals/.
49 Interview with Cristiano Giovando, May 1 2015.
50 “Buy,” Agisoft, July 7 2015, http://www.agisoft.com/buy/online-store/.
51 “Buy or Rent,” Pix4D, July 7 2015, https://pix4d.com/buy_rent/.
52 Mike R. James and Stuart Robson, “Mitigating systematic error in topographic models derived from UAV and ground-based image networks,” Earth Surface Processes and Landforms 39, no. 10 (2014): 1413-1420.
53 Ben Kreimer and Matt Waite, “The Feasibility of Using Small Unmanned Aerial Vehicles for Mapping News Events,” (paper pre-sented at the Computation + Journalism Symposium 2014, Columbia University, New York City, October 24-25, 2014), http://com-pute-cuj.org/cj-2014/cj2014_session5_paper1.pdf.
54 Interview with Austin “Chad” Hill, phone, May 5 2015.
55 “Guidelines,” DroneMapper, https://dronemapper.com/guidelines.


![Domestic Use of Drones Make Privacy Advocates Anxious [Landscape]](https://img.pdfslide.net/doc/110x75/563dbb0a550346aa9aa9c542/domestic-use-of-drones-make-privacy-advocates-anxious-landscape.jpg)