Embed Size (px)
Citation preview

4.1
Chapter 4 Measuring intellectual capital
It is tempting to try to design a measurement system equivalent to double-entrybookkeeping with money as the common denominator. It is an establishedframework with definitions and standards and therefore common sense. But thisis precisely the reason why we should break with it. If we measure the new withtools of the old, we won’t be able to see the new (Sveiby, 1997, p 155).

4.2
4.1 Introduction It is said that what is measured in companies is also what is managed. What is not said is that very often what is important is too difficult to measure and therefore it does not get measured and neither does it get managed. The crux of the matter is that time needs to be spent on identifying items that will provide tangible proof that intangible growth (or decline) is taking place. The best way of measuring is by ensuring that goals and strategy are known. Without that it becomes very easy to either measure for measurement’s sake or to measure only those items for which measuring tools can be found. Industrial age companies needed balance sheets to show their value to investors. In the knowledge economy the balance sheet, as tool, is no longer sufficient to provide the assurance that a safe investment is being made. However, alternative methods of measuring and evaluating intellectual capital have been slow to develop. This is, in all probability, because investors, through ignorance or short sightedness, have continued to value balance sheet information. To facilitate the process of managing intellectual capital, there have been several attempts to create formulae that will capture and measure the real value of intellectual capital in the organization's balance sheet (Filios, 1991, in Zickner, 1996, p 42-43; Stewart, 1996, in Zickner, 1996, p 37 and Sveiby, Lloyd and Joubert, 1995, in Zickner, 1996, p 41). Kaplan and Norton introduced the ‘Balanced Scorecard’ technique to help managers combine performance measurements from different perspectives. Building on the Balanced Scorecard approach, Skandia is seen as one of the pioneering companies in developing and implementing a systematic way of visualizing and measuring intellectual capital (Roos and Roos, 1997, p 415). Accountants are not yet ready to make significant changes to a 500-year-old system (Robson, 2000, p 13). It is therefore not strange that it is generally seen as an enormous step forward that efforts to capture intellectual capital more appropriately are being made from the accounting domain. According to Robson (2000, p 15), the movement away from the black and white balance sheet information is known as the ‘colourizing’ of balance sheets, which in today’s world of colourful multimedia appears to be a very apt description! It is however also worth noting Kaes’ (1999, p 140) concern. She is of the opinion that so much emphasis is placed on measuring intellectual capital that some forget it is actually about managing the intellectual capital. The Gartner Group estimates that intellectual assets are worth approximately three to four times an enterprise’s book value (Smith, 1998, p 8). The dilemma remains that, even though intellectual capital can outweigh physical assets enormously, it is very difficult to find measures that will accurately reflect their value within an instrument such as the balance sheet. Physical and intellectual capitals have different properties and should therefore have different valuation methods. When a company has mainly physical assets, output is more predictive than for those with mainly intellectual assets. (For example a mine produces ‘x’ tons of ore annually. The probability that it would produce a similar amount of ore is fairly predictable.

4.3
When an advertising company launches ‘x’ number of successful marketing campaigns one year there is very little that can be used as an indication that the same would happen in the following year.) The dot.com valuation problems can be closely associated with the fact that inappropriate predictive measures were and are being used to value these companies. Fortunately if, as Roos and Roos (1997, p 417) indicate, the growth or decline of the intellectual capital of the company is increasingly interpreted as an early warning signal of subsequent financial performance, most managers will eventually realise that it is of the utmost importance that appropriate measures of performance, other than balance sheets, are developed. In support of Roos and Roos, Lank (1997, p 408) is of the opinion that the interest in intangible assets gives the opportunity to develop new and creative business measures that are much more likely to be indicators of future business success than the traditional rear-view mirror financial measures. However, knowing that new measures are necessary does not necessarily mean that these measures are developed. Despite the feverish interest and exponential growth in literature relating to knowledge management and intellectual capital management, Bontis and Girardi (1998) state that the majority of literature relating to the development and measurement of the subject:
• has an introductory flavour; • lacks substance; and • tends to be repetitive.
Research for this project confirmed the statement. It was therefore not strange to find that intellectual capital research done at South African universities stems from the Business departments where many MBA candidates are and have investigated the options available. To date no results indicate that an absolutely reliable solution to the problem has been found. There are, however, a number of different angles from which the measurements challenge has been approached. It was also found that, despite the fact that intellectual capital management reflects the human aspect of business, most research is being done in the financial or business administration sectors of business. When measures are given, the measures as a rule relate to means to improve balance sheet information. Convinced of the importance of managing knowledge, intellectual capital, or intangible assets, one is still none-the-wiser as to what practical measures can be utilized to prove the value and the changes brought about by intellectual capital management practices. Liebowitz and Wright (1999, p 99) established that there are two schools of thought in terms of measuring knowledge. They are of the opinion that researchers either try to find the appropriate metrics for knowledge or they (such as Davenport and Prusak (1998, in Liebowitz and Wright, 1999, p 99)) are of the opinion that knowledge in itself cannot be measured and therefore they look for indicators of knowledge. They support the latter school of thought as in their opinion only the outcomes of knowledge activities are measurable. The opinion, expressed within the context of this research, follows suit as there will be an attempt to identify metrics that will prove that knowledge is being harnessed to improve the wider company’s value chain, which is the creation of knowledge.

4.4
Before measuring intellectual capital, four pieces of advice should be taken seriously. First of all Stewart’s advice (1997, pp 243-244), as supported by Roos and Roos (1997, p 419), was seen to contain one of the most important lessons to learn. Stewart is of the opinion that no single measurement will ever describe a company’s full quota of stocks and flows in intellectual capital. Therefore, when devising measurements, instead of developing one ultimate measuring tool, one should:
• keep it simple; • measure only what is strategically important; and • measure activities that produce intellectual wealth.
A second piece of advice comes from Bontis (1998, p 73). He is of the opinion that it requires people to rethink their attitudes on intangible assets and to start recognizing that measuring and strategically managing knowledge may make the difference between mediocrity and excellence. This change in attitude was seen to not only reflect the change necessary in the eyes of the clients (in this case the senior managers within the CSIR) but also within the IMPS programme itself. Put differently, it is very difficult to convince others that an item holds value when the owner does not believe in that value himself. The way to see and experience value increase is to find an appropriate ‘mirror’ where growth and decline can be seen. It is anticipated that a personal scorecard may be an appropriate tool to do this. The third piece of advice was that of Demarest (1997, p 378). Demarest remarked that the only reasonable purpose for organized knowledge management practice in an organization is to increase the quality and quantity of the company’s marketplace performances. Measuring should therefore target those activities that achieve at least one of the following:
• enable the organization to sell more and sell better (relating to activities that encourage human capital development);
• support more and support better (relating to activities that encourage structural capital development); or
• create and keep more/ better customers (relating to activities that encourage customer capital development).
Duffy’s (2000, p 13) advice, that the risk of miscommunication is reduced when there is a common understanding of the jargon used and the processes followed, was also embraced. The last piece of advice is twofold and came from Kaplan and Norton (2001a, p 102). They state that measurement is not only about reporting what happened in the past. More importantly it is about creating focus for the future. Finally, their reminder that ownership and active involvement of the executive team is the single most important condition for success (Kaplan and Norton, 2001b, p 155) is taken for granted. To recap: although advice on devising measures is available, intellectual capital and knowledge managers find it difficult to identify useful measures because the key question for many firms has been how to exactly measure, reflect and communicate

4.5
the impact of knowledge management on business results in financial terms. However, when dealing with knowledge economy assets, one should not get caught, in the short term trap of looking at the bottom line only. At the same time heed shoukld be taken of the warning iterated by Zickner (1996, p 36) unless the value created by the intellectual asset can be measured (the intangible asset leads to a tangible result) it is difficult to understand the significance of intellectual capital. The rest of this chapter will therefore review a variety of meaningful methods through which an attempt could be made to measure the impact of intellectual capital management practices on information services. Within the CSIR’s IMPS environment, identifying such measures appears to be challenging. There is, however, also a significant opportunity to be forward thinking and creative when designing measures that would be able to convince internal business managers to invest in a programme that should be developed and grown for their own sustainability. 4.2 Measuring the impact of intellectual capital management Sveiby (1998c) uses the metaphor of a natural fountain or well to explain the use and the measurement of a knowledge body. Supposing one is tasked to measure the water in a spring, the solution to the task will depend on the purpose of the measurement and also on whom the measurer is and his/her values. To top it all, one would always, while endeavouring to measure, run the risk of altering and even killing off the source of the ‘water’. The question, therefore, is what the purpose of measuring the intellectual capital activity should be. Hackett (2000, pp 50-51) reports that customer satisfaction or customer value is the primary measure most often cited by senior executives. He continues to say that, as is the case with training and other forms of investment in human capital, too many variables can prevent the development of a formula that leads to a proof. Therefore, most firms rely on the evidence such as cost savings, speed to market and customer satisfaction. Recording the number of hits on knowledge databases or activity on a corporate intranet can also be a useful proxy. A standard measure of success for knowledge management efforts: improved productivity at the individual and the organizational level, remains difficult to identify. Although actual measures may be lacking, authors recognise that in order to measure intellectual capital effectively, a framework to guide the analysis needs to be developed. Robinson and Kleiner (1996, p 36) states that meaningful measures are a prerequisite to measuring the effectiveness of programmes designed to increase intellectual capital. They opted to develop a structure based on the work of Leif Edvinsson. Their structure has general categories:
• The first category refers to ‘structural capital’ and includes that portion of intellectual capital that is left behind when the workers leave the company - the documented or captured knowledge. This is also where patents, licenses, trademarks and trade secrets reside and it is the part of intellectual capital that is probably the easiest to measure because it is tangible and is very often seen as a source of income generation. A start could therefore be to count the number of patents and licenses in a firm. The first complication arrives

4.6
when it is realized that, to be of value to the firm, the patents must have market value. The market value of patents and licenses will continue to change as market conditions change. This complication has meant that Robinson and Kleiner have accepted that, within their framework, any measurement of intellectual capital will always be subject to change.
• The second, and more difficult side of intellectual capital measurement, refers
to ‘human capital’ and includes the human skills of know how, problem solving, technology development, decision-making and learning.
A point of concern is that Robson (2000, p 81) reports that the experts he interviewed came to the conclusion that the valuation of intellectual capital is more of an ‘art’ than a ‘science’. In true knowledge era style, they believe the person doing the valuation reflects the value of the valuation. This is an indication that subjectivity is accepted as an integral part of intellectual capital measurement. As such it could be expected that consultants specializing in the field of ‘subjective measuring’ will become sought after. It is, however, ideal that more objective ways in which to establish value should be developed. Whether objective or subjective, when designing measures it is important to remember that it is not sufficient to be a smart employee. One needs to be an effective member of the firm (Robinson and Kleiner, 1996, p 38). Rather than measuring an individual’s ability to deliver products, the most important aspect to measure is rather how well the knowledge workers communicate with the company’s customers (Sveiby, 1997, in Ramosedi, 2000, p 14). In order to communicate well with customers, staff members have to communicate well with each other and therefore contribution to and usage of the internal network becomes the next important issue to measure. Measuring intellectual capital does not only ensure that important issues receive the attention they deserve, it is also seen as an important step in determining how to measure general productivity improvement appropriately. Joia (2000, p 68) was able to show that, although knowledge may be intangible, it does not mean that it cannot be measured. Even so Zickner (1996, p 84), through her research on South African companies, Ramosedi (2000, p 77), in his research at a large financial institution, and Robson (2000, p 68), through his interviews with 10 senior executives, established that, notwithstanding the fact that a concerted effort is made to understand the impact of intellectual capital, evaluators still fall back on valuing and wanting to measure tangibles/hard numbers. No true accountant would, by merely listing indicators of intangible value, be able to bypass the generally accepted accounting practices and simply add intellectual capital to the company’s balance sheet. None of the authors consulted suggested that the balance sheet be totally ignored but, if the balance sheet is not the answer to the problem, the questions to ask are the following:
• What is a more appropriate tool? • What alternative structures for value reporting are available? • What does one measure?

4.7
BV + IC = MV
Where: MV = Market Value BV = Book Value = (MC + PC) MC = Monetary Capital PC = Physical Capital IC = Intellectual Capital = (HC+IVC+RC+SC) HC = Human Capital IVC = Innovation Capital RC = Relationship Capital/Customer Capital SC = Structural Capital/Process Capital
• How does one measure? • How does one calibrate the results?
This chapter attempts to answer these questions. However, before discussing the alternatives to balance sheets it is perhaps useful to briefly pause and look at the developments where intellectual capital becomes part of the balance sheet. 4.3 Financial formulae and measures The accountancy-profession is guided by generally accepted accounting practices (GAAP). These practices can be seen as universal ‘rules’ according to which a company’s books are balanced. GAAP tend to be very conservative and treat items like R&D and human capital as expenses. It is accepted that if the return on capital is greater than the cost of capital, then value is created and a project should be implemented. If one then wants to pursue the financial statement avenue, this financial theory of capital should be used as a model from which to develop the measurement of intellectual capital. Trying to put intellectual capital into a company’s balance sheet may sound logical and the research documented by, for example, Joia (2000, pp 68-83) showed that it could theoretically be factored in quite easily. Joia (2000, p 70) claims to base his findings on research carried out by a number of experts (Edvinsson and Malone (1997); Roos et al., (1997); Sveiby (1997); and Stewart (1997), in Joia (2000, p 70)). He reports that it is proposed that a corporate capital taxonomy be used when determining intellectual capital value for the sake of reflecting it in the balance sheet. Edvinsson and Malone (1997, in Joia, 2000, p 74-75) suggest that intellectual capital is the arithmetic mean of all its components. Intellectual capital components are: human capital, innovation capital, process capital and relationship capital. To change all this information into a financial formula one can say that: This equation shows that MV has a tangible portion BV, in addition to an intangible component IC. Hence, supposing MV minus BV is greater than zero (MV - BV > 0), it shows that the company needs to make provision for managing and measuring its

4.8
MV + (MV/q) = IC
intellectual capital. It can be assumed that the more knowledge-intensive the company is, the greater the IC value will be. Differing depreciation policies might of course influence the book value calculation of a company, which is where the Tobin q value comes in. This ratio measures the relationship between a company’s market value and its replacement value (i.e. the cost of replacing its assets) and was developed by the Nobel Prize-winning economist James Tobin. In order to circumvent the differing depreciation policies used by accountants world-wide, Tobin in 1969 suggested the use of replacement cost - q. He defined q as (market value)÷(replacement cost of the assets). If q is greater than one, the asset is worth more than the cost of replacing it; thus it is likely that the company will seek to acquire more assets of this kind. When using Tobin’s q, a company with a stock market value of R100 million and a book value of R25 million will have a Tobin’s q ratio of 4.00. In the long run, this ratio will tend towards 1.00, but evidence shows that it can differ significantly from 1.00 for very long periods of time. For example, companies in the software industry, where intellectual capital is abundant, tend to have a Tobin’s q ratio of 7.00, whereas firms in the steel industry, noted for their large capital assets, have a Tobin’s q ratio of nearly 1.00. According to Joia (2000, p 70), the formula becomes: As was seen with the depreciation of BV, it also needs to be considered for the IC part of the formula. Joia (2000, p 83) quotes the work of Argote, et al., (1998) and Jelle (1979) to inform the reader that there is a substantial component of organizational knowledge that depreciates rapidly. More research is necessary to identify the factors that affect the rate of learning and ‘forgetting’ in organizations. Similarly, Yelle (1979, in Joia, 2000, p 83) also indicated that identifying factors favouring an accelerated rate of learning is a promising area of future research. Knowing more about these two issues could allow investments on training and innovation to lead to better and quicker results than those achieved at present. Neither knowledge acceleration nor depreciation form part of this research and will therefore not be taken into consideration but it should be researched within the information services environment. Fortunately Joia (2000, p 74) suggests that it is not important to try and establish an absolute monetary value for intellectual capital. Rather variations should be tracked within its component values over the course of time. Joia did however test his intellectual capital measurement model in a case study with actual data. He found his model more accurate than that of Edvinsson and Malone. Yet he came to the conclusion that A long and arduous road still needs to be negotiated before we have reliable measurements for intangible capital (Joia, 2000, p 82). His results did indicate that a lack of investment in the development of more efficient and effective internal processes plus a disregard for the players involved (customers, suppliers and banks) lead to the fact that the intellectual capital score is jeopardized. In addition, the effects of heavy investments in human and innovation capitals take a while to be

4.9
fully implemented and felt. A ‘snapshot’ measuring methodology does not take these aspects into account. The Joia research reiterates the fact that the current balance sheet and income statement tools are able to present an X-ray or ‘snapshot’ of a firm. Balance sheets provide indications of how the company appears within a specific period, but are not reliable tools to perceive a company’s future performance. From further literature consulted, it is clear that the measuring of and reporting on intellectual capital should be seen as a tool separate but complementary to the balance sheet. Robson’s (2000, p 91) research also confirmed that financial experts do not see it as a feasible option to include intellectual capital on the balance sheet of a company within the current accounting framework. It confirms Stewart’s observation about the balance sheet not being the right instrument to record intellectual capital. This opinion is supported by Kaplan and Norton (2001a, p 88). Their argument is specifically directed at the fact that balance sheets usually reflect those items that have a direct impact on revenue and profit. Where intangible assets are concerned, there is usually no direct link between cause and effect and the time variation also depends upon uncontrollable circumstances. They see the balance sheet as an additive tool. In contrast, they are of the opinion that intangible assets need a multiplicative tool (Kaplan and Norton, 2001a, p 89). Nevertheless, it will in all probability still take a long time before both financial managers and investors take note of Stewart’s remark that balance sheets and income statements are part of the framework that fits the industrial enterprise, not the intelligent one (Stewart, 1997, p 58). Until then it will remain important that additional measures exist side by side with the traditional. These measures need to make provision for the facts that, within a knowledge era company:
• The most valuable employee is the one who is capable to perform at an expert skill level and is able to transfer that expertise to appropriate colleagues. Capturing or embedding that expertise within a system that is independent of the individual is ‘first prize’. If it is to be successful the measuring system needs to take into consideration all the stages between embarking on new learning experiences and transferring knowledge to appropriate systems.
• Customers are the engines of growth (Duffy, 2000, p 10) and success begins and ends with customer satisfaction (Fine, et al., 2002, p 72). No measuring methodology or tool is more important than providing a product or service that the customer is willing to support. Measuring customer capital and making use of the results of the measurement to ensure growth is fundamental in ensuring long term sustainability.
In line with these two facts, Garrick and Clegg (2000, p 280) report that although measures for intellectual capital have grown from dissatisfaction with conventional economic measures of value, the most desirable results remain in terms of profit margins or observable (measurable) outcomes. They stress that financial objectives represent the long term goal of the organization: to provide superior returns based on the capital invested in the unit. De Gooijer (2000, p 303-304) warns that most of

4.10
the solutions offered are geared towards profit-making commercial firms. She is of the opinion that solutions have had limited application for public sector management, especially when applied to measuring cultural change within an organization. As a last comment Lank (1997, p 409) asks: Would an investor put his money in a business that didn’t keep track of its financial assets? The answer to the question is quite obvious. It is therefore anticipated that, before too long, investors may be asking, as a key aspect of their due diligence process, how intangible assets are managed and this will indeed focus management attention onto this invisible and intangible source of value. The bottom line is therefore that appropriate measurements need to be established and developed urgently. A large number of measuring methodologies, where both balance sheets and intangible assets are evaluated, do exist. Fortunately Sveiby (2001a) identified 21 of these and provided structure in terms of what the aim of each method is. A table reflecting all the methods (Table 4.1 on page 4.13) is provided but, in short, according to his categorization there are four approaches to measuring intangible assets, namely:
• Direct intellectual capital methods (DIC) – where components are identified and valued.
• Market capitalization methods (MCM) - where the difference between market capitalization and stockholders’ equity is calculated.
• Return on assets (ROA) – where tangible assets and the annual financial growth figures are compared to the industry average. Above average earnings are then utilized to estimate the value of intangible assets.
• Scorecard methods (SC) – where the various components of intellectual capital are identified and reflected in terms of scorecards or graphs.
The purpose of measuring intellectual capital growth within the context of this research, in all probability, differs vastly from that of a listed company with investors. Listed companies would want to provide proof that the company is viable and that it would continue to make a handsome profit. Within this research the aim is rather to provide proof of sustainable, efficient service and that the investment made by the company is to the benefit of all the knowledge workers within the company as a whole. It is also to establish ultimately where the service fits into the company’s virtual structure: is it purely support or truly an indispensable part of its learning cycle. Taking the context of this study into consideration, it is especially the scorecard-type methods of measuring intangible assets that were found to be of interest. 4.4 Available measurement methodologies It was thought that the work done by Robson (2000), where he investigated the internal valuation of intellectual capital, would contribute largely to this research. Unfortunately this was not the case. He did confirm the opinion that internal valuation forces management to acknowledge that they are responsible for more than just the company’s tangible assets. Management is in effect ‘forced’ to focus on the real drivers of value in a knowledge-based organization. However,

4.11
disappointingly he came to the conclusion, from the experts he consulted, that the valuation of individual components is seen as too time consuming and intensive to do regularly. The experts would base valuations on the interaction of all the company’s assets, rather than value individual assets and then aggregate these values into an implied valuation for the entire company (Robson, 2000, p 94). The same valuation of tangible assets was therefore still being used irrespective of the company’s asset base. In effect the difference between physical and intellectual assets were ignored. Robson ascribed this tendency largely to the absence of reliable measuring methods, which of course is a useful excuse to fall back into comfort zone techniques. In reporting on the results of his research, Robson (2000, pp 84-85) indicated that, notwithstanding the fact that experts see the danger of over-simplifying complex and inter-related concepts when trying to take advantage of the opportunity inherent in intellectual capital management, they also believe that instinctive judgement of the value of intellectual capital was sufficient as a basis for making management decisions relating to the value of internal intellectual capital. In his opinion a broader understanding of intellectual capital as a concept should improve the situation but, for the present, an instinctive ‘gut-feel’ to decide if one is creating or destroying intellectual capital was thought to be sufficient for ‘day-to-day’ management of a company. Again the complexity of the valuation methods was seen to prohibit the collection and recording of intellectual capital values over time. He acknowledged that there is a need to establish how to value ‘potential’ if there is no historical data. He acknowledged the danger of speculation about either the future earnings or the future market size as both have the risk of flawed and biased judgement. He conceded that if it is not possible to improve the valuation, the answer was to establish a method to evaluate the valuation and the evaluator rather than evaluate the company. This may be logical but it appears to be an academic exercise rather than finding a simple solution. After the initial brush with balance sheet type measures and the disappointing conclusions from Robson’s research, it was decided to follow the advice given by Sveiby (2001a) and Bontis, et al., (1999, p 392) and start at the beginning. This meant gaining an overview of all the available techniques before attempting to identify any one reliable technique. Fortunately the task was less daunting than expected. Authors such as Bontis, et al., (1999) and Sveiby (2001a) had already attempted to collect and evaluate all the available measuring techniques and the exercise was therefore a fairly easy one. Kaes (1999) gave in depth insight into the rationale, purpose, approach, tools, advantages and disadvantages of a number of the measuring techniques. Sveiby’s (2001a) list of possible measuring techniques is, however, more complete and is reflected in Table 4.1 on page 4.13. Although Bontis, et al., (1999) identified only four of the groupings (their research was published two years prior to Sveiby’s), they did provide the advantages and disadvantages of some of these techniques. As a further enhancement of Sveiby’s work, the activity based costing methodology for human capital valuation, identified by Leibowitz and Wright (1999, p 102), was added. Lastly, Table 4.1 also gives an indication of the elimination process followed to establish which methodologies to investigate/not investigate any further.

4.12
Table 4.1: Overview of intangible assets measures (modified1 version of Sveiby (2001a)) DIC - Direct Intellectual Capital Methods MCM - Market Capitalization Methods ROA - Return on Assets SC - Scorecard Methods Label Major Proponent Category Description of Measure Suitability within the research
context Technology Broker Brooking (1996) DIC Assesses the value of the intellectual capital of a firm
based on a diagnostic analysis of a firm’s response to 20 questions covering four major components of intellectual capital.
Has possibilities but appears subjective. The questions will have to be evaluated for relevance. It also appears to require an advanced stage of development that is not realistic within this research. Not suitable
Citation-Weighted Patents
Bontis (1996) DIC Calculates a technology factor based on the patents developed by a firm. Intellectual capital and its performance is measured based on the impact of research development efforts on a series of indices, such as number of patents and cost of patents to sales turnover, that describe the firm’s patents.
No patents were or are being developed. Not suitable
Inclusive Valuation Methodology (IVM)
McPherson (1998) DIC Uses hierarchies of weighted indicators that are combined, and focuses on relative rather than absolute values. Combined Value Added = Monetary Value Added combined with Intangible Value Added.
Appears to be too complex for the context of the research Not suitable
The Value Explorer™ Andriessen and Tiessen (2000)
DIC Calculates and allocates value to five types of intangibles: (1) Assets and endowments, (2) Skills and tacit knowledge, (3) Collective values and norms, (4) Technology and explicit knowledge, (5) Primary and management processes.
Taking the context of the research into consideration, accounting methodologies were not seen to be suitable. Not suitable
1 The work of Liebowitz and Wright was not reflected in Sveiby’s (2001a) version of this Table.

4.13
Label Major Proponent Category Description of Measure Suitability within the research context
Intellectual Asset Valuation
Sullivan (2000) DIC Methodology for assessing the value of Intellectual Property.
Supporting literature was not retrieved but based on Sveiby’s categorization this methodology will in all probability be too complex within context. Not suitable
Total Value Creation, TVC™
Anderson and McLean (2000)
DIC A project initiated by the Canadian Institute of Chartered Accountants. Uses discounted projected cash flows to re-examine how events affect planned activities.
Taking the context of the research into consideration accounting methodologies were not seen to be suitable. Not suitable
Accounting for the Future (AFTF)
Nash H. (1998) DIC A system of projected discounted cash flows. The difference between AFTF value at the end and the beginning of the period is the value added during the period.
Taking the context of the research into consideration, accounting methodologies were not seen to be suitable. Not suitable
Tobin’s q Stewart (1997) Bontis (1999)
MCM The q is the ratio of the stock market value of the firm divided by the replacement cost of its assets. Changes in q provide a proxy for measuring effective performance or not of a firm’s intellectual capital.
Taking the context of the research into consideration accounting methodologies were not seen to be suitable. Not suitable
Investor assigned market value (IAMV™)
Standfield (1998) MCM Takes the company's true value to be its stock market value and divides it into tangible capital + (realised IC + IC erosion + SCA (Sustainable Competitive Advantage)
Stock market value is not an appropriate measure within the context of this research. Not suitable
Market-to-Book Value Stewart (1997) Luthy (1998)
MCM Considers the value of intellectual capital to be the difference between the firm’s stock market value and the company’s book value.
Stock market value is not an appropriate measure within the context of this research. Not suitable
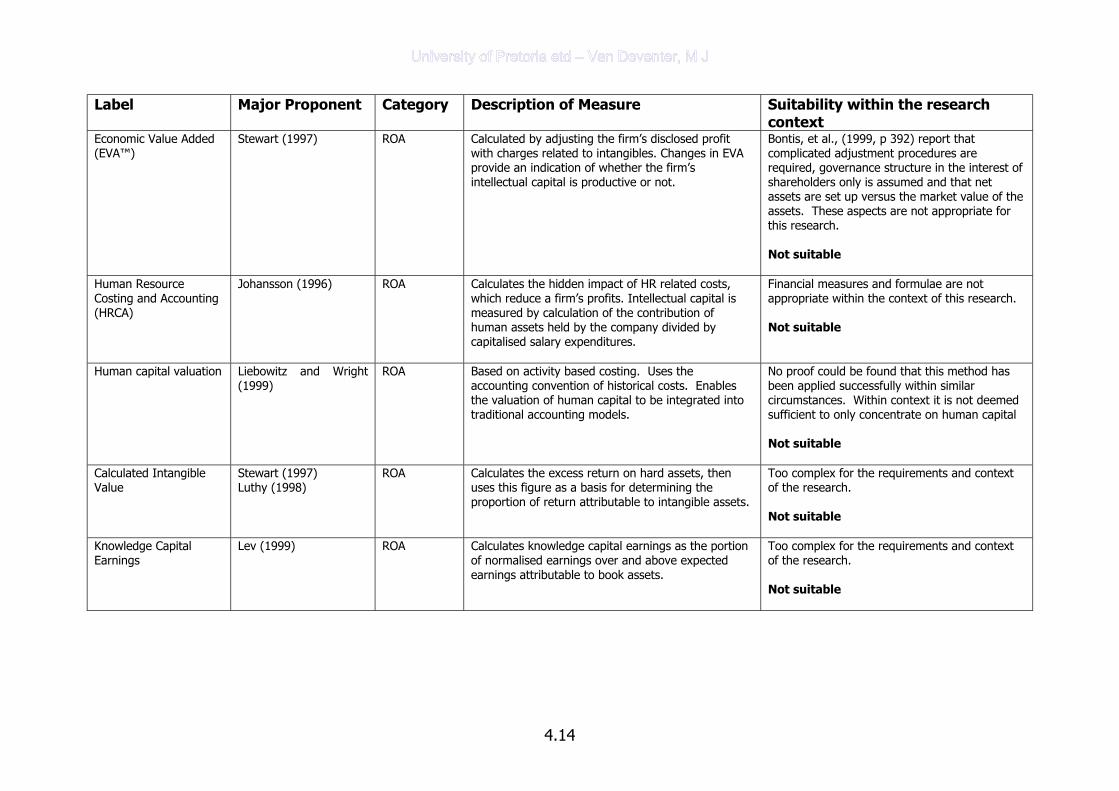
4.14
Label Major Proponent Category Description of Measure Suitability within the research context
Economic Value Added (EVA™)
Stewart (1997) ROA Calculated by adjusting the firm’s disclosed profit with charges related to intangibles. Changes in EVA provide an indication of whether the firm’s intellectual capital is productive or not.
Bontis, et al., (1999, p 392) report that complicated adjustment procedures are required, governance structure in the interest of shareholders only is assumed and that net assets are set up versus the market value of the assets. These aspects are not appropriate for this research. Not suitable
Human Resource Costing and Accounting (HRCA)
Johansson (1996) ROA Calculates the hidden impact of HR related costs, which reduce a firm’s profits. Intellectual capital is measured by calculation of the contribution of human assets held by the company divided by capitalised salary expenditures.
Financial measures and formulae are not appropriate within the context of this research. Not suitable
Human capital valuation Liebowitz and Wright (1999)
ROA Based on activity based costing. Uses the accounting convention of historical costs. Enables the valuation of human capital to be integrated into traditional accounting models.
No proof could be found that this method has been applied successfully within similar circumstances. Within context it is not deemed sufficient to only concentrate on human capital Not suitable
Calculated Intangible Value
Stewart (1997) Luthy (1998)
ROA Calculates the excess return on hard assets, then uses this figure as a basis for determining the proportion of return attributable to intangible assets.
Too complex for the requirements and context of the research. Not suitable
Knowledge Capital Earnings
Lev (1999) ROA Calculates knowledge capital earnings as the portion of normalised earnings over and above expected earnings attributable to book assets.
Too complex for the requirements and context of the research. Not suitable

4.15
Label Major Proponent Category Description of Measure Suitability within the research context
Value Added Intellectual Coefficient (VAIC™)
Pulic (1997) ROA (does not quite fit any of the categories)
Measures how much and how efficiently intellectual capital and capital employed create value based on the relationship to three major components: (1) capital employed; (2) human capital; and (3) structural capital.
Does not make provision for customer /stakeholder capital. Not suitable
Human Capital Intelligence
Jac Fitz-Enz (1994) SC Collects and benchmarks sets of human capital indicators against a database. Similar to HRCA.
No benchmark database is readily available. The context of the research does not warrant the effort in creating such a database. Within context it is also not deemed sufficient to only concentrate on human capital Not suitable
Skandia Navigator™ Edvinsson and Malone (1997)
SC Measures intellectual capital through the analysis of up to 164 metric measures (91 intellectually based and 73 traditional metrics) that cover five components: (1) financial; (2) customer; (3) process; (4) renewal and development; and (5) human.
May be too complex but further investigation is required. Possibly suitable
IC-Index™ Roos, Roos, Dragonetti and Edvinsson (1997)
SC Consolidates all individual indicators representing intellectual properties and components into a single index. Changes in the index are then related to changes in the firm’s market valuation.
May be too complex but further investigation is required. Bontis, et al., (1999, p 392) report that this method is flexible; dynamic; allows for partial external comparison; and can also be utilized by not-for-profit organizations Possibly suitable
Intangible Asset Monitor Sveiby (1997) SC Management selects indicators, based on the strategic objectives of the firm, to measure four major components of intangible assets: (1) growth (2) renewal; (3) efficiency; and (4) stability.
Appears to be applicable within the context of this research. Possibly suitable

4.16
Label Major Proponent Category Description of Measure Suitability within the research context
Value Chain Scoreboard™
Lev B. (forthcoming) SC Arranges a matrix of non-financial indicators in three categories according to the cycle of development: Discovery/Learning, Implementation, Commercialisation.
Holds promise as its fits in with the strategy of the mother organization. Possibly suitable
Balanced Scorecard
Kaplan and Norton (1992)
SC Measures a company’s performance through indicators covering four major focus perspectives: (1) financial perspective; (2) customer perspective; (3) internal process perspective; and (4) learning perspective. The indicators are based on the strategic objectives of the firm.
Appears to be applicable within the context of this research. Bontis, et al., (1999, p 392) claim that the methodology has powerful logic; clear correlation between indicators and financial performance as well as well-developed and consistent literature. Possibly suitable

4.17
4.5 Selected measuring methodologies What appeared to be a fairly superficial evaluation - as reflected in Table 4.1, proved to be valuable in deciding to investigate only the scorecard methods of evaluation. As a group, within the context of this study and taking the wider CSIR into consideration, these techniques were deemed more appropriate. 4.5.1 Skandia Navigator™ Skandia regards its Navigator as a future-orientated business-planning model. The Skandia Navigator, which shows similarities with the balanced scorecard, was developed in 1994 to provide Skandia with a measuring and reporting tool. It makes provision for historical measurements (financial focus), present day measurements (customer and process focus) and the measurements required of a future organization (renewal and development focus) (Skandia, 1998, p 5). According to Edvinsson (1997, p 366), Skandia makes use of the same model when it does employee performance appraisal and rewards assessment. This ensures that the reward system is balanced: that both the financial and the non-financial aspects feature as focus areas. This information was confirmed in their 1998 annual report. To develop their Navigator, Skandia identified almost 200 indicators to take a snapshot of the six different subsets of their intellectual capital (human, structural, customer, organizational, innovation and process). Some of these are reflected in Table 4.5 on page 4.39. From the Skandia intellectual capital report it appears that subsidiary companies each select the indicators that are relevant to that specific company, which is appropriate when considering the reason why the Navigator was developed. Leibowitz and Wright (1999, p 101) and Kaes (1999, p 137) criticise the Navigator for the following reasons:
• There is an amalgam of both quantitative and descriptive measures without a common basis of measurement.
• The measures are infused with subjectivity that is difficult to generalize over organizations. Kaes goes as far as to say that the use is limited because of the unstandardized approach that underlies the index.
• There is an inadequate treatment of the external environment, i.e. the exclusive focus on customers.
• The static intellectual capital flows are not incorporated. • The index was designed specifically for a service company which limits its
applicability to other industries. In addition to the criticism expressed by Kaes and Leibowitz and Wright, it is also necessary to add that, although the Navigator is seen as the benchmark in measuring intangible assets, the multitude of measuring elements is not appropriate in the given environment. It also does not appear to make provision for the full picture within the context of this research, which is in all probability due to the fact that the company backgrounds differ to the extent that they do.

4.18
Customer’s customers
Customers
Suppliers/Partners
Company
Supplier Company Customers Customers’ customers
Traditional value chain constellation
Cluster constellation
4.5.2 IC-Index™ and its related activity digital IC-landscaping Skandia, recognising some of the weaknesses in the Skandia Navigator, developed a method through which to manipulate and display the results. Basically it requires that a number of indicators be devised or identified. The indicators are then consolidated to form a measurement tool that can dynamically describe intellectual capital and its development over time. It allows for the comparison between changes in intellectual capital and changes in the company’s market value, thereby gaining a prognosticating value (Skandia, 1998, p 5). With the exception of the reference to digital landscaping, no literature referring to the IC-Index published after 1998 could be traced. Sveiby’s (2001a) description of the methodology, the disadvantages identified by Bontis, et al., (1999) and the definition provided by Skandia pointed to this being a methodology that concentrated on growing shareholder value. As such the methodology would not be suitable and as a result further investigation was abandoned. For interest sake, it was, however, decided to briefly look at the development of digital landscaping as it is based on the IC-Index™ methodology. Digital IC-landscaping Digital IC-landscape is a methodology based on multi-dimensional scaling and mathematical statistics. It supports the pedagogical display of IC complexity, migration of IC-affecting knowledge, exploratory retrieval of high IC efficiency, investment planning and forecasting (Edvinsson, Kitts and Beding, 2000, p 263). To illustrate their point, these authors investigated 11 companies using 20-40 essential variables and a number of free parameters. In contrast to the value chain methodology, which is described in section 4.5.4 on page 4.21, Edvinsson, Kitts and Beding (2000, p 264) are of the opinion that value addition no longer occurs in a linear fashion. In classical value chain style, a product moves from the supplier, to the company, to the customer and finally to the customer’s customer. In the knowledge economy, the value chain turns into a value cluster constellation where all are interlinked. Figure 4.1, below, represents the formations graphically. Fig 4.1: Value chain and value cluster constellations

4.19
The purpose of digital IC landscaping is to collect ‘flat’ information and to put it into the digital environment where it is possible for managers to play ‘what if’ games in terms of their intellectual capital development. The result strongly resembles a geographical map where the peaks and valleys are depicted by contour lines. Fascinating as these 3-D graphs are, they were seen to be far too complex for application within the context of this study and as a result were not investigated any further. 4.5.3 Intangible Assets Monitor The Assets Monitor framework makes provision for both tangible and intangible assets. Intangible asset indicators are then grouped into three subsets, namely external structure, internal structure and individual competencies. Each of these framework items requires that the growth rate, the renewal activities, the efficiency and the associated stability or risk be investigated (Sveiby, 1998c). In contrast to the common assumption, Sveiby (2001b) claims that the intangible asset monitor was conceptualised, independent of the balanced scorecard concept, in Sweden between 1986 and 1987. He argues that the measure should not be seen as yet another control mechanism and that the results of the measure should be used to learn and to enter into dialogue. He admits that the asset monitor shows the following similarities with the balanced scorecard:
• it suggests that financial indicators need to be complemented with non-financial indicators to measure sustainability;
• it categorises the non-financial indicators into three components; • it argues that the non-financial indicators must be moved from being
operational in nature to the strategic level; • it sees strategy as the key driver of the metrics that are designed; • it sees change should be seen as the most important aspect of the measure;
The theoretical differences between the two systems lie in the following factors:
• The assets monitor is based on the notion that people are an organization’s only profit generators. People are not seen as a cost but as revenue creators and the source of wealth creation.
• The Asset Monitor treats profits generated as signs of success and not as the originator of success;
• The Asset Monitor acknowledges that intangible ‘structures’ are created as a result of human actions. These structures can be directed outward (contact with customers and suppliers) or inward (work teams). The structures in themselves also have value.
• The assets monitor is based on the stock-flow theory, which is the basis of traditional accounting theory. As a result the monitor sets out to measure the change in assets such as development, growth, renewal, efficiency and the risk associated with losing the assets.
• The external structure includes customers, suppliers and other external stakeholders. Especially not-for-profit and public sector companies find it
4.20
difficult to see their ‘customers’ in the same light as commercial companies do.
• The assets monitor requires that companies go through a redesign process. The purpose would be to be more knowledge focused. The company is therefore not just rolling out its strategy better but is also improving the quality of the strategy itself.
The latest development in Kaplan and Norton’s (2001a, p 101) balanced scorecard for public sector companies, where the value creation component and stakeholders were added, was in all probability an effort to compensate for at least some of the differences identified by Sveiby. It does appear though that the main difference between the Asset Monitor and the Balanced Scorecard lies in the focus of each. It appears that the Intangible Asset Monitor focuses on human capital while the Balanced Scorecard focuses on strategy. In terms of the disadvantages of the Intangible Asset Monitor, Kaes (1999, p 137) did point out the following:
• the strong focus on employees might lead to neglect of important areas of structural capital;
• inadequate treatment of the external enviroment, i.e. the exclusive focus on customers;
• the explicit focus on service and know-how companies which makes it less relevant to other industries;
• the static intellectual capital flows are not incorporated; and • there is no link to financial capital performance.
Notwithstanding the weaknesses, the Intangible Asset Monitor did appear to be a suitable methodology for measuring progress within the context of this research. Because it is already visible that there are overlaps in what is required for measurement and because of the clear advantages in the next two methodologies to be discussed, it is already anticipated that it would in fact not be one single methodology that would be appropriate for use but rather a combination of methodologies that would provide the most suitable solution. 4.5.4 Value Chain Scoreboard™ The idea behind the value chain scoreboard is to find and score appropriate measures for each of a number of value chain stages. The purpose is to ensure that growth occurs to ensure that the company is able to keep pace with the increase in speed requirement of the new economy. The original work could not be traced but, according to Sveiby (2001a), Lev’s value chain identifies discovery, implementation and commercialisation stages. These stages are similar to the discovery, investigation and consumer testing phases identified by Czerniawska and Potter (1998, pp 74-85). Because their work particularly refers to a typical research environment, which is the context of this study, it was decided to use that rather than to refer back to Lev. Evaluation or scoring of the value chain cannot be done at leisure. Speed (of delivery) is the single most important factor that impacts on knowledge economy

4.21
businesses. Therefore, the company’s value chain also needs to allow for the acceleration of delivery of products and services (at least at the same level but preferably an improved level of quality) to its customers. If this is not possible, the company has not yet made the shift into the knowledge economy competitive arena. Without that basic understanding, it will be even more difficult to understand intangible value chains. Napster, a web service that allowed for the sharing of music in MP3 format, is often used as an example to illustrate value chains within the e-business environment. It is also often quoted as an example to illustrate that, if one does not understand the impact of the changed environment upon your value chain, you could, as the music industry has done, lose all control over the really valuable portion of the supply chain. By succeeding to close Napster down, the industry opened the opportunity for a number of anarchists who are now devoted to making music files available free of charge and who are causing huge losses to the formal industry (Fine, et al., 2002, p 69). The identification of a virtual (or intangible) component to value chains comes from work that was published in 1995 by Rayport and Sviokla (in Czerniawska and Potter, 1998, p 67). They argued that within physical value chains, information is part of the supporting infrastructure. Once the value within the virtual value chain is understood, it becomes an asset to be managed just as a physical value chain. The reason why the virtual value chain is, more often than not, not valued is that both the processes (making connections between disparate pieces of data and selecting, analysing, extracting and distributing data) as well as the customers (staff members within your own organization who need the information for their own processes) are virtual. To explain the concept, Czerniawska and Potter (1998, p 67) provided an analogy of the modern school. The physical value chain refers to the children moving through the system from one grade to the next until they are able to leave having attained an expected minimum standard of education. When analysing the virtual value chain, the strengths and weaknesses of both teachers and children are assessed. The state of knowledge within the children is established prior to class and the effect of the teaching is measured afterwards. The aim would be to change and improve the teaching to the class as a whole and to individual children. The overall effectiveness of the school could then be measured and benchmarked against other schools. The first step is therefore to monitor and improve the virtual process. Within the information services this would refer to personalization of both end user training and access to information sources. When the intangible value within the chain has been maximised, the next step is to replace processes where necessary. A library example of this is where patrons, who were previously expected to visit the library to gain access to information, now have desktop access to electronic full text which was scanned from a physical document and forwarded electronically, or where the information specialist has negotiated access to a publisher’s full text content and taught the member of staff to help himself.

4.22
As a third step in value chain methodology utilization, it is also possible to create new products for new customers, if the value chain is exploited to its full potential. Linking back to the library example, the information gained from patron feedback could be sold to (or exchanged with) suppliers to improve their products. Needs that are expressed could be sold to other role players so that new products to address those needs could be created. Once the benchmark identifies your service as the best in the market, it is of course also possible to sell the service to customers outside the company walls. Perhaps what is most valuable from the whole process, is the continuous positive, active cycle (or chain) of innovation and improvement that works to the benefit of all parties involved in it. The faster the development is in underlying technologies of a product or system, the more likely it is that the relevant section of the value chain will be prone to rapid innovations. It is therefore more likely that one would require higher ongoing knowledge investments to maintain technological competency (Fine, et al., 2002, p 72). The best growth position to be in is when a section of your value chain has competitive advantage in an area where there is high customer importance evaluation and technologically there is a relatively fast rate of development. The trick is to identify and take advantage of such a niche area. Similarly, if it is cheaper to outsource a section of the supply chain, where the company does not hold competitive advantage, to a reliable supplier, the company should do so. As was mentioned at the beginning of this section, Czerniawska and Potter’s work (1998, pp 74-85) is of particular interest because they identified an intangible value chain within a research environment. Their value chain refers to the discovery or creation of a new idea, the investigation of the feasibility of that idea and then lastly the testing of the idea on the consumer. This value chain could easily be adapted to indicate the significance for and the impact of information services on the various stages of both the tangible and intangible value chains of a research organization. Figure 4.2 on the next page is an attempt to illustrate the significance of the value chains for information services.

4.23
Fig 4.2: Value chains in information services
Looking at the physical value chain of a research organization and the contributions information specialists/librarians make to it, it can be clearly seen that much of the visible or tangible contribution is reactive-proactive. The customer is not aware of any activity prior to the identification of a project. The researcher requests information and only then does the information specialist start identifying appropriate sources of information. During the research phase, the information products are acquired and maintained while some assistance is given to maintain and or develop intellectual property products (typically research reports) after the research is completed. Within the intangible chain, the information specialist pro-actively ensures that connections are made and maintained not only to sources but also to a variety of minds (knowledgeable people). During the investigation phase, the information professional compares and analyses sources of information in order to recommend the most reliable or most suitable when the researcher needs to gain access to it. During the consumer testing phase, the information professional either co-develops with the researcher or prepares products and services that can be utilized as direct input by the researcher. This idea is developed further through Table 4.2 on the following page. The table was created from a combination of Czerniawska and Potter’s ideas and the skills identified by Marshall, et al., (1996).
Intangible chainTangible chain
Consumer testing
Investigation
Discovery Making connections
Analysis and comparison
Co-develop enhanced products
Project acquisition
Projectresearch
Project delivery
Acquire and maintain information products
Maintain intellectual property products
Identify sources
Accelerated speed of developm
ent

4.24
Table 4.2: Information specialist contribution to the intangible value chain activities of a typical research organization Intangible value chain stage
Activities Methods IS Inputs to the new value chain
Skills required
Discovery • Synthesise your own and others’ ideas
• Take an existing approach and modify it for a new situation
• An idea that was introduced in one context can be applied in another
• Experiment with a definite goal to see what will happen
Old • Read • Attending
conferences • Hold discussions
with colleagues New
• Communication technology is utilized to accelerate the exchange of ideas
• The Internet allows the researcher to choose his sources where previously he depended upon an intermediary to choose on his behalf
• Information is always on tap – one just needs to identify the source
• Assess and evaluate information supply chains
• Enable access to reliable information sources
• Negotiate favourable deals with reliable information suppliers
• Provide staff with access to push, pull and push-pull information
• Provide access to information generated internally
• Transfer information from the physical (paper) to the virtual (electronic) domain
Value created • Client
experiences an increase in speed and scope of information
• Increased productivity of the researcher
• Increase in efficiency of the researcher
• Overview (balcony vision)
• Critical evaluation • Technical/ICT
manipulation • Negotiation – with
suppliers and users
• Ability to make connections – connecting minds and data
• Sifting, sorting, maintaining information collections – virtual and physical
Investigation • Experiment to find feasible solutions
• Develop drawings
• Develop proto-types
Old • Laborious, labour
intensive laboratory tests
• Expensive (and sometimes risky) in-situ tests
New • Mathematical
models are run against a database of possible solutions
• Making designs
• Maintain databases of possible solutions
• Identify and track experts
• Capturing lessons learnt
• Automating literature searches
• Teach users to exploit the full capacity of available commercial
• Database creation, maintenance and manipulation
• Communication skills
• Training • Facilitating
communities of practice and cross functional teams
• Expert searching skills including the creation and maintenance of

4.25
Intangible value chain stage
Activities Methods IS Inputs to the new value chain
Skills required
available for comment and improvement by peers – in a 24 hour working shift of global participation
• Virtual testing in simulation environments
• Cross functional teams
information products
• Monitor new developments and pushing the information to the researchers
Value created • Access to ‘free’
solutions for the researcher (cost saving)
• Re-invention of the wheel minimized (increased productivity)
• Reduced lead time (time saving)
SDI and alerting facilities of databases and the Internet
• Expert indexing, reducing retrieval of noise
Consumer testing
• Exposing customers to the result of the research conducted
• Turning an experiment into a viable business opportunity
Old • Marketing to clients
after prototype has been tested
• Variety of attempts to gain funding
New • Co-development by
known customers • Inputs from
unknown customers (via the Internet for example)
• Individualization or personalization of consumer goods
• Physical domain testing is the very large test at the end of the process
• Pro-active identification of potential customers
• Building customized portals and extranets and identifying/main- taining content in collaboration with customers and consumers
• ‘Market scanning’ and analysis
• Maintaining a database of records of interactions, actions taken, lessons learnt
Value created • Adding to the
efficiency and professional image of the researcher
• Analytical skills for needs identification and analysis
• Identification and selection of relevant information to be shared between all partners
• Skills to use relevant technology effectively – includes expert knowledge of web and database applications
Both Figure 4.1 and Table 4.2 provide valuable insight into the intangible aspects that needed to be considered when developing human capital.

4.26
4.5.5 Balanced Scorecard and its sub-entities If literature volume was the only criterion to use, this methodology would easily be judged as the most popular. This is in all probability part of the reason why the sub-entities: knowledge management performance scorecard and balanced scorecard strategy maps, came into being. The balanced scorecard approach, to measure corporate performance, was developed and introduced in 1992 because Kaplan and Norton realised that companies, even though they may understand the value of non-physical assets, were not able to reliably measure the non-tangibles (Kaplan and Norton, 2001a, p 88). They saw that there was a widening gap between the short term financial goals and the longer term strategic goals and identified a scorecard that they felt would give companies a means to bridge the gap. In addition Kaplan and Norton (1996, pp 75-77) identified four ‘new’ business processes for those who introduced their balanced scorecard methodology. These processes were:
• Translating the words in the company’s vision and strategy into an integrated set of objectives and measures that all executives could and would agree on.
• Communicating and linking the company’s vision and strategy so that the organization as a whole could understand the long term strategy.
• Integrated business planning, which allows for the allocation of finance and other resources to initiatives that work towards realising long term goals.
• Feedback and learning not only from the short term financial point of view but from three additional perspectives, namely customers, internal business processes and staff learning and growth.
Keeping the above in mind, it is possible to say that the crux of the balanced scorecard methodology is that it provides management with the tools to learn at executive level – where strategic learning needs to take place. It provides the opportunity to translate company vision and strategy into measurable objectives with targets and initiatives. Mooraj, Oyon and Hostettler (1999, p 484) confirm this by stating that, even though it can be regarded as a control mechanism, they regard the balanced scorecard as part of the planning cycle of management science. Kaplan and Norton saw it fit to identify four areas in which to develop these objectives, namely:
• financial (to succeed financially how to appear to shareholders); • internal business processes (to satisfy your customers and shareholders what
business processes should you excel at); • learning and growth (to achieve the vision how to sustain ability to change
and improve); and • customers (how to appear to customers).
Figure 4.3 on the next page provides a graphical representation of the above.

4.27
Fig 4.3: Balanced scorecard framework (in Mooraj, Oyon and Hostettler, 1999, p 481)
The intention is that management sets objectives for each of the four business objectives. Indicators to measure are then identified for the objectives. Targets are set for each of the indicators and initiatives are identified to ensure that targets are met. The balanced scorecard is meant to be more than just developing a checklist to measure managers’ performance. Kaplan and Norton (2001a, p 87) are of the opinion that the only way to ensure that the scorecard does not become a checklist is to continually emphasise the linkage with strategy. It is easy to recognize that the scorecard encourages the development of human, structural and customer capital. This technique therefore appeared to be very suitable for measuring the impact of intellectual capital activities on the development of a service such as that provided by CSIR IMPS. Kaplan and Norton (2001b, pp 147-155) identified five principles to be upheld when using their methodology. These principles are the following:
• translate the strategy into operational terms; • align the organization to the strategy; • make strategy everyone’s everyday job; • make strategy a continual process; • mobilize leadership for change.
Objecti
ves
Targ
ets
Indic
ator
sMea
sure
s
To achieve our vision, how will we we sustain our ability to change and improve?
Learning and growth
Objecti
ves
Targ
ets
Indic
ator
s
Measu
res
To succeed financially, how should we appear to our shareholders?
Financial
Objecti
ves
Targ
ets
Indic
ator
s
Measu
res
To achieve our vision, how should we appear to our customers?
Customer
Objecti
ves
Targ
ets
Indic
ator
s
Measu
res
To satisfy our shareholders and customers, what business processes must we excel at?
Internal business processes
Vision and Strategy

4.28
It is a good start to define and communicate vision and strategy throughout the organization. However, to ensure that each individual aligns with the activities Kaplan and Norton (1996, p 80) advise that each employee is informed and receives education as to what the scorecard activities really mean, that each and every employee sets goals in alignment with the company’s strategy and that the company links rewards to performance measures. When this is managed correctly, each individual’s responsibility towards the company achieving its goals can be identified. Looking at the matter from another angle, the contribution of each individual to the company reaching its goals can be identified and, in effect, his/her reward determined. The danger/risk lies in the fact that, as soon as reward is linked directly to a measure, the measuring instrument becomes more important than the contribution, that is being measured. A further point of concern, which is directly applicable for this study, is that in a commercial company where financial gain is the goal, the customer who pays for and receives the service is usually one and the same. In not-for-profit organizations this is usually not the case. In not-for-profit organizations those who pay do not, as a rule, directly reap the benefits derived from the investment. Because of this, these not-for-profit organizations usually put the stakeholders instead of financial gain at the top of their ‘scorecard’. De Gooijer’s work, reflected in the next section, is an example of this. Kaplan and Norton (2001a, p 99) suggest that, instead of placing the stakeholder in such a prominent position, the mission should in such cases rather be placed at the highest level. (For example a law enforcement agency will have a safe and crime free environment as the highest level of the scorecard or an information service could have the development of an informed, information literate body of staff members as its mission.) As a result of their observations, Kaplan and Norton adapted the original scorecard framework specifically for not-for-profit organizations as indicated in Figure 4.4 on the next page.

4.29
Fig 4.4: Adapted balanced scorecard framework (Kaplan and Norton, 2001a, p 100) Kaplan and Norton realised that, even when the scorecard framework is adapted, the advantage of having the service does not get sufficient attention. They therefore developed a model through which public sector agencies could develop their objectives. This model (Kaplan and Norton, 2001a, p 101) was utilized to create the model reflected in Figure 4.5. The model makes provision for the development of objectives and measures in terms of the four items identified previously (finance, customers, processes and growth) but brings in the notion of value addition. It also places the customers and the stakeholders at the same level.
Objecti
ves
Targ
ets
Indic
ator
s
Measu
res
To achieve our vision, how must our people learn, communicate and work together?
Learning and growth
Indic
ator
s
Objecti
ves
Targ
ets
Measu
res
If we succeed, how will we look to our financial donors?
Financial
Objecti
ves
Targ
ets
Indic
ator
sMea
sure
s
To achieve our vision, how should we look to our customer?
Customer
Measu
res
Objecti
ves
Targ
ets
Indic
ator
s
To satisfy our customers, financial donors, and mission, what business processes must we excel at?
Internal Business Processes
The Mission

4.30
Value/Benefit of the service
Human capital development
Structural capital development/ Internal structure
Stakeholder strategy/ Financial support
Customer/ Supplier capital development/ External structure
Mission
Fig 4.5: Framework for the evaluation of information services (adapted from Kaplan and Norton (2001a, p 101)) From Figure 4.5 one can determine that the development of both human and structural capital is subordinate to the value of the service. Value should be measured against the mission of the service. The model makes provision for the fact that not all human capital can and should be transferred to structural capital and, similarly, customers are also able to add value by providing feedback and engaging in interaction. Stakeholders may not benefit directly from the value provided by the service but, by ensuring that the mission of the service is in line with stakeholder strategy, stakeholders ensure alignment with their own focus. Customers benefit from the value created with stakeholder support (usually in monetary format) but need to be in direct contact with stakeholders as well. Such contact ensures that stakeholders are aware of their needs when providing input to the development of the service mission. In general, literature consulted was very positive about the use of balanced scorecards. Mooraj, Oyon and Hostettler (1999, p 484-486) identified the following advantages of using the methodology:
• a dramatic increase in productivity;

4.31
• a significant increase in an individual’s ability to identify his role in the success of the business;
• communication and understanding of the holistic system; • balanced information in a concise way; • an environment which is conducive to learning; • elimination of the uncertainty of which control system to use in what situation; • a good tool to define and disperse core values; and • prevention of conflict where each employee knows what to do as well as the
reason behind what needs to be done. However, of particular interest was the warning that culture has an influence over the success of a balanced scorecard. Mooraj, Oyon and Hostettler (1999, pp 487-488) identified the following three types of culture to take into consideration:
• National culture (for example the Americans are very much focused on creating shareholder value, the Europeans for rewarding all who have an input and the Japanese on creating long term relationships).
• Professional culture (some professions have unwritten or informal rules. When an attempt is made to turn these into formal rules it apparently causes problems.)
• Organizational culture (a scorecard that is not congruent with the organizational structure and management style will cause confusion throughout the organization).
Should a balanced scorecard methodology be deployed, it will be necessary to ensure that it is in line with the existing CSIR scorecard or basket of measures. Professional culture was not seen as a particular threat as none of the employees affected by this study belong to a profession other that that of information services. No proof could be found that any research has been conducted where the impact of African and specifically South African culture on the use of a scorecard had been measured. Because of the staff mix (White females and Black males), it is anticipated that there would be an indication of this aspect coming through. This should, however, be a research study of its own. Other points of concern identified by Mooraj, Oyon and Hostettler (1999, pp 484-486) are that:
• There is a lack of the unplanned. The scorecard ensures so much focus that employees are inclined to ignore new opportunities.
• The employee is given no room for spontaneous reflection. This can be extremely debilitating to creative individuals.
• No place is provided for the management of the unintended strategy. This links to the facts that nothing is unplanned and that employees are given little room to reflect on what they are doing.
Fortunately these disadvantages can be managed and Mooraj, Oyon and Hostettler (1999, p 489) came to the conclusion that the balanced scorecard could be both a necessary and a useful tool for the knowledge economy company. They are of the

4.32
opinion, however, that each organization needs to create its own unique scorecard with its own unique priorities. It is also useful to remember that a balanced scorecard on its own will not necessarily ensure competitiveness and profitability. It is the setting of goals and identifying suitable initiatives and measures that will do that. The balanced scorecard appeared to be the most suitable measurement methodology but it was thought appropriate to identify a similar situation (not-for-profit company or a library or an information service) that had utilized it successfully. The literature search lead to the work of De Gooijer, which is reported on below. 4.5.5.1 Knowledge Management Performance Scorecard as sub entity
of the Balanced Scorecard The Knowledge Management Performance Scorecard is an adapted version of the balanced scorecard approach. It is of interest because it was developed for the non-commercial environment. Just as with Kaplan and Norton’s balanced scorecard, the Knowledge Management Performance Scorecard measures performance in four key result areas:
• financial performance; • internal business processes; • ‘stakeholders’ instead of ‘customers’; and • ‘people’ instead of ‘growth’.
De Gooijer (2000, p 305) did her research in a not-for-profit governmental department. She made some assumptions about a knowledge management performance management system. These are:
• A Knowledge Management Performance Framework is not in isolation from the organization’s business performance framework.
• There is clear and direct alignment between individual work plans, team goals, business unit objectives and the organization’s key result areas.
• There are clear benchmarks against which performance can be measured. • Performance indicators are unambiguous. • Knowledge management is a business principle and is embedded in all aspects
of the organization’s work. She also used as input the knowledge management map concept that stems from the information ecology framework (which was discussed in section 2.4.2.3 on page 2.24 of this report), the tacit to explicit knowledge transfer processes as well as the notion of sense making which comes from electronic mediated communication. For very valid reasons, De Gooijer (2000, p 306) changed the Balanced Scorecard’s categories of customers to stakeholders and growth to people. In order to design the scorecard, she then asked the following three questions:
• What business processes do we need to excel at?

4.33
• How should we appear to our stakeholders? • How will we sustain our ability to learn and develop?
For each of these questions the expected outcome, the initiatives and the performance indicators were identified. Indicators included items such as the number of times a frequently asked questions (FAQ) list was accessed as well as how well the staff room was utilized. The ‘concerns-based-adoption-model’ was utilized to identify the various levels or stages through which behaviour could be classified. In an adapted version of the classification system, the levels of skill and associated roles can be indicated as follows: Table 4.3: De Gooijer’s levels of skill and roles to play
Level Skill Role at this level 0 Awareness but non use Maintainer of status quo 1 Actively seeking information Early learner 2 Personal experimentation Follower 3 Personal implementation Implementer 4 Refining the impact and consequences of
implementation activities Problem solver
5 Active integration into all aspects of work Leader 6 Refocusing skills on new business opportunities Innovator/Investigator
Theoretically this classification system makes much sense, as it should be possible to categorize each of the identified scorecard items in any of these six categories. However, practically, based on experience, any classification system with as many variations causes confusion and unhappiness. For example, the difference between levels three, four and five are rather subtle and, similarly, the difference between levels zero and one are negligible. Within IMPS it was decided to opt for a three level classification system. Table 4.4: IMPS roles and skills classification
Level Skill level Expectations for this skill level 1 Beginner/Learner Needs assistance. 2 Experienced/Worker Able to work/implement independently.
Able to identify alternatives. 3 Mentor Able to teach and train others.
Able to implement alternatives and enhancements.
This classification was used as the basis upon which skills levels were determined during the skills audit, as discussed in section 5.4.3.1 on page 5.34. In terms of the tools and infrastructure required to enable and monitor the scorecard, De Gooijer (2000, p 309) identified Lotus Notes, team rooms, the Intranet, access to internal and external information, an electronic library of internal documents and objects, and community of practice participation.

4.34
This research still needed to be implemented and unfortunately no further reference to it could be traced. 4.5.5.2 Balanced Scorecard strategy maps As an extension of their original work and as a result of extensive scorecard consultancy, Kaplan and Norton (2001a, p 90) are able to create strategy maps that specify the critical elements and their linkages to an organization’s strategy. They claim that a strategy map should be seen as a diagnostic tool that can assist in finding and remedying flaws in balanced scorecards. This work is of significance because they also found that not-for-profit organizations in general concentrate on a key performance or operational excellence strategy rather than looking at the total strategy. To them it is typical that a scorecard for a not-for-profit organization would indicate attempts to
• work more efficiently; • at lower costs; • with less defects; and • faster.
They believe that such a method of working is very inward looking and limited in scope. (This cycle of continuous improvement of existing processes is also very typical of the situation within libraries.) To break out of the inward looking cycle, they (Kaplan and Norton, 2001a, p 88) suggested that one takes note of the following linkages in what they refer to as the service management profit chain:
• investment in employee training improves service quality; • improvement in service quality leads to higher customer satisfaction; • higher customer satisfaction leads to increased customer loyalty; and • increased customer loyalty generates increased revenues and margins.
Taking the service management profit chain into consideration, it was decided to adapt the strategy map created by Kaplan and Norton (2001a, p 92) and to create a map that could fit in with the framework for information services. The map is reflected in Figure 4.6 on the next page. The map sets out to, at the highest or strategy level, recognise that staff, customer as well as stakeholder satisfaction are the objectives and a prerequisite for success. Staff satisfaction depends upon setting targets for a motivated workforce and the continuous improvement of structural capital. Customer satisfaction requires activities or targets to address product/service attributes, the relationship with the customer as well as the image of the products/services the customer pays for. Lastly, in line with the CSIR IMPS situation, stakeholder satisfaction depends upon healthy financial management that includes reliable supply chain selection and improvement in customer productivity. The overview of the methodologies mentioned lead to the conclusion that a combination of the Balanced Scorecard, the Asset Monitor and the Value Chain

4.35
Scoreboard types of methodology would be the most appropriate to follow. It also became clear that measurement should be done at both an operational (or personal level) as well as at a strategic or organizational level if it is to be truly useful. Once it was decided which methodology to use, the questions still remained what actually had to be measured, what measuring tools should be utilized, and how measuring should be done.

4.36
Fig 4.6: Balanced scorecard strategy map for information services (based on the Kaplan and Norton (2001a, p 92) model)
Staff satisfaction Customer satisfaction Stakeholder satisfaction Human capital perspective
Structural capital perspective
Customer capital perspective Financial capital perspective
Price Build the service (innovation process)
Quality Decreased dependency
Time
Appropriate skills and competencies
Increase customer value (customer management process)
Products/Services
Prod
uct/
Serv
ice
attr
ibut
es
Cust
omer
acq
uisi
tion
Prod
uctiv
ity
Improve asset utilization
Impr
ovin
g cu
stom
er
prod
uctiv
ity s
trat
egy
Appropriate resources
Service level
Improve cost efficiency
Operational excellence (operations and logistics processes)
Relations
Rel
atio
nshi
p
Efficient financial management
Positive work environment
Mot
ivat
ed a
nd p
repa
red
wor
kfor
ce
Increase supplier reliability (supplier management processes) Co
ntin
uous
impr
ovem
ent
Brand
Imag
e
Cust
omer
val
ue p
ropo
sitio
n op
erat
iona
l exc
elle
nce
Cust
omer
va
lue
prop
ositi
on
cust
omer
intim
acy
Cust
omer
val
ue p
ropo
sitio
n Pr
oduc
t le
ader
ship
Cust
omer
ret
entio
n
Cost
eff
ectiv
enes
s
Increase value for customer
Relia
ble
effe
ctiv
e su
pply
cha
in
sele
ctio
n st
rate
gy
Fulf
illin
g ou
r m
issi
on
Continuous improvement of all four capitals is a prerequisite to fulfilling the mission of information services

4.37
4.6 The ‘what’ and ‘how’ of measuring Bontis, et al., (1999, p 392) suggested that it might be useful to ask the following questions before starting to identify the most suitable measuring tools:
• How possible is it for accounting tools, that were developed 500 years ago to help merchants in the feudal era, to make the key success factors of the knowledge economy possible? This question prompted the decision in principle to ensure that suitable measuring elements should be identified so that all focus areas are addressed at both the operational and strategic levels.
• How does one choose among the many alternatives suggested by different authors? Keeping the context of the research in mind, this question led to the decision to, in principle, identify measures that are known within the environment, that are simple and easy to use but that gives results that could be graphically displayed. (In other words it should be possible to put numbers to the results so that graphs can be drawn.)
• How can the urge to jump from one faddish instrument to the next be prevented when all promise success and competitive dominance? This question led to the decision to, in principle, create a measuring instrument (with the assistance of the staff members) that was unique to our own set of circumstances. The rationale is that one is much more loyal to one’s own creation than to any adopted methodology/instrument.
Bontis, et al., (1999, p 400) came to the conclusion that no single method of evaluation is perfect. One can only attempt to find a measuring tool that is most appropriate within the set circumstances. They warn, for example, that a good tool used in the wrong circumstances can do more harm than good especially in terms of the undesired side effects. This statement led to a fourth principle, namely to design a measuring tool that was unique to CSIR IMPS but that had ample staff input continuously. Having identified the guiding principles, the next important aspect of the exercise was to identify what exactly should be measured. It was taken for granted that possible measures, within the context of this study, have to address all of the following: human capital growth, structural capital development, customer focus and financial health. Again available literature was researched to find both suitable indicators to be measured and the appropriate tools to use. Roos and Roos (1997, pp 417-423) stated that the vehicle for measuring intellectual performance is a set of indicators used for each intellectual capital category. Their advice, which was also re-iterated by Duffy (2000, p 14), in terms of indicators includes the following:
• To be a useful measurement mechanism, the indicators should be grounded in:
o the drivers of the vision and/or direction expressed; o the intellectual capital categories selected; and o inter-capital flows.

4.38
• The intellectual performance system must be rooted in the language of the company or unit. Important concepts used in conversations and texts around the vision, mission, strategy and success factors must be identified, and the meaning of these concepts must be uncovered.
• To be measured, intellectual capital obviously needs to be categorized. Categorizing must be more of a top-down than a bottom-up process.
• Any intellectual capital model must be scaleble; it should make sense for large as well as small companies, and for organizations, parts of organizations as well as individuals.
They also identify the fact that there are many difficulties in dealing with indicators. Examples of these difficulties are:
• selecting the right indicators among the almost limitless number of potential ones;
• ranking the importance of indicators for a specific category; • ensuring high precision for indicators; • establishing reliability of numerical values of indicators; • tracing all sources of error or noise in the logic used to identify indicators,
which may otherwise lead to erroneous or irrelevant indicators; and • tracking the high multi-co-linearity among many of the indicators, meaning
that the indicators are not reciprocally independent. Looking more at specific indicators to use, Robinson and Kleiner (1996, p 38) advised, in terms of human capital development, that if a direct measure of a skill is not available, the use of an ‘indicator’ of the skills will need to be used. There are various counts and ratios that have been and are being used as a means of assessing intellectual capital. But again the presence of these practices is probably best thought of as an indication of intellectual capital, not as a measure of intellectual capital: just as the measure of training is really just an indicator that intellectual capital is being created or maintained (Robinson and Kleiner, 1996, pp 37-38). Indicators include:
• the numbers of patents, good ideas or articles published per person; • various ratios of employee output; • the value-chain support activity called technology development; • benchmarking studies to identify the best decision-making practices in a R&D
setting; • the use of cross-functional teams; • the use of post-project audits; and • analyzing best practices including charts where quality of execution is plotted
versus frequency of use. Liebowitz and Wright (1999, p 101) created a table (see Table 4.5) of sample indicators, as used within the Skandia Navigator.

4.39
Table 4.5: Sample of the metrics developed for the Skandia Navigator (Leibowitz and Wright, 1999, p 101)
Capital asset Example indicators Human • Replacement and acquisition cost
• Generalized training and employee development cost • Percentage of outsourced personnel resources • Development of cross-functional team structures • Internal control and ethics
Customer • Creation and development of external relationships
• Brand loyalties • Customer service expectations • Market share
Process • ICT infrastructure
• Logistical efficiencies • Administrative procedures
Innovation • Renewal and development costs
• Change in product development and delivery cycle • Adoption of industry quality standards
Peters and Waterman (1982, in Robinson and Kleiner, 1996, p 39) identified further traits that can be used as indicators. These are:
• ‘management by walking around’ or ensuring that the manager/leader is visible and available;
• lack of barriers to communication flow; • toleration of failure and experimentation; and • the concept of a champion.
In terms of the valuation of customer capital, Duffy (2000, p 12) suggested the following:
• to use anything that would indicate that you are really keeping your customers happy;
• monitor your competitive position; • monitor which customer-related investments were showing a better return
than any other; • establish what type of customers were best for your company; and • measure the effectiveness, the efficiency and the return on investment of the
tools and techniques that were designed to improve the relationship with the customers.
In further work Liebowitz and Suen (2000, pp 55-62) compiled a complete list of indicators identified by a variety of authors. For their research, the metrics work conducted by some of the most prominent intellectual capital authors (Edvinsson, Lev, and Bontis) was correlated. Unfortunately, their work did not include that of Stewart, Sveiby or Kaplan and Norton. They came to the conclusion that the metrics

4.40
identified were perhaps not sufficient within the knowledge era and as a result they complemented their list with that of the KPMG online assessment tool called The Value Enhancer. From the comprehensive list, it was clear that all items would not be applicable within the context of this study. Below is a selection of the items they identified as metrics: Human capital Training expense per employee R&D investment in basic research Years of service with the company Revenues per employee Profits per employee Percent of employees with advanced degrees IT literacy Motivation index Savings from employee suggestions New solutions/products suggestions Training efforts Competence development Employee satisfaction Age distribution Time in training Re-use of available knowledge Number of ideas that were turned into projects Number of apprentices that staff mentor Interactions with academics, consultants and advisors Structural capital Processing time Contracts filled without error Number of new products Number of lessons learnt and best practices applied Customer capital Number of new customers Sales per customer Time from customer contact to sales response Average customer duration with the company Customer satisfaction index/customer rating Productivity index Number of processes renewed Market share Customers lost Customer size Financial capital Profits/total assets Revenues resulting from new business operations Profits per employee

4.41
In all probability, the lack in background knowledge of/or experience in utilizing the available scorecards and monitors leads to the perception that the listed indicators would not be of particular use (as a directly transferable group) within the context of this research. All of the information within this section of the research did not make the selection of appropriate measures any easier. It was therefore decided to utilize the strategy map (Figure 4.6 on page 4.37) and to use it as a point of departure to at least focus the measuring activity. It was anticipated that if the correct questions were identified within such a strategy map, the correct indicators would follow. The following were identified as further principles to note in compiling a measuring tool if it were to be useful within the context of this study:
• It is not possible to measure a department or organization’s ‘combined’ score if you have not established a ‘score’ at an individual level. The tool should therefore make provision for the easy integration of personal scores into a departmental or organizational monitor/scorecard.
• Provision needs to be made for growth at an individual level as well as for contribution at a team level if you do not wish to fall into the internal competition trap.
• A review of the current rewards and recognition system will need to form an integral part of the study.
• It would be necessary to benchmark skills levels and to set appropriate standards before attempting to measure an individual’s human capital ‘value score’.
• Some system of weighting or point allocation, which will have to be standardized, would have to be established for ‘intangible’ contributions (for example positive feedback from a customer).
Keeping these principles in mind, the following two tables were developed. Table 4.6: Substance for an organizational/departmental value monitor: testing against mission and measuring leadership (see page 4.43); and Table 4.7: Substance for an operational or personal value monitor: measuring human capital development (see page 4.44). In Table 4.6, on the next page, measuring is looked at from the departmental point of view. Here, specifically the aim would be to measure growth in terms of human capital development, customer satisfaction and stakeholder commitment. It also should measure the enhancements and growth in terms of structural capital. Growth in all these areas could be regarded as an indication that leadership is moving in the right direction. Alignment with the mission should be tested in terms of human, structural and customer development. The items evaluated as part of the financial capital component all have a direct link to the mission of the service.
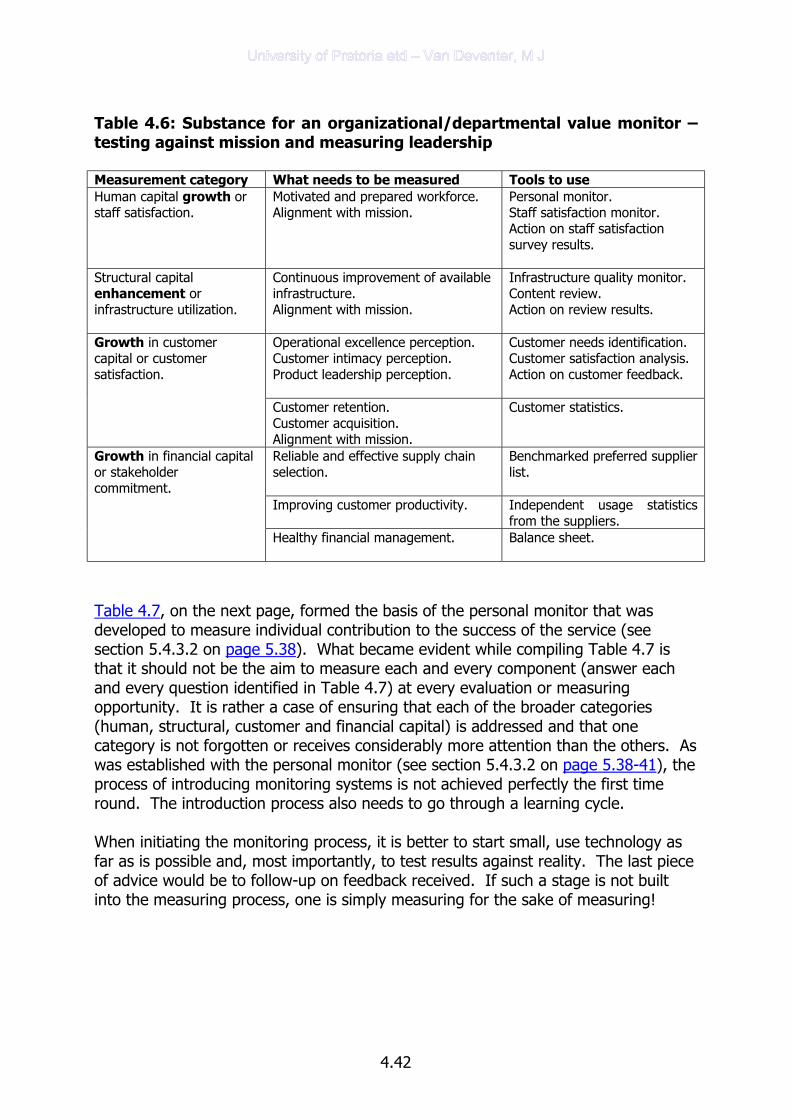
4.42
Table 4.6: Substance for an organizational/departmental value monitor – testing against mission and measuring leadership Measurement category What needs to be measured Tools to use Human capital growth or staff satisfaction.
Motivated and prepared workforce. Alignment with mission.
Personal monitor. Staff satisfaction monitor. Action on staff satisfaction survey results.
Structural capital enhancement or infrastructure utilization.
Continuous improvement of available infrastructure. Alignment with mission.
Infrastructure quality monitor. Content review. Action on review results.
Operational excellence perception. Customer intimacy perception. Product leadership perception.
Customer needs identification. Customer satisfaction analysis. Action on customer feedback.
Growth in customer capital or customer satisfaction.
Customer retention. Customer acquisition. Alignment with mission.
Customer statistics.
Reliable and effective supply chain selection.
Benchmarked preferred supplier list.
Improving customer productivity.
Independent usage statistics from the suppliers.
Growth in financial capital or stakeholder commitment.
Healthy financial management. Balance sheet.
Table 4.7, on the next page, formed the basis of the personal monitor that was developed to measure individual contribution to the success of the service (see section 5.4.3.2 on page 5.38). What became evident while compiling Table 4.7 is that it should not be the aim to measure each and every component (answer each and every question identified in Table 4.7) at every evaluation or measuring opportunity. It is rather a case of ensuring that each of the broader categories (human, structural, customer and financial capital) is addressed and that one category is not forgotten or receives considerably more attention than the others. As was established with the personal monitor (see section 5.4.3.2 on page 5.38-41), the process of introducing monitoring systems is not achieved perfectly the first time round. The introduction process also needs to go through a learning cycle. When initiating the monitoring process, it is better to start small, use technology as far as is possible and, most importantly, to test results against reality. The last piece of advice would be to follow-up on feedback received. If such a stage is not built into the measuring process, one is simply measuring for the sake of measuring!

4.43
Table 4.7: Substance for an operational or personal value monitor (measuring human capital development) Measurement category
What needs to be measured
Personal contribution to both the tangible and intangible value chains
Contribution to IMPS/Value added
Appropriate skills and competencies
What skills do I need to do my job? What additional skills do I need to learn? At what skill level am I functioning?
What did I teach to whom? How did I contribute to benchmarking our competencies and skills
Appropriate resources How well am I able to utilize the resources I am supposed to be using?
What role did I play in identifying appropriate resources for our group?
Human capital -motivated and prepared workforce
Positive work environment
What did I do to make work a pleasurable experience for me?
What did I do to our shared work environment?
Build the service (innovation process)
What am I doing to identify new and better ways to do my work?
What am I contributing to our overall innovation process?
Increase customer value (customer management process)
What am I doing to ensure that my customer is getting the best price for what he is buying?
What am I contributing to the best value for money benchmarking exercise?
Operational excellence (operations and logistics processes)
What am I doing to ensure that the customer is getting the best service as fast as is possible?
What am I contributing to our overall operational success?
Structural capital -continuous improvement
Increase supplier reliability (supplier management processes)
Did I continuously check that both the supplier and I adhere to the agreement between the supplier and IMPS?
Did I contribute to improving the relationship between the supplier and us? What did I do to identify our most reliable suppliers?
Price Am I utilizing our pricing schedule correctly? Did I assist in benchmarking and calibrating the pricing schedule?
Quality What do I do to ensure good quality work? How often do I need to re-do work?
Do I share my quality improvement lessons with my colleagues? Did I share the learning gained from re-work? Did I capture the learning gained from re-work? Did I assist in benchmarking and calibrating the quality of our service?
Customer capital - customer acquisition
Time What is my turn-around time for difficult solutions? What is my turn-around time for easy solutions?
What am I contributing to improve / maintain the customer’s perception of our turn-around time?

4.44
Measurement category
What needs to be measured
Personal contribution to both the tangible and intangible value chains
Contribution to IMPS/Value added
Product/Service What do I do to ensure that I know my customers are getting what they need? Do I know what products and services my competitors provide?
What is my contribution to establishing the customer’s needs? What is my contribution to analysing the customer’s needs? What is my contribution to enhancing our current products and services? What is my contribution to identifying new products and services? Do I assist in analysing our competitors?
Service level What feedback am I getting with regards to the service I am providing?
What do I contribute to the improvement of our service to customers?
Relations What contact do I have with my clients outside my normal duties? What have I done to improve the customer’s perception of IMPS?
What did I contribute to finding new ways to improve our relationship with our clients?
Customer retention
Brand What do I do to ensure that my customers are familiar with our brand?
What did I contribute to enhancing and enforcing our brand?
Improve cost efficiency Am I using the appropriate suppliers? What contribution am I making in identifying the right suppliers?
Efficient financial management
Are my timesheets completed? Are my invoices done in time? Am I buying supplies that make me more efficient?
How much income did I generate for IMPS?
Financial capital - reliable and effective supply chain selection
Increase value for customer
What am I doing to identify new, better or more effective products and services for my customers?
How am I contributing to the selection of products and services IMPS is providing to our customers?
Decreased dependency Am I assisting and training my customers? What am I contributing to decrease the customers’ dependence on our physical presence?
Improving customer productivity
Improve asset utilization
Am I exposing customers to products and services other to my own?
How am I contributing to ensure that all the IMPS assets are utilized?

4.45
4.7 Summary Measuring the impact of intellectual capital management is difficult, especially when there is very little tangible proof of a service’s value. In the introduction of this chapter it was said that the crux of the matter is that time needs to be spent on identifying items that will provide tangible proof that intangible growth (or decline) is taking place. The purpose of this chapter was therefore to determine if appropriate measuring tools are already available to utilize. The specific intent was to establish if available tools and methodologies were appropriate to measure the impact of intellectual capital development activities within the CSIR IMPS environment. The complete list of available methodologies, as identified by Sveiby (see Table 4.1 on page 4.13), was used as a starting point. Keeping in mind the context of this study, all the methods closely associated with financial measures were then eliminated. This resulted in an evaluation of the scorecard-type methodologies. The methods investigated (see section 4.5 on page 4.18) were the following:
• Skandia Navigator™ which was found to be too complex to be realistic within the given environment.
• IC-Index™ and its associated digital IC-landscaping. These were found to be too complex for the context of the study.
• Intangible Asset Monitor. It was found that the philosophy behind the methodology is appealing and should be integrated.
• Value Chain Scoreboard™ which could hold much potential if integrated with the balanced scorecard and/or intangible asset methodologies.
• Balanced Scorecard. The later developments which focus on public sector or not-for-profit type organizations appear to be especially useful.
The words of Kaplan and Norton (2001b, p 158) It is not only what is measured but also how the measurements are used that determines organizational success led to the conclusion that it also does not matter what the methodology being followed is called. In the case of the CSIRIS IMPS, the most suitable methodology should be designed as a hybrid of Kaplan and Norton’s Balanced Scorecard with the individual measured elements as well as the application rather linking back to the philosophy of the Intangible Asset Monitor and including aspects of the Value Chain Scoreboard. The opinion was expressed that monitoring needs to take place at both the operational/individual and the strategic/organizational level if monitoring is to be of objective value.