Embed Size (px)
Citation preview
8/3/2019 Chapter 5 Rewrite Final 9-20-11
http://slidepdf.com/reader/full/chapter-5-rewrite-final-9-20-11 1/27
CHAPTER 5 – State of the Bay 2010
CHAPTER 5 – STATE OF THE BAY 2010
Physical Form and Processes
By John B. Anderson
[Texas Bays] are a magnificent resource, shallow and brackish and marshybordered and rich with
life.... The flat land runs to the flat bays, and beyond the flat sand islands is the blue flat Gulf but
it is dramatic enough for all that, because of the life that is there … . Nearly any memory of that
coast has in it a sense of teeming life...
—John Graves, in The Water Hustlers (1971)
Review Table Reference to to ensure correct citation
Introduction
Twenty thousand years ago the earth was in the midst of an ice age and ice sheets in both
hemispheres were expanding. Expansion of the ice sheets was fed by water from the sea, to the
extent that sea level fell an average of 100 meters across the globe. Then, when the ice age ended
approximately 17,000 years ago, meltwater from the ice sheets flowed back into the oceans
causing sea level to rise to its current level. It was during this rise in sea level that the estuaries of
the Gulf Coast were formed, including Galveston Bay. Hence, the very existence of Galveston
Bay is attributed to sea level rise. It is ironic that its future will be strongly regulated by the now
rising sea.
Setting
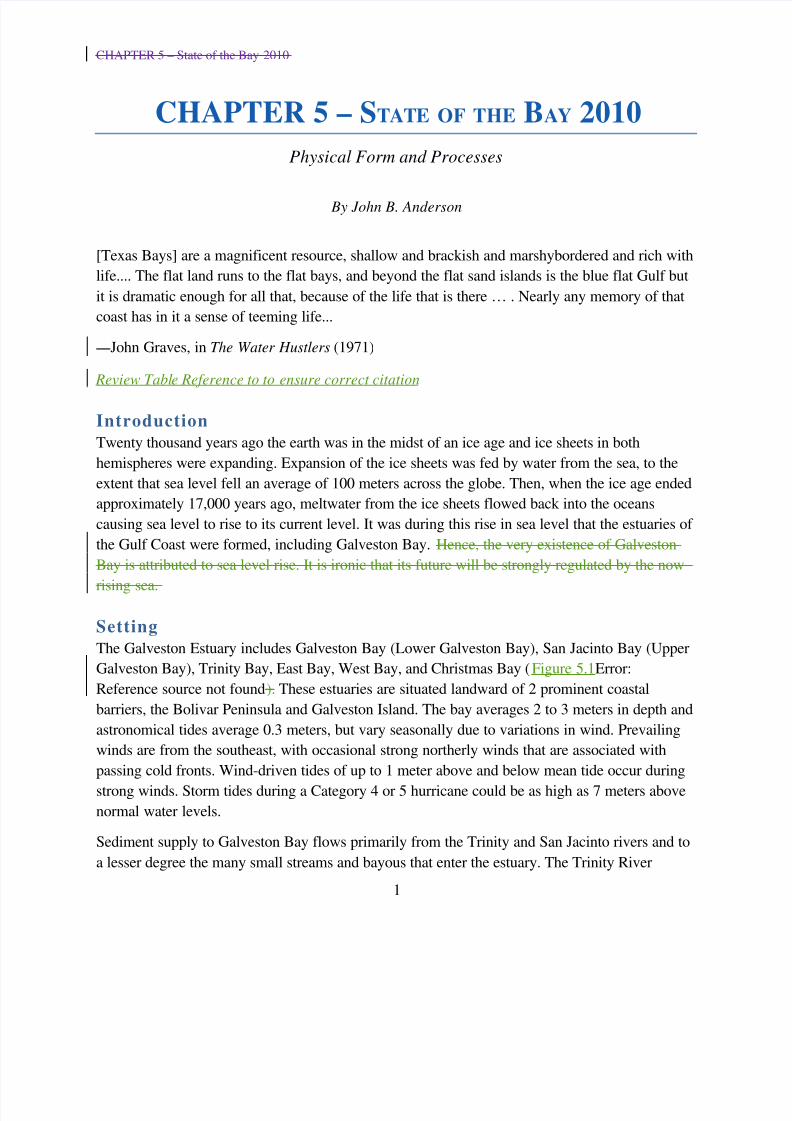
The Galveston Estuary includes Galveston Bay (Lower Galveston Bay), San Jacinto Bay (Upper
Galveston Bay), Trinity Bay, East Bay, West Bay, and Christmas Bay (Figure 5.1Error:
Reference source not found). These estuaries are situated landward of 2 prominent coastal
barriers, the Bolivar Peninsula and Galveston Island. The bay averages 2 to 3 meters in depth and
astronomical tides average 0.3 meters, but vary seasonally due to variations in wind. Prevailing
winds are from the southeast, with occasional strong northerly winds that are associated with
passing cold fronts. Wind-driven tides of up to 1 meter above and below mean tide occur during
strong winds. Storm tides during a Category 4 or 5 hurricane could be as high as 7 meters above
normal water levels.
Sediment supply to Galveston Bay flows primarily from the Trinity and San Jacinto rivers and to
a lesser degree the many small streams and bayous that enter the estuary. The Trinity River
1
8/3/2019 Chapter 5 Rewrite Final 9-20-11
http://slidepdf.com/reader/full/chapter-5-rewrite-final-9-20-11 2/27
CHAPTER 5 – State of the Bay 2010
drains an area of 5,500 km2 and has an annual discharge of 7.1 billion cubic meters (m3). The San
Jacinto River has an annual discharge of 2.4 billion m3. Both the San Jacinto and Trinity rivers
have been dammed, but sediment delivery to the estuary may not have been significantly reduced
(Phillips et al. 2004). The entire Galveston Bay Estuary experiences significant bay-shore
erosion, which contributes to the sediment supply of the estuary (Paine et al. 1986).
In addition to the 5 main subbays, the estuary and watershed comprise a number of different
environments, each with its own unique set of processes and ecosystems. The following is a brief
description of these other environments.
2
8/3/2019 Chapter 5 Rewrite Final 9-20-11
http://slidepdf.com/reader/full/chapter-5-rewrite-final-9-20-11 3/27
CHAPTER 5 – State of the Bay 2010
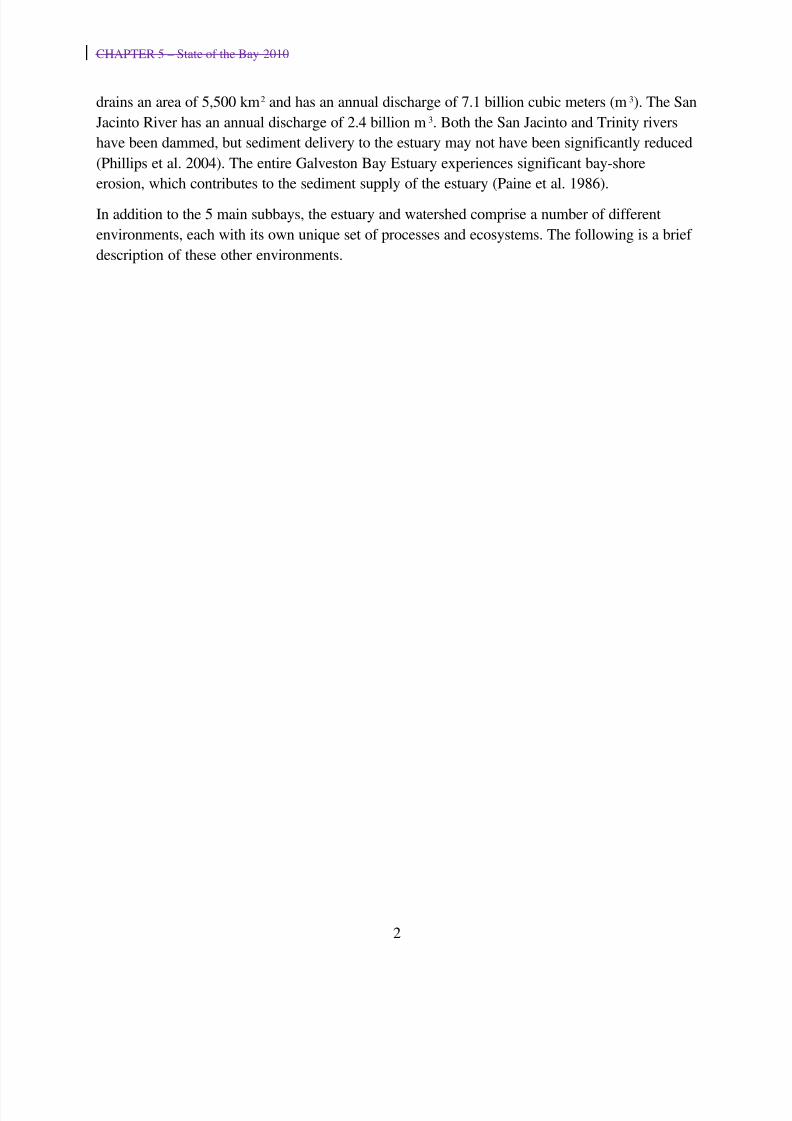
Wetlands
Wetlands occur along the margins of the Galveston Bay Estuary and are a vital part of the bay
ecosystem. Wetlands are also the most rapidly disappearing component of the estuarine complex,
due mainly to direct human intervention. Salt and brackish wetlands exist within 0.5 meters of
mean sea level and are frequently inundated during spring tides and storms; these wetlands are
adapted to submergence, but only for brief periods. As sea level rises, wetlands are able to
3Figure 5.. The Galveston Bay Estuary.
8/3/2019 Chapter 5 Rewrite Final 9-20-11
http://slidepdf.com/reader/full/chapter-5-rewrite-final-9-20-11 4/27
CHAPTER 5 – State of the Bay 2010
survive only if they are able to grow vertically at a rate equal to that of sea level rise, a process
known as aggradation. To aggrade, wetlands require healthy plant growth and a steady supply of
sediment to fill the water column created by sea level rise. If the rate of aggradation is less than
the rate of sea level rise, the wetlands must migrate inland to higher ground in order to survive.
Approximately half of the natural wetlands of the Galveston Bay Estuary have disappeared inhistorical time due to a combination of sea level rise, diminished sediment supply and human
intervention. Sea level rise, thus far, has been mainly due to subsidence related to withdrawal of
subsurface fluid (e.g. water and oil) which peaked in the mid-1970s, when groundwater
extraction reached a peak. Groundwater extraction for public, industrial, and agricultural use hasdecreased since the mid-1970s (Mace et al. 2006) significantly reducing subsidence.
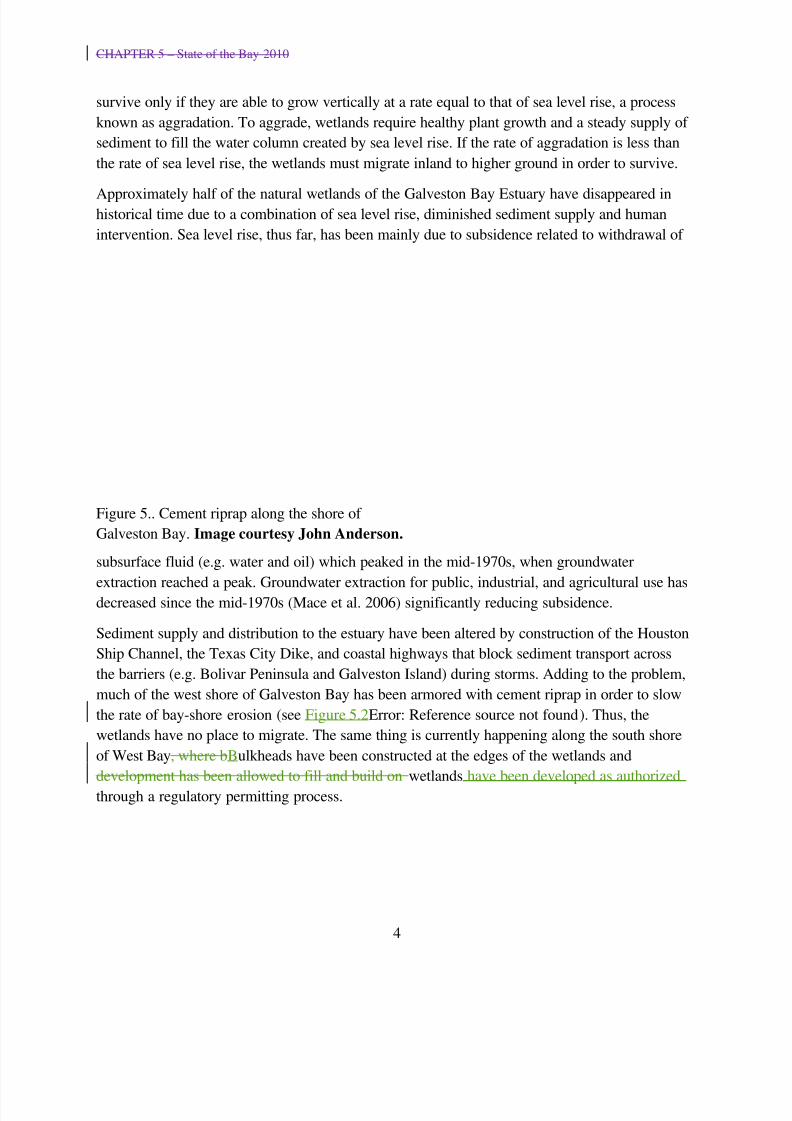
Sediment supply and distribution to the estuary have been altered by construction of the Houston
Ship Channel, the Texas City Dike, and coastal highways that block sediment transport across
the barriers (e.g. Bolivar Peninsula and Galveston Island) during storms. Adding to the problem,
much of the west shore of Galveston Bay has been armored with cement riprap in order to slow
the rate of bay-shore erosion (see Figure 5.2Error: Reference source not found). Thus, the
wetlands have no place to migrate. The same thing is currently happening along the south shore
of West Bay, where bBulkheads have been constructed at the edges of the wetlands and
development has been allowed to fill and build on wetlands have been developed as authorized
through a regulatory permitting process.
4
Figure 5.. Cement riprap along the shore of
Galveston Bay. Image courtesy John Anderson.
8/3/2019 Chapter 5 Rewrite Final 9-20-11
http://slidepdf.com/reader/full/chapter-5-rewrite-final-9-20-11 5/27
CHAPTER 5 – State of the Bay 2010
Current rates of bay shore retreat along the southwest shore of West Bay average 1 meter per
year and are as high as 4 meters per year. In Christmas Bay, which is located west of Galveston
Island behind Follets Island (Figure 5.1Error: Reference source not found) and where minimal
development has occurred, wetlands are growing. The contrast between these 2 subbays provides
documentation of the impact humans have had on wetlands. Current laws that are designed to
protect wetlands do not take into account their migratory nature. As sea level rise continues,
management of wetland resources will need to address changing conditions.
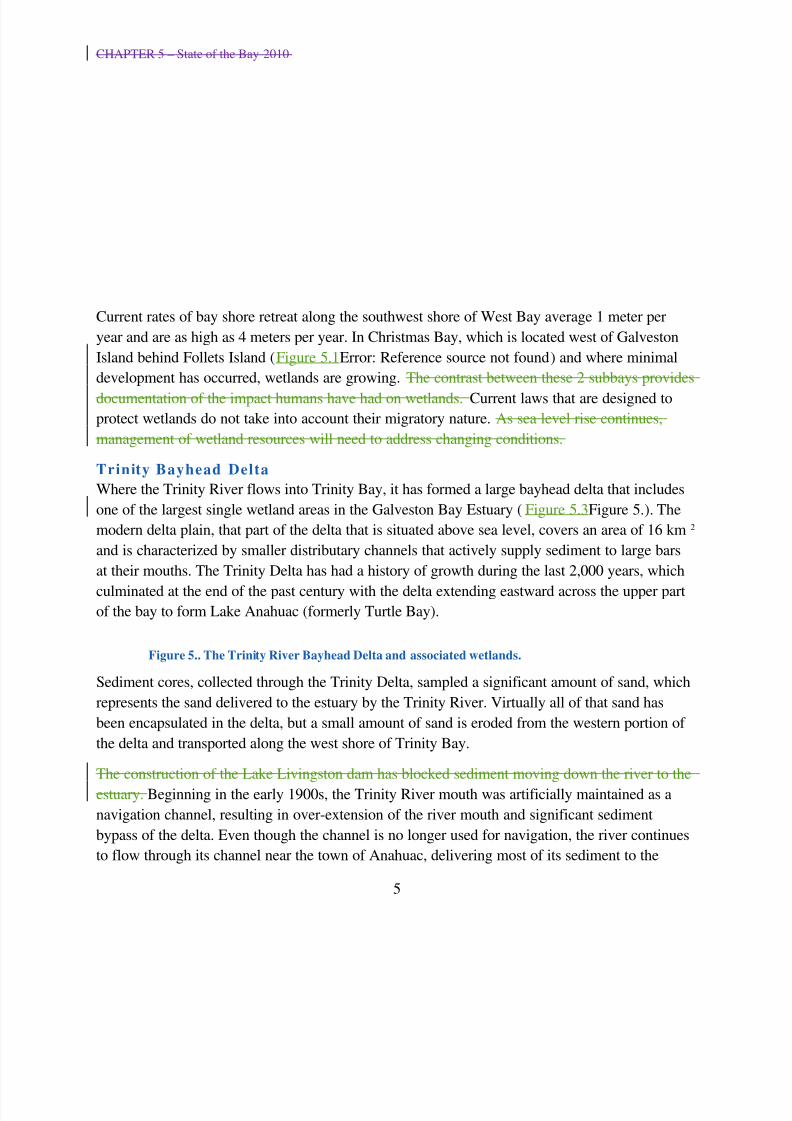
Trinity Bayhead Delta
Where the Trinity River flows into Trinity Bay, it has formed a large bayhead delta that includes
one of the largest single wetland areas in the Galveston Bay Estuary (Figure 5.3Figure 5.). The
modern delta plain, that part of the delta that is situated above sea level, covers an area of 16 km 2
and is characterized by smaller distributary channels that actively supply sediment to large bars
at their mouths. The Trinity Delta has had a history of growth during the last 2,000 years, which
culminated at the end of the past century with the delta extending eastward across the upper partof the bay to form Lake Anahuac (formerly Turtle Bay).
Figure 5.. The Trinity River Bayhead Delta and associated wetlands.
Sediment cores, collected through the Trinity Delta, sampled a significant amount of sand, which
represents the sand delivered to the estuary by the Trinity River. Virtually all of that sand has
been encapsulated in the delta, but a small amount of sand is eroded from the western portion of
the delta and transported along the west shore of Trinity Bay.
The construction of the Lake Livingston dam has blocked sediment moving down the river to the
estuary. Beginning in the early 1900s, the Trinity River mouth was artificially maintained as a
navigation channel, resulting in over-extension of the river mouth and significant sediment
bypass of the delta. Even though the channel is no longer used for navigation, the river continues
to flow through its channel near the town of Anahuac, delivering most of its sediment to the
5
8/3/2019 Chapter 5 Rewrite Final 9-20-11
http://slidepdf.com/reader/full/chapter-5-rewrite-final-9-20-11 6/27
CHAPTER 5 – State of the Bay 2010
eastern portion of the delta. Only during major floods do the distributary channels along the
western portion of the delta deliver sediment to the bay (Figure 5.3Figure 5.). There has not been
a significant decrease in the size of the Trinity Delta this century. However, geologists know that
the response of deltas to changes in sediment supply is not always instantaneous. In the case of
the Trinity Delta, the reduction in sediment supply to the delta was likely offset by increased
sediment input to the river resulting from agriculture and land clearing within the drainage basin
(Phillips et al. 2004). The uncertain future of the Trinity Delta will be examined later in this
chapter.
Inter-Distributary Bays and Lakes
A number of small bays and lakes, including Lake Anahuac, occur in the upper part of Galveston
Bay and along the north shore of East Bay and West Bay (Figure 5.1Error: Reference source not
found). These water bodies provide important freshwater habitats and their destiny is closely tied
to that of the rest of the estuary.
Lower Estuary and Bolivar Tidal-Delta ComplexThe 3 km–wide inlet between the Bolivar Peninsula and Galveston Island is known as the
Bolivar Tidal Inlet (Figure 5.1Error: Reference source not found), known to locals as Bolivar
Roads. Prior to dredging of the Galveston and Houston ship channel entrance in the early 1900s,
this was a natural tidal inlet with a prominent tidal delta that extended both offshore and into
Galveston Bay (Siringan et al. 1993). Since the channel was dredged, the tidal delta has shrunk
to approximately half its original size, and the inlet has been significantly modified. This is
where most of the sand that moved west along Bolivar Peninsula in the longshore transport
system was deposited prior to the construction of the north jetty. Now, most of the sand is
trapped on the upstream side of the jetty and the tidal delta is no longer being nourished with
sand. As a result, the sandy part of the delta has shrunk throughout historical time (Siringan andAnderson 1993).
Coastal Barriers
Bolivar Peninsula
Bolivar Peninsula formed by a process geologists call spit accretion, whereby sand is added to
the western end of the peninsula by westward flowing longshore currents (Anderson 2007). A
detailed study of Bolivar Peninsula by Rodriguez et al. (2004) showed that it is a relatively
young barrier, having formed over the last 2,500 years. Its growth was relatively continuous until
approximately 800 years ago, when a hurricane destroyed much of the western end of the barriernow located seaward of the current highway. The peninsula seaward of the highway is mostly
younger than 800 years old.
As the Bolivar Peninsula grew toward the west, the Bolivar tidal inlet grew narrower. This
resulted in gradual alteration of tidal movement in and out of Galveston Bay. The net effect has
been a reduction in tidal circulation within the bay, altering its salinity regime. Seismic records
6
8/3/2019 Chapter 5 Rewrite Final 9-20-11
http://slidepdf.com/reader/full/chapter-5-rewrite-final-9-20-11 7/27
CHAPTER 5 – State of the Bay 2010
from East Bay show that the oyster reefs in the lower part of the bay have migrated through time
toward the center of Galveston Bay. This change was likely caused by the change in bay salinity.
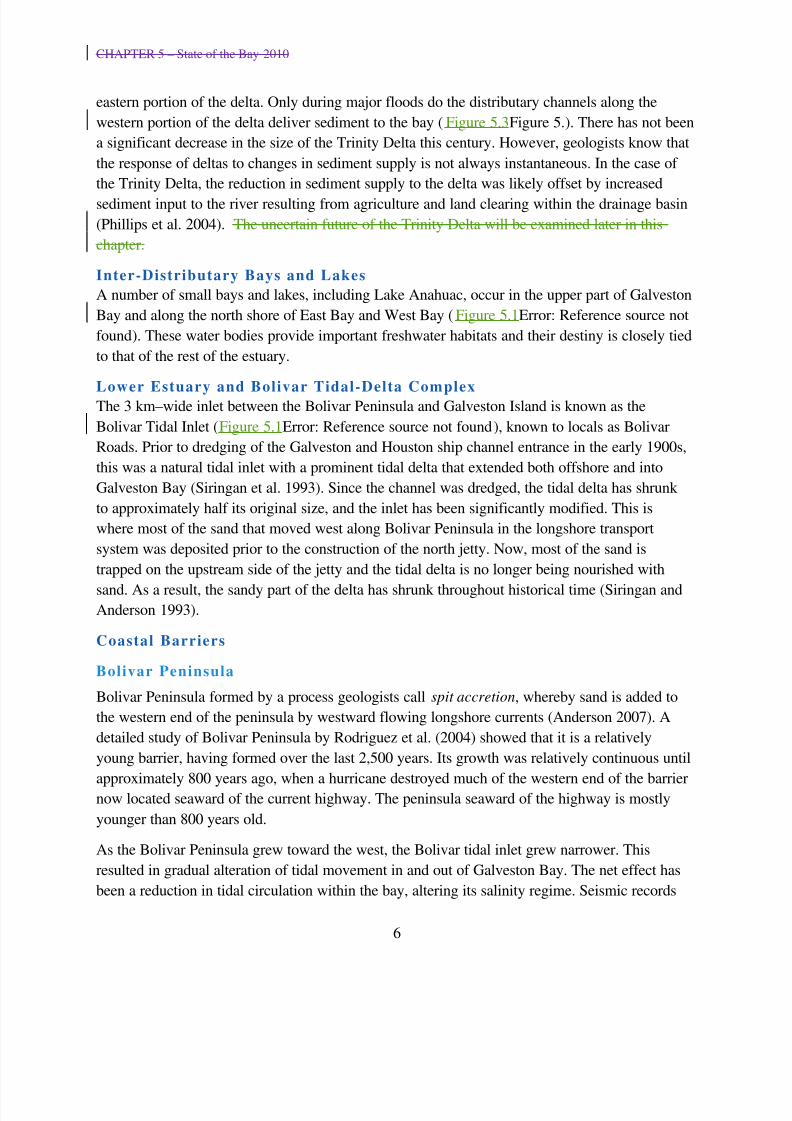
The backside of the Bolivar Peninsula is dominated by storm washover deposits that formed
during the early phase of barrier evolution (Figure 5.4Error: Reference source not found). The
washover deposits provide a framework for the growth of wetlands. They also stand as areminder of the fact that hurricanes are capable of breaching the peninsula.
Galveston Island
Galveston Island is a typical drumstick-shaped barrier island with prominent beach ridges
recording the history of barrier growth since approximately 5,500 years ago (Bernard et al. 1959;
Rodriguez et al. 2004). Growth of the island was followed by landward retreat 1,200 years ago, a
result of depletion of an offshore source of sand that nourished the island (Anderson 2007). The
island is now eroding, both on the Gulf and West Bay sides. Pelican Island, at the east end of
Galveston Island, was part of the Bolivar tidal delta in historical time. During the past century it
was nourished with sediment dredged from the ship channels, raising its elevation and expanding
its area.
Longitudinal Bays
7
Figure 5.. Storm washover deposits on the Bolivar Peninsula.
Image courtesy USGS GlobeXplorer.
8/3/2019 Chapter 5 Rewrite Final 9-20-11
http://slidepdf.com/reader/full/chapter-5-rewrite-final-9-20-11 8/27
CHAPTER 5 – State of the Bay 2010
Two subbays—East Bay and West Bay, at either side of Upper and Lower Galveston Bay (Figure
5.1Error: Reference source not found)—were formed as rising sea level inundated the low areas
behind Bolivar Peninsula and Galveston Island. The 2 bays differ in that West Bay has a natural
tidal inlet (San Luis Pass) at its western end, which results in more vigorous tidal circulation and
higher average salinity levels relative to East Bay. Unlike the Bolivar Roads tidal inlet, the San
Luis Pass inlet has been unaltered by humans. Hence, sand supply to the delta via the longshore
transport system has been unimpeded. Most of the sand eroded from Galveston Island beaches
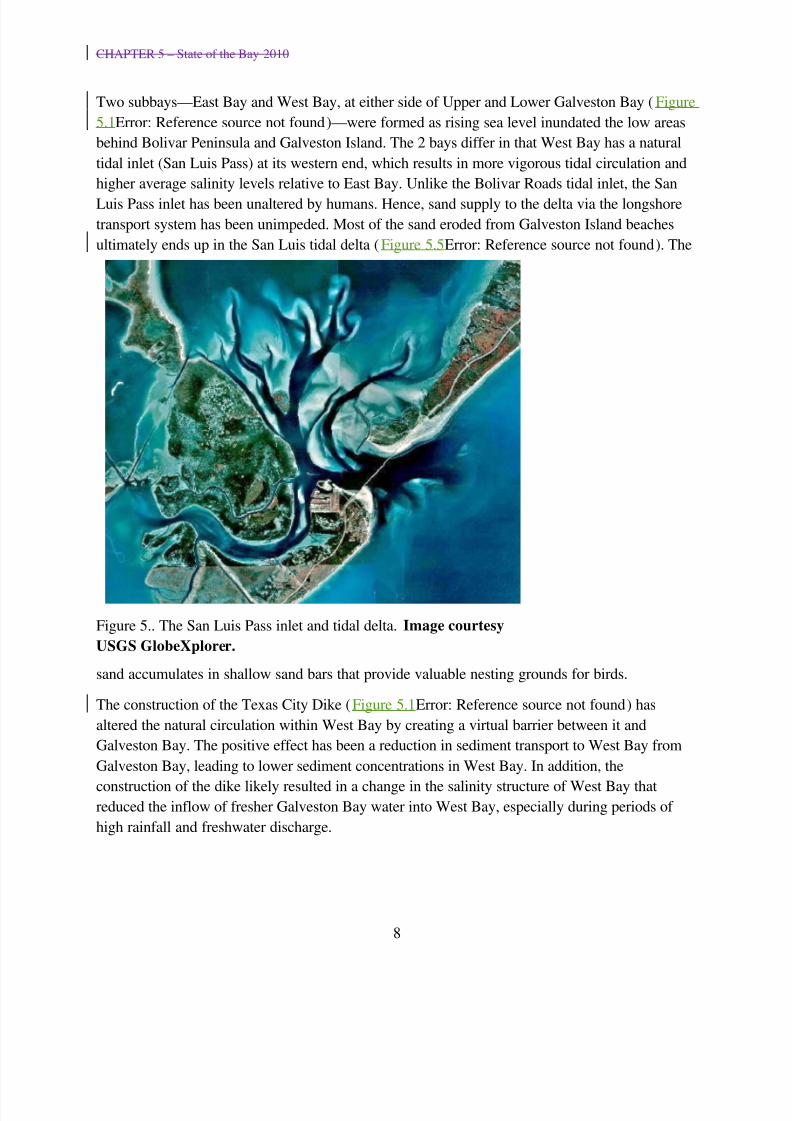
ultimately ends up in the San Luis tidal delta (Figure 5.5Error: Reference source not found). The
sand accumulates in shallow sand bars that provide valuable nesting grounds for birds.
The construction of the Texas City Dike (Figure 5.1Error: Reference source not found) has
altered the natural circulation within West Bay by creating a virtual barrier between it and
Galveston Bay. The positive effect has been a reduction in sediment transport to West Bay from
Galveston Bay, leading to lower sediment concentrations in West Bay. In addition, the
construction of the dike likely resulted in a change in the salinity structure of West Bay thatreduced the inflow of fresher Galveston Bay water into West Bay, especially during periods of
high rainfall and freshwater discharge.
8
Figure 5.. The San Luis Pass inlet and tidal delta. Image courtesy
USGS GlobeXplorer.
8/3/2019 Chapter 5 Rewrite Final 9-20-11
http://slidepdf.com/reader/full/chapter-5-rewrite-final-9-20-11 9/27
CHAPTER 5 – State of the Bay 2010
Impact of Sea Level Rise Change
Sea level has changed over time. rise is one of the main impacts of global climate change and has
accelerated (Error: Reference source not found). It is now well established that the rate of global
sea level rise (eustasy) has increased during the past 2 centuries, from an average rate of 1.2 mm
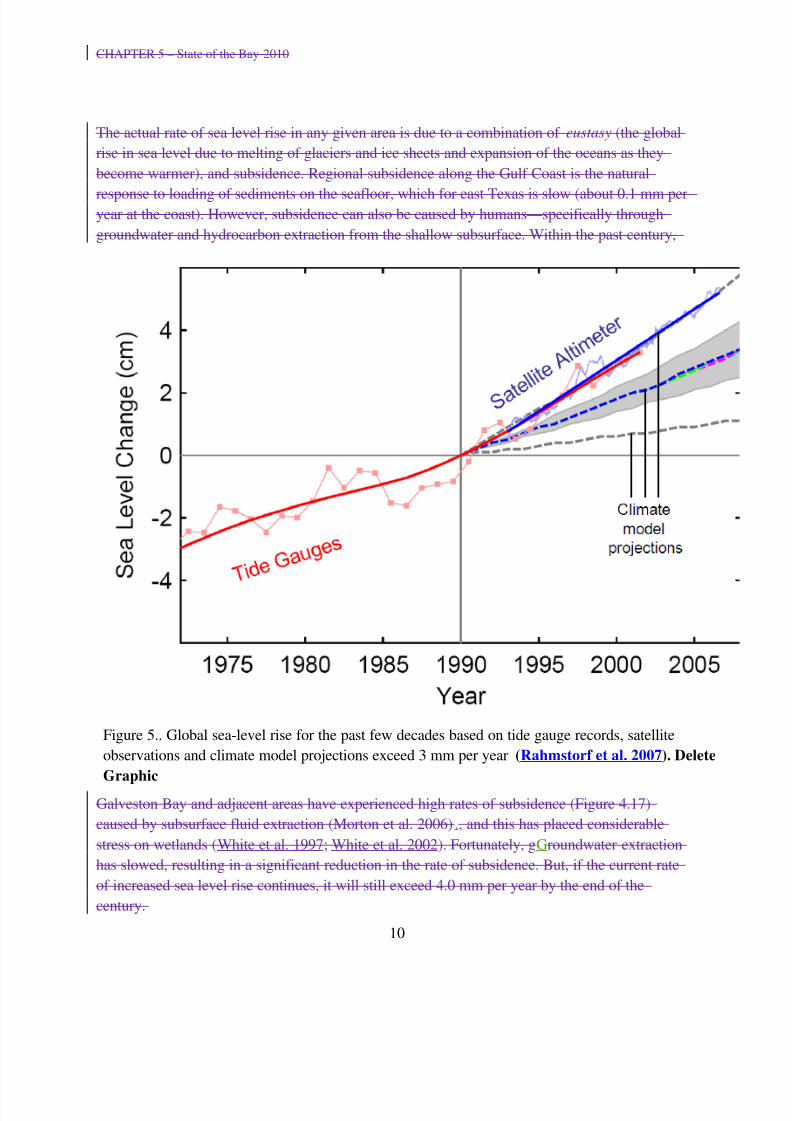
per year to 3.1 mm per year (Rahmstorf et al. 2007; Gehrels et al. 2008). While the actual rate of rise varies across the globe, tThe Gulf of Mexico has experienced an increase from 0.4 to 0.6 mm
per year for the past 4,000 years to a modern rate of 2.8 mm per year (Milliken et al. 2008)
(Figure 5.Figure 5.a). This is a departure from the long-range trend of decreasing sea level rise
over the past 10,000 years (Figure 5.Figure 5.b).
9
8/3/2019 Chapter 5 Rewrite Final 9-20-11
http://slidepdf.com/reader/full/chapter-5-rewrite-final-9-20-11 10/27
CHAPTER 5 – State of the Bay 2010
The actual rate of sea level rise in any given area is due to a combination of eustasy (the global
rise in sea level due to melting of glaciers and ice sheets and expansion of the oceans as they
become warmer), and subsidence. Regional subsidence along the Gulf Coast is the natural
response to loading of sediments on the seafloor, which for east Texas is slow (about 0.1 mm peryear at the coast). However, subsidence can also be caused by humans—specifically through
groundwater and hydrocarbon extraction from the shallow subsurface. Within the past century,
Galveston Bay and adjacent areas have experienced high rates of subsidence (Figure 4.17)
caused by subsurface fluid extraction (Morton et al. 2006)., and this has placed considerable
stress on wetlands (White et al. 1997; White et al. 2002). Fortunately, gGroundwater extraction
has slowed, resulting in a significant reduction in the rate of subsidence. But, if the current rate
of increased sea level rise continues, it will still exceed 4.0 mm per year by the end of the
century.
10
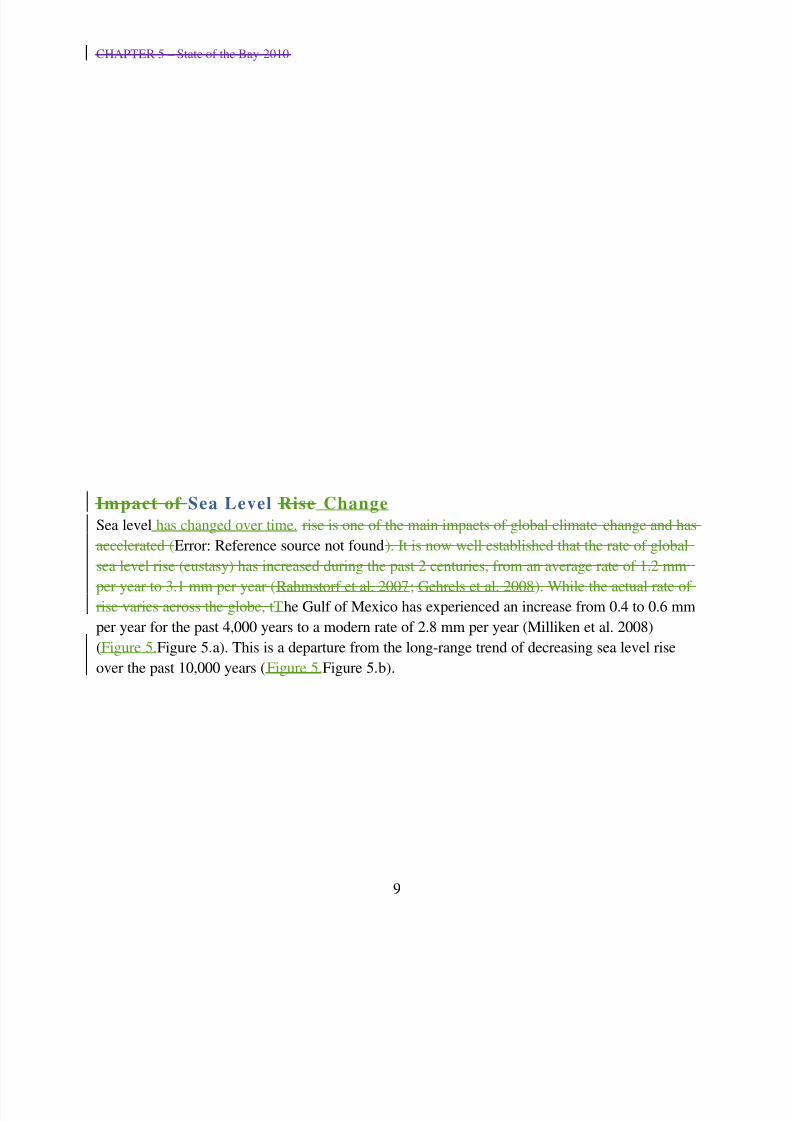
Figure 5.. Global sea-level rise for the past few decades based on tide gauge records, satellite
observations and climate model projections exceed 3 mm per year (Rahmstorf et al. 2007). Delete
Graphic
8/3/2019 Chapter 5 Rewrite Final 9-20-11
http://slidepdf.com/reader/full/chapter-5-rewrite-final-9-20-11 11/27
CHAPTER 5 – State of the Bay 2010
Figure 5.6. Sea level rise in the Gulf of Mexico (a) over the past 4,000 years; (b) over
the past 10,000 years. Image courtesy John Anderson.
The impact of sea level rise change on an estuary is dependent on sediment supply to the estuary.
If the rate of sediment supply is great enough to fill the space created by rising changing sea
level, the bay shoreline and wetlands will not be affected. Likewise, even in a stable sea level
11
8/3/2019 Chapter 5 Rewrite Final 9-20-11
http://slidepdf.com/reader/full/chapter-5-rewrite-final-9-20-11 12/27
CHAPTER 5 – State of the Bay 2010
scenario the bay shoreline and wetlands may experience significant erosion if the supply of
sediment to the estuary decreases. The most important natural factors governing the sediment
supply of rivers to estuaries are precipitation, stream discharge, and vegetation cover. Studies
have shown that significant changes in sediment supply occur at times when precipitation is
changing, especially when the climate changes from more arid to more humid conditions
(Fraticelli 2006).
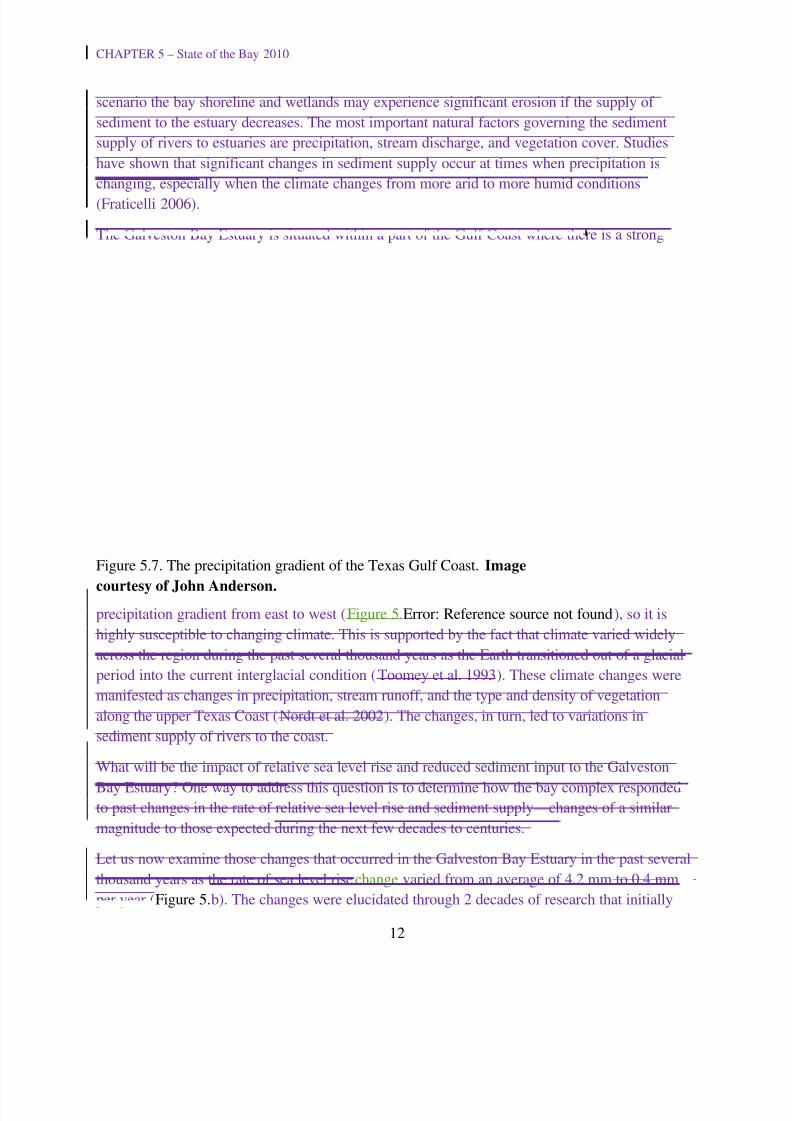
The Galveston Bay Estuary is situated within a part of the Gulf Coast where there is a strong
precipitation gradient from east to west (Figure 5.Error: Reference source not found), so it is
highly susceptible to changing climate. This is supported by the fact that climate varied widely
across the region during the past several thousand years as the Earth transitioned out of a glacial
period into the current interglacial condition (Toomey et al. 1993). These climate changes were
manifested as changes in precipitation, stream runoff, and the type and density of vegetation
along the upper Texas Coast (Nordt et al. 2002). The changes, in turn, led to variations in
sediment supply of rivers to the coast.
What will be the impact of relative sea level rise and reduced sediment input to the Galveston
Bay Estuary? One way to address this question is to determine how the bay complex respondedto past changes in the rate of relative sea level rise and sediment supply—changes of a similar
magnitude to those expected during the next few decades to centuries.
Let us now examine those changes that occurred in the Galveston Bay Estuary in the past several
thousand years as the rate of sea level risechange varied from an average of 4.2 mm to 0.4 mm
per year (Figure 5.b). The changes were elucidated through 2 decades of research that initially
12
Figure 5.7. The precipitation gradient of the Texas Gulf Coast. Image
courtesy of John Anderson.
8/3/2019 Chapter 5 Rewrite Final 9-20-11
http://slidepdf.com/reader/full/chapter-5-rewrite-final-9-20-11 13/27
CHAPTER 5 – State of the Bay 2010
involved detailed seismic surveys of the bay aimed at mapping the morphology of the Trinity-
Sabine incised valley (Smyth et al. 1988). This phase of the research was followed by an
examination of the sediments that fill the valley using seismic records and sediment cores. The
research led to the discovery that the Galveston Bay Estuary has experienced changes that are far
beyond any that have occurred during modern times.
The Evolution of Galveston Bay
We begin our discussion of Galveston Bay’s evolution at the last interglacial period, which
occurred approximately 120,000 years ago. At that time, the ice sheets were somewhat smaller
than today, resulting in a sea level stand approximately 5 meters above present. The shoreline at
that time extended from Smith Point across to San Leon (Figure 5.1Error: Reference source not
found).
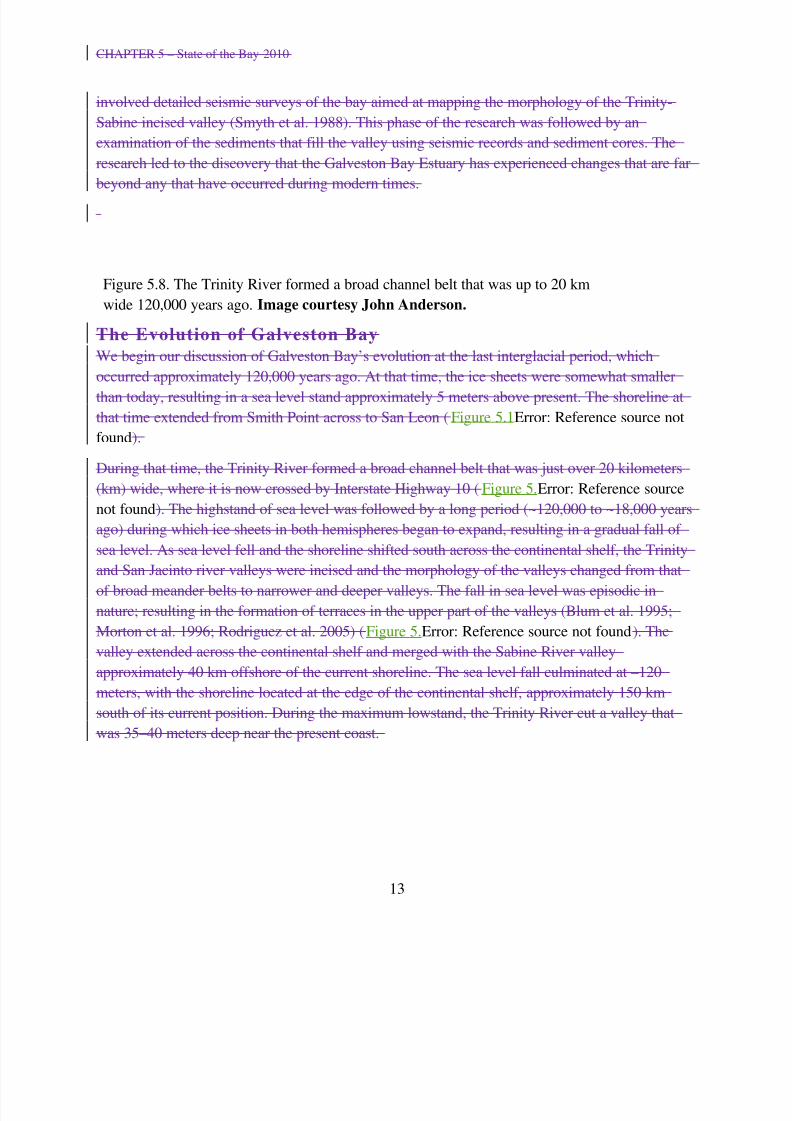
During that time, the Trinity River formed a broad channel belt that was just over 20 kilometers
(km) wide, where it is now crossed by Interstate Highway 10 (Figure 5.Error: Reference source
not found). The highstand of sea level was followed by a long period (~120,000 to ~18,000 years
ago) during which ice sheets in both hemispheres began to expand, resulting in a gradual fall of
sea level. As sea level fell and the shoreline shifted south across the continental shelf, the Trinity
and San Jacinto river valleys were incised and the morphology of the valleys changed from that
of broad meander belts to narrower and deeper valleys. The fall in sea level was episodic innature; resulting in the formation of terraces in the upper part of the valleys (Blum et al. 1995;
Morton et al. 1996; Rodriguez et al. 2005) (Figure 5.Error: Reference source not found). The
valley extended across the continental shelf and merged with the Sabine River valley
approximately 40 km offshore of the current shoreline. The sea level fall culminated at –120
meters, with the shoreline located at the edge of the continental shelf, approximately 150 km
south of its current position. During the maximum lowstand, the Trinity River cut a valley that
was 35–40 meters deep near the present coast.
13
Figure 5.8. The Trinity River formed a broad channel belt that was up to 20 km
wide 120,000 years ago. Image courtesy John Anderson.
8/3/2019 Chapter 5 Rewrite Final 9-20-11
http://slidepdf.com/reader/full/chapter-5-rewrite-final-9-20-11 14/27
CHAPTER 5 – State of the Bay 2010
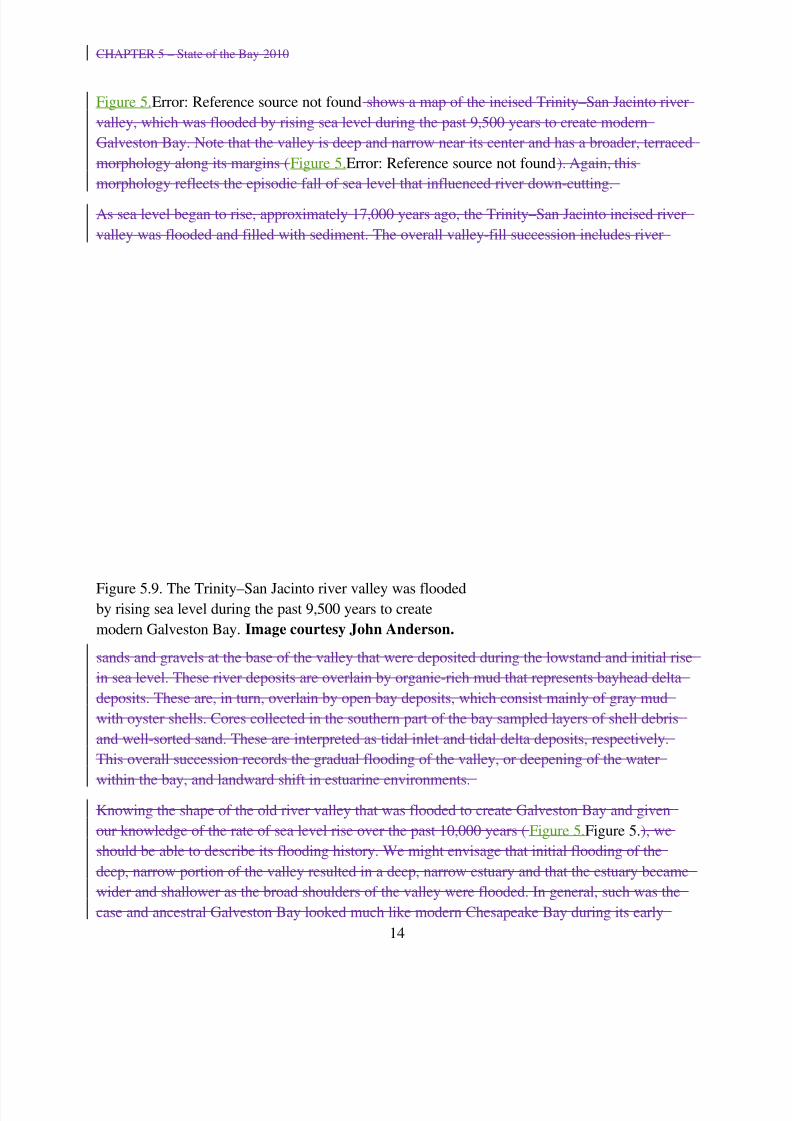
Figure 5.Error: Reference source not found shows a map of the incised Trinity–San Jacinto river
valley, which was flooded by rising sea level during the past 9,500 years to create modern
Galveston Bay. Note that the valley is deep and narrow near its center and has a broader, terraced
morphology along its margins (Figure 5.Error: Reference source not found). Again, this
morphology reflects the episodic fall of sea level that influenced river down-cutting.
As sea level began to rise, approximately 17,000 years ago, the Trinity–San Jacinto incised river
valley was flooded and filled with sediment. The overall valley-fill succession includes river
sands and gravels at the base of the valley that were deposited during the lowstand and initial rise
in sea level. These river deposits are overlain by organic-rich mud that represents bayhead delta
deposits. These are, in turn, overlain by open bay deposits, which consist mainly of gray mud
with oyster shells. Cores collected in the southern part of the bay sampled layers of shell debris
and well-sorted sand. These are interpreted as tidal inlet and tidal delta deposits, respectively.
This overall succession records the gradual flooding of the valley, or deepening of the water
within the bay, and landward shift in estuarine environments.
Knowing the shape of the old river valley that was flooded to create Galveston Bay and given
our knowledge of the rate of sea level rise over the past 10,000 years (Figure 5.Figure 5.), we
should be able to describe its flooding history. We might envisage that initial flooding of the
deep, narrow portion of the valley resulted in a deep, narrow estuary and that the estuary became
wider and shallower as the broad shoulders of the valley were flooded. In general, such was the
case and ancestral Galveston Bay looked much like modern Chesapeake Bay during its early
14
Figure 5.9. The Trinity–San Jacinto river valley was floodedby rising sea level during the past 9,500 years to create
modern Galveston Bay. Image courtesy John Anderson.
8/3/2019 Chapter 5 Rewrite Final 9-20-11
http://slidepdf.com/reader/full/chapter-5-rewrite-final-9-20-11 15/27
CHAPTER 5 – State of the Bay 2010
history. As sea level continued to rise and flood the broad shoulders of the valley, the bay took on
its current, more rounded shape, which still bears the outline of old river meanders.
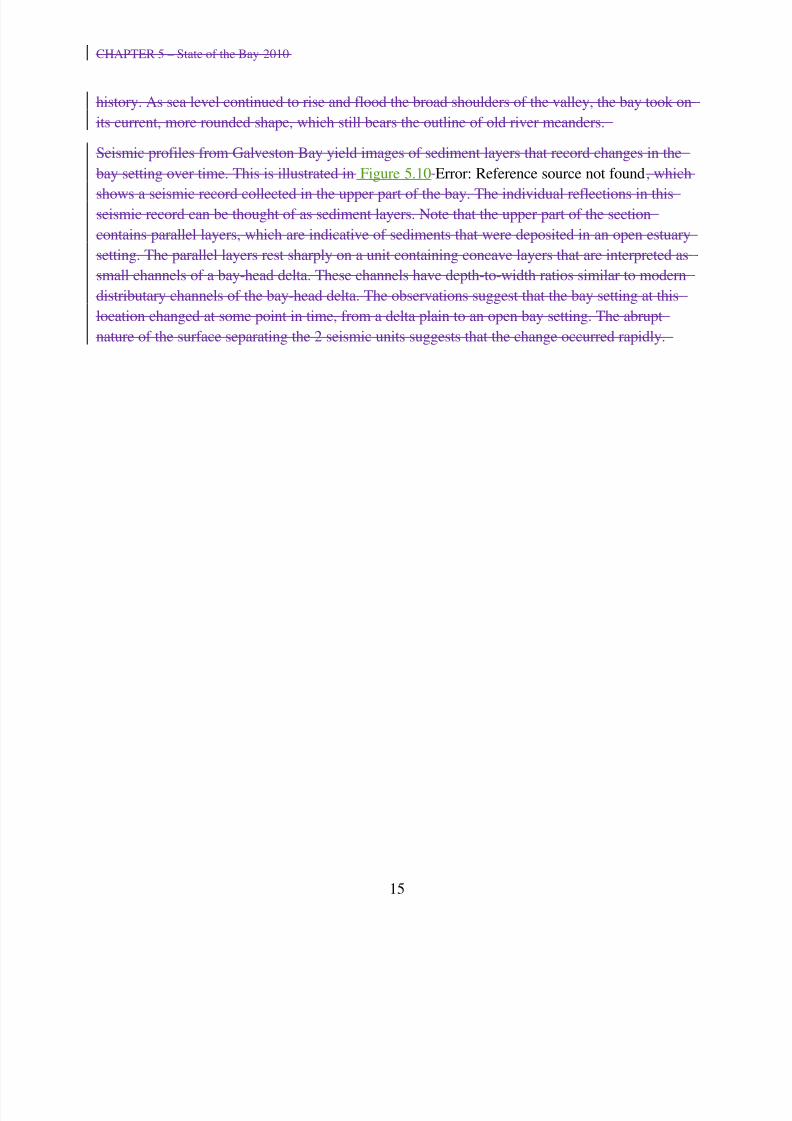
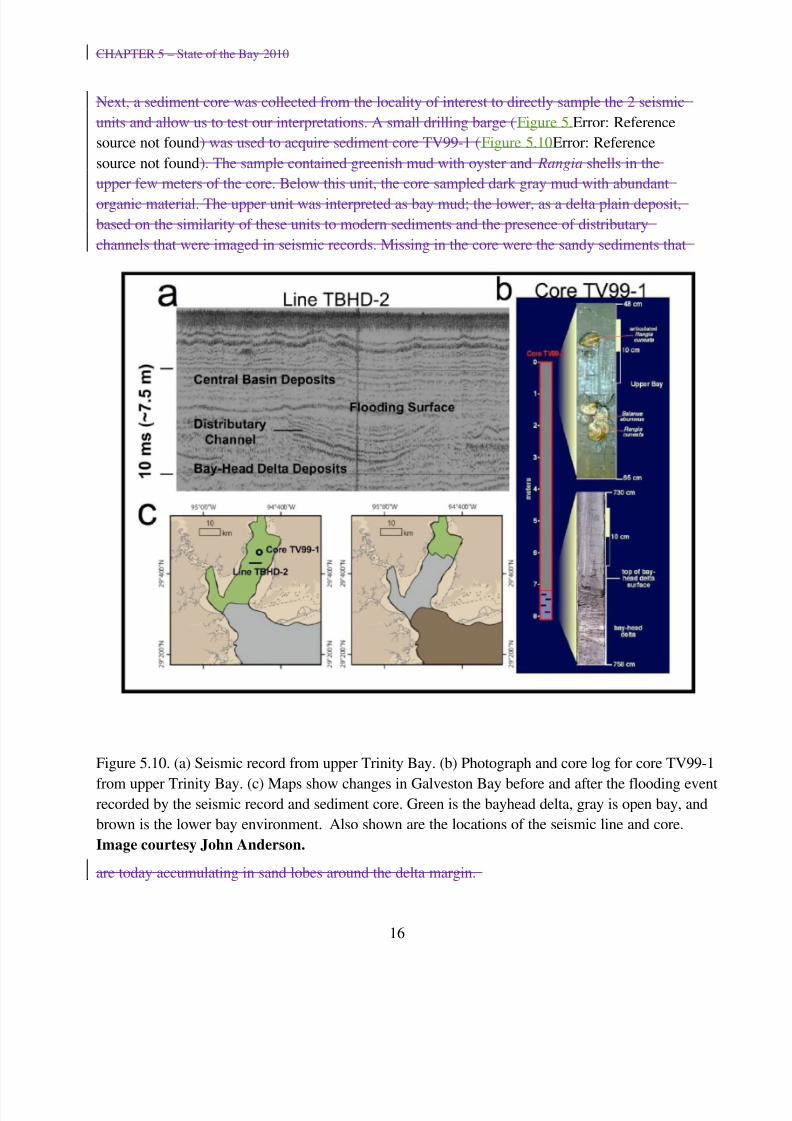
Seismic profiles from Galveston Bay yield images of sediment layers that record changes in the
bay setting over time. This is illustrated in Figure 5.10 Error: Reference source not found, which
shows a seismic record collected in the upper part of the bay. The individual reflections in thisseismic record can be thought of as sediment layers. Note that the upper part of the section
contains parallel layers, which are indicative of sediments that were deposited in an open estuary
setting. The parallel layers rest sharply on a unit containing concave layers that are interpreted as
small channels of a bay-head delta. These channels have depth-to-width ratios similar to modern
distributary channels of the bay-head delta. The observations suggest that the bay setting at this
location changed at some point in time, from a delta plain to an open bay setting. The abrupt
nature of the surface separating the 2 seismic units suggests that the change occurred rapidly.
15
8/3/2019 Chapter 5 Rewrite Final 9-20-11
http://slidepdf.com/reader/full/chapter-5-rewrite-final-9-20-11 16/27
CHAPTER 5 – State of the Bay 2010
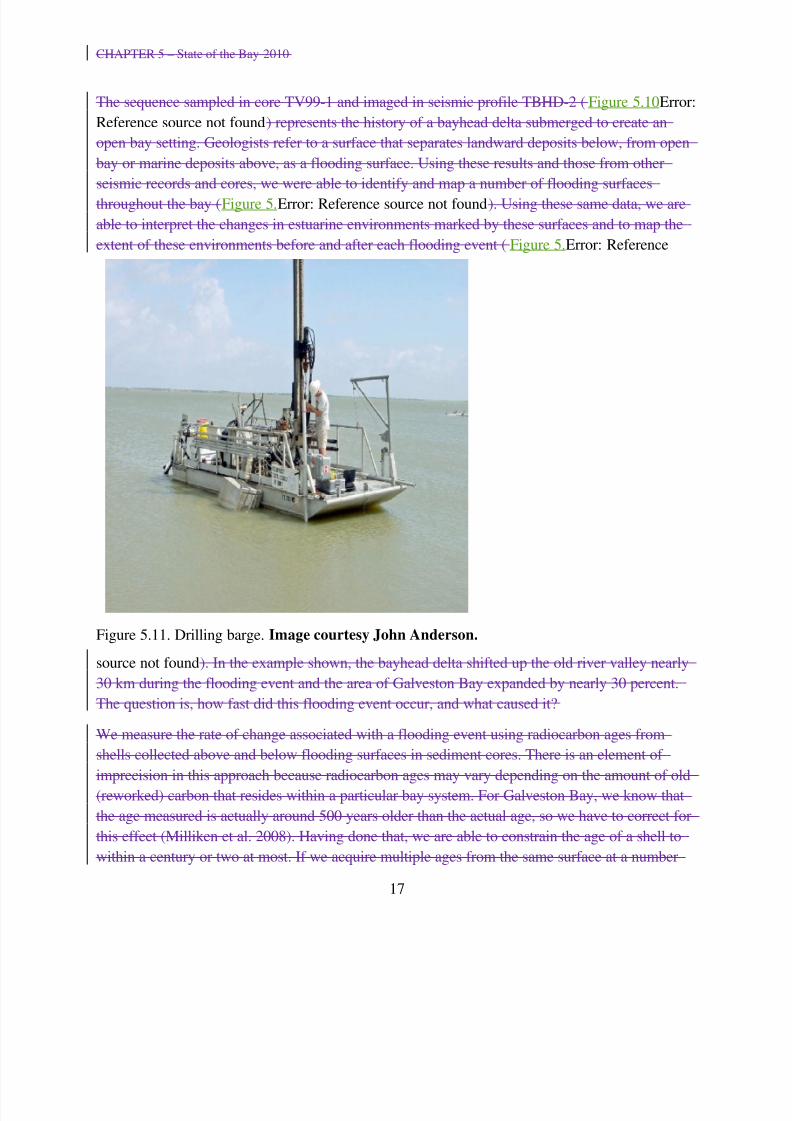
Next, a sediment core was collected from the locality of interest to directly sample the 2 seismic
units and allow us to test our interpretations. A small drilling barge (Figure 5.Error: Reference
source not found) was used to acquire sediment core TV99-1 (Figure 5.10Error: Reference
source not found). The sample contained greenish mud with oyster and Rangia shells in the
upper few meters of the core. Below this unit, the core sampled dark gray mud with abundant
organic material. The upper unit was interpreted as bay mud; the lower, as a delta plain deposit,
based on the similarity of these units to modern sediments and the presence of distributary
channels that were imaged in seismic records. Missing in the core were the sandy sediments that
are today accumulating in sand lobes around the delta margin.
16
Figure 5.10. (a) Seismic record from upper Trinity Bay. (b) Photograph and core log for core TV99-1
from upper Trinity Bay. (c) Maps show changes in Galveston Bay before and after the flooding eventrecorded by the seismic record and sediment core. Green is the bayhead delta, gray is open bay, and
brown is the lower bay environment. Also shown are the locations of the seismic line and core.
Image courtesy John Anderson.
8/3/2019 Chapter 5 Rewrite Final 9-20-11
http://slidepdf.com/reader/full/chapter-5-rewrite-final-9-20-11 17/27
CHAPTER 5 – State of the Bay 2010
The sequence sampled in core TV99-1 and imaged in seismic profile TBHD-2 (Figure 5.10Error:
Reference source not found) represents the history of a bayhead delta submerged to create an
open bay setting. Geologists refer to a surface that separates landward deposits below, from open
bay or marine deposits above, as a flooding surface. Using these results and those from other
seismic records and cores, we were able to identify and map a number of flooding surfaces
throughout the bay (Figure 5.Error: Reference source not found). Using these same data, we are
able to interpret the changes in estuarine environments marked by these surfaces and to map the
extent of these environments before and after each flooding event (Figure 5.Error: Reference
source not found). In the example shown, the bayhead delta shifted up the old river valley nearly
30 km during the flooding event and the area of Galveston Bay expanded by nearly 30 percent.
The question is, how fast did this flooding event occur, and what caused it?
We measure the rate of change associated with a flooding event using radiocarbon ages from
shells collected above and below flooding surfaces in sediment cores. There is an element of
imprecision in this approach because radiocarbon ages may vary depending on the amount of old
(reworked) carbon that resides within a particular bay system. For Galveston Bay, we know that
the age measured is actually around 500 years older than the actual age, so we have to correct for
this effect (Milliken et al. 2008). Having done that, we are able to constrain the age of a shell to
within a century or two at most. If we acquire multiple ages from the same surface at a number
17
Figure 5.11. Drilling barge. Image courtesy John Anderson.
8/3/2019 Chapter 5 Rewrite Final 9-20-11
http://slidepdf.com/reader/full/chapter-5-rewrite-final-9-20-11 18/27
CHAPTER 5 – State of the Bay 2010
of different locations within the bay, the range of uncertainty is decreased. Figure 5.Error:
Reference source not found also shows the ages of the flooding surfaces at different drill sites.
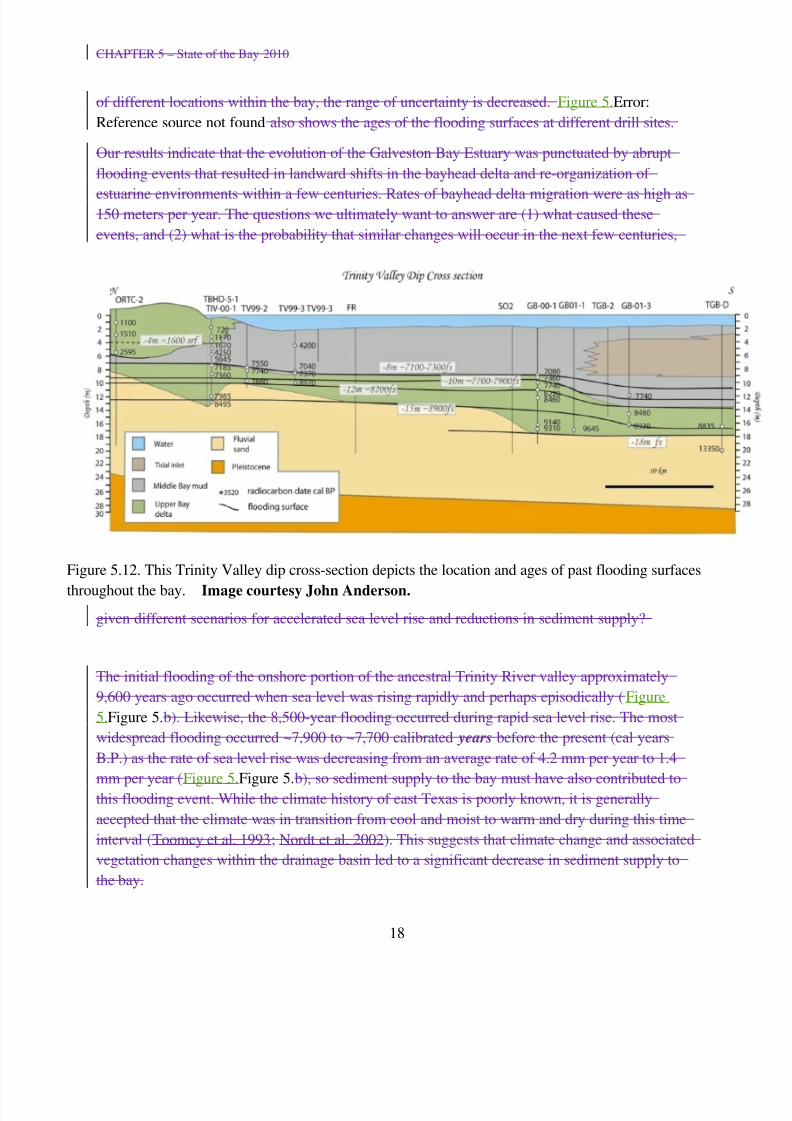
Our results indicate that the evolution of the Galveston Bay Estuary was punctuated by abrupt
flooding events that resulted in landward shifts in the bayhead delta and re-organization of
estuarine environments within a few centuries. Rates of bayhead delta migration were as high as150 meters per year. The questions we ultimately want to answer are (1) what caused these
events, and (2) what is the probability that similar changes will occur in the next few centuries,
given different scenarios for accelerated sea level rise and reductions in sediment supply?
The initial flooding of the onshore portion of the ancestral Trinity River valley approximately
9,600 years ago occurred when sea level was rising rapidly and perhaps episodically (Figure
5.Figure 5.b). Likewise, the 8,500-year flooding occurred during rapid sea level rise. The most
widespread flooding occurred ~7,900 to ~7,700 calibrated years before the present (cal years
B.P.) as the rate of sea level rise was decreasing from an average rate of 4.2 mm per year to 1.4
mm per year (Figure 5.Figure 5.b), so sediment supply to the bay must have also contributed tothis flooding event. While the climate history of east Texas is poorly known, it is generally
accepted that the climate was in transition from cool and moist to warm and dry during this time
interval (Toomey et al. 1993; Nordt et al. 2002). This suggests that climate change and associated
vegetation changes within the drainage basin led to a significant decrease in sediment supply to
the bay.
18
Figure 5.12. This Trinity Valley dip cross-section depicts the location and ages of past flooding surfaces
throughout the bay. Image courtesy John Anderson.
8/3/2019 Chapter 5 Rewrite Final 9-20-11
http://slidepdf.com/reader/full/chapter-5-rewrite-final-9-20-11 19/27
CHAPTER 5 – State of the Bay 2010
The Trinity River bayhead delta started to prograde into the upper estuary ~2,600 calibrated (cal)
years B.P., well after the rate of sea level rise had decreased to between 0.4 and 0.6 mm per year
(Figure 5.Figure 5.). The rate of growth of the delta increased dramatically after ~1,600 cal years
B.P., which indicates an increase in sediment supply, perhaps related to climate change. This
increase may also mark the beginning of agricultural activity by Native Americans in the drainage
basin of the river. Since ~1,600 cal years B.P., the main geological changes within the Galveston
Bay Estuary setting were the continued westward growth of the Bolivar Peninsula and the
shrinkage of the Bolivar tidal delta (Figure 5.1Error: Reference source not found).
Summary
The evolution of the Galveston Bay Estuary was punctuated by rapid changes, most of which
occurred when sea level was rising at a rate faster than present and when regional climate was
changing. The most important modifications included changes in precipitation and the resultant
changes in vegetation and sediment supply to the system. Other Texas estuaries, including Sabine
Lake (Milliken et al. 2008); Matagorda Bay (Maddox et al. 2008); and Corpus Christi Bay(Simms et al. 2008) have experienced similar changes.
Current rates of relative sea level rise, due to both an increased rate of eustasy and subsidence,
are approaching 3 mm per year and may well exceed 4 mm per year by the end of this century.
The Trinity bayhead delta is vulnerable to rapid sea level rise and variations in sediment supply.
In the past, the delta has had a threshold response to these changes that was manifested as virtual
destruction of the delta followed by reoccupation of the delta in a more landward location. This,
in turn, had impacts on the other estuarine environments. We should begin monitoring changes in
the delta and thinking about ways to mitigate impacts due to sea level rise and reduced sediment
supply to the Galveston Bay Estuary.
19
8/3/2019 Chapter 5 Rewrite Final 9-20-11
http://slidepdf.com/reader/full/chapter-5-rewrite-final-9-20-11 20/27
CHAPTER 5 – State of the Bay 2010
20
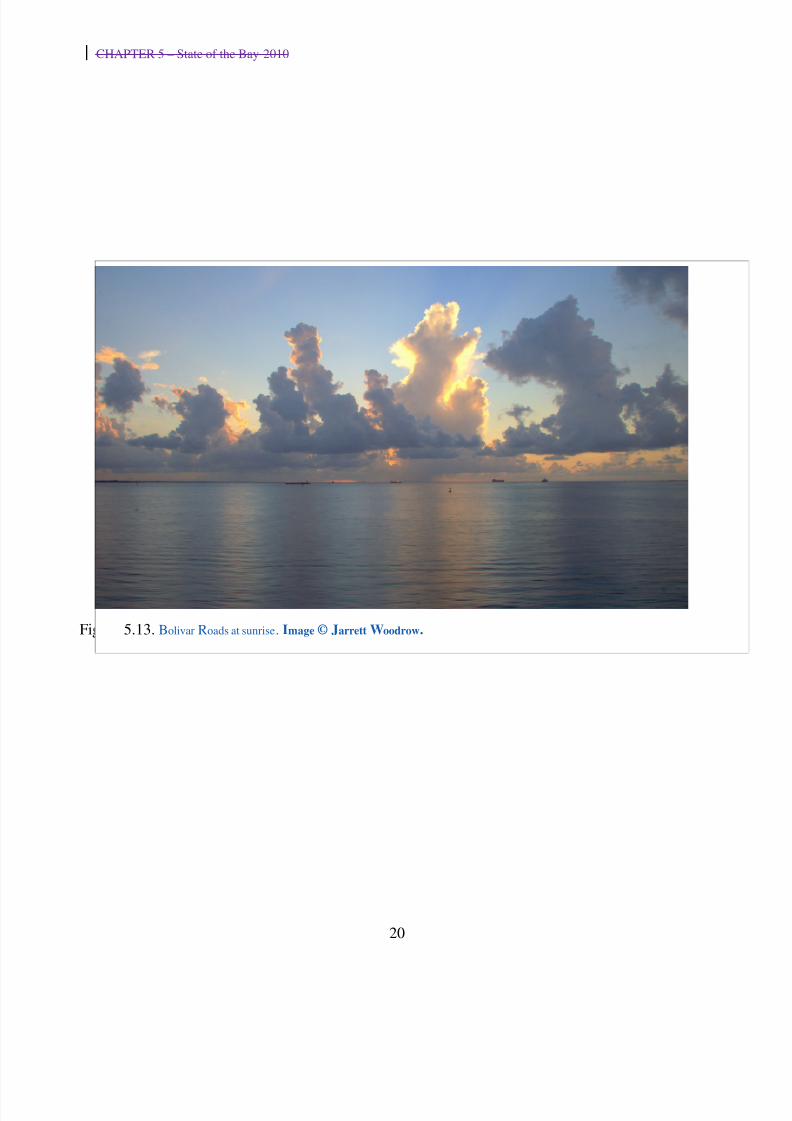
Figure 5.13. Bolivar Roads at sunrise. Image © Jarrett Woodrow.
8/3/2019 Chapter 5 Rewrite Final 9-20-11
http://slidepdf.com/reader/full/chapter-5-rewrite-final-9-20-11 21/27
CHAPTER 5 – State of the Bay 2010
Hurricane Ike—Ecological Impacts
Hurricanes are a periodic disturbance to the ecology of the Galveston Bay watershed. Since the
compilation of U.S. records began in 1851, 7 major hurricanes (Category 3, 4 or 5) have struck
the Upper Texas Coast; about one major hurricane every 20 years. The Galveston Bay area
experienced direct hits from hurricanes (defined as the eye of the storm making landfall in the
lower Galveston Bay watershed) in 1900, 1915, 1932, 1949, 1959, 1983, 1989, and 2008. All of
these events must have been associated with qualitatively similar ecological impacts. However, it
would have been difficult in 2007 to identify any ecological effects of Hurricane Alicia, which
crossed the middle of Galveston Island in 1983 or, in 1982, to identify remaining ecological
impacts from Debra, which crossed at San Luis Pass in 1959. Estuarine systems are changing
constantly; they respond to many temporal cycles and stresses, including hurricanes.
21
By L. James Lester
High Island
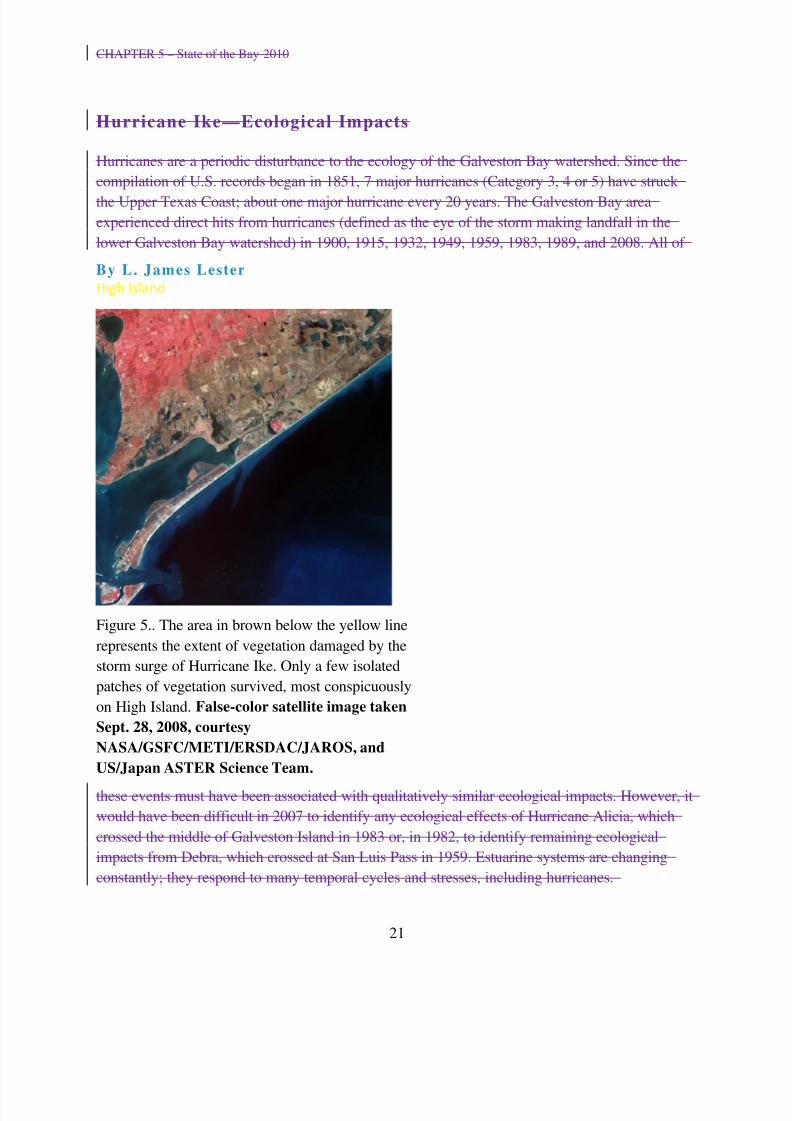
Figure 5.. The area in brown below the yellow line
represents the extent of vegetation damaged by the
storm surge of Hurricane Ike. Only a few isolated
patches of vegetation survived, most conspicuously
on High Island. False-color satellite image taken
Sept. 28, 2008, courtesy
NASA/GSFC/METI/ERSDAC/JAROS, and
US/Japan ASTER Science Team.
8/3/2019 Chapter 5 Rewrite Final 9-20-11
http://slidepdf.com/reader/full/chapter-5-rewrite-final-9-20-11 22/27
CHAPTER 5 – State of the Bay 2010
Hurricane Ike was not a major hurricane according to the Saffir-Simpson Hurricane Wind Scale,
but it was accompanied by a major storm surge. The storm surge that hit the Galveston Bay region in
September 2008 had large ecological impacts, but ecological systems that are adapted to the Texas
coast are resilient to such changes. Only those ecological impacts caused by anthropogenic stressors,
such as toxic chemical spills, are likely to significantly alter the ecological system on a decadal scale.
The storm surge from Hurricane Ike inundated the wetlands surrounding Galveston Bay, as seen
in Error: Reference source not found. The false-color, infrared image shows the vegetation dying
from salinity shock (areas in red depict living vegetation, areas in brown lack living vegetation).
The saline water that produced this effect drained out of the marshes soon after the storm passed
over the area, but the soil of the area was left with an elevated salinity that can only be reduced
by flushing or leaching with freshwater from runoff or precipitation. To the extent that the
salinity of soil in an area is permanently increased due to changes in the elevation or topography
of an area, the storm will have changed the biological community for a long time. Initial reports
suggest that there are areas on the eastern side of the bay where Ike changed freshwater marshes
to brackish and brackish to salt (FEMA 2008).
A substantial quantity of sediment was suspended in the storm surge of Ike. Some of that
sediment was deposited in the bay and buried benthic communities. It is not clear whether the
storm added sediment to the bay, but it certainly redistributed sediment with deleterious impacts
on some communities. Much of the area covered by the storm-deposited sediment was populated
by a soft sediment biological community before the storm and will be recolonized by a similar
biological community in the months and years following the storm. Of greatest significance for
the ecological characteristics of the bay is the area of oyster reefs buried by sediment. The Texas
Parks and Wildlife Department (TPWD) estimates that Ike buried around 60 percent of the living
consolidated oyster reef area in the bay and 80 percent in East Bay. It will take time for theoysters of the bay to build new reefs as large as those that existed in 2007. As noted above, there
have been multiple storm surges into Galveston Bay in history, and the oysters had rebuilt to the
extent shown in the maps in Chapter 7. Our current concern should be the impact of a depleted
oyster population on environmental quality in the bay and the status of the fishery during the
rebuilding process.
22
8/3/2019 Chapter 5 Rewrite Final 9-20-11
http://slidepdf.com/reader/full/chapter-5-rewrite-final-9-20-11 23/27
CHAPTER 5 – State of the Bay 2010
Whenever there is a major storm surge or flood event that produces a large flow of nutrient-rich
water draining from the surrounding marshes, there are fish kills (Error: Reference source not
found). As the flood waters of Ike drained from the marshes, many fish kills were noted (FEMA
2008). Most of the dead fish were likely menhaden and mullet, which have large populations and
high reproductive rates. Even if the mortalities were in the millions, these species should recover
in a few years.
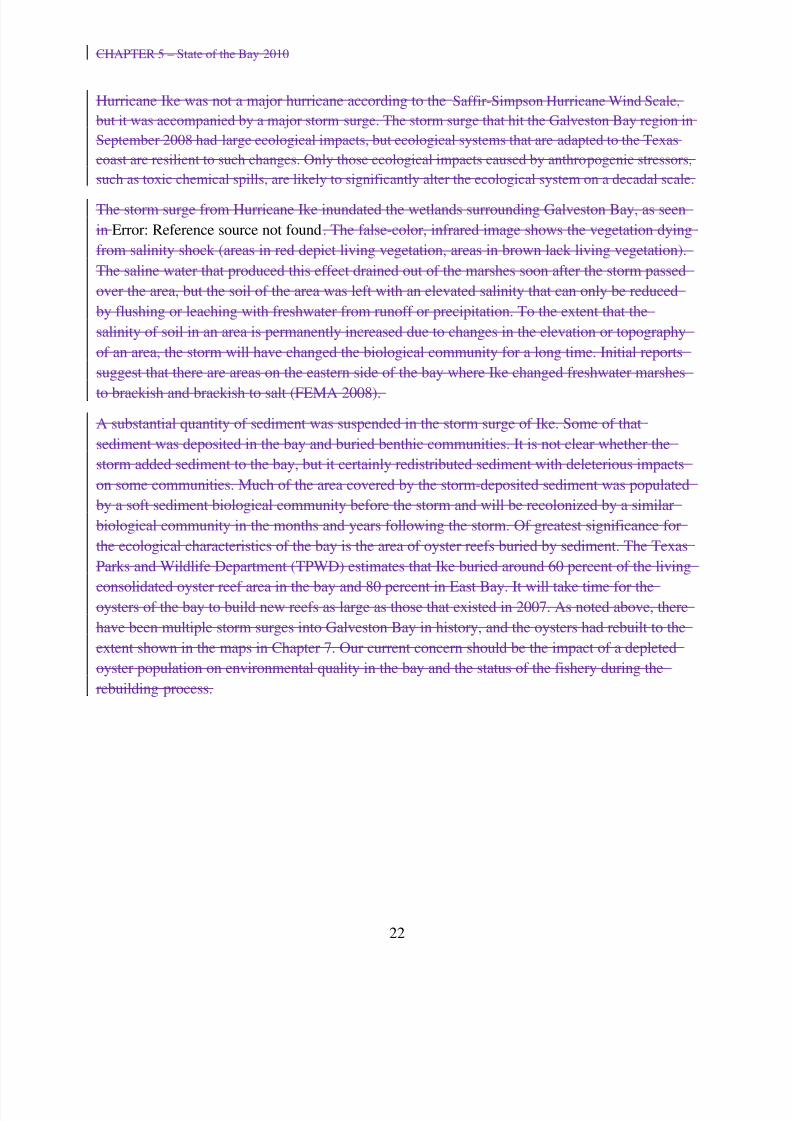
As the surge moved through areas of human development, it picked up contaminants and solid
waste that were carried into the bay. Nearly 200 spills of toxic chemicals were reported (FEMA
2008) and many more unreported small spills occurred when homes, stores and office buildings
flooded. Approximately 3,000 acres in the High Island–East Bay area were affected by visible oilsheens, and 500 to 2,000 acres in the Anahuac, McFaddin, and Sabine National Wildlife Refuges
suffered spills (FEMA 2008). Despite their common use, household chemicals (e.g. cleaning fluids
and pesticides) are often toxic in the environment. The quantity of toxic compounds released
from debris and the exact spatial distribution of small releases will never be known. Most
synthetic organic compounds can be degraded by physical or biological processes. A few types of
pollutants will remain in the sediments for a very long time but are rather quickly buried.
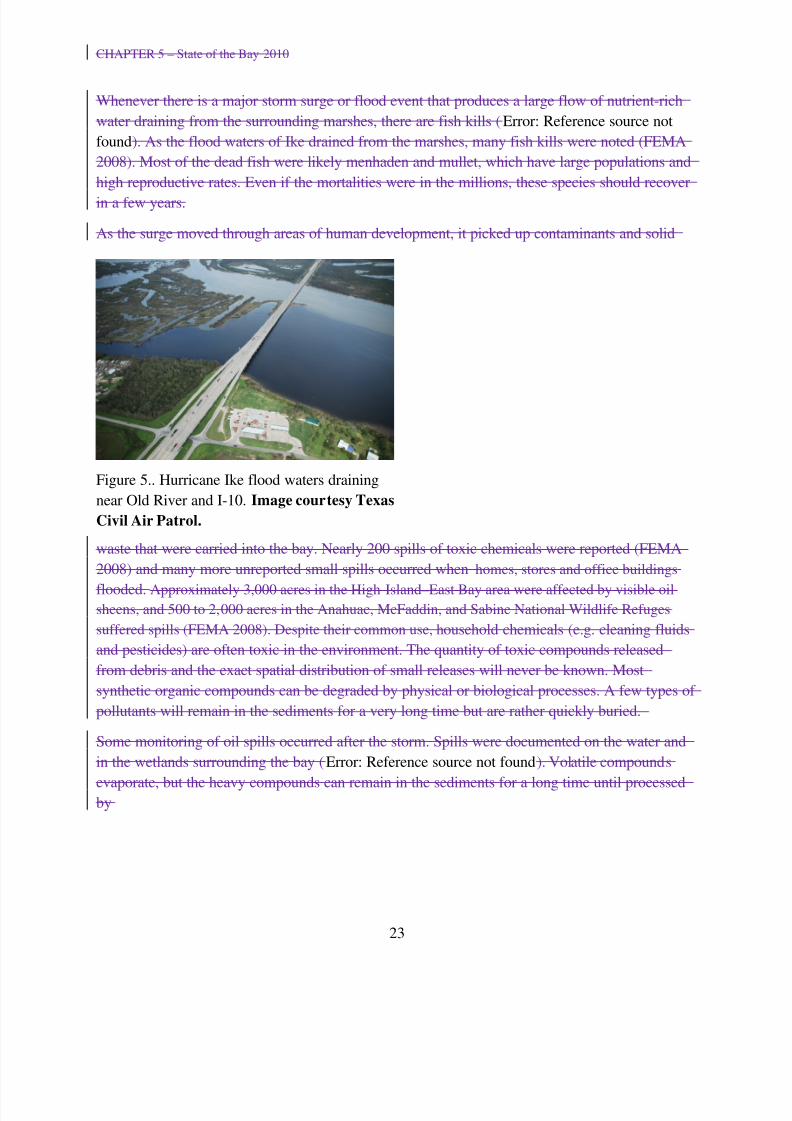
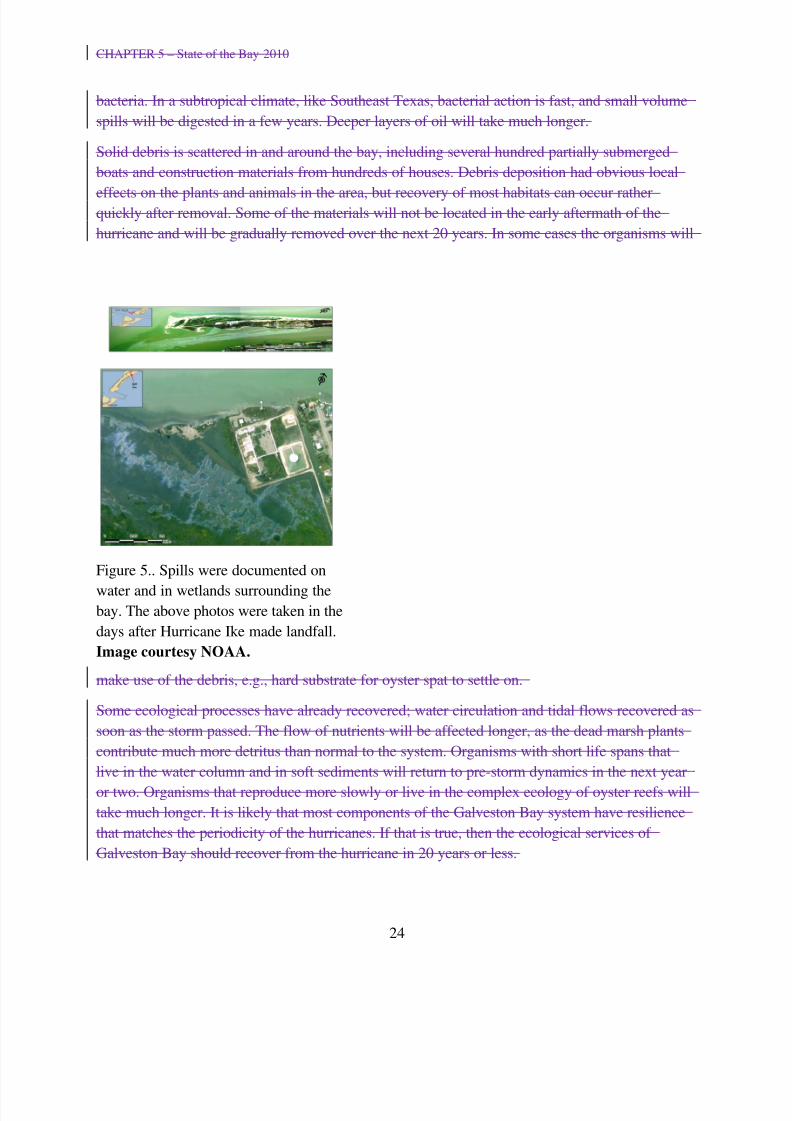
Some monitoring of oil spills occurred after the storm. Spills were documented on the water and
in the wetlands surrounding the bay (Error: Reference source not found). Volatile compounds
evaporate, but the heavy compounds can remain in the sediments for a long time until processedby
23
Figure 5.. Hurricane Ike flood waters draining
near Old River and I-10. Image courtesy Texas
Civil Air Patrol.
8/3/2019 Chapter 5 Rewrite Final 9-20-11
http://slidepdf.com/reader/full/chapter-5-rewrite-final-9-20-11 24/27
CHAPTER 5 – State of the Bay 2010
bacteria. In a subtropical climate, like Southeast Texas, bacterial action is fast, and small volume
spills will be digested in a few years. Deeper layers of oil will take much longer.
Solid debris is scattered in and around the bay, including several hundred partially submerged
boats and construction materials from hundreds of houses. Debris deposition had obvious local
effects on the plants and animals in the area, but recovery of most habitats can occur ratherquickly after removal. Some of the materials will not be located in the early aftermath of the
hurricane and will be gradually removed over the next 20 years. In some cases the organisms will
make use of the debris, e.g., hard substrate for oyster spat to settle on.
Some ecological processes have already recovered; water circulation and tidal flows recovered as
soon as the storm passed. The flow of nutrients will be affected longer, as the dead marsh plants
contribute much more detritus than normal to the system. Organisms with short life spans that
live in the water column and in soft sediments will return to pre-storm dynamics in the next year
or two. Organisms that reproduce more slowly or live in the complex ecology of oyster reefs will
take much longer. It is likely that most components of the Galveston Bay system have resilience
that matches the periodicity of the hurricanes. If that is true, then the ecological services of
Galveston Bay should recover from the hurricane in 20 years or less.
24
Figure 5.. Spills were documented on
water and in wetlands surrounding thebay. The above photos were taken in the
days after Hurricane Ike made landfall.
Image courtesy NOAA.
8/3/2019 Chapter 5 Rewrite Final 9-20-11
http://slidepdf.com/reader/full/chapter-5-rewrite-final-9-20-11 25/27
CHAPTER 5 – State of the Bay 2010
Galveston County’s waterfront communities have been challenged many times by extreme weather
events, but nothing on the magnitude of Hurricane Ike. The storm’s devastating surge ripped apart
homes, scoured beaches, destroyed landmark businesses and eroded the decades-old character of
many coastal neighborhoods. Shortly after the storm, it did not seem possible that Bolivar Peninsula
or the sleepy fishing towns lining the shores of Galveston Bay would ever recover, given the extent
of destruction. But the residents of these communities are a resilient breed, and they were determinedto preserve a peaceful way of life that is so closely tied to the bays and bayous. Friends, neighbors
and volunteers from across the country joined with county government and our state and federal
partners to clean up debris, remove hundreds of abandoned cars and boats—from both land and water
—and restore infrastructure to enable homeowners to rebuild. Our coastal communities survived and
are coming back bigger and better than ever. New homes built to better standards are being raised,
roadways are being rebuilt and elevated, generators are being installed to keep water and sewer lines
flowing properly, and trees are being planted to replace those killed by the salty surge. Disasters
bring federal dollars and once-in-a-lifetime opportunities. Galveston County is working to use these
dollars in ways that ensure our precious coastal way of life is protected and better able to withstand
what Mother Nature sends our way.—Galveston County Judge Jim Yarbrough, 2009
Literature Cited
Anderson, J. B. 2007. The Formation and Future of the Upper Texas Coast . College Station,Texas: Texas A&M Press.
Bernard, H. A., C. F. Major, and B. S. Parrot. 1959. "The Galveston barrier island and environs: a
model for predicting reservoir occurrence and trend." Gulf Coast Association of
Geological Society Transactions no. 9:221-224.
Blum, M. D., R. A. Morton, and J. M. Durbin. 1995. " Deweyville terraces and deposits of theTexas Gulf Coastal Plain." Gulf Coast Association of Geological Societies Transactions
no. 45:53-60.FEMA. 2008. Hurricane Ike preliminary recovery assessment: Hurricane Ike impact report.
Fraticelli, C. M. 2006. "Climate forcing in a wave-dominated delta: The effects of drought-flood
cycles on delta progradation." Journal of Sedimentary Research no. 76 (9-10):1067-1076.Gehrels, R., and S. Jevrejeva. 2008. Acceleration of sea-level rise in the past 200 years. Paper
read at Quaternary Association, Program and Abstracts of the 2008 Biennial Meeting, at
University Park, Pennsylvania.Graves, J. 1971. The Water Hustlers, edited by R.H. Boyle, J. Graves and T.H. Watkins, 253.
San Francisco, California: Sierra Club.
Mace, R. E., S. C. Davidson, E. S. Angle, and W. F. Mullican II. 2006. Aquifers of the Gulf Coast of Texas, Texas Water Development Board Report 365. edited by Texas WaterDevelopment Board. Austin, Texas.
Maddox, J., J. B. Anderson, K. Milliken, A. B. Rodriguez, T. M. Dellapenna, and L. J. B.
Giosan. 2008. "The Holocene evolution of Matagorda/Lavaca Bay estuary complex,Texas." In Response of Upper Gulf Coast Estuaries to Holocene Climate Change and
Sea-Level Rise, edited by Anderson and A.B. Rodriguez, 105-119. Geological Society of
America
25
8/3/2019 Chapter 5 Rewrite Final 9-20-11
http://slidepdf.com/reader/full/chapter-5-rewrite-final-9-20-11 26/27
CHAPTER 5 – State of the Bay 2010
Milliken, K. T., J. B. Anderson, and A. B. Rodriguez. 2008. "A new composite Holocene sea-
level curve for the northern Gulf of Mexico." In Response of Upper Gulf Coast Estuaries
to Holocene Climate Change and Sea-Level Rise, edited by J.B. Anderson and A.B.Rodriguez, 1-12. Geological Society of America Special Paper 443.
Morton, R. A., J. C. Bernier, and J. A. Barras. 2006. "Evidence of regional subsidence and
associated interior wetland loss induced by hydrocarbon production, Gulf Coast region,USA." Environmental Geology no. 50 (2):261-274.
Morton, R. A., M. D. Blum, and W.A. White. 1996. "Valley fills of incised coastal plain rivers."
Gulf Coast Association of Geological Society Transactions no. 46:321-331.Nordt, L. C., T. W. Boutton, J. S. Jacob, and R. D. Mandel. 2002. "C4 plant productivity and
climate-CO2 variations in south-central Texas during the Late Quaternary." Quaternary
Research no. 58:182-188.
Paine, J. G., and R. A. Morton. 1986. Historical shoreline changes in Trinity, Galveston, Westand East Bays, Texas Gulf Coast. Austin, Texas: The University of Texas at Austin,
Bureau of Economic Geology, Geology Circular 86-3.
Phillips, J. D., M. C. Slattery, and Z. A. Musselman. 2004. "Dam-to-delta sediment inputs and
storage in the lower Trinity River, Texas."Geomorphology
no. 62 (1-2):17-34.Rahmstorf, S., A. Cazenave, J. A. Church, J. E. Hansen, R. F. Keeling, D. E. Parker, and R. C. J.
Somerville. 2007. "Recent climate observations compared to projections." Science no.316 (5825):709-709.
Rodriguez, A. B., J. B. Anderson, and A. R. Simms. 2005. "Terrace inundation as an autocyclic
mechanism for parasequence formation: Galveston Estuary, Texas, USA." Journal of
Sedimentary Research no. 75 (4):608-620.
Rodriguez, A. B., J. B. Anderson, F. P. Siringan, and M. Taviani. 2004. "Holocene evolution of
the east Texas coast and inner continental shelf: Along-strike variability in coastal retreat
rates." Journal of Sedimentary Research no. 74 (3):405-421.Simms, A. R., J. B. Anderson, A. B. Rodriguez, and M. Taviani. 2008. "Mechanisms controlling
environmental change within an estuary: Corpus Christi Bay, Texas, USA." In Response
of Upper Gulf Coast Estuaries to Holocene Climate Change and Sea-Level Rise, editedby J.B. Anderson and A.B. Rodriguez, 121-146.
Siringan, F. P., and J. B. Anderson. 1993. "Seismic facies, architecture, and evolution of the
Bolivar Roads tidal inlet/delta complex, East Texas Gulf Coast." Journal of Sedimentary
Geology no. 63:794-808.
Smyth, W. C., J. B. Anderson, and M. A. Thomas. 1988. "Seismic facies analysis of entrenched
valley-fill: a case study of the Galveston Bay area, Texas." Gulf Coast Association of
Geological Societies Transactions no. 38:385-394.Toomey, R. S., M. D. Blum, and S. Valastro Jr. 1993. "Late Quaternary climates and
environments of the Edwards Plateau, Texas." Global and Planetary Change no. 7:299-
320.White, W. A., and R. A. Morton. 1997. "Wetland losses related to fault movement and
hydrocarbon production, southeastern Texas coast." Journal of Coastal Research no.
13:1305-1320.White, W. A., R. A. Morton, and C. W. Holmes. 2002. "A comparison of factors controlling
sedimentation rates and wetland loss in fluvial-deltaic systems." Texas Gulf coast
Geomorphology no. 44:47-66.
26

8/3/2019 Chapter 5 Rewrite Final 9-20-11
http://slidepdf.com/reader/full/chapter-5-rewrite-final-9-20-11 27/27
CHAPTER 5 – State of the Bay 2010
27

![Planning Scheme Rewrite Project Final Report Jan 2015 PLANNING SCHEME REWRITE PROJECT FINAL REPORT [2] GLOSSARY Incorporated Document: The Planning and Environment Act 1987 allows](https://img.pdfslide.net/doc/110x75/5b4054737f8b9a51528d1670/planning-scheme-rewrite-project-final-report-jan-2015-planning-scheme-rewrite-project.jpg)