Embed Size (px)
Citation preview
C H A P T E R - 5
Vib r a t io n a l spe c tr o sc o pic
STUDIES ON DOUBLE ALKALI MOLYBDATES/ TUNGSTATES
CHAPTERSVIBRATIONAL SPECTROSCOPIC STUDIES ON DOUBLE
ALKALI MOLYBDATES/ TUNGSTATES
5.1 INTRODUCTION
Molybdates and tungstates arc promising materials due to their high ionic and electron
conductivity, luminescence, ferroelectric, piezoelectric and catalytic properties [I j. the
transition metal oxides o f molybdates / tungstates with do configuration belong to the
most stable class o f materials used as photo anodes. They find wide applications as
scintillation detectors, laser host materials and in optical libers [2). Transition metal
molybdates/ tungstates have been studied widely due to their use as laser host and display
materials. However, the molvbdates/ tungstates o f alkali metals are rarely explored.
Aleksandrov et al [3] studied the double alkali tungstates CsLi\VQ4 (CLW). molybdates
CsLiM o ( )4 (CLM) and R b L iM o 04 (RLM) in ferroelectric phase. These belong to cubic
eccentric space group T li'7F43m and show remarkable piezoelectric effect and second
optic harmonic generation [4-6]. Their structure is based on a frame o f com er linked
M0 O4 and L i0 4 tetrahedral and topologically related to high cristobalite form o f SiO?.
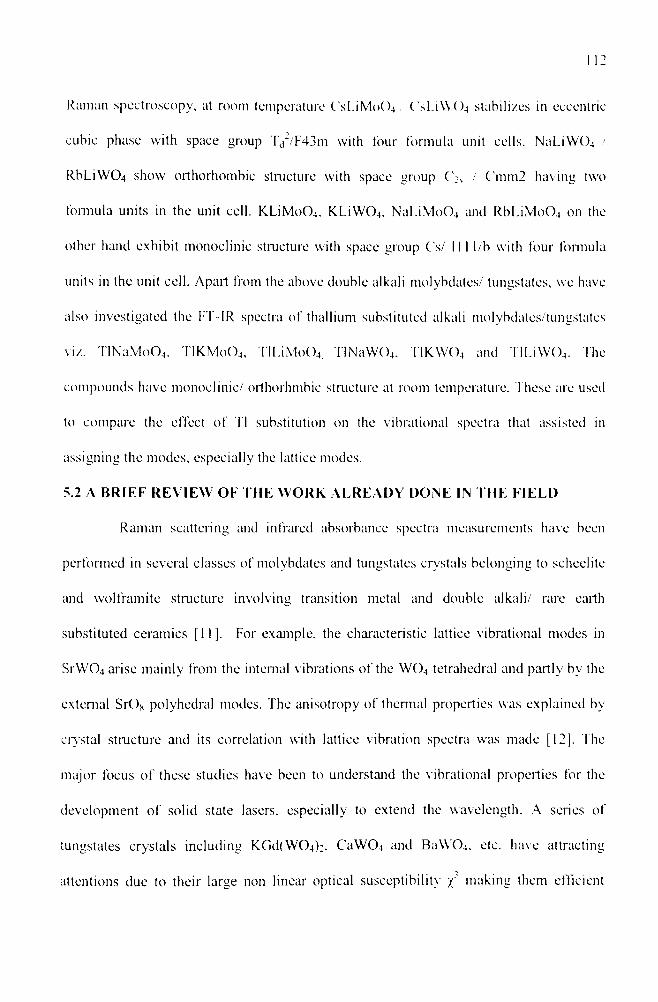
The cristobalite form is shown in figure 5.1. Cristobalite has an isometric structure, in
which six-membered rings o f (S i0 4)’4 tetrahedral are stacked parallel to (111). This
arrangement o f tetrahedral is analogous to the stacking o f spheres in cubic closest
packing. The large disorder produced due to variation of alkali ionic size gives interesting
properties and variety o f structural phases in these materials. It is also interesting to note
that indirect band-band transitions in transition metal molybdates tungstates are assisted
bv internal vibrations o f tetrahedral ion. Therefore, any distortion created at local level
could be utilized for applications by manipulating the band energy gap. 1 bus. the
vibrational studies become very important, especially in double alkali molybdates/
tungstates, for which such vibrational studies are sporadic only.
The molybdenum/ tungsten oxides with double alkali cations having general
formula A 1A 1M O4 ( A 1 = large and A> small s i /e monovalent cations and M-^Mo/W)
exhibit interesting commensurate-incommensurate phase transitions from high
temperature cubic phase (43m) to low temperature ferroelectric orthorhombic (mm2) to
monoclinic (111) phase [7], The crystal structure is mainly based on the framework ot
corner sharing o f MO4 and (A|, A2) ( )4 tetrahedral. The coordination around M atom is
tetrahedron to octahedron depending upon the oxygen bridge structure formation. The
large disorder produced due to variation o f ionic s i /e gives interesting properties and
variety of structural phases in these materials [<X],
IR and Raman spectroscopy has contributed greatly in understanding the nature of
vibrational transitions and molecular dynamics in ferroelectric materials by observing the
changes in vibrational modes with external variables inducing the transition. The hard
mode theory o f Petzelt [9] has been very successful in analyzing the spectroscopic data.
The phonon -pseudo spin couple approach is used where both displasive orientational
ordering contribute to the transition. Many new features such as incommensurate phases
and critical region are also explored experimentally. We measured the room temperature
IR and Raman spectra o f the materials and analyzed the observed modes using group
theoretical methods on the basis o f crystal structural information investigated and
presented in Chapter- 4. The main idea is to study the internal modes o f motion
corresponding to M ot>4 and W t)4 to deduce the statistical disorder present in them.
Systematic studies of vibrational spectra (IT1R and Raman) in the systems containing
molybdenum and tungsten have been carried out in this work. Raman spectroscopy is
regularly used to study the effects o f incorporating a large diversity o f metals such as
alkali and rare earth elements. Fourier Transform 1R spectra in combination with Raman
spectra using group theoretical techniques allowed the assignment o f vibrational modes
in different crystalline environment. Thus, the effect o f alkali cation substitution and site
symmetry can be deduced bv analyzing and comparing the modes in various materials o f
double alkali molybdates/ tungstates family. The materials studied are highly hygroscopic
and special care was taken in their preparation and during measurements. Raman
spectroscopy has been applied to the study o f many solid state tungstates. Interest in the
tungstates exists because o f observed electronic and ferroelectric effects. In recent
investigations Ktid (W 0 4)2 tungstates crystal (K tiW ) were found to be very promising
nonlinear media for SRS [ 10]. They possess strong symmetrical Raman active phonon
modes at 1047 c m 1, 901 cm ' 1 and 767 c m 1 and are found to be very important for Raman
frequency conversion o f picoseconds laser pulses with a wide spectrum o f oscillation.
The materials studied in the work include the double alkali molybdates tungstates
o f general formula A B M 0O4 A B W O 4 where A. represents the large size alkali cation
(Na. K. Cs. Rb) and B is small size cation (Li). The materials stabilize in differing crystal
structure at room temperature. They generally undergo a series of structural phase
transitions from prototype high temperature (cubic) phase - incommensurate phase-
(orthorhombic)-monoclinic phase. The orthorhombic ph;ise is in general lock in phase
where modulation in commensuratelv locked in. Of ail the materials studied through 1R
Raman spectroscopy, at room temperature C'sl.iMo()4 C'sLi\V( )4 stabilizes in eccentric
cubic phase with space group Td7F43m with tour formula unit cells. NaLiWQ4 /
R b L iW 0 4 show orthorhombic stmcture with space group / C'mm2 having two
formula units in the unit cell. K L iM o04, K L iW 0 4, N aL iM o 0 4 and R b L iM o 0 4 on the
other hand exhibit monoclinic structure with space group Cs/ I I 1 1/b with four formula
units in the unit cell. Apart from the above double alkali molybdates/ tungstates, we have
also investigated the FT-IR spectra o f thallium substituted alkali molybdates/tungstates
viz. T lN a M o 0 4, TIKM0 O4, T lFiM o()4. T IN aW 0 4, T1KWO., and TILiVVO.,. The
compounds have monoclinic/ orthorhmbic structure at room temperature. These are used
to compare the effect o f T1 substitution on the vibrational spectra that assisted in
assigning the modes, especially the lattice modes.
5.2 A BRIEF REVIEW OF THE W O RK A LREADY DONE IN THE FIELD
Raman scattering and infrared absorbance spectra measurements have been
performed in several classes of molybdates and tungstates crystals belonging to scheelite
and wolframite structure involving transition metal and double alkali/ rare earth
substituted ceramics [11]. For example, the characteristic lattice vibrational modes in
S rW 0 4 arise mainly from the internal vibrations o f the W 0 4 tetrahedral and partly by the
external SrOs polyhedral modes. The anisotropy o f thermal properties was explained by
crystal structure and its correlation with lattice vibration spectra was made [12]. The
major focus o f these studies have been to understand the vibrational properties for the
development o f solid state lasers, especially to extend the wavelength. A series of
tungstates crystals including K G d (W 0 4);. C a W 0 4 and B a \V 04. etc. have attracting
attentions due to their large non linear optical susceptibility •//' making them efficient
frequency converts by SRS [13-18], More recently, highly eificient SRS experiment ot
SrWO-i was conducted with maximum total con\'ersion efficiency 70% for the first &
second stokes [ 19J.
The vibrational studies in double tungstates M T(W ()4)i crystals (shortly MTW) derived
from the substitution o f Ca~' in the tetragonal scheelite-type C 'aW 04 by a couple ot M
and T ’ cations (M = alkali cation or Ag, T Y. La, In. or Bi. are also reported and
attracted attention due to demonstrations o f stimulated emission o f N d ' in simple X W O 4
(X ( 'a ' . S r ’, or Pb~ ) [20] as well as in double Na n >Cid ,M.xNdvW ()4 tungstates.
Subseciuent extensive studies revealed that the polymorphism is a distinctive feature o f
MTW compounds, and in fact, depending on the M-T ionic radii relationship as well as
the temperature o f the synthesis (or crystal growth) different phases have been found,
including the tetragonal scheelite-type o f the C'aWOi (space group /4Lv/ (No. <X8 )). but
also orthorhombic. monoclinic or even triclinic symmetries. Research activities on M I W
focused on the relationship between vibronic IR and Raman properties and the crystal
symmetry [2 1 ], their scintillating characteristics, nonlinear optical properties, such as
Raman shifting and up-conversion. and detailed spectroscopic and crystal held analyses
o f optically active R L ' in several monoclinic KTW (space group C2 c (No. 15)) and
tetragonal NaBiW (space group /4 (No. <X2)) hosts. More recently, with the development
o f the pumping technology using high-power semiconductor diode lasers DL. ultimate
capabilities o f these crystals as laser and nonlinear materials as well as for optical cooling
have been completely revealed in the strongly anisotropic (biaxial) monoclinic KYW.
KGdW and KLuW crystals [22], Such crystals, characterized by the possibility o f being
doped with hiLih concentrations ot the optically active RE ions without substantial
fluorescence quenching as well as high values of the absorption and emission cross
sections o f these dopants, have found applications in continuous wave (c\v) and pulsed
high-power laser systems, and as solid-state stimulated Raman laser shifters. Crystals
doped with Yb', ‘ and T in ' ' [23j have lately concentrated the interest as these cations
possess optical absorption bands allow very ef ficient high power diode-pumping, and the
achievement o f extended Yb ’and T in ” laser tunabilitv and ultra short pulse generation
[24-29).
The critical dependence o f the laser performance on host properties, such as
crystal field strength and ion-host interactions, imposes the need for a reliable
determination o f the involved Stark levels in order to calculate the partition functions
used in the evaluation o f the emission and gain cross sections for the indicated Tm ' and
Y b ' laser transitions. However, the unambiguous identification of energy levels in these
4/12 and 4/13 configurations is usually problematic, mainly due to the strong interaction
with lattice vibrations, and for the first one is specially complicated given the scarce
number o f energy levels, which prevent the phenomenological determination o f crystal
field effects and Stark levels .
In contrast to the potassium-based double tungstates. MTW crystals with M=Li or Na and
T - Y. La, Gd. Lu or Bi, possessing tetragonal U crystallographic structure present local
disorder associated to the random distribution o f M and T " cations on the same lattice
sites [30-34], When doped with optically active R L " cations their optical absorption and
photoluminescence spectra show substantial inhomogeneous broadening, and although
with proportional decrease in peak absorption and emission cross-sections with regard to
KTW counterparts, enlarged gain bandwidths. It is therefore interesting to understand the
effect o f large and small alkali cations occupying the same site on the vibrational modes
and also the effect o f site potential on the vibrational mode behavior, l his has been
attempted in the present work. In order to interpret the observed spectra, group theoretical
techniques lire very important; therefore first the summary o f factor group analysis used
in the present study is made.
5.3 FACTO R G R O U P ANALYSIS
Most spectroscopic measurements on crystals involve phenomena which are
translationally invariant .Consequently, great simplification results and a knowledge o f
the symmetry point group in sufficient to enable spectral predictions to be made. The
factor group and unit cell group lead to identical prediction but are only relevant when
these is coupling between corresponding transitions in different molecules [35]. fo r
increasing localized phenomena the site symmetry and oriented as models become more
applicable [36].
The Bhagavantham-Venkataryndu method [37] deals with the smallest unit
cell that is a rhombohedral cell for hexagonal system and the primitive cell for the other
systems. The rhombohedral cell contains one third o f the atoms in the hexagonal cell.
There are many ways o f choosing the primitive axes and primitive cell for a given lattice.
Bravais lattice is the common term for distinct lattice type. If the crvstallographic unit
cell is different from the smallest possible unit cell, as it is the case with all face centered,
side centered and body centered lattice, it will contain Z atoms where the volume o f the
crvstallographic cell will be Z-times that o f the Bravais cell where Z = 2 or 4.
For a crystal made up o f non-linear polyatomic molecules having P-atoms in
each molecule and with Z molecule for unit cell, the total number o f vibrations = 3Z.P.
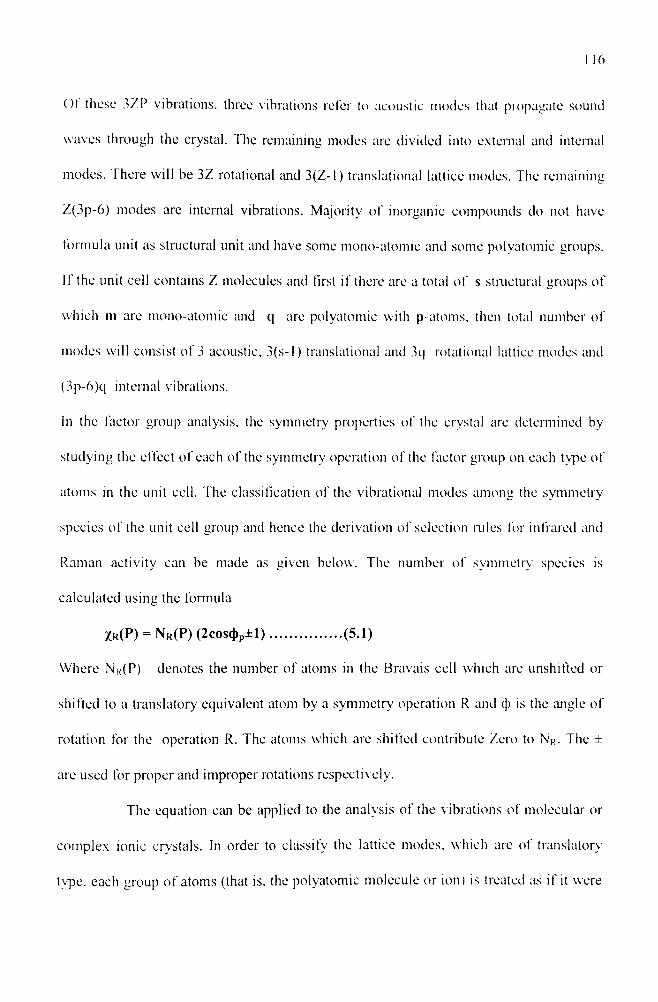
()l these 3ZP vibrations, three vibrations refer to acoustic modes that propagate sound
waves through the crystal. The remaining modes are divided into external and internal
modes. There will be 3Z rotational and 3(Z-1) translational lattice modes. The remaining
Z(3p-6) modes are internal vibrations. Majority o f inorganic compounds do not have
formula unit as structural unit and have some mono-atomic and some polyatomic groups.
It the unit cell contains Z molecules and first if there are a total o f s structural groups o f
which in are mono-atomic and q are polyatomic with p-atoms, then total number o f
modes will consist o f 3 acoustic, 3(s-l) translational and 3q rotational lattice modes and
(3p-6)q internal vibrations.
In the factor group analysis, the symmetry properties o f the crystal are determined by
studying the effect o f each o f the symmetry operation o f the factor group on each type o f
atoms in the unit cell. The classification o f the vibrational modes among the symmetry
species o f the unit cell group and hence the derivation of selection rules for infrared and
Raman activity can be made as given below. The number o f symmetry species is
calculated using the formula
Zr(P) = N r (P) (2 cos(j)p±l)...................... (5.1)
W here N R(P) denotes the number o f atoms in the Bravais cell which are unshifted or
shifted to a translatory equivalent atom by a symmetry operation R and (j) is the angle o f
rotation for the operation R. The atoms which are shifted contribute Zero to N r. The ±
are used for proper and improper rotations respectively.
The equation can be applied to the analysis o f the vibrations of molecular or
complex ionic crystals. In order to classify the lattice modes, which are o f translatory
type, each group o f atoms (that is. the polyatomic molecule or ion) is treated as if it were
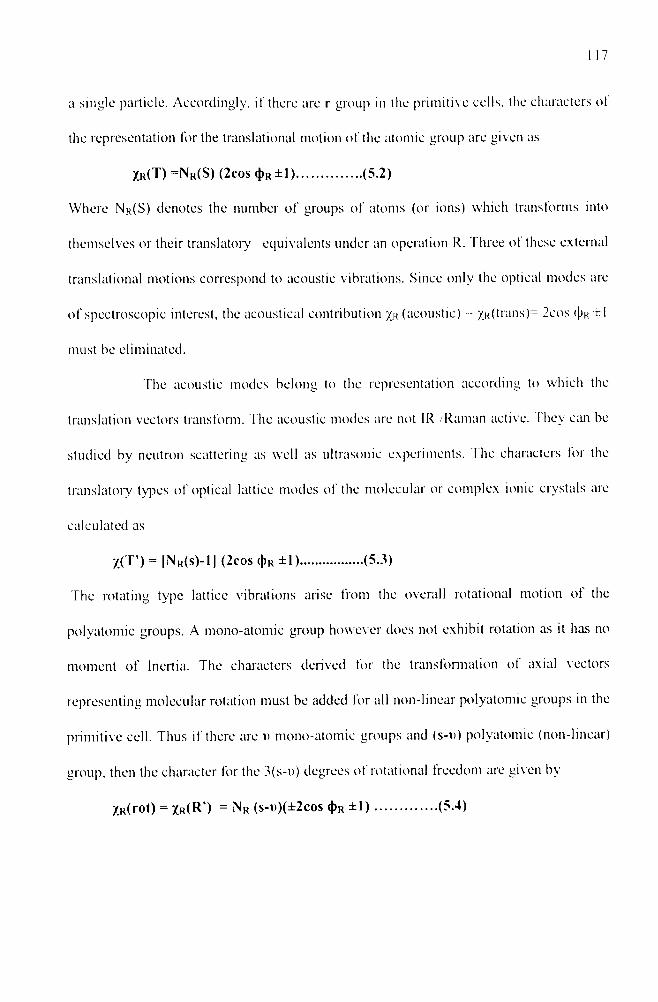
a single particle. Accordingly, if there are r group in the primitive cells, the characters ot
the representation for the translational motion o f the atomic group are given as
Xr(T) =N«(S) ( 2 c o s (J)r±1).......................... ( 5 .2 )
Where Nr(S) denotes the number o f groups o f atoms (or ions) which transforms into
themselves or their translatory equivalents under an operation R. Three ot these external
translational motions correspond to acoustic vibrations. Since only the optical modes are
o f spectroscopic interest, the acoustical contribution yj< (acoustic) xi<(lnins) = 2cos <|)K ±1
must be eliminated.
The acoustic modes belong to the representation according to which the
translation vectors transform. The acoustic modes are not IR /Raman active. 1 hey can be
studied by neutron scattering as well as ultrasonic experiments. I he characters for the
translatory types o f optical lattice modes o f the molecular or complex ionic crystals are
calculated as
y.(T’) = [Nr(s) -1 | (2eos «j»R ± l ) ................... (5.3)
The rotating type lattice vibrations arise from the overall rotational motion of the
polyatomic groups. A mono-atomic group however does not exhibit rotation as it has no
moment o f Inertia. The characters derived for the transformation o f axial vectors
representing molecular rotation must be added for all non-linear polyatomic groups in the
primitive cell. Thus if there are v mono-atomic groups and (s-i>) polyatomic (non-linear)
group, then the character for the 3(s-\>) degrees ot rotational freedom are given by
-/_R( r o t ) = X r ( R ' ) = N r ( s-d ) (± 2 c o s (}>r ± 1 ) .........................( 5 .4 )
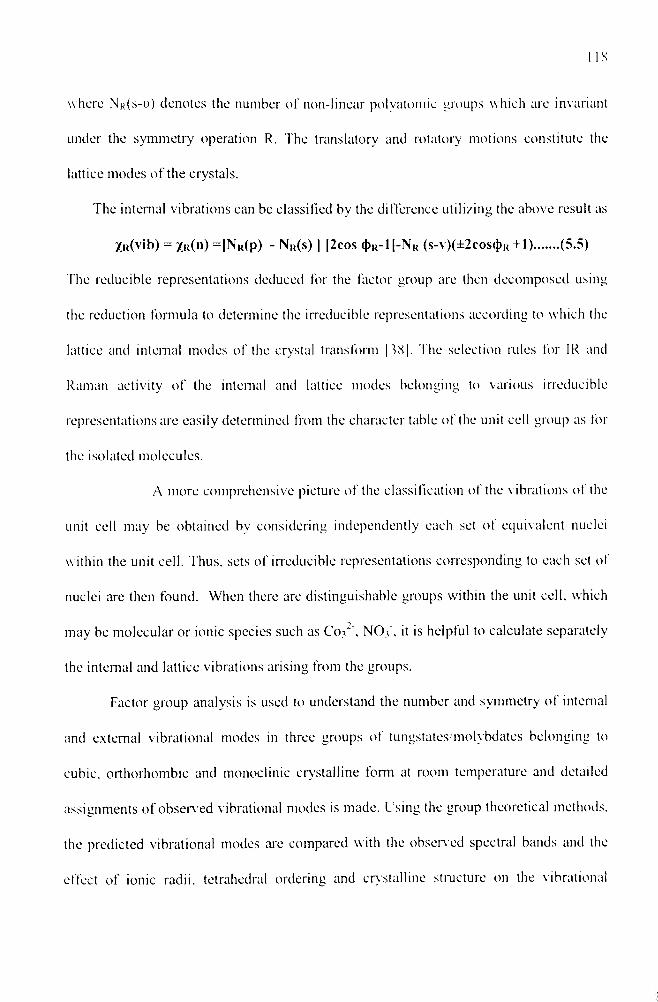
w here N r(s- u ) d en otes the number o f non-linear p o lyatom ic groups w hich are invariant
under the sym m etry operation R. The translatory and rotatory m otions constitute the
lattice m o d e s o f the crystals.
The internal vibrations can be classified by the difference utilizing the above result as
XR(vib) = Xn(n)= |NR(p) - N R(s) | |2 cos <J>R-1 |-N K ( s-v ) (± 2 c o s <J)r +1)........(5.5)
The reducible representations deduced for the factor group are then decomposed using
the reduction formula to determine the irreducible representations according to which the
lattice and internal modes o f the crystal transform [3S]. The selection rules for 1R and
Raman activity o f the internal and lattice modes belonging to various irreducible
representations are easily determined from the character table o f the unit cell group as for
the isolated molecules.
A more comprehensive picture o f the classification o f the vibrations ol the
unit cell may be obtained by considering independently each set ot equivalent nuclei
w ithin the unit cell. Thus, sets o f irreducible representations corresponding to each set ot
nuclei are then found. When there are distinguishable groups within the unit cell, which
may be molecular or ionic species such as C o / ' , N O / , it is helpful to calculate separately
the internal and lattice vibrations arising from the groups.
Factor group analysis is used to understand the number and symmetry o f internal
and external vibrational modes in three groups ot tungstates/molybdates belonging to
cubic, orthorhombic and monoclinic crystalline form at room temperature and detailed
assignments o f observed vibrational modes is made. Using the group theoretical methods,
the predicted vibrational modes are compared with the observed spectral bands and the
effect o f ionic radii, tetrahedral ordering and crystalline structure on the vibrational
modes are analyzed. As the materials are hardly studied earlier, attempt has been made
not only to confirm the structural forms investigated at room temperature by XRD, but
also the disorder in various species is explored. Most o f the observed spectral features are
commensurate with predicted vibrational modes based on the reported crystalline
structure.
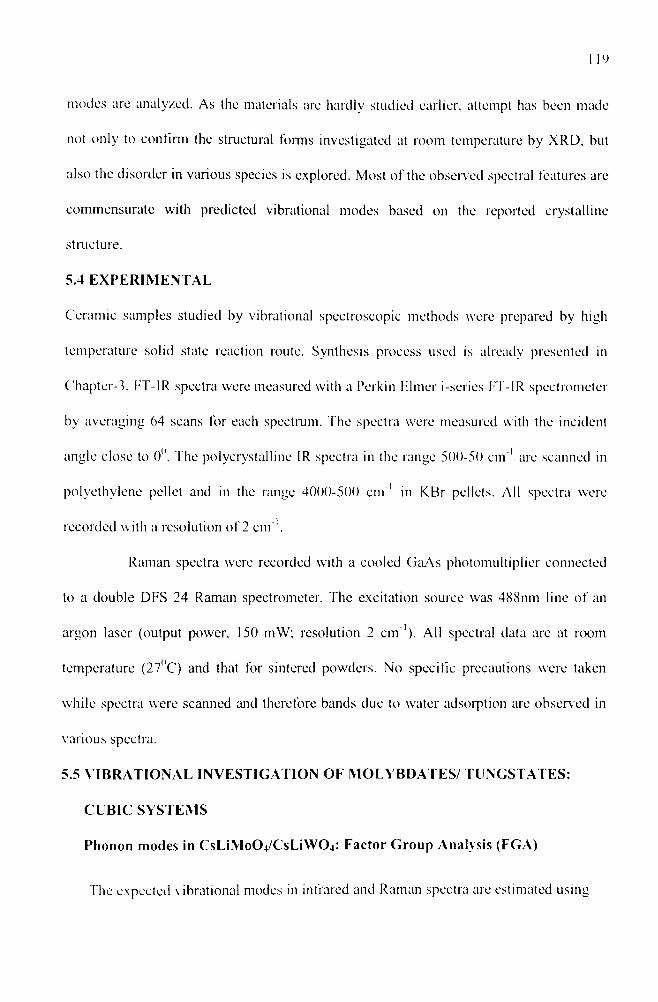
5.4 EXPER IM EN TA L
Ceramic samples studied by vibrational spectroscopic methods were prepared by high
temperature solid state reaction route. Synthesis process used is already presented in
Chapter-3. FT-IR spectra were measured with a Perkin Hlmer i-series FT-1R spectrometer
by averaging 64 scans for each spectrum. The spectra were measured with the incident
angle close to 0°. The polycrystalline IR spectra in the range 500-50 cm ' 1 are scanned in
polyethylene pellet and in the range 4000-500 cm 1 in KBr pellets. All spectra were
recorded with a resolution o f 2 cm"1.
Raman spectra were recorded with a cooled GaAs photomultiplier connected
to a double DFS 24 Raman spectrometer. The excitation source was 488nm line o f an
argon laser (output power, 150 mW; resolution 2 c m 1). All spectral data are at room
temperature (27°C) and that for sintered powders. No specific precautions were taken
while spectra were scanned and therefore bands due to water adsorption are observed in
various spectra.
5.5 V IB R A T IO N A L INVESTIGATION OF M O L Y B D A T E S/ TUNGSTATES:
CUBIC SYSTEM S
Phonon modes in C sL iM o 0 4/C sL iW 0 4: Factor Group Analysis (FGA)
The expected vibrational modes in infrared and Raman spectra are estimated using
factor group analysis and assignment o f observed modes is attempted based on the F(iA
predictions, reported assignments o f internal modes o f M0 O4/W O 4 in various compounds
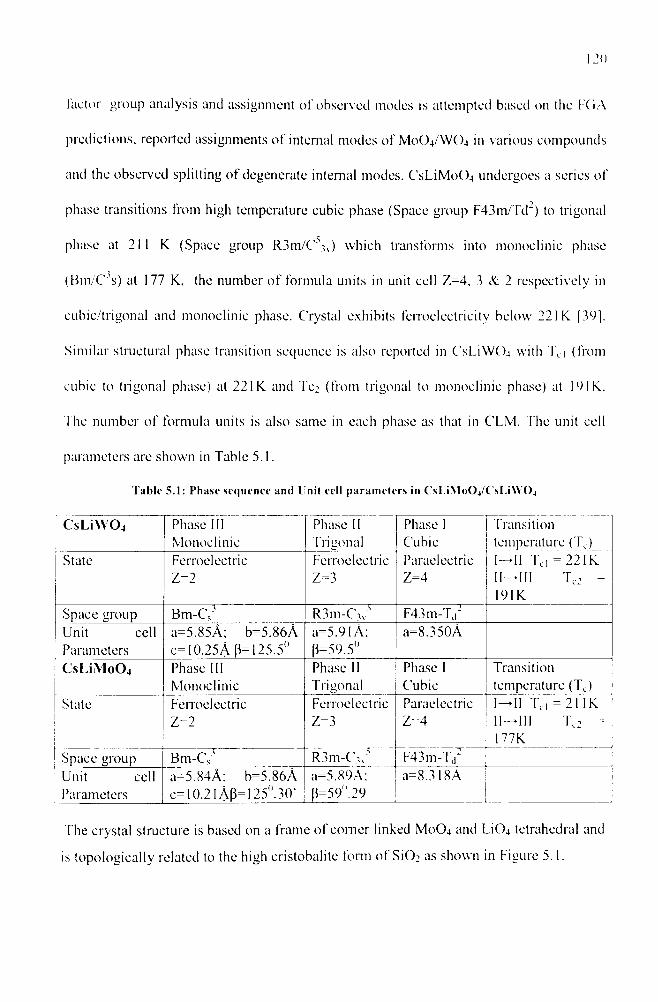
and the observed splitting o f degenerate internal modes. C.SUM0 O4 undergoes a series o f
phase transitions from high temperature cubic phase (Space group F43m/Td~) to trigonal
phase at 211 K (Space group R 3 m /C \N) which transforms into monoclinic phase
(iiin/'C’s) at 177 K, the number o f formula units in unit cell Z=4, 3 & 2 respectively in
cubic/trigonal and monoclinic phase. Crystal exhibits ferroelectricity below 2 2 IK [39],
Similar structural phase transition sequence is also reported in C SU W O4 with TL| (from
cubic to trigonal phase) at 2 2 IK and Tc;> (from trigonal to monoclinic phase) at 191 K.
The number o f formula units is also same in each phase as that in CLM. The unit cell
parameters are shown in Table 5.1.
Table 5.1: Phase sequence and Unit cell parameters in CsI.iM o()4/C'sI.iW()j
C s L iW 0 4 Phase 111 Monoclinic
Phase II Trigonal
Phase I Cubic
Transition temperature (Tc)
State FerroelectricZ=2
FerroelectricZ=3
ParaelectricZ=4
I—>•11 T cl = 22 IKII— III Tc; = 19 IK
Space group B m -C / R3m-C^- F43m-Td2Unit cell Parameters
a=5.85A; b=5.86A c=10.25A p= 125.5°
a=5.91 A; P=59.5"
a=8.350A
CsLiMoO* Phase III Monoclinic
Phase II Trigonal
Phase I Cubic
Transition temperature (Tc)
State FerroelectricZ=2
FerroelectricZ=3
ParaelectricZ‘--4
F43m-T,r
I— II Tc, = 21 IK II — III Tc; -177K
Space group Bm-Cs! R3m -C 'vUnit cell Parameters
a=5.84A; b=5.86A c= 10.21 Ap= 125".30'
a=5.89A:P=59".29
a=8.318A
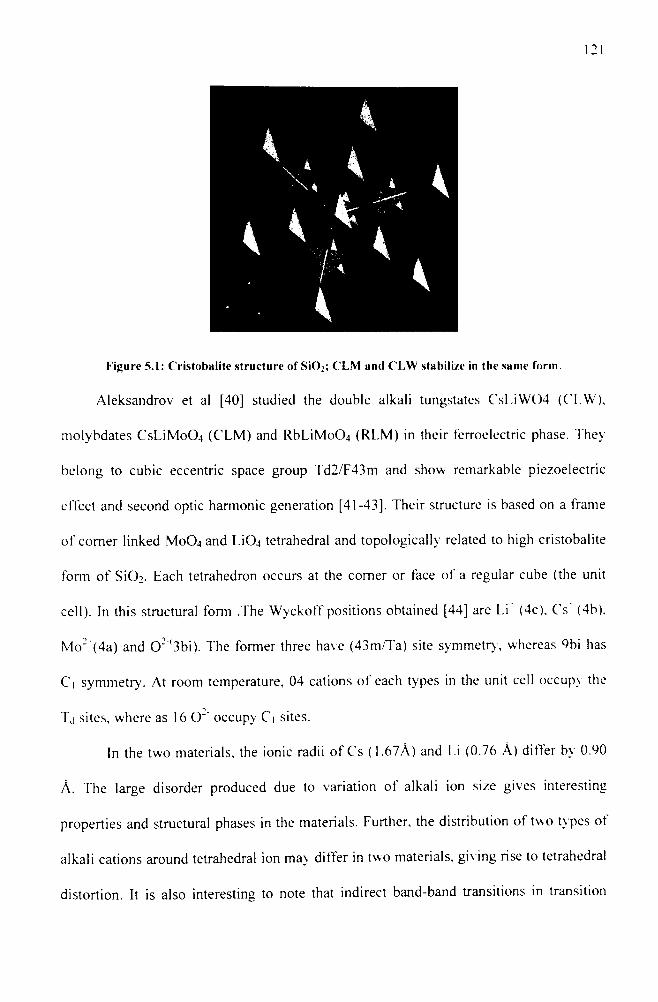
The crystal structure is based on a frame o f com er linked M 0O 4 and L i0 4 tetrahedral and
is topologically related to the high cristobalite form o f SiO: as shown in Figure 5.1.
V *K
<
Figure 5.1: Cristobalite structure of S i()2; C'LM and CLW stabilize in the same form.
Aleksandrov et al [40] studied the double alkali tungstates C sL iW 04 (CLW),
m olybdates C sL iM o 0 4 (CLM ) and R b L iM o 0 4 (RLM ) in their ferroelectric phase. They
belong to cubic eccentric space group Td2/F43m and show remarkable piezoelectric
effect and second optic harmonic generation [41-43]. Their structure is based on a frame
o f com er linked M 0 O4 and L i 0 4 tetrahedral and topologically related to high cristobalite
form o f S i(X Each tetrahedron occurs at the com er or face o f a regular cube (the unit
cell). In this structural form .The W yckoff positions obtained [44] are L.i' (4c), Cs (4b),
M o2"(4a) and 0 : "(3bi). The former three have (43m/Ta) site symmetry-, whereas 9bi has
Ci symmetry. At room temperature, 04 cations o f each types in the unit cell occupy the
Tj sites, where as 16 O'" occupy C 1 sites.
In the two materials, the ionic radii o f Cs (1.67A) and Li (0.76 A) differ by 0.90
A. The large disorder produced due to variation o f alkali ion size gives interesting
properties and structural phases in the materials. Further, the distribution o f two types ot
alkali cations around tetrahedral ion may differ in two materials, giving rise to tetrahedral
distortion. It is also interesting to note that indirect band-band transitions in transition
metal molybdates/ tungstates are assisted by internal vibrations of tetrahedral ion.
Therefore any distortion created at local level could be utilized for application by
manipulating the band energy gap. Thus, changes in the internal modes, especially in the
totally symmetric U| mode o f tetrahedral ion in double alkali molybdates/ tungstates,
w hich is 1R forbidden under Tj symmetry w ill reflect such distortion.
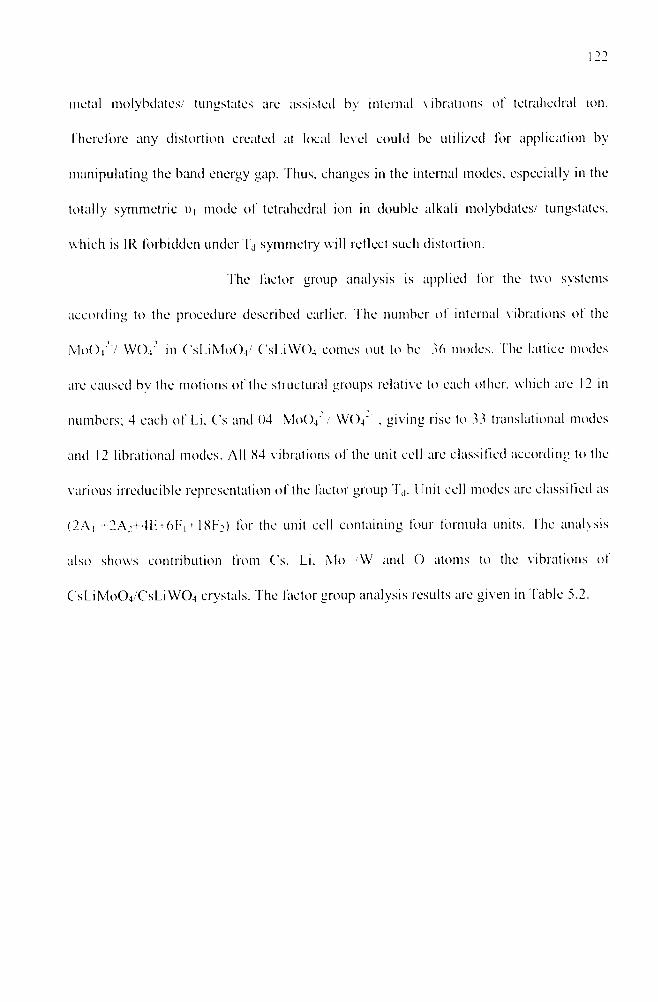
The factor group analysis is applied for the two systems
according to the procedure described earlier. 1'he number ot internal vibrations ot the
M o ( V 7 W ( )42 in C 'sI.iM oO / C sI . iW 0 4 comes out to be 36 modes. The lattice modes
are caused by the motions o f the structural groups relative to each other, which are 12 in
numbers; 4 each o f Li. C’s and 04 Mo()4‘7 W()4“ , giving rise to 33 translational modes
and 12 librational modes. All 84 vibrations of the unit cell are classified according to the
various irreducible representation o f the factor group T,|. Unit cell modes are classified as
(2A| t2Ai+4H + 6 Fi + 18f7) for the unit cell containing four formula units. The analysis
also show-s contribution from C's. Li. Mo W and O atoms to the vibrations ot
C’sL iM o 0 4/C sL iW 0 4 crystals. The factor group analysis results are given in Table 5.2.
I'able 5.2 Results of Factor Group Analysis for C s l . i . \ lo ( )4/t 's I . i \ \ Oj
I'd E 8C3 3C': 6 S4 6 od
N K(Li) 4 4 4 4 4
R r ( C s ) 4 4 4 4 4
N r ( M o ) 4 4 4 4 4
N r(O) 16 0 0 0 0
N R(C sL iM o 0 4) 28 12 12 12 12
<I> 0 120 180 90 0
C'os <I> 1 -0.5 -1 0 1
2 Cos <I> i I 3 0 -1 r - l 1
Xk ( L i ) 12 0 -4 -4 4
X k ( t ' s ) 12 0 -4 -4 4
Xu(Mo) 12 0 -4 -4 4
Xk ( O ) 48 0 0 0 0
N r ( P ) 28 12 12 12 12
N r ( S ) 12 12 12 1 2 12
N r ( S - V ) 04 0 0 0 0
/j < ( N ) 84 0 -12 - 1 2 12
Zk(T) 36 0 - 1 2 - 1 2 12... _i
trails) 3 0 -1 - 1 1
Xk(T ') ->0 - 1 1 - 1 1 1 1
Xr ( R ' ) 12 0 0 0 0
Xk(ii) 39 0 -5 -5 5
Irreducible representations (symmetry species o f vibrational modes) (or translational modes o f each species, total modes o f the unit cell are as given below:
n , = 4F2; rcs = 4F ; : r Mo w = 4 F 2;p „ = 2 A |+ 2 A ;+ 4 E + 6 F |+6F; r CsLiM oO, = 2 A |+ 2A 2+4E+6F| + 18F;
where A,. A: are non-degenerate species: E is doubly degenerate and F,. F; belongs to
triplv degenerate species ot Tj space group. Accordingly, total 84 modes belong to (2A 1
- 2 A : - 4 E - 6 F | - 1 8 F : ) irreducible symmetry species. Translation modes of Li' CV \Y‘
belongs to 4F2 whereas those O2' to 2A, +2A.+4H t 6 F, i 6 F: . the acoustic modes belongs
to 6 F2. The internal vibration o f M o 0 42' /W 0 42 ; v ,(A,) v: (E) and v3 / v4(F: ) will not get
split in this state. However, Factor group splitting may produce bands in polycrystalline
material.
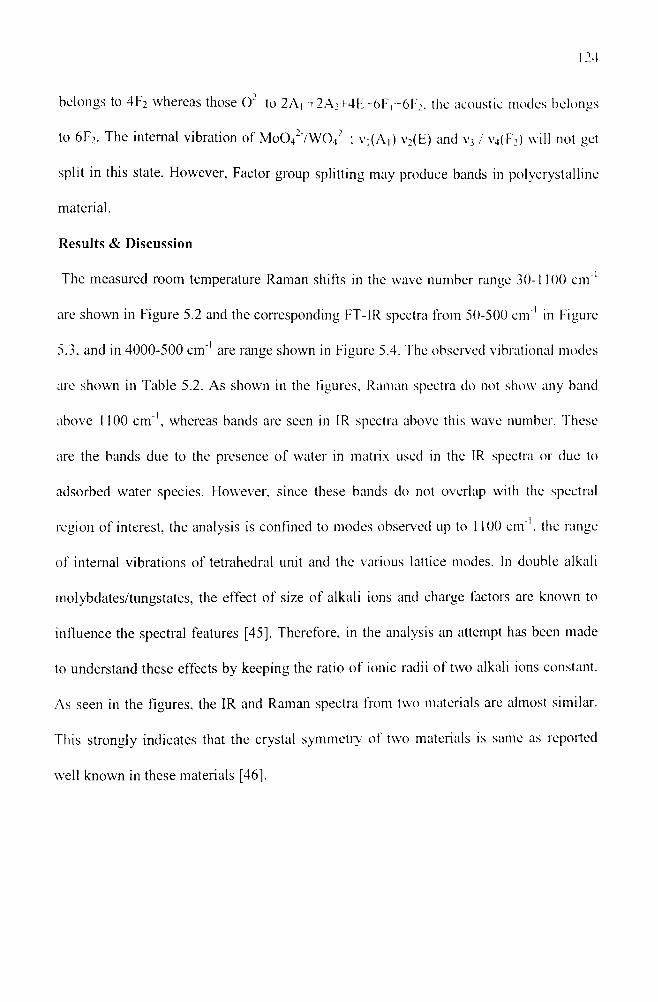
Results & Discussion
The measured room temperature Raman shifts in the wave number range 30-1100 cm ' 1
are shown in Figure 5.2 and the corresponding FT-IR spectra from 50-500 cm ' 1 in Figure
5.3, and in 4000-500 cm "1 are range shown in Figure 5.4. The observed vibrational modes
are shown in Table 5.2. As shown in the figures, Raman spectra do not show any band
above 1100 cm"1, whereas bands are seen in 1R spectra above this wave number. These
are the bands due to the presence o f water in matrix used in the IR spectra or due to
adsorbed water species. However, since these bands do not overlap with the spectral
region o f interest, the analysis is confined to modes observed up to 1100 c m '1, the range
o f internal vibrations o f tetrahedral unit and the various lattice modes. In double alkali
molybdates/tungstates, the effect o f size o f alkali ions and charge factors are known to
influence the spectral features [45]. Therefore, in the analysis an attempt has been made
to understand these effects by keeping the ratio o f ionic radii of two alkali ions constant.
As seen in the figures, the IR and Raman spectra from two materials are almost similar.
This strongly indicates that the crystal symmetry o f two materials is same as reported
well known in these materials [46].

Figure 5.2 Observed room temperature Raman spectra of C sL i\V 0 4 and CsLiM o()4
C s L iW 0 4. ____ .
\ } '■J \
K > 1
\ !
V. / 1 ;
it
i i
V . / : }/
//
/
\
, "NC s L i M o O 4 / '1
/ '■ / N / 1 /
*/b' ist S «ji v i S r f ^ ?co i7? r*ri inT
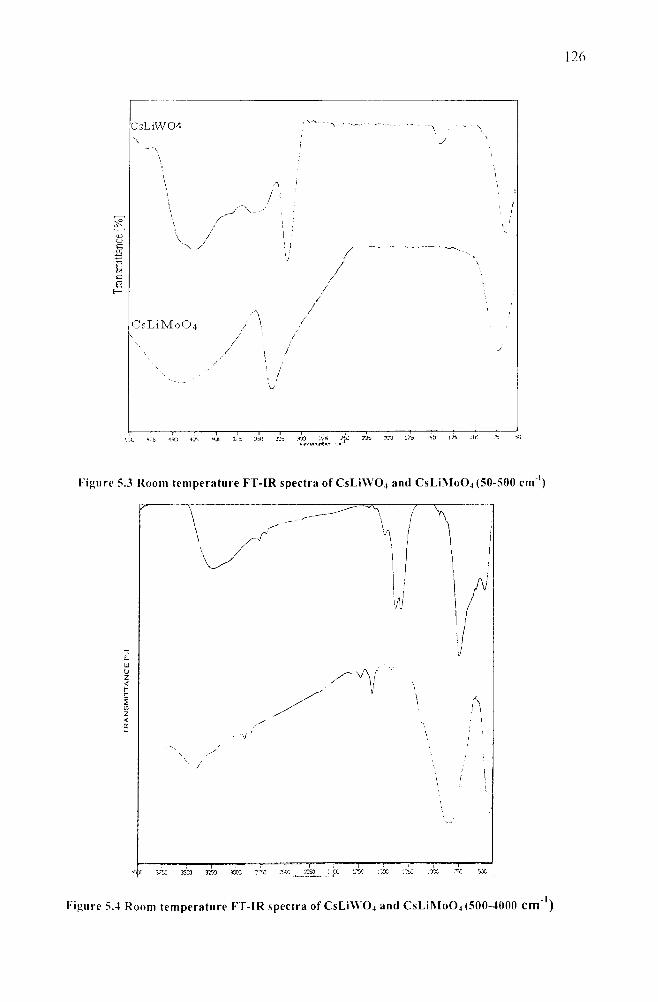
Figure 5.3 Room temperature FT-IR spectra of CsLiWO^ and C s L iM o 0 4 (50-500 cm'1)
Figure 5.4 Room temperature FT-IR spectra of CsLi\VO.| and CsLiMoO^ (500-4000 c m *)
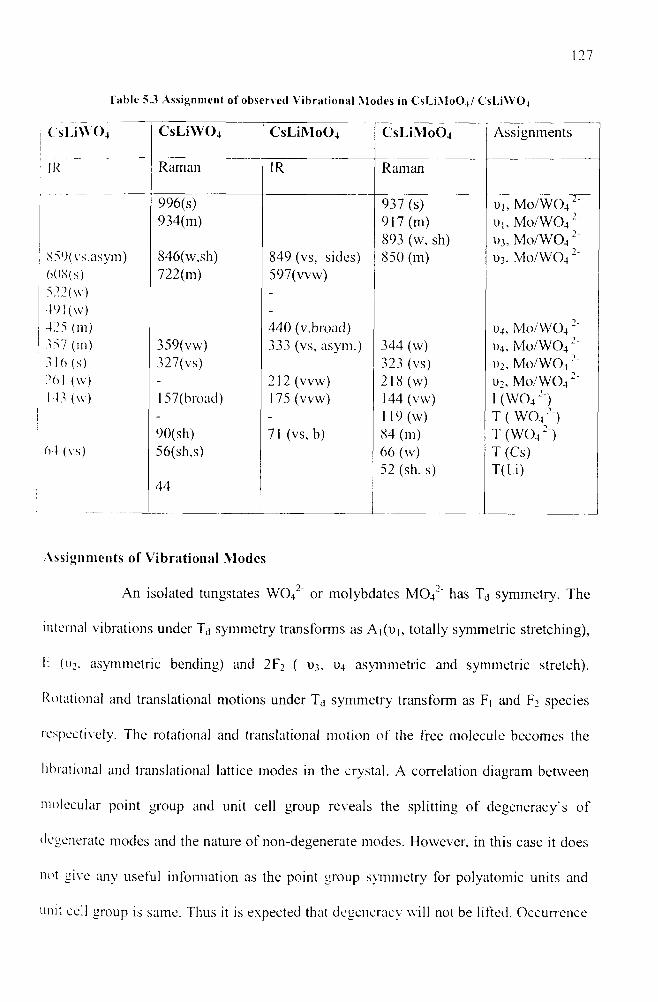
Table 5.3 Assignment of observed Vibrational Modes in CsLi.MoO^/ CsLiWOj
( S l . i \ \0 4 C sL i\V 0 4 CsLiM oOj C sL iM oO .1 Assignments
I Raman IR Raman
996(s) 937 (s) ui, M0 /WO4 2~934(m) 917 (m) Ui, M0 /W O 4 2"
893 (w, sh) l)3, M0 /W O 4 2_859(vs.asym) 846(w,sh) 849 (vs, sides) 850 (m) U3. MO/W0 4 2'6 ()«S(s) 722(m) 597(vvw)522(\v) -
491 (w) -425 (m) 440 (v.broad) 1)4, M0 /WO4 2'357 (in) 359(vw) 333 (vs, asym.) 344 (w) 1)4, iV1o/W 0 4 2‘3 l(>(s) 327(vs) 323 (vs) \)2, M0 /W O 4 2'261 (w) - 212 (vvw) 218 (w) u2, M0 /W O 4 2'143 (w) 157(broad) 175 (vvw) 144 (vw) 1 ( w o 4 2 )
- - 1 19 (w) T ( WO4 2 )90(sh) 71 (vs, b) 84 (m) T ( W 0 4 2')
64 (vs) 56(sh.s) 66 (w) T (Cs)52 (sh. s) T(Li)
44
Assignments of Vibrational Modes
An isolated tungstates W 0 42' or molybdates M O 42' has Td symmetry. The
internal vibrations under Td symmetry transforms as A |(i) |, totally symmetric stretching),
f. (I);, asymmetric bending) and 2F2 ( U3, 1)4 asymmetric and symmetric stretch).
Rotational and translational motions under Td sym m etry transform as Fi and F2 species
respectively. The rotational and translational motion o f the free molecule becomes the
librational and translational lattice modes in the crystal. A correlation diagram between
molecular point group and unit cell group reveals the splitting o f degeneracy 's o f
degenerate modes and the nature o f non-degenerate modes. However, in this case it does
not give any useful information as the point group symmetry for polyatomic units and
unit cell group is same. Thus it is expected that degeneracy will not be lifted. Occurrence
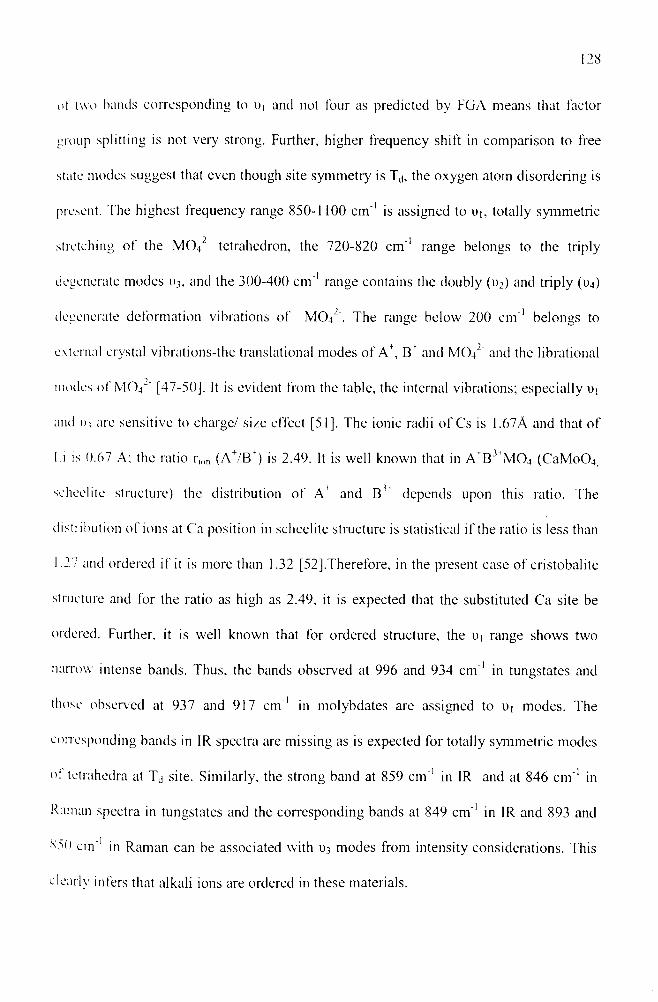
of two hands corresponding to U| and not four as predicted by FGA means that factor
group splitting is not very strong. Further, higher frequency shift in comparison to free
state modes suggest that even though site symmetry is Tj, the oxygen atom disordering is
present. The highest frequency range 850-1100 cm ' 1 is assigned to U|, totally symmetric
stretching o f the M 0 42’ tetrahedron, the 720-820 cm ' 1 range belongs to the triply
degenerate modes 1)3, and the 300-400 cm ' 1 range contains the doubly (1)2) and triply (u4)
degenerate deformation vibrations o f M O 42". The range below 200 cm ' 1 belongs to
external crystal vibrations-the translational modes o f A ', B f and M 0 42‘ and the librational
modes o f M()4~‘ [47-50]. It is evident from the table, the internal vibrations; especially U|
and O’, are sensitive to charge/ size effect [51]. The ionic radii o f Cs is 1.67A and that o f
I.i is 0.67 A; the ratio rIOI, (A+/B f) is 2.49. It is well known that in A +B3+M 0 4 ( C a M o ( \
scheelite structure) the distribution o f A f and B3+ depends upon this ratio. The
distribution o f ions at Ca position in scheelite structure is statistical if the ratio is less than
1.27 and ordered if it is more than 1.32 [52],Therefore, in the present case o f cristobalite
structure and for the ratio as high as 2.49, it is expected that the substituted Ca site be
ordered. Further, it is well known that for ordered structure, the U| range shows two
narrow intense bands. Thus, the bands observed at 996 and 934 cm ' 1 in tungstates and
those observed at 937 and 917 cm ' 1 in molybdates are assigned to U| modes. The
corresponding bands in IR spectra are missing as is expected for totally symmetric modes
of tetrahedra at T j site. Similarly, the strong band at 859 cm ' 1 in IR and at 846 cm ' 1 in
Raman spectra in tungstates and the corresponding bands at 849 cm ' 1 in IR and 893 and
8 M) cm ' 1 in Raman can be associated with 1)3 modes from intensity considerations. This
clearly infers that alkali ions are ordered in these materials.
The hands at 316 , 356 cm ' 1 and around 425 cm ' 1 with strong asymmetry at 440 cm ' 1 are
observed in the IR spectra o f CLW; the corresponding spectral features in C’LM are at
440 and 333 cm ' 1 with the later having strong asymmetric feature at around 300 c m '1. The
Raman spectra gives strong band at 323 cm ' 1 with a very weak feature at 344 cm "1 in
CLW and at 328 and 360 cm ' 1 in CLM. These bands are associated with x)2 and 1)4. A
strong band at 721 cm ' 1 seen only in CLM Raman spectra, reflects the presence o f
oxygen bridging or may be due to adsorbed species. The lattice modes in case o f CLM
are well resolved whereas for CLW we get a broad band. Whereas, the 1)4/ u2 components
are resolved in CLW but show broad band in CLM; modes corresponding to u2 is also
asymmetric in CLM. The reason for this may lie in the charge controlled interaction that
may differ in two materials. In an ordered structure, the coulomb interaction between A +,
15 ions, the most probable way o f ordering is such that each ion o f the same type is
surrounded ( in the second coordination sphere) only by the ion o f other type. This may
lead to the lowering o f effective site symmetry and splitting o f t>i modes. A careful
examination o f the intensity and band splitting pattern o f internal modes in two materials
suggests that this interaction is more pronounced in molybdates than in tungstates. This is
just opposite to what is reported for A \ B3+ ions interaction with tungstates and
molybdates [53], The role o f factor group splitting can also not ruled out at this stage, as
the \>, band in IR and Raman differs significantly (13 c m '1) in tungstates, whereas there is
virtually no factor group splitting in molybdates. More careful experiments are needed to
further understand this point. The lattice vibrations could not be assigned due to specific
10ns. How ever, on the basis o f reported assignment o f translational modes o f alkali atoms
in similar systems and librational modes o f tetrahedral molybdates [54], the bands at 119.
91 cm 1 arc tentatively assigned due to translational motion involving W ( V \ whereas
hand around 170 cm ' 1 due to librational motion o f W O 42", the bands at 70, 55 and 42 cm ' 1
arc due to alkali atoms translations.
5.6 V IBR A TIO N A L IN V ESTIG ATIO N ON M O L Y B D A T E S/ TUNG STA TES:
O R T H O R H O M B IC SYSTEM S
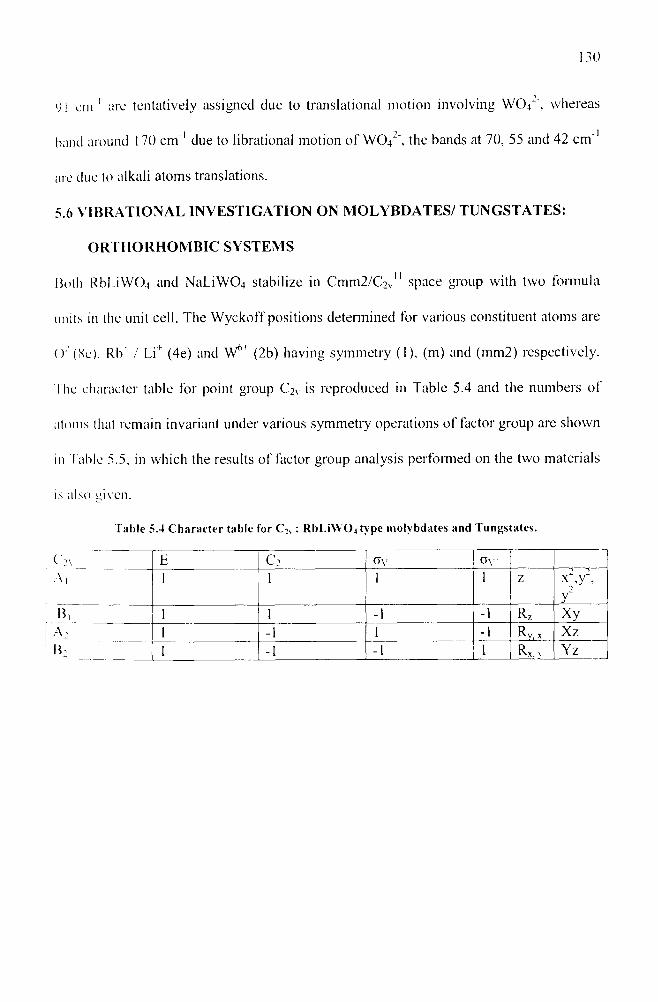
Moth R b L iW 0 4 and N a L iW 0 4 stabilize in C m m 2/C 2v11 space group with two formula
u n i t s in the unit cell. The W yckoff positions determined for various constituent atoms are
()J (Sc). Rb* / L if (4e) and V /’f (2b) having sym m etry (1), (m) and (mm2) respectively.
The character table for point group C 2V is reproduced in Table 5.4 and the numbers o f
atoms that remain invariant under various symmetry operations o f factor group are shown
in fable 5.5. in which the results o f factor group analysis performed on the two materials
is also given.
I able 5.4 Character table for C 2v: R bLiW O jtype molybdates and Tungstates.
C'2V E c2 a v OyA, 1 1 1 1 Z 1
¥B, 1 1 -1 -1 Rz X y
A 2 1 -1 1 -1 Ry, x XzB: 1 -1 -1 1 Rx. V Yz
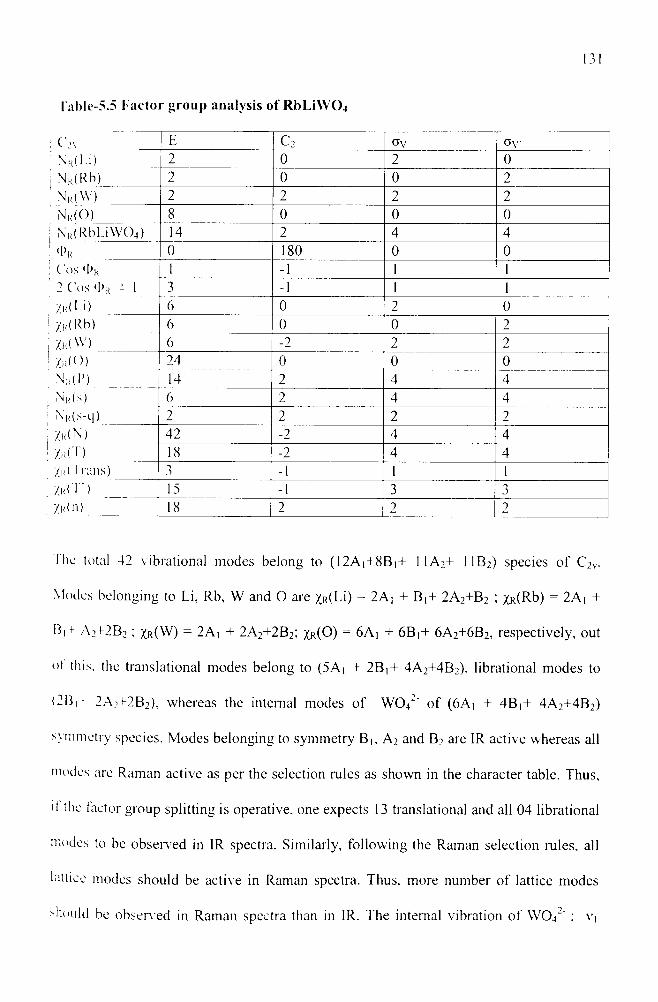
lable-5.5 Factor group analysis of RbLiVV04
C:v E c 2 GV OvNi<(I i) 2 0 2 0N,<(Rb) 2 0 0 2Ni<(\V) 2 2 2 2Nr(O) 8 0 0 0N,<(RbLiW04) 14 2 4 4<I>R 0 180 0 0Cos <I>,< 1 -1 1 12 Cos <I>r - 1 3 -1 1 1Zk(I.i) 6 0 2 0Zk( Rb) 6 0 0 2Zk( W ) 6 -2 2 2
Zk(<>) 24 0 0 0Nk(P) 14 2 4 4N u( s ) 6 2 4 4N'i<(s-q) 2 2 2 2Zk( N ) 42 -2 4 4Zk ( 1) 18 -2 4 4Zu( Trans) 3 -1 1 1Zr( T ' ) 15 -1 3 3Zk( n) 18 2 2 2
I he total 42 vibrational modes belong to (12A i+8B i+ 11A2+ 11B2) species o f C2v.
Modes belonging to Li, Rb, W and O are Xr(LD = 2A , + B ,+ 2A 2+B 2 ; XR(Rb) = 2A, +
B| A 2+2B 2 ; 5Cr(W) = 2A | + 2A2+2B2; x.r(0) = 6A] + 6 B]+ 6A 2+6 B2, respectively, out
ot this, the translational modes belong to (5Ai + 2 B |+ 4 A 2+4B 2), librational m odes to
(2B| • 2A 2+2B2), whereas the internal modes o f W 0 42 o f (6Ai + 4 B |+ 4A 2+4B 2)
symmetry species. Modes belonging to symmetry B |, A 2 and B2 are IR active whereas all
modes are Raman active as per the selection rules as shown in the character table. Thus,
it the factor group splitting is operative, one expects 13 translational and all 04 librational
modes to be observed in IR spectra. Similarly, following the Raman selection rules, all
lattice modes should be active in Raman spectra. Thus, more number o f lattice modes
should be observed in Raman spectra than in IR. The internal vibration o f W 0 42’ : \ ’i
(Ai). t>: (Li) and V3. V4 (F2) belonging to T j point group in free state can be correlated
through site sym m etry to that o f the unit cell group as shown in the correlation table
(table 5.6). As depicted in the correlation diagram, factor group splitting m ay produce
bands in polycrystalline material that are forbidden in free state. Thus, under
orthorhombic unit cell having two formula units per unit cell, internal vibrations o f
tetrahedra that should be observed are; v, (2 A t), u 2 (2A i+2B ,) and vj, v4 as
(2A 1 t-2A2+2B 2). Based on the IR and Raman selection rules for various modes, two
bands corresponding to V|, two corresponding to v2 and 06 each corresponding to v3> v4
should be observed.
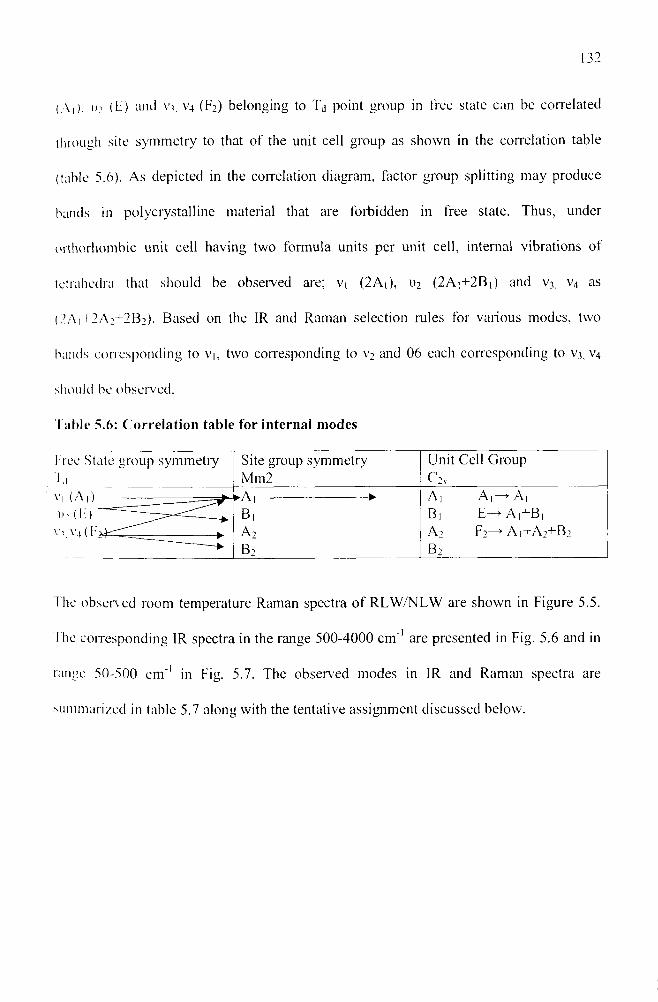
Table 5.6: Correlation table for internal modes
Free State group symmetryT\,
Site group symmetry Mm2
Unit Cell Groupc 2v
v i (A | ) _____ kA| ----------------------- ► A 1 A , —>■ AiB| B, E— Ai+B,
v - v t ( a 2 a 2 F2—* A i+ A 2+B 2b 2 b 2
T he observed room temperature Raman spectra o f R L W /N L W are shown in Figure 5.5.
The corresponding IR spectra in the range 500-4000 cm "1 are presented in Fig. 5.6 and in
range 50-500 cm"' in Fig. 5.7. The observed modes in IR and Raman spectra are
summarized in table 5.7 along with the tentative assignment discussed below.
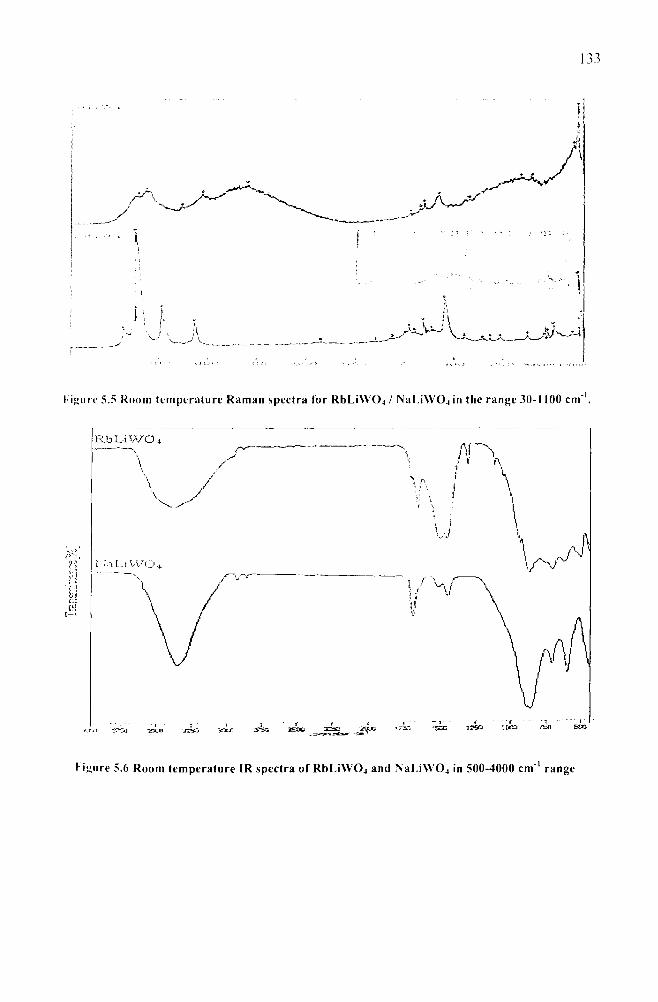
Figure 5.5 Room temperature Raman spectra for R b L i \V 0 4 / N a I . i \V 0 4 in the range 30-1100 c m 1.
Hgure 5.6 Room temperature IR spectra o f R b L iW 0 4 and N a L i \V 0 4 in 500-4000 cm ' 1 range
RbLiWO*
Hi,n$■ r-i
li c.iW(-!
M aLiW 04
_f — r_ _r - S» 1:5 -150 <25 -:<I
■ V \
\ /
r \ / V u
1 )
—s : i :?s :£< i* -DO ,’s it'
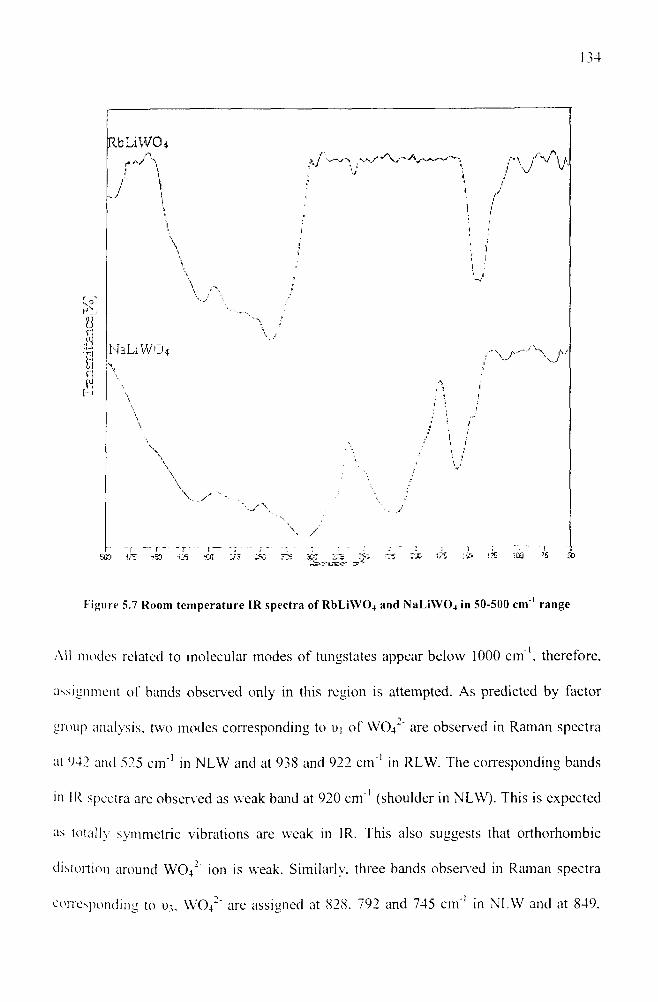
Figure 5.7 Room temperature IR spectra o f R b L i \V 0 4 and iNaLiVV04 in 50-500 cm" range
All modes related to molecular modes o f tungstates appear below 1000 cm" , therefore,
assignment o f bands observed only in this region is attempted. As predicted by factor
group analysis, two modes corresponding to Ui o f W 0 42' are observed in Raman spectra
at 942 and 525 cm ' 1 in N LW and at 938 and 922 cm ' 1 in RLW. The corresponding bands
in IR spectra are observed as weak band at 920 cm ' 1 (shoulder in NLW). This is expected
as totally symmetric vibrations are weak in IR. This also suggests that orthorhombic
distortion around W 0 42' ion is weak. Similarly, three bands observed in Raman spectra
corresponding to W70 42‘ are assigned at 828. 792 and 745 cm ' 1 in N LW and at 849.
,st)7 and 715 cm 1 in RLW. The fact that three, instead o f six bands, are observed for
asymmetric stretch o f W O42' further confirms weak distortion and related splitting. The
IR spectra show only single broad band in both materials centered at 835 and 862 cm ' 1 in
NI.W and RLW respectively. Bands corresponding to U2, WO42" are assigned as 325 and
2b 1 cm 1 in RLW and 255 cm "1 in N LW in Raman spectra. As in the case o f U3, modes,
i»i. \V (V ' also gives rise to three bands at 495, 406 and 340 cm "1 in RLW: 416 and 365
cm 1 in NLW in IR spectra. The corresponding Raman modes are observed at 382, 353
cm 1 111 RLW and 498, 432, 347 cm ' 1 in NLW. Observance o f modes at different wave
number in IR and Raman spectra may be due to the fact that the observed bands belong to
different sym m etry species in IR and Raman spectra and further that the factor group
splitting is operative. However, observance o f half the number o f bands than those
predicted bv FGA indicates that the site symmetry splitting is not significant.
According to the group theoretical predictions, one expects 04 librational and 13
translational inodes in the lattice region in IR spectra and 06 librational and 13
translational modes in Raman spectra. The librational modes should be more intense than
the translational one in Raman and weaker in the IR spectra [55]. Below 200 c m 1, three
bands with relatively strong intensity at 82, 102 and 145 cm ' 1 are observed in NLW,
however, in RLW only one very broad band centered around 137 cm ' 1 is observed. It may
be due to the mixing o f translational and librational modes. These are mainly due to
tetrahedral ion librational and translational motion. If one looks at the ratio o f alkali ion
ionic radii ratio (A*/B~) in two systems, it is 2.00 for RLW and 1.34 for NLW.
Accordingly, the site distribution for alkali ions should be ordered for RLW and
disordered for NLW . This may be the reason for different spectral features in two
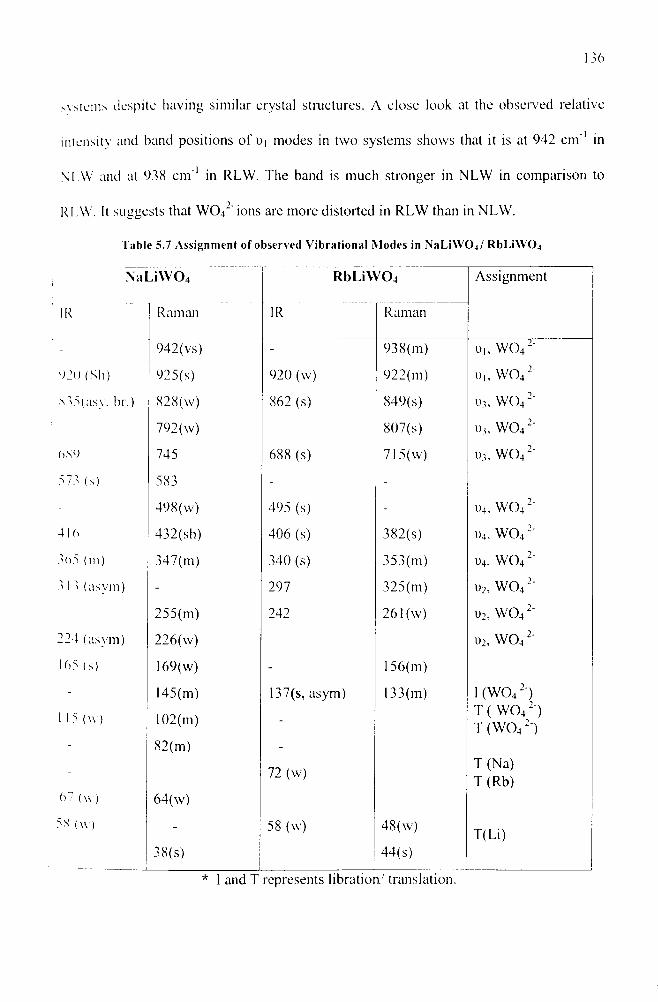
. s y s t e m s despite having similar crystal structures. A close look at the observed relative
i n t e n s i t y and band positions o f U| modes in two systems shows that it is at 942 cm ' 1 in
M W and at 938 cm ' 1 in RLW. The band is much stronger in NLW in comparison to
2RLW. It suggests that W O4 ‘ ions are more distorted in RLW than in NLW.
Table 5.7 Assignment of observed Vibrational Modes in NaLiWO^/ RbLiVVO^
N aLiW C >4 R b L i \V 0 4 Assignment
IR Raman IR Raman
- 942(vs) - 938(m) u i, W 0 4 2‘
9 2 0 ( S h ) 925(s) 920 (w) 922(m) u,. w o 4 2'
N VMasy. hr.) 828(w) 862 (s) 849(s) u3, W Q 4 2‘
792(w) 807(s) i)3, W O 4 2'
689 745 688 (s) 715(w) i)3, W O 4 2'
573 (s) 583 - -
- 498(w) 495 (s) - i)4, W 0 4 2'
416 432(sh) 406 (s) 382(s) 1)4. W 0 4 2'
365 (in) 347(m) 340 (s) 353(m) 1)4, W 0 4 2"
3 13 (asym) - 297 325(m) d 2, W 0 4 2'
255(m) 242 261(w) U2, W O4 2'
224 (asym) 226(w) l)2, W O 4 2'
165 (s) 169(w) - 156(m)
1 15 ( \v )
67 (w)
I45(m)
102(m)
82(m)
64(w)
137(s, asym)
72 (w)
133(m) 1 (W 0 4 2')T ( W O 4 2 ) T ( W 0 4 2 )
T (Na)T (Rb)
5S (w)
--. .38(s)
58 (w) 48(w)
44(s)T ( L i)
* 1 and T represents libration' translation.
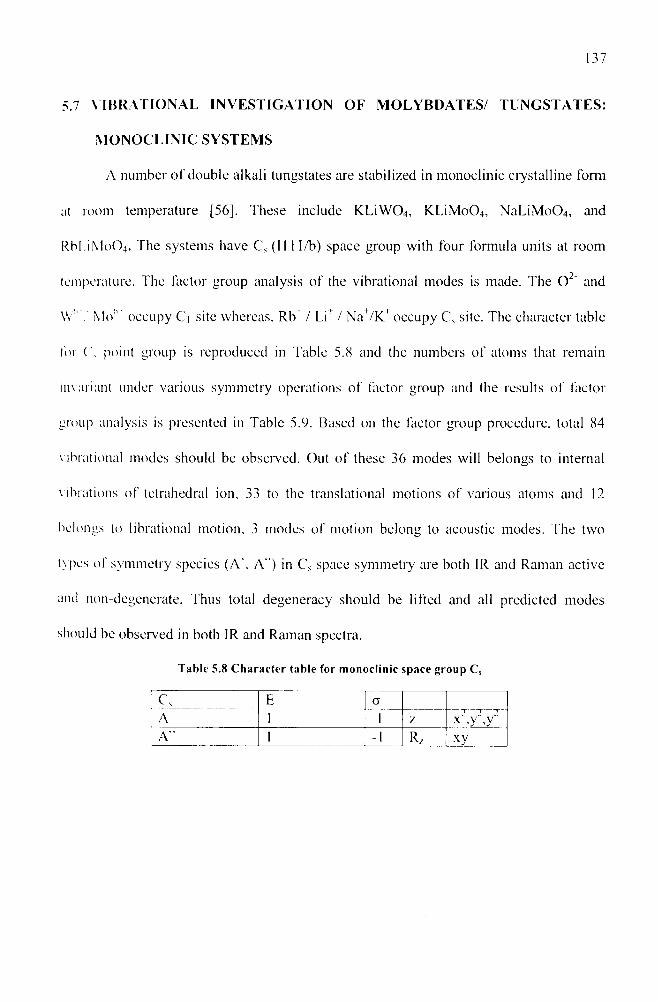
5.7 V IBRATIO NAL IN VESTIG ATIO N OF M O L Y B D A T E S/ TUNG STA TES:
M O NO CLINIC SY STEM S
A number o f double alkali tungstates are stabilized in monoclinic crystalline form
at room temperature [56], These include KLiWO,*, KLiMoO.}, NaLiMoO,*, and
RbLiMoO.}. The systems have Cs (111 1/b) space group with four formula units at room
temperature. The factor group analysis o f the vibrational modes is made. The O 2" and
W "7 Mo*" occupy Ci site whereas, Rb* / Li+ / N a+/K +occupy C’s site. The character table
for C, point group is reproduced in Tabic 5.8 and the numbers o f atoms that remain
invariant under various symmetry operations o f factor group and the results o f factor
group analysis is presented in Table 5.9. Based on the factor group procedure, total 84
vibrational modes should be observed. Out o f these 36 modes will belongs to internal
vibrations o f tetrahedral ion, 33 to the translational motions o f various atoms and 12
belongs to librational motion, 3 modes o f motion belong to acoustic modes. The two
types of symmetry species (A', A") in C s space symmetry are both IR and Raman active
and non-degenerate. Thus total degeneracy should be lifted and all predicted modes
should be observed in both IR and Raman spectra.
Table 5.8 Character table for monoclinic space group Cs
Cs E ! CTA i : i Z x\y-\y~
A" 1 : -1 R, xy
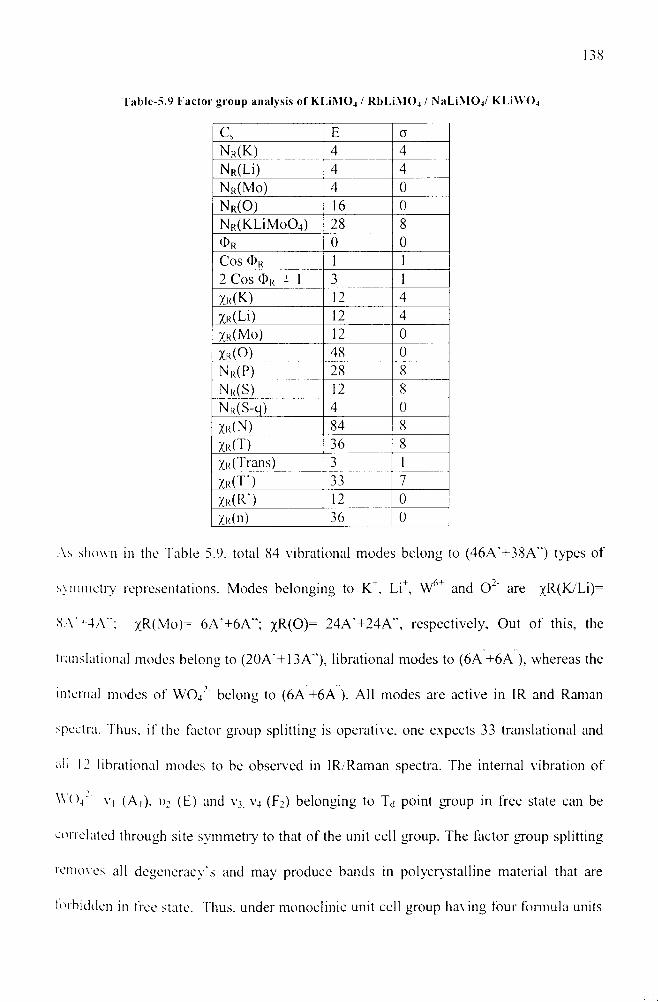
Table-5.9 Factor group analysis of K L iM 0 4 / RbLiMO^ / iNaLi.M04/ K L i \V 0 4
Cs E 0N r(K) 4 4N r(U ) 4 4N r(M o) 4 0N r(O) 16 0N R(K L iM o 0 4) 28 8(Dr 0 0COS O r 1 12 Cos (Dr ± 1 3 1
Xr(K) 12 4Xn(Li) 12 4Xr(M o) 12 0
Xk(O) 48 0N r(P) 28 8N r(S) 12 8N k(S-q) 4 0
Xk(N) 84 8
Xr(T) 36 8Xr (Trans) 3 1
Xr(T ') 33 7
Xr(R ') 12 036 0
As shown in the Table 5.9, total 84 vibrational modes belong to (46A ‘+38A “) types o f
symmetry representations. Modes belonging to KT, Li+, W6+ and O 2' are j (R (^ L i)=
XA'M A"; yR(M o)= 6A '+ 6A"; %R(0)= 24A '+ 24A ", respectively, Out o f this, the
translational modes belong to (20A '+13A "), librational modes to (6A + 6A ), whereas the
internal modes o f W 0 42' belong to (6A + 6 A ). All modes are active in IR and Raman
spectra. T hus, if the factor group splitting is operative, one expects 33 translational and
all 12 librational modes to be observed in IR/Raman spectra. The internal vibration o f
W 0 4‘‘ v, (A |). D; (E) and V3 v4 (F2) belonging to T j point group in free state can be
correlated through site symmetry to that o f the unit cell group. The factor group splitting
removes all degeneracy 's and may produce bands in polycrystalline material that are
forbidden in free state. Thus, under monoclinic unit cell group having four formula units
per unit cell, internal vibrations are; V| (4A ‘), u2 (4A +4A ) and v3, v4 as (8A +4A ). Based
on the IR and Ram an selection rules for various modes, 04 bands corresponding to V|, 08
corresponding to v2 and 12 each corresponding to v3i v4 should be observed.
Analysis of O bserved IR/Raman Spectra:
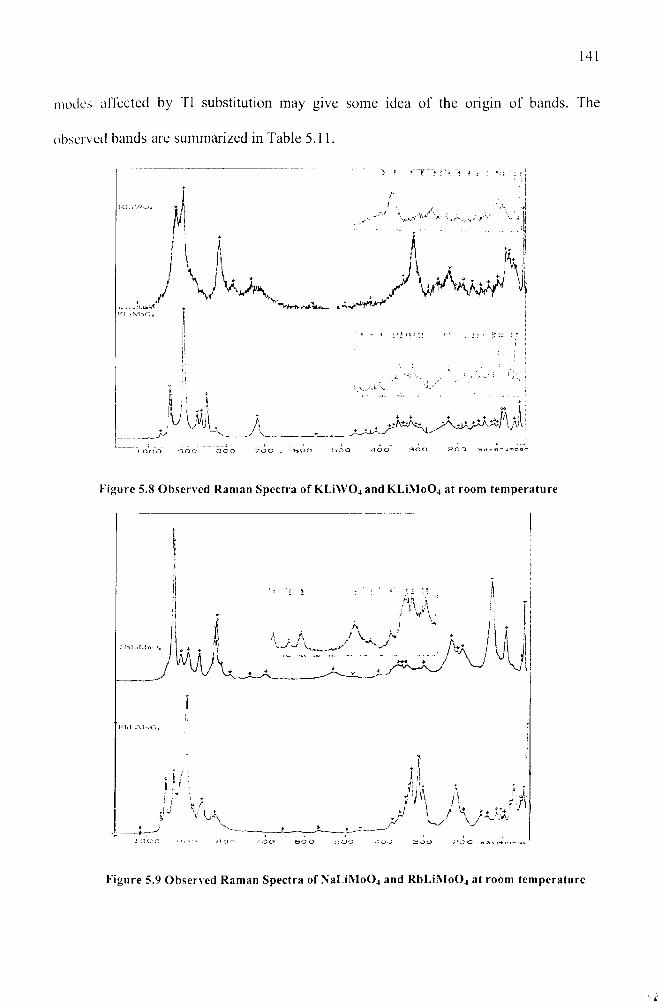
Room temperature Ram an spectra o f K L iW 0 4 (KLW ) and K L iM o 0 4 (KLM ) are shown
in Figure 5.8 in the range 20-1000 cm"1. The corresponding spectra for N a L iW 0 4 (NLM)
and R b L iM o 0 4 (RLM ) are depicted in Figure 5.9. FT-IR spectral features in the range
50-500 cm "1 for all the four samples are shown in Figure 5.10 and the same in the range
500-4000 cm 1 in Figure 5.11. As is obvious from the figure, the spectral features o f all
the studied materials are very similar, indicating the similar crystal structure. The
observed modes are summarized in Table 5.10. As seen from the table, even at room
temperature well separated internal modes o f M o 0 4 / W 0 4 are observed. In the totally
symmetric stretch m ode region, 04 Raman bands at 965, 954, 935 and 905 cm"1 are
observed in RLM , whereas three bands are present in the Raman spectra o f other
materials (964, 940, 906 cm ' 1 in NLM; 964, 940, 906 cm "1 in KLM; 937, 917, 893 cm "1
for KLW). In the asymmetric stretch region six Ram an bands at 871, 829, 813, 791, 741,
700 cm ' 1 are seen in N L M and five bands at 872, 861, 846, 822, 716 cm in KLM.
RLM shows only two bands and in K L W only one band is observed. A careful
observation o f table reveals that totally symmetric stretch modes in the IR spectra are
either absent or very weak except in NLM and KLW . This indicates that distortion from
tetrahedral sym m etry in RLM and KLM is small. The m olecular ions are interacting
strongly probably through asymmetric mode coupling leading to broad asymmetric
response as seen in K L W and NLM in IR spectra. Thus the stretching mode region
clearly reflects the different site environment in different samples even though their
crystal structure is similar. In the bending region, we observe four bands in Ram an (478,
414. 364, 346 c m '1) and five in IR (481, 458, 416, 382, 363 c m '1) assigned to asymmetric
bending in NLM. In KLM six bands in Raman and 03 in IR are assigned to this mode,
whereas in RLM one gets 04 bands each in Raman and IR corresponding to asymmetric
bending mode. In the absence o f symmetry species to which each observed bands belong,
the assignment is highly tentative and the modes may have mixed character. However,
what is noticeable is the split components o f symmetric and asymmetric modes that are
almost same in all samples except in KLW where modes corresponding to asymmetric
stretch are not observed. The modes observed at around 220 and 200 cm "1 in different
samples may be having contribution from both symmetric stretch and some translational
modes as discussed by earlier workers for tungstates [57]. The bands observed below 200
cm "1 are assigned to various lattice modes. However, the numbers ot lattice modes
observed in the spectra are far less than predicted by factor group analysis. This m ay be
due to highly mixed mode character and broadening o f the modes at room temperature.
In order to have som e tentative idea o f these lattice modes, w e compared the observed
bands in these systems with those observed in T1 substituted alkali molybdates and
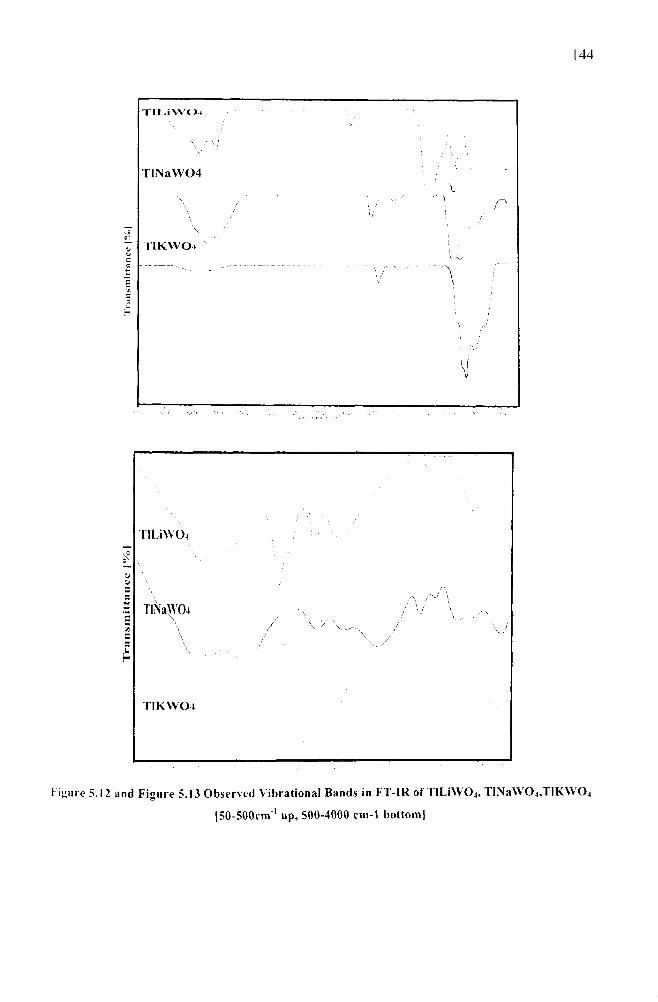
tungstates which also stabilize in monoclinic space group at room temperature. T he IR
spectra o f T lL i(M o 0 4)2, T lN a (M o 0 4)2, T lK (M o 0 4)2 are presented in Figure 5.12 in 50-
500 cm 1 range and in Figure 5.13 in 500-4000 cm ' 1 range. T he corresponding IR spectra
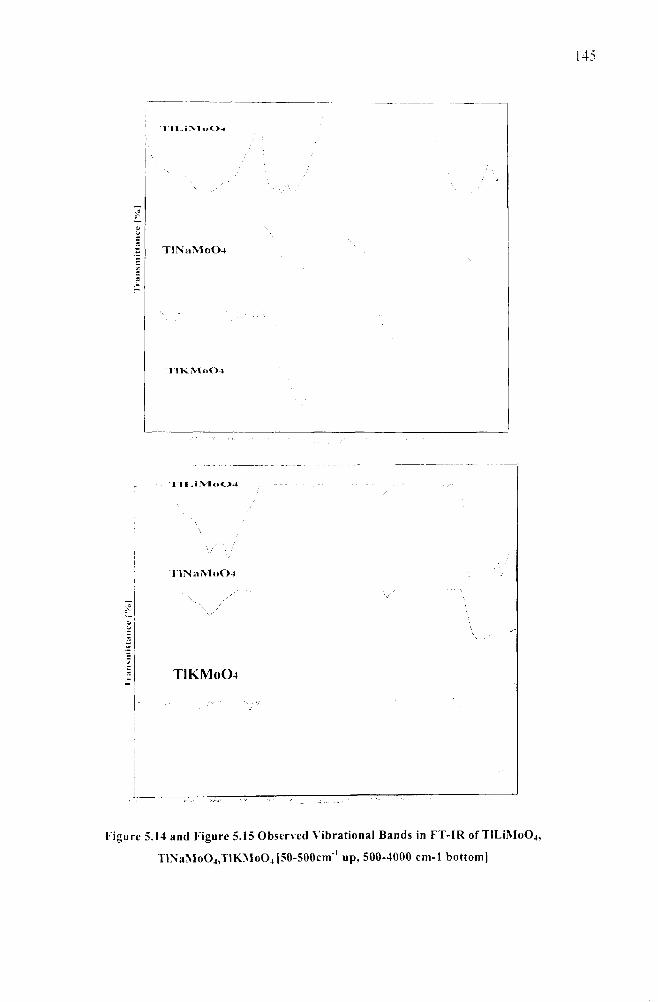
for tungstates T lL i(W 0 4)2, T lN a (W 0 4)2. T 1K (W 04)2 are depicted in Figures 5.14 - 5.15.
The materials stabilize in monoclinic crystalline structure, therefore, a com parison o f the
modes affected by T1 substitution may give some idea o f the origin o f bands. The
observed bands are summarized in Table 5.11.
Figure 5.8 Observed Raman Spectra o f K L i \V 0 4 and K L iM o 0 4 at room temperature
Figure 5.9 Observed Raman Spectra of N a L iM o 0 4 and R b L iM o 0 4 at room temperature
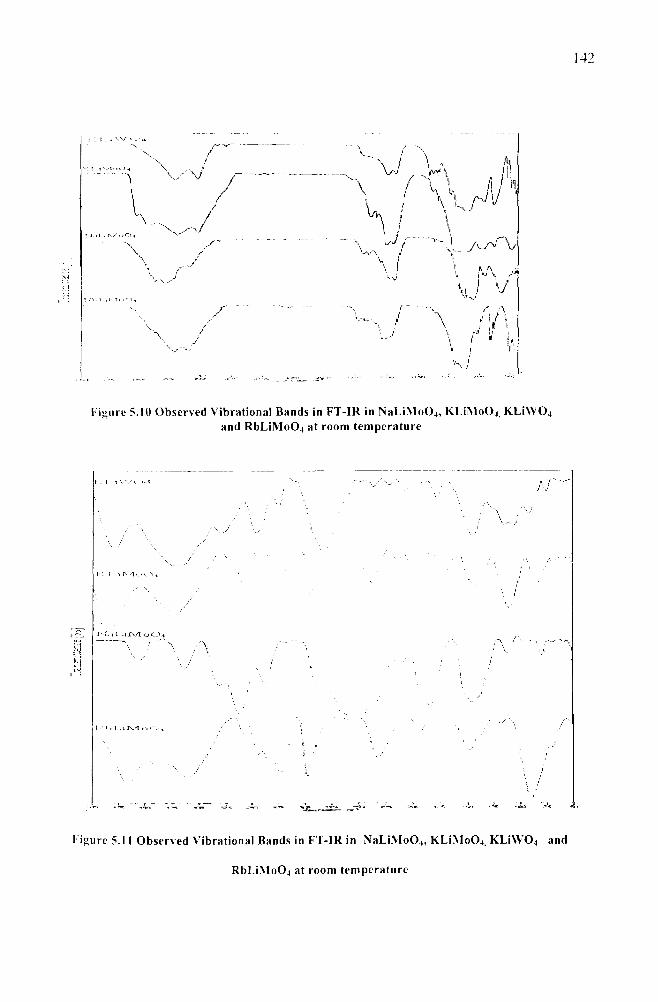
Figure 5.10 Observed Vibrational Bands in FT-IR in NaLiMoOj, K L iM o 0 4i K L i \V 0 4 and R b L iM o 0 4 at room temperature
M 1L.1M 0 O
Figure 5.11 Observed Vibrational Bands in FT-IR in N a L iM o 0 4, K L iM o 0 4. K L i \V 0 4 and
RbLi.Mo04 at room temperature
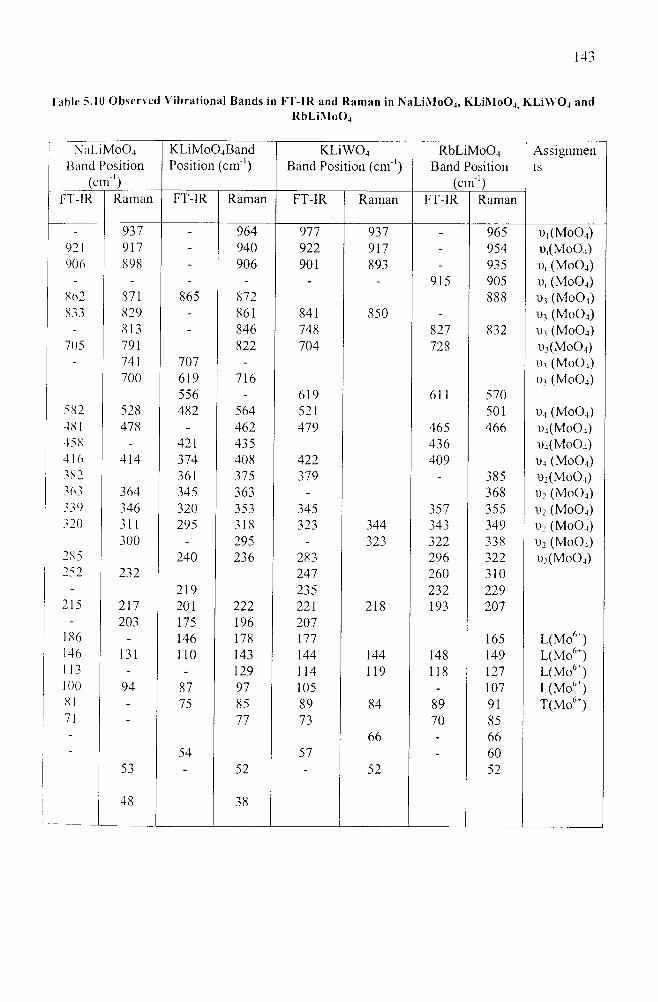
1 able 5.10 Observed Vibrational Bands in FT-IR and Raman in NaLiMoOj, KLiMoO^, K L i \V 0 4 andRbLiMoOj
N a L iM o 0 4 Band Position
( c m ‘)
K L iM o 0 4Band Position ( c m 1)
KLiWO,Band Position ( c m 1)
R bL iM o04 Band Position
(cm ')
Assignments
FT-IR Raman FT-IR Raman FT-IR Raman FT-IR Raman
- 937 - 964 977 937 - 965 Ui(M o0 4)921 917 - 940 922 917 - 954 d ,(Mo0 4)906 898 - 906 901 893 - 935 u, (M 0O 4)
- - - - - - 915 905 i), ( M o 0 4)862 871 865 872 888 u3 ( M o 0 4)833 829 - 861 841 850 - i>3 ( M o 0 4)
- 813 - 846 748 827 832 (M o0 4)705 791 822 704 728 u3( M o 0 4)
- 741 707 - i), (M 0O4)700 619 716 Uj (M o0 4)
556 - 619 611 570582 528 482 564 521 501 t>4 ( M o 0 4)481 478 - 462 479 465 466 d4( M o 0 4)458 - 421 435 436 u4( M o 0 4)416 414 374 408 422 409 u4 ( M o 0 4)382 361 375 379 - 385 i)2( M o 0 4)363 364 345 363 - 368 u2 ( M o 0 4)339 346 320 353 345 357 355 u2 ( M o 0 4)320 311 295 318 323 344 343 349 u2 ( M o 0 4)
- 300 - 295 - 323 322 338 u2 ( M o 0 4)285 240 236 283 296 322 u2( M o 0 4)252 232 247 260 310
- 219 235 232 229215 217 201 222 221 218 193 207
- 203 175 196 207186 - 146 178 177 165 L(M o6+)146 131 110 143 144 144 148 149 L(Mo6")113 - - 129 114 119 118 127 L(Mo6i)100 94 87 97 105 - 107 L(Mo',f)81 - 75 85 89 84 89 91 T(M o6")71 - 77 73 70 85
- 66 - 66- 54 57 - 60
53 - 52 - 52 52
48 38
Tra
iis
iiii
tta
iic
c
|%
|__
____
rr
ansin
ittn
iicc
\"/,\
Tll.iVVO-i
TlNaW04
TIKVVOj
TILiW Oi
TINaWOi
\
// \ /
TIKVV04
figure 5.12 and Figure 5.13 Observed Vibrational Bands in FT-IR of TILiWOj, TlN a\V 0 .|,TIK\Y04
[50-500cnV‘ up, 500-4000 cm-1 bottom]
Tran
smitt
ance
\"/o
]1
T IN a M o 0 4
'IIKM0O4
r i U M o O J
T lN a M o 0 4
T1KM0O4
Figure 5.14 and Figure 5.15 Observed Vibrational Bands in F T-IR of TIL1M 0O 4,
T lN a M o 0 4,T lK M o 0 4 [SO-SOOcm' 1 up, 500-4000 cm-1 bottom)
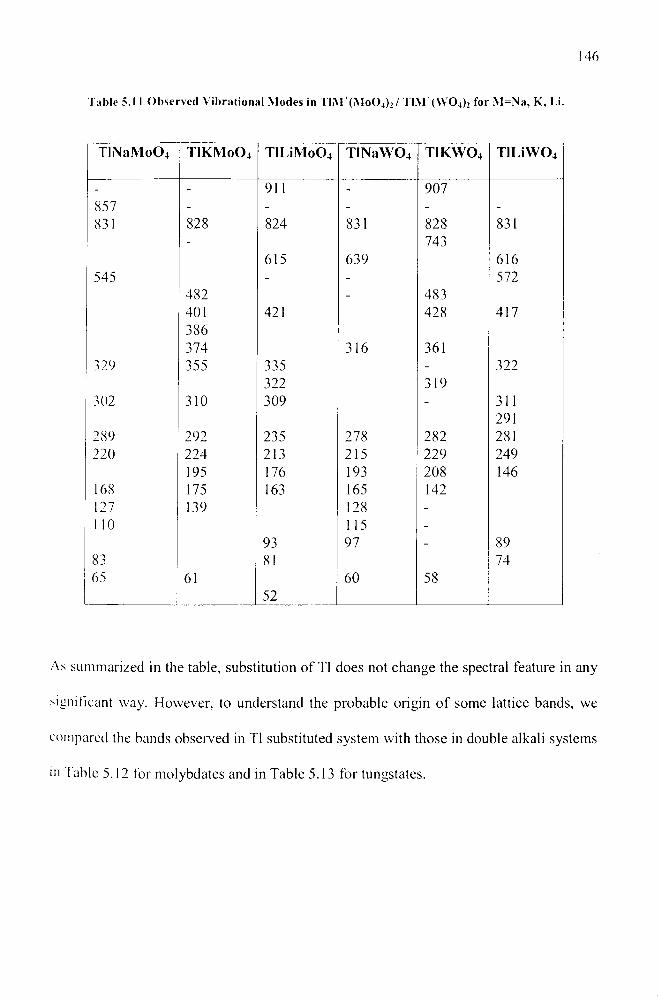
Table 5.11 Observed Vibrational Modes in TliMt(M o0 4)2/ TliM ( \ V 0 4)2 for M=Na, K, Li.
T lN a M o 0 4 TIKM 0 O4 T I U M 0 O4 T lN a W 0 4 TIKWO4 T lL iW 0 4
- - 911 - 907857 - - - - -
831 828 824 831 828 831- 743
615 639 616545 - - 572
482 - 483401 421 428 417386374 316 361
329 355 335 - 322322 319
302 310 309 - 311291
289 292 235 278 282 281220 224 213 215 229 249
195 176 193 208 146168 175 163 165 142127 139 128 -
1 10 115 -
93 97 - 8983 81 7465 61 60 58
52
As summarized in the table, substitution o f T1 does not change the spectral feature in any
significant way. However, to understand the probable origin o f some lattice bands, we
compared the bands observed in T1 substituted system with those in double alkali systems
in Table 5.12 for molybdates and in Table 5.13 for tungstates.
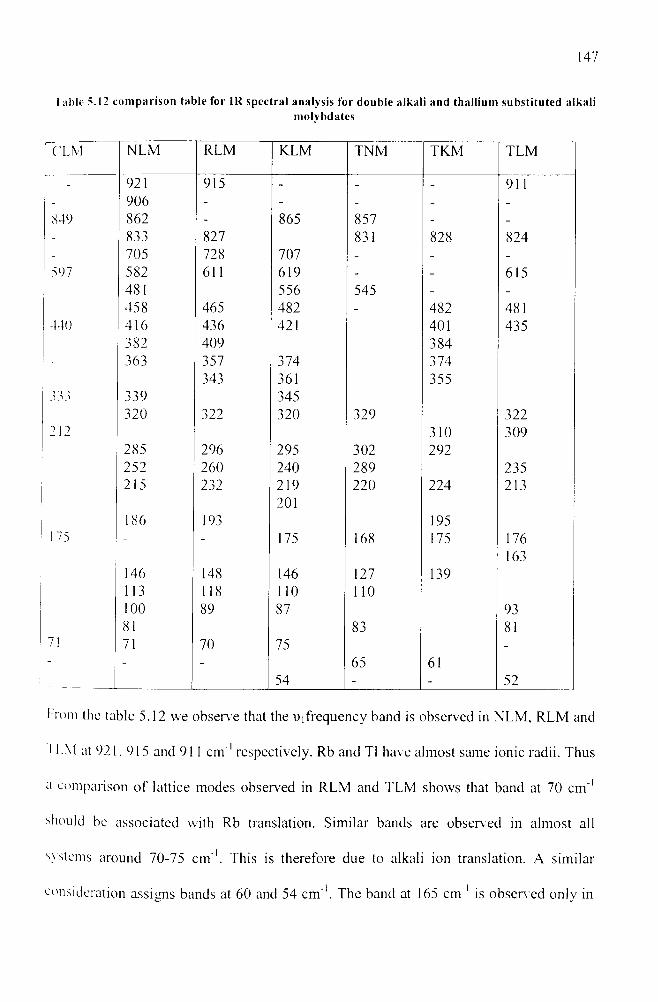
Table 5.12 comparison table for IR spectral analysis for double alkali and thallium substituted alkalimolybdates
CLM NLM RLM KLM TNM TKM TLM
- 921 915 - - - 911- 906 - - - - -
849 862 - 865 857 - -
- 833 827 831 828 824- 705 728 707 - - -
597 582 611 619 - - 615481 556 545 - -
458 465 482 - 482 481440 416 436 421 401 435
382 409 384- 363 357 374 374
343 361 355339 345320 322 320 329 322
212 310 309285 296 295 302 292252 260 240 289 235215 232 219 220 224 213
201186 193 195
175 - - 175 168 175 176163
146 148 146 127 139113 118 110 110100 89 87 9381 83 81
71 71 70 75 -
- - - 65 6154 - - 52
h'om the table 5.12 we observe that the infrequency band is observed in N LM , RLM and
I l.M at 921. 915 and 911 cm ’1 respectively. Rb and T1 have almost same ionic radii. Thus
a comparison o f lattice modes observed in RLM and TLM shows that band at 70 cm "1
should be associated with Rb translation. Similar bands are observed in almost all
systems around 70-75 c m '1. This is therefore due to alkali ion translation. A similar
consideration assigns bands at 60 and 54 cm ’1. The band at 165 cm "1 is observed only in
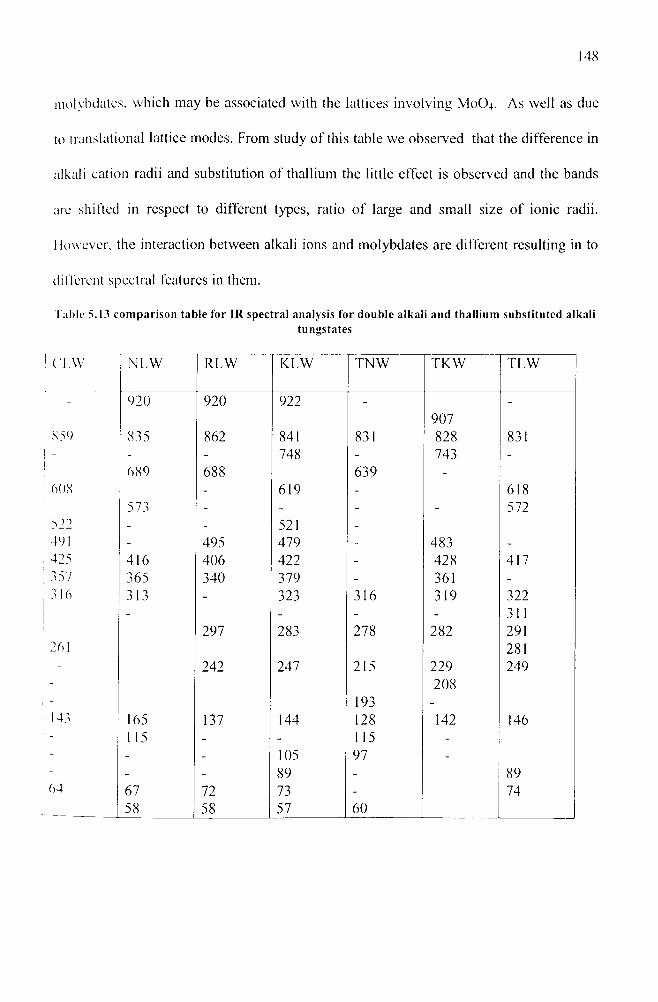
molybdates, which may be associated with the lattices involving M 0O 4. As well as due
to translational lattice modes. From study o f this table we observed that the difference in
alkali cation radii and substitution o f thallium the little effect is observed and the bands
are shifted in respect to different types, ratio o f large and small size o f ionic radii.
However, the interaction between alkali ions and molybdates are different resulting in to
different spectral features in them.
Table 5.13 comparison table for IR spectral analysis for double alkali and thallium substituted alkalitungstates
CI.W NLW RLW KLW TN W T K W TLW
- 920 920 922 -907
-
N59 835 862 841 831 828 831- - - 748 - 743 -
689 688 639 -
60,S - 619 - 618573 - - - - 572
522 - - 521 -
491 - 495 479 - 483 -
425 416 406 422 - 428 417357 365 340 379 - 361 -
316 313 - 323 316 319 322- - - - 311
297 283 278 282 291261 281
- 242 247 215 229 249- 208- 193 -
143 165 137 144 128 142 146- 1 15 - - 115 -
- - - 105 97 -
- - - 89 - 8964 67 72 73 - 74
58 58 57 60
5.8 CO NC LU SIO N
Room temperature infra-red and Raman spectra o f double alkali tungstates and
molybdates having large and small alkali ions are reported and analyzed using group
theoretical approach. The detailed factor group analysis is made and the symmetry
species associated with internal and external crystal modes are presented based on cubic
space group for CsLiM o0 4 /C sL iW 04 monoclinic (Cs) space group for N aLiM o0 4 ,
K IJM 0 O4, K LiW 0 4 and R b L iM o 04 that stabilize in monoclinic structure as well as those
of N a L iM 0 4/ RbLiW 0 4 which stabilize in orthorhombic crystal structure. In addition,
I f 1R spectra o f thallium substituted alkali molybdates and tungstates (TIM*(Mo0 4 )2/
TIM (W ()4)2 for M=Na, K, Li) that stabilize in orthorhombic/ monoclinic structure at
room temperature, are also investigated in order to understand the role o f T1 substitution
and ionic size on the observed vibration mode. The expected vibration modes in Infrared
anil Raman spectra are estimated using factor group analysis and assignment o f observed
modes is attempted based on FGA predictions, earlier reported assignment o f internal
modes o f M 0 O 4/. W O4 ion in other compound .A comparison o f the IR and Raman modes
in transition metal compounds and those observed in the present study reveals the effect
of different types o f coupling in two set o f tungstates/molybdates The effect o f the large
ratio of the alkali ions radii on the charge ordering is investigated and the observed
splitting in d.i, u 3 modes infers that the alkali ions are ordered in the materials with cubic
symmetry. However, the interaction between alkali ions and molybdates/ tungstates is
different resulting into different spectral features in them. A careful examination o f the
intensity and band splitting pattern o f internal modes in materials suggests that this
interaction is more pronounced in molybdates than in tungstates.
The internal/' lattice modes in case o f CLM are well resolved whereas for CLW they are
broad. This is attributed to the charge controlled interaction that m ay differ in two
materials. In an ordered structure, the coulomb interaction between A + , B+ ions, the most
probable way o f ordering is such that each ion o f the same type is surrounded ( in the
second coordination sphere) only by the ion o f other type. This may lead to the lowering
of effective site sym m etry and splitting o f U] modes. This is just opposite to what is
reported for A f, B 3+ ions interaction with tungstates and molybdates [58], However, on
the basis o f reported assignment o f translational modes o f alkali atoms in similar systems
anti librational modes o f tetrahedral molybdates [59], the bands at 119, 91 cm ' 1 are
tentatively assigned due to translational motion involving W O 42", whereas band around
170 cm 1 due to librational motion o f WO42", the bands at 70, 55 and 42 cm ' 1 are due to
alkali atoms translations.
The distortion from tetrahedral symmetry in RLM and KLM that stabilizes in
orthorhombic sym m etry is found to be small. The molecular ions are interacting strongly
probably through asymmetric mode coupling leading to broad asymmetric response as is
seen in K LW and N L M in IR spectra. In monoclinic systems, factor group splitting
removes all degeneracy’s and produces bands in polycrystalline material that are
forbidden in free state. Based on the IR and Raman selection rules for various modes, 04
bands corresponding to v,. 08 corresponding to v2 and 12 each corresponding to v3 v4
should be observed.
The comparison o f the observed vibrational modes o f double alkali molybdates/
tungstates with those substituted by thallium, we infer that and substitution o f thallium
has very little effect on the observed bands. Rather, the shifts observed in various modes

a n d t h e appearance o f modes is more clearly related to the difference in alkali cation
r a d i i , their types, ratio o f large and small size o f ionic radii. Further, the different nature
of site sym m etry leading to varied interaction between alkali ions and molybdates
resulting into different spectral features in them.

RKFKRENCES
[ I ] V.V. Trunov, V.A. Efremov, Yu.A. Velikondy, Nauka, Leningard (1986).
(2J Redfcm, S.A.T.Phys.B 48, 5761(1993).
[3] K. S. Aleksandrov, A. T. Anistratov, S. V. Melnikova, P. V. Klevtsov, A. I. Kruglik,
V. N. Voronov, Physica Status Solidi(a) 67, 377-380 (1981).
[4] P. B ecker, L. Bohaty, R. Frohlich, H. J. Eichler, K. U eda, K. T ak a ich i , J. Flanuza,
M. M aczka, H. Rhee, A. A. Kaminskii Physica Status Solidi(a) 202, 2543-2564
(2005).
|5 | I. N. Flerov, A. V. Kartashev and S. V. M el’nikova, Physics o f the Solid State, 48,
1063-7834 (2006).
[6 ] fan g Lie, Bing Yan. Hao Hong Chen and Jing Tai Jhao, Inorganic Chem. 48 7576-
7584 (2009).
{71 K.S.Blat,Aleksandary,O.H.Zinenko,V.I.Iskorenev,I.S.and Kruglink,A.I.Ferroelectrics
54.233(1994).
[8 ] S.K.Mathew, Aroras T.and Batra,N.M .J/.Phys.Chem.Solid 5o, 665(1989).
[9] I.Petzelt and V.Dvorak, in vibrational spectroscopy o f phase transitions, edited by
Z.Iqbal and F.J.Owens (Academic, Orland), pp .55.151,(1984).
[ 10] W.Kaiser and M.Maier,in:F.T.Arichi and E.O.Schultz-Dubois(eds.),Laser
Handbook,Vol.2(North-Holland,Am-sterdam, 1972).p .(1 0 7 7 ).
[1 1] J.T.S. Irvine, D, C. Sinclair and A.R. West. Adsv. Mater. 21 . 1321 (1990).
[12] Z.C'.Ling, H.P.XIA. D.G.Ran. F.Q.Liu, S.Q.Sun. J.D.Fan, H.J.Zhang, J.Y.wana.
L.L.Yu.chemical physics letters, 426, 85-90 (2006).
[13] S.P.S.Porto and J.F.Scott. Phys.Rev,157.N0.3 . 716-719(1967).
[14] X.Z.Li.Z.B.Liu,L.Z.Zhang.G.F.Wang, J.Cryst.Growth 290,670 (2006)
[15] X.Z.. Li, Z, B .Li,L.Z.Zhang.G.F.,Wang.J.Cryst.Growth 293, 157 (2006).
[16] X.A.Lu,Z.Y.You.J.F.Li,Z.J.Zhu,G.H.Jia.B.C.,Wu.C.Y.,Tu,J.Alloys
Compel.426, 352, (2006).
[ l7]Yu.K.Voron"ko,K.A.Subboitin,V.E.Shukshin,D.A.Lis,S.N.Ushakov,A.V.Poipov.E.V
.Zharikov, Opt.Mater.29, 246, (2006).
[IX] J.Hanuza, M .M aczka and J.H.van der Maas,J .Mol .Struct.348, 349(1995).
[ 19] J.Hanuza, M .M aczka.and J.H.van der Maas, .(.Solid State Chem .l 17, 117(1995).
|2() |Yu.K.Voron'ko,K.A.Subbotin,V.E.Shukshiun.D.A.Lis,S.N.Ushakov.A.V.Popoivc,E.
V.Zharikov, Opt.Mater.29, 246, (2006).
[21] S.P.S.Porto and J.F.Scott,Phys.Rev, 157, 716-719(1967).
[221 J.Hanuza, M .M aczka and J.H.van der Maas.J.Mol .Struct.348, 349(1995).
[23], J.Hanuza, M .M aczka.and J.H.van der Maas, J.Solid State Chem .l 17, 117(1995).
[24] J.Liu.J.M.CanoToirres, C.Cascales, F.EstebanBetegon, M.D.. Serrano, V.Volkov,
C.Zaldo.M.Rico.U.Griebner,V.Petrov.Phys.Stat.Soi.A.202, R29-R31, (2005).
[25] M.Rice.J.Liu.J.M.Cano-Torres, A.Garcia- Cortex,C.Cascales,C.Zaldo.
U.Griebner.V.Petroiv.Appl.Phys.B 81, 621-625, (2005).
[26] M..Rico.U.Griebner.V.Petrov,P.Ortega,X.Han,C.Cascales,C.Zaldoi,J.Opt.Soc.Am.B2
3. 1083-1090, (2006).
[27] C .Cascales,M .D.Serranoi.F.EstebanBetegon,C.Zaldo,R.Peters.K.Petermann,G.Huber
L .Ackermann, D., Rytz.C.Dupre.MRicoi, J .Liu.U.Griebner.V.Petroiv,Phys.Rev.B
74. 174114-1-174114-15. (2006).
[2S] A.GarciaC'ortes, J.M.CanoTorres, X.Han,C.Cascales.C.Zaldoi,X.Mateos,S.Rivier,
U.Griebner,V.Petrov,F.J.Valle,J.Appl.Phys. 101, 063110-1-063110-7. (2007).
[29]. A.GarciaCortes,J.M.CanoTorres,M.D.Serrano,C.Cascales,C.Zaldo.S.Rivier,
X.Mateois .U.Griebner, V.Petrov.IEEE J.Quant.Electron.43, 758-764. (2007).
[30] J.Hanuza and M.Maczka, Vibrational Spectrosc.7, 85(1995).
[3 1 J. J.Hanuza, M.Maczka, L.Macalik and J.H.van der Maas, J.Mol.Struct, 325,
1 19(1994).
[32] J.Hanuza .M .M aczka and J.H.van Maas, J .Phys.Condensed Matter 6 , 10263(1994).
13 3 J. V.V.Atuchin,V.G.Kesler,N.Y.Maklakova,L.D.Pokrovsky, Solid State
Com m un.133, 347, (2005).
[34]. F. Song. J. Su, H.Tan, L.Han. B.Fu,J.G.Tian.G.Y.Zhang,Z.X.Cheng, H.C. Chen.Opt.
Cmmun.241, 455, (2004).
[35] A.Bernardo, De An Gelis, E.Robert, N ewnham and B.Wiliam American Mineralogist
Vol.57, pp.255-268 (1972).
[36] J.Hanuza,M .M aczka,Vibrational Spectroscopy, 7,85 (1994).
[37] Bhaga Vantum and Venkatarayudu factor Group Analysis o f the Vibrational spectra
(1939).
[38] A.Jayaraman.S.Y.W ang, and S.K.Sharma, Solid state commun. 93,885 (1995).
139] K. S. Aleksandrov, A. T. Anistratov, S. V. Melnikova, P. V. Klevtsov, A.I.
Kruglik. V. N. Voronov, Physica Status Solidi(a) 67. 377-380 (1981).
[40] Usha soni, P.K.Bajpai, R.N.P.Choudhary.vol. 14 (2010).
[411 I*. Becker, L. Bohaty, R. Frohlich, H. J. E ichler, K. U eda. K. Takaichi, J.
Hanuza, M. M aczka, H. Rhee, A. A. Kaminskii Physica Status Solidi(a) 202,
2543- 564 (2005).
[42] I. N. Flerov, A. V. Kartashev and S. V. M el’nikova, Physics o f the Solid State,
48, 1063-7834 (2006).
[43] I. N. Flerov, A. V. Kartashev and S. V. M el’nikova, Physics o f the Solid State,
48, 1063-7834 (2006).
[44] W yckoff R.W.G.Crystal Structure, Inter science Newyork (1960).
[45] R.Shavv and G.F.Claringbull, Am M in e r40,933 (1995).
[46] IJsha sharaff, Ph.D. Thesis, Guru Ghasidas Vishwavidyalaya, Bilaspur (C.G.)
(2010).
147 j. K. O kada and J. Ossaka, Crystal data and phase transition o f KLiWC>4 and
K U M 0 O 4, J. Solid State Chemistry, 37, 325-327 (1981).
[4X]V.A. Kolesov and L.P. Kozeeva, Zhumal Struktumoi Khimii,
34, 52-58 , ( Translated by Plenum Publishing), (1993).
[49], Kaminskii, A. A. and Bohaty, L. and Becker, P. and Held, P. and Rhee, H. and
Eichler, H. J. and J. Hanuza, laser physics letters,6 , 335-350, (2009).
[50], Meister. S. and Franke, B. and Scharfenorth. C. and H.J. Eichler, plasma processes
and polymers, 6 . 727-730 (2009).
[51], R.F.Klevtsova, L.P.Kozeeva and P.V.Klevtsov. crystallographia, 19, 89-94 (1974).
[52], R.D.Shannon. Acta Crystallogr, A32. 751-767 (1976).
[53] M.V.Mokhosoev, F.P.Alekseev and V.L.Butukhanov, Dauble Molybdates and
Tungstates (Nauka, Hovosibirsk in Russian) (1981).
[54 ] H .Grassman,H.M oser,E.Lorentz,J.Lumin.33,109(1985).
[55] J.Hanuza, M .M aczka and J.H. van Mass, J.Phys. Condensed M atter.6 ,10263 (1994).
[56] S.Sharma, R.N.P.Choudhary, Journal o f Physics and Chemistry o f Solids 60,743-
747 (1999).
[57] A.Watterich, M.Wohlecke, H.Mulles,K.Raksanji,A.Breitkope and
B.Zelei,J.Phys,Chem.Solids 53.89(1992).
[58] M.Cioldstein, spectrochim, Acta 22, 1389 (1966).
[59] P.'Parte and J.Predhomme, Specrochim.Acta A 28, 69(1972).


![Alkali Earth Metal Molybdates as Catalysts for the ... · 5.76% per year of the market value from 2018 to 2022 [4]. The synthesis of formaldehyde was first reported by Butlerov in](https://img.pdfslide.net/doc/110x75/5f84baaaf90a562e2a188783/alkali-earth-metal-molybdates-as-catalysts-for-the-576-per-year-of-the-market.jpg)


![Alkali & alkali tanah [yunusthariqrizky]](https://img.pdfslide.net/doc/110x75/555d0f95d8b42ac4258b46d7/alkali-alkali-tanah-yunusthariqrizky.jpg)