Embed Size (px)
Citation preview
CHAPTER 6:
Characterisation of the Morris Water Maze
and the Elevated Plus Maze
6.1. INTRODUCTION
The neurodegenerative pathology of Sanfilippo syndrome results in a host of
behavioural changes, including developmental delay and cognitive decline (as discussed in
Chapter 1). Prior to assessing the clinical effect of CAV-NS vector administration in MPS
IIIA mice in the longer-term studies described in Chapter 7, it was necessary to validate
several behavioural tests in the congenic C57Bl/6 strain of MPS IIIA mice. The Morris Water
Maze, which evaluates memory and learning ability, has been used to assess cognitive
function in a variety of LSD mouse models including MPS IIIA (Gliddon and Hopwood,
2004; Crawley et al, 2006a), MPS IIIB (Fu et al, 2007), MPS VII (Chang et al, 1993; Bastedo
et al, 1994; O'Connor et al, 1998; Frisella et al, 2001; Sakurai et al, 2004),
aspartylglucosaminuria (Jalanko et al, 1998) and cystinosis (Dr Eric Kremer, personal
communication), and has also been evaluated in an -mannosidosis guinea pig model
(Robinson et al, submitted by LDRU). However, the performance of congenic MPS IIIA mice
in the Morris Water Maze was in the process of being independently determined within the
LDRU when this stage of the project was undertaken. Therefore, the first aim of the
experiments described in this chapter was to contribute to the characterisation of the memory
and spatial learning abilities of congenic unaffected and MPS IIIA mice at 16-wks of age
using the Morris Water Maze.
The Elevated Plus Maze examines “emotionality” or anxiety-related behaviours by
assessing the conflict between the desire to explore a novel environment and the anxiogenic
elements such as elevation and an unfamiliar, brightly illuminated arena. This test has a
predictive value for both anxiogenic (anxiety-inducing) and anxiolytic (anxiety-relieving)
compounds in rats (Pellow et al, 1985) as well as mice (Lister, 1987). As the administration
of anxiolytic agents induces increases in exploratory behaviour on the open arms, common
indices of anxiety include the percentage of entries into the open arms, the percentage of time
spent on the open arms and the percentage of the path length on the open arms. Parameters
- 141 -
such as total path length and arm entries into the open and closed arms also give an indication
of total activity. Given that MPS IIIA mice have biphasic hyper-/hypo-active changes in
activity compared to wild-type animals, as measured by the exploration of an open field arena
(Hemsley and Hopwood, 2005), and that MPS IIIB mice are less anxious/fearful than
unaffected controls in the Elevated Plus Maze (Cressant et al, 2004), the second objective was
to investigate whether similar differences in anxiety could be detected in MPS IIIA mice
using the Elevated Plus Maze.
6.2. SPECIFIC METHODS
Morris Water Maze testing of male C57Bl/6 mice was performed as previously
described, with minor modifications to the published protocol to permit use of an automated
HVS Image tracker system and changes to the layout of the CYWHS Animal House (Gliddon
and Hopwood, 2004; Crawley et al, 2006a).
6.2.1. Morris Water Maze Equipment and Testing Room Layout
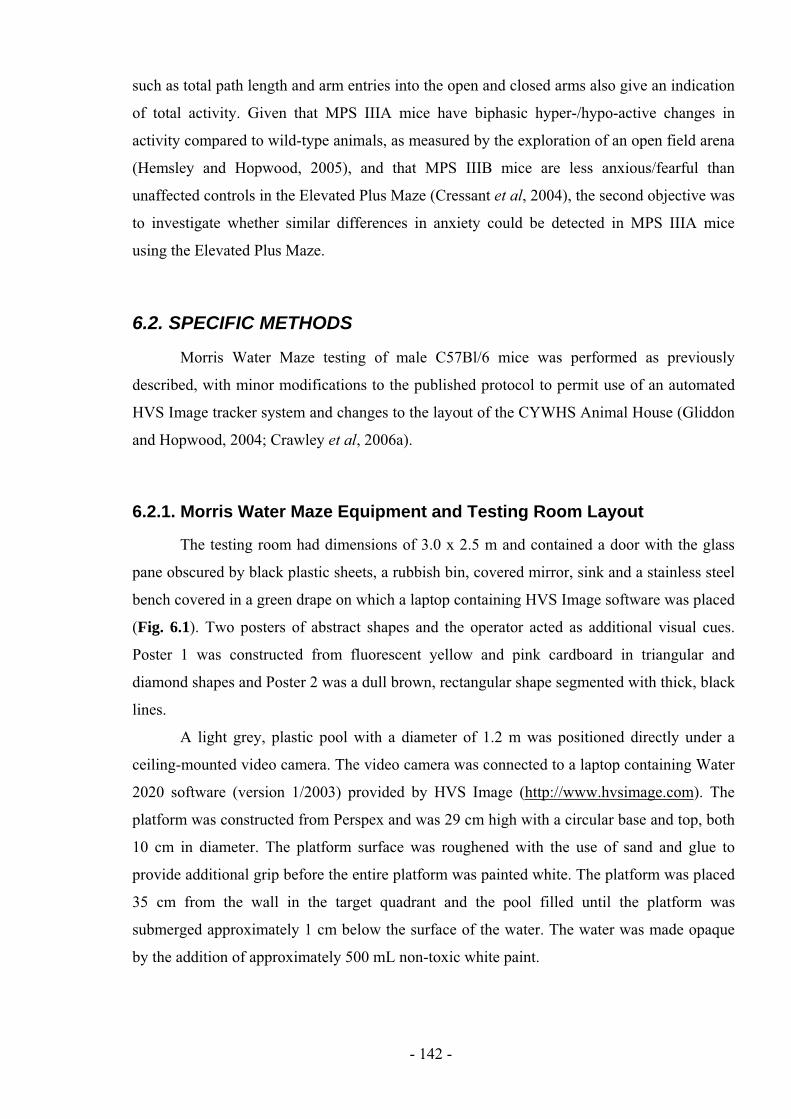
The testing room had dimensions of 3.0 x 2.5 m and contained a door with the glass
pane obscured by black plastic sheets, a rubbish bin, covered mirror, sink and a stainless steel
bench covered in a green drape on which a laptop containing HVS Image software was placed
(Fig. 6.1). Two posters of abstract shapes and the operator acted as additional visual cues.
Poster 1 was constructed from fluorescent yellow and pink cardboard in triangular and
diamond shapes and Poster 2 was a dull brown, rectangular shape segmented with thick, black
lines.
A light grey, plastic pool with a diameter of 1.2 m was positioned directly under a
ceiling-mounted video camera. The video camera was connected to a laptop containing Water
2020 software (version 1/2003) provided by HVS Image (http://www.hvsimage.com). The
platform was constructed from Perspex and was 29 cm high with a circular base and top, both
10 cm in diameter. The platform surface was roughened with the use of sand and glue to
provide additional grip before the entire platform was painted white. The platform was placed
35 cm from the wall in the target quadrant and the pool filled until the platform was
submerged approximately 1 cm below the surface of the water. The water was made opaque
by the addition of approximately 500 mL non-toxic white paint.
- 142 -
N
E
S
W
Poster 2
Table & Laptop
Poster 1
Mouse
Rack
(and towelling
to dry mice)
Platform
Operator
Pool
Bin
Covered Mirror & Sink Door
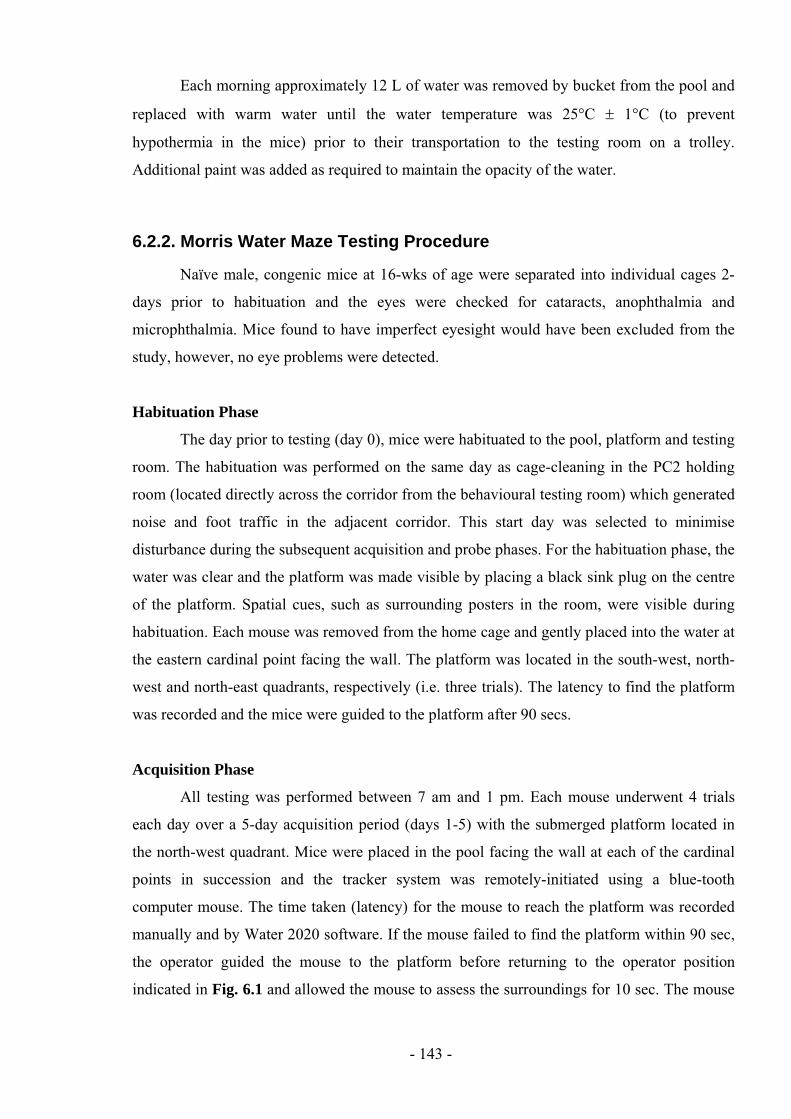
Figure 6.1: Schematic layout of the Morris Water Maze room. A 2.5 x 3.0 m room
within the CYWHS Animal House was set up for Morris Water Maze testing as displayed.
Testing was performed in a 1.2 m diameter plastic pool by placing the mouse at each
cardinal point (north N, south S, east E or west W) in succession. The operator then
returned to the position indicated near the north-east quadrant. A ceiling-mounted video
camera connected to a laptop running Water 2020 software was used to record each trial.
Each morning approximately 12 L of water was removed by bucket from the pool and
replaced with warm water until the water temperature was 25 C 1 C (to prevent
hypothermia in the mice) prior to their transportation to the testing room on a trolley.
Additional paint was added as required to maintain the opacity of the water.
6.2.2. Morris Water Maze Testing Procedure
Naïve male, congenic mice at 16-wks of age were separated into individual cages 2-
days prior to habituation and the eyes were checked for cataracts, anophthalmia and
microphthalmia. Mice found to have imperfect eyesight would have been excluded from the
study, however, no eye problems were detected.
Habituation Phase
The day prior to testing (day 0), mice were habituated to the pool, platform and testing
room. The habituation was performed on the same day as cage-cleaning in the PC2 holding
room (located directly across the corridor from the behavioural testing room) which generated
noise and foot traffic in the adjacent corridor. This start day was selected to minimise
disturbance during the subsequent acquisition and probe phases. For the habituation phase, the
water was clear and the platform was made visible by placing a black sink plug on the centre
of the platform. Spatial cues, such as surrounding posters in the room, were visible during
habituation. Each mouse was removed from the home cage and gently placed into the water at
the eastern cardinal point facing the wall. The platform was located in the south-west, north-
west and north-east quadrants, respectively (i.e. three trials). The latency to find the platform
was recorded and the mice were guided to the platform after 90 secs.
Acquisition Phase
All testing was performed between 7 am and 1 pm. Each mouse underwent 4 trials
each day over a 5-day acquisition period (days 1-5) with the submerged platform located in
the north-west quadrant. Mice were placed in the pool facing the wall at each of the cardinal
points in succession and the tracker system was remotely-initiated using a blue-tooth
computer mouse. The time taken (latency) for the mouse to reach the platform was recorded
manually and by Water 2020 software. If the mouse failed to find the platform within 90 sec,
the operator guided the mouse to the platform before returning to the operator position
indicated in Fig. 6.1 and allowed the mouse to assess the surroundings for 10 sec. The mouse
- 143 -
was then removed from the pool by hand, dried in cloth towelling (fresh towels each day) and
returned to its home cage between trials. At the end of each day, the rack of mice was
transferred to the PC2 holding room overnight.
Mice were tested in randomly-allocated groups of 5-6 so that the inter-trial interval for
each mouse was approximately 10 min, with a minimum inter-trial interval of 5 min. The
order of each group of mice was rotated on each day of testing so that group 1 swam first on
day 1, second on day 2 and so on. The rack holding the mouse cages was covered with white
towels and then transferred to the testing room to prevent the mice observing the swim trials
of other mice.
Probe Phase
The memory transfer efficiency was determined the day following the acquisition
phase by removing the platform and calculating the percentage of time spent in each quadrant
(day 6). These measures were determined both automatically (Water 2020 software) and
manually by recording the position of the mouse each second using a multi-channel cell
counter. Each mouse underwent three trials lasting 90 sec each, beginning at the northern
cardinal point and rotating clock-wise.
Visual Testing
Mice underwent a final day of swimming (three trials starting from the east, south and
west cardinal points) in clear water with the platform raised approximately 0.5 cm above the
water surface to determine the visual acuity of the mice. The spatial cues (e.g. posters) were
visible and in the same position as during the acquisition and probe phases. The platform was
located in the south-east quadrant (i.e. opposite the target quadrant in the acquisition phase).
Mice that failed to find the platform in all trials in the visual test would have been excluded
from the study, however, all mice passed the visual test in this assessment.
6.2.3. Morris Water Maze Data and Statistical Analyses
The default settings for the Water 2020 software were utilised (percentage of time
swimming slowly defined as swimming less than 5 m per second; thigmotaxic/circular
swimming if the thigmotaxis diameter/pool diameter ratio was greater than 0.9).
Mr Craig Hirte of the Public Health Research Unit (CYWHS) performed all statistical
analyses of Morris Water Maze data using SPSS (version 14.0) and Stata (version 9). The 4
- 144 -
trials in the acquisition phase were averaged each day to give one outcome per day and
assessed using a linear-mixed model using a Greenhouse-Geisser correction with simple
contrasts. For the probe phase, the percentage of time within each quadrant was assessed as
unit level data (i.e. was not averaged) for the three trials using a linear mixed model with a
Greenhouse-Geisser correction to allow a trial effect to be included as a predictor.
6.2.4. The Elevated Plus Maze
Unless otherwise stated all mice were male, naïve to the Elevated Plus Maze apparatus
and from the congenic strain. Unaffected and MPS IIIA mice were 7-, 15-, 18- or 20-wks of
age when tested and the group sizes for each of the Elevated Plus Maze trials are summarised
in Table 6.1. These mice had not undergone testing in other behavioural tests with the
exception of two groups: the ‘repeat-tested’ 18-wk-old group (which underwent testing in the
Elevated Plus Maze at both 15- and 18-wks) and the automatically-assessed mice at 15-wks of
age (tested in open field activity 8-days before assessment in the Elevated Plus Maze). The
mice were group-housed where possible but some mice were single-housed due to aggressive
tendencies (Table 6.1). The 7-wk-old mice were tested over 2 consecutive days, separated by
gender.
Apparatus
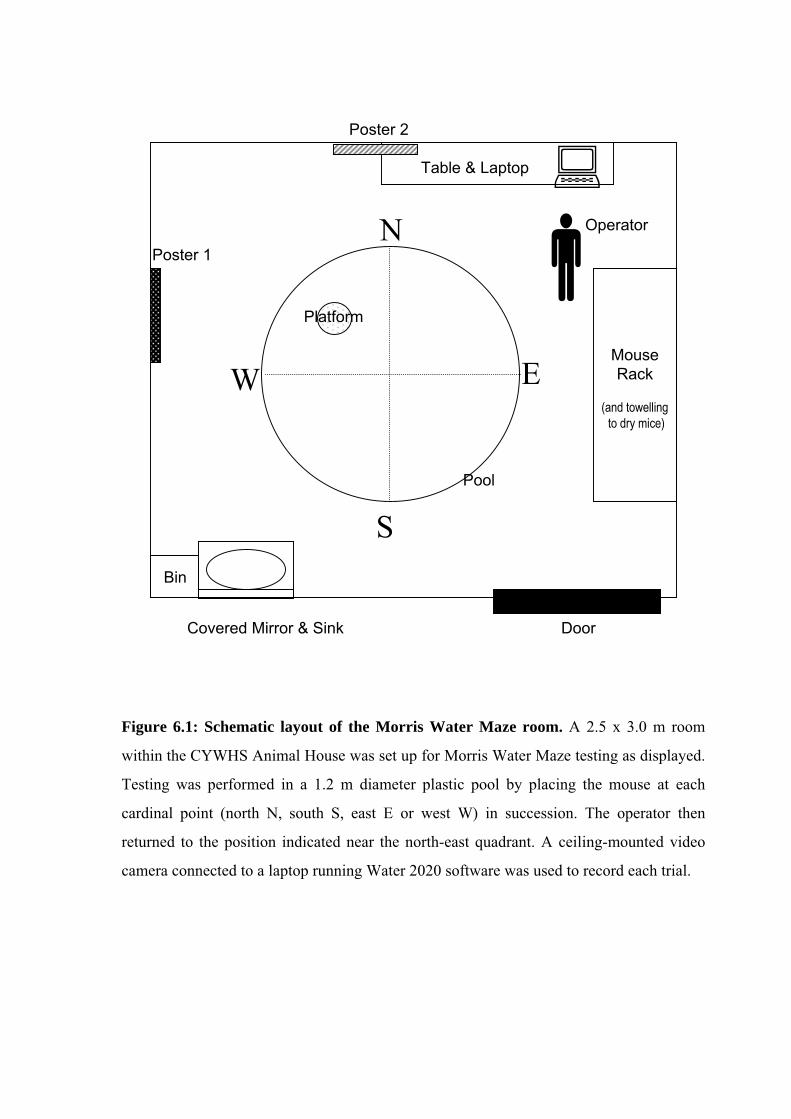
The Elevated Plus Maze was constructed of wood so that four arms with dimensions
of 50 cm x 7 cm intersected in a central square (7 cm x 7 cm) forming a “+” shape (Fig. 6.2).
The maze floor was covered in white paper and clear plastic to prevent urine impregnation
and to allow easy cleaning with ethanol between trials to eliminate odour transfer. Two
opposing arms were enclosed by 40 cm high walls covered in black plastic (“closed arms”)
and the two arms without walls were designated “open arms”. The open arms did not contain
ledges. The maze floor was elevated 50 cm above ground level. The apparatus was placed on
a green drape to provide contrast during the calibration of the Maze 2020 software.
Room Layout
The Elevated Plus Maze was conducted in the same room as the Morris Water Maze,
described in Section 6.2.2. The glass pane of the door was covered with a black plastic sheet
and a ceiling-mounted video camera was connected to a laptop with Maze 2020 software
(Fig. 6.3). The operator was positioned at a 45 angle between an open and closed arm.
- 145 -
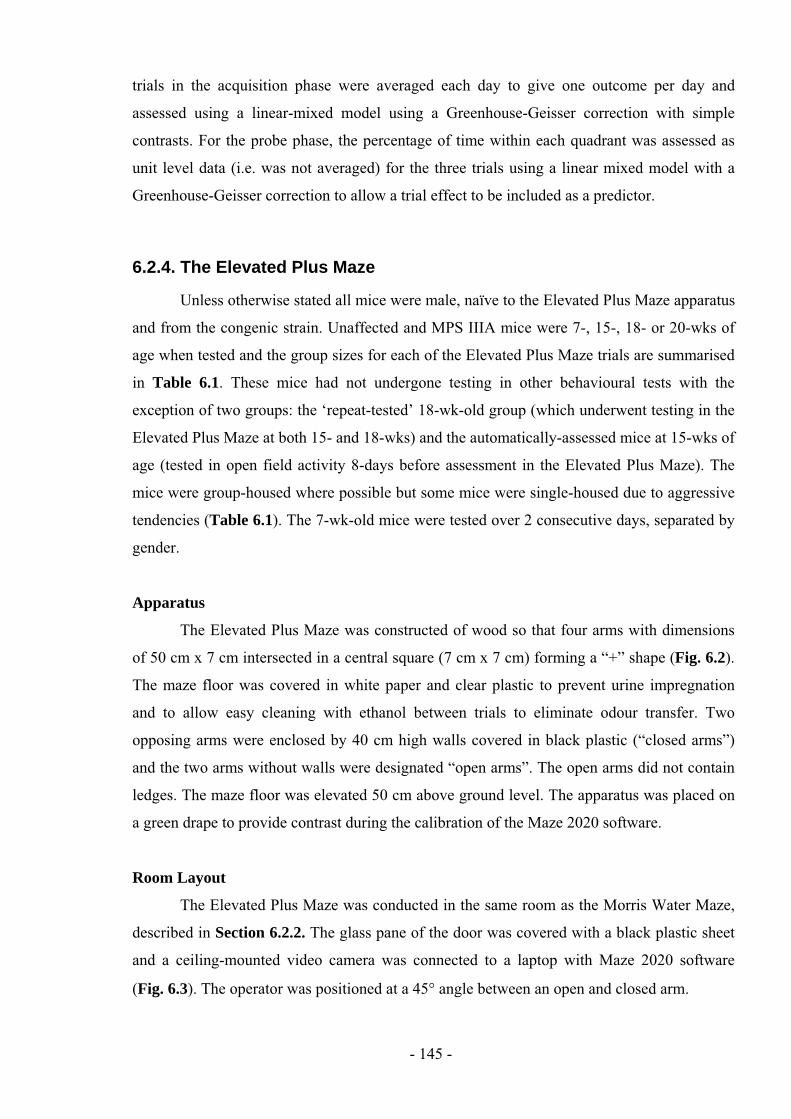
Table 6.1: Group sizes of Elevated Plus Maze trials. The number of mice tested in each
Elevated Plus Maze trial is listed by genotype. The 7-wk-old male and female mice were
tested over two consecutive days. Age-matched animals were tested on the same day. Mice
indicated by an asterisk were tested on two separate occasions at 15- and 18-wks of age.
Age and Sex Unaffected(n=)
MPS IIIA(n=)
Elevated Plus Maze Experience
Other Behavioural Test Experience(time prior to Elevated Plus Maze testing)
HousingConditions
15 wk Males * 6
(Manual assessment)
6 Naïve None Single/Group
7 wk Females
7 wk Males
15 wk Males
18 wk Males
18 wk Males *
20 wk Males
10
10
7
11
9
10
11
8
10
9
9
9
Naïve
Naïve
Naïve
Naïve
Repeat-Tested
Naïve
None
None
Open Field (8 days)
None
Elevated Plus Maze (3 wks)
None
Group
Group
Group
Group
Single
Single
Testing
Mice were brought into the behaviour room on the morning of assessment and were
tested in a random order between 7 am and 2 pm. Each mouse was placed in the centre square
facing the open arm furthest from the operator and allowed to freely explore the apparatus for
5 or 10 min. For the pilot study, where the data was manually-assessed, the path of the mouse
recorded with a video camera for 10 min and the location of the mouse (open arm, closed arm
or centre square) at every second was tallied using a multi-channel cell counter after the
completion of all trials. For subsequent trials, the path of the mouse was recorded
automatically by HVS Image Maze 2020 software (version 7/2003). At the completion of
each trial, the quantity of faecal boli and number of urinary spots were counted. The floor and
inner walls were cleaned with ethanol between each trial to prevent scent transfer.
Data Analysis
In the pilot study, the percentage of time spent in the open arms was calculated by
summing the number of seconds in both of the open arms and dividing it by the total sum of
the time in any arm. The number of open arm entries was defined as the two front paws
crossing into an open arm.
- 146 -
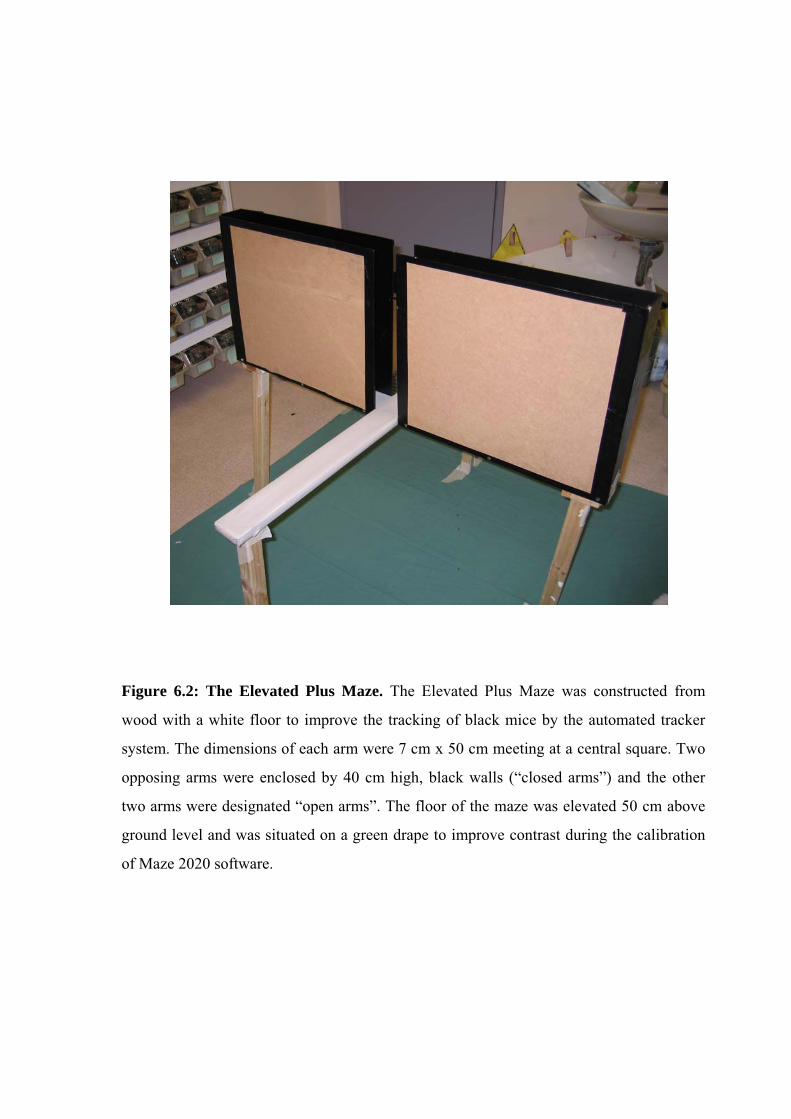
Figure 6.2: The Elevated Plus Maze. The Elevated Plus Maze was constructed from
wood with a white floor to improve the tracking of black mice by the automated tracker
system. The dimensions of each arm were 7 cm x 50 cm meeting at a central square. Two
opposing arms were enclosed by 40 cm high, black walls (“closed arms”) and the other
two arms were designated “open arms”. The floor of the maze was elevated 50 cm above
ground level and was situated on a green drape to improve contrast during the calibration
of Maze 2020 software.
7 cm
Covered Mirror & Sink Door
Table & Laptop
Mouse
Rack
Operator
Bin
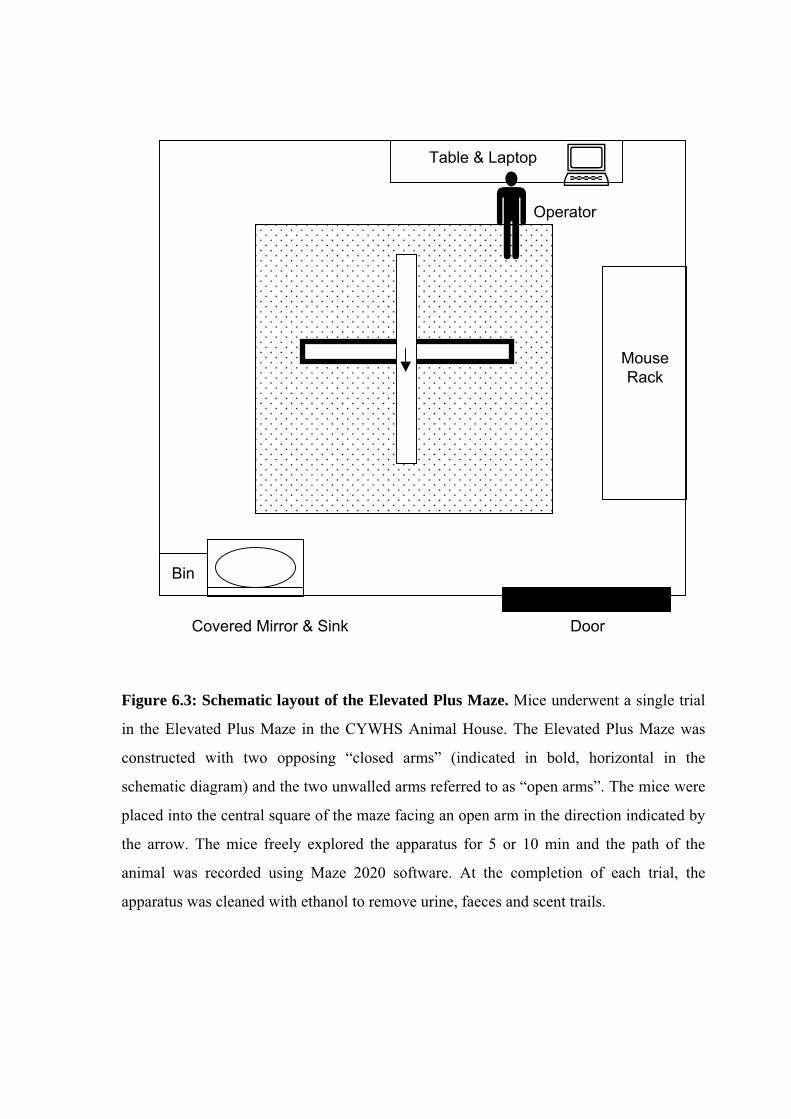
Figure 6.3: Schematic layout of the Elevated Plus Maze. Mice underwent a single trial
in the Elevated Plus Maze in the CYWHS Animal House. The Elevated Plus Maze was
constructed with two opposing “closed arms” (indicated in bold, horizontal in the
schematic diagram) and the two unwalled arms referred to as “open arms”. The mice were
placed into the central square of the maze facing an open arm in the direction indicated by
the arrow. The mice freely explored the apparatus for 5 or 10 min and the path of the
animal was recorded using Maze 2020 software. At the completion of each trial, the
apparatus was cleaned with ethanol to remove urine, faeces and scent trails.
For the subsequent trials, Maze 2020 software automatically determined the path
length, percentage of time spent in all arms and the total number of arm entries. The following
measures were calculated from the data provided by the Maze 2020 software:
Percentage of entries
into open arms=
Entries in open arm A + Entries in open arm B x 100
Total arm entries (open arm A + open arm B + closed arm C + closed arm D)
Percentage of path
length in open arms= % Path in open arm A + % Path in open arm B
Percentage of time
spent in open arms=
Time in open arm A + Time in open arm B x 100
% time in all arms tracker
Statistical analyses were performed using a one-way ANOVA followed by a post-test
calculation with GraphPad software (http://graphpad.com/quickcalcs/posttest2.cfm). This
comparison uses a Bonferroni correction factor to adjust for multiple comparisons. The alpha
value was set at 0.05 with a 95% confidence level.
6.3. RESULTS
6.3.1. Morris Water Maze
Male MPS IIIA and unaffected congenic mice were assessed in the Morris Water
Maze as described in Section 6.2.2 at approximately 16-wks of age. The dates of birth on the
habituation day spanned from 15-wks and 5-days to 16-wks and 2-days. The mice had been
assessed in the open field activity arena (13-days prior) and the Elevated Plus Maze (5-days
prior) before initiating the Morris Water Maze. This was the first Morris Water Maze
conducted by our group using the HVS Image tracker system and consequently many
experimental parameters were investigated to determine whether there were significant
differences between the disease and control groups.
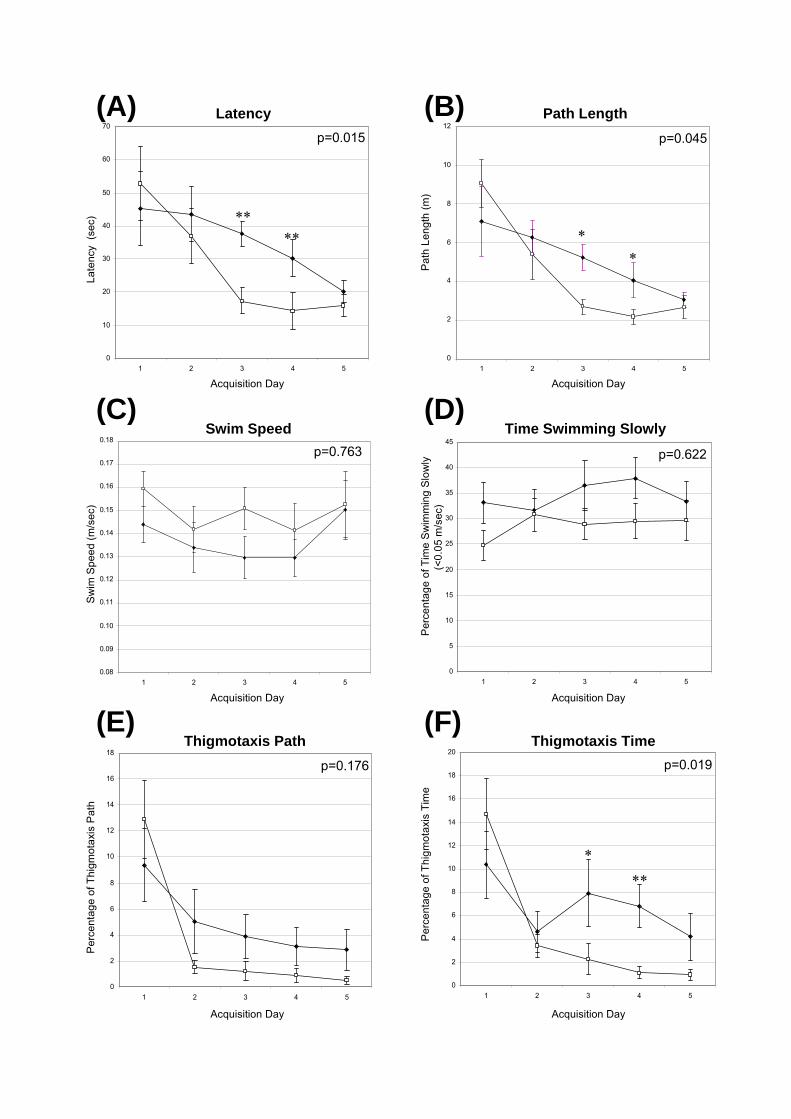
The time taken by MPS IIIA and unaffected mice to find the hidden platform was
similar on the first 2-days of the acquisition period (Fig. 6.4A) with average latencies of 53
and 45 sec for unaffected and MPS IIIA mice, respectively, on the first day of testing.
However, the unaffected mice had significantly faster latencies on days 3 and 4, with
unaffected mice improving their swim time to 17 and 14 sec, respectively, whilst the MPS
- 147 -
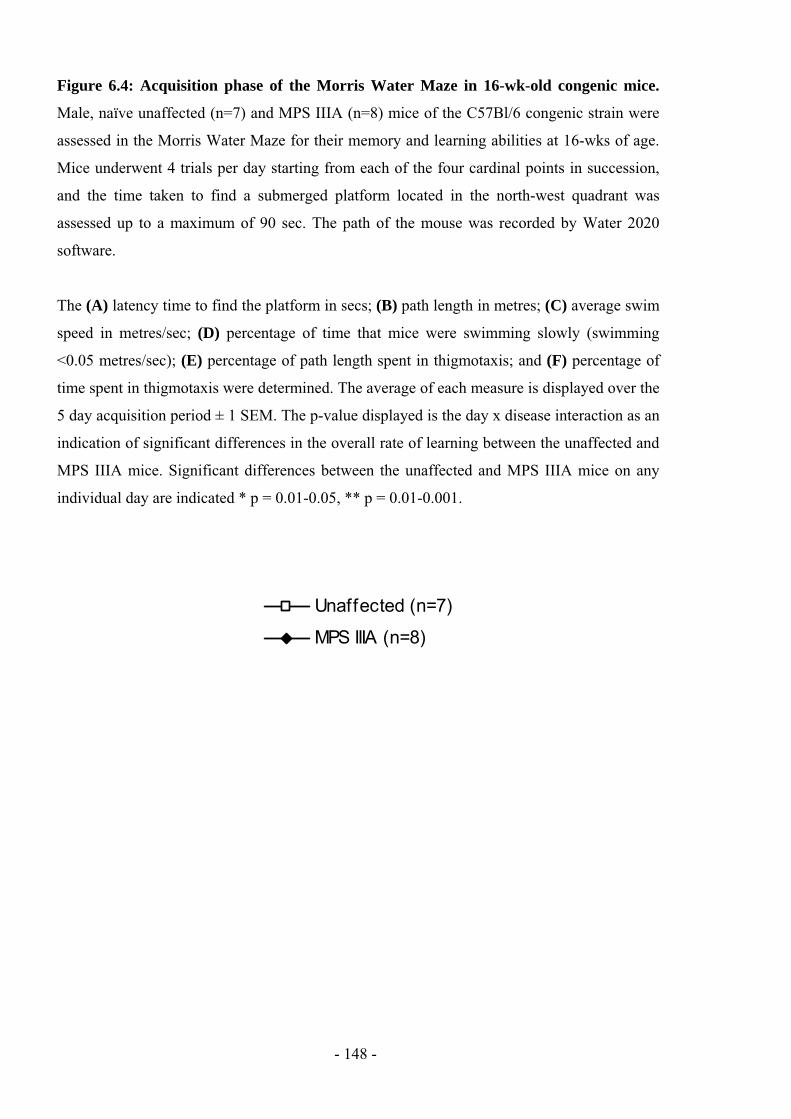
Figure 6.4: Acquisition phase of the Morris Water Maze in 16-wk-old congenic mice.
Male, naïve unaffected (n=7) and MPS IIIA (n=8) mice of the C57Bl/6 congenic strain were
assessed in the Morris Water Maze for their memory and learning abilities at 16-wks of age.
Mice underwent 4 trials per day starting from each of the four cardinal points in succession,
and the time taken to find a submerged platform located in the north-west quadrant was
assessed up to a maximum of 90 sec. The path of the mouse was recorded by Water 2020
software.
The (A) latency time to find the platform in secs; (B) path length in metres; (C) average swim
speed in metres/sec; (D) percentage of time that mice were swimming slowly (swimming
<0.05 metres/sec); (E) percentage of path length spent in thigmotaxis; and (F) percentage of
time spent in thigmotaxis were determined. The average of each measure is displayed over the
5 day acquisition period ± 1 SEM. The p-value displayed is the day x disease interaction as an
indication of significant differences in the overall rate of learning between the unaffected and
MPS IIIA mice. Significant differences between the unaffected and MPS IIIA mice on any
individual day are indicated * p = 0.01-0.05, ** p = 0.01-0.001.
Unaffected (n=7)
MPS IIIA (n=8)
- 148 -
0
2
4
6
8
10
12
1 2 3 4 5
(A) (B)
(C) (D)
(E) (F)
0
10
20
30
40
50
60
70
1 2 3 4 5
Acquisition Day Acquisition Day
**
**
p=0.015
0.08
0.09
0.10
0.11
0.12
0.13
0.14
0.15
0.16
0.17
0.18
1 2 3 4 5
0
5
10
15
20
25
30
35
40
45
1 2 3 4 5
p=0.622
0
2
4
6
8
10
12
14
16
18
1 2 3 4 5
Pe
rce
nta
ge
of
Th
igm
ota
xis
Pa
thS
wim
Sp
ee
d (
m/s
ec)
La
ten
cy
(se
c)
p=0.176
0
2
4
6
8
10
12
14
16
18
20
1 2 3 4 5
Pe
rce
nta
ge
of
Th
igm
ota
xis
Tim
eP
erc
en
tag
eo
f T
ime
Sw
imm
ing
Slo
wly
Pa
thL
en
gth
(m
)
(<0
.05
m/s
ec)
*
**
p=0.019
Swim Speed Time Swimming Slowly
Thigmotaxis Path Thigmotaxis Time
Acquisition Day Acquisition Day
Acquisition Day Acquisition Day
p=0.763
Latency Path Length
*
*
p=0.045
IIIA mice remained at 38 and 39 sec (p=0.001, p=0.005). This was reflected in a significant
overall day x disease interaction (p=0.015), indicating that the unaffected mice learnt the
position of the platform more quickly than the MPS IIIA mice. However, by acquisition day 5
both disease groups had similar search times (unaffected 15.4 sec; MPS IIIA 19.7 sec)
suggesting that both groups of mice had learnt the task.
The path length displayed a similar trend with shorter path lengths observed in both
groups on day 5 of the acquisition phase compared to day 1, indicating that the mice had
improved their navigation to the hidden platform during training (Fig. 6.4B). The mean path
length was significantly greater in the MPS IIIA mice compared to the unaffected mice on
acquisition days 3 and 4 (p=0.011, p=0.040) but was similar on day 5 (p=0.508). As before,
there was a significant overall day x disease interaction (p=0.045) indicating that the
unaffected mice had a faster rate of learning compared to the MPS IIIA mice.
The shorter path lengths in the unaffected mice were not a result of faster swim speeds
as there was no significant difference in the overall mean swim speed during the acquisition
phase between the disease groups (day x disease interaction, p=0.763; Fig. 6.4C).
In some trials, mice floated for parts of the trial and were not actively searching for the
hidden escape platform. To try and quantify this behaviour, the percentage of time mice spent
swimming slowly, as defined as having swim speeds less than 0.05 metres per sec, was
assessed (Fig. 6.4D). There were no significant differences between the unaffected and MPS
IIIA mice (p=0.233) or in the percentage of time the mice swam slowly over the acquisition
phase (day x disease interaction, p=0.622).
The percentage of path and time swum in a thigmotaxic pattern was determined (Fig.
6.4E, F). These parameters are indicators of anxiety and involve the mice searching for an
exit by swimming in circles in close proximity to the wall. It is difficult to interpret the results
in a statistically significant manner as the majority of trials recorded zero thigmotaxic
measurements. The percentage of time and the percentage of path length spent swimming
around the pool edge (thigmotaxis time, thigmotaxis path length) was reduced in both
unaffected and MPS IIIA mice throughout the acquisition period (thigmotaxis time and path
length, day x disease interaction p=0.019 and p=0.176, respectively). MPS IIIA mice were
more likely to swim in a thigmotaxic pattern than unaffected mice on acquisition days 2 to 5,
which was likely influenced by the unaffected mice learning the position of the hidden
platform more quickly than the MPS IIIA animals.
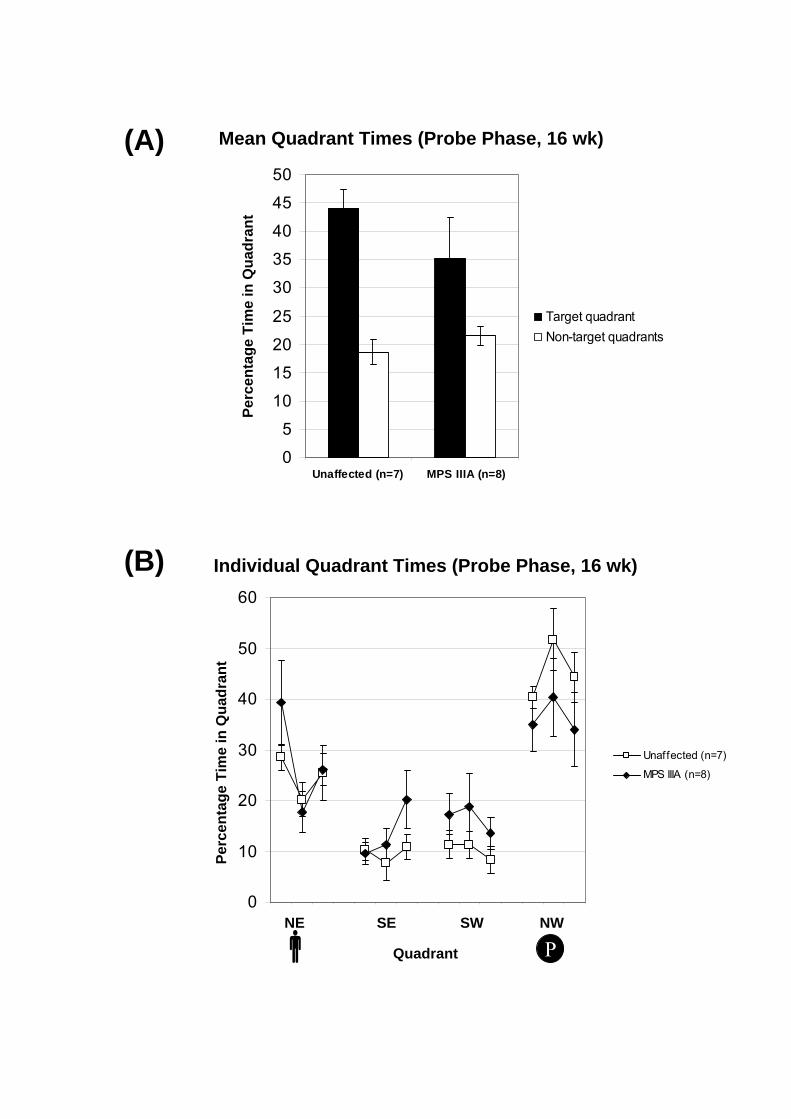
For the probe phase, the percentage of time spent in the target quadrant was
marginally higher in the unaffected mice compared to MPS IIIA mice, with an average of
- 149 -
44% and 35%, respectively (Fig. 6.5A). However, these changes were not statistically
different between the disease and control groups (p=0.307). The mice showed a preference
towards the target quadrant (NW) and the quadrant closest to the operator (NE) compared to
the remaining quadrants (Fig. 6.5B). A significant trial effect was not observed in the target
quadrant (p=0.214) suggesting that the mice were persisting in their search for the hidden
platform over the three probe trials.
No obvious eye defects were detected in the tested mice. By the third trial in the visual
acuity test on the final day of swimming, unaffected and MPS IIIA mice were able to find the
visible platform in 10.9 2.7 and 23.9 3.9 sec, respectively (p=0.02). However, the swim
speeds between the two diseases groups were indistinguishable (unaffected and MPS IIIA
0.156 0.009 and 0.150 0.006 metres/sec, respectively; p=0.567).
6.3.2. Elevated Plus Maze
6.3.2.1. Manual Assessment at 15-wks
A pilot study was conducted in 15-wk-old male mice (n=6 for each genotype) and was
analysed manually from a video-recording. No significant differences were detected in the
number of open arm entries (p=0.69), with unaffected and MPS IIIA mice crossing into the
open arms 15.8 2.6 and 14.2 3.1 times, respectively. Likewise, the number of faecal boli
and urinary spots produced during the trial was similar (4.8 1.0 and 4.8 1.1) for unaffected
and MPS IIIA animals.
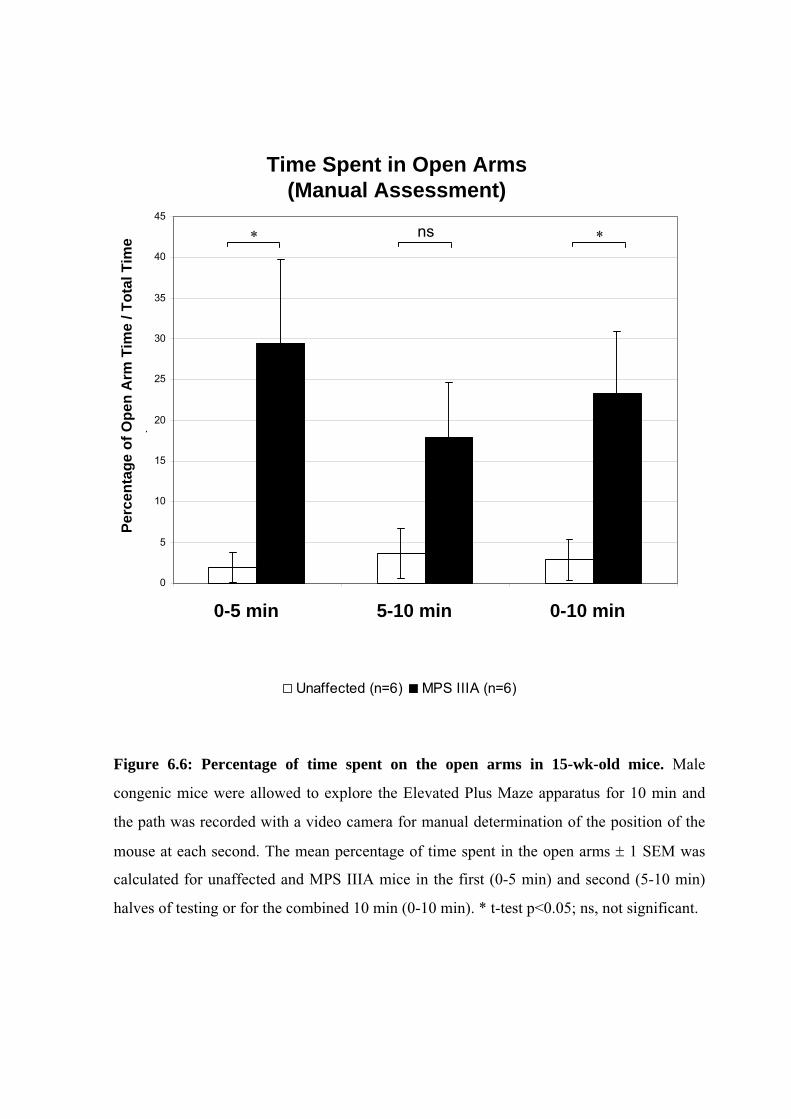
In contrast, the percentage of time spent in the open arms was significantly elevated in
MPS IIIA mice compared to unaffected mice over the 10 min trial (Fig. 6.6; p=0.029). MPS
IIIA mice were more likely to explore the open arms compared to wild-type mice in the first 5
min of testing (p=0.02). However, in the second half of testing MPS IIIA mice tended to
spend less time in the open arms compared to the first 5 min (p=0.37) whilst unaffected mice
increased the percentage of time in the open arms over the same time period (p=0.66). For the
5-10 min time period there was a marginal difference between the disease groups (p=0.08).
Consequently, successive trials in the Elevated Plus Maze were conducted for 5 min.
- 150 -
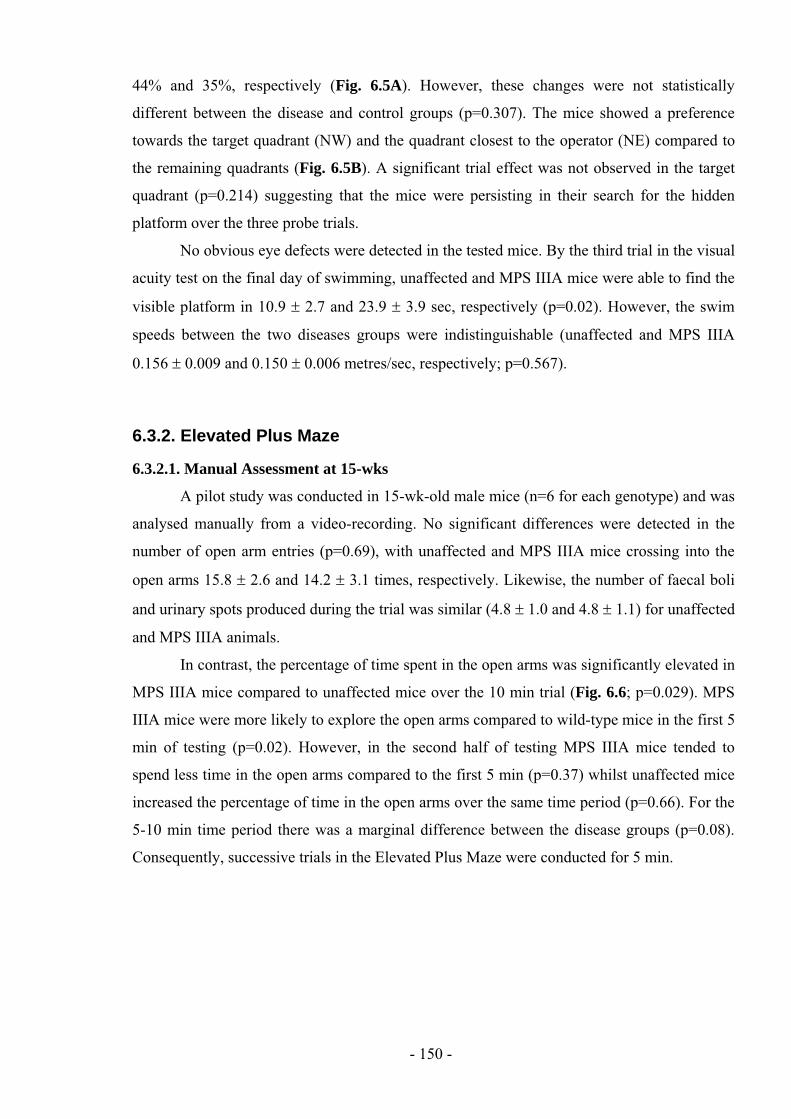
Figure 6.5: Quadrant times for probe phase of the Morris Water Maze in 16-wk-old
congenic mice. Following the 5-day acquisition phase, the memory transfer (probe phase)
was assessed in three trials lasting 90 sec each by measuring the percentage of time spent in
each quadrant using an automated tracker system. The operator was located closest to the
north-east quadrant (indicated by ) and the hidden platform was previously positioned in
the north-west quadrant (indicated by ) throughout the acquisition phase. The percentage
of time spent in the target quadrant was marginally significantly greater for the unaffected
mice compared to the MPS IIIA mice (p=0.097). (A) The data are presented as the mean
percentage of time spent in the non-target quadrants for all trials (white bars) compared to the
percentage of time in the target quadrant for all trials (black bars) ± 1 SEM or (B) the mean of
the individual percentage of time spent in each quadrant per trial ± 1 SEM.
P
- 151 -
0
10
20
30
40
50
60
NE SE SW NW
Quadrant
Pe
rce
nta
ge
Tim
e in
Qu
ad
ran
t
Individual Quadrant Times (Probe Phase, 16 wk)
P
Unaffected (n=7)
MPS IIIA (n=8)
Mean Quadrant Times (Probe Phase, 16 wk)
0
5
10
15
20
25
30
35
40
45
50
Unaffected (n=7) MPS IIIA (n=8)
Pe
rce
nta
ge
Tim
e in
Qu
ad
ran
t
(A)
(B)
Target quadrant
Non-target quadrants
0
5
10
15
20
25
30
35
40
45
p
Time Spent in Open Arms
(Manual Assessment)
0-5 min 5-10 min 0-10 min
Pe
rce
nta
ge
of
Op
en
Arm
Tim
e/ T
ota
l T
ime * ns *
Unaffected (n=6) MPS IIIA (n=6)
Figure 6.6: Percentage of time spent on the open arms in 15-wk-old mice. Male
congenic mice were allowed to explore the Elevated Plus Maze apparatus for 10 min and
the path was recorded with a video camera for manual determination of the position of the
mouse at each second. The mean percentage of time spent in the open arms 1 SEM was
calculated for unaffected and MPS IIIA mice in the first (0-5 min) and second (5-10 min)
halves of testing or for the combined 10 min (0-10 min). * t-test p<0.05; ns, not significant.
6.3.2.2. Automated Tracking in 7-wk-old Male and Female Mice
Other measures of interest, such as path length, were difficult to quantitate from the
video recording in the pilot experiment. To address this issue, animals were tracked with an
automated system equipped with Maze 2020 software. Seven-wk-old male and female mice
were assessed to determine whether there were gender differences in the disease groups. In all
parameters measured, there was no statistically significant difference between disease groups
of mice with the same gender (i.e. MPS IIIA and unaffected male mice were similar; MPS
IIIA and unaffected female mice were similar).
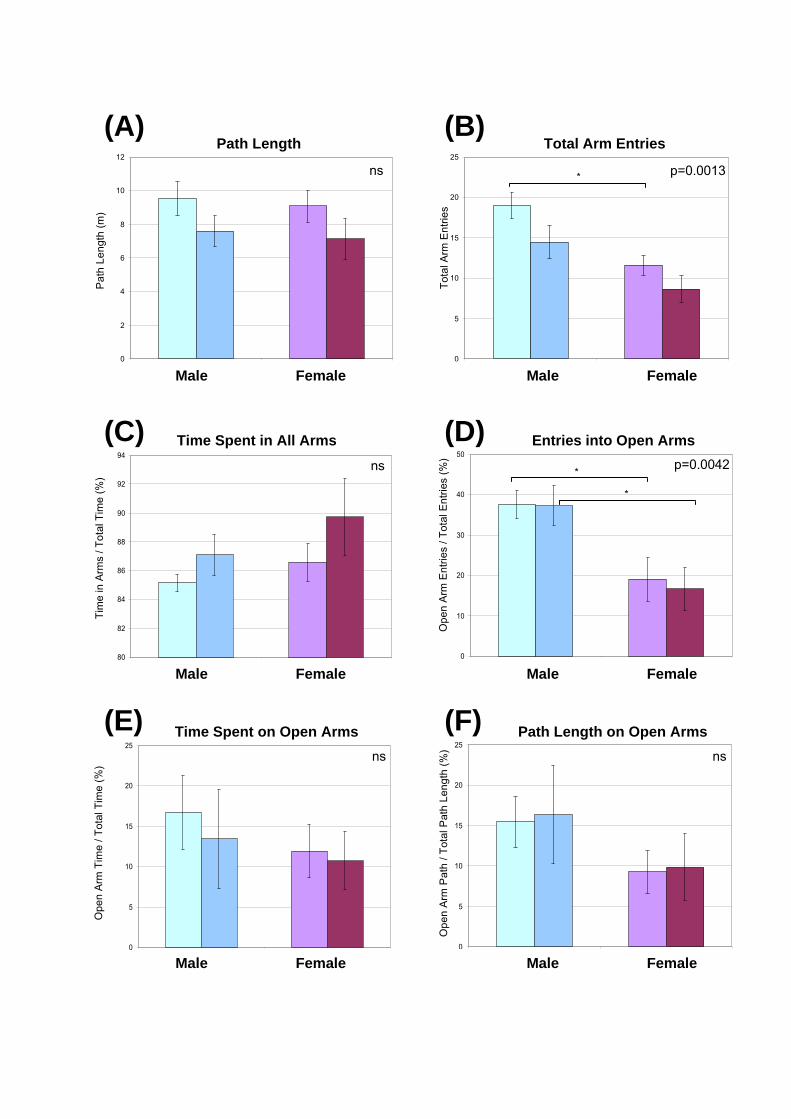
Unaffected mice had longer path lengths than gender-matched MPS IIIA mice (Fig.
6.7A) but there were no statistical differences between the groups. Similarly, the number of
total entries (open and closed arms) was greater in unaffected animals compared to their MPS
IIIA counter-parts (Fig. 6.7B). Males tended to enter the arms more frequently than females
of the same genotype (Fig. 6.7B). Statistical differences in the total number of arm entries
were only observed between unaffected males and females (p<0.05, t=3.145). Unaffected
mice tended to spend less time in arms (or conversely spent more time in the centre square, as
a less risky assessment of the open arms than direct exploration of the open arms) than MPS
IIIA animals (Fig. 6.7C).
No differences in the number of entries into the open arms were observed between
gender-matched mice (Fig. 6.7D). However, significant reductions in the number of entries
into the open arms were detected between male and female mice of genotype-matched
animals (p<0.05 for both; t=2.708 for unaffected male versus unaffected female; t=2.908 for
MPS IIIA male versus MPS IIIA female). Males were more likely to spend time exploring the
open arms than genotype-matched females (Fig. 6.7E) but not to a statistically significant
degree. Male mice tended to have a greater percentage of path length on the open arms but no
statistical differences between the genotypes or genders were found (Fig. 6.7F).
- 152 -
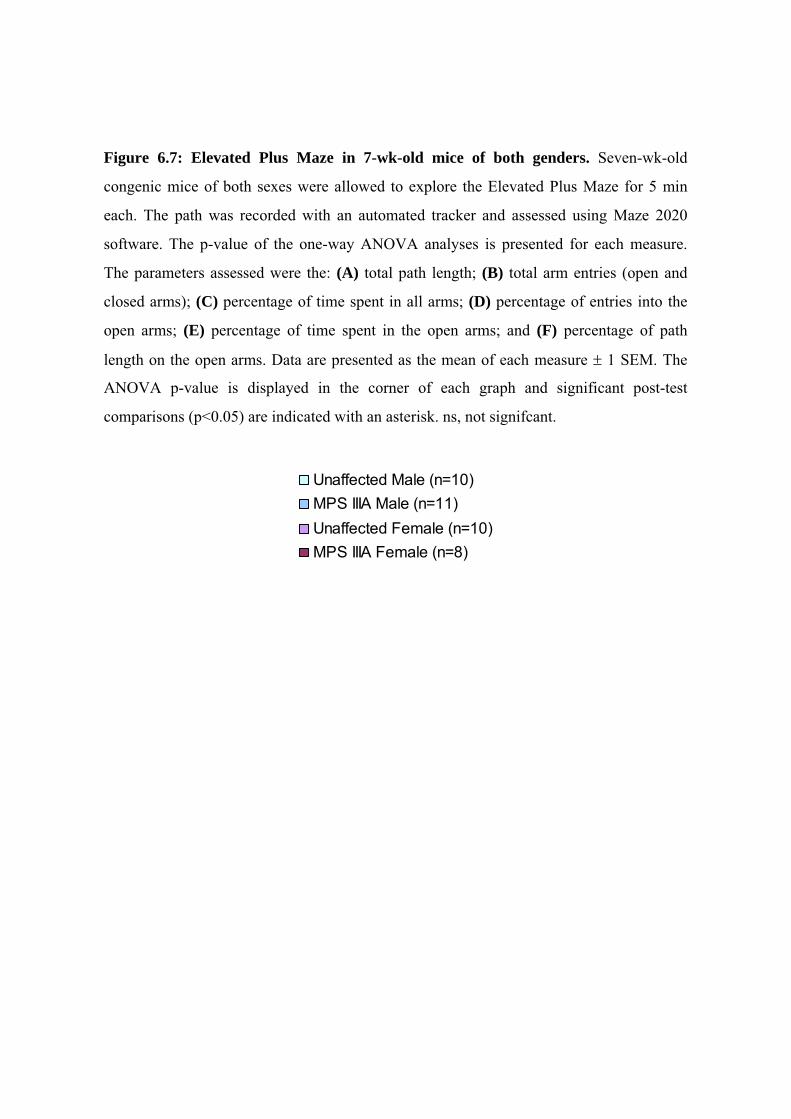
Figure 6.7: Elevated Plus Maze in 7-wk-old mice of both genders. Seven-wk-old
congenic mice of both sexes were allowed to explore the Elevated Plus Maze for 5 min
each. The path was recorded with an automated tracker and assessed using Maze 2020
software. The p-value of the one-way ANOVA analyses is presented for each measure.
The parameters assessed were the: (A) total path length; (B) total arm entries (open and
closed arms); (C) percentage of time spent in all arms; (D) percentage of entries into the
open arms; (E) percentage of time spent in the open arms; and (F) percentage of path
length on the open arms. Data are presented as the mean of each measure 1 SEM. The
ANOVA p-value is displayed in the corner of each graph and significant post-test
comparisons (p<0.05) are indicated with an asterisk. ns, not signifcant.
Unaffected Male (n=10)
MPS IIIA Male (n=11)
Unaffected Female (n=10)
MPS IIIA Female (n=8)
0
5
10
15
20
25
0
2
4
6
8
10
12
Path Length Total Arm Entries
ns p=0.0013
Pa
th L
en
gth
(m)
To
tal A
rm E
ntr
ies
(A) (B)
*
Male Female Male Female
(C) (D)Time Spent in All Arms Entries into Open Arms
0
10
20
30
40
50
1 280
82
84
86
88
90
92
94
1 2
ns p=0.0042
Tim
e in
Arm
s /
To
tal T
ime
(%
)
Op
en
Arm
En
trie
s /
To
tal E
ntr
ies (
%)
*
*
Male Female Male Female
Time Spent on Open Arms Path Length on Open Arms
0
5
10
15
20
25
1 20
5
10
15
20
25
Male Female Male Female
ns ns
Op
en
Arm
Tim
e/
To
tal T
ime
(%
)
Op
en
Arm
Pa
th /
To
talP
ath
Le
ng
th (
%)
(E) (F)
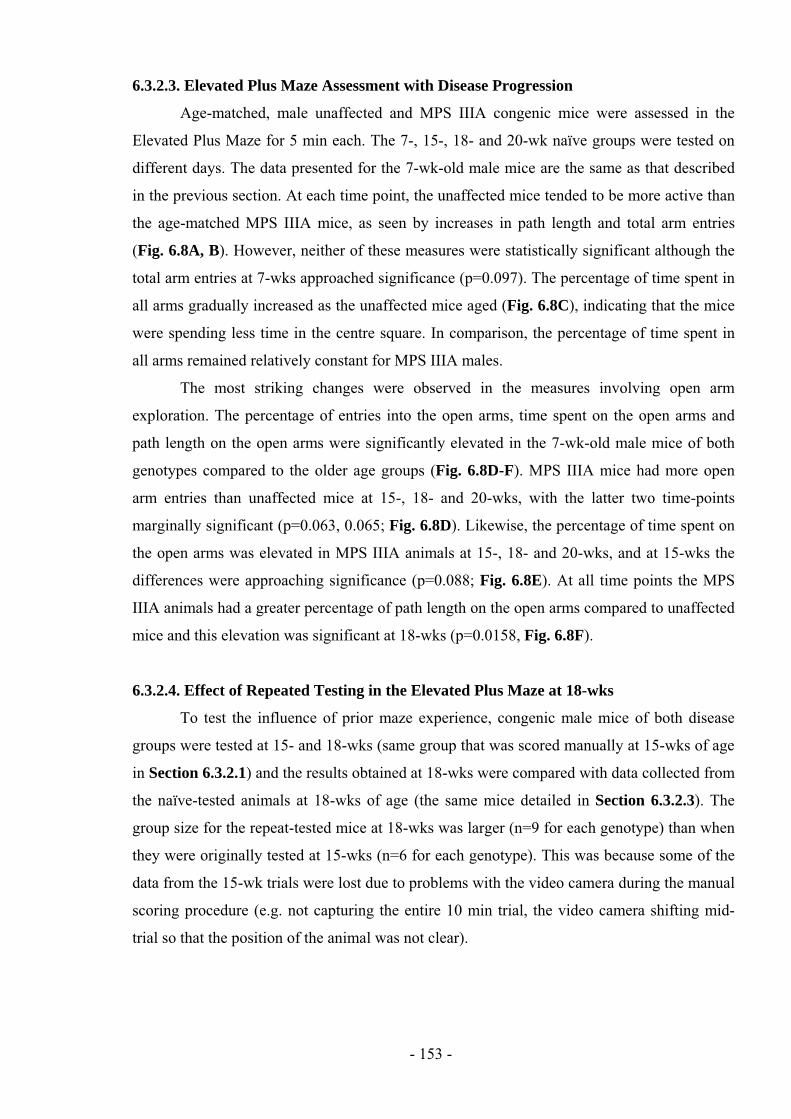
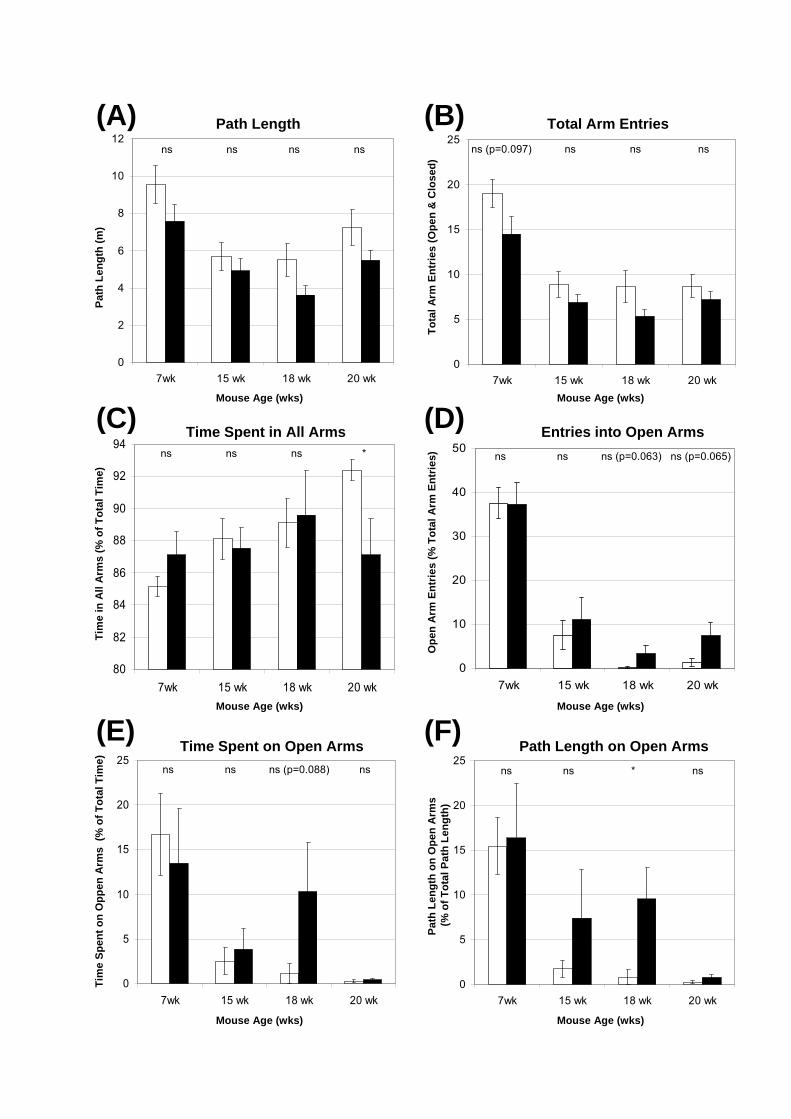
6.3.2.3. Elevated Plus Maze Assessment with Disease Progression
Age-matched, male unaffected and MPS IIIA congenic mice were assessed in the
Elevated Plus Maze for 5 min each. The 7-, 15-, 18- and 20-wk naïve groups were tested on
different days. The data presented for the 7-wk-old male mice are the same as that described
in the previous section. At each time point, the unaffected mice tended to be more active than
the age-matched MPS IIIA mice, as seen by increases in path length and total arm entries
(Fig. 6.8A, B). However, neither of these measures were statistically significant although the
total arm entries at 7-wks approached significance (p=0.097). The percentage of time spent in
all arms gradually increased as the unaffected mice aged (Fig. 6.8C), indicating that the mice
were spending less time in the centre square. In comparison, the percentage of time spent in
all arms remained relatively constant for MPS IIIA males.
The most striking changes were observed in the measures involving open arm
exploration. The percentage of entries into the open arms, time spent on the open arms and
path length on the open arms were significantly elevated in the 7-wk-old male mice of both
genotypes compared to the older age groups (Fig. 6.8D-F). MPS IIIA mice had more open
arm entries than unaffected mice at 15-, 18- and 20-wks, with the latter two time-points
marginally significant (p=0.063, 0.065; Fig. 6.8D). Likewise, the percentage of time spent on
the open arms was elevated in MPS IIIA animals at 15-, 18- and 20-wks, and at 15-wks the
differences were approaching significance (p=0.088; Fig. 6.8E). At all time points the MPS
IIIA animals had a greater percentage of path length on the open arms compared to unaffected
mice and this elevation was significant at 18-wks (p=0.0158, Fig. 6.8F).
6.3.2.4. Effect of Repeated Testing in the Elevated Plus Maze at 18-wks
To test the influence of prior maze experience, congenic male mice of both disease
groups were tested at 15- and 18-wks (same group that was scored manually at 15-wks of age
in Section 6.3.2.1) and the results obtained at 18-wks were compared with data collected from
the naïve-tested animals at 18-wks of age (the same mice detailed in Section 6.3.2.3). The
group size for the repeat-tested mice at 18-wks was larger (n=9 for each genotype) than when
they were originally tested at 15-wks (n=6 for each genotype). This was because some of the
data from the 15-wk trials were lost due to problems with the video camera during the manual
scoring procedure (e.g. not capturing the entire 10 min trial, the video camera shifting mid-
trial so that the position of the animal was not clear).
- 153 -
Figure 6.8: Elevated Plus Maze in male mice of various ages. Naïve groups of unaffected
or MPS IIIA male mice were tested in the Elevated Plus Maze at 7-, 15-, 18- or 20-wks of
age. The path of each mouse was automatically tracked for 5 min and the data analysed using
independent t-tests. The measures assessed included the (A) total path length (metres); (B)
total arm entries (i.e. entries into open and closed arms); (C) percentage of time spent in all
arms; (D) open arm entries (as a percentage of total entries into all arms); (E) time spent on
the open arms (as a percentage of total time spent in arms); and (F) path length on the open
arms (as a percentage of total path length). Data are the mean of each measure ± 1 SEM. The
t-test p-value for comparisons made between unaffected and MPS IIIA at each age is
displayed and p-values approaching significance (p=0.05-0.1) are also indicated. * p=0.01-
0.05.
Unaffected (n=7-11)
MPS IIIA (n=9-11)
- 154 -
0
5
10
15
20
25
7wk 15 wk 18 wk 20 wk
0
10
20
30
40
50
7wk 15 wk 18 wk 20 wk
0
5
10
15
20
25
7wk 15 wk 18 wk 20 wk
0
2
4
6
8
10
12
7wk 15 wk 18 wk 20 wk
(A) (B)
(C) (D)
(E) (F)
Tim
eS
pen
to
nO
pp
en
Arm
s (
%o
f T
ota
l T
ime
)T
ime
in
All
Arm
s (
% o
f T
ota
lT
ime)
Pa
th L
en
gth
(m
)
Path Length Total Arm Entries
Mouse Age (wks) Mouse Age (wks)
ns ns ns ns
0
5
10
15
20
25
7wk 15 wk 18 wk 20 wk
ns (p=0.097) ns ns ns
Pa
thL
en
gth
on
Op
en
Arm
sO
pen
Arm
En
trie
s(%
To
tal
Arm
En
trie
s)
To
tal
Arm
En
trie
s (
Op
en
& C
los
ed
)
(% o
f T
ota
l P
ath
Le
ng
th)
80
82
84
86
88
90
92
94
7wk 15 wk 18 wk 20 wk
Time Spent in All Arms Entries into Open Arms
Mouse Age (wks) Mouse Age (wks)
ns ns ns * ns ns ns (p=0.063) ns (p=0.065)
Time Spent on Open Arms Path Length on Open Arms
Mouse Age (wks) Mouse Age (wks)
ns ns * nsns ns ns (p=0.088) ns
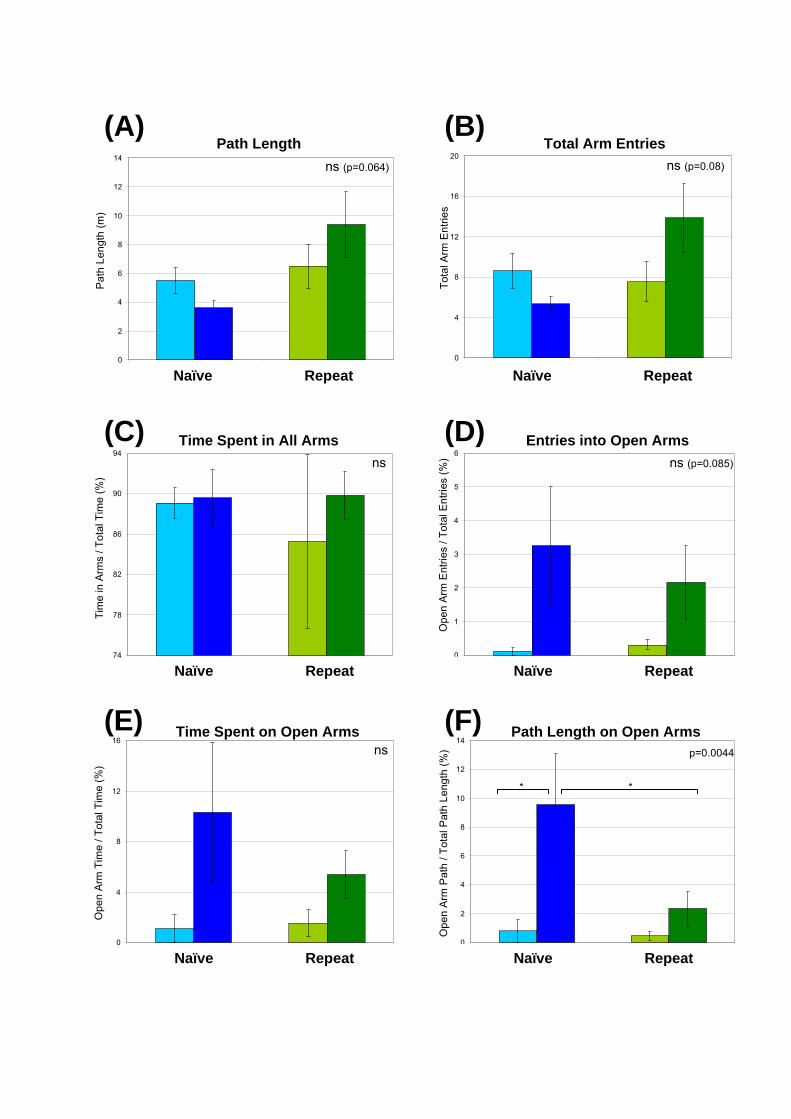
At 18-wks of age, mice which had been previously tested in the Elevated Plus Maze
had different behavioural profiles to mice that were naïve to the apparatus. Naïve MPS IIIA
mice were less active than naïve unaffected mice as indicated by reduced path lengths and
total arm entries (Fig. 6.9A, B). Repeat testing had no effect on the activity of unaffected
mice (Fig. 6.9A, B). In contrast, repeat-tested MPS IIIA mice were more active than naïve-
tested MPS IIIA mice to a level that was approaching statistical significance (path length
ANOVA p=0.064; total arm entries ANOVA p=0.08; Fig. 6.9A, B). The percentage of time
spent in all arms was similar for both naïve- and repeat-tested mice (Fig. 6.9C).
Interestingly, the repeat-tested MPS IIIA mice were less likely to explore the open
arms compared to naïve-tested MPS IIIA mice, with reductions observed in the number of
entries into the open arms as well as the percentage of time and path length spent on the open
arms (Fig. 6.9D-F). Repeat-tested, unaffected mice had slightly more open arm entries and
percentage of time spent on the open arms than naïve unaffected mice, suggesting that prior
maze experience marginally reduced the anxiety in unaffected animals (Fig. 6.9D, E). Whilst
similar profiles were observed in all measures of open arm exploration (MPS IIIA mice were
more active than unaffected mice, repeat-testing reduced the level of exploration on the open
arms by MPS IIIA mice compared to naïve-tested MPS IIIA mice), significant differences
were only detected in the percentage of path length on the open arms (ANOVA p=0.0044;
Fig. 6.9F) with a significant reduction in exploration observed in repeat-tested MPS IIIA
mice compared to naïve-tested mice of the same genotype (post test p<0.05, t=2.724).
- 155 -
Figure 6.9: Effect of repeat testing of 18-wk-old mice in the Elevated Plus Maze. Male
congenic mice underwent a 5 min trial in the Elevated Plus Maze at 18-wks of age. Mice
were either naïve to the Elevated Plus Maze apparatus or had previously been tested at 15-
wks of age. An automated tracker and Maze 2020 software were used to record the path of
the animal. The p-value of the one-way ANOVA analyses is presented for each measure.
The parameters assessed were: (A) total path length; (B) total arm entries; (C) percentage
of time spent in all arms; (D) percentage of entries into the open arms; (E) percentage of
time spent in the open arms; and (F) percentage of path length on the open arms. Data are
presented as the mean 1 SEM. The ANOVA p-value is displayed in the corner of each
graph and significant (p<0.05) comparisons from the post test are also shown (*).
Unaffected Naïve Tested (n=11)
MPS IIIA Naïve Tested (n=9)
Unaffected Repeat Tested (n=9)
MPS IIIA Repeat Tested (n=9)
0
4
8
12
16
20
1 2
0
2
4
6
8
10
12
14
1 2
0
4
8
12
16
1 2
74
78
82
86
90
94
1 2
0
1
2
3
4
5
6
1 2
0
2
4
6
8
10
12
14
1 2
Path Length Total Arm Entries
Time Spent in All Arms Entries into Open Arms
Time Spent on Open Arms Path Length on Open Arms
Naïve Repeat Naïve Repeat
Pa
th L
en
gth
(m)
To
tal A
rm E
ntr
ies
Tim
e in
Arm
s /
To
tal T
ime
(%
)
Op
en
Arm
En
trie
s /
To
tal E
ntr
ies (
%)
Op
en
Arm
Tim
e/
To
tal T
ime
(%
)
Op
en
Arm
Pa
th /
To
talP
ath
Le
ng
th (
%)
(A) (B)
(C) (D)
(E) (F)
Naïve Repeat Naïve Repeat
Naïve Repeat Naïve Repeat
ns (p=0.064)
ns (p=0.085)ns
ns p=0.0044
ns (p=0.08)
**
6.4. DISCUSSION
Memory and Learning Deficits in MPS IIIA Mice
In this study, congenic male MPS IIIA mice at 16-wks of age displayed significant
memory and learning impairments in the learning or acquisition phase compared to unaffected
controls. The difference observed was not the result of variations in swim speeds between the
disease and control groups. These data support previous findings outlining that C57Bl/6 mice
are “good learners” in the Morris Water Maze. Wild-type C57Bl/6 mice outperform
BALB/cByJ, BALB/c, 129/SvEvBrd, DBA/2J, 1291/SvlmJ, BTBR T + tf/tf, A/J, C3H/HeJ
(retinal degeneration), FVB/NJ (retinal degeneration) strains in the Morris Water Maze
(Upchurch and Wehner, 1988; Zaharia et al, 1996; Wahlsten et al, 2005; Van Dam et al,
2006).
Prior to undertaking the study detailed within this chapter, several Morris Water Maze
tests had been conducted in 14- to 20-wk-old congenic mice by other researchers (Crawley et
al, 2006a, unpublished results, LDRU). The earlier experiments established the necessity to
increase the inter-trial interval from 2 min to approximately 10 min and to raise the water
temperature from the 21-25 C used for the “New York” strain to 25 C 1 C to prevent
hypothermia in the congenic mice (Crawley et al, 2006a). Learning is inhibited by
hypothermia caused by low water temperatures and/or short inter-trial intervals (Iivonen et al,
2003). In studies conducted by other LDRU researchers in the congenic MPS IIIA mice, the
latencies were manually recorded and the mice were held in the corridor adjacent to the
testing room until immediately prior to testing. However, in the present study, alterations to
the classification levels of holding rooms within the Animal House resulted in the plan of the
Animal House being modified such that the access point to the PC2 holding room was now
situated across the corridor from the behavioural testing room, greatly increasing the amount
of foot traffic and noise in the corridor during testing. It was decided that whilst it was not
ideal to keep mice in the testing room throughout the behavioural assessments, this option
would provide greater reproducibility and control of experimental conditions.
Spatial Cognition and Neuropathology in MPS IIIA
Several brain regions have been implicated in spatial learning, as assessed by the
Morris Water Maze, including the hippocampus, striatum, basal forebrain, cerebellum and
neocortex (reviewed extensively in D'Hooge and De Deyn, 2001). The importance of the
hippocampus in spatial memory has been demonstrated using a virtual computer simulation of
- 156 -
the Morris Water Maze task in 10 human patients with unilateral hippocampal resections
(Astur et al, 2002). Similar results have been obtained in C57Bl/6 mice receiving unilateral or
bilateral chemical lesions in the hippocampus (Logue et al, 1997; Gerlai et al, 2002). Mild
lysosomal storage within the dentate gyrus of the hippocampus has been documented in a 24-
wk-old, vehicle-treated MPS IIIA mouse (n=1; Savas et al, 2004). In addition, 2- to 10-
month-old MPS IIIA mice (n=6) display moderate to high amounts of HS storage as well as
secondary storage of GM2 and GM3 gangliosides and cholesterol in the hippocampus
(McGlynn et al, 2004). These pathological changes may have contributed to the spatial
learning impairments observed in the MPS IIIA mice during the acquisition phase of the
Morris Water Maze.
However, no statistically significant differences were observed between the two
disease groups at 16-wks of age when the efficacy of memory transfer was tested in the probe
phase. It is possible that prior behavioural training (in the open field activity and Elevated
Plus Maze) in the fortnight prior to Morris Water Maze testing may have contributed to the
lack of overall significant differences in the probe phase. The behavioural profile of mice is
greatly influenced by the training history (i.e. naïve-tested versus battery-tested) of the mice
(discussed further in Chapter 7; McIlwain et al, 2001; Voikar et al, 2004). In combination
with the comparable escape latency and path length measures on the final day of the
acquisition phase, these data suggest that both unaffected and MPS IIIA mice ultimately
learnt the position of the platform, although the rate of learning was slower in MPS IIIA mice.
Consequently, subsequent Morris Water Maze assessments undertaken in congenic mice were
performed at a later stage of disease progression, at approximately 20-wks of age (Chapter
7).
Manual and Automated Scoring of 15-wk-old Male Mice
The design of the Elevated Plus Maze was based on that described in Crawley (2000).
A comprehensive appraisal by questionnaire of approximately 30 research groups revealed a
great deal of variability in both the design (presence/absence of open arm ledges, colour of
floor and walls, dimensions of the maze) and the testing procedures (bright or dim
illumination, the use of red lights, length of trial, method of scoring) for the Elevated Plus
Maze (Hogg, 1996). A grey maze floor (which influences the maze brightness) was
considered as the percentage of time that male C57Bl/10J mice spent exploring the open arms
was greater when using a grey floor compared to a white floor (Lamberty and Gower, 1996).
However, we ultimately selected a white floor to improve the contrast, and thus accuracy, of
the automated HVS tracker system.
- 157 -
In the pilot study, 15-wk-old mice explored the maze apparatus for 10 min. The
percentage of time spent in open arm exploration was significantly higher in MPS IIIA mice
compared to unaffected controls in both the first and second halves of testing (5 min blocks).
However, the MPS IIIA mice appeared to habituate over the course of the trial with less time
spent in the open arms during the second block of testing. Similar observations were made
over the course of 5 min trials when the path of the mice was assessed in 1 min increments
(Rodgers et al, 1996; Zhu et al, 2006). To avoid habituation in the MPS IIIA mice, the
subsequent maze trials were conducted for 5 min.
At 15-wks of age, MPS IIIA mice were significantly more likely to spend a greater
percentage of time on the open arms (scored manually) over the 5 min trial (p=0.02)
compared to analysis with Maze 2020 software. Considerable variation in this parameter was
observed with manual scores of 2.0% and 29.5% and automated scores of 2.5% and 3.8% for
unaffected and MPS IIIA mice, respectively. Part of this variation may be attributed to the
way in which an open arm entry is defined: for manual scoring, an open arm entry is defined
as “the two front paws crossing into the open arm”, whilst for the automated scoring the
software follows the “nominal centre” of the animal (usually the rear haunches as this
provides the greatest colour contrast; Mr Richard Baker, HVS Image, personal
communication). Consequently, the majority of an animal’s torso is required to enter into the
open arm for the automated tracker system to classify the movement as an ‘open arm entry’,
and is likely to reduce the number of open arm scores when compared to the ‘two front paws’
definition of an open arm entry. Better comparisons may have been drawn between the
manually-assessed and Maze 2020-calculated data if the definition of an open arm entry was
revised so that the whole body was required to cross into an arm to be counted as an entry in
the manual assessments.
In addition, the manually-assessed mice were housed randomly (i.e. single- or group-
housed) whilst all 15-wk-old mice scored with the automated system were group-housed.
Long-term individual housing (7-wks prior to testing) significantly reduced anxiety-like
behaviours in male C57Bl/6JolaHsd mice, with faster open arm latencies and higher
percentages of open arm entries and time spent on the open arms when tested in the Elevated
Plus Maze (Voikar et al, 2005). Altered emotional behaviours were also detected after social
isolation in alternative anxiety tests (novel cage, dark-light test, hyponeophagia) (Voikar et al,
2005). Furthermore, male and female C57Bl/6 mice housed in isolation for 4-months before
testing were less fearful than their environmentally-enriched/group-housed counter-parts in
the Elevated Plus Maze (Zhu et al, 2006). As a result of the behavioural changes described in
- 158 -
these published studies, great care was taken in this study to standardise the housing
conditions. Data from single- and group-housed animals has not been combined in the
following, automatically-assessed studies.
Female Mice are More Anxious than Male Mice
It has been widely reported that human females have a greater tendency for depressive
and/or anxiety-related disorders, and by age six, females are twice as likely as males to have
experienced an anxiety disorder (Breslau et al, 1995; Lewinsohn et al, 1998). In an attempt to
determine whether behavioural distinctions related to the gender of the mice were evident, 7-
wk-old unaffected and MPS IIIA animals of each gender were assessed. Male mice were
found to be significantly less fearful/anxious than females as measured by the percentage of
entries into the open arms. This finding was supported by the trends observed in the time and
path length spent on the open arms. Similar observations were made when C57Bl/6NIA mice
were tested in an Elevated Plus Maze (Frick et al, 2000), with males tending to be less
anxious than females (time spent in the open arms, entries into the open arms) and significant
gender differences were detected at 17-months of age for parameters influenced by
locomotion (time in closed arms, closed arm entries).
These findings contrast with the Elevated Plus Maze results presented by Teixeira et
al (2004) where no gender effect was observed between Swiss male and female mice in the
diestus phase of the estrous cycle. Furthermore, when 5 common mouse genetic strains of
each gender were tested, there were statistically insignificant gender-associated changes in the
Elevated Plus Maze, although male mice tended to be less fearful than the females of the
corresponding strain in 4 of the 5 strains (Voikar et al, 2001). Due to the gender-related
differences observed in this study, subsequent behavioural experiments were only conducted
with male mice.
Male Mice are Less Active and Display More Anxiety-Related Behaviours with Age
A longitudinal study was conducted using unaffected and MPS IIIA mice ranging
from 7- to 20-wks of age. Both disease groups were less active with age, as seen by reduced
path lengths and total arm entries. Similar to the hypoactivity displayed by MPS IIIA mice at
6- to 15-wks in the open-field activity testing (Hemsley and Hopwood, 2005), MPS IIIA mice
were less active in the Elevated Plus Maze compared to unaffected controls at every time
point assessed.
- 159 -
Younger mice (7-wks of age) were more prone to reckless behaviour than the older
mice (15- to 20-wks) with young/adolescent mice spending more time in the central platform
and exhibiting a greater level of open arm exploration (entries into the open arms, percentage
of time spent on the open arms and percentage of path length on the open arms). These
observations mirror those described by Macri et al (2002), where adolescent mice (~7-wks)
were approximately 80% more likely to enter an open arm and spend a significantly higher
proportion of time in the open arms compared to adult mice (~9-wks). This is further
supported by studies where younger (5-month-old) female C57Bl/6NIA mice had
significantly more open arm entries and spent a greater percentage of time on the open arms
than 17-month-old females (Frick et al, 2000). Comparable trends have also been observed
using rats of various ages (Imhof et al, 1993; Boguszewski and Zagrodzka, 2002).
Effect of Repeated Testing
In this study, unaffected mice displayed nearly identical values when tested naïvely or
when retested for all of the measures assessed. This conflicts with the results reported in
vehicle-treated mice (Rodgers et al, 1996; Espejo, 1997) or rats (Fernandes and File, 1996;
Bertoglio and Carobrez, 2000) in the Elevated Plus Maze where a marked decrease was
observed in the percentage of open arm entries and time spent on the open arms when retested
1- to 7-days after the initial exposure. When unaffected congenic male mice are tested in the
open field, the mice with previous exposure to the test eventually habituate to the testing
arena and are hypoactive and less exploratory than naïve mice (Allison Crawley, LDRU,
unpublished results; Crawley et al, 2006a). In comparison, MPS IIIA mice tend to have
similar or higher levels of open field activity after re-testing which may indicate that the
affected mice do not effectively remember the testing apparatus and continue to actively
explore the open field (LDRU unpublished results; Crawley et al, 2006a).
Naïve and repeat-tested MPS IIIA mice display reduced anxiety/fearfulness at 18-wks
of age compared to wild-type controls in all parameters assessed (entries into the open arms,
percentage of time spent on the open arms, percentage of path length on the open arms). In
contrast to the data collected from unaffected mice, 18-wk-old MPS IIIA mice with previous
exposure to the maze appeared to habituate during re-testing, with reductions for all anxiety-
related measures (entries into the open arms, percentage of path length and time spent on the
open arms). Based on these observations, it was decided that repeated testing altered the
behavioural profile of MPS IIIA mice in the Elevated Plus Maze and consequently mice in
subsequent studies were only tested once at a single time-point (Chapter 7).
- 160 -
Reduced Anxiety in MPS IIIA Mice
The amygdala of the brain has been implicated in influencing anxiety or fearfulness in
humans (Richardson et al, 2000, as reviewed in Davis, 1992; Rauch et al, 2003). The
accumulation and distribution of storage material has been studied in four models of MPS
disease (MPS I, IIIA, IIIB and VII) in mice ranging in age from 2- to 10-months (McGlynn et
al, 2004). The amygdala is a major site of neuropathology in these diseases, with high to
intense HS storage reported in all of the models assessed (McGlynn et al, 2004). In addition,
appreciable accumulation of glycosphingolipids (GM2 and GM3 gangliosides), free cholesterol
and autofluorescent storage material was also observed in the amygdala of MPS mice
(McGlynn et al, 2004).
The occurrence of behavioural problems, including hyperactivity, disruptive
tendencies and poor impulse control has been documented in Sanfilippo children (Nidiffer
and Kelly, 1983). Qualitative increases in anxiety were also reported with 64% of affected
children displaying fear/anxiety when parents (n=30) were assessed via questionnaire
(Nidiffer and Kelly, 1983). Our quantitative findings using the Elevated Plus Maze support
those in MPS IIIB mice (Cressant et al, 2004), suggesting that MPS IIIA and MPS IIIB mice
are significantly less anxious than their wild-type counterparts.
6.5. SUMMARY AND CONCLUSIONS
The Morris Water Maze revealed spatial learning differences between unaffected and
MPS IIIA congenic male mice at 16-wks. However, MPS IIIA mice eventually learnt the
position of the hidden escape platform, displaying comparable escape latencies to those of
unaffected animals. This indicates that the disease impairs the speed at which learning occurs
in MPS IIIA mice.
Furthermore, the Elevated Plus Maze was developed to measure anxiety-related and
emotional behaviour. Significant gender-related differences were detected at 7-wks of age,
with males more inclined to explore the open arms than the female mice. The best
discrimination between MPS IIIA and control groups of males was obtained at 18-wks of age.
The analyses conducted in this chapter provided the baseline evaluations of different aspects
of the MPS IIIA behavioural phenotype. This characterisation was essential to enable the
evaluation of the functional effect of CAV-NS-mediated therapy.
- 161 -
CHAPTER 7:
Therapeutic Assessment of Gene Transfer
in Newborn MPS IIIA Mice
7.1. INTRODUCTION
In the experiments detailed in the previous chapters, the administration of CAV-NS
vector in newborn mice resulted in widespread GFP expression in the brains of injected mice
(Chapter 5). Dose-dependent transgene expression was observed for both the rhNS and GFP
transgenes, with the optimal titre determined to be 109 particles/hemisphere (Chapter 5).
Neither antibodies towards rhNS nor neutralising antibodies to the CAV-2 capsid were
detected in PBS- or CAV-NS-injected-mice (Chapter 5). In addition, the behavioural
phenotype of MPS IIIA mice was thoroughly characterised, both in Chapter 6 and by other
members of the LDRU in studies independent of this thesis, to provide an insight into the
functional changes resulting from NS deficiency.
The major aim of the experiments described in this chapter was to determine whether
early intervention with the CAV-NS vector could improve the clinical outcome in MPS IIIA
mice in long-term studies using the methods developed and validated in the preceding
chapters.
7.2. SPECIFIC METHODS
7.2.1. Evan’s Blue Toxicity Test
To determine whether Evan’s Blue dye (used to illuminate the cerebral ventricles
during injection) was toxic to CAV-2 vectors, 1x10⁵ DKCre cells/well were plated in 24-well
trays and incubated overnight at 37 C. A series of dilutions were prepared from a 0.2% (w/v)
solution of filter-sterilised Evan’s Blue Dye diluted in PBS, combined with an equal volume
of 20 particles/cell CAV-GFP, and the mixture was then applied to DKCre cells to give a final
concentration of 0.1% (w/v) Evan’s Blue dye in the most concentrated samples. Twenty-four
hrs post-inoculation, quadruplicate samples were analysed by flow cytometry to quantitate the
number of GFP-positive cells (Section 2.2.9).
- 162 -
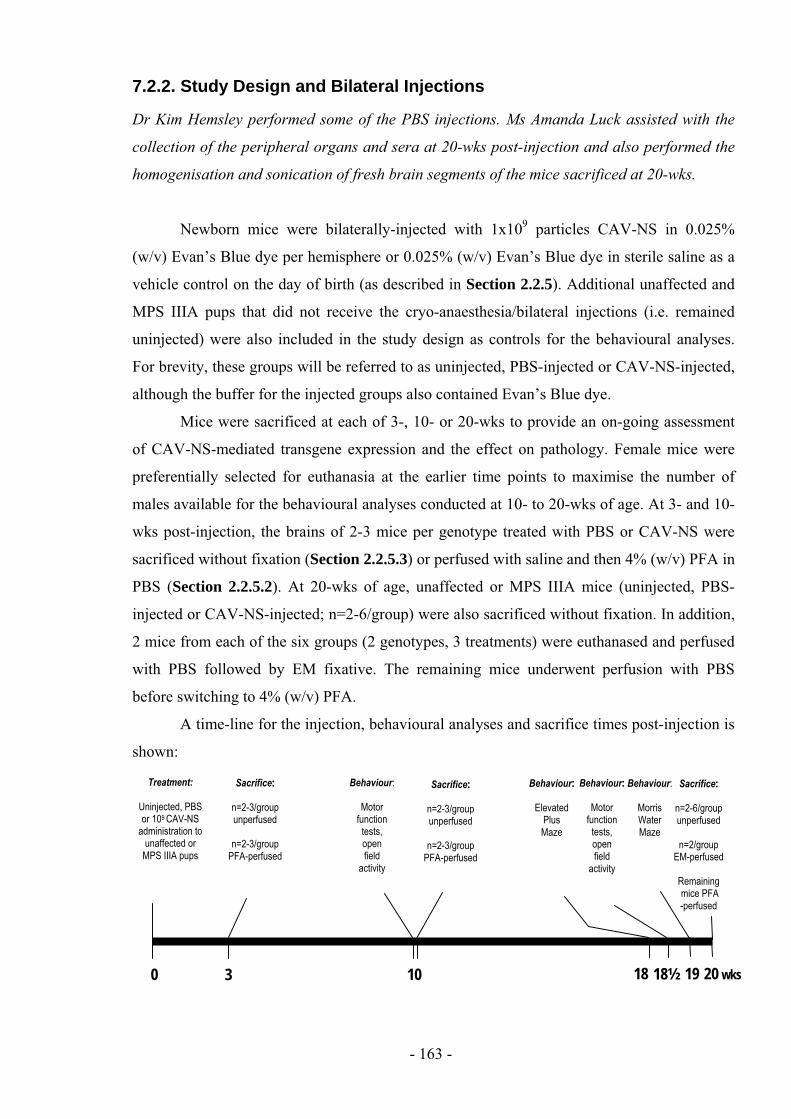
7.2.2. Study Design and Bilateral Injections
Dr Kim Hemsley performed some of the PBS injections. Ms Amanda Luck assisted with the
collection of the peripheral organs and sera at 20-wks post-injection and also performed the
homogenisation and sonication of fresh brain segments of the mice sacrificed at 20-wks.
Newborn mice were bilaterally-injected with 1x10⁹ particles CAV-NS in 0.025%
(w/v) Evan’s Blue dye per hemisphere or 0.025% (w/v) Evan’s Blue dye in sterile saline as a
vehicle control on the day of birth (as described in Section 2.2.5). Additional unaffected and
MPS IIIA pups that did not receive the cryo-anaesthesia/bilateral injections (i.e. remained
uninjected) were also included in the study design as controls for the behavioural analyses.
For brevity, these groups will be referred to as uninjected, PBS-injected or CAV-NS-injected,
although the buffer for the injected groups also contained Evan’s Blue dye.
Mice were sacrificed at each of 3-, 10- or 20-wks to provide an on-going assessment
of CAV-NS-mediated transgene expression and the effect on pathology. Female mice were
preferentially selected for euthanasia at the earlier time points to maximise the number of
males available for the behavioural analyses conducted at 10- to 20-wks of age. At 3- and 10-
wks post-injection, the brains of 2-3 mice per genotype treated with PBS or CAV-NS were
sacrificed without fixation (Section 2.2.5.3) or perfused with saline and then 4% (w/v) PFA in
PBS (Section 2.2.5.2). At 20-wks of age, unaffected or MPS IIIA mice (uninjected, PBS-
injected or CAV-NS-injected; n=2-6/group) were also sacrificed without fixation. In addition,
2 mice from each of the six groups (2 genotypes, 3 treatments) were euthanased and perfused
with PBS followed by EM fixative. The remaining mice underwent perfusion with PBS
before switching to 4% (w/v) PFA.
A time-line for the injection, behavioural analyses and sacrifice times post-injection is
shown:
io
Sacrifice:
n=2-6/groupunperfused
n=2/groupEM-perfused
Remaining mice PFA -perfused
Behaviour:
MorrisWaterMaze
Behaviour:
Motorfunction
tests,openfield
activity
Behaviour:
ElevatedPlusMaze
Behaviour:
Motorfunction
tests,openfield
activity
Sacrifice:
n=2-3/groupunperfused
n=2-3/groupPFA-perfused
Sacrifice:
n=2-3/groupunperfused
n=2-3/groupPFA-perfused
Treatment:
Uninjected, PBSor 109 CAV-NS
administrat n tounaffected or
MPS IIIA pups
18 19 20 wks18½0 103
- 163 -
In several of the figures and tables presented in this chapter, data from the preceding
chapters are also presented to better allow comparisons between CAV-NS doses (ranging
from 5x10⁶ to 1x10
9 particles/hemisphere in Chapter 5 versus 1x10
9 particles/hemisphere in
this chapter; Fig. 7.7 and Table 7.4), at various times post-treatment (1- or 6-wks post-
injection in Chapter 5 versus 3-, 10- or 20-wks post-injection in this chapter; Figs. 7.9, 7.10)
or between groups of mice in the behavioural analyses (non-battery-tested mice described in
Chapter 6 versus battery-tested mice in this chapter; Fig. 7.5). In addition, based on the
results in this chapter, data obtained from further analysis of samples collected from mice
described in Chapter 5 (CAV-NS dose of 1x10⁹ particles/hemisphere, sacrificed 1-wk post-
injection) are presented in Table 7.2 and Fig 7.18.
7.2.3. Behavioural Test Battery
Behavioural testing and data processing were performed without knowledge of the
treatment and genotype of the animals (i.e. blinded). Statistical analyses were performed
using a one-way ANOVA for the data collected at each individual time-point followed by a
post-test calculation with GraphPad software (http://graphpad.com/quickcalcs/posttest2.cfm).
This comparison uses a Bonferroni correction factor to adjust for multiple comparisons. The
alpha value was set at 0.05 with a 95% confidence level.
Timing of Behavioural Tests
Gait, negative geotaxis, neuromuscular grip strength and open field locomotor activity
were originally validated in the “New York” mixed mouse strain (Hemsley and Hopwood,
2005) and then compared to the congenic strain (LDRU unpublished observations and
Crawley et al, 2006a). For this study, male mice were battery-tested in a series of tests
examining locomotion, cognition and emotional behaviours (similar to components of the
behavioural phenotyping battery reviewed in Crawley, 1999). Animals were born over a 9-
day period. The distribution of the date of births of the male mice was as follows, with the
number of mice born each day shown in parentheses: day 1 (n=3); day 2 (n=2); day 3 (n=1);
day 4 (n=8); day 5 (n=8); day 6 (n=12); day 7 (n=11); day 8 (n=11); and day 9 (n=17). The
reported age at which each behavioural test was performed in this chapter is based on the age
of mice born on the sixth day. Mice were housed in same-sex groups of 8-10 animals per
cage. All males were separated into single cages at approximately 15-wks of age due to
aggression in some mice.
- 164 -
Motor function (gait, negative geotaxis, neuromuscular grip strength) was investigated
at 10-wks. The mice were naïve-tested in open field activity 2-days later (10-wks). At 18-wks
of age, mice were randomly divided into two groups for the Elevated Plus Maze and
underwent one trial on either of two consecutive days after overnight acclimatisation to the
behaviour room. Three- or 4-days later, mice were again examined in the motor function tests
(18.5-wks) and then open field activity the following day. Mice were then divided on the
basis of age into two groups and assessed in the Morris Water Maze with the habituation day
performed at approximately 19-wks of age for each group. The latter test was performed over
two consecutive weeks. Mice were sacrificed at 20-wks of age.
7.2.3.1. Gait
The walking pattern of mice was assessed in a walled corridor lined with paper with a
width of approximately 12 cm and a length of 50 cm. A darkened goal box was positioned at
the end of the corridor. The hind paws of each mouse were dipped into non-toxic food
colouring and the mouse allowed to freely walk towards the goal box. At least two sets of
tracks were assessed for each mouse with a minimum of three pairs of footprints included in
the analysis. The mean length of the right and left strides (length) and the perpendicular
distance between each stride (width) were assessed. The first and last two sets of footprints
were not included in the analysis due to changes in speed associated with initiating movement
and slowing down as the mouse approached the goal box.
7.2.3.2. Negative Geotaxis
Immediately following the gait analysis, mice were positioned on a wire grid (15 x 30
cm) and slowly rotated vertically so that the mouse was facing downwards. The time taken for
the mouse to re-position itself so that it was facing towards the ceiling was determined up to a
maximum of 30 sec.
7.2.3.3. Neuromuscular Grip Strength
Mice were placed onto a horizontal wire grid suspended 50 cm above a container
filled with soft bedding material. Grid squares were 1 cm2. The time taken for mice to fall
from the grid from a single attempt up to a maximum of 60 secs was recorded.
- 165 -
7.2.3.4. Open Field Locomotor Activity
After overnight acclimatisation to the behaviour room, mice were tested between 7 am
and 1 pm in a plastic enclosure divided into 15 zones in a 5 x 3 grid formation. Each zone had
dimensions of 9 x 10 cm. Mice were placed facing the corner closest to the operator
(designated south-east) and the number of line crossings, rears (both fore-legs not in contact
with the floor) and faecal boli were manually recorded over 3 min. The HVS tracker system
equipped with Field 2020 software (version 10/20/04) determined path length and the total
number of cell entries. The open field was swabbed with 70% (v/v) ethanol between trials.
7.2.3.5. Elevated Plus Maze
Male mice were tested at 18-wks of age as described in Section 6.2.4. The mice were
acclimatised in the testing room overnight and randomly allocated to one of two consecutive
days of testing. The group tested on the second day was kept in the testing room during the
first day of testing and for an additional night. Several trials were excluded due to inaccurate
tracking by the automated Maze 2020 software prior to unblinding the identity of each mouse.
7.2.3.6. Amendments to Morris Water Maze Protocol
The mice born on days 1-7 and 7-9 (n=34, n=33, respectively) were tested in a 7-day
protocol (day 0 habituation phase, days 1-5 acquisition phase, day 6 probe phase) over 2
consecutive weeks. Between the performing of experiments described in Chapter 6 and the
present study, changes were made to the Morris Water Maze protocol based on observations
made within the LDRU. These included the use of a curtain to surround the pool to obscure
all visual cues on the habituation day (e.g. stationary cues such as the experimenter, sink, door
etc) and a more visible marker on the platform (a brightly-coloured paperweight
approximately 10 cm in height). To habituate each mouse, they were placed into the pool at
each of the cardinal points in succession (4 trials in total with an inter-trial interval of
approximately 5-10 min) whilst the platform remained located in the north-eastern quadrant.
Mice were swum in a different, random order each day of the acquisition and probe
phases (based on a random number table) and were warmed on heat pads between trials. For
the acquisition phase, the platform was located in the north-western quadrant. The operator
was blinded to the identity and the treatment group of the mice. Due to hardware failure on
the first day of the acquisition phase during the first week of testing, the data from this group
was only recorded manually. Mice underwent four trials in the probe phase beginning at each
of the four cardinal points.
- 166 -
7.2.4. Measurement of Anti-GFP Antibody Titres
The ELISA detection method used to assay for the presence of anti-rhNS antibodies in
sera (Section 2.2.10) was adapted to test whether a humoral response was being generated
against the GFP protein in CAV-treated mice. The coating antigen was recombinant GFP
protein (5 g/well). A mouse monoclonal anti-GFP antibody (1/125 diluted in blocking
solution) was used as a positive control. All other assay procedures were conducted as
previously described (Section 2.2.10).
7.2.5. NS Activity Time-course in Mixed, Primary Neural Cells
Newborn, primary cell cultures derived from unaffected mice were harvested and
plated into four 6-well trays (Section 2.2.2.1). Seven-days post-plating, the cells were mixed
with 1000 particles/cell of CAV-NS in complete media (or media only as a control) and
cultured under standard conditions. Cells were viewed using an inverted fluorescent
microscope to confirm GFP expression. The conditioned media was collected at harvest (days
3, 6 or 9 post-transduction) and stored at 4 C. For the wells yet to be harvested, the cells were
fed with an additional 2 mL/well of fresh complete media. The cell layer was harvested as
described in Section 2.2.2.3, resuspended in 200 L of 20 mM Tris/0.5 M NaCl (pH 7.0) and
the cell contents liberated by six alternate cycles of freezing/thawing. NS activity in
conditioned media and cell extract samples was determined as detailed in Section 2.2.12, after
dialysis overnight in 0.2 M sodium acetate (pH 5.0), and was normalised to total cellular
protein (Section 2.2.13).
7.2.6. CytoTox-OneTM Membrane Integrity Assay
Unaffected primary murine neural cells derived from newborn or adult mice were
plated into 6-well trays as described in Section 2.2.2.1. Seven-days post-plating, duplicate
samples were mixed with 100 or 1000 particles/cell of CAV-GFP or CAV-NS vector in
complete primary cell culture media excluding the sodium pyruvate supplement in a volume
of 3 mL/well. Untransduced cells (treatment negative control) and media without cells (assay
negative control) were also included. The media was not replaced after inoculation.
After 2- or 7-days post-treatment, the conditioned media was removed and an assay
positive control well corresponding to 100% lysis/cytotoxicity was also prepared by adding
12 L of lysis buffer/well. The lactate dehydrogenase activity was measured as detailed in the
- 167 -
manufacturer’s instructions as an indicator of membrane integrity and cytotoxicity in the
CAV-NS-treated cells. In brief, triplicate wells containing 100 L of sample per well were
aliquoted into 96-well tissue culture trays, mixed with an equal volume of cytotoxic substrate
and mixed for 30 sec on the Milenia plate shaker (Micromix 4, Biomediq; setting 5). After
incubation at 22-24 C in the dark for 10 min, 50 L stop buffer per well was added, mixed for
10 sec and the fluorescence read on a Victor2 (1420 Multilabel counter, Wallac, Finland) with
an excitation of 544 nm and an emission of 590 nm. The percentage of cytotoxicity was
determined using the following equation:
% Cytotoxicity = (Experimental – Culture Medium Background) x 100%
(Maximum LDH Release - Culture Medium Background)
7.3. RESULTS
7.3.1. Evan’s Blue Toxicity to CAV-NS Vector Particles
To improve the consistency and reproducibility of targeting the lateral ventricles of
newborn mice, the use of Evan’s Blue dye in the dilution buffer was considered. However, it
was first necessary to determine if the dye was toxic to CAV-2 vectors (Section 7.2.1). No
significant differences in transduction efficiencies were observed in the samples containing
Evan’s Blue dye, even at the highest concentration (0.1% (w/v) final concentration), when
compared to viral particles in the absence of dye (unpaired t-test, p=0.4475; Table 7.1).
It was noted that the recommended concentration of 0.1% (w/v) Evan’s Blue dye for
newborn injections (Dr Allison Crawley, personal communication) produced very strong and
intense colour in the cell culture media. Consequently a lower dose of 0.025% (w/v) Evan’s
Blue dye was examined in vivo in the first instance in an attempt to minimise the exposure of
the pups and CAV-NS particles to high concentrations of dye. Visualisation of the lateral
ventricles was sufficient using 0.025% (w/v) Evan’s Blue dye and consequently all PBS
vehicle control and CAV-NS-treated mice were injected with Evan’s Blue dye at this
concentration.
- 168 -
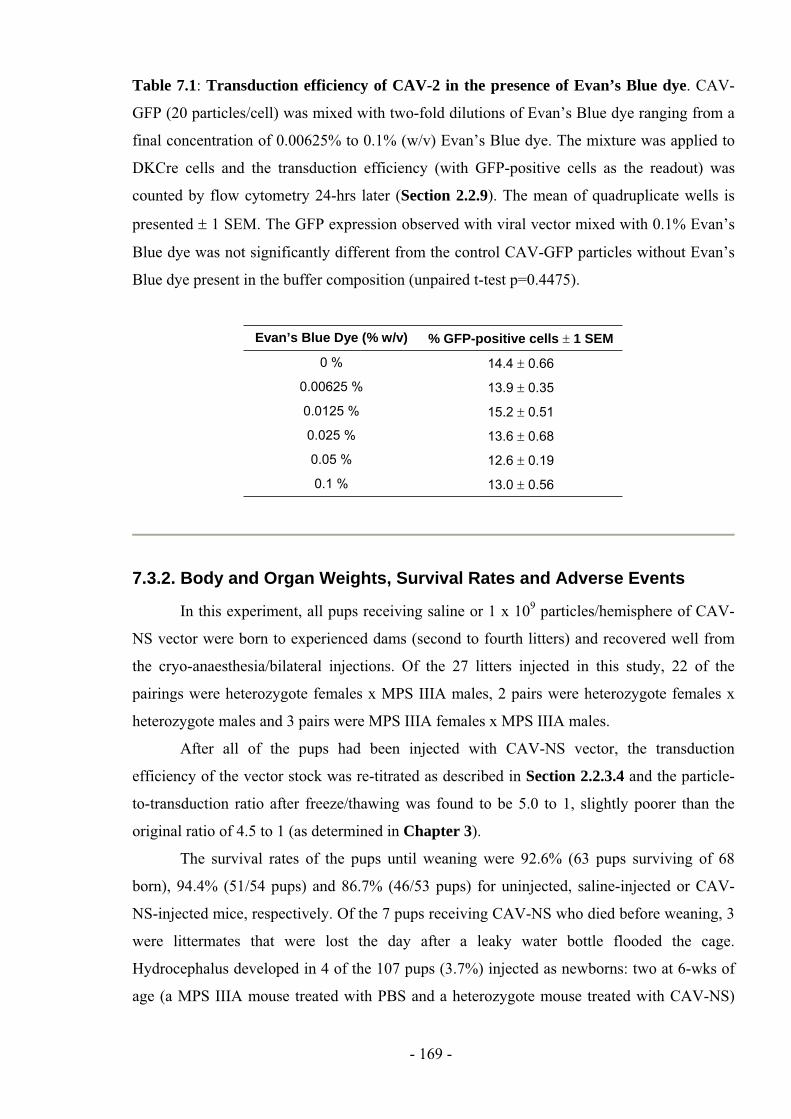
Table 7.1: Transduction efficiency of CAV-2 in the presence of Evan’s Blue dye. CAV-
GFP (20 particles/cell) was mixed with two-fold dilutions of Evan’s Blue dye ranging from a
final concentration of 0.00625% to 0.1% (w/v) Evan’s Blue dye. The mixture was applied to
DKCre cells and the transduction efficiency (with GFP-positive cells as the readout) was
counted by flow cytometry 24-hrs later (Section 2.2.9). The mean of quadruplicate wells is
presented 1 SEM. The GFP expression observed with viral vector mixed with 0.1% Evan’s
Blue dye was not significantly different from the control CAV-GFP particles without Evan’s
Blue dye present in the buffer composition (unpaired t-test p=0.4475).
Evan’s Blue Dye (% w/v) % GFP-positive cells 1 SEM
0 % 14.4 0.66
0.00625 % 13.9 0.35
0.0125 % 15.2 0.51
0.025 % 13.6 0.68
0.05 % 12.6 0.19
0.1 % 13.0 0.56
7.3.2. Body and Organ Weights, Survival Rates and Adverse Events
In this experiment, all pups receiving saline or 1 x 10⁹ particles/hemisphere of CAV-
NS vector were born to experienced dams (second to fourth litters) and recovered well from
the cryo-anaesthesia/bilateral injections. Of the 27 litters injected in this study, 22 of the
pairings were heterozygote females x MPS IIIA males, 2 pairs were heterozygote females x
heterozygote males and 3 pairs were MPS IIIA females x MPS IIIA males.
After all of the pups had been injected with CAV-NS vector, the transduction
efficiency of the vector stock was re-titrated as described in Section 2.2.3.4 and the particle-
to-transduction ratio after freeze/thawing was found to be 5.0 to 1, slightly poorer than the
original ratio of 4.5 to 1 (as determined in Chapter 3).
The survival rates of the pups until weaning were 92.6% (63 pups surviving of 68
born), 94.4% (51/54 pups) and 86.7% (46/53 pups) for uninjected, saline-injected or CAV-
NS-injected mice, respectively. Of the 7 pups receiving CAV-NS who died before weaning, 3
were littermates that were lost the day after a leaky water bottle flooded the cage.
Hydrocephalus developed in 4 of the 107 pups (3.7%) injected as newborns: two at 6-wks of
age (a MPS IIIA mouse treated with PBS and a heterozygote mouse treated with CAV-NS)
- 169 -
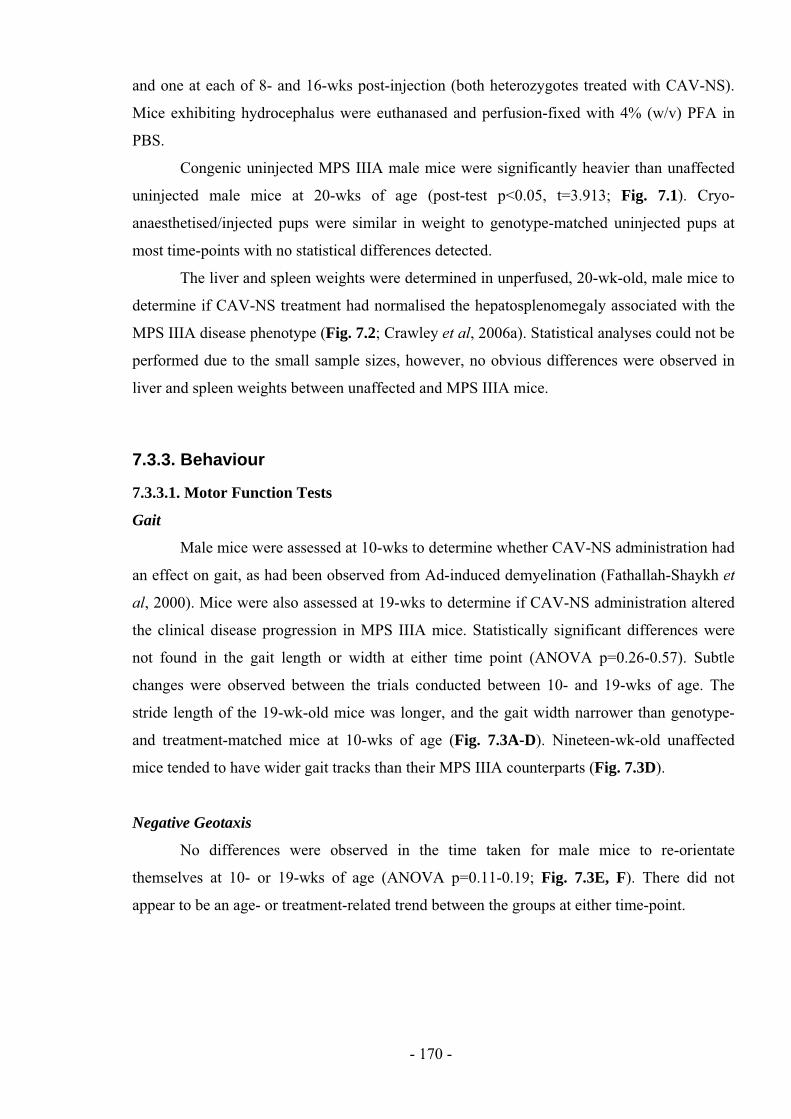
and one at each of 8- and 16-wks post-injection (both heterozygotes treated with CAV-NS).
Mice exhibiting hydrocephalus were euthanased and perfusion-fixed with 4% (w/v) PFA in
PBS.
Congenic uninjected MPS IIIA male mice were significantly heavier than unaffected
uninjected male mice at 20-wks of age (post-test p<0.05, t=3.913; Fig. 7.1). Cryo-
anaesthetised/injected pups were similar in weight to genotype-matched uninjected pups at
most time-points with no statistical differences detected.
The liver and spleen weights were determined in unperfused, 20-wk-old, male mice to
determine if CAV-NS treatment had normalised the hepatosplenomegaly associated with the
MPS IIIA disease phenotype (Fig. 7.2; Crawley et al, 2006a). Statistical analyses could not be
performed due to the small sample sizes, however, no obvious differences were observed in
liver and spleen weights between unaffected and MPS IIIA mice.
7.3.3. Behaviour
7.3.3.1. Motor Function Tests
Gait
Male mice were assessed at 10-wks to determine whether CAV-NS administration had
an effect on gait, as had been observed from Ad-induced demyelination (Fathallah-Shaykh et
al, 2000). Mice were also assessed at 19-wks to determine if CAV-NS administration altered
the clinical disease progression in MPS IIIA mice. Statistically significant differences were
not found in the gait length or width at either time point (ANOVA p=0.26-0.57). Subtle
changes were observed between the trials conducted between 10- and 19-wks of age. The
stride length of the 19-wk-old mice was longer, and the gait width narrower than genotype-
and treatment-matched mice at 10-wks of age (Fig. 7.3A-D). Nineteen-wk-old unaffected
mice tended to have wider gait tracks than their MPS IIIA counterparts (Fig. 7.3D).
Negative Geotaxis
No differences were observed in the time taken for male mice to re-orientate
themselves at 10- or 19-wks of age (ANOVA p=0.11-0.19; Fig. 7.3E, F). There did not
appear to be an age- or treatment-related trend between the groups at either time-point.
- 170 -
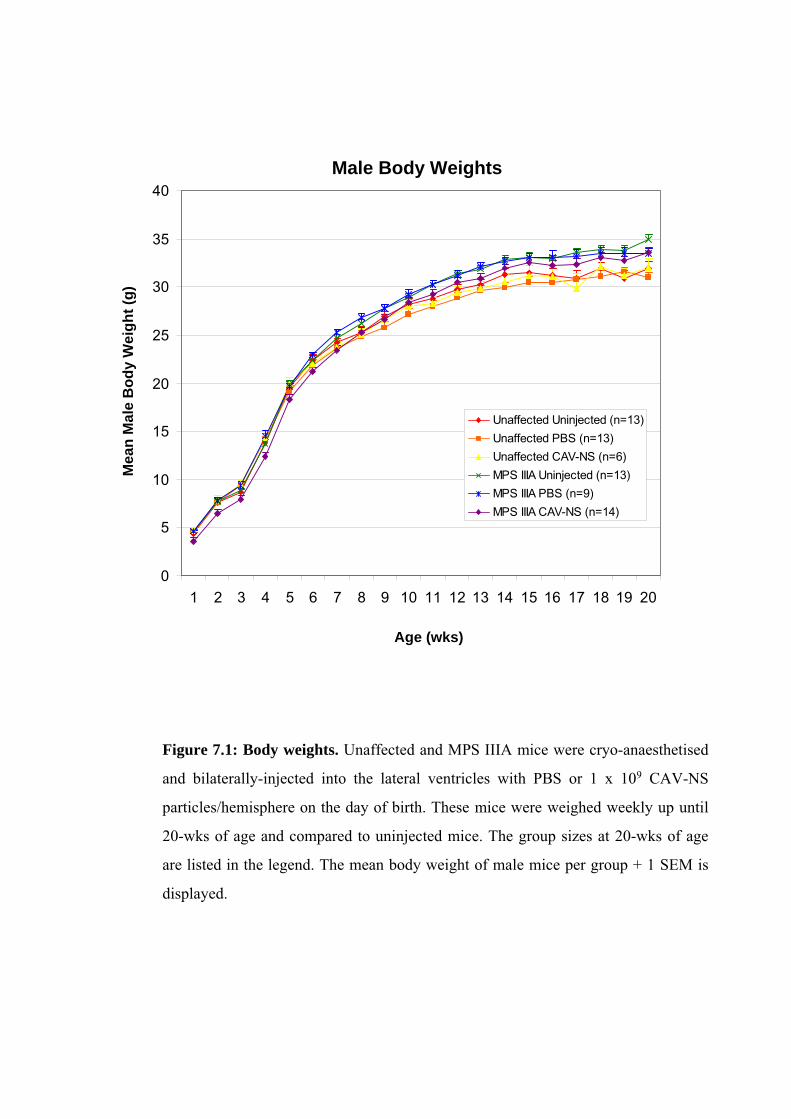
Age (wks)
Me
an
Ma
leB
od
y W
eig
ht
(g)
0
5
10
15
20
25
30
35
40
1 2 3 4 5 6 7 8 9 10 11 12 13 14 15 16 17 18 19 20
Unaffected Uninjected (n=13)
Unaffected PBS (n=13)
Unaffected CAV-NS (n=6)
MPS IIIA Uninjected (n=13)
MPS IIIA PBS (n=9)
MPS IIIA CAV-NS (n=14)
Male Body Weights
Figure 7.1: Body weights. Unaffected and MPS IIIA mice were cryo-anaesthetised
and bilaterally-injected into the lateral ventricles with PBS or 1 x 10⁹ CAV-NS
particles/hemisphere on the day of birth. These mice were weighed weekly up until
20-wks of age and compared to uninjected mice. The group sizes at 20-wks of age
are listed in the legend. The mean body weight of male mice per group + 1 SEM is
displayed.
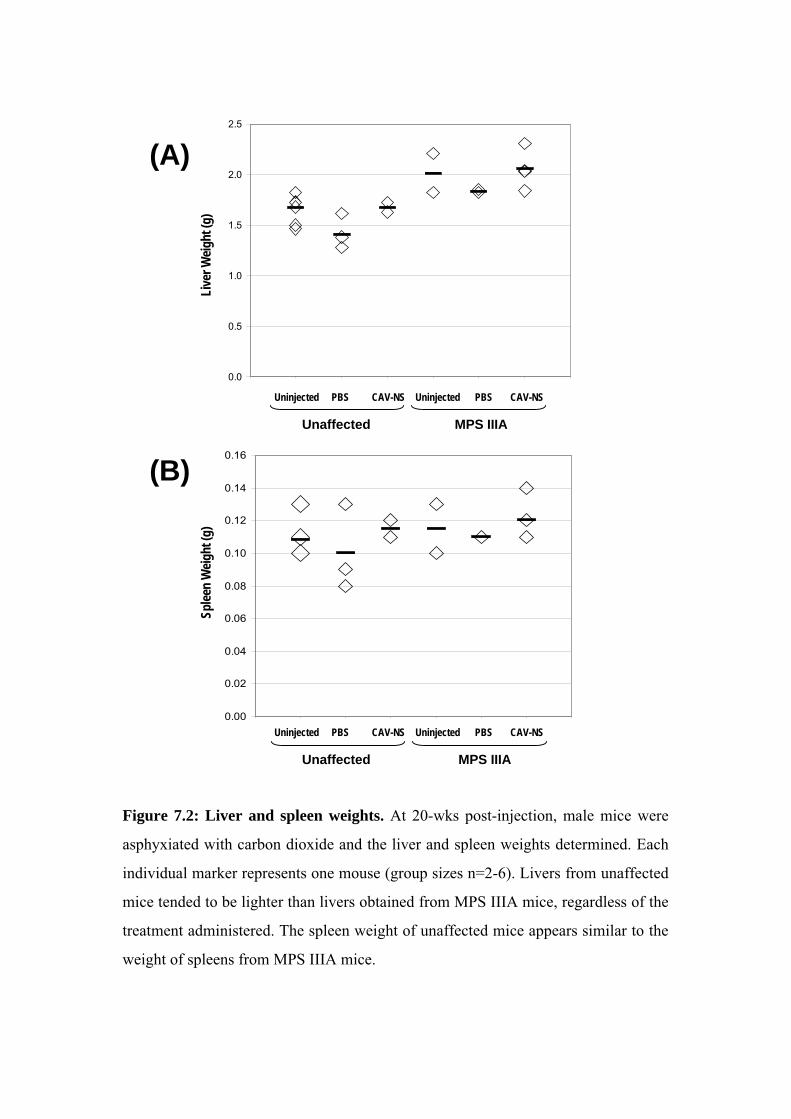
Uninjected PBS CAV-NS Uninjected PBS CAV-NS
Unaffected MPS IIIA
(A)
(B)
Uninjected PBS CAV-NS Uninjected PBS CAV-NS
Unaffected MPS IIIA
0.0
0.5
1.0
1.5
2.0
2.5
0.00
0.02
0.04
0.06
0.08
0.10
0.12
0.14
0.16
0 1 2 3 4 5 6 7Uninjected PBS CAV-NS Uninjected PBS CAV-NS
Unaffected MPS IIIA
Sp
leen
Wei
gh
t (g
) L
iver
Wei
gh
t (g
)
Figure 7.2: Liver and spleen weights. At 20-wks post-injection, male mice were
asphyxiated with carbon dioxide and the liver and spleen weights determined. Each
individual marker represents one mouse (group sizes n=2-6). Livers from unaffected
mice tended to be lighter than livers obtained from MPS IIIA mice, regardless of the
treatment administered. The spleen weight of unaffected mice appears similar to the
weight of spleens from MPS IIIA mice.
Figure 7.3: Motor Function. Male mice were subjected to a battery of non-invasive
behavioural tests. The motor function of the mice was assessed at 10-wks (left column; A, C,
E, G) or 19-wks (right column; B, D, F, H) of age. The changes in the gait of the animals
were investigated by dipping the hind paws of the mice in non-toxic food colouring and
measuring the length (A, B) and width (C, D) of at least three strides in duplicate runs.
Immediately following the gait assessment, male mice were placed on a wire grid situated
over soft bedding material and orientated to face downwards. The time taken for the mouse to
re-position itself to face towards the ceiling (negative geotaxis, E, F) was measured up to a
maximum of 30 sec. Finally, the neuromuscular grip strength (G, H) of the animals was
evaluated by allowing the mice to hang from a wire grid and measuring the latency of the
mice to fall into soft bedding material up to a maximum of 60 sec. The mean of each measure
± 1 SEM is displayed. The ANOVA p-value is shown for each graph. Note that the y-axis is
the same scale between each row.
Group Size (n=)
Treatment 10 wks 19 wks
Unaffected Uninjected 13 13
Unaffected PBS 13 13
Unaffected CAV-NS 7 6
MPS IIIA Uninjected 13 13
MPS IIIA PBS 9 9
MPS IIIA CAV-NS 14 14
Unaffected
MPS IIIA
- 171 -
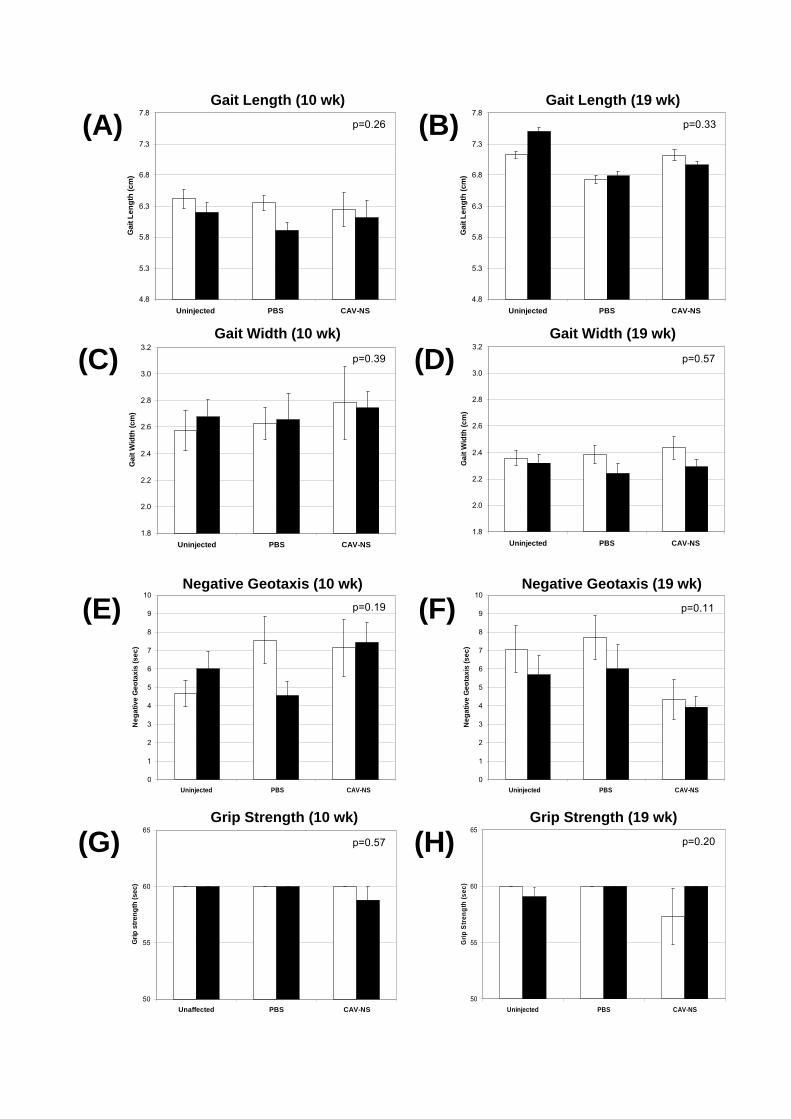
(A) (B)
(C) (D)
4.8
5.3
5.8
6.3
6.8
7.3
7.8
Uninjected PBS CAV-NS
Ga
it L
en
gth
(cm
)
4.8
5.3
5.8
6.3
6.8
7.3
7.8
Uninjected PBS CAV-NS
Ga
it L
en
gth
(cm
)
1.8
2.0
2.2
2.4
2.6
2.8
3.0
3.2
Uninjected PBS CAV-NS
Ga
it W
idth
(cm
)
1.8
2.0
2.2
2.4
2.6
2.8
3.0
3.2
Uninjected PBS CAV-NS
Ga
it W
idth
(c
m)
p=0.26
Gait Length (10 wk) Gait Length (19 wk)
Gait Width (10 wk) Gait Width (19 wk)
p=0.33
p=0.39 p=0.57
(E) (F)
(G) (H)
0
1
2
3
4
5
6
7
8
9
10
Ne
ga
tiv
e G
eo
tax
is(s
ec
)
0
1
2
3
4
5
6
7
8
9
10
Ne
ga
tive
Ge
ota
xis
(se
c)
50
55
60
65
Unaffected PBS CAV-NS
Gri
p s
tre
ng
th (
se
c)
50
55
60
65
Uninjected PBS CAV-NS
Gri
p S
tre
ng
th (
se
c)
Negative Geotaxis (10 wk) Negative Geotaxis (19 wk)
Grip Strength (10 wk) Grip Strength (19 wk)
p=0.19 p=0.11
p=0.57 p=0.20
Uninjected PBS CAV-NS Uninjected PBS CAV-NS
Neuromuscular Grip Strength
All mice performed well in the neuromuscular grip strength test (Fig. 7.3G,H) with
only 1 (at 10-wks of age) or 2 mice (at 19-wks of age) recording fails. Rather than falling off
the grid due to lack of neuromuscular strength, these mice appeared to fall while exploring the
wire matrix. No significant differences were measured between the treatment groups at either
time-point (ANOVA p=0.20-0.57).
7.3.3.2. Open Field Locomotor Activity
One male MPS IIIA mouse treated with PBS was excluded from all open field activity
tests due to anophthalmia in both eyes (i.e. had no eyes, a defect known to occur in the
C57Bl/6 strain of mice). At 10-wks of age, male MPS IIIA mice were less active than their
unaffected counterparts when assessed manually (Fig. 7.4A) and via an automated tracker
system (Fig. 7.4C, E; ANOVA p=0.018-0.031). Hypoactivity in MPS IIIA animals was
observed in all of the measures assessed (total activity encompassing both horizontal line-
crossing and vertical rearing exploration, path length and cell entries). Post-hoc test
comparisons revealed that no statistically significant differences were present for each of the
measures at 10-wks of age for the following pair-wise tests: unaffected uninjected versus
MPS IIIA uninjected; unaffected PBS versus MPS IIIA PBS; unaffected uninjected versus
unaffected PBS; MPS IIIA uninjected versus MPS IIIA PBS; unaffected PBS versus
unaffected CAV-NS; MPS IIIA PBS versus MPS IIIA CAV-NS.
When tested a second time at 19-wks of age, mice appeared less active than the
corresponding group at 10-wks. Similar to observations at 10-wks, 19-wk-old uninjected,
unaffected mice were more active than uninjected MPS IIIA mice (Fig. 7.4B, D, F), however,
no significant differences were measured (ANOVA p=0.53-0.63). This contrasts with the
trend observed in PBS-treated mice, with the MPS IIIA mice treated with PBS being more
active than the unaffected mice treated with PBS. CAV-NS treatment of MPS IIIA mice did
not appear to influence locomotor activity and exploration when compared to control
uninjected and PBS-treated MPS IIIA mice.
- 172 -
Figure 7.4: Open Field Activity. One- to 2-days after assessment in the motor function tests,
male mice underwent testing in the open field arena at 10-wks (A, C, E) or 19-wks (B, D, F)
of age. The testing enclosure consisted of a plastic, rectangular box arbitrarily divided into 15
cells, each with dimensions of 9 x 10 cm. Male mice were placed in the corner closest to the
operator and allowed to freely explore the enclosure for 3 min. The arena was cleaned
between trials with ethanol to remove scent trails. The total number of rears and lines crossed
in each trial were scored manually (A, B) to give an indication of total activity (vertical and
horizontal activity). An automated tracker system equipped with Field 2020 software was also
used to monitor the path of the animal, and the total path length in metres (C, D) and number
of cells entered (E, F) were calculated. The mean of each measure ± 1 SEM and the ANOVA
p-value is displayed for each parameter. Note that the y-axis is the same scale between each
row. ns, not significant.
Group Size (n=)
Treatment 10 wks 19 wks
Unaffected Uninjected 13 13
Unaffected PBS 13 13
Unaffected CAV-NS 7 6
MPS IIIA Uninjected 13 13
MPS IIIA PBS 8 8
MPS IIIA CAV-NS 14 14
Unaffected
MPS IIIA
- 173 -
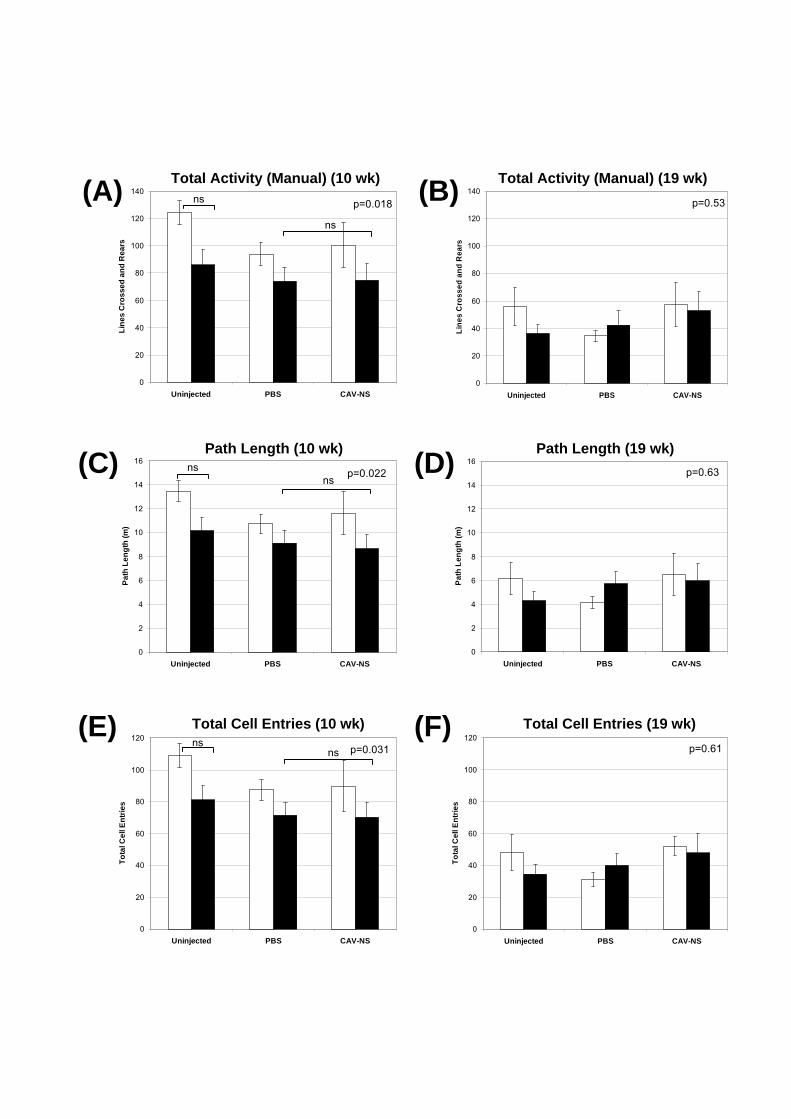
(A) (B)
0
20
40
60
80
100
120
140
Uninjected PBS CAV-NS
Lin
es
Cro
sse
d a
nd
Re
ars
0
20
40
60
80
100
120
140
Uninjected PBS CAV-NS
Lin
es
Cro
ss
ed
an
d R
ea
rs
(C) (D)
0
2
4
6
8
10
12
14
16
Uninjected PBS CAV-NS
Pa
th L
en
gth
(m)
0
2
4
6
8
10
12
14
16
Uninjected PBS CAV-NS
Pa
th L
en
gth
(m
)
(E) (F)
0
20
40
60
80
100
120
Uninjected PBS CAV-NS
To
tal C
ell E
ntr
ies
0
20
40
60
80
100
120
Uninjected PBS CAV-NS
To
tal C
ell
En
trie
s
Total Activity (Manual) (10 wk) Total Activity (Manual) (19 wk)
Path Length (10 wk) Path Length (19 wk)
Total Cell Entries (10 wk) Total Cell Entries (19 wk)
p=0.018 p=0.53
p=0.022 p=0.63
p=0.031 p=0.61
ns
ns
ns
ns
nsns
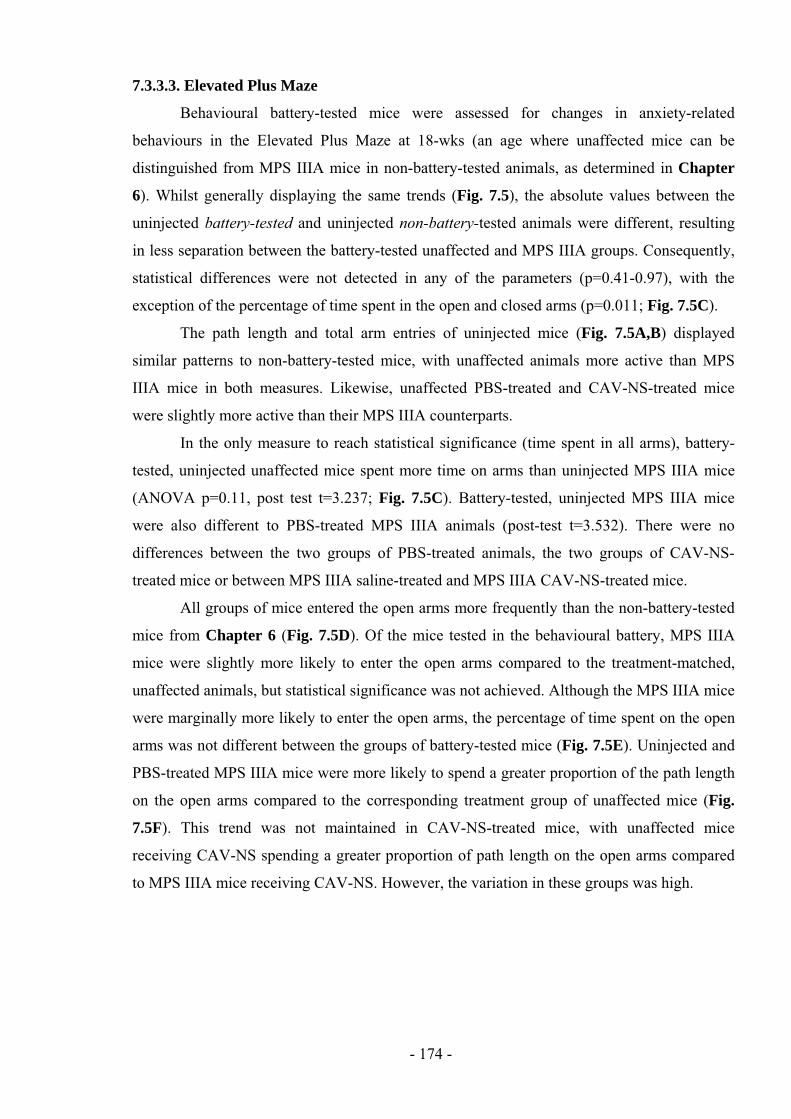
7.3.3.3. Elevated Plus Maze
Behavioural battery-tested mice were assessed for changes in anxiety-related
behaviours in the Elevated Plus Maze at 18-wks (an age where unaffected mice can be
distinguished from MPS IIIA mice in non-battery-tested animals, as determined in Chapter
6). Whilst generally displaying the same trends (Fig. 7.5), the absolute values between the
uninjected battery-tested and uninjected non-battery-tested animals were different, resulting
in less separation between the battery-tested unaffected and MPS IIIA groups. Consequently,
statistical differences were not detected in any of the parameters (p=0.41-0.97), with the
exception of the percentage of time spent in the open and closed arms (p=0.011; Fig. 7.5C).
The path length and total arm entries of uninjected mice (Fig. 7.5A,B) displayed
similar patterns to non-battery-tested mice, with unaffected animals more active than MPS
IIIA mice in both measures. Likewise, unaffected PBS-treated and CAV-NS-treated mice
were slightly more active than their MPS IIIA counterparts.
In the only measure to reach statistical significance (time spent in all arms), battery-
tested, uninjected unaffected mice spent more time on arms than uninjected MPS IIIA mice
(ANOVA p=0.11, post test t=3.237; Fig. 7.5C). Battery-tested, uninjected MPS IIIA mice
were also different to PBS-treated MPS IIIA animals (post-test t=3.532). There were no
differences between the two groups of PBS-treated animals, the two groups of CAV-NS-
treated mice or between MPS IIIA saline-treated and MPS IIIA CAV-NS-treated mice.
All groups of mice entered the open arms more frequently than the non-battery-tested
mice from Chapter 6 (Fig. 7.5D). Of the mice tested in the behavioural battery, MPS IIIA
mice were slightly more likely to enter the open arms compared to the treatment-matched,
unaffected animals, but statistical significance was not achieved. Although the MPS IIIA mice
were marginally more likely to enter the open arms, the percentage of time spent on the open
arms was not different between the groups of battery-tested mice (Fig. 7.5E). Uninjected and
PBS-treated MPS IIIA mice were more likely to spend a greater proportion of the path length
on the open arms compared to the corresponding treatment group of unaffected mice (Fig.
7.5F). This trend was not maintained in CAV-NS-treated mice, with unaffected mice
receiving CAV-NS spending a greater proportion of path length on the open arms compared
to MPS IIIA mice receiving CAV-NS. However, the variation in these groups was high.
- 174 -
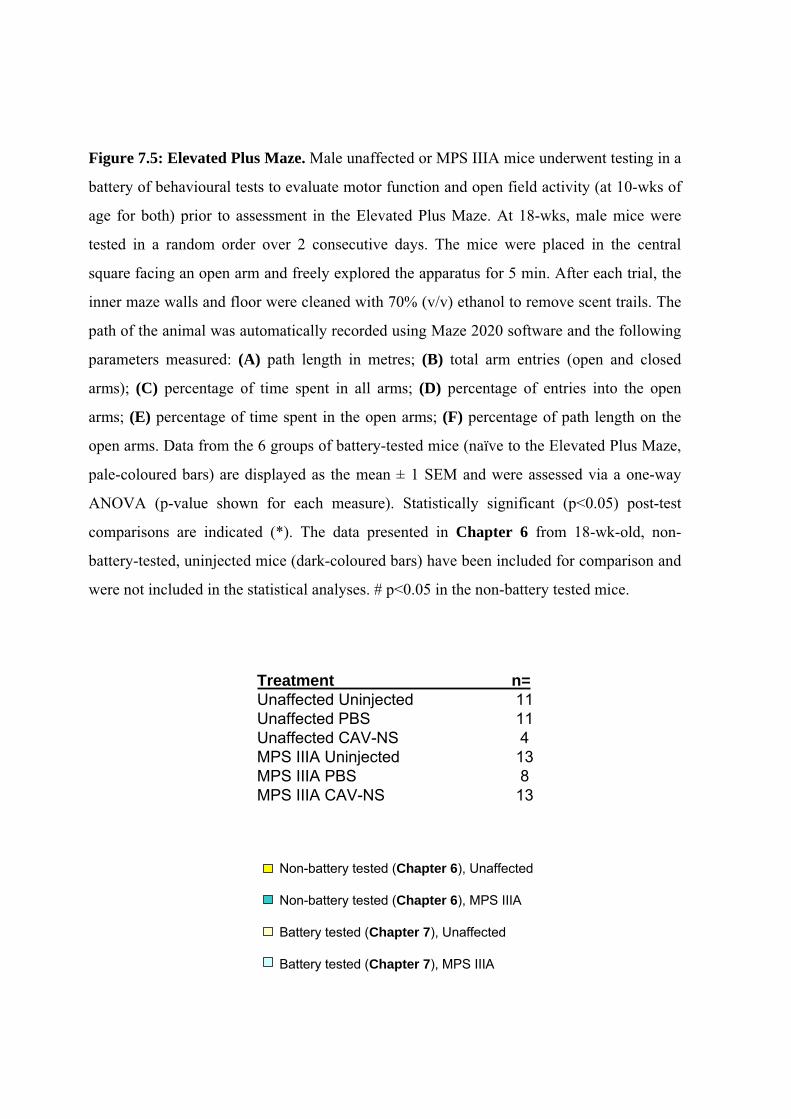
Figure 7.5: Elevated Plus Maze. Male unaffected or MPS IIIA mice underwent testing in a
battery of behavioural tests to evaluate motor function and open field activity (at 10-wks of
age for both) prior to assessment in the Elevated Plus Maze. At 18-wks, male mice were
tested in a random order over 2 consecutive days. The mice were placed in the central
square facing an open arm and freely explored the apparatus for 5 min. After each trial, the
inner maze walls and floor were cleaned with 70% (v/v) ethanol to remove scent trails. The
path of the animal was automatically recorded using Maze 2020 software and the following
parameters measured: (A) path length in metres; (B) total arm entries (open and closed
arms); (C) percentage of time spent in all arms; (D) percentage of entries into the open
arms; (E) percentage of time spent in the open arms; (F) percentage of path length on the
open arms. Data from the 6 groups of battery-tested mice (naïve to the Elevated Plus Maze,
pale-coloured bars) are displayed as the mean ± 1 SEM and were assessed via a one-way
ANOVA (p-value shown for each measure). Statistically significant (p<0.05) post-test
comparisons are indicated (*). The data presented in Chapter 6 from 18-wk-old, non-
battery-tested, uninjected mice (dark-coloured bars) have been included for comparison and
were not included in the statistical analyses. # p<0.05 in the non-battery tested mice.
Treatment n=
Unaffected Uninjected 11
Unaffected PBS 11
Unaffected CAV-NS 4
MPS IIIA Uninjected 13
MPS IIIA PBS 8
MPS IIIA CAV-NS 13
Non-battery tested (Chapter 6), Unaffected
Non-battery tested (Chapter 6), MPS IIIA
Battery tested (Chapter 7), Unaffected
Battery tested (Chapter 7), MPS IIIA
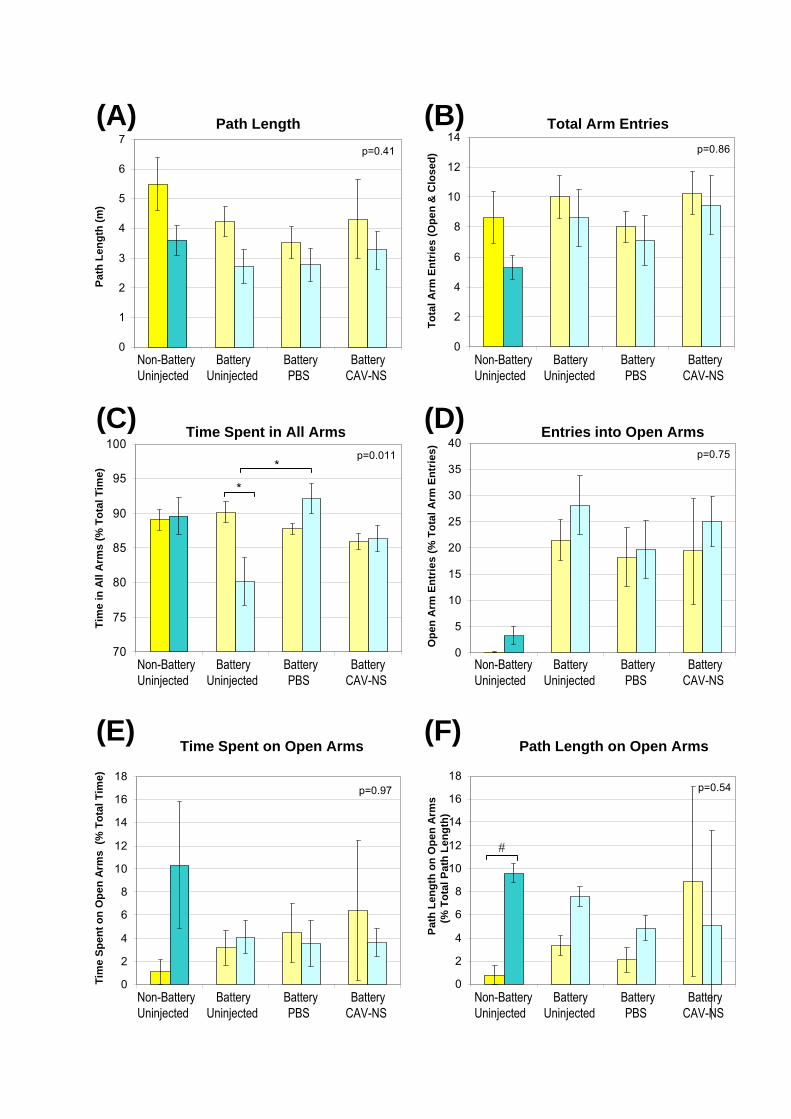
*
0
2
4
6
8
10
12
14
16
18
0
2
4
6
8
10
12
14
16
18
(A) (B)
(C) (D)
(E) (F)
70
75
80
85
90
95
100
0
5
10
15
20
25
30
35
40
0
2
4
6
8
10
12
14
0
1
2
3
4
5
6
7
Tim
e S
pe
nt
on
Op
en
Arm
s (
%T
ota
lT
ime
)T
ime
inA
llA
rms
(%
To
tal
Tim
e)
Pa
th L
en
gth
(m
)
Path Length Total Arm Entries
Pa
thL
en
gth
on
Op
en
Arm
sO
pen
Arm
En
trie
s(%
To
tal
Arm
En
trie
s)
To
tal
Arm
En
trie
s (
Op
en
& C
los
ed
)
(% T
ota
l P
ath
Le
ng
th)
Time Spent in All Arms Entries into Open Arms
Time Spent on Open Arms Path Length on Open Arms
p=0.41 p=0.86
p=0.011 p=0.75
p=0.97 p=0.54
#
Non-Battery Battery Battery Battery
Uninjected Uninjected PBS CAV-NS
Non-Battery Battery Battery Battery
Uninjected Uninjected PBS CAV-NS
Non-Battery Battery Battery Battery
Uninjected Uninjected PBS CAV-NS
Non-Battery Battery Battery Battery
Uninjected Uninjected PBS CAV-NS
Non-Battery Battery Battery Battery
Uninjected Uninjected PBS CAV-NS
Non-Battery Battery Battery Battery
Uninjected Uninjected PBS CAV-NS
*
*
7.3.3.4. Morris Water Maze
Male mice were tested at 19-wks of age for their memory and spatial learning ability
in the Morris Water Maze. Due to the large number of mice to be tested (n=67), the mice were
divided into 2 groups on the basis of their date of birth so that older mice were tested in the
first week (n=34) and the younger mice (n=33) in the second week. This strategy enabled
mice to be tested closer to exactly 19-wks of age by the same operator and at the same stage
of the day (i.e. morning to early afternoon).
The habituation phase was the only day where the automated tracker was functional in
both weeks of testing due to hardware break-down during the Morris Water Maze testing
conducted in the first week. Consequently, to determine whether testing over two consecutive
weeks had a significant effect, comparisons of each measure between week 1 and week 2 of
testing and between the 6 treatment groups (unaffected or MPS IIIA mice either uninjected, or
treated with PBS or CAV-NS) were made using a two-way ANOVA on the habituation day.
Mice tested in week 1 swam to the visible platform quicker than mice of the same
genotype/treatment in the following week on the habituation day (Fig. 7.6A). The faster
latency times of the mice tested in week 1 were marginally different (p=0.058) to the mice
swum in week 2 when controlling for a possible treatment group effect and was significantly
affected by the treatment group (p=0.042). Statistically significant (p 0.05) post-hoc pair-
wise comparisons were observed between the following pairs: unaffected uninjected and MPS
IIIA CAV-NS; unaffected CAV-NS and MPS IIIA uninjected; and unaffected CAV-NS and
MPS IIIA CAV-NS. For the path lengths on the habituation day (Fig. 7.6B), significant
differences were detected between the 2-wks of testing (p=0.025) but not between the 6
treatment groups (p=0.094), with mice tested in the first week swimming to the platform in a
shorter path length. The week in which the mice were tested did not significantly affect the
mean swim speeds (p=0.229, Fig. 7.6C), however, the treatment group of the mouse
influenced the swim speed (p=0.050). The least significant difference post-hoc tests showed
differences between the following groups: unaffected uninjected and MPS IIIA PBS;
unaffected PBS and MPS IIIA CAV-NS; MPS IIIA uninjected and MPS IIIA PBS; and MPS
IIIA PBS and MPS IIIA CAV-NS. In contrast, the percentage of time that mice swam in a
thigmotaxic pattern (Fig. 7.6D) was significantly reduced in the mice assessed in week 1
compared to those tested in week 2 (p=0.029), but was not affected by the treatment group of
the mouse (p=0.338).
- 175 -
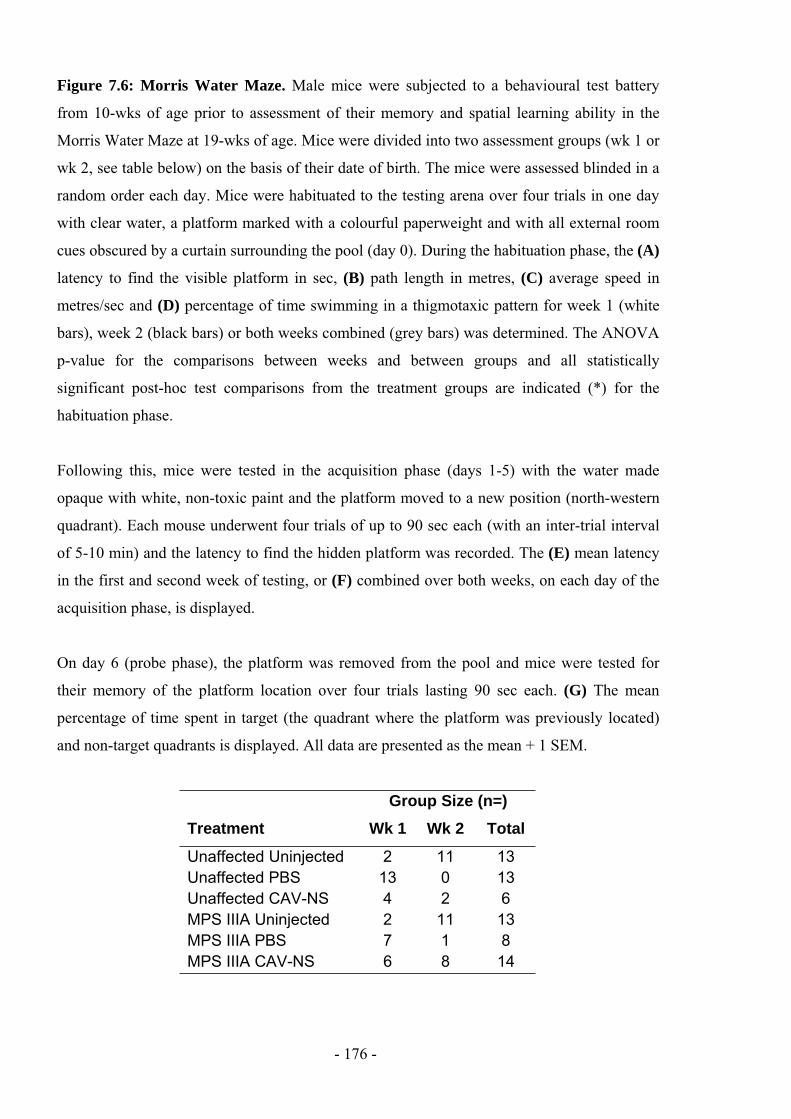
Figure 7.6: Morris Water Maze. Male mice were subjected to a behavioural test battery
from 10-wks of age prior to assessment of their memory and spatial learning ability in the
Morris Water Maze at 19-wks of age. Mice were divided into two assessment groups (wk 1 or
wk 2, see table below) on the basis of their date of birth. The mice were assessed blinded in a
random order each day. Mice were habituated to the testing arena over four trials in one day
with clear water, a platform marked with a colourful paperweight and with all external room
cues obscured by a curtain surrounding the pool (day 0). During the habituation phase, the (A)
latency to find the visible platform in sec, (B) path length in metres, (C) average speed in
metres/sec and (D) percentage of time swimming in a thigmotaxic pattern for week 1 (white
bars), week 2 (black bars) or both weeks combined (grey bars) was determined. The ANOVA
p-value for the comparisons between weeks and between groups and all statistically
significant post-hoc test comparisons from the treatment groups are indicated (*) for the
habituation phase.
Following this, mice were tested in the acquisition phase (days 1-5) with the water made
opaque with white, non-toxic paint and the platform moved to a new position (north-western
quadrant). Each mouse underwent four trials of up to 90 sec each (with an inter-trial interval
of 5-10 min) and the latency to find the hidden platform was recorded. The (E) mean latency
in the first and second week of testing, or (F) combined over both weeks, on each day of the
acquisition phase, is displayed.
On day 6 (probe phase), the platform was removed from the pool and mice were tested for
their memory of the platform location over four trials lasting 90 sec each. (G) The mean
percentage of time spent in target (the quadrant where the platform was previously located)
and non-target quadrants is displayed. All data are presented as the mean + 1 SEM.
Group Size (n=)
Treatment Wk 1 Wk 2 Total
Unaffected Uninjected 2 11 13
Unaffected PBS 13 0 13
Unaffected CAV-NS 4 2 6
MPS IIIA Uninjected 2 11 13
MPS IIIA PBS 7 1 8
MPS IIIA CAV-NS 6 8 14
- 176 -
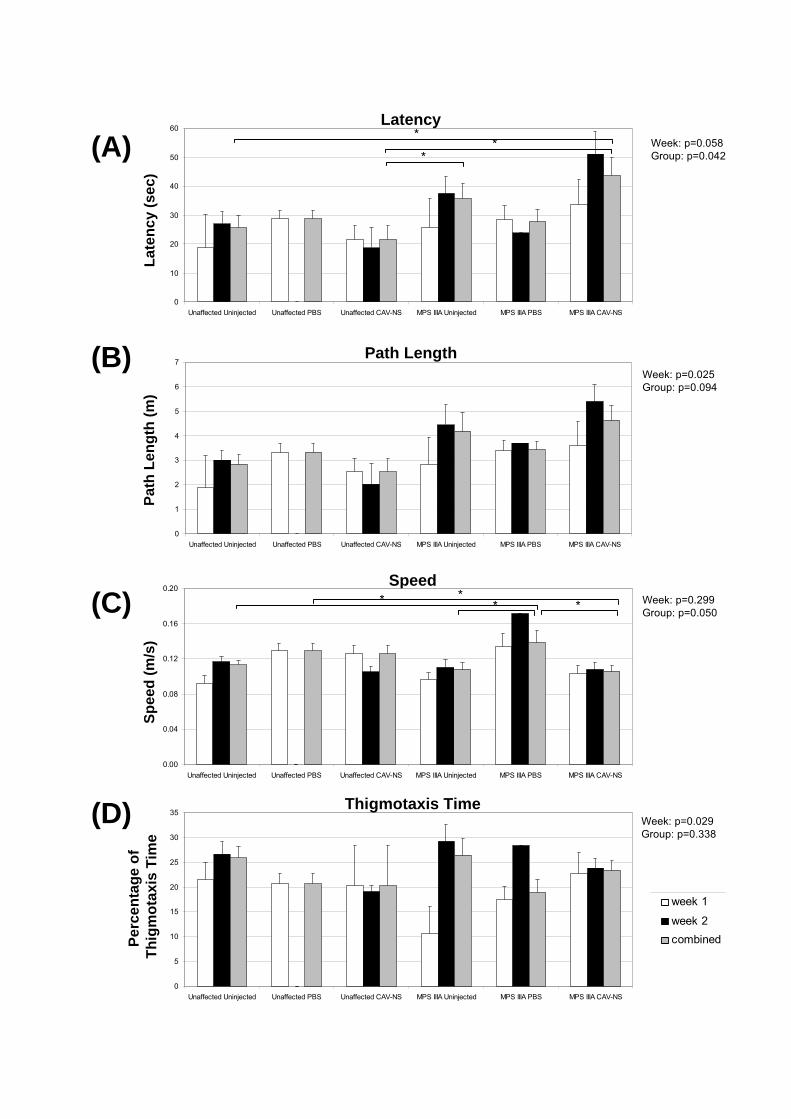
0
10
20
30
40
50
60
Unaffected Uninjected Unaffected PBS Unaffected CAV-NS MPS IIIA Uninjected MPS IIIA PBS MPS IIIA CAV-NS
0
5
10
15
20
25
30
35
Unaffected Uninjected Unaffected PBS Unaffected CAV-NS MPS IIIA Uninjected MPS IIIA PBS MPS IIIA CAV-NS
(A)
(B)
(C)
(D)
Latency
Path Length
Speed
Thigmotaxis Time
Pe
rce
nta
ge
of
Th
igm
ota
xis
Tim
eS
peed
(m
/s)
Pa
th L
en
gth
(m
)L
ate
nc
y (
se
c)
week 1
week 2
combined
Week: p=0.058
Group: p=0.042
Week: p=0.025
Group: p=0.094
Week: p=0.299
Group: p=0.050
Week: p=0.029
Group: p=0.338
0
1
2
3
4
5
6
7
Unaffected Uninjected Unaffected PBS Unaffected CAV-NS MPS IIIA Uninjected MPS IIIA PBS MPS IIIA CAV-NS
0.00
0.04
0.08
0.12
0.16
0.20
Unaffected Uninjected Unaffected PBS Unaffected CAV-NS MPS IIIA Uninjected MPS IIIA PBS MPS IIIA CAV-NS
*
**
* ** *
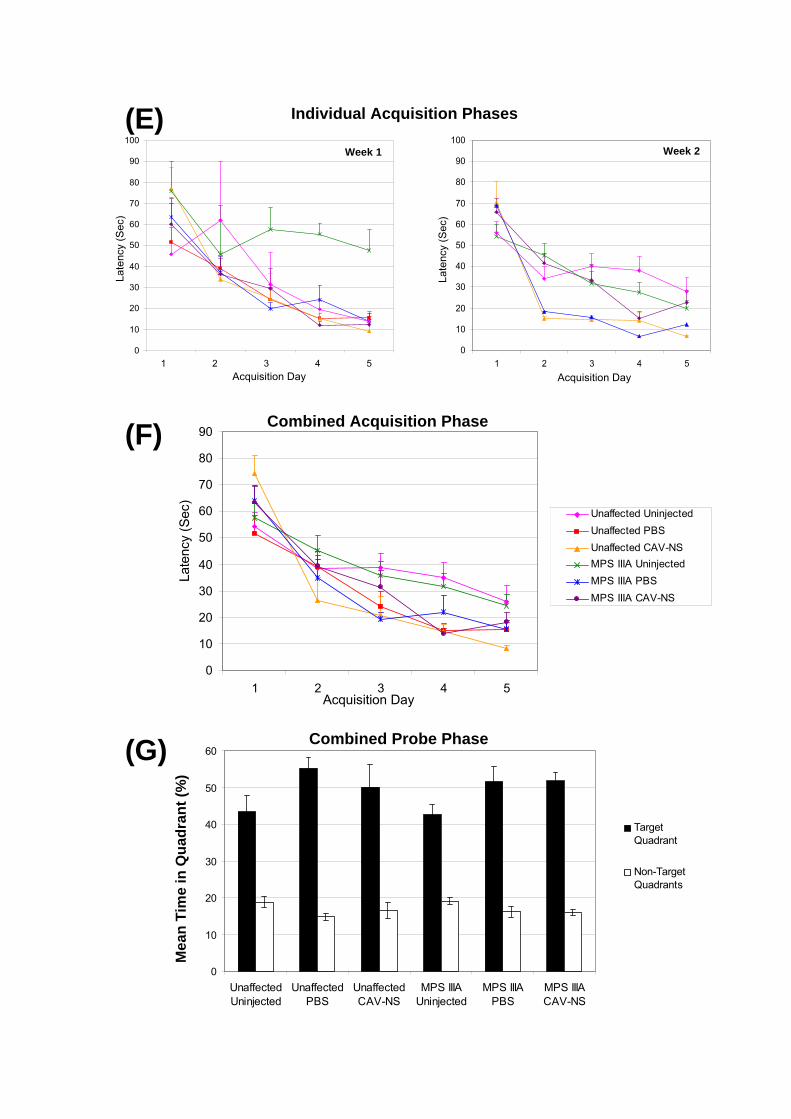
0
10
20
30
40
50
60
70
80
90
100
1 2 3 4 5
0
10
20
30
40
50
60
70
80
90
100
0
10
20
30
40
50
60
Unaffected
Uninjected
Unaffected
PBS
Unaffected
CAV-NS
MPS IIIA
Uninjected
MPS IIIA
PBS
MPS IIIA
CAV-NS
Combined Probe Phase
Me
an
Tim
e in
Qu
ad
ran
t(%
)
Combined Acquisition Phase
Acquisition Day
Late
ncy (
Sec)
Individual Acquisition Phases
1 2 3 4 5
La
ten
cy (
Se
c)
La
ten
cy (
Se
c)
Acquisition Day Acquisition Day
Week 1 Week 2
(E)
(F)
(G)
Target
Quadrant
Non-Target
Quadrants
0
10
20
30
40
50
60
70
80
90
1 2 3 4 5
Unaffected Uninjected
Unaffected PBS
Unaffected CAV-NS
MPS IIIA Uninjected
MPS IIIA PBS
MPS IIIA CAV-NS
The latency data from the acquisition phase was recorded manually in both weeks of
testing (Fig. 7.6E, F) and was statistically analysed as described in Chapter 6. Over the
course of the acquisition phase there were no significant differences between unaffected and
MPS IIIA mice when adjusted for the treatment group (p=0.870) or across all treatments and
days (p=0.332). However, the treatment group had a significant impact on the latency of the
mice when adjusted for any possible disease effects (p=0.001). Mice who were not injected
had greater latencies to find the hidden platform on the final days of the acquisition phase
(days 3 to 5) compared to both cryo-anaesthetised/bilaterally-injected groups, regardless of
the genotype of the mice. This was reflected in the significant values in latency between the
treatment groups on acquisition days 3 to 5 (p=0.002, <0.001, 0.03, respectively), although
there were no significant differences detected on acquisition days 1 and 2 (p=0.436, 0.727).
For the data collected in the probe phase, a two-way ANOVA was performed with the
two variables as disease state (i.e. unaffected or MPS IIIA) and injection type (uninjected,
PBS-injected, CAV-NS-injected). As seen in Fig. 7.6G, there were no statistically significant
differences between the unaffected and MPS IIIA mice in the percentage of time spent in the
target quadrant (p=0.743) or the mean of the non-target quadrants (p=0.749). Mice that
underwent surgical procedures (PBS- and CAV-NS-treated mice) were more likely to spend a
greater proportion of time in the target quadrant than uninjected mice (p=0.005), regardless of
the genotype of the mice, suggesting that uninjected mice did not learn as effectively as the
injected mice. Correspondingly, uninjected mice were more likely to spend time in the non-
target quadrants compared to the injected mice (PBS- or CAV-NS-treated; p=0.006). The
differences between the treatment groups was not evident in the quadrant closest to the
operator (p=0.170) or the quadrant furthest from the operator (p=0.354) but could be detected
in the quadrant opposing the target quadrant (p=0.010).
7.3.4. Biochemistry
7.3.4.1. Humoral Immune Response
Neutralising Antibodies Against the CAV-2 Capsid
Sera were collected at euthanasia and assessed for the presence of neutralising
antibodies against the CAV-2 capsid proteins (Section 2.2.9). Significant titres were classified
as 16 according to previous studies (Perreau et al, submitted). The CAV-2 neutralising
antibody titres for all mice injected at birth and euthanased between 2-days and 20-wks post-
injection is displayed in Fig. 7.7.
- 177 -
Figure 7.7: Neutralising antibody titres. Newborn mice were bilaterally-injected with one
of four CAV-NS doses (in particles/hemisphere), PBS control or remained uninjected. Sera
was collected at euthanasia at various times post-injection (2-days, 1-wk, 2-wks and 6-wks
post-injection, data from Chapter 5; 3-wks, 10-wks and 20-wks post-injection, data from
Chapter 7), complement-inactivated and assessed for the presence of CAV-2 neutralising
antibodies via a transduction inhibition assay. The percentage of transduced cells was
determined via a flow cytometer with GFP expression as the readout. The CAV-2
neutralising antibody titre is the inverse of the highest dilution that gave a 50% reduction in
the number of GFP-positive cells and is presented on a logarithmic scale. A significant
CAV-2 neutralising titre is 16 (Perreau et al, submitted). The group size is listed to the
right of each symbol. One mouse (indicated with an asterisk) had insufficient sera volume
for the neutralising antibody detection assay and had a titre of 160. The highest titre
detected after intracerebral injection of CAV-NS into adult mice is presented as a
comparison (“Control”; Chapter 4).
Unaffected
MPS IIIA
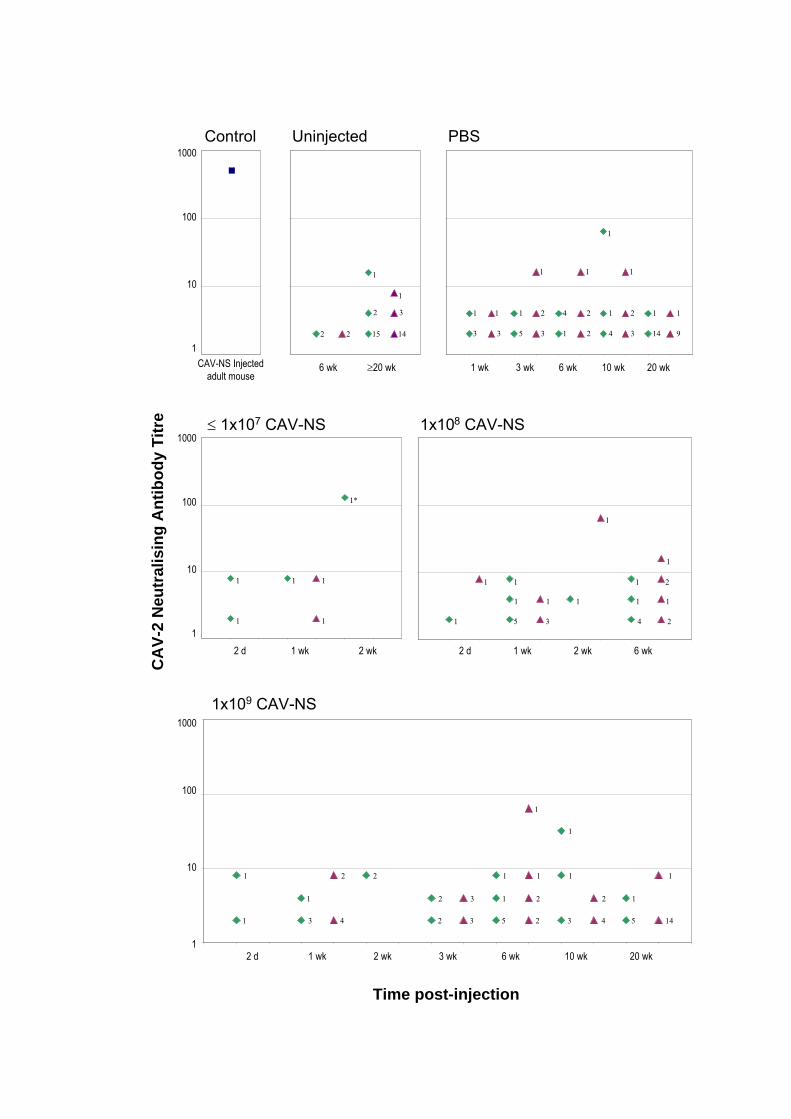
CAV-NS Injected
adult mouse
1000
100
10
1
1000
100
10
1
1000
100
10
1
6 wk 20 wk 1 wk 3 wk 6 wk 10 wk 20 wk
2 d 1 wk 2 wk 2 d 1 wk 2 wk 6 wk
2 d 1 wk 2 wk 3 wk 6 wk 10 wk 20 wk
Control Uninjected PBS
1x10⁷ CAV-NS 1x10⁸ CAV-NS
1x10⁹ CAV-NS
2 2 15 14
2 3
1
1
3 3 5 3 1 2 4 3 14 9
1 1 1 2 4 2 1 2 1 1
1 1 1
1
1 1
1 1 1
1*
1 5 3 4 2
1 1 1 1 1
1 1 1 2
1
1
1 3 4 2 3 5 2 3 4 5 14
1 2 3 1 2 2 1
1 2 2 1 1 1 1
1
1
CA
V-2
Neu
tra
lis
ing
An
tib
od
y T
itre
Time post-injection
In comparison to the adult mice receiving intracerebral injections of CAV-NS, very
few mice receiving intraventricular injections during the neonatal period developed
neutralising antibodies against CAV-2. When assessing the effect of CAV-NS dose on the
percentage of mice with significant CAV-2 neutralising antibody titres (data from Chapter 5
and this chapter), the percentage of responding mice were similar for all treatment groups:
uninjected controls, 2.5% (1/40 mice); PBS-treated controls, 6.0% (4/67); and CAV-NS-
treated, 0% (0/5), 7.4% (2/27) or 2.9% (2/69) for mice injected with 1x10⁷, 1x10
8 or 1x10
9
CAV-NS particles/hemisphere.
Detection of Transgene Specific Antibodies by ELISA
To determine whether transgene-specific antibodies had developed in CAV-NS-
treated mice, sera samples were collected from saline- or CAV-NS-injected mice euthanased
at 3-, 10- or 20-wks post-injection (Fig. 7.8). With the exception of one mouse, there were no
differences in the rhNS- or GFP-specific antibodies between the PBS- and CAV-NS-treated
mice at any of these time-points. One unaffected mouse receiving 109 particles/hemisphere of
CAV-NS, and euthanased at 10-wks post-injection, displayed a slightly elevated rhNS
antibody titre (1/800) compared to the other samples analysed in this subset, but was much
lower than the positive control plasma collected from a mouse receiving 20 g of purified
rhNS into the cerebrospinal fluid (>1/1600, previously determined to be 1/51,200) (Hemsley
et al, 2007).
7.3.4.2. Detection of rhNS Protein and Activity
Concurrently, brain tissues were sliced as demonstrated in Fig. 2.2, sonicated and the
tissue homogenates from an olfactory bulb or the hemi-coronal slice containing the lateral
ventricle injection site were assessed for rhNS protein and activity. Similar to the results
obtained in mice treated with 1 x 10⁹ particles/hemisphere of CAV-NS at 1-wk post-injection
(Chapter 5 and Fig. 7.9), unaffected mice receiving 1 x 10⁹ CAV-NS particles/hemisphere
had 6.4 and 1.9 ng rhNS/mg total protein after 3-wks of treatment (data from individual mice;
Fig. 7.9). MPS IIIA mice treated with CAV-NS had slightly lower measurements for rhNS
protein at 3-wks (1.5, 0.6, 0.1 ng rhNS/mg total protein). The rhNS protein concentration was
0.2-0.4 ng rhNS/mg total protein or undetectable for PBS-treated unaffected and PBS-treated
MPS IIIA mice, respectively.
As the maximum rhNS and GFP expression was determined to be at 1-wk post-
injection (as evaluated by rhNS protein concentrations and the GFP immunostaining), NS
- 178 -
Figure 7.8: Trangene specific antibody response. Newborn mice were bilaterally
injected with PBS or 1x10⁹ particles of CAV-NS per hemsiphere and monitored up to
20-wks of age. Sera samples were collected from mice euthanased at 3-, 10- or 20-wks
post-injection. The complement was inactivated and assessed for transgene-specific
antibodies using an ELISA-based assay. Serial dilutions of 4 randomly selected mice
per group are displayed on a logarithmic scale. The positive control samples used for
the rhNS-specific and GFP-specific antibody detection ELISA assays were serum
collected from a MPS IIIA mouse receiving purified rhNS into the cerebrospinal fluid
or a mouse anti-GFP monoclonal antibody, respectively. The assay background
absorbance value is indicated with a pale blue line.
Unaffected PBS
Unaffected CAV-NS
MPS IIIA PBS
MPS IIIA CAV-NS
Positive control
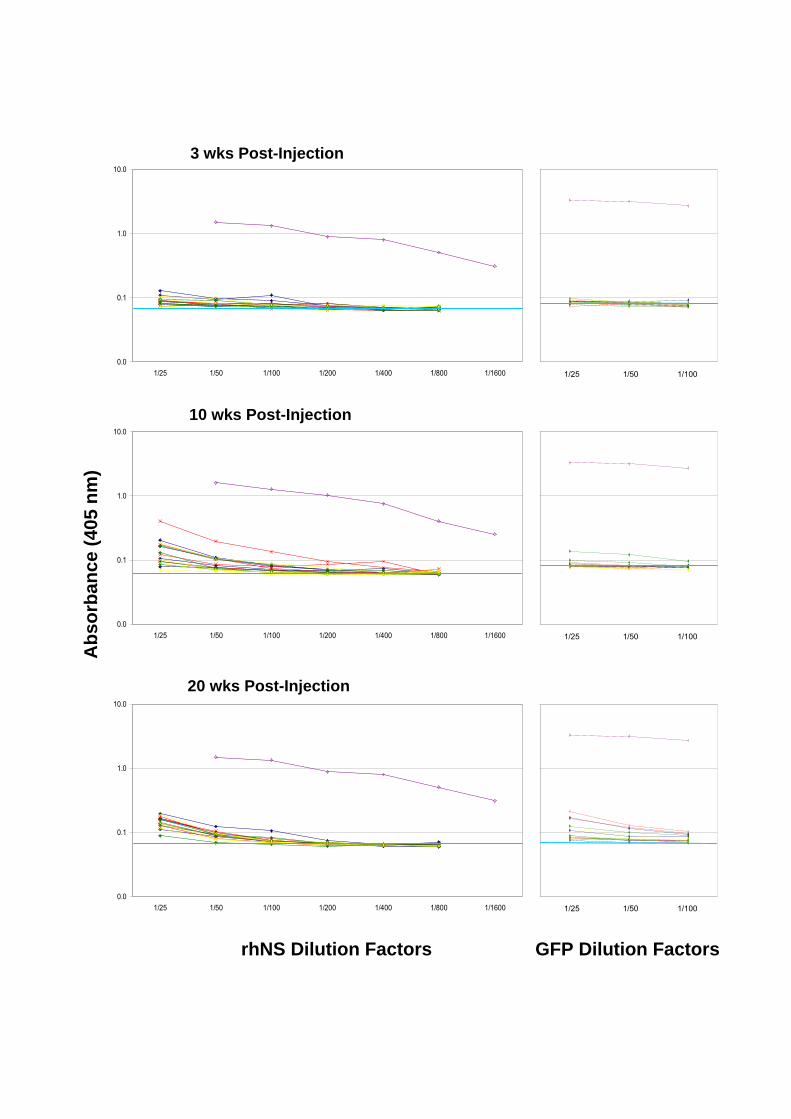
0.0
0.1
1.0
10.0
1/25 1/50 1/100 1/200 1/400 1/800 1/1600
Ab
so
rban
ce (
405 n
m)
3 wks Post-Injection
10 wks Post-Injection
20 wks Post-Injection
rhNS Dilution Factors GFP Dilution Factors
0.0
0.1
1.0
10.0
1/25 1/50 1/100 1/200 1/400 1/800 1/1600
0.0
0.1
1.0
10.0
1/25 1/50 1/100 1/200 1/400 1/800 1/1600
1/25 1/50 1/100
1/25 1/50 1/100
1/25 1/50 1/100
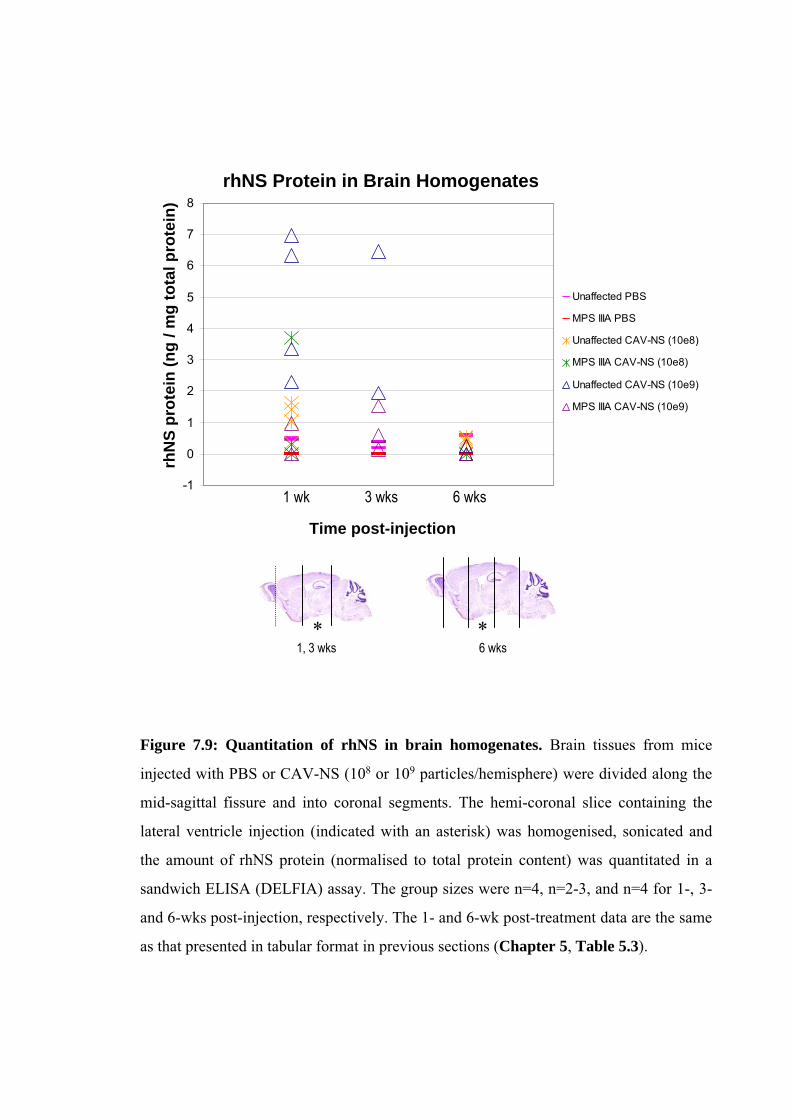
-1
0
1
2
3
4
5
6
7
8
Time post-injection
rhN
S p
rote
in (
ng
/ m
g t
ota
l p
rote
in)
1 wk 3 wks 6 wks
rhNS Protein in Brain Homogenates
Unaffected PBS
MPS IIIA PBS
Unaffected CAV-NS (10e8)
MPS IIIA CAV-NS (10e8)
Unaffected CAV-NS (10e9)
MPS IIIA CAV-NS (10e9)
* *1, 3 wks 6 wks
Figure 7.9: Quantitation of rhNS in brain homogenates. Brain tissues from mice
injected with PBS or CAV-NS (108 or 109 particles/hemisphere) were divided along the
mid-sagittal fissure and into coronal segments. The hemi-coronal slice containing the
lateral ventricle injection (indicated with an asterisk) was homogenised, sonicated and
the amount of rhNS protein (normalised to total protein content) was quantitated in a
sandwich ELISA (DELFIA) assay. The group sizes were n=4, n=2-3, and n=4 for 1-, 3-
and 6-wks post-injection, respectively. The 1- and 6-wk post-treatment data are the same
as that presented in tabular format in previous sections (Chapter 5, Table 5.3).
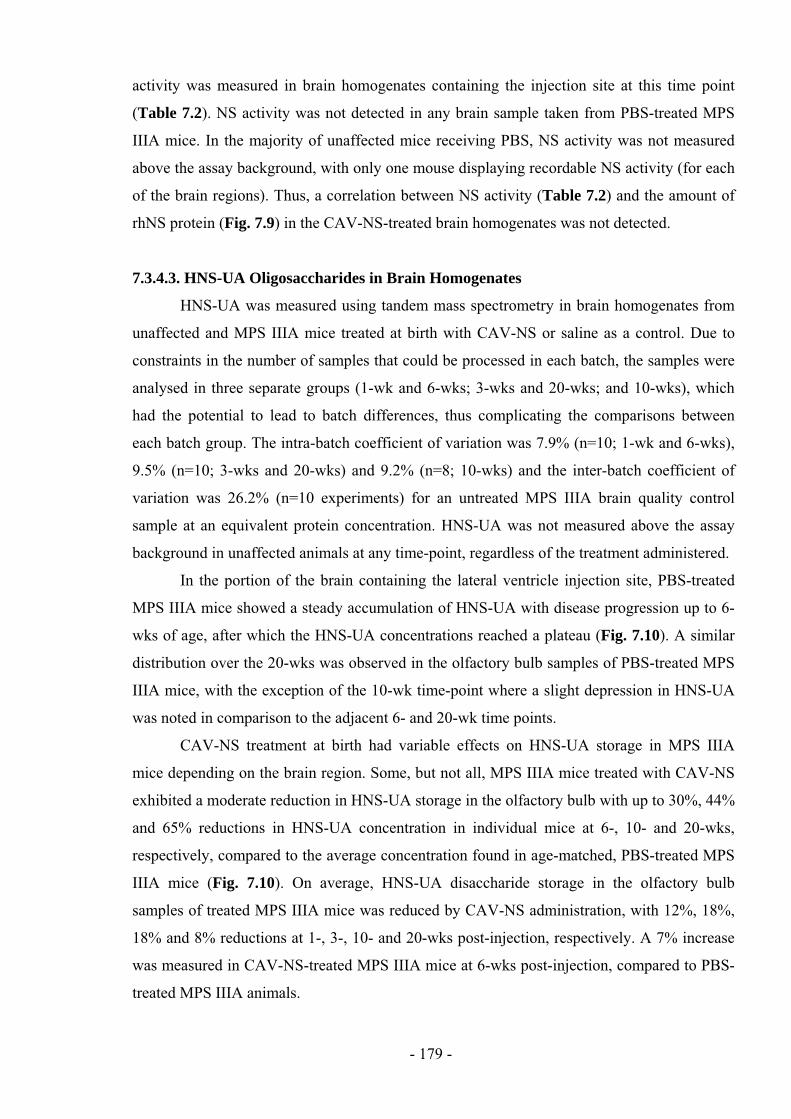
activity was measured in brain homogenates containing the injection site at this time point
(Table 7.2). NS activity was not detected in any brain sample taken from PBS-treated MPS
IIIA mice. In the majority of unaffected mice receiving PBS, NS activity was not measured
above the assay background, with only one mouse displaying recordable NS activity (for each
of the brain regions). Thus, a correlation between NS activity (Table 7.2) and the amount of
rhNS protein (Fig. 7.9) in the CAV-NS-treated brain homogenates was not detected.
7.3.4.3. HNS-UA Oligosaccharides in Brain Homogenates
HNS-UA was measured using tandem mass spectrometry in brain homogenates from
unaffected and MPS IIIA mice treated at birth with CAV-NS or saline as a control. Due to
constraints in the number of samples that could be processed in each batch, the samples were
analysed in three separate groups (1-wk and 6-wks; 3-wks and 20-wks; and 10-wks), which
had the potential to lead to batch differences, thus complicating the comparisons between
each batch group. The intra-batch coefficient of variation was 7.9% (n=10; 1-wk and 6-wks),
9.5% (n=10; 3-wks and 20-wks) and 9.2% (n=8; 10-wks) and the inter-batch coefficient of
variation was 26.2% (n=10 experiments) for an untreated MPS IIIA brain quality control
sample at an equivalent protein concentration. HNS-UA was not measured above the assay
background in unaffected animals at any time-point, regardless of the treatment administered.
In the portion of the brain containing the lateral ventricle injection site, PBS-treated
MPS IIIA mice showed a steady accumulation of HNS-UA with disease progression up to 6-
wks of age, after which the HNS-UA concentrations reached a plateau (Fig. 7.10). A similar
distribution over the 20-wks was observed in the olfactory bulb samples of PBS-treated MPS
IIIA mice, with the exception of the 10-wk time-point where a slight depression in HNS-UA
was noted in comparison to the adjacent 6- and 20-wk time points.
CAV-NS treatment at birth had variable effects on HNS-UA storage in MPS IIIA
mice depending on the brain region. Some, but not all, MPS IIIA mice treated with CAV-NS
exhibited a moderate reduction in HNS-UA storage in the olfactory bulb with up to 30%, 44%
and 65% reductions in HNS-UA concentration in individual mice at 6-, 10- and 20-wks,
respectively, compared to the average concentration found in age-matched, PBS-treated MPS
IIIA mice (Fig. 7.10). On average, HNS-UA disaccharide storage in the olfactory bulb
samples of treated MPS IIIA mice was reduced by CAV-NS administration, with 12%, 18%,
18% and 8% reductions at 1-, 3-, 10- and 20-wks post-injection, respectively. A 7% increase
was measured in CAV-NS-treated MPS IIIA mice at 6-wks post-injection, compared to PBS-
treated MPS IIIA animals.
- 179 -
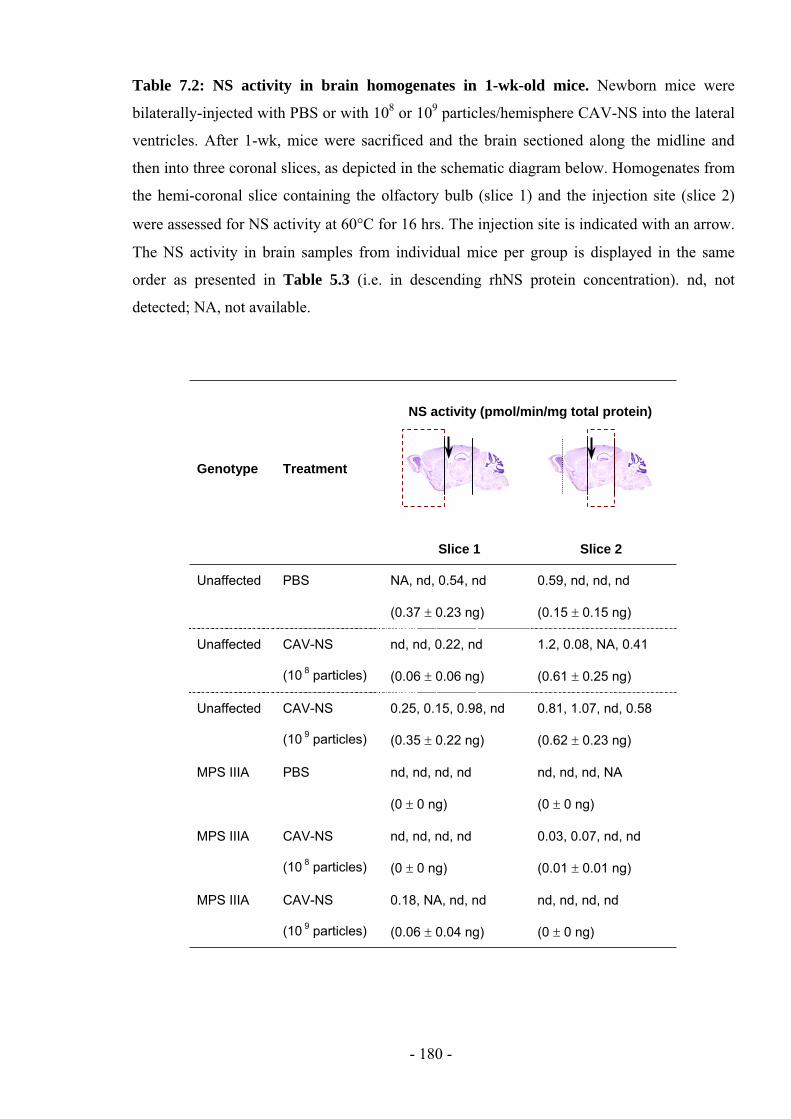
Table 7.2: NS activity in brain homogenates in 1-wk-old mice. Newborn mice were
bilaterally-injected with PBS or with 108 or 10
9 particles/hemisphere CAV-NS into the lateral
ventricles. After 1-wk, mice were sacrificed and the brain sectioned along the midline and
then into three coronal slices, as depicted in the schematic diagram below. Homogenates from
the hemi-coronal slice containing the olfactory bulb (slice 1) and the injection site (slice 2)
were assessed for NS activity at 60 C for 16 hrs. The injection site is indicated with an arrow.
The NS activity in brain samples from individual mice per group is displayed in the same
order as presented in Table 5.3 (i.e. in descending rhNS protein concentration). nd, not
detected; NA, not available.
Genotype Treatment
NS activity (pmol/min/mg total protein)
Slice 1 Slice 2
Unaffected PBS NA, nd, 0.54, nd
(0.37 0.23 ng)
0.59, nd, nd, nd
(0.15 0.15 ng)
Unaffected CAV-NS
(10 8 particles)
nd, nd, 0.22, nd
(0.06 0.06 ng)
1.2, 0.08, NA, 0.41
(0.61 0.25 ng)
Unaffected CAV-NS
(10 9 particles)
0.25, 0.15, 0.98, nd
(0.35 0.22 ng)
0.81, 1.07, nd, 0.58
(0.62 0.23 ng)
MPS IIIA PBS nd, nd, nd, nd
(0 0 ng)
nd, nd, nd, NA
(0 0 ng)
MPS IIIA CAV-NS
(10 8 particles)
nd, nd, nd, nd
(0 0 ng)
0.03, 0.07, nd, nd
(0.01 0.01 ng)
MPS IIIA CAV-NS
(10 9 particles)
0.18, NA, nd, nd
(0.06 0.04 ng)
nd, nd, nd, nd
(0 0 ng)
- 180 -
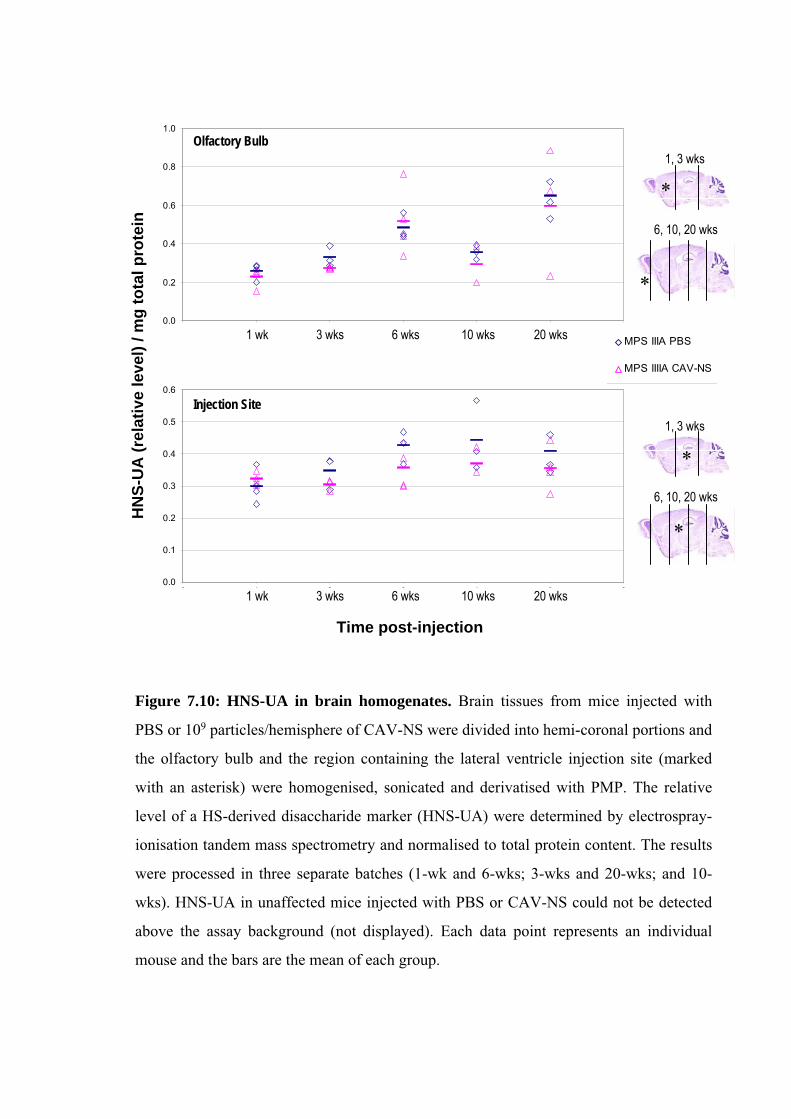
0.0
0.1
0.2
0.3
0.4
0.5
0.6
0 1 2 3 4 5 6
0.0
0.2
0.4
0.6
0.8
1.0
MPS IIIA PBS
MPS IIIIA CAV-NS
1 wk 3 wks 6 wks 10 wks 20 wks
1 wk 3 wks 6 wks 10 wks 20 wks
HN
S-U
A (
rela
tiv
e l
evel)
/ m
g t
ota
l p
rote
in
Time post-injection
Olfactory Bulb
Injection Site
*
*
*
*
1, 3 wks
6, 10, 20 wks
1, 3 wks
6, 10, 20 wks
Figure 7.10: HNS-UA in brain homogenates. Brain tissues from mice injected with
PBS or 109 particles/hemisphere of CAV-NS were divided into hemi-coronal portions and
the olfactory bulb and the region containing the lateral ventricle injection site (marked
with an asterisk) were homogenised, sonicated and derivatised with PMP. The relative
level of a HS-derived disaccharide marker (HNS-UA) were determined by electrospray-
ionisation tandem mass spectrometry and normalised to total protein content. The results
were processed in three separate batches (1-wk and 6-wks; 3-wks and 20-wks; and 10-
wks). HNS-UA in unaffected mice injected with PBS or CAV-NS could not be detected
above the assay background (not displayed). Each data point represents an individual
mouse and the bars are the mean of each group.
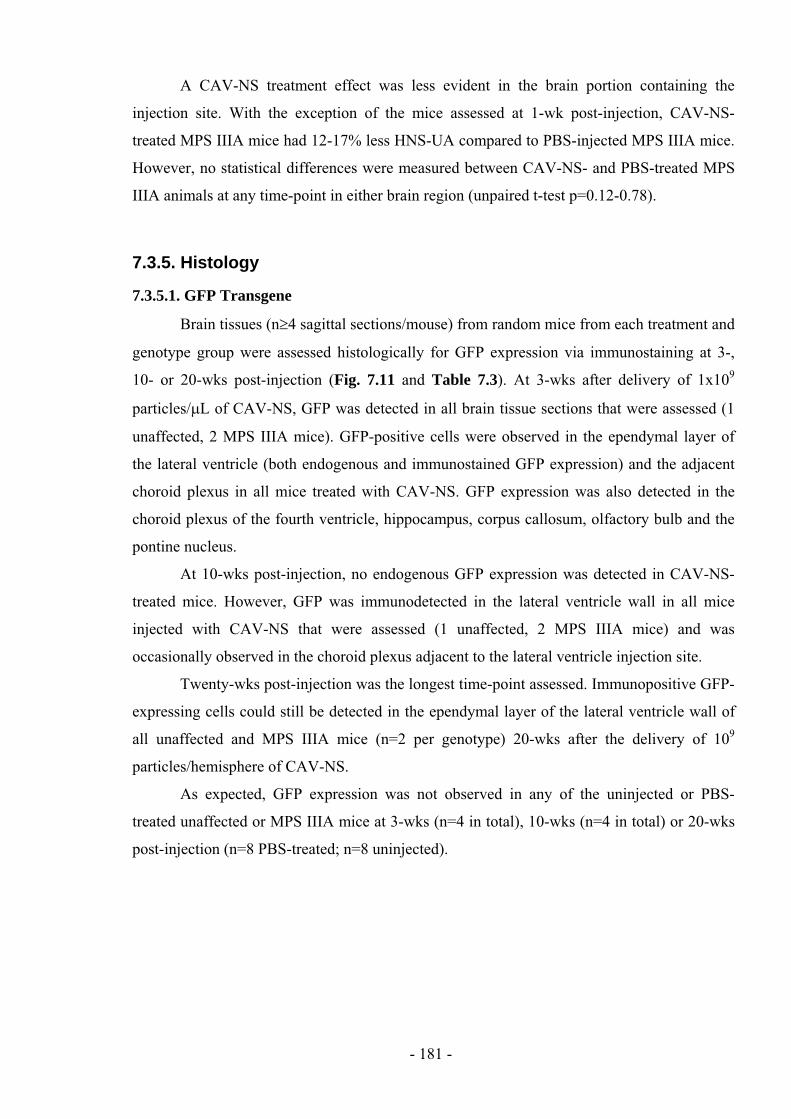
A CAV-NS treatment effect was less evident in the brain portion containing the
injection site. With the exception of the mice assessed at 1-wk post-injection, CAV-NS-
treated MPS IIIA mice had 12-17% less HNS-UA compared to PBS-injected MPS IIIA mice.
However, no statistical differences were measured between CAV-NS- and PBS-treated MPS
IIIA animals at any time-point in either brain region (unpaired t-test p=0.12-0.78).
7.3.5. Histology
7.3.5.1. GFP Transgene
Brain tissues (n 4 sagittal sections/mouse) from random mice from each treatment and
genotype group were assessed histologically for GFP expression via immunostaining at 3-,
10- or 20-wks post-injection (Fig. 7.11 and Table 7.3). At 3-wks after delivery of 1x10⁹
particles/ L of CAV-NS, GFP was detected in all brain tissue sections that were assessed (1
unaffected, 2 MPS IIIA mice). GFP-positive cells were observed in the ependymal layer of
the lateral ventricle (both endogenous and immunostained GFP expression) and the adjacent
choroid plexus in all mice treated with CAV-NS. GFP expression was also detected in the
choroid plexus of the fourth ventricle, hippocampus, corpus callosum, olfactory bulb and the
pontine nucleus.
At 10-wks post-injection, no endogenous GFP expression was detected in CAV-NS-
treated mice. However, GFP was immunodetected in the lateral ventricle wall in all mice
injected with CAV-NS that were assessed (1 unaffected, 2 MPS IIIA mice) and was
occasionally observed in the choroid plexus adjacent to the lateral ventricle injection site.
Twenty-wks post-injection was the longest time-point assessed. Immunopositive GFP-
expressing cells could still be detected in the ependymal layer of the lateral ventricle wall of
all unaffected and MPS IIIA mice (n=2 per genotype) 20-wks after the delivery of 109
particles/hemisphere of CAV-NS.
As expected, GFP expression was not observed in any of the uninjected or PBS-
treated unaffected or MPS IIIA mice at 3-wks (n=4 in total), 10-wks (n=4 in total) or 20-wks
post-injection (n=8 PBS-treated; n=8 uninjected).
- 181 -
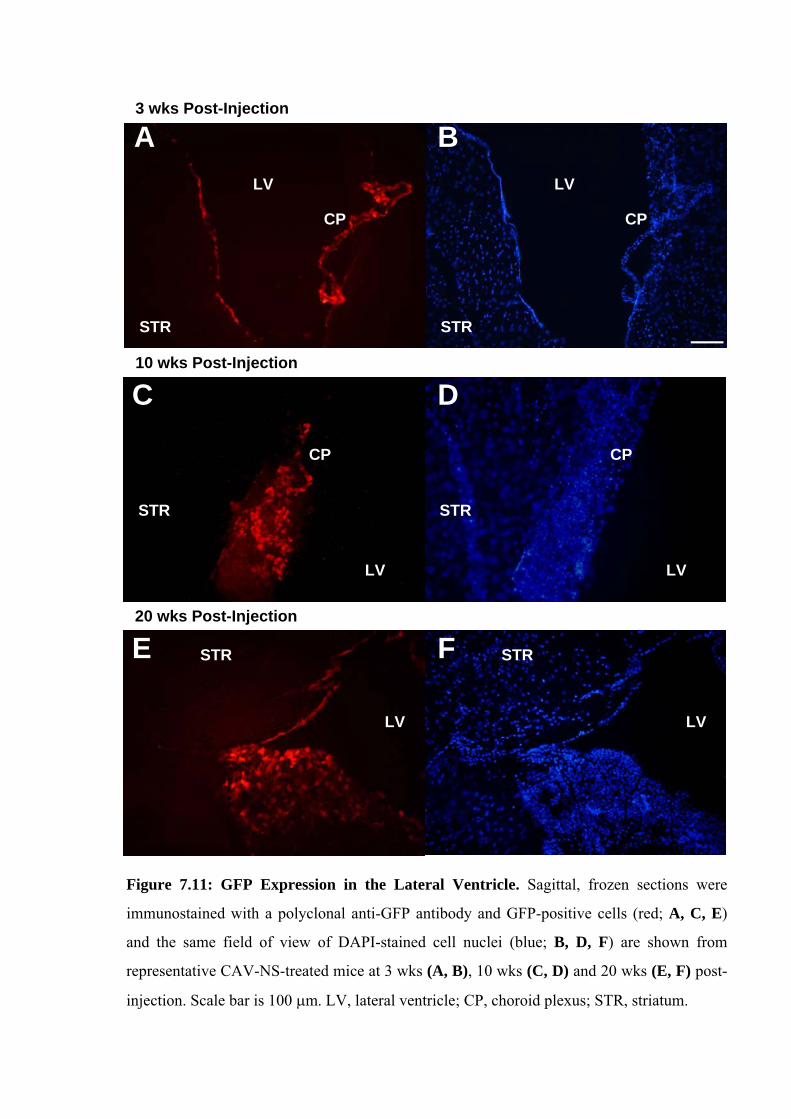
LV
CP
STR
LV
CP
STR
3 wks Post-Injection
A B
LV
STR
CP
LV
STR
CP
10 wks Post-Injection
C D
LV
STR
LV
STR
20 wks Post-Injection
E F
Figure 7.11: GFP Expression in the Lateral Ventricle. Sagittal, frozen sections were
immunostained with a polyclonal anti-GFP antibody and GFP-positive cells (red; A, C, E)
and the same field of view of DAPI-stained cell nuclei (blue; B, D, F) are shown from
representative CAV-NS-treated mice at 3 wks (A, B), 10 wks (C, D) and 20 wks (E, F) post-
injection. Scale bar is 100 m. LV, lateral ventricle; CP, choroid plexus; STR, striatum.
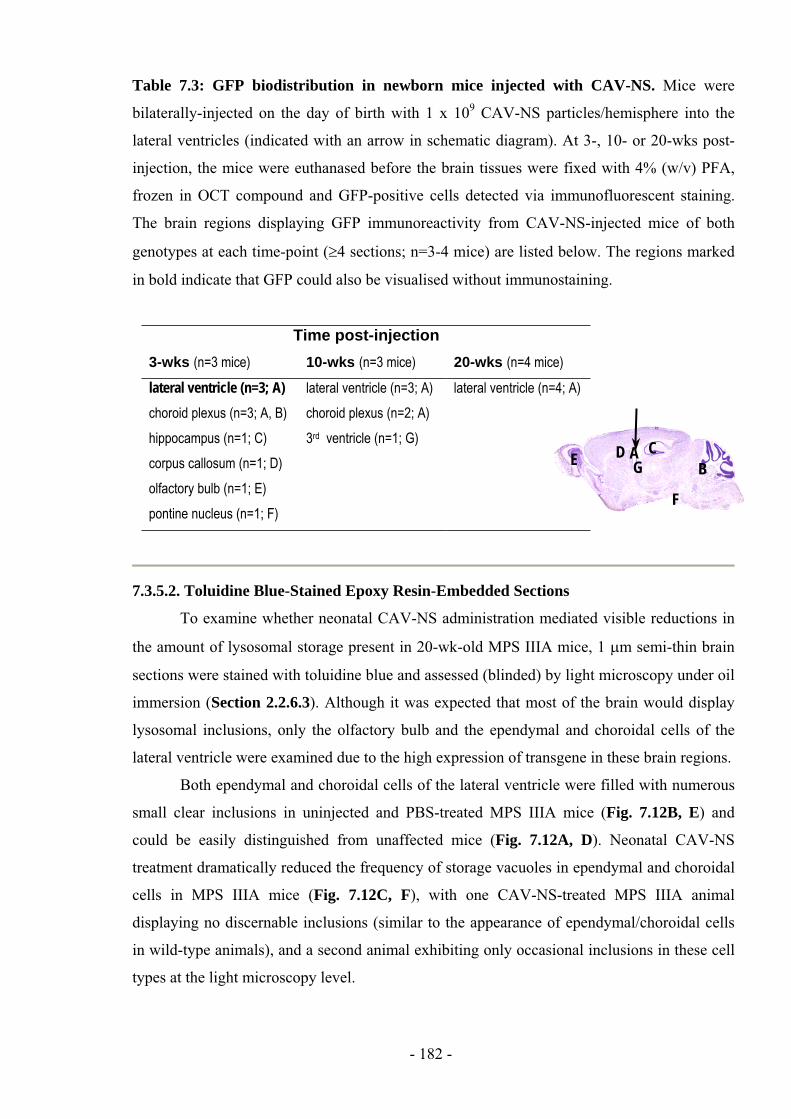
Table 7.3: GFP biodistribution in newborn mice injected with CAV-NS. Mice were
bilaterally-injected on the day of birth with 1 x 10⁹ CAV-NS particles/hemisphere into the
lateral ventricles (indicated with an arrow in schematic diagram). At 3-, 10- or 20-wks post-
injection, the mice were euthanased before the brain tissues were fixed with 4% (w/v) PFA,
frozen in OCT compound and GFP-positive cells detected via immunofluorescent staining.
The brain regions displaying GFP immunoreactivity from CAV-NS-injected mice of both
genotypes at each time-point ( 4 sections; n=3-4 mice) are listed below. The regions marked
in bold indicate that GFP could also be visualised without immunostaining.
Time post-injection
3-wks (n=3 mice) 10-wks (n=3 mice) 20-wks (n=4 mice)
lateral ventricle (n=3; A)
choroid plexus (n=3; A, B)
hippocampus (n=1; C)
corpus callosum (n=1; D)
olfactory bulb (n=1; E)
pontine nucleus (n=1; F)
lateral ventricle (n=3; A)
choroid plexus (n=2; A)
3rd ventricle (n=1; G)
lateral ventricle (n=4; A)
F
E D C
BAG
7.3.5.2. Toluidine Blue-Stained Epoxy Resin-Embedded Sections
To examine whether neonatal CAV-NS administration mediated visible reductions in
the amount of lysosomal storage present in 20-wk-old MPS IIIA mice, 1 m semi-thin brain
sections were stained with toluidine blue and assessed (blinded) by light microscopy under oil
immersion (Section 2.2.6.3). Although it was expected that most of the brain would display
lysosomal inclusions, only the olfactory bulb and the ependymal and choroidal cells of the
lateral ventricle were examined due to the high expression of transgene in these brain regions.
Both ependymal and choroidal cells of the lateral ventricle were filled with numerous
small clear inclusions in uninjected and PBS-treated MPS IIIA mice (Fig. 7.12B, E) and
could be easily distinguished from unaffected mice (Fig. 7.12A, D). Neonatal CAV-NS
treatment dramatically reduced the frequency of storage vacuoles in ependymal and choroidal
cells in MPS IIIA mice (Fig. 7.12C, F), with one CAV-NS-treated MPS IIIA animal
displaying no discernable inclusions (similar to the appearance of ependymal/choroidal cells
in wild-type animals), and a second animal exhibiting only occasional inclusions in these cell
types at the light microscopy level.
- 182 -
Figure 7.12: Toluidine blue-stained semi-thin brain sections. EM-fixed brains from 20-
wk-old mice were embedded in epoxy resin and 1 m thick sections were stained with
toluidine blue. Representative images from (A, D, G) PBS-treated unaffected, (B, E, H) PBS-
treated MPS IIIA and (C, F, I) CAV-NS-treated MPS IIIA mice are shown. Lysosomal
storage inclusions (see arrows) were observed in both the (A-F) ependymal layer of the lateral
ventricle and the (G-I) cerebral cortex. Perivascular cells in the cortex were frequently
observed with numerous inclusions (inset, H, I). Scale bar is 300 m (A-C, G-I) and 100 m
(D-F).
- 183 -
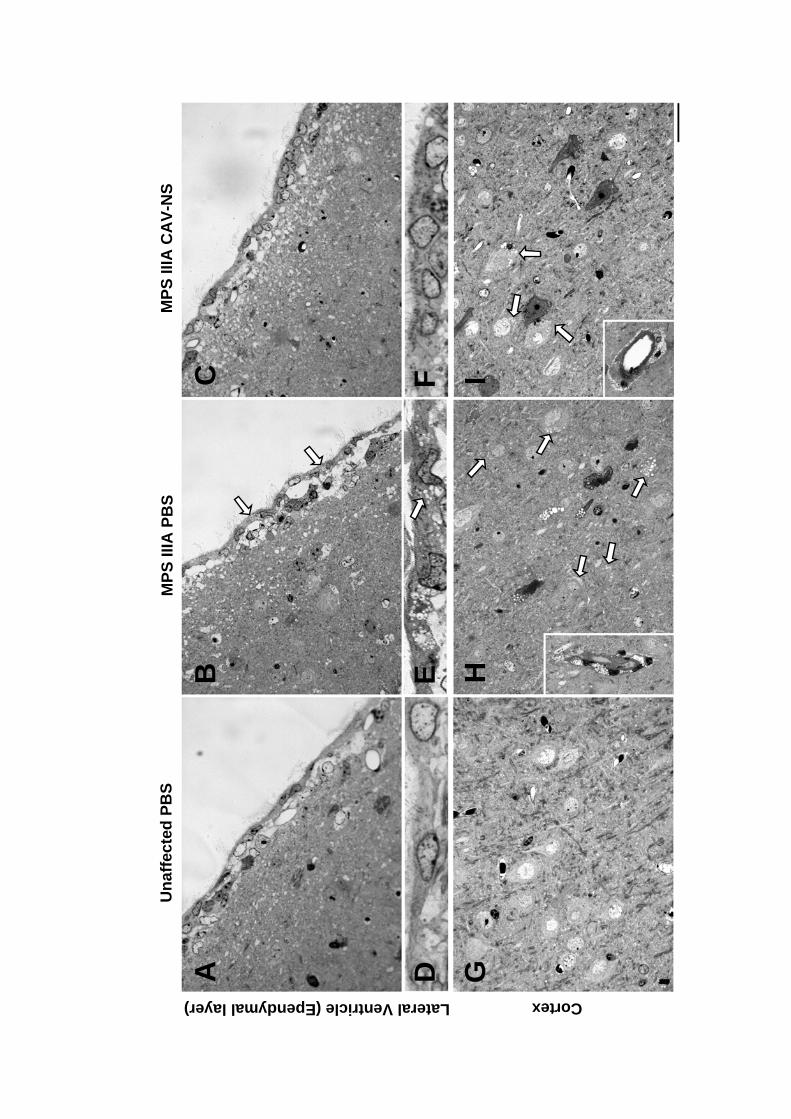
A
BC
D
EF
G
HI
Un
aff
ecte
d P
BS
MP
S I
IIA
PB
SM
PS
III
A C
AV
-NS
Lateral Ventricle (Ependymallayer) Cortex
Similar observations were made in the cortex situated directly above the lateral
ventricle. Microglia and oligodendrocytes could not be distinguished at 100x magnification
and are subsequently referred to collectively as “glia”. Uninjected and PBS-treated MPS IIIA
mice displayed numerous inclusions in the neurons of all cortical layers (Fig. 7.12H), in some
instances exceeding more than 25 inclusions per cell. Perivascular and free glia were also
laden with storage, filling the entire cytoplasm in the majority of inclusion-containing cells
assessed (Fig. 7.12H inset). Compared to cortical neurons, glial cells contained fewer
vacuoles per cell but the inclusions were generally larger than those observed in neurons.
Lysosomal inclusions were not observed in unaffected mice, regardless of the treatment
administered (Fig. 7.12G).
In CAV-NS-treated MPS IIIA mice, it appeared that fewer cortical neurons contained
inclusions and, of those with storage, the inclusions were less frequent and smaller in size
than in similar cell populations in MPS IIIA mice either injected with PBS or not injected
(Fig. 7.12I). As the treatment effect in cortical cells was not as definitive as that observed in
the ependymal and choroidal cells of the lateral ventricle, the percentage of neuronal and glial
cells with lysosomal storage inclusions was determined in cells near the cortical surface
(layers II-III, further from the injection site) or in deeper layers (layers V-VI, closer to the
injection site) to establish whether CAV-NS treatment had ameliorated lysosomal storage (as
described in Section 2.2.6.3).
In total, between 71-156 cortical neurons and 19-34 glial cells were assessed per
cortical region from each mouse. As shown in Fig. 7.13, CAV-NS treatment reduced the
percentage of neurons and glia containing inclusions at both the cortical surface and in deeper
layers of MPS IIIA mice compared to PBS-injected MPS IIIA animals. At the cortical
surface, inclusions were seen in 62.9 6.4% and 73.7 2.3% of neurons and glia,
respectively, in PBS-treated MPS IIIA animals. Delivery of CAV-NS at birth to MPS IIIA
mice reduced the percentage of cells with storage vacuoles for both cell populations (neurons
41.5 7.8%, p=0.17; glia 60.1 1.8%, p=0.04, compared to PBS-treated MPS IIIA mice).
Likewise, the deeper cortical layers of PBS-treated MPS IIIA mice exhibited neurons
with inclusions (49.7 9.5%) and, on treatment with CAV-NS, the percentage of vacuolated
neurons was reduced to 21.9 13.3% (p=0.23; Fig. 7.13). A similar trend was observed for
glial cells from deeper layers of the cortex with 73.3 8.6% and 56.5 14.4% of glial cells
containing inclusions for PBS- and CAV-NS-treated cells, respectively (p=0.42).
There were no differences in the percentage of dark neurons in the PBS- and CAV-
NS-treated MPS IIIA mice at the cortical surface (12.4 4.6% versus 10.6 7.8% for PBS-
- 184 -
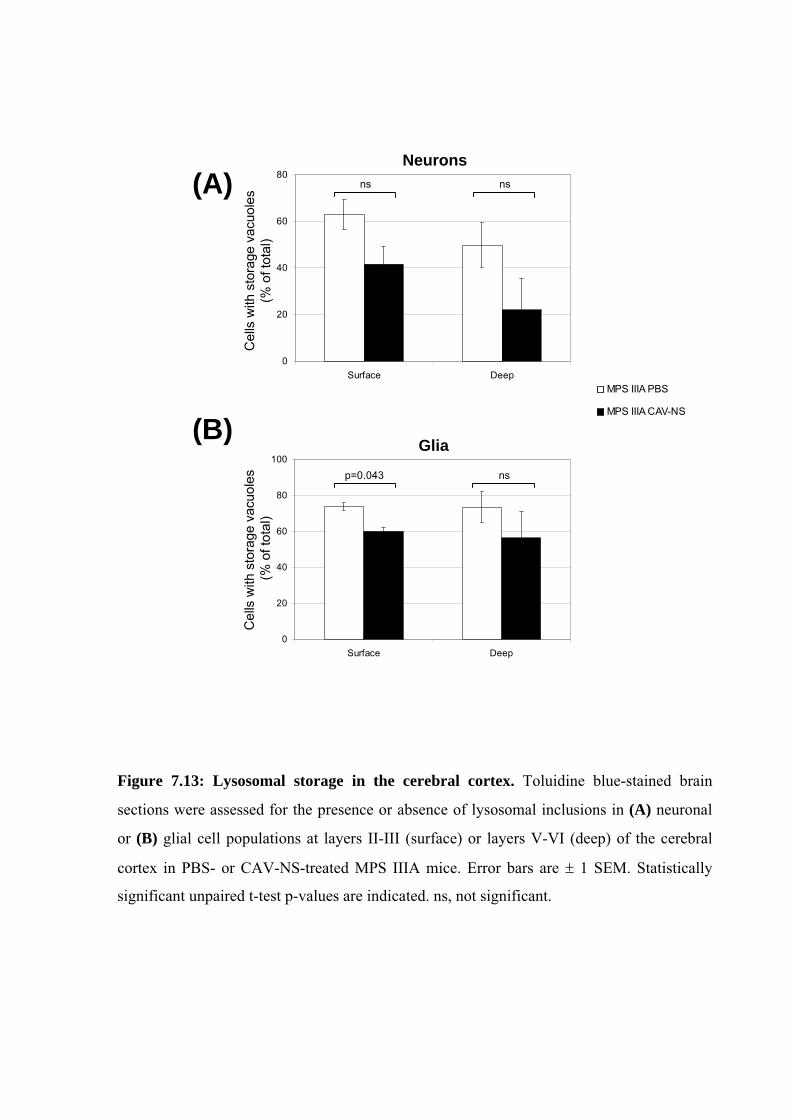
0
20
40
60
80
Surface Deep
0
20
40
60
80
100
Surface Deep
(A)
(B)
Ce
lls w
ith s
tora
ge v
acuole
s
(% o
f to
tal)
Neurons
Glia
p=0.043
Ce
lls w
ith s
tora
ge v
acuo
les
(% o
f to
tal)
ns ns
ns
MPS IIIA PBS
MPS IIIA CAV-NS
Figure 7.13: Lysosomal storage in the cerebral cortex. Toluidine blue-stained brain
sections were assessed for the presence or absence of lysosomal inclusions in (A) neuronal
or (B) glial cell populations at layers II-III (surface) or layers V-VI (deep) of the cerebral
cortex in PBS- or CAV-NS-treated MPS IIIA mice. Error bars are 1 SEM. Statistically
significant unpaired t-test p-values are indicated. ns, not significant.
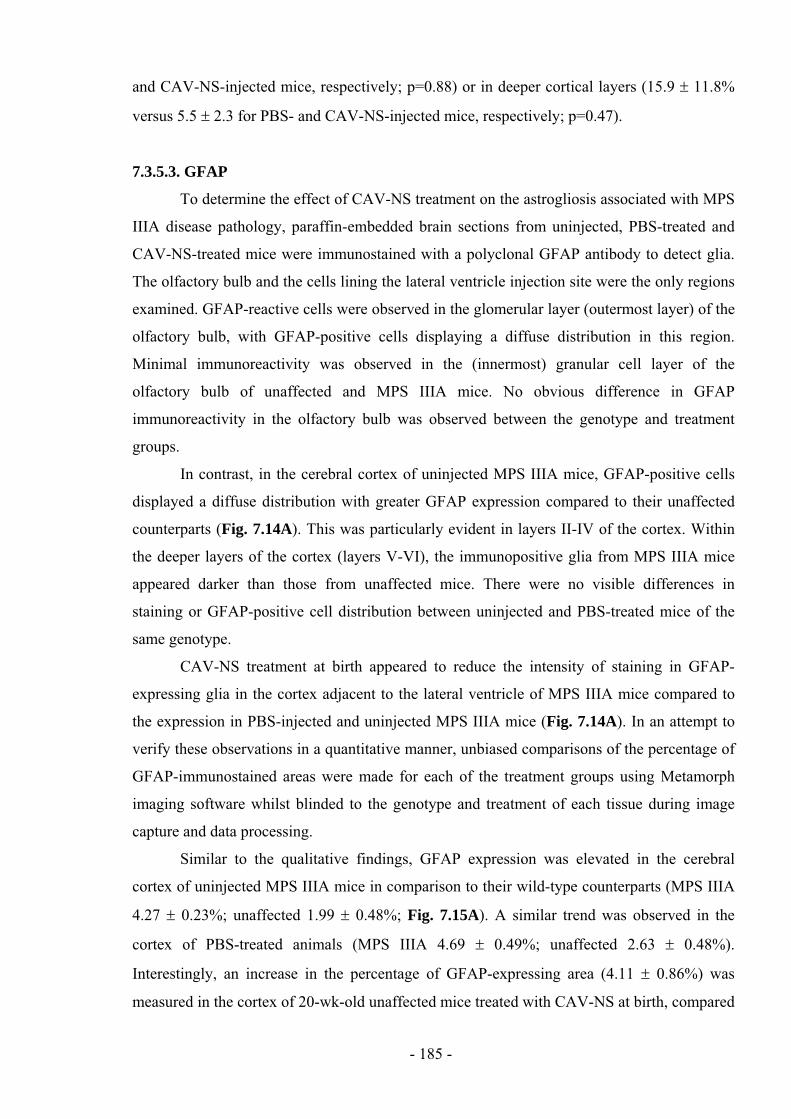
and CAV-NS-injected mice, respectively; p=0.88) or in deeper cortical layers (15.9 11.8%
versus 5.5 2.3 for PBS- and CAV-NS-injected mice, respectively; p=0.47).
7.3.5.3. GFAP
To determine the effect of CAV-NS treatment on the astrogliosis associated with MPS
IIIA disease pathology, paraffin-embedded brain sections from uninjected, PBS-treated and
CAV-NS-treated mice were immunostained with a polyclonal GFAP antibody to detect glia.
The olfactory bulb and the cells lining the lateral ventricle injection site were the only regions
examined. GFAP-reactive cells were observed in the glomerular layer (outermost layer) of the
olfactory bulb, with GFAP-positive cells displaying a diffuse distribution in this region.
Minimal immunoreactivity was observed in the (innermost) granular cell layer of the
olfactory bulb of unaffected and MPS IIIA mice. No obvious difference in GFAP
immunoreactivity in the olfactory bulb was observed between the genotype and treatment
groups.
In contrast, in the cerebral cortex of uninjected MPS IIIA mice, GFAP-positive cells
displayed a diffuse distribution with greater GFAP expression compared to their unaffected
counterparts (Fig. 7.14A). This was particularly evident in layers II-IV of the cortex. Within
the deeper layers of the cortex (layers V-VI), the immunopositive glia from MPS IIIA mice
appeared darker than those from unaffected mice. There were no visible differences in
staining or GFAP-positive cell distribution between uninjected and PBS-treated mice of the
same genotype.
CAV-NS treatment at birth appeared to reduce the intensity of staining in GFAP-
expressing glia in the cortex adjacent to the lateral ventricle of MPS IIIA mice compared to
the expression in PBS-injected and uninjected MPS IIIA mice (Fig. 7.14A). In an attempt to
verify these observations in a quantitative manner, unbiased comparisons of the percentage of
GFAP-immunostained areas were made for each of the treatment groups using Metamorph
imaging software whilst blinded to the genotype and treatment of each tissue during image
capture and data processing.
Similar to the qualitative findings, GFAP expression was elevated in the cerebral
cortex of uninjected MPS IIIA mice in comparison to their wild-type counterparts (MPS IIIA
4.27 0.23%; unaffected 1.99 0.48%; Fig. 7.15A). A similar trend was observed in the
cortex of PBS-treated animals (MPS IIIA 4.69 0.49%; unaffected 2.63 0.48%).
Interestingly, an increase in the percentage of GFAP-expressing area (4.11 0.86%) was
measured in the cortex of 20-wk-old unaffected mice treated with CAV-NS at birth, compared
- 185 -
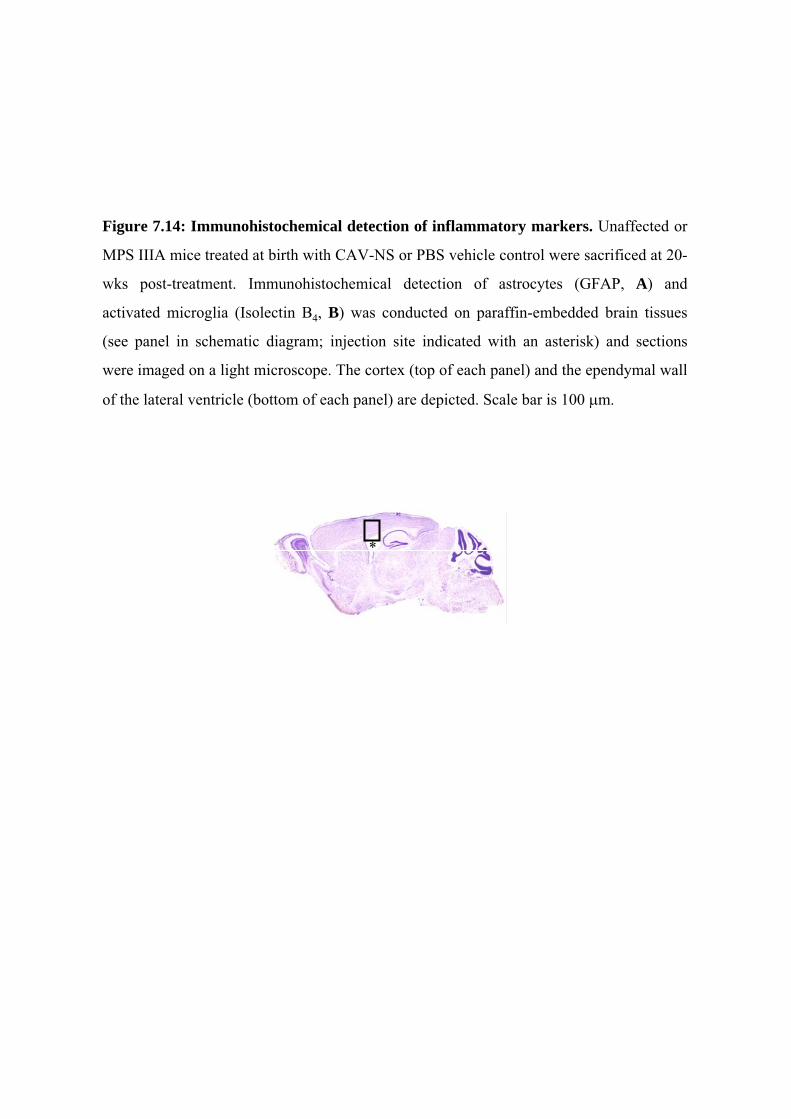
Figure 7.14: Immunohistochemical detection of inflammatory markers. Unaffected or
MPS IIIA mice treated at birth with CAV-NS or PBS vehicle control were sacrificed at 20-
wks post-treatment. Immunohistochemical detection of astrocytes (GFAP, A) and
activated microglia (Isolectin B4, B) was conducted on paraffin-embedded brain tissues
(see panel in schematic diagram; injection site indicated with an asterisk) and sections
were imaged on a light microscope. The cortex (top of each panel) and the ependymal wall
of the lateral ventricle (bottom of each panel) are depicted. Scale bar is 100 m.
*
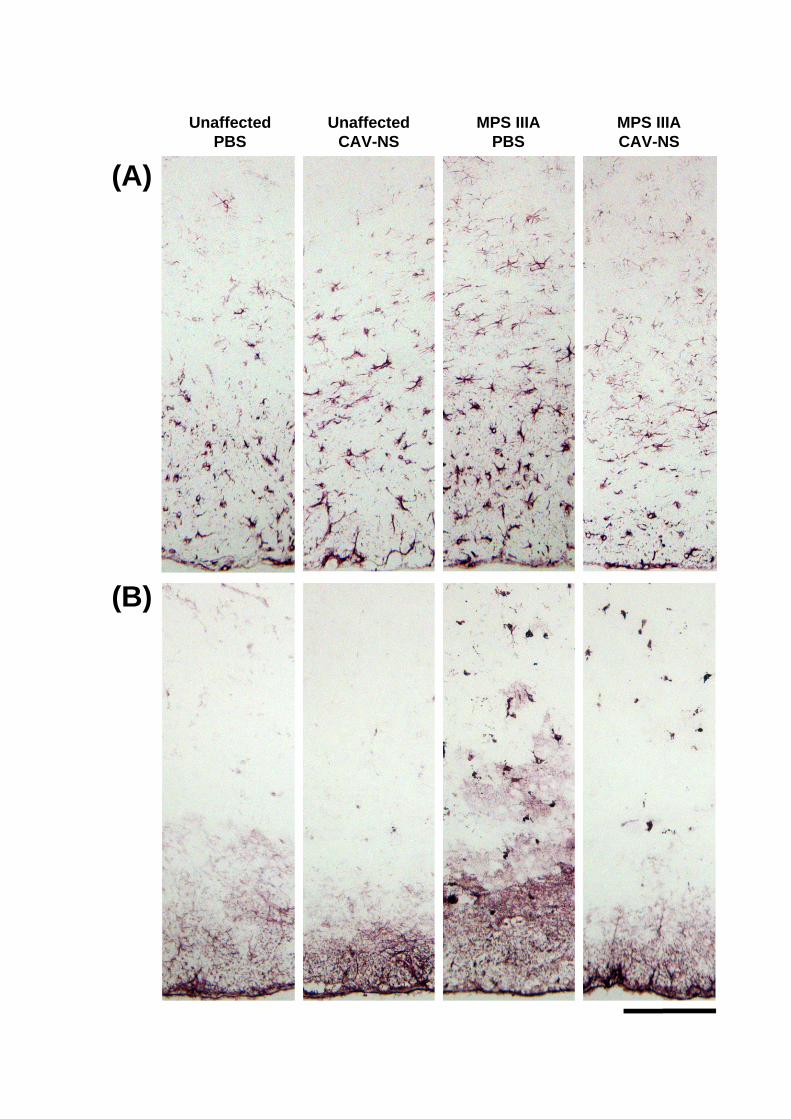
Unaffected
PBS
Unaffected
CAV-NS
MPS IIIA
PBS
MPS IIIA
CAV-NS
(A)
(B)
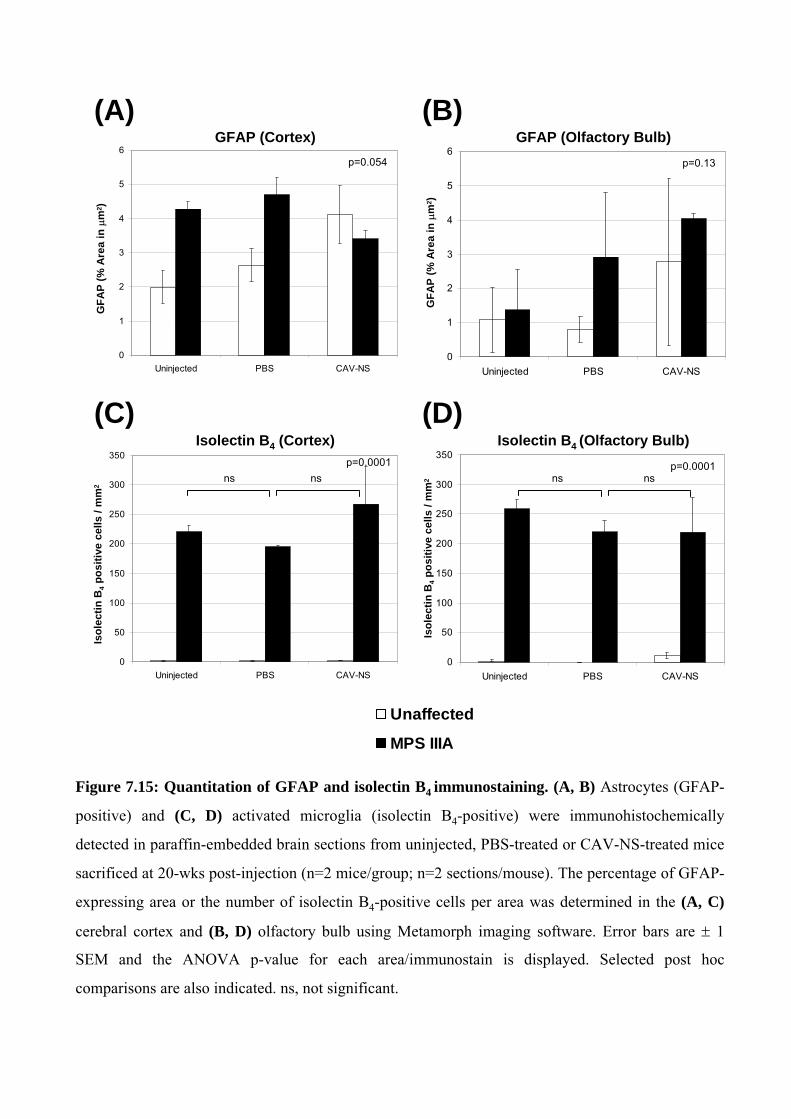
0
50
100
150
200
250
300
350
Uninjected PBS CAV-NS
(A) (B)
(C) (D)
0
1
2
3
4
5
6
Uninjected PBS CAV-NS
p=0.054
0
1
2
3
4
5
6
Uninjected PBS CAV-NS
GFAP (Cortex)
GF
AP
(%
Are
ain
m2)
GFAP (Olfactory Bulb)
GF
AP
(%
Are
ain
m2)
p=0.13
0
50
100
150
200
250
300
350
Uninjected PBS CAV-NS
Isolectin B4 (Cortex) Isolectin B4 (Olfactory Bulb)Is
ole
cti
n B
4p
os
itiv
e c
ell
s/
mm
2
Iso
lec
tin
B4
po
sit
ive
ce
lls
/ m
m2
p=0.0001 p=0.0001nsns nsns
Unaffected
MPS IIIA
Figure 7.15: Quantitation of GFAP and isolectin B4 immunostaining. (A, B) Astrocytes (GFAP-
positive) and (C, D) activated microglia (isolectin B4-positive) were immunohistochemically
detected in paraffin-embedded brain sections from uninjected, PBS-treated or CAV-NS-treated mice
sacrificed at 20-wks post-injection (n=2 mice/group; n=2 sections/mouse). The percentage of GFAP-
expressing area or the number of isolectin B4-positive cells per area was determined in the (A, C)
cerebral cortex and (B, D) olfactory bulb using Metamorph imaging software. Error bars are 1
SEM and the ANOVA p-value for each area/immunostain is displayed. Selected post hoc
comparisons are also indicated. ns, not significant.
to unaffected mice treated with PBS (2.63 0.48%). The corresponding CAV-NS-treated
MPS IIIA mice displayed less GFAP immunoreactivity (3.41 0.25%) than both the PBS-
treated MPS IIIA mice and the unaffected CAV-NS-treated mice. The differences in the
percentage of GFAP expression were marginally statistically significant (ANOVA p=0.054).
The percentage of GFAP expression in the olfactory bulb was also assessed due to the
high transgene expression observed in this structure at early time-points after treatment. No
differences were detected between uninjected unaffected and MPS IIIA mice (unaffected 1.08
0.95; MPS IIIA 1.38 1.18%), thus complicating the interpretation of whether CAV-NS
treatment had a therapeutic effect (Fig. 7.15B). However, in a trend similar to that observed in
the cortex, GFAP expression in the olfactory bulb was elevated in PBS-treated MPS IIIA
mice compared to PBS-treated unaffected mice (MPS IIIA 2.92 1.89%; unaffected 0.80
0.38%) and CAV-NS delivery at birth increased the percentage of GFAP staining in
unaffected mice (2.77 2.44%) compared to PBS-treated unaffected animals. In contrast to
the pattern observed within the cortex, GFAP expression was not reduced in CAV-NS-treated
MPS IIIA mice (4.04 0.15%) compared to PBS-injected MPS IIIA mice (ANOVA p=0.13).
7.3.5.4. Isolectin B4
The number of activated microglia (isolectin B4-positive) was determined in the same
subset of mice described in Section 7.3.5.3. Very few activated microglia were observed in
the cortex or olfactory bulb of unaffected mice regardless of the treatment administered, with
only occasional isolectin B4-positive cells detected in the entire field of view (Fig. 7.14). In
contrast, darkly stained, activated microglial cells were readily observed throughout the
cortex and the olfactory bulb of MPS IIIA mice. The isolectin B4-expressing cells were
evenly distributed throughout both of these brain regions, with the cell morphology displaying
dark cell bodies with short processes. Other areas of the brain were expected to also contain
activated microglia but were not examined. There were no discernable differences between
staining patterns in untreated MPS IIIA animals and those receiving PBS or CAV-NS at birth.
Activated microglial cells were quantitated in the cortex and the olfactory bulb (n=2
mice/treatment and genotype group; n=2 sections/mouse). A range of 1.2 1.2 – 2.2 0.5
activated microglial cells/mm2 was measured in the cortex of unaffected mice (Fig. 7.15C). A
177-fold increase in cortical staining was observed in uninjected MPS IIIA mice (ANOVA
p=0.0001). Similar patterns were observed in the cortices of PBS-treated and CAV-NS-
treated MPS IIIA mice, with 116- and 120-fold increases in the number of activated
microglia/mm2, respectively. CAV-NS treatment at birth did not alter the density of cortical
- 186 -
activated microglia in MPS IIIA mice (PBS 195 2.1; CAV-NS 267.6 63.6; p>0.05 post-
tests).
Likewise, very few activated microglia were observed in the granular cell layer of the
olfactory bulb in unaffected mice (range 2.1 1.2 to 11.1 5.3; Fig. 7.15D). Uninjected MPS
IIIA mice exhibited a 126-fold increase in isolectin B4-expressing cells compared to
uninjected unaffected mice (ANOVA p=0.0001). Administration of PBS or CAV-NS at birth
to MPS IIIA mice did not have a significant effect on the number of activated microglia/mm2
(220 18.9 or 219.2 59.1, respectively; p>0.05 post-tests).
7.3.6. In Vitro Cytotoxic Assessment of CAV-NS
7.3.6.1. NS Activity Time Course
Widespread and high-level GFP transgene expression was not maintained in vivo after
CAV-NS delivery to newborn mice. An in vitro experiment was therefore designed to
determine whether similar transgene kinetics were observed with the NS transgene using
primary cultured neural cells from newborn mice (Section 7.2.5). These experiments could
not be performed on samples collected from mice treated in vivo due to the undetectable NS
activity in CAV-NS-injected brain homogenates. In dialysed conditioned media samples, NS
activity was not detected above the assay background in any of the untreated wells (Fig.
7.16). Inoculation with CAV-NS at 1000 particles/cell resulted in high NS activity (375 85
pmol/min/mg total protein) at 3-days after transduction. However, NS activity was reduced by
13% and 56% at 6- and 9-days post-inoculation, respectively, compared to the NS activity
measured at 3-days post-transduction (ANOVA p=0.0001; post-test p=not significant at 6-
days post-transduction; post-test p<0.05 (t=4.77) at 9-days).
A similar NS activity pattern emerged in the CAV-NS-treated cell extracts.
Untransduced cell extracts had similar NS activity at all time-points (range of 37.1 3.9 to
51.8 11.5 pmol/min/mg total protein; Fig. 7.16). The highest NS activity was detected in
CAV-NS-treated cells at 3-days post-transduction, with a 26-fold increase compared to
untreated cells. However, whilst NS activity was elevated in comparison to untransduced cells
(16-fold and 12.5-fold more NS activity in CAV-NS-treated cells compared to untransduced
controls at 6- and 9-days post-transduction, respectively), NS activity was not maintained
with time. A 38% and 52% reduction in NS activity was observed in treated cells at 6- and 9-
days of culture compared to the activity measured after 3-days post-inoculation. However,
this reduction in NS activity was not statistically significant.
- 187 -
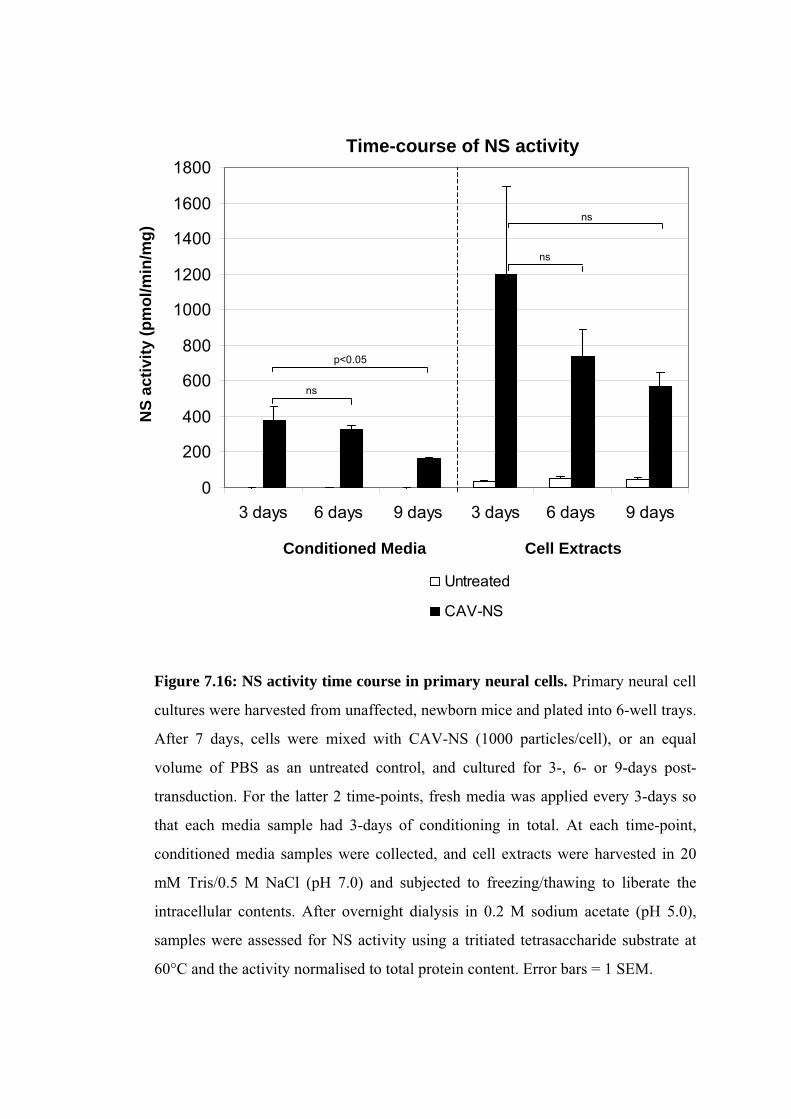
0
200
400
600
800
1000
1200
1400
1600
1800
3 days 6 days 9 days 3 days 6 days 9 days
NS
ac
tiv
ity (
pm
ol/
min
/mg
)
Conditioned Media Cell Extracts
Untreated
CAV-NS
Time-course of NS activity
ns
p<0.05
ns
ns
Figure 7.16: NS activity time course in primary neural cells. Primary neural cell
cultures were harvested from unaffected, newborn mice and plated into 6-well trays.
After 7 days, cells were mixed with CAV-NS (1000 particles/cell), or an equal
volume of PBS as an untreated control, and cultured for 3-, 6- or 9-days post-
transduction. For the latter 2 time-points, fresh media was applied every 3-days so
that each media sample had 3-days of conditioning in total. At each time-point,
conditioned media samples were collected, and cell extracts were harvested in 20
mM Tris/0.5 M NaCl (pH 7.0) and subjected to freezing/thawing to liberate the
intracellular contents. After overnight dialysis in 0.2 M sodium acetate (pH 5.0),
samples were assessed for NS activity using a tritiated tetrasaccharide substrate at
60°C and the activity normalised to total protein content. Error bars = 1 SEM.
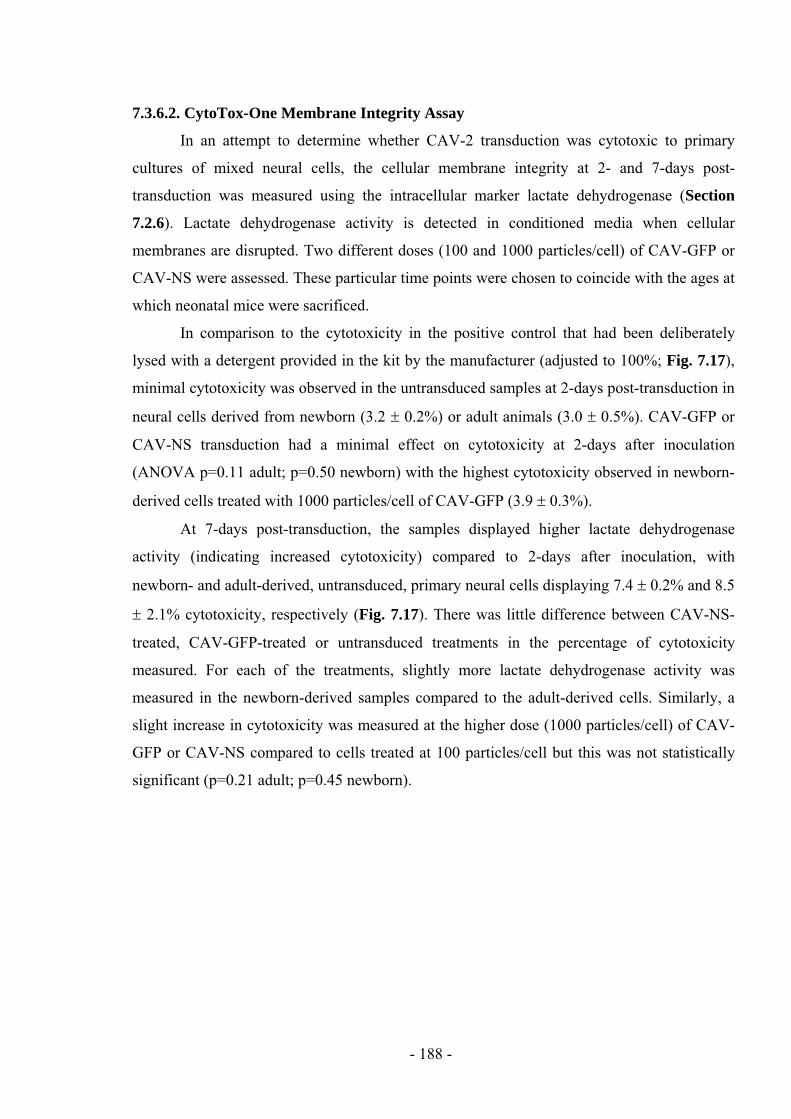
7.3.6.2. CytoTox-One Membrane Integrity Assay
In an attempt to determine whether CAV-2 transduction was cytotoxic to primary
cultures of mixed neural cells, the cellular membrane integrity at 2- and 7-days post-
transduction was measured using the intracellular marker lactate dehydrogenase (Section
7.2.6). Lactate dehydrogenase activity is detected in conditioned media when cellular
membranes are disrupted. Two different doses (100 and 1000 particles/cell) of CAV-GFP or
CAV-NS were assessed. These particular time points were chosen to coincide with the ages at
which neonatal mice were sacrificed.
In comparison to the cytotoxicity in the positive control that had been deliberately
lysed with a detergent provided in the kit by the manufacturer (adjusted to 100%; Fig. 7.17),
minimal cytotoxicity was observed in the untransduced samples at 2-days post-transduction in
neural cells derived from newborn (3.2 0.2%) or adult animals (3.0 0.5%). CAV-GFP or
CAV-NS transduction had a minimal effect on cytotoxicity at 2-days after inoculation
(ANOVA p=0.11 adult; p=0.50 newborn) with the highest cytotoxicity observed in newborn-
derived cells treated with 1000 particles/cell of CAV-GFP (3.9 0.3%).
At 7-days post-transduction, the samples displayed higher lactate dehydrogenase
activity (indicating increased cytotoxicity) compared to 2-days after inoculation, with
newborn- and adult-derived, untransduced, primary neural cells displaying 7.4 0.2% and 8.5
2.1% cytotoxicity, respectively (Fig. 7.17). There was little difference between CAV-NS-
treated, CAV-GFP-treated or untransduced treatments in the percentage of cytotoxicity
measured. For each of the treatments, slightly more lactate dehydrogenase activity was
measured in the newborn-derived samples compared to the adult-derived cells. Similarly, a
slight increase in cytotoxicity was measured at the higher dose (1000 particles/cell) of CAV-
GFP or CAV-NS compared to cells treated at 100 particles/cell but this was not statistically
significant (p=0.21 adult; p=0.45 newborn).
- 188 -
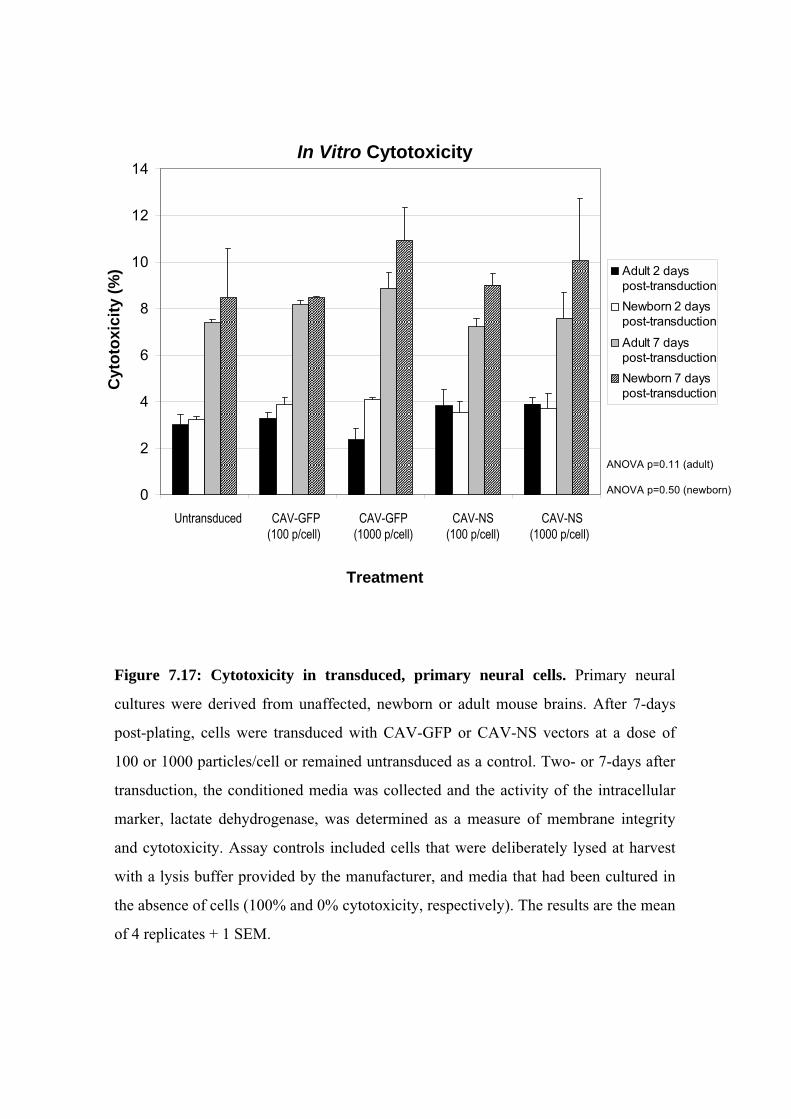
0
2
4
6
8
10
12
14
Adult 2 days
post-transduction
Newborn 2 days
post-transduction
Adult 7 days
post-transduction
Newborn 7 days
post-transduction
Cyto
tox
icit
y (
%)
Untransduced CAV-GFP CAV-GFP CAV-NS CAV-NS
(100 p/cell) (1000 p/cell) (100 p/cell) (1000 p/cell)
ANOVA p=0.11 (adult)
ANOVA p=0.50 (newborn)
In Vitro Cytotoxicity
Treatment
Figure 7.17: Cytotoxicity in transduced, primary neural cells. Primary neural
cultures were derived from unaffected, newborn or adult mouse brains. After 7-days
post-plating, cells were transduced with CAV-GFP or CAV-NS vectors at a dose of
100 or 1000 particles/cell or remained untransduced as a control. Two- or 7-days after
transduction, the conditioned media was collected and the activity of the intracellular
marker, lactate dehydrogenase, was determined as a measure of membrane integrity
and cytotoxicity. Assay controls included cells that were deliberately lysed at harvest
with a lysis buffer provided by the manufacturer, and media that had been cultured in
the absence of cells (100% and 0% cytotoxicity, respectively). The results are the mean
of 4 replicates + 1 SEM.
7.3.7. In Vivo Cytotoxic Assessment of CAV-NS via FISH
Method Development (Cell Smears and the XY18 Probe)
Fluorescence in situ hybridisation (FISH) was performed in CAV-treated human 293
cell smears to verify whether the signal generated by the probes was specific for the CAV-2
vector genome using fluorochrome-labelled pTG5412 (which could potentially detect the
genome of any CAV-2 vector) and pCAV-NS (potentially with improved sensitivity due to
the increased length of probe homology) DNA probes. The XY18 probe, specific for human
chromosomes X, Y and 18, acted as a positive control.
Untreated and CAV-GFP-treated 293 cells were hybridised at 75 C for 10 min
(Sections 2.2.7.1 and 2.2.7.3). The pCAV-NS and pTG5412 DNA probes were comparable in
signal localisation, intensity and in the degree of FISH-positive cells, with specific staining
localised in discrete, punctate dots at the periphery of the cell nucleus. Whilst >95% of CAV-
GFP-treated cells were GFP-positive, only a small fraction (~5%) of these cells displayed
FISH-positive signal. The signal detection with the XY18 probe was much greater than that
observed with the pTG5412 and pCAV-NS probes. No signal was detected in the untreated
control hybridised with the pTG5412 or pCAV-NS probes.
The XY18 probe was also hybridised at 75 C to human skin biopsies to optimise the
detection of DNA in paraffin sections for 5 or 15 min in the presence or absence of proteinase
K digestion using a flat-bed PCR machine (Section 2.2.7.3). The most abundant and sensitive
XY18 signal was detected with proteinase K pre-treatment for 15 min, indicating that DNA
could be detected by FISH in paraffin-embedded tissues.
Genomic DNA Extraction and FISH Detection in Paraffin-Embedded Mouse Tissues
No detectable CAV-NS genome FISH signal was observed in paraffin-embedded
mouse brain sections (1x10⁹ CAV-NS particles/hemisphere, 1-wk post-injection) when
hybridised at 75 C for 10 or 30 min with proteinase K pre-treatment. This tissue was selected
as maximal GFP expression was observed in the contralateral, cryo-embedded brain
hemisphere. Consequently, a method for extracting genomic DNA from PFA-fixed, paraffin-
embedded tissue was developed to confirm that the CAV-2 genome was present in the tissue
samples (Section 2.2.1.1). CAV-2 genome was only detected in brain tissues from mice
treated at the highest dose (1x10⁹ particles CAV-NS/hemisphere) at 2-days post-injection
(Table 7.4).
- 189 -
Table 7.4: CAV-2 genome detection. The CAV-2 genome was detected in paraffin-
embedded brain sections from mice injected with various doses of CAV-NS by: (a) PCR
amplification of the CAV-2 genome or the murine NS as a DNA extraction control; or (b)
localising the CAV-2 genome with a fluorochrome-labelled pCAV-NS probe via FISH.
nd, not detected.
Time post-injection (n=2/group)CAV-NS Dose (particles/hemisphere)
2-days 1-wk 2-wks
5x10⁶
PCR
FISH
nd
nd
nd
nd
nd
nd
1x10⁷
PCR
FISH
Not assessed (pups found dead) nd
nd
nd
nd
1x10⁸
PCR
FISH
nd
nd
nd
nd
nd
nd
1x10⁹
PCR
FISH
Present (n=2/2)
Present
Lateral ventricle (n=2/2)
Corpus callosum (n=2/2)
nd
Present
Lateral ventricle (n=2/2)
Corpus callosum (n=1/2)
Olfactory bulb (n=1/2)
nd
nd
As a result, a biotinylated-CAV-NS probe was hybridised to CAV-2 genome-positive
tissues (as detected by PCR amplification) and compared to the signal obtained with a
fluorochrome-labelled CAV-NS probe to determine whether the signal could be amplified
(Section 2.2.7.4). Two probe concentrations (3 or 6 L/section) of biotinylated- or
fluorochrome-labelled probe were hybridised for 30 min at 75 C or 78 C. FISH signal was
detected in all samples, with discrete, punctate dots observed around the periphery of the
nucleus (Fig. 7.18). Hybridisation at 78 C with 6 L/section of probe produced the most
sensitive signal detection, regardless of whether a biotinylated- or fluorochrome-labelled
probe was used.
CAV-2 DNA was not detected in any of the mice treated with 5x10⁶, 1x10
7 or 1x10
8
particles of CAV-NS when assessed by the optimised FISH method (Table 7.4). In contrast,
viral DNA was observed in both mice treated with 1x10⁹
CAV-NS particles/hemisphere at 2-
days or 1-wk, but not at 2-wks post-delivery, with signal observed in the ependymal cell layer
adjacent to the lateral ventricular space (Fig. 7.18 and Table 7.4). In addition, CAV-2 DNA
was observed within the corpus callosum of mice injected with 1 x 10⁹
particles CAV-NS at
2-days- and 1-wk post-delivery. CAV-2 vector genome signal was also observed within the
- 190 -
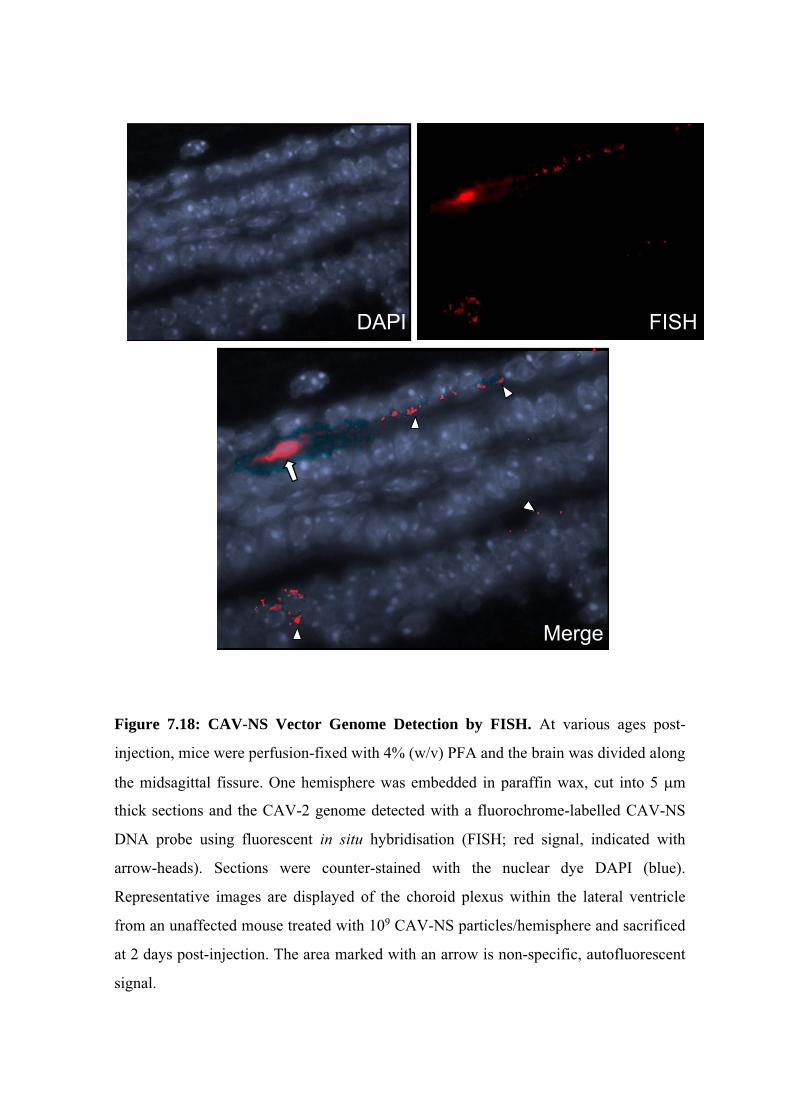
DAPI FISH
Merge
Figure 7.18: CAV-NS Vector Genome Detection by FISH. At various ages post-
injection, mice were perfusion-fixed with 4% (w/v) PFA and the brain was divided along
the midsagittal fissure. One hemisphere was embedded in paraffin wax, cut into 5 m
thick sections and the CAV-2 genome detected with a fluorochrome-labelled CAV-NS
DNA probe using fluorescent in situ hybridisation (FISH; red signal, indicated with
arrow-heads). Sections were counter-stained with the nuclear dye DAPI (blue).
Representative images are displayed of the choroid plexus within the lateral ventricle
from an unaffected mouse treated with 109 CAV-NS particles/hemisphere and sacrificed
at 2 days post-injection. The area marked with an arrow is non-specific, autofluorescent
signal.
olfactory bulb. However, by 2-wks post-injection no discernable CAV-2 genome signal was
apparent in mice treated with CAV-NS, regardless of the dose administered.
7.4. DISCUSSION
The major aim of this study was to determine whether early intervention with CAV-
NS gene therapy could ameliorate the MPS IIIA disease phenotype. Consequently, CAV-NS
was injected into the lateral ventricles of newborn unaffected and MPS IIIA mice. Uninjected
mice and PBS vehicle-treated mice were included as controls. The mice were sacrificed at
various times post-injection to evaluate the biodistribution, amount of transgene expression
and the effect on neuropathology using biochemical (HNS-UA storage) or histological
analyses (lysosomal vacuolation, astrogliosis and activated microglia). In addition, mice
underwent testing in a behavioural test battery to determine whether CAV-NS administration
mediated improvements in the clinical symptoms of MPS IIIA mice. The effect of CAV-NS
treatment on each of these aspects of MPS IIIA pathology will be discussed.
7.4.1. Biochemistry
Following CAV-NS delivery to newborn mice, limited NS activity and rhNS protein
was detected in treated brain homogenates. The maximum rhNS expression mediated by
CAV-NS was ~7.5 ng rhNS/mg total protein at 1-wk post-injection. In comparison, rhNS
delivered intravenously to newborn MPS IIIA mice at 1 mg/kg resulted in rhNS
concentrations of 180 and 45 ng rhNS/mg total protein in whole brains at 1- and 24-hrs post-
injection, respectively (Gliddon and Hopwood, 2004). Weekly intravenous rhNS ERT at this
dose improved the memory and spatial learning capabilities and reduced lysosomal storage
vacuoles in the brains of MPS IIIA mice treated from birth (Gliddon and Hopwood, 2004).
Similar amounts of HNS-UA disaccharide storage were measured in the olfactory bulb
and a hemi-coronal brain slice containing the injection site in MPS IIIA mice treated with
PBS or CAV-NS. Although individual CAV-NS-treated MPS IIIA mice had reduced HNS-
UA storage when compared to PBS-treated MPS IIIA animals, the intra-group variation (as
well as the potential dilution of localised reductions in storage by untransduced regions, due
to assessing the tissues in coronal brain slices) made it difficult to determine whether CAV-
NS administration had mediated a subtle improvement in lysosomal storage.
- 191 -
7.4.2. Histology
As significant reductions in HNS-UA content were not observed in treated MPS IIIA
mice, histological analyses were undertaken to examine whether localised correction of
lysosomal storage was achieved after CAV-NS vector administration at birth. Three separate
methods were employed to assess various components of MPS IIIA histopathology.
1) Vacuolation
The almost complete absence of storage vacuoles in the choroid plexus and ependymal
cells of the lateral ventricle in CAV-NS-treated MPS IIIA mice suggested that the initial high
burst of transgene expression, together with residual low-level transgene expression, was
sufficient to delay/prevent vacuole formation at the injection site. In the absence of continued
rhNS expression, storage vacuoles can re-accumulate in cortical cells approximately 6- to 8-
wks after intravenous rhNS treatment in newborn MPS IIIA mice (Gliddon and Hopwood,
2004). Similarly, storage re-accumulates in adult MPS IIIA mice receiving intracerebral
injections of purified rhNS, with substantial reductions in vacuolation in Purkinje neurons and
hippocampal granule cells in animals injected 6-wks prior to sacrifice (compared to the
vacuolation when treated >12-wks prior to sacrifice), when all treatment groups are
euthanased at the same age (Savas et al, 2004).
CAV-NS-mediated decreases in the frequency of (and the number of vacuoles
contained within) cortical, vacuolated cells in MPS IIIA mice demonstrated that this treatment
effect was not restricted to the injection site. Further, reduced vacuolation at both the cortical
surface as well as within deeper layers (further and closer to the injection site, respectively)
implies that a treatment gradient effect was not present at 20-wks post-delivery.
Unsurprisingly, the degree of correction was not as remarkable in the cortex (where transgene
expression was only observed at 1-wk after CAV-NS delivery) as in the lateral ventricle
injection site, where GFP expression was detected at every time-point assessed (7 time-points,
ranging from 2-days to 20-wks post-injection).
2) Astrogliosis
Increased GFAP expression, as a marker of reactive gliosis, has previously been
documented in the brainstem, superior colliculus, cortex, and the gracile and cuneate nuclei in
MPS IIIA mice (Savas et al, 2004), and in the cortex and hippocampus of MPS IIIB mice (Li
et al, 2002). Improvements in astrogliosis were observed in the cortex of CAV-NS-treated
MPS IIIA mice (compared to MPS IIIA mice receiving PBS). However, significant
- 192 -
differences were not achieved in the cortex or olfactory bulb (p=0.054, 0.13), which may
relate to the small sample size. In a study where mice were treated with purified rhNS at
various stages of MPS IIIA disease progression, a re-occurrence of astrogliosis was observed
in MPS IIIA mice treated 18-wks prior to sacrifice, whilst animals treated 6-wks before
sacrifice displayed a nearly complete elimination of reactive gliosis (Savas et al, 2004). It is
possible that greater improvements in reactive gliosis were achieved by CAV-NS treatment in
MPS IIIA mice, but the treatment effect was lost soon after cessation of high transgene
expression.
3) Microglial Activation
Activated microglia have also been implicated in the neurodegenerative process in
mouse models of MPS I and MPS IIIB (Ohmi et al, 2003), Sandhoff disease (Wada et al,
2000), metachromatic leukodystrophy (Hess et al, 1996) and Niemann Pick type C disease
(German et al, 2002). In the two areas examined in this study (the olfactory bulb and cerebral
cortex), isolectin B4-positive activated microglia were detected more frequently in uninjected
MPS IIIA mice than in their unaffected counterparts. CAV-NS treatment did not influence the
density of activated microglia in either of the structures assessed, suggesting that some
pathological changes (e.g. activated microglia) may be more refractory to treatment than
others (e.g. gliosis, vacuolation). Indeed, the inability of purified rhNS to treat another
pathological change - ubiquitin-positive axonal spheroids - that are already present before the
initiation of intracerebral therapy, supports this hypothesis (Savas et al, 2004). Alternatively,
the amount of rhNS produced or the short duration of high-level transgene expression may
have been insufficient to treat the microglial activation in MPS IIIA mice. Assessing the
isolectin B4 staining patterns of CAV-NS-treated MPS IIIA mice at earlier time-points after
injection may clarify this situation.
Using additional immunohistochemical markers, such as HS, GM2 and GM3
gangliosides, cholesterol and ubiquitin (McGlynn et al, 2004; Savas et al, 2004), will aid in
characterising the efficacy of CAV-NS therapy. Transmission electron microscopic analysis
may also be beneficial in examining the effect of treatment (and the ultrastructure of the
storage material within the inclusions) at various ages after CAV-2 delivery (Gliddon and
Hopwood, 2004; Hemsley et al, 2007), particularly at the injection site and the olfactory bulb
where high-level transgene expression were observed.
- 193 -
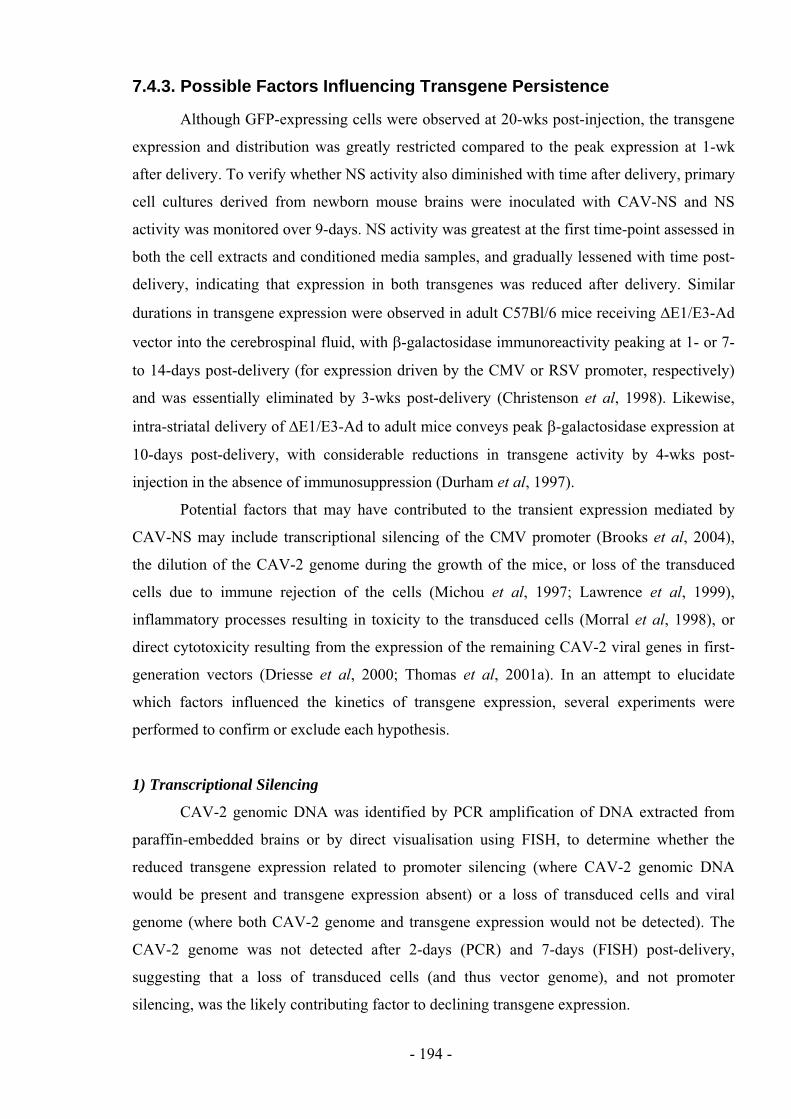
7.4.3. Possible Factors Influencing Transgene Persistence
Although GFP-expressing cells were observed at 20-wks post-injection, the transgene
expression and distribution was greatly restricted compared to the peak expression at 1-wk
after delivery. To verify whether NS activity also diminished with time after delivery, primary
cell cultures derived from newborn mouse brains were inoculated with CAV-NS and NS
activity was monitored over 9-days. NS activity was greatest at the first time-point assessed in
both the cell extracts and conditioned media samples, and gradually lessened with time post-
delivery, indicating that expression in both transgenes was reduced after delivery. Similar
durations in transgene expression were observed in adult C57Bl/6 mice receiving E1/E3-Ad
vector into the cerebrospinal fluid, with -galactosidase immunoreactivity peaking at 1- or 7-
to 14-days post-delivery (for expression driven by the CMV or RSV promoter, respectively)
and was essentially eliminated by 3-wks post-delivery (Christenson et al, 1998). Likewise,
intra-striatal delivery of E1/E3-Ad to adult mice conveys peak -galactosidase expression at
10-days post-delivery, with considerable reductions in transgene activity by 4-wks post-
injection in the absence of immunosuppression (Durham et al, 1997).
Potential factors that may have contributed to the transient expression mediated by
CAV-NS may include transcriptional silencing of the CMV promoter (Brooks et al, 2004),
the dilution of the CAV-2 genome during the growth of the mice, or loss of the transduced
cells due to immune rejection of the cells (Michou et al, 1997; Lawrence et al, 1999),
inflammatory processes resulting in toxicity to the transduced cells (Morral et al, 1998), or
direct cytotoxicity resulting from the expression of the remaining CAV-2 viral genes in first-
generation vectors (Driesse et al, 2000; Thomas et al, 2001a). In an attempt to elucidate
which factors influenced the kinetics of transgene expression, several experiments were
performed to confirm or exclude each hypothesis.
1) Transcriptional Silencing
CAV-2 genomic DNA was identified by PCR amplification of DNA extracted from
paraffin-embedded brains or by direct visualisation using FISH, to determine whether the
reduced transgene expression related to promoter silencing (where CAV-2 genomic DNA
would be present and transgene expression absent) or a loss of transduced cells and viral
genome (where both CAV-2 genome and transgene expression would not be detected). The
CAV-2 genome was not detected after 2-days (PCR) and 7-days (FISH) post-delivery,
suggesting that a loss of transduced cells (and thus vector genome), and not promoter
silencing, was the likely contributing factor to declining transgene expression.
- 194 -
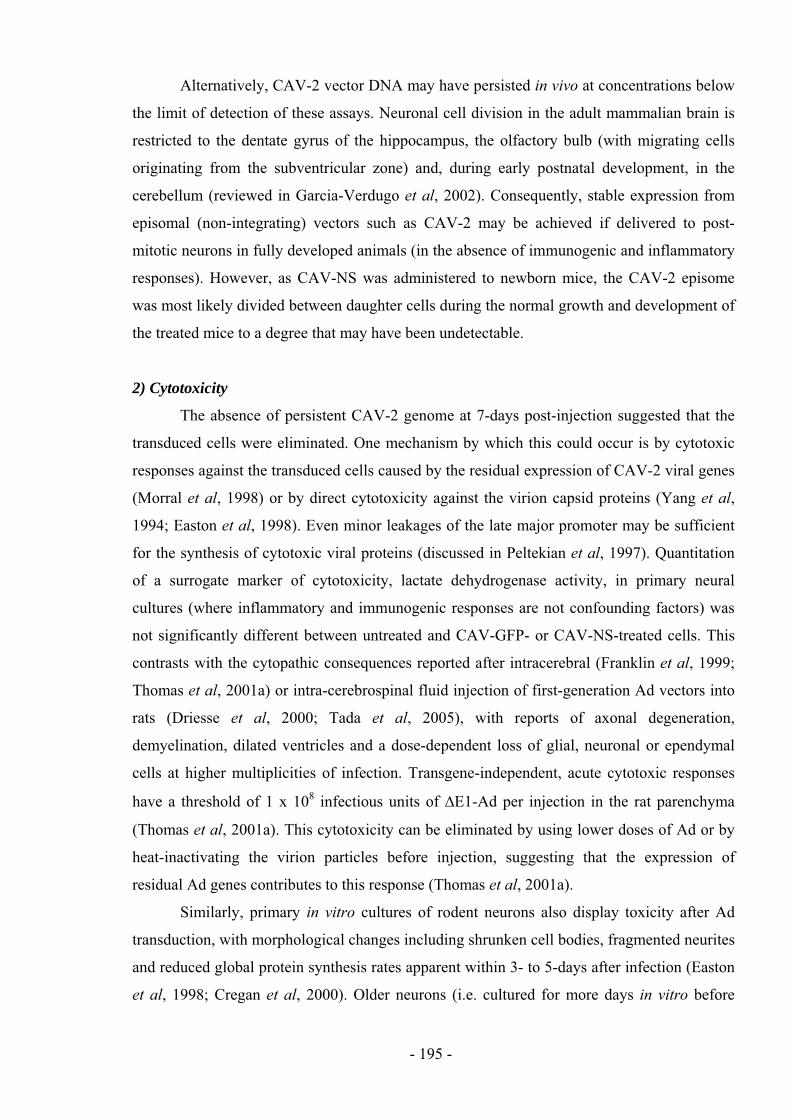
Alternatively, CAV-2 vector DNA may have persisted in vivo at concentrations below
the limit of detection of these assays. Neuronal cell division in the adult mammalian brain is
restricted to the dentate gyrus of the hippocampus, the olfactory bulb (with migrating cells
originating from the subventricular zone) and, during early postnatal development, in the
cerebellum (reviewed in Garcia-Verdugo et al, 2002). Consequently, stable expression from
episomal (non-integrating) vectors such as CAV-2 may be achieved if delivered to post-
mitotic neurons in fully developed animals (in the absence of immunogenic and inflammatory
responses). However, as CAV-NS was administered to newborn mice, the CAV-2 episome
was most likely divided between daughter cells during the normal growth and development of
the treated mice to a degree that may have been undetectable.
2) Cytotoxicity
The absence of persistent CAV-2 genome at 7-days post-injection suggested that the
transduced cells were eliminated. One mechanism by which this could occur is by cytotoxic
responses against the transduced cells caused by the residual expression of CAV-2 viral genes
(Morral et al, 1998) or by direct cytotoxicity against the virion capsid proteins (Yang et al,
1994; Easton et al, 1998). Even minor leakages of the late major promoter may be sufficient
for the synthesis of cytotoxic viral proteins (discussed in Peltekian et al, 1997). Quantitation
of a surrogate marker of cytotoxicity, lactate dehydrogenase activity, in primary neural
cultures (where inflammatory and immunogenic responses are not confounding factors) was
not significantly different between untreated and CAV-GFP- or CAV-NS-treated cells. This
contrasts with the cytopathic consequences reported after intracerebral (Franklin et al, 1999;
Thomas et al, 2001a) or intra-cerebrospinal fluid injection of first-generation Ad vectors into
rats (Driesse et al, 2000; Tada et al, 2005), with reports of axonal degeneration,
demyelination, dilated ventricles and a dose-dependent loss of glial, neuronal or ependymal
cells at higher multiplicities of infection. Transgene-independent, acute cytotoxic responses
have a threshold of 1 x 10⁸ infectious units of E1-Ad per injection in the rat parenchyma
(Thomas et al, 2001a). This cytotoxicity can be eliminated by using lower doses of Ad or by
heat-inactivating the virion particles before injection, suggesting that the expression of
residual Ad genes contributes to this response (Thomas et al, 2001a).
Similarly, primary in vitro cultures of rodent neurons also display toxicity after Ad
transduction, with morphological changes including shrunken cell bodies, fragmented neurites
and reduced global protein synthesis rates apparent within 3- to 5-days after infection (Easton
et al, 1998; Cregan et al, 2000). Older neurons (i.e. cultured for more days in vitro before
- 195 -
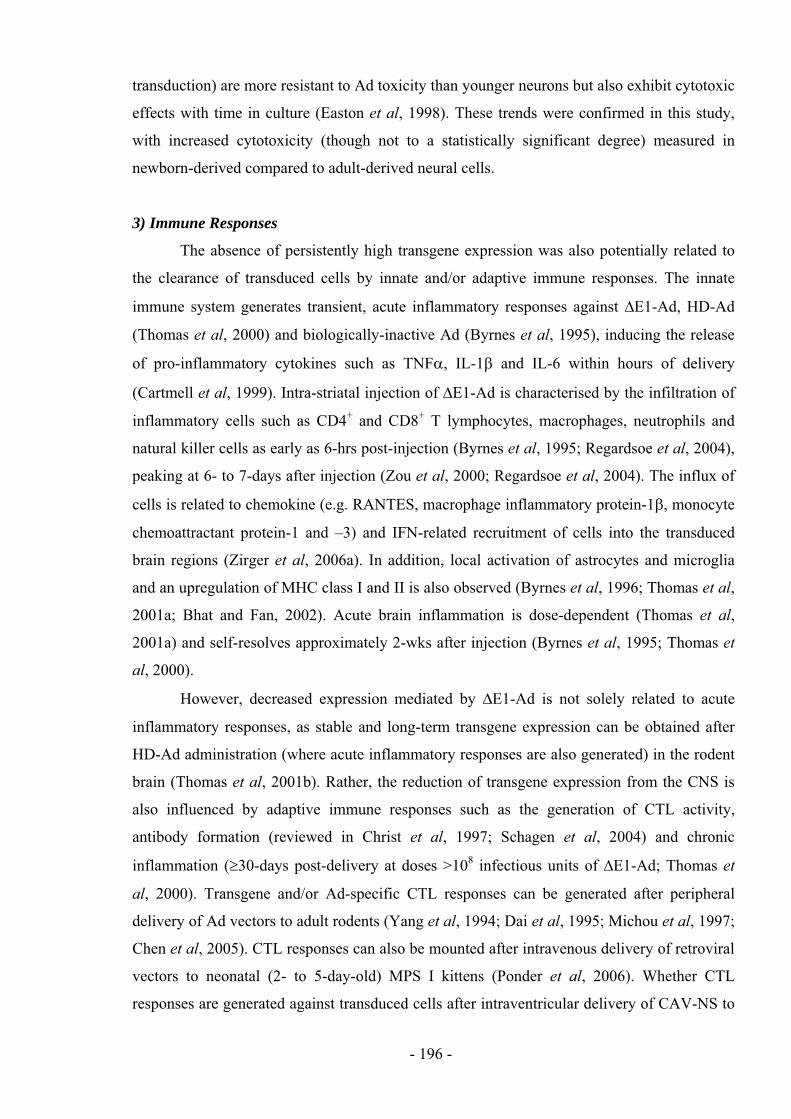
transduction) are more resistant to Ad toxicity than younger neurons but also exhibit cytotoxic
effects with time in culture (Easton et al, 1998). These trends were confirmed in this study,
with increased cytotoxicity (though not to a statistically significant degree) measured in
newborn-derived compared to adult-derived neural cells.
3) Immune Responses
The absence of persistently high transgene expression was also potentially related to
the clearance of transduced cells by innate and/or adaptive immune responses. The innate
immune system generates transient, acute inflammatory responses against E1-Ad, HD-Ad
(Thomas et al, 2000) and biologically-inactive Ad (Byrnes et al, 1995), inducing the release
of pro-inflammatory cytokines such as TNF , IL-1 and IL-6 within hours of delivery
(Cartmell et al, 1999). Intra-striatal injection of E1-Ad is characterised by the infiltration of
inflammatory cells such as CD4+ and CD8
+ T lymphocytes, macrophages, neutrophils and
natural killer cells as early as 6-hrs post-injection (Byrnes et al, 1995; Regardsoe et al, 2004),
peaking at 6- to 7-days after injection (Zou et al, 2000; Regardsoe et al, 2004). The influx of
cells is related to chemokine (e.g. RANTES, macrophage inflammatory protein-1 , monocyte
chemoattractant protein-1 and –3) and IFN-related recruitment of cells into the transduced
brain regions (Zirger et al, 2006a). In addition, local activation of astrocytes and microglia
and an upregulation of MHC class I and II is also observed (Byrnes et al, 1996; Thomas et al,
2001a; Bhat and Fan, 2002). Acute brain inflammation is dose-dependent (Thomas et al,
2001a) and self-resolves approximately 2-wks after injection (Byrnes et al, 1995; Thomas et
al, 2000).
However, decreased expression mediated by E1-Ad is not solely related to acute
inflammatory responses, as stable and long-term transgene expression can be obtained after
HD-Ad administration (where acute inflammatory responses are also generated) in the rodent
brain (Thomas et al, 2001b). Rather, the reduction of transgene expression from the CNS is
also influenced by adaptive immune responses such as the generation of CTL activity,
antibody formation (reviewed in Christ et al, 1997; Schagen et al, 2004) and chronic
inflammation ( 30-days post-delivery at doses >108 infectious units of E1-Ad; Thomas et
al, 2000). Transgene and/or Ad-specific CTL responses can be generated after peripheral
delivery of Ad vectors to adult rodents (Yang et al, 1994; Dai et al, 1995; Michou et al, 1997;
Chen et al, 2005). CTL responses can also be mounted after intravenous delivery of retroviral
vectors to neonatal (2- to 5-day-old) MPS I kittens (Ponder et al, 2006). Whether CTL
responses are generated against transduced cells after intraventricular delivery of CAV-NS to
- 196 -
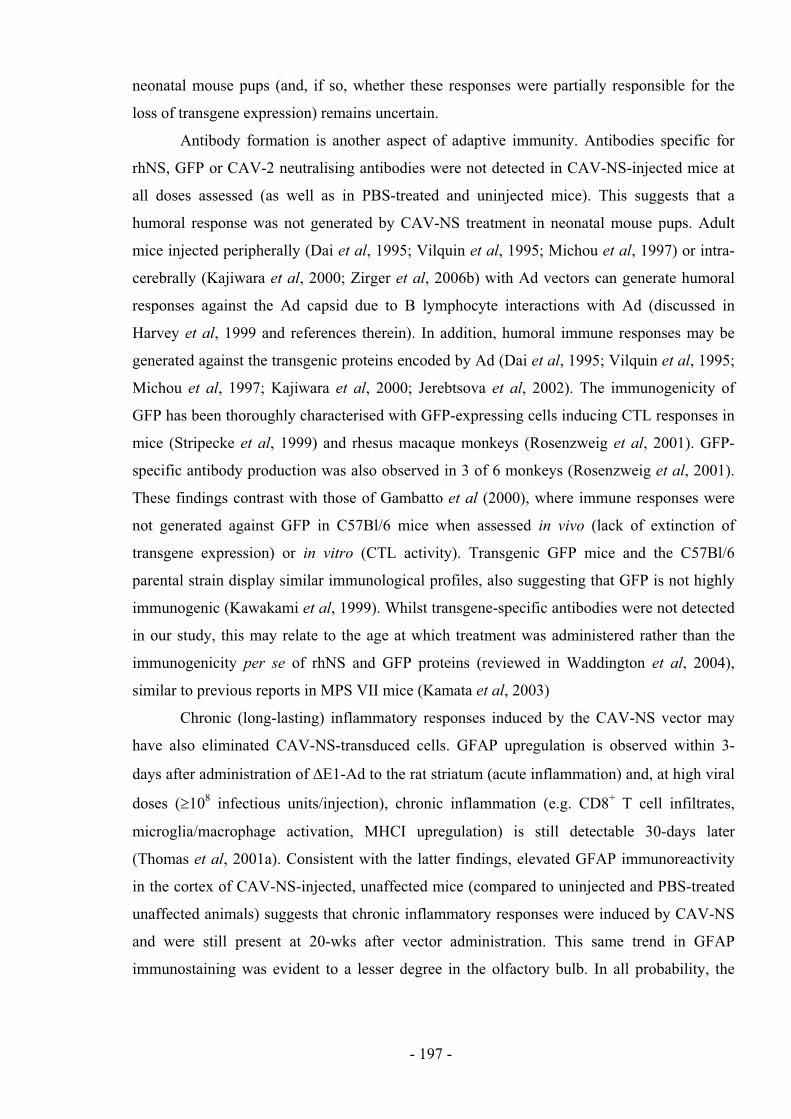
neonatal mouse pups (and, if so, whether these responses were partially responsible for the
loss of transgene expression) remains uncertain.
Antibody formation is another aspect of adaptive immunity. Antibodies specific for
rhNS, GFP or CAV-2 neutralising antibodies were not detected in CAV-NS-injected mice at
all doses assessed (as well as in PBS-treated and uninjected mice). This suggests that a
humoral response was not generated by CAV-NS treatment in neonatal mouse pups. Adult
mice injected peripherally (Dai et al, 1995; Vilquin et al, 1995; Michou et al, 1997) or intra-
cerebrally (Kajiwara et al, 2000; Zirger et al, 2006b) with Ad vectors can generate humoral
responses against the Ad capsid due to B lymphocyte interactions with Ad (discussed in
Harvey et al, 1999 and references therein). In addition, humoral immune responses may be
generated against the transgenic proteins encoded by Ad (Dai et al, 1995; Vilquin et al, 1995;
Michou et al, 1997; Kajiwara et al, 2000; Jerebtsova et al, 2002). The immunogenicity of
GFP has been thoroughly characterised with GFP-expressing cells inducing CTL responses in
mice (Stripecke et al, 1999) and rhesus macaque monkeys (Rosenzweig et al, 2001). GFP-
specific antibody production was also observed in 3 of 6 monkeys (Rosenzweig et al, 2001).
These findings contrast with those of Gambatto et al (2000), where immune responses were
not generated against GFP in C57Bl/6 mice when assessed in vivo (lack of extinction of
transgene expression) or in vitro (CTL activity). Transgenic GFP mice and the C57Bl/6
parental strain display similar immunological profiles, also suggesting that GFP is not highly
immunogenic (Kawakami et al, 1999). Whilst transgene-specific antibodies were not detected
in our study, this may relate to the age at which treatment was administered rather than the
immunogenicity per se of rhNS and GFP proteins (reviewed in Waddington et al, 2004),
similar to previous reports in MPS VII mice (Kamata et al, 2003)
Chronic (long-lasting) inflammatory responses induced by the CAV-NS vector may
have also eliminated CAV-NS-transduced cells. GFAP upregulation is observed within 3-
days after administration of E1-Ad to the rat striatum (acute inflammation) and, at high viral
doses ( 108 infectious units/injection), chronic inflammation (e.g. CD8
+ T cell infiltrates,
microglia/macrophage activation, MHCI upregulation) is still detectable 30-days later
(Thomas et al, 2001a). Consistent with the latter findings, elevated GFAP immunoreactivity
in the cortex of CAV-NS-injected, unaffected mice (compared to uninjected and PBS-treated
unaffected animals) suggests that chronic inflammatory responses were induced by CAV-NS
and were still present at 20-wks after vector administration. This same trend in GFAP
immunostaining was evident to a lesser degree in the olfactory bulb. In all probability, the
- 197 -
extinction of high-level transgene expression mediated by E1 CAV-NS was influenced by a
combination of these (and potentially other) factors rather than by one sole factor.
7.4.4. Behavioural Phenotype Assessment of CAV-NS-Treated Mice
Two treatment effects were analysed in the behavioural test battery: firstly, whether
the surgical procedures (cryo-anaesthesia/intraventricular injections) altered the behaviour of
injected mice compared to uninjected control mice and, secondly, whether treatment with
CAV-NS gene therapy normalised the disease phenotype in MPS IIIA mice. The results of the
majority of the behavioural studies reported throughout this chapter were not statistically
significant. Although the surgical procedures in anaesthetised/injected animals may explain
the behavioural differences in the PBS- and CAV-NS-treated groups, the lack of separation
between uninjected unaffected and MPS IIIA mice (at ages where discrimination between the
disease groups has previously been observed) indicated possible underlying problems in the
manner in which the tests were conducted. Whilst every care was taken to standardise the
testing procedures, there are several possible explanations as to why the tests failed to
discriminate between the two genotypes.
The long-term nature of this study may have resulted in the mice habituating to human
handling, the behavioural testing room and the testing apparatus (for the tests performed
twice; open field activity, motor function tests). In addition, the tests were conducted as a
behavioural test battery in an attempt to examine multiple aspects of behaviour in what was
considered to be in order from least to most invasive, similar to the rationale of other groups
(McIlwain et al, 2001). This was also the chronological order in which pathological changes
were observed (Hemsley and Hopwood, 2005). Consistent with other reports (McIlwain et al,
2001; Voikar et al, 2004), battery-testing appeared to influence the behavioural profile of the
animals when compared to non-battery-tested mice (Chapter 6; unpublished observations,
LDRU; Gliddon and Hopwood, 2004; Hemsley and Hopwood, 2005). For example, battery-
tested mice appeared less anxious and fearful than (infrequently handled) non-battery-tested
animals, as evidenced by the percentage of entries into open arms in the Elevated Plus Maze.
Exploratory and emotional behaviours are the most sensitive traits affected by prior
training history in a test battery (Voikar et al, 2004). Battery-tested, male C57Bl/6 mice are
less active (reduced path length and number of rears) than non-battery-tested animals when
normalised for handling effects (i.e. non-battery-tested mice were removed from cages and
transferred to the testing area an equal number of times as battery-tested mice; McIlwain et al,
- 198 -
2001; Voikar et al, 2004). Consistent with previous reports (LDRU unpublished observations,
Hemsley and Hopwood, 2005; Crawley et al, 2006a), 10-wk-old uninjected MPS IIIA mice
were less active than uninjected unaffected animals and statistically significant differences
were not observed, potentially due to testing as part of a test battery. In addition, PBS- or
CAV-NS-injected unaffected and MPS IIIA mice were less active than genotype-matched,
uninjected animals, indicating that the surgical procedures altered the behaviour of injected
mice. The reduced activity displayed in all groups tested in the open field at 19-wks (when
compared to 10-wks) may be a habituation effect to the operator, testing arena and room, in
combination with the influence of prior training in the test battery.
The emotional profiles of C57Bl/6 mice are also altered when assessed as part of a
behavioural battery or in a naïve state, with significant differences in several anxiety-related
parameters (latency to first open arm entry, the number of open arm entries, the percentage of
open arm entries and the percentage of time spent on open arms; Voikar et al, 2004). In our
study, uninjected test-battery mice displayed lower anxiety scores in the Elevated Plus Maze
than non-battery-tested uninjected mice (entries into the open arms, time spent on the open
arms and path length on the open arms). Also, battery-tested C57Bl/6 mice display decreased
exploratory behaviour compared to non-battery-tested mice as measured by the path length
and the total number of arm entries (this study and Voikar et al, 2004). The differences
between the battery- and non-battery-tested mice in the open field activity and Elevated Plus
Maze tests are hypothesised to relate to changes in the motivational state of the animals
(Voikar et al, 2004).
Non-battery-tested, male “New York” MPS IIIA mice have unaltered gait lengths,
decreased gait widths ( 15-wks of age), take longer to re-orient themselves in the negative
geotaxis test ( 20-wks) and show reduced neuromuscular grip strength ( 20-wks) compared
to their unaffected counterparts (Hemsley and Hopwood, 2005). In contrast, battery-tested,
male congenic MPS IIIA mice display reduced gait lengths and widths, are not different in the
negative geotaxis test and have reduced grip strength compared to unaffected animals
(Crawley et al, 2006a). The discrepancies between these studies may reflect differences
between the strains and training history of the tested mice. Whilst MPS IIIA mice in the
current study were more likely to also have reduced gait width and take longer to re-orientate
themselves in the negative geotaxis test than unaffected mice, the majority of the battery-
tested mice from both genotypes passed the neuromuscular grip strength test at 19-wks of age.
Superior motor co-ordination on the rotorod has previously been observed in battery-tested
mice compared to naïve-tested animals (McIlwain et al, 2001; Voikar et al, 2004).
- 199 -
Newborn MPS IIIA mice receiving cryo-anaesthesia and bilateral injections of PBS
display impaired memory and spatial learning compared to PBS-treated unaffected mice at
20-wks of age (Fraldi et al, 2006). The cognitive deficits in MPS IIIA mice can be improved
by treatment with an AAV vector encoding NS and SUMF1 (Fraldi et al, 2006). Based on
these findings (and the data presented in Chapter 6 and Crawley et al, 2006a), the mice in
this study were assessed in the Morris Water Maze at 20-wks of age. Unexpectedly, the
uninjected and PBS-treated MPS IIIA mice performed well in the acquisition phase. The
major differences between the this study and the Fraldi et al (2006) study were that the mice
in the AAV study were (a) not handled as frequently, (b) assessed in a less invasive
behavioural battery (three open field activity tests at 10-, 15- and 18-wks and one gait
assessment at 18-wks prior to Morris Water Maze testing at 20-wks), (c) were tested in the
same order each day over 1-wk and (d) the experimenter was not blinded to the
treatment/genotype of the mice during testing (Dr Kim Hemsley, personal communication).
Battery-tested mice have been documented as being less proficient at using a spatially
selective search pattern to locate the hidden platform in the probe phase of the Morris Water
Maze compared to non-battery-tested mice (McIlwain et al, 2001). These observations do not
support the data in this thesis, which showed that all groups were highly selective in searching
the target quadrant during the probe phase. The week in which mice were tested affected the
performance in the visible platform test and the cause/s of this variation is unclear.
For subsequent behavioural analyses, using fewer tests and not repeating the same test
in a battery may provide phenotypic information that is more consistent with non-battery-
tested animals. Home cage activity monitoring may provide data on the activity and
sleep/wake patterns of unaffected and MPS IIIA mice in a less invasive manner than open
field activity testing. Home cage activity differences have been reported in mouse models of
MPS I (Jordan et al, 2005) and MPS IIIB (Cressant et al, 2004). Elevated Plus Maze testing
should be the first component of the battery due to the sensitivity of this test to environmental
and procedural manipulations (Voikar et al, 2004; Carobrez and Bertoglio, 2005). The
cognitive function of MPS IIIA mice cannot be assessed via the Morris Water Maze after 25-
wks of age due to statistically significant differences in swim speed between unaffected and
MPS IIIA mice (unpublished observations, LDRU). Other memory and learning tests (e.g.
fear conditioning, conditioned taste aversion or novel object recognition tests) may be
valuable in assessing cognition in unaffected and MPS IIIA mice at older ages, where the
disease phenotype may be more readily discriminated from wild-type mice.
- 200 -
7.4.4. Safety
Another important aspect of E1 CAV-2 gene therapy is the safety of this treatment
modality. The CAV-NS vector was tolerated well when administered under cryo-anaesthesia
to neonatal mouse pups. The survival of 87% of CAV-NS-treated mice was comparable to
uninjected and PBS-treated mice (93-94%) and to those detailed in Chapter 5. An increased
incidence of hydrocephalus (3.7%) was observed in the cryo-anaesthetised/injected mice
compared to the rates observed within the congenic mouse colony (3/1000 mice, 0.3%;
unpublished LDRU records). Given that cerebrospinal fluid is produced in the epithelial cells
of the choroid plexus (reviewed in Brown et al, 2004), it may not be surprising that damage
results in the abnormal secretion/drainage of cerebrospinal fluid after injection into the lateral
ventricle. Comparable incidences of hydrocephalus after cryo-anaesthesia/intraventricular
delivery of cells or AAV vectors to newborn mice have been observed (unpublished
observations, LDRU) suggesting that the hydrocephalus was influenced by the method of
delivery rather than the CAV-NS vector.
E1 CAV-2 treatment did not result in antibody production against the CAV-2 capsid,
or rhNS or GFP transgenic proteins (compared to PBS-treated and uninjected mice). This
suggests that humoral responses will not be generated against the HD CAV-2 vectors if they
are delivered in the neonatal period.
7.5. SUMMARY AND CONCLUSIONS
Intraventricular administration of E1 CAV-NS to newborn MPS IIIA mice resulted
in transgene expression for >20-wks and mediated a reduction in both vacuolation and the
reactive astrogliosis associated with the MPS IIIA disease process. However, the amount of
NS generated by CAV-NS was insufficient to significantly alter several clinical parameters
(as assessed by a battery of behavioural tests) as well as other pathological changes (HS-
disaccharide storage, activated microglia).
The loss of CAV-2 vector genome and high-level transgene expression after
approximately 1-wk post-injection was potentially caused by chronic inflammatory responses
(as detected by elevated GFAP staining) against the E1 CAV-NS vector. Other factors
potentially played a less significant role (direct vector-mediated cytotoxicity) or were not
responsible for the reduction in high-level transgene expression (transgene silencing, humoral
responses). In conclusion, whilst improvements in some aspects of neuropathology were
observed in treated MPS IIIA mice, early intervention with E1 CAV-NS gene therapy was
unable to significantly alter the course of MPS IIIA disease progression.
- 201 -
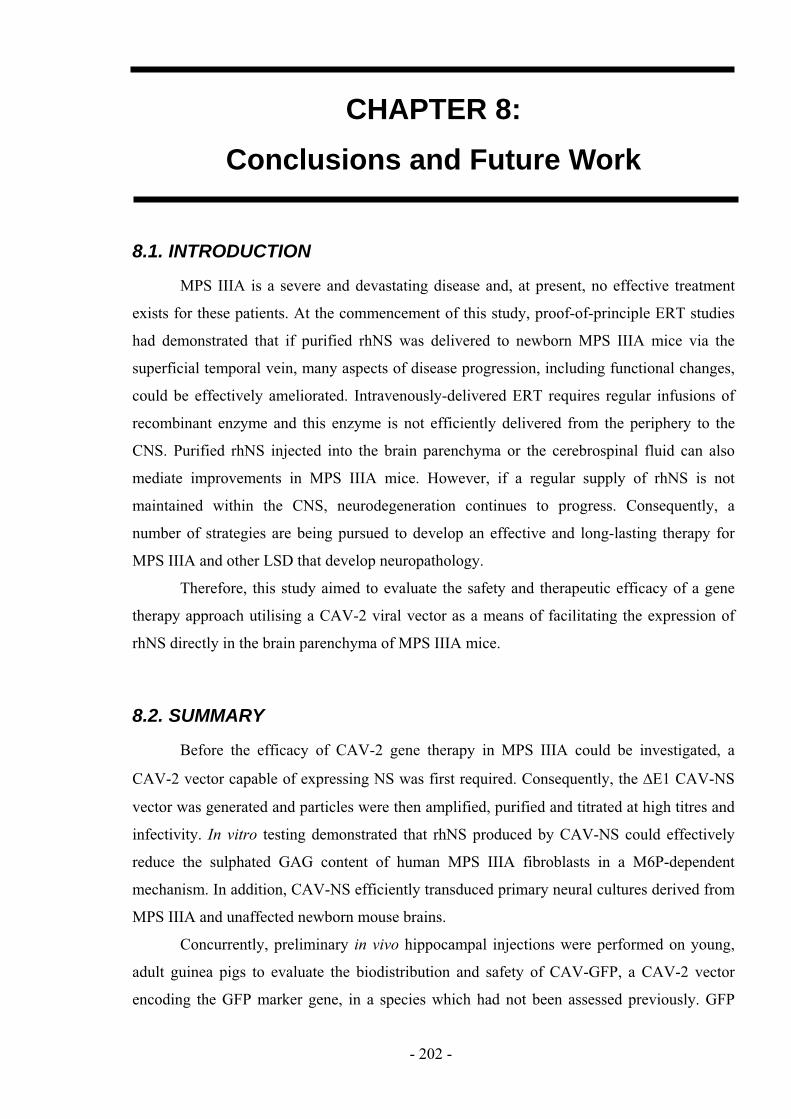
CHAPTER 8:
Conclusions and Future Work
8.1. INTRODUCTION
MPS IIIA is a severe and devastating disease and, at present, no effective treatment
exists for these patients. At the commencement of this study, proof-of-principle ERT studies
had demonstrated that if purified rhNS was delivered to newborn MPS IIIA mice via the
superficial temporal vein, many aspects of disease progression, including functional changes,
could be effectively ameliorated. Intravenously-delivered ERT requires regular infusions of
recombinant enzyme and this enzyme is not efficiently delivered from the periphery to the
CNS. Purified rhNS injected into the brain parenchyma or the cerebrospinal fluid can also
mediate improvements in MPS IIIA mice. However, if a regular supply of rhNS is not
maintained within the CNS, neurodegeneration continues to progress. Consequently, a
number of strategies are being pursued to develop an effective and long-lasting therapy for
MPS IIIA and other LSD that develop neuropathology.
Therefore, this study aimed to evaluate the safety and therapeutic efficacy of a gene
therapy approach utilising a CAV-2 viral vector as a means of facilitating the expression of
rhNS directly in the brain parenchyma of MPS IIIA mice.
8.2. SUMMARY
Before the efficacy of CAV-2 gene therapy in MPS IIIA could be investigated, a
CAV-2 vector capable of expressing NS was first required. Consequently, the E1 CAV-NS
vector was generated and particles were then amplified, purified and titrated at high titres and
infectivity. In vitro testing demonstrated that rhNS produced by CAV-NS could effectively
reduce the sulphated GAG content of human MPS IIIA fibroblasts in a M6P-dependent
mechanism. In addition, CAV-NS efficiently transduced primary neural cultures derived from
MPS IIIA and unaffected newborn mouse brains.
Concurrently, preliminary in vivo hippocampal injections were performed on young,
adult guinea pigs to evaluate the biodistribution and safety of CAV-GFP, a CAV-2 vector
encoding the GFP marker gene, in a species which had not been assessed previously. GFP
- 202 -
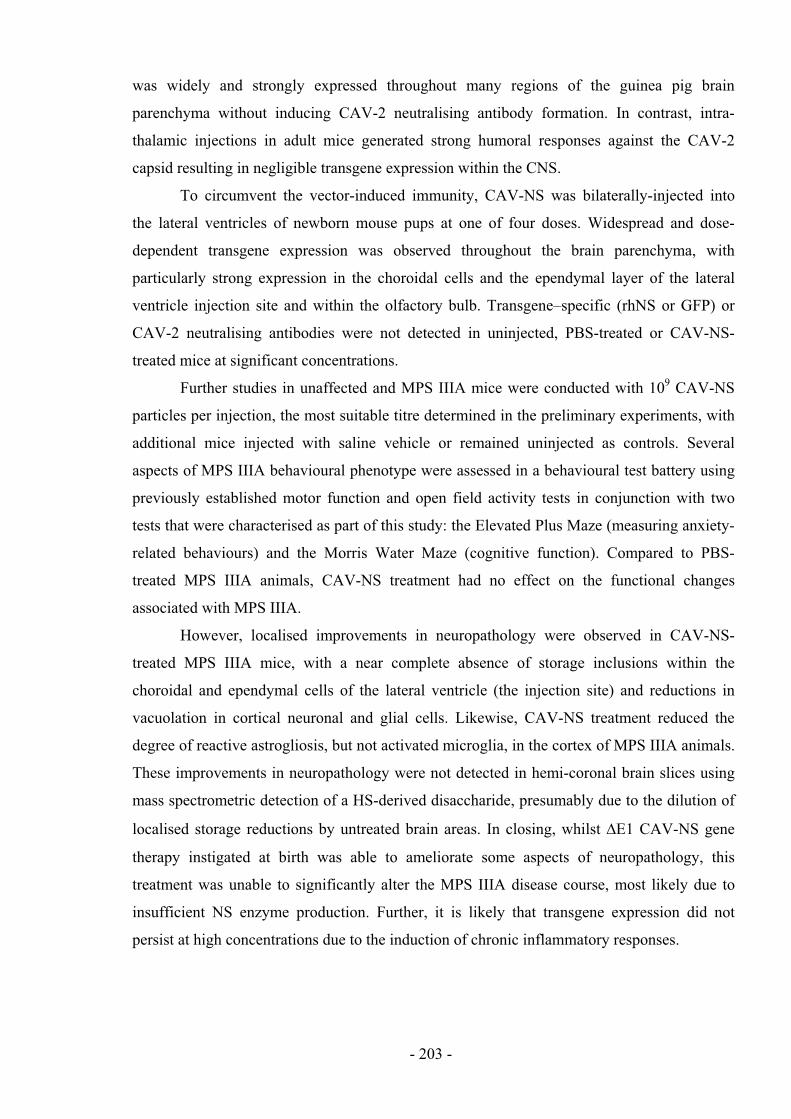
was widely and strongly expressed throughout many regions of the guinea pig brain
parenchyma without inducing CAV-2 neutralising antibody formation. In contrast, intra-
thalamic injections in adult mice generated strong humoral responses against the CAV-2
capsid resulting in negligible transgene expression within the CNS.
To circumvent the vector-induced immunity, CAV-NS was bilaterally-injected into
the lateral ventricles of newborn mouse pups at one of four doses. Widespread and dose-
dependent transgene expression was observed throughout the brain parenchyma, with
particularly strong expression in the choroidal cells and the ependymal layer of the lateral
ventricle injection site and within the olfactory bulb. Transgene–specific (rhNS or GFP) or
CAV-2 neutralising antibodies were not detected in uninjected, PBS-treated or CAV-NS-
treated mice at significant concentrations.
Further studies in unaffected and MPS IIIA mice were conducted with 109 CAV-NS
particles per injection, the most suitable titre determined in the preliminary experiments, with
additional mice injected with saline vehicle or remained uninjected as controls. Several
aspects of MPS IIIA behavioural phenotype were assessed in a behavioural test battery using
previously established motor function and open field activity tests in conjunction with two
tests that were characterised as part of this study: the Elevated Plus Maze (measuring anxiety-
related behaviours) and the Morris Water Maze (cognitive function). Compared to PBS-
treated MPS IIIA animals, CAV-NS treatment had no effect on the functional changes
associated with MPS IIIA.
However, localised improvements in neuropathology were observed in CAV-NS-
treated MPS IIIA mice, with a near complete absence of storage inclusions within the
choroidal and ependymal cells of the lateral ventricle (the injection site) and reductions in
vacuolation in cortical neuronal and glial cells. Likewise, CAV-NS treatment reduced the
degree of reactive astrogliosis, but not activated microglia, in the cortex of MPS IIIA animals.
These improvements in neuropathology were not detected in hemi-coronal brain slices using
mass spectrometric detection of a HS-derived disaccharide, presumably due to the dilution of
localised storage reductions by untreated brain areas. In closing, whilst E1 CAV-NS gene
therapy instigated at birth was able to ameliorate some aspects of neuropathology, this
treatment was unable to significantly alter the MPS IIIA disease course, most likely due to
insufficient NS enzyme production. Further, it is likely that transgene expression did not
persist at high concentrations due to the induction of chronic inflammatory responses.
- 203 -
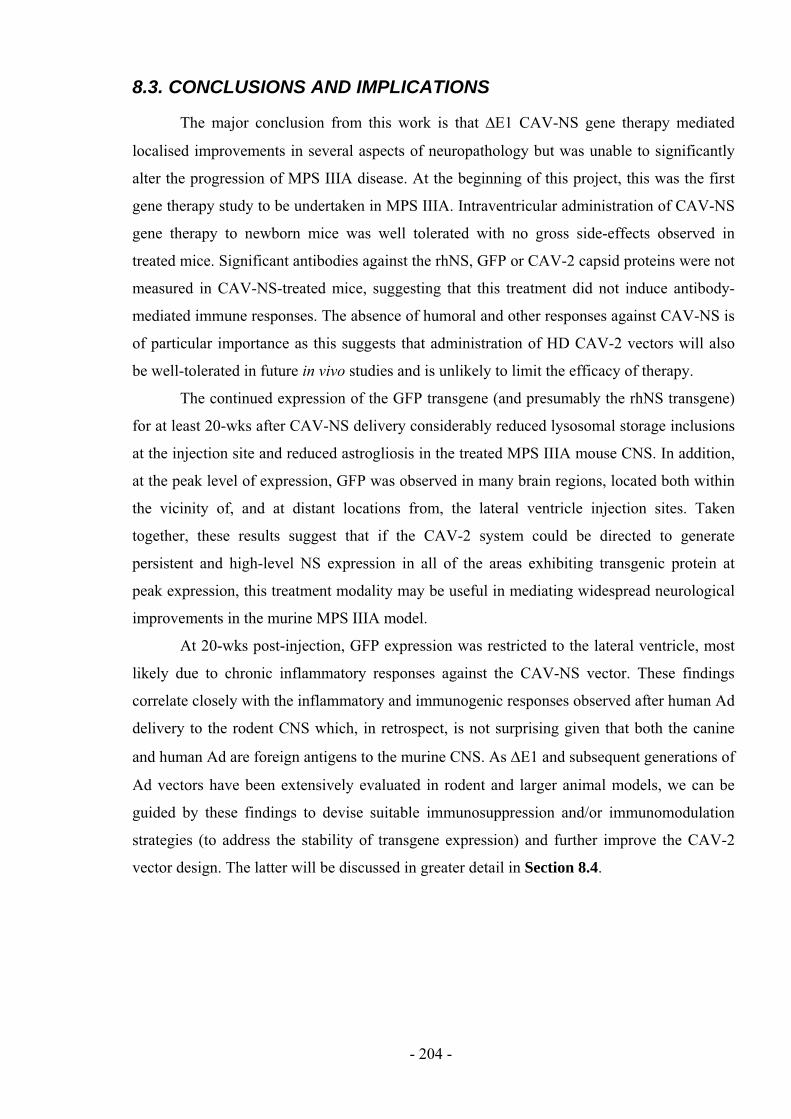
8.3. CONCLUSIONS AND IMPLICATIONS
The major conclusion from this work is that E1 CAV-NS gene therapy mediated
localised improvements in several aspects of neuropathology but was unable to significantly
alter the progression of MPS IIIA disease. At the beginning of this project, this was the first
gene therapy study to be undertaken in MPS IIIA. Intraventricular administration of CAV-NS
gene therapy to newborn mice was well tolerated with no gross side-effects observed in
treated mice. Significant antibodies against the rhNS, GFP or CAV-2 capsid proteins were not
measured in CAV-NS-treated mice, suggesting that this treatment did not induce antibody-
mediated immune responses. The absence of humoral and other responses against CAV-NS is
of particular importance as this suggests that administration of HD CAV-2 vectors will also
be well-tolerated in future in vivo studies and is unlikely to limit the efficacy of therapy.
The continued expression of the GFP transgene (and presumably the rhNS transgene)
for at least 20-wks after CAV-NS delivery considerably reduced lysosomal storage inclusions
at the injection site and reduced astrogliosis in the treated MPS IIIA mouse CNS. In addition,
at the peak level of expression, GFP was observed in many brain regions, located both within
the vicinity of, and at distant locations from, the lateral ventricle injection sites. Taken
together, these results suggest that if the CAV-2 system could be directed to generate
persistent and high-level NS expression in all of the areas exhibiting transgenic protein at
peak expression, this treatment modality may be useful in mediating widespread neurological
improvements in the murine MPS IIIA model.
At 20-wks post-injection, GFP expression was restricted to the lateral ventricle, most
likely due to chronic inflammatory responses against the CAV-NS vector. These findings
correlate closely with the inflammatory and immunogenic responses observed after human Ad
delivery to the rodent CNS which, in retrospect, is not surprising given that both the canine
and human Ad are foreign antigens to the murine CNS. As E1 and subsequent generations of
Ad vectors have been extensively evaluated in rodent and larger animal models, we can be
guided by these findings to devise suitable immunosuppression and/or immunomodulation
strategies (to address the stability of transgene expression) and further improve the CAV-2
vector design. The latter will be discussed in greater detail in Section 8.4.
- 204 -
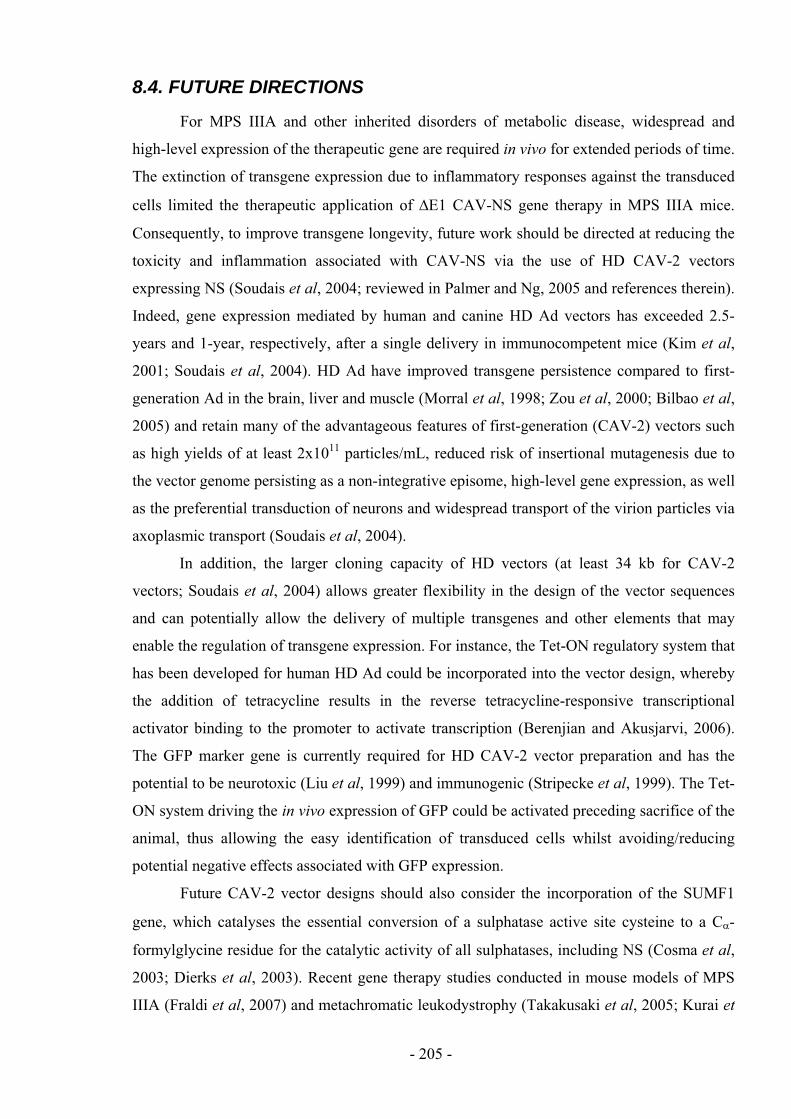
8.4. FUTURE DIRECTIONS
For MPS IIIA and other inherited disorders of metabolic disease, widespread and
high-level expression of the therapeutic gene are required in vivo for extended periods of time.
The extinction of transgene expression due to inflammatory responses against the transduced
cells limited the therapeutic application of E1 CAV-NS gene therapy in MPS IIIA mice.
Consequently, to improve transgene longevity, future work should be directed at reducing the
toxicity and inflammation associated with CAV-NS via the use of HD CAV-2 vectors
expressing NS (Soudais et al, 2004; reviewed in Palmer and Ng, 2005 and references therein).
Indeed, gene expression mediated by human and canine HD Ad vectors has exceeded 2.5-
years and 1-year, respectively, after a single delivery in immunocompetent mice (Kim et al,
2001; Soudais et al, 2004). HD Ad have improved transgene persistence compared to first-
generation Ad in the brain, liver and muscle (Morral et al, 1998; Zou et al, 2000; Bilbao et al,
2005) and retain many of the advantageous features of first-generation (CAV-2) vectors such
as high yields of at least 2x10¹¹
particles/mL, reduced risk of insertional mutagenesis due to
the vector genome persisting as a non-integrative episome, high-level gene expression, as well
as the preferential transduction of neurons and widespread transport of the virion particles via
axoplasmic transport (Soudais et al, 2004).
In addition, the larger cloning capacity of HD vectors (at least 34 kb for CAV-2
vectors; Soudais et al, 2004) allows greater flexibility in the design of the vector sequences
and can potentially allow the delivery of multiple transgenes and other elements that may
enable the regulation of transgene expression. For instance, the Tet-ON regulatory system that
has been developed for human HD Ad could be incorporated into the vector design, whereby
the addition of tetracycline results in the reverse tetracycline-responsive transcriptional
activator binding to the promoter to activate transcription (Berenjian and Akusjarvi, 2006).
The GFP marker gene is currently required for HD CAV-2 vector preparation and has the
potential to be neurotoxic (Liu et al, 1999) and immunogenic (Stripecke et al, 1999). The Tet-
ON system driving the in vivo expression of GFP could be activated preceding sacrifice of the
animal, thus allowing the easy identification of transduced cells whilst avoiding/reducing
potential negative effects associated with GFP expression.
Future CAV-2 vector designs should also consider the incorporation of the SUMF1
gene, which catalyses the essential conversion of a sulphatase active site cysteine to a C -
formylglycine residue for the catalytic activity of all sulphatases, including NS (Cosma et al,
2003; Dierks et al, 2003). Recent gene therapy studies conducted in mouse models of MPS
IIIA (Fraldi et al, 2007) and metachromatic leukodystrophy (Takakusaki et al, 2005; Kurai et
- 205 -
al, 2007) have demonstrated that SUMF1 co-expression significantly increases the sulphatase
enzyme activity.
In addition, other promoters driving the expression of NS should be assessed to
determine which provides the most prolonged and high-level transgene expression within the
CNS. Gerdes et al (2000) have demonstrated that high-level expression in the CNS can be
achieved from low doses of Ad when strong promoters (e.g. major immediate early murine
CMV) are utilised. This is also advantageous as the low viral doses do not promote cellular
inflammation (Gerdes et al, 2000). The human CMV promoter used in the E1 CAV-NS
vector has been reported to have shorter-lived transgene expression than the RSV promoter
when E1/E3-Ad was delivered to the cerebrospinal fluid of C57Bl/6 mice (Christenson et al,
1998). Another strong candidate promoter is the neuron-specific human synapsin I promoter,
where transgene expression mediated by E1-Ad at 9-months after intra-hippocampal
delivery was equivalent to the expression driven by the CMV promoter at 3-days post-
injection (Glover et al, 2003).
Once the optimal HD CAV-2 vector design has been determined, the therapeutic
efficacy of the HD CAV-NS vector should be compared to the biodistribution and the NS
transgene activity/protein concentration mediated by the E1 CAV-NS vector. Alternative
injection sites should be evaluated, such as intra-parenchymal injections into areas of
pathology (e.g. the hippocampus or cerebellum) or extensive neural networks (e.g. the
thalamus), or delivery directly into the cerebrospinal fluid via the cisterna magna (a less
invasive method of delivery). If HD CAV-2 vectors are demonstrated to be less toxic and less
inflammatory than first-generation CAV-2 vectors, similar to the data obtained with HD Ad,
multiple injection sites or increased viral doses per site may be attainable. Also, as pathology
is observed in the somatic tissues of MPS IIIA mice (e.g. hepatosplenomegaly, distended
bladders) the most widespread/long-lived CNS delivery method could be assessed in
combination with intravenous infusions of HD CAV-NS.
At present a newborn screening program for MPS IIIA has not been implemented and
consequently the majority of MPS IIIA children have established pathology at diagnosis. It
will be interesting to see whether pathology in MPS IIIA mice can be reversed or delayed
with HD CAV-NS gene therapy at various ages throughout development, including in utero
delivery. Ubiquitin-positive axonal spheroids present at 6-wks of age in MPS IIIA mice are
resistant to intracerebral ERT, suggesting that there may be irreversible pathological changes
and that treatment should be initiated as soon as possible (Savas et al, 2004). The potential
also exists for HD CAV-2 vectors to be administered multiple times in the absence of
- 206 -
immunosuppressive regimes (Koehler et al, 2006). It will be essential to determine whether a
single administration of HD CAV-NS will be sufficient for life-long NS expression or
whether multiple doses (and potentially immunosuppressive schedules) are required.
In conclusion, E1 CAV-NS gene therapy was able to mediate widespread and high-
level transgene expression after delivery to the newborn murine brain. Although transgene
expression was still detected at 20-wks after administration, this treatment did not
significantly impact on the clinical progression associated with MPS IIIA, presumably due to
the short-lived nature of high-level transgene expression in vivo. The data presented in this
thesis have expanded our understanding of the murine MPS IIIA phenotype and demonstrated
some of the challenges associated with CAV-2 - and other viral vector-based gene therapy -
that must be resolved before CAV-2 gene transfer becomes a viable treatment for neurological
LSD.
- 207 -
Publications Resulting From Work
Described In This Thesis
Poster presentation at the 8th
International Symposium on Mucopolysaccharide and Related
Diseases in Mainz, Germany (2004). Lau, A.A., Hemsley, K.M., Skander, N., Kremer, E.J.,
Hopwood, J.J. Canine adenoviral vectors: A preliminary study of an alternative gene delivery
system for alpha-mannosidosis.
Poster presentation at the 9th
International Symposium on Mucopolysaccharide and Related
Diseases in Venice, Italy (2006). Lau, A.A., Hemsley, K.M., Kremer, E.J., Hopwood, J.J.
Gene transfer in the MPS IIIA mouse model using canine adenoviral vectors.
- 208 -


![Sullivan [2010] - Reconsidering 'Spatial Memory' and the Morris Water Maze](https://img.pdfslide.net/doc/110x75/563db9d4550346aa9aa058ab/sullivan-2010-reconsidering-spatial-memory-and-the-morris-water.jpg)