Embed Size (px)
Citation preview

1
"Broadband Economic"
Takanori Ida,
Kyoto University, Graduate School of Economics
December 7, 2007
Chapter 6 IP Telephony:
Inception to Wide Spread Deployment
In this chapter we will consider the market structure of Internet protocol (IP)
telephony, while referring to supporting data and econometric analysis. In Japan the
number of IP telephony customers exceeded 10 million in December 2005, and there are
clear signs that widespread penetration of IP telephony is imminent. Most of this
up-take is 050-type IP telephony, a best-effort service and does not guarantee the
quality and functionality of wireline phones, but as FTTH becomes widely available,
0ABJ-type IP telephony that can fully replace PSTN telephony is poised for takeoff. In
this chapter we will consider IP telephony from the following four perspectives. First,
we will examine the supply structure of IP telephony. we will begin by defining IP
telephony, then explain the differences between 050-type and 0ABJ-type IP telephony.
Second, we will outline the current state of IP telephony usage in Japan based on the
results of a consumer questionnaire. We will elaborate on why people use IP telephony
services, how satisfied they are with the services, and other information gleaned from
the survey responses. Third, we will examine the demand substitutability of IP
telephony for fixed telephony based on conjoint analysis. This will give a good
quantitative picture of the basic conditions it would take to induce a fixed telephony
user to switch to IP telephony, what conditions must be satisfied for IP telephony to be
substituted for fixed telephony, and so on. Forth and finally, we will address IP
telephony interconnection, the impact IP telephony is having on fixed telephony, and
some of the relevant policy issues that are in contention.
6.1 IP Telephony Supply Analysis
In this section we will examine the supply side of IP telephony. IP telephony is the
routing of voice conversations over the Internet or other IP-based network using the
voice over Internet protocol (VoIP). Currently, IP telephony is provided as an additional
2
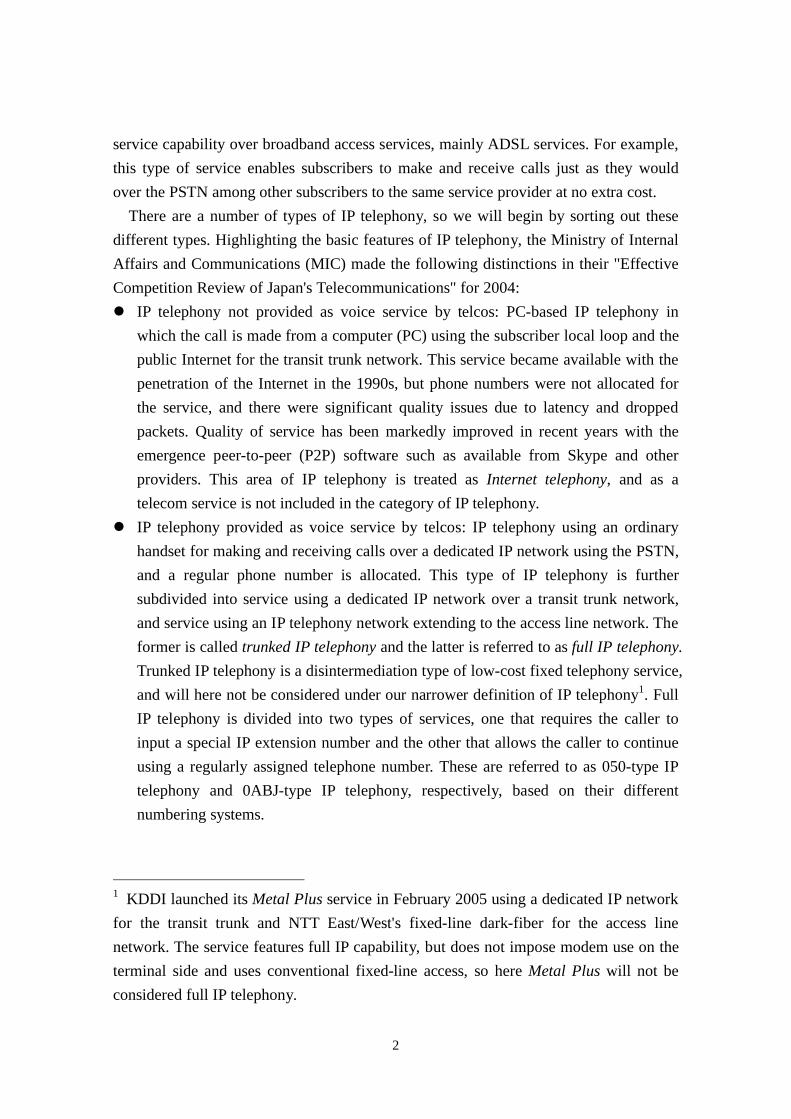
service capability over broadband access services, mainly ADSL services. For example,
this type of service enables subscribers to make and receive calls just as they would
over the PSTN among other subscribers to the same service provider at no extra cost.
There are a number of types of IP telephony, so we will begin by sorting out these
different types. Highlighting the basic features of IP telephony, the Ministry of Internal
Affairs and Communications (MIC) made the following distinctions in their "Effective
Competition Review of Japan's Telecommunications" for 2004:
IP telephony not provided as voice service by telcos: PC-based IP telephony in
which the call is made from a computer (PC) using the subscriber local loop and the
public Internet for the transit trunk network. This service became available with the
penetration of the Internet in the 1990s, but phone numbers were not allocated for
the service, and there were significant quality issues due to latency and dropped
packets. Quality of service has been markedly improved in recent years with the
emergence peer-to-peer (P2P) software such as available from Skype and other
providers. This area of IP telephony is treated as Internet telephony, and as a
telecom service is not included in the category of IP telephony.
IP telephony provided as voice service by telcos: IP telephony using an ordinary
handset for making and receiving calls over a dedicated IP network using the PSTN,
and a regular phone number is allocated. This type of IP telephony is further
subdivided into service using a dedicated IP network over a transit trunk network,
and service using an IP telephony network extending to the access line network. The
former is called trunked IP telephony and the latter is referred to as full IP telephony.
Trunked IP telephony is a disintermediation type of low-cost fixed telephony service,
and will here not be considered under our narrower definition of IP telephony1. Full
IP telephony is divided into two types of services, one that requires the caller to
input a special IP extension number and the other that allows the caller to continue
using a regularly assigned telephone number. These are referred to as 050-type IP
telephony and 0ABJ-type IP telephony, respectively, based on their different
numbering systems.
1 KDDI launched its Metal Plus service in February 2005 using a dedicated IP network
for the transit trunk and NTT East/West's fixed-line dark-fiber for the access line
network. The service features full IP capability, but does not impose modem use on the
terminal side and uses conventional fixed-line access, so here Metal Plus will not be
considered full IP telephony.
3
6.1.1 0ABJ-type and 050-type IP Telephony
In this section we present an analysis of full IP telephony. Full IP telephony is
supported by two number systems: "050" numbering and "0ABJ" numbering.
0ABJ-type IP telephony: Telephone numbering system specified by regular PSTN.
The location of a handset can be identified from the phone number. IP telephony
using an 0ABJ number is referred to as 0ABJ-type IP telephony. A basic condition
for provisioning 0ABJ-type IP telephony is that it must be defined by a technical
standard or protocol. This means that an FTTH line supporting an ultra-high-speed
large-capacity Internet connection is generally required to supply 0ABJ-type IP
telephony service. Since 0ABJ-type IP telephony supports emergency calls, ability
to keep existing NTT phone numbers, and good voice quality equivalent to fixed
telephony, it is generally assumed that 0ABJ-type IP telephony will supplant fixed
telephony with the widespread penetration of FTTH.
050-type IP telephony: IP telephony specific numbering system. One drawback of
this scheme is that users cannot keep their existing 0ABJ phone number because the
handset's location cannot be determined from the number, but an advantage is that
users can continue to use the same 050 phone number regardless of where they are
connected to the network. This service is now widely offered, mainly in conjunction
with ADSL or CATV Internet services. Because 050-type IP telephony provides
relatively poor quality compared with fixed phones and does not support emergency
calls, 050 services are unlikely to emerge as a viable substitute for PSTN services,
but are rather expected to serve as supplemental location-free service.
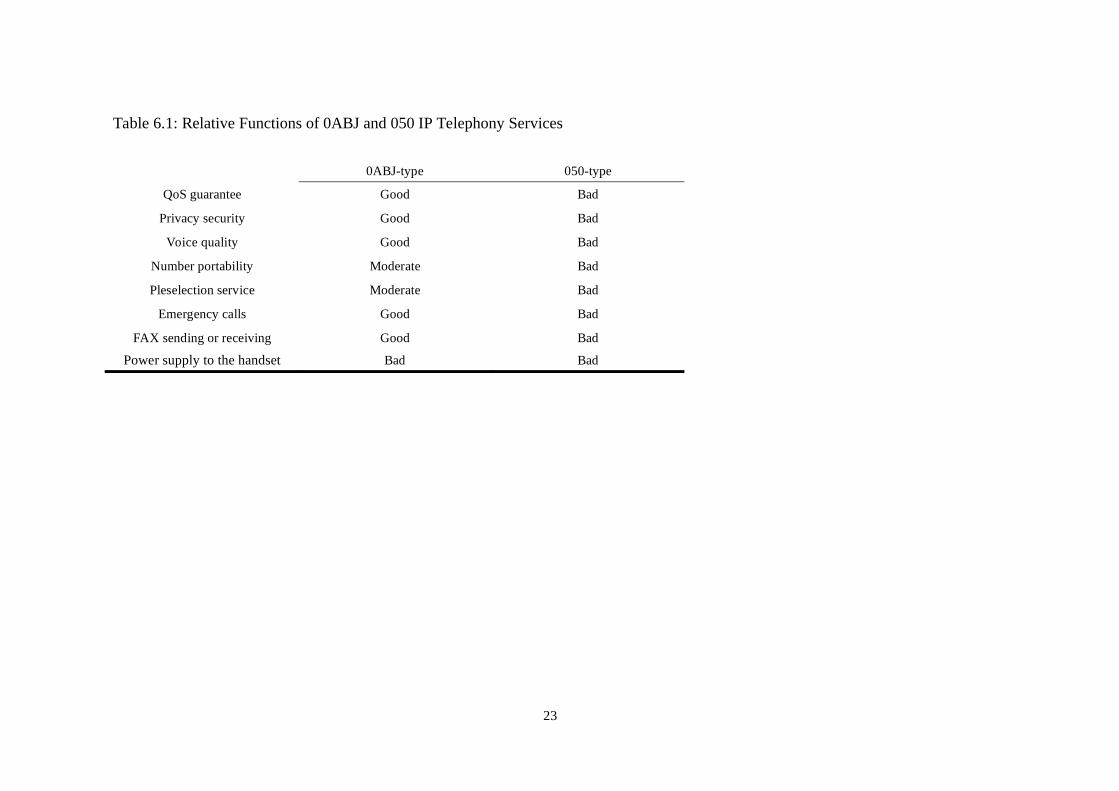
Table 6.1 compares the relative functions of 0ABJ and 050 IP telephony services.
Except for the power supply to the handset, the 0ABJ-type IP telephony service
provides basically the same features and quality as wireline phones. The only cautionary
note is that the 0ABJ-type IP telephony service is only currently used by some FTTH
customers, so the key to further take-up of 0ABJ-type IP telephony is widespread
penetration of FTTH services. Note too that, since users can cancel their wireline phone
if they sign up for 0ABJ-type IP telephony in conjunction with FTTH, the cost of FTTH
plus 0ABJ telephony is likely to be less than the total cost of basic service charges plus
ADSL charges that ADSL users must pay. By contrast, 050-type IP telephony does not
guarantee the same performance or functionality of fixed phones, so the great majority
of users employ 050 telephony in addition to their regular wireline service, mainly as a
cheap alternative by people who make a lot of long-distance calls.

4
<Table 6.1>
Table 6.2 shows the change in number of IP telephony users. The total number of IP
telephony subscribers was 13 million as of September 2006. Of these subscribers, 79%
use the 050-type IP telephony service, and most of these subscribe to Softbank ADSL or
NTT Communications' services. We summarize the main points as follows.
<Table 6.2>
[Points] 0ABJ-type and 050-type IP Telephony
There are two varieties of IP telephony service in Japan: 0ABJ-type IP telephony
guarantees voice quality equivalent to wireline phones, and 050-type IP telephony
that does not make voice equality guarantees. The 0ABJ-type service assumes
availability of FTTH, so its growth phase still lies in the future, while the 050-type
service is bundled with ADSL, and already has reached 13 million users.
6.1.2 IP Telephony Business Models
At present, IP telephony business models can be classified into three types. First is
the vertically integrated model where the business undertakes the entire range of IP
telephony, Internet connection, and Internet access line services. Softbank is a
representative example of this model. The second type is the non-vertically integrated
model represented mainly by ISPs that provide IP telephony services in which IP
telephony, Internet connectivity, and Internet access line services are vertically
separated. This model is represented by ISPs such as Nifty-Serve that provides IP
telephony and Internet connection services using NTT East/West's FLETS ADSL
service. The third type is the wholesale model in which ISPs that provide IP telephony
and Internet connectivity services also sell Internet access line services at the wholesale
level. For example, there are some ISPs that provide both ADSL and FTTH lines
according to this wholesale service model. Among these three business models, the
vertically integrated model permitting unified sales, pricing, and business strategies
prevails, and NTT East/West are now stepping up efforts to shift from the non-vertically
integrated approach to the vertically integrated model. We summarize the main points
as follows.
[Points] IP Telephony Business Models
5
There are three basic IP telephony business models—vertically integrated,
non-vertically integrated, and wholesale—but the vertically integrated model is
currently the most prevalent.
6.2 IP Telephony Demand Analysis
In this section, we will analyze demand trends for IP telephony. In November of 2004,
the MIC conducted a questionnaire survey regarding IP telephony. The survey was
conducted over the Web and involved a total of 1,500 subjects, 300 people who use IP
telephony and 1,200 people who do not. The age breakdown of the subjects was as
follows: 3.3% of the respondents were in their teens, 24.3% were in their 20s, 36.6%
were in their 30s, 24.2% were in their 40s, and 11.5% were in their 50s. The gender
breakdown was 47.9% men and 52.1% women. In terms of occupation, 44.7% of the
subjects was office workers, 6.2% self-employed, 11.6% part-time employees, 27.4%
unemployed, 7.7% students, and 2.4% other. Now let us take a look at what the survey
revealed.
6.2.1 Reasons for Using and Not Using IP telephony
Let us begin by considering the reasons people gave for either using or not using IP
telephony. Table 6.3 summarizes the reasons people gave for using IP telephony. The
number one reason people gave for using IP telephony, accounting for 55% of the
respondents who use the service, was that it came bundled with the service provided by
their ISP. This included 48.4% who said the IP telephony service came as part of the
ISP service and 7.0% who said it came as a discounted service with their ISP and access
line service. One might consider these users as fairly noncommittal who regard IP
telephony as merely an added capability that came bundled with their Internet
connection service. The second most common reason given by 30.3% of the
respondents was that charges for the IP service are low. These respondents can be
regarded as more committed users who are aware of the benefits of IP telephony. Table
6.4 summarizes the reasons the subjects gave for not using IP telephony. In order of
lack of interest or need, 25.0% of the respondents said they did not know much about IP
telephony, 22.0% do not use the telephone much, and 17.7% felt that wireline service
was perfectly adequate. These results are probably not unrelated to the shift from fixed
phone to mobile calling associated with the rapid penetration of mobile telephony that is
going on in the background. In addition, a considerable number of respondents

6
expressed interest but had misgivings about the quality of IP telephony, including 8.3%
who were loath to change phone numbers, 4.7% who were unsure about the functional
aspects of IP telephony, 4.3% who dislike the incoming call destination restrictions, and
3.0% who felt the subscription procedures were more trouble than the service was worth.
We summarize the main points as follows.
<Table 6.3>
<Table 6.4>
[Points] Reasons for Using and Not Using IP Telephony
Some users of IP telephony are passive and noncommittal, while others are
committed to the service. Among the reasons for not using IP telephony, some
respondents indicated that they had little knowledge or awareness of the service, and
others expressed misgivings about the quality of IP telephony.
6.2.2 Actual Usage of IP Telephony
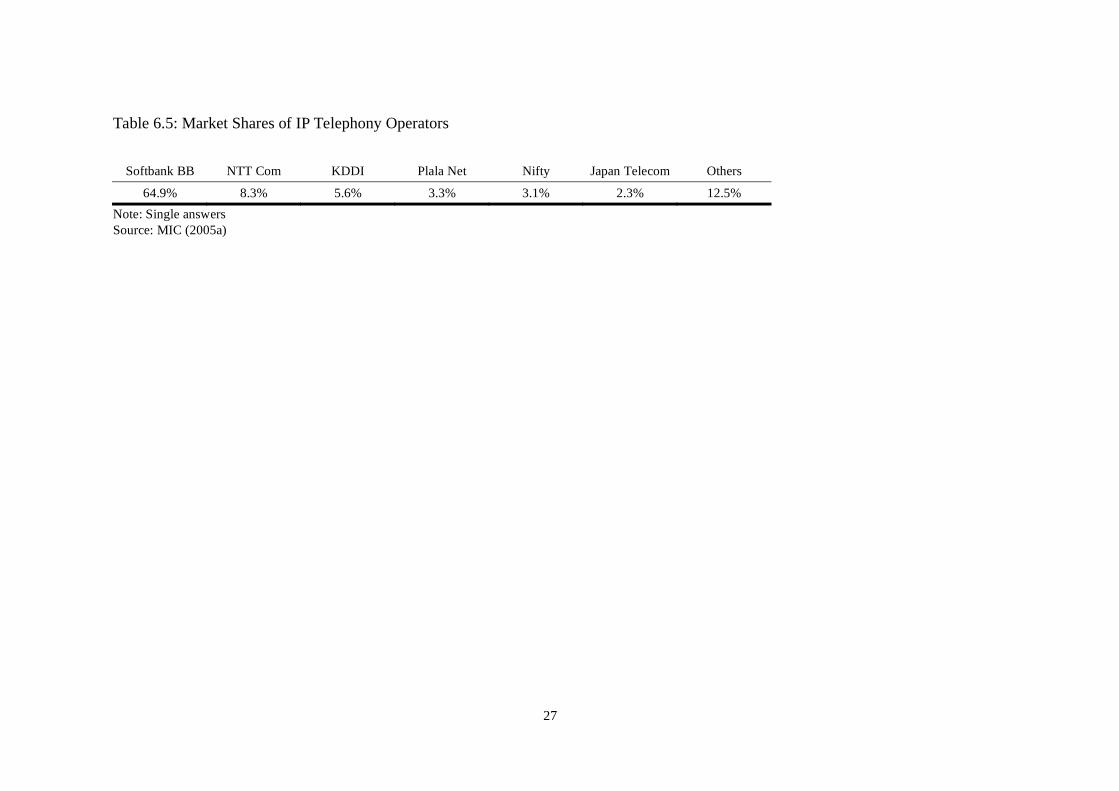
Next we will consider the actual use of IP telephony in Japan. Table 6.5 shows the
market shares of the main operators currently providing IP telephony services. The
largest share of the IP telephony market by far is held by Softbank, with some 64.9% of
the market. Softbank is primarily an ADSL provider, and offers a bundled set of
services including Internet connectivity, Internet access line, and IP telephony services.
Softbank's market share is consistent with the number one reason that 55% of the
respondents gave for using IP telephony—that is, that it came bundled with other
services. This suggests that the key to further penetration of IP telephony is to bundle
the service with Internet connectivity or Internet access line services. Table 6.6 shows
the relative shares of different types of connections used by IP telephony customers.
One can see that most of the respondents use IP telephony over an ADSL connection
with 88.7% share. Although the up-take of IP telephony thus far has been almost wholly
050-type IP telephony, we can anticipate a gradual increase in 0ABJ-type IP telephony
as FTTH become more widely available. In any event, the impact that the differences
between 050-type and 0ABJ-type IP telephony have on the future penetration rate of IP
telephony is a critically important issue. We will return to this question in the next
section, and see what light can be shed on the issue using conjoint analysis.
<Table 6.5>
7
<Table 6.6>
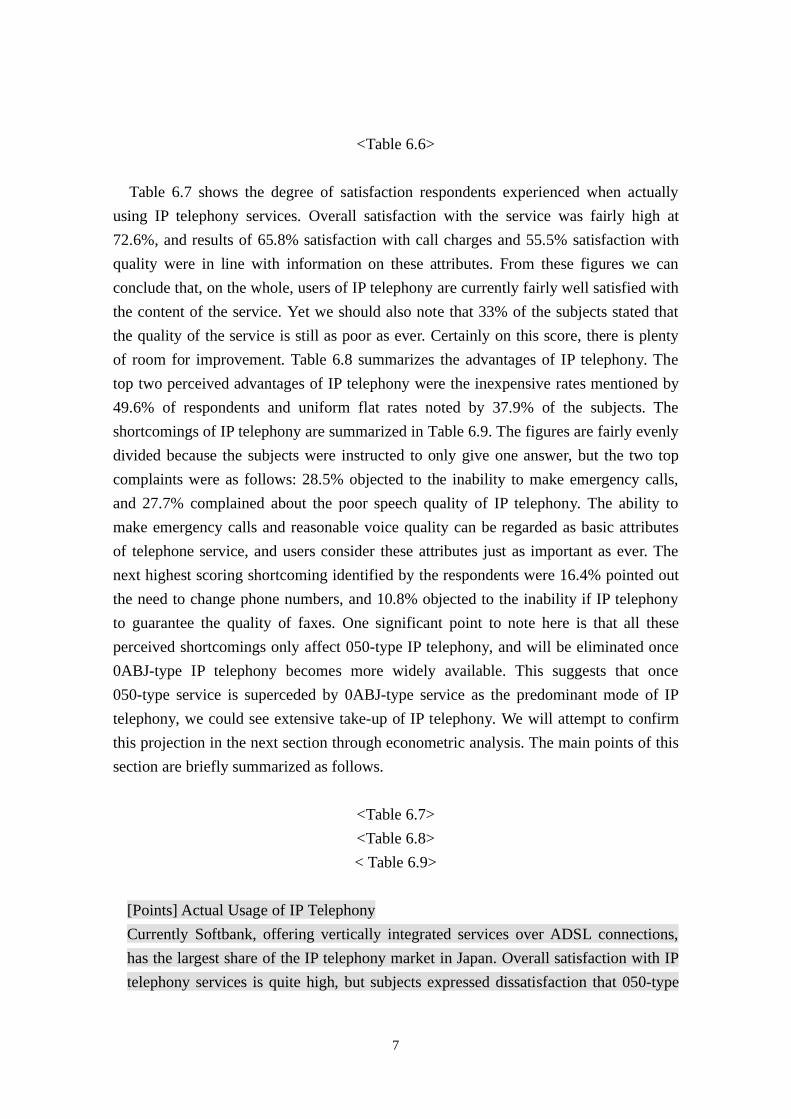
Table 6.7 shows the degree of satisfaction respondents experienced when actually
using IP telephony services. Overall satisfaction with the service was fairly high at
72.6%, and results of 65.8% satisfaction with call charges and 55.5% satisfaction with
quality were in line with information on these attributes. From these figures we can
conclude that, on the whole, users of IP telephony are currently fairly well satisfied with
the content of the service. Yet we should also note that 33% of the subjects stated that
the quality of the service is still as poor as ever. Certainly on this score, there is plenty
of room for improvement. Table 6.8 summarizes the advantages of IP telephony. The
top two perceived advantages of IP telephony were the inexpensive rates mentioned by
49.6% of respondents and uniform flat rates noted by 37.9% of the subjects. The
shortcomings of IP telephony are summarized in Table 6.9. The figures are fairly evenly
divided because the subjects were instructed to only give one answer, but the two top
complaints were as follows: 28.5% objected to the inability to make emergency calls,
and 27.7% complained about the poor speech quality of IP telephony. The ability to
make emergency calls and reasonable voice quality can be regarded as basic attributes
of telephone service, and users consider these attributes just as important as ever. The
next highest scoring shortcoming identified by the respondents were 16.4% pointed out
the need to change phone numbers, and 10.8% objected to the inability if IP telephony
to guarantee the quality of faxes. One significant point to note here is that all these
perceived shortcomings only affect 050-type IP telephony, and will be eliminated once
0ABJ-type IP telephony becomes more widely available. This suggests that once
050-type service is superceded by 0ABJ-type service as the predominant mode of IP
telephony, we could see extensive take-up of IP telephony. We will attempt to confirm
this projection in the next section through econometric analysis. The main points of this
section are briefly summarized as follows.
<Table 6.7>
<Table 6.8>
< Table 6.9>
[Points] Actual Usage of IP Telephony
Currently Softbank, offering vertically integrated services over ADSL connections,
has the largest share of the IP telephony market in Japan. Overall satisfaction with IP
telephony services is quite high, but subjects expressed dissatisfaction that 050-type

8
IP telephony does not guarantee the same level of quality as fixed telephony.
6.3 Conjoint Analysis of Demand for IP Telephony
This section will apply conjoint analysis to demand for IP telephony2. There are two
kinds of IP telephony. The first is best-effort IP telephony called “050-type” with a 050
prefix assigned for direct-dial calls from fixed telephones to IP telephony terminals. The
second is quality of service (QoS) guaranteed IP telephony called “0ABJ-type” with the
same numbering format used as 0AB-J for fixed telephones (e.g., 03 for Tokyo and 06
for Osaka). According to the Japanese Ministry of Internal Affairs and Communications
(MIC), as of the end of 2005, the number of IP telephony subscribers reached 10 million,
accounting for 40% of the current Japanese broadband Internet access lines. However,
90% of IP telephony subscribers are using 050-type IP telephony, in which QoS is not
sufficiently guaranteed3, including voice quality, number portability, fax usage, and
emergency access. This lack of QoS may obstruct further penetration and utilization of
IP telephony. As such, we analyze the potential demand for IP telephony by using a
conjoint analysis, corroborating our findings with studies done by MIC4.
We quickly review related literature although the number of empirical studies on IP
telephony demand is limited5 . Raina et al. (1998) argue that long-distance and
international services currently available on telephones will be replaced by IP telephony.
2 The analysis in this section is based on Ida, Kinoshita, and Sato (2007). 3 In addition, since interconnections among voice over Internet protocol (VoIP) circuits
are not complete, 050-type IP telephony may not be used if different Internet service
providers (ISPs) are involved. 4 For previous research using conjoint analysis, for example, see Bryan and Parry
(2002), Kim et al. (2005), Madden and Simpson (1997), Roe et al. (2005), San Miguel
et al. (2000). 5 Field pioneers McKnight and Leide (1998) have analyzed the costs, pricing, and
policy problems of Internet telephony, arguing for a comprehensive regulatory
framework concerning the convergence of fixed telephone and Internet telephony. Ono
and Aoki (1998) have also compared how policy makers and regulators in the US, the
EU, Japan, and Singapore responded to the emergence of IP telephony; they insist that
existing regulatory frameworks will not be aligned within dynamically changing
environments. Jaiswal and Raghav (2004) have suggested that IP telephony is a
potential key enabler for service delivery in developing countries.
9
Zubey et al. (2002) analyze demand substitutability between VoIP and POTS by using
conjoint analysis, concluding that it is important to improve the quality of connections
between end users and publicly switched telephone network (PSTN) facilities; given
such advantages of VoIP as low price and voice/data integration, there is huge potential
for its growth.
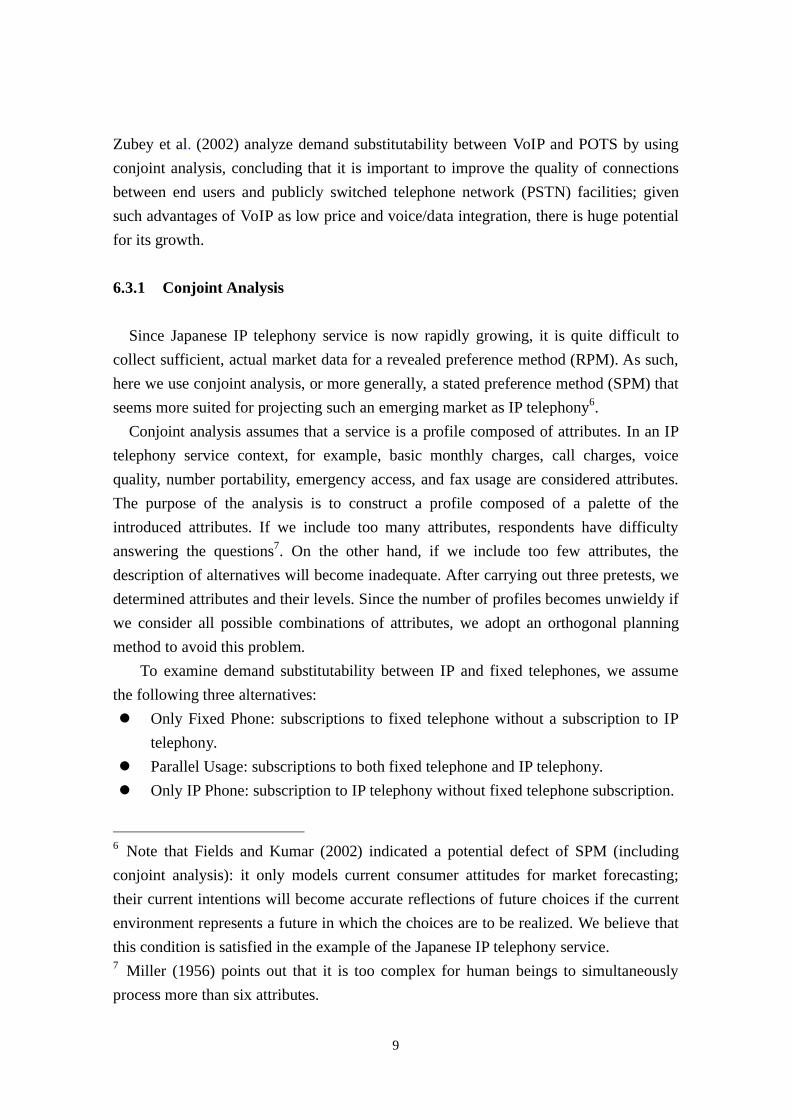
6.3.1 Conjoint Analysis
Since Japanese IP telephony service is now rapidly growing, it is quite difficult to
collect sufficient, actual market data for a revealed preference method (RPM). As such,
here we use conjoint analysis, or more generally, a stated preference method (SPM) that
seems more suited for projecting such an emerging market as IP telephony6.
Conjoint analysis assumes that a service is a profile composed of attributes. In an IP
telephony service context, for example, basic monthly charges, call charges, voice
quality, number portability, emergency access, and fax usage are considered attributes.
The purpose of the analysis is to construct a profile composed of a palette of the
introduced attributes. If we include too many attributes, respondents have difficulty
answering the questions7. On the other hand, if we include too few attributes, the
description of alternatives will become inadequate. After carrying out three pretests, we
determined attributes and their levels. Since the number of profiles becomes unwieldy if
we consider all possible combinations of attributes, we adopt an orthogonal planning
method to avoid this problem.
To examine demand substitutability between IP and fixed telephones, we assume
the following three alternatives:
Only Fixed Phone: subscriptions to fixed telephone without a subscription to IP
telephony.
Parallel Usage: subscriptions to both fixed telephone and IP telephony.
Only IP Phone: subscription to IP telephony without fixed telephone subscription.
6 Note that Fields and Kumar (2002) indicated a potential defect of SPM (including
conjoint analysis): it only models current consumer attitudes for market forecasting;
their current intentions will become accurate reflections of future choices if the current
environment represents a future in which the choices are to be realized. We believe that
this condition is satisfied in the example of the Japanese IP telephony service. 7 Miller (1956) points out that it is too complex for human beings to simultaneously
process more than six attributes.

10
Next, their attributes and levels are defined as follows:
Basic Monthly Charge: Monthly charges are approximately ¥1500 (US $14) for
fixed telephone service and ¥500 (US $4) for IP telephony service; therefore,
levels are assumed to range from ¥1000 (US $9) to ¥1800 (US $16) for fixed
telephone service, and from ¥0 (US $0) to ¥800 (US $7) for IP telephony service.
Voice Quality: The voice quality of IP telephony may be inferior to fixed
telephone services; therefore, IP telephony voice quality is either good (1) or poor
(0).
Number Portability: There are two types of IP telephony prefixes: one is 050
restricted for IP telephony (phone number must be changed), and the other is
0AB-J, which is the same as current fixed telephone numbers (03 in Tokyo and 06
in Osaka), allowing consumers to keep their numbers; therefore, number
portability of IP telephony service is either possible (1) or impossible (0).
Emergency Access: Direct dial calls from IP telephony to 110 (police) or 119 (fire
station) may not be available; therefore, emergency access from IP telephony is
either possible (1) or impossible (0). We assume that emergency access is always
possible (1) in the case of parallel usage because one can dial from fixed
telephones.
Fax Usage: IP telephony may not guarantee the sending and receiving of faxes
depending on traffic conditions or equipment; therefore, fax usage from IP
telephony is either possible (1) or impossible (0). We assume that fax usage is
always possible (1) in the case of parallel usage because one can send and receive
faxes using fixed telephones.
Call Charges: Long-distance charges (per three minutes) are approximately ¥10
(US $0.1) to ¥80 (US $0.7), depending on distance and time as well as user
contract on carrier preselection for fixed telephone services and ¥0 (US $0) to ¥10
(US $0.1) regardless of distance and time for IP telephony services8; therefore,
levels are assumed to range from ¥10 (US $0.1) to ¥25 (US $0.2) for preselection
contracts and a maximum of ¥80 (US $0.7) in the cases without preselection
contracts for fixed telephone services, while from ¥0 (US $0) to ¥10 (US $0.1) for
IP telephony service.
<Fig. 6.1>
8 If a user opts to preselect a specific carrier called MYLINE, calling charges are
decreased according to a discounted fee schedule.

11
Fig. 6.1 depicts the scope of the representative questionnaire covering profiles and
attributes. We asked ten questions per respondent. The respondents of this online
sample survey are monitors registered with a Web investigative company designated by
MIC9. Consumer preferences may differ depending on the type of Internet access
services. For this reason, we collected 100 samples according to the following Internet
connection:
FTTH Internet users at home
CATV Internet users at home
ADSL Internet users at home
Dial-up or ISDN Internet users at home.
We used a stratified random sampling method (see Louviere et al. 2000 for details)
on a pooled data set constructed from a total of 4000 (400 10) samples. We summarize
main points as follows.
[Points] Conjoint Analysis
We carried out conjoint analysis to examine stated preferences for IP telephony.
Assumed alternatives are only fixed phone, parallel usage, and only IP phone. Also,
assumed attributes are basic monthly charge, voice quality, number portability,
emergency access, fax usage, and call charges. we collected 100 samples according to
the Internet connection.
6.3.2 Basic Statistics and Estimations Results
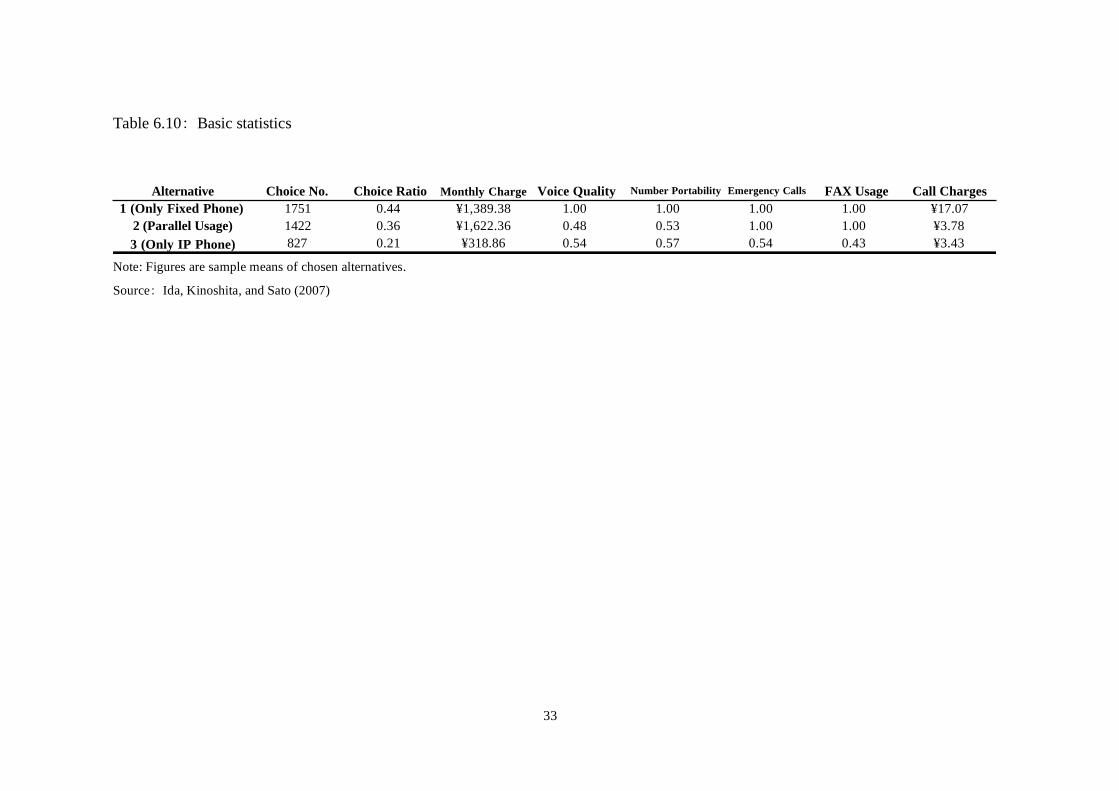
Table 6.10 indicates the basic statistics of the experimental choices. Examining the
pooled data, the choice ratio is 44% for Alternative 1 (Only Fixed Phone), 36% for
Alternative 2 (Parallel Usage), and 21% for Alternative 3 (Only IP Phone)10. The total
9 Since we conducted the survey online, the data may have a bias because the monitors
who participated may be more interested in the Internet than average people. We believe,
however, that such sampling bias is allowable because the purpose here is to study the
future usage of such new technology as the Internet. 10 Due to space constraints, we avoid detailed analysis of each Internet connection
preference (ADSL, CATV Internet, FTTH, and narrowband). However, note that choice
ratios for alternatives 1, 2, and 3 differ depending on the type of Internet connection.
For example, the IP telephony ratio is higher among broadband than narrowband users.

12
choice ratio of using fixed telephone (the sum of the choice ratios of Alternatives 1 and
2) amounts to 80%. We observe, therefore, that at this stage, few users are considering
shifting from fixed telephones to IP telephony. On the other hand, the total choice ratio
of using IP telephony (the sum of the choice ratios of Alternatives 2 and 3) amounts to
57%, demonstrating that more than half of the users are highly interested in using IP
telephony. This seemingly contradictory tendency may suggest the current changeover
from POTS to IP telephony.
<Table 6.10>
Note here that since non-compensatory decision making was observed,
substitutability between attributes was not considered by decision makers, and only one
attribute determines the decision (see Payne et al. 1993, pp. 240-243) similar to the case
of lexicographic preferences. In our experiment, 108 of 400 respondents chose the same
alternative among three, regardless of the different levels of attributes in the profiles.
The breakdown of this adherence to only one alternative is 56 people for Alternative 1,
28 people for Alternative 2, and 24 people for Alternative 3. It follows that only fixed
phone users exhibit such a strong tendency. In this respect, we observe the status quo
bias that current choices (namely, using fixed phones) determine the stated preferences
of users11.
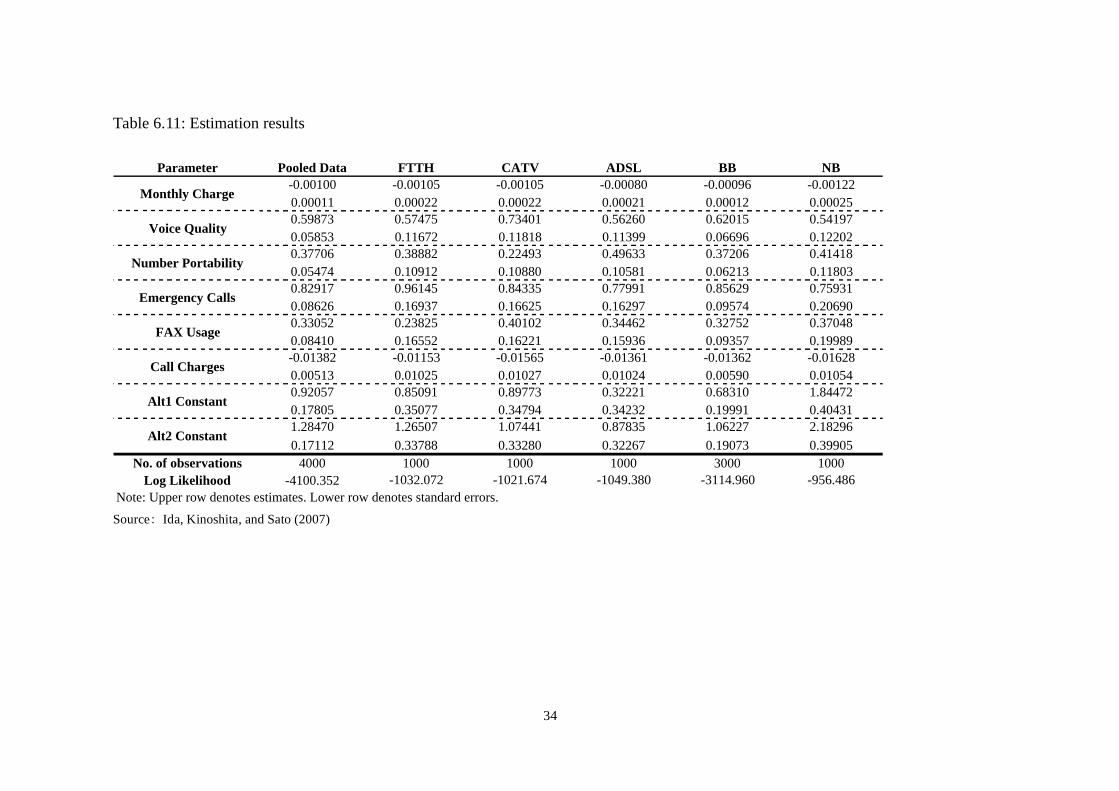
We used a CL model for estimating the data12. Table 6.11 indicates the estimation
This suggests that the type of Internet connection influences consumer preferences for
the adoption of IP telephony. We will investigate whether parameter estimates (namely,
consumer preferences) are equal among user groups based on their Internet connection
type by using a likelihood ratio (LR) test. 11 Since conjoint analysis is essentially based on substitutability between attributes, it
cannot deal with non-compensatory decision making, which results in biased WTP
estimation. Therefore, it might be wise to exclude such non-compensatory responses
from the data for estimation. 12 We should carry out the Hausman test and investigate whether the independence
from irrelevant alternatives (IIA) assumption holds, since we adopt a CL model.
Accordingly, we carried out the Hausman test, excluding Alternative 2, for the six
groups (see Hausman and McFadden 1984). Consequently, the IIA assumption is
rejected in some cases, but not rejected in others. Concretely, the results for (d), the
ADSL user group, are 6.76, and, therefore, the IIA assumption is not rejected, given that
13
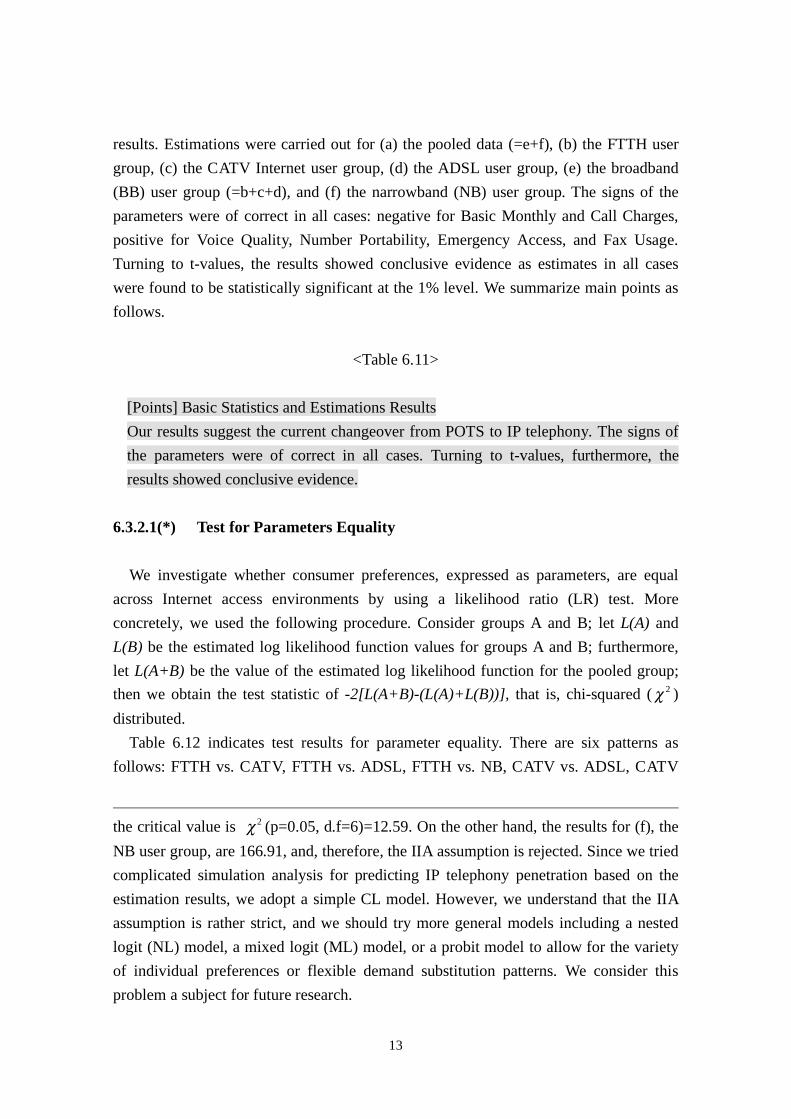
results. Estimations were carried out for (a) the pooled data (=e+f), (b) the FTTH user
group, (c) the CATV Internet user group, (d) the ADSL user group, (e) the broadband
(BB) user group (=b+c+d), and (f) the narrowband (NB) user group. The signs of the
parameters were of correct in all cases: negative for Basic Monthly and Call Charges,
positive for Voice Quality, Number Portability, Emergency Access, and Fax Usage.
Turning to t-values, the results showed conclusive evidence as estimates in all cases
were found to be statistically significant at the 1% level. We summarize main points as
follows.
<Table 6.11>
[Points] Basic Statistics and Estimations Results
Our results suggest the current changeover from POTS to IP telephony. The signs of
the parameters were of correct in all cases. Turning to t-values, furthermore, the
results showed conclusive evidence.
6.3.2.1(*) Test for Parameters Equality
We investigate whether consumer preferences, expressed as parameters, are equal
across Internet access environments by using a likelihood ratio (LR) test. More
concretely, we used the following procedure. Consider groups A and B; let L(A) and
L(B) be the estimated log likelihood function values for groups A and B; furthermore,
let L(A+B) be the value of the estimated log likelihood function for the pooled group;
then we obtain the test statistic of -2[L(A+B)-(L(A)+L(B))], that is, chi-squared ( 2 )
distributed.
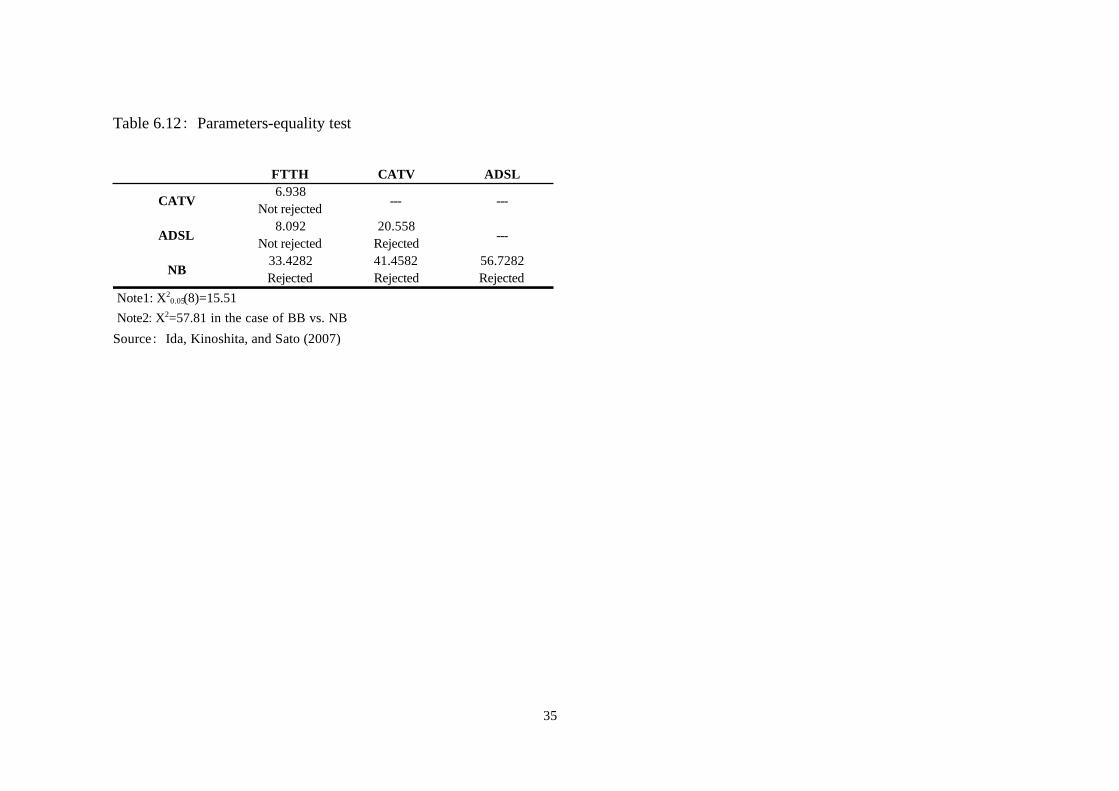
Table 6.12 indicates test results for parameter equality. There are six patterns as
follows: FTTH vs. CATV, FTTH vs. ADSL, FTTH vs. NB, CATV vs. ADSL, CATV
the critical value is 2 (p=0.05, d.f=6)=12.59. On the other hand, the results for (f), the
NB user group, are 166.91, and, therefore, the IIA assumption is rejected. Since we tried
complicated simulation analysis for predicting IP telephony penetration based on the
estimation results, we adopt a simple CL model. However, we understand that the IIA
assumption is rather strict, and we should try more general models including a nested
logit (NL) model, a mixed logit (ML) model, or a probit model to allow for the variety
of individual preferences or flexible demand substitution patterns. We consider this
problem a subject for future research.

14
vs. NB, and ADSL vs. NB. Preferences are not different between the FTTH and CATV
groups and between the FTTH and ADSL groups, whereas the preferences are different
for other patterns. In short, FTTH, CATV Internet, and ADSL users share similar
preferences regarding IP telephony adoptions, and only narrowband users are distinctly
different from the other users.
<Table 6.12>
By performing an additional test for the BB vs. NB scenario, we confirmed that
broadband users have different preferences from narrowband users. The reason may be
that IP telephony is still considered only an optional supplement of broadband services,
so that preference differences are not observed among FTTH, CATV Internet, and
ADSL users; on the other hand, since narrowband users are not prepared to use IP
telephony, they are generally not interested in using IP telephony13. We summarize
main points as follows.
[Points] Test for Parameters Equality
FTTH, CATV Internet, and ADSL users share similar preferences regarding IP
telephony adoptions, and only narrowband users are distinctly different from the other
users.
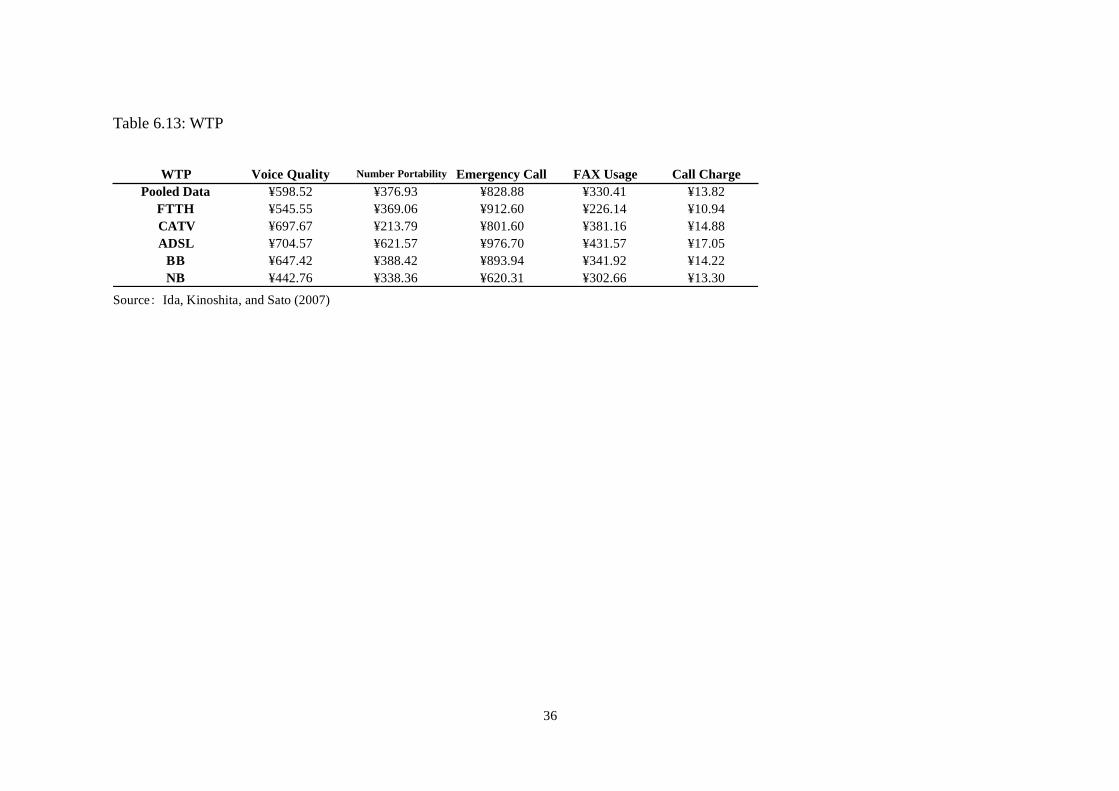
6.3.2.2 Willingness to Pay
We calculated the monthly willingness to pay (WTP) values of various IP telephony
attributes, as indicated in Table 6.13. Focusing on the results of broadband users, the
highest WTP is for emergency access, which is ¥894 (US $8.1). They attach the most
importance to emergency access. WTP for securing voice quality ranks second, which is
13 Socio-demographic differences may lie behind the differences in the preferences of
BB and NB users. Therefore, we investigate such demographic characteristics of both
groups as age, gender, living in the three largest metropolitan areas (namely, Tokyo,
Osaka, and Nagoya), education levels, employment history, and household income.
Consequently, we see that only the ratio of living in the three largest metropolitan areas
(Tokyo, Osaka, and Nagoya) differs between BB and NB users, whereas the other
characteristics are almost identical. It is more likely that BB users live in metropolitan
areas and that NB users live in rural areas.
15
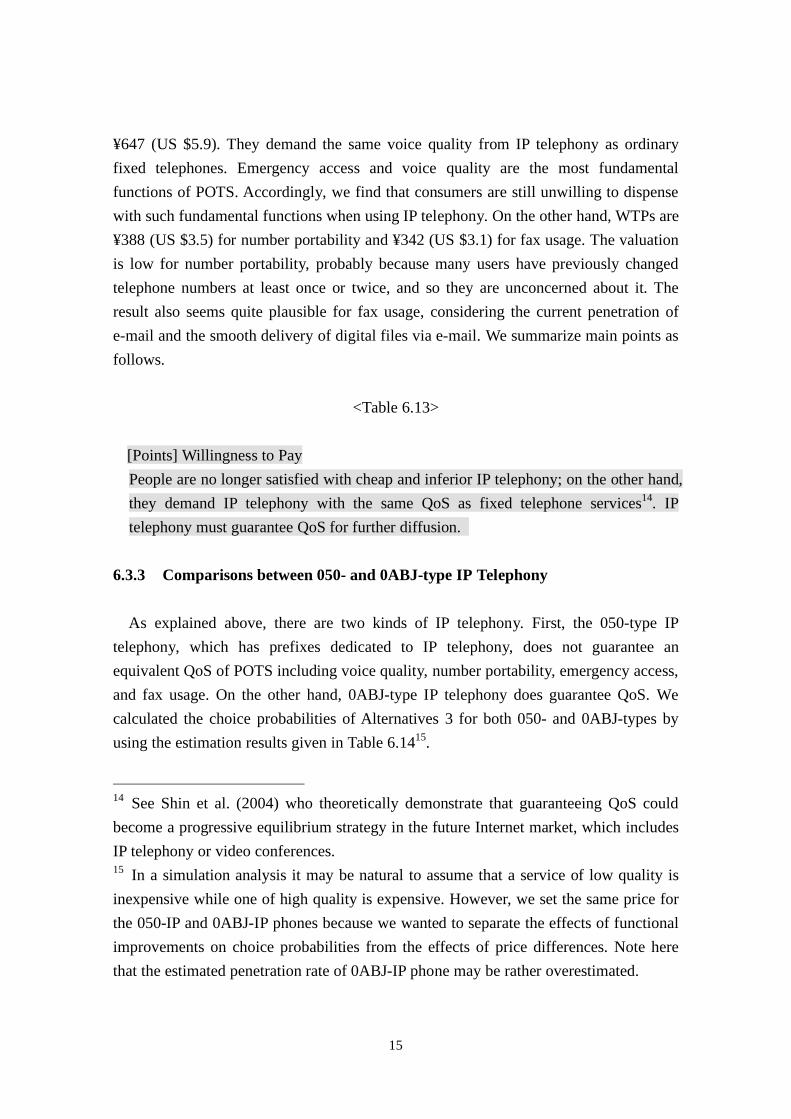
¥647 (US $5.9). They demand the same voice quality from IP telephony as ordinary
fixed telephones. Emergency access and voice quality are the most fundamental
functions of POTS. Accordingly, we find that consumers are still unwilling to dispense
with such fundamental functions when using IP telephony. On the other hand, WTPs are
¥388 (US $3.5) for number portability and ¥342 (US $3.1) for fax usage. The valuation
is low for number portability, probably because many users have previously changed
telephone numbers at least once or twice, and so they are unconcerned about it. The
result also seems quite plausible for fax usage, considering the current penetration of
e-mail and the smooth delivery of digital files via e-mail. We summarize main points as
follows.
<Table 6.13>
[Points] Willingness to Pay
People are no longer satisfied with cheap and inferior IP telephony; on the other hand,
they demand IP telephony with the same QoS as fixed telephone services14. IP
telephony must guarantee QoS for further diffusion.
6.3.3 Comparisons between 050- and 0ABJ-type IP Telephony
As explained above, there are two kinds of IP telephony. First, the 050-type IP
telephony, which has prefixes dedicated to IP telephony, does not guarantee an
equivalent QoS of POTS including voice quality, number portability, emergency access,
and fax usage. On the other hand, 0ABJ-type IP telephony does guarantee QoS. We
calculated the choice probabilities of Alternatives 3 for both 050- and 0ABJ-types by
using the estimation results given in Table 6.1415.
14 See Shin et al. (2004) who theoretically demonstrate that guaranteeing QoS could
become a progressive equilibrium strategy in the future Internet market, which includes
IP telephony or video conferences. 15 In a simulation analysis it may be natural to assume that a service of low quality is
inexpensive while one of high quality is expensive. However, we set the same price for
the 050-IP and 0ABJ-IP phones because we wanted to separate the effects of functional
improvements on choice probabilities from the effects of price differences. Note here
that the estimated penetration rate of 0ABJ-IP phone may be rather overestimated.

16
<Table 6.14>
Focusing on broadband users, the calculated choice probability of Alternative 3 is
0.25 at the sample means. In the case of 050-type IP telephony, where all attribute
levels of voice quality, number portability, emergency access, and fax usage are set to
zero, the choice probability of Alternative 3 is only 0.09. On the other hand, in the case
of 0ABJ-type IP telephony where all attribute levels are set to one, the choice
probability of Alternative 3 increases to 0.48. As such, the future diffusion of IP
telephony is largely based on whether the QoS of IP telephony is guaranteed.
0ABJ-type IP telephony could conceivably replace existing fixed telephones. We
summarize main points as follows.
[Points] 050- and 0ABJ-type IP Telephony
The difference of choice probability between 050- and 0ABJ-type IP Telephony is
quite large. Thus, the future diffusion of IP telephony is largely based on whether the
QoS of IP telephony is guaranteed.
6.3.4 Projection for IP Telephony Household Penetration Rates
Since conjoint analysis is suited for forecasting long-term consumer preferences, we
forecast the spread of IP telephony by using estimation results. Parker (1994) advocates
a model that includes the dynamic market potential of the form cM(t), where c measures
the percentage of non-adopters in the potential market (i.e., non-Internet users and
narrowband users) while M(t) is the number of potential units that could adopt (i.e.,
number of households)16.
For our projections, we derive the estimated number of broadband subscribers as of
2009 from the Nomura Research Institute (NRI). According to NRI, the number of
subscribers will be 9.0 million for FTTH (18.1%), 3.5 million for CATV Internet
(7.0%), 16.1 million for ADSL (32.1%), for a total of 28.6 million broadband
subscribers (57.4%). The figures in parentheses represent household penetration rates of
50 million, which is the approximate number of households in Japan in 2010, according
to the National Institute of Population and Social Security Research.
We suppose two scenarios for Japan’s household IP telephony penetration rate by
16 Examples in line with this include Islam and Meads (1996) and Ahn and Lee (1999).

17
2009:
Scenario 1: The values of all attributes are set to the sample means summarized in
Table 1.
Scenario 2: The attribute levels of voice quality, number portability, emergency
access, and fax usage are set to one (i.e., 0ABJ-type IP telephony) while basic
monthly and calling charges are set to the sample means.
Table 6.15 shows the projection results for the IP telephony household penetration
rate in 2009. In Scenario 1 (sample means), the number of IP telephony subscribers is
17.6 million (35.1%) for Alternatives 2 and 3 (including parallel usage of fixed and IP
phones) and 7.2 million (14.4%) for Alternative 3 (using only IP phones). In Scenario 2
(0ABJ-type IP telephony), the number of IP telephony subscribers is 22.0 million
(44.1%) for Alternatives 2 and 3 (including parallel usage of fixed and IP phones) and
12.0 million (23.9%) for Alternative 3 (exclusively IP telephony usage). We summarize
main points as follows.
<Table 6.15>
[Points] Projection for IP Telephony
The household penetration rate will probably reach 30 to 40%; moreover, half will
eventually shift from fixed telephones to IP telephony17.
6.4 IP Telephony Policy Issues
In this section we will take up and discuss the main competition policy issues in
contention relating to IP telephony based on the analysis presented thus far (MIC
2005a).
6.4.1 IP Telephony Interconnectivity
This section will address IP telephony interconnectivity. IP telephony is a call service,
so of course network externalities arise from the network connections. We argued in
Chapter 2 that when network externalities are involved, interconnectivity increases
17 In November 2004, NTT announced a “Middle-term Management Strategy” that
aims to gain 30 FTTH million lines by 2010. If satisfied, IP telephony will increase
market penetration rates much faster than in our projections.

18
social welfare, but when the interests of service providers collide over interconnection
cost burden, it is possible that only a minor interconnection incentive will result that is
too small to contribute to social welfare. Currently, there are three basic interconnection
scenarios for exchanging VoIP traffic between IP telephony service providers:
(1) VoIP traffic exchanged over an IP (Internet Protocol)-IP connection
(2) VoIP traffic not exchanged over an IP-to-IP connection, but over an IP-PSTN
(Public Switched Telephone Network)-IP connection
(3) VoIP traffic is not interconnected at all, and traffic can only be exchanged over a
PSTN connection.
In the first scenario, IP telephony services are directly connected, so this scenario is
mainly represented by IP telephony providers offering free telephony service. In the
second scenario, the PSTN is interposed between IP telephony services, so this scenario
is mainly represented by IP telephony providers offering VoIP services at a flat rate of
¥8 for three minutes. In the third scenario, IP telephony cannot be used, so fixed
telephony is used.
The main appeal of IP telephony is the low cost for the service. But in cases where
part of the interconnection is over the PSTN, the primary appeal of low rates is
attenuated and the relative advantage over fixed telephony is reduced. In terms of
network externalities, IP telephony has considerable appeal if people you frequently call
are IP telephony subscribers, but if the people you call are not subscribers or if the rates
are little different from wireline telephony, then the motivation for subscribing to IP
telephony is markedly reduced.
Let us next consider the model. Here we assume two service providers: Operator A
with 4,000 subscribers and Operator B with 1,000 subscribers, and Operator B requests
interconnection with Operator A. This would cost ¥100 million to modify the system to
set up the interconnection, plus ¥100 million a year in maintenance costs. Operator A
contends that Operator B should pay all the costs, since it is Operator B who wants to
set up the interconnection. But Operator A says he will consider the arrangement, if the
costs are split evenly between the two operators. Meanwhile, Operator B wants
Operator A to bear all the costs considering the different sizes of their respective
operations, but says that at least the costs should be prorated based on number of
subscribers. These kinds of cases are very often decided by the authorities based
political dynamics.
How should we approach this kind of an issue? First we would note that while costs
are fixed, calls are completed through peer-to-peer (P2P) connections between
subscribers. So by considering all the possible call combinations, we can assess the
19
network externalities which are dependent on the number of subscribers. Before the
networks are interconnected, the call combinations for Network A are 4000C2 =
7,998,000, and the call combinations for Network B are 1000C2 = 499,500. Moreover, the
total number of call combinations for both Networks A and B after they are
interconnected is 5000C2 = 12,497,500. It will be apparent that the number of call
combinations for Network A increased by 4,499,500, while the number of call
combinations for Network B increased by 11,998,000. Operator A's share of the
increase in consumer call combinations resulting from interconnecting the two networks
is 27.3% while Operator B's share of the increase is 72.7%. This would be one criterion
for prorating fixed costs based on the relative benefit/burden ratio for the two operators.
Now turning to variable costs, simply assuming equal probability of one subscriber
calling another subscriber, then 80% of calls from Network A would be to subscribers
in Network A and 20% would be to subscribers in Network B. The percentages would
be reversed for Network B, with 20% of calls from Network B going to other
subscribers in Network B and 80% to Network A. Since Network A has 4 times the
number of subscribers as Network B, the connection charges will be exactly offset,
unless there is a significant difference in calling patterns between the two networks. In
other words, 4,000 subscribers x 20% is the same as 1,000 subscribers x 80%. Thus,
simply splitting the variable costs would be one approach to sharing the costs.
Summarizing, we find that A's share of costs in this model for the first year after
interconnection would be ¥77.3 million while B's share would be ¥122.7 million. But do
not become alarmed. Although this burden sharing may be perfectly fair from a logical
standpoint, no one would think it was fair from an intuitive realistic standpoint. Indeed,
this allocation would all but exclude all smaller scale network operators from entering
the market. Under these terms, for example, each Network A subscriber's share would
be about ¥20,000, while the amount borne by Network B subscribers would be about
¥120,000. If consumers were to rationally factor these interconnection charges into their
decision-making, then all would opt for Network A and none would choose Network B.
It is thus apparent that from the standpoint of policies designed to promote competition,
identifying an appropriate cost-share burden for Operator A based on ability to pay,
providing an opportunity for Operator B to enter the market, and invigorating market
competition are all highly significant objectives. At the same time, careful consideration
should be given to ensure that overly favorable treatment for Operator B does not have
the contrary effect of exacerbating inefficiency of the industry. We summarize the main
points as follows:

20
[Points] IP Telephony Interconnectivity
There are three basic call scenarios for interconnecting IP telephony services: IP-IP,
IP-PSTN-IP, and PSTN. When migrating from interconnection over the PSTN to IP,
the cost burden becomes an issue. Based on the benefit/burden principle, new entrants
must bear some share of the costs to enter the market, but their share should reflect
ability to pay to promote competition.
6.4.2 Impact of IP Telephony on Fixed Telephony
In this section, we discuss the impact that IP telephony is likely to have on fixed
telephony. This raises two important concerns: the impact that IP telephony penetration
will have on the stability of maintaining fixed telephony infrastructure, and the impact
that IP telephony penetration will have on fixed telephony universal service. Of course
these two concerns are essentially the opposite sides of the same issue, since the spread
of IP telephony will reduce the profits of the fixed telephone service providers, thus
making it increasingly difficult for these operators to maintain legacy PSTN and POTS
networks.
We have already seen that there are two types of IP telephony service: 050-type IP
telephony and 0ABJ-type IP telephony. Let us consider the impact these two types of
VoIP service will have on fixed telephony one at a time.
First, 050-type IP telephony is supported over ADSL or CATV Internet connections,
and while offered at low rates—sometimes no additional cost at all—the service may
have less than desirable voice quality. The 050 numbers do not support emergency calls
and the calling range is limited, so 050-type IP telephony is not a viable substitute for
PSTN services. Yet 050-type IP telephony has clearly captured a good share of
long-distance and international call traffic, so the long-distance and international service
providers in particular have been dealt a serious blow. It is clear that the fixed telephony
portion of the long-distance and international call market supported is contracting, so
we can anticipate that the profitability of the fixed telephony service providers will
rapidly deteriorate in the years ahead. Then, as 0ABJ-type IP telephony services become
available with the penetration of FTTH, users will no longer need to maintain their
wireline phones since 0ABJ service guarantees voice quality and supports number
portability, so we can anticipate that many will choose to cancel their fixed wireline
service altogether. The fixed telephony service providers will then see their most basic
source of revenue begin to dry up. Local exchange carriers like NTT East and West will
be stuck in a position of having to maintain both the legacy PSTN and new FTTH
21
network, and will see their revenues from voice services fall across the board even
while their costs to support those services will remain the same or increase. There is a
good probability that fixed wireline will emerge from all this as a heavily deficit ridden
service.
Formerly, fixed universal telephone services were supported by subsidizing lower
revenue sources with higher revenue sources—rural areas supported by urban areas,
residential users supported by business users, and local calls supported by long-distance
calls—and charges were set so that revenues and expenditures were balanced by overall
multiple costing. But now it is precisely the urban dwellers, the business users, and the
long-distance callers who bore the brunt of higher charges in the past that are in the first
wave of users abandoning wireline services for IP telephony services, and while there
have been vain efforts to restore funding and the cross-subsidies of the past, it is
apparent that the universal fixed telephony service of the past is on the verge of
collapsing. Even though one wanted to offset the losses from rural, residential, and local
wireline subscribers, the urban, business, and long-distance callers are starting to
abandon the PSTN for the optical IP network, and any attempt levy punitive charges on
these early adopters of new services would only be a backward policy propping up a
declining industry.
Essentially there is only one viable option, particularly since there is no stopping the
flood of users who will soon be migrating from fixed telephony to 0ABJ-type IP
telephony as the penetration of FTTH continues. First we would note that the
technology supporting IP telephony is far simpler than that supporting the PSTN, so
IP-based networks can be deployed at relatively low cost. Since basic charges from
users who migrate to FTTH will be the primary source of revenues in the years ahead,
the only realistic option is to seek to avoid the wasteful costs of sustaining redundant
networks by stepping up efforts to move rural, residential, and local call users to
0ABJ-type IP telephony as quickly as possible. In other words, to avoid the collapse of
the telephone industry, there is no alternative but to move quickly and systematically to
decommission the old network and roll out a new FTTH access network premised on
0ABJ-type IP telephony that will provide a new standard of universal service and
universal access. We will explore this issue is greater depth in Part III. We summarize
the main points as follows.
[Points] Impact of IP Telephony on Fixed Telephony
As the transition from fixed telephony to IP telephony continues, this raises a number
of thorny issues as to how the telephone infrastructure can be maintained and how
22
universal service currently supported by the PSTN can continue to be provided. There
is already no stopping the transition from fixed telephony to 0ABJ-type IP telephony,
so there is no alternative but to move quickly and systematically to decommission the
old network and deploy new fiber-based infrastructure.
6.5 Conclusion
This chapter analyzes IP telephony demand by using conjoint analysis.
Approximately 80 per cent of the respondents maintain a fixed-line telephone, including
parallel usage of a fixed telephone and IP telephony. Therefore, IP telephony is
currently considered an add-on service option of broadband Internet access services in
Japan; not as a close substitute for fixed telephones. The second finding, however, may
be more interesting. If such IP telephony attributes as voice quality, number portability,
emergency access, and fax usage are completely guaranteed, however, more than half of
the respondents will choose IP telephony. Therefore, if 0ABJ-type IP telephony is
provided at low prices, there will be rapid changeover from POTS to IP telephony. This
conclusion is consistent with MIC’s survey (2005a). However, since innovation is
rapidly changing the landscape of telecommunication infrastructure and architecture,
there are broad implications concerning the industrial structure of telecommunication
services that need careful consideration in the future.
23
Table 6.1: Relative Functions of 0ABJ and 050 IP Telephony Services
0ABJ-type 050-type
QoS guarantee Good Bad
Privacy security Good Bad
Voice quality Good Bad
Number portability Moderate Bad
Pleselection service Moderate Bad
Emergency calls Good Bad
FAX sending or receiving Good Bad
Power supply to the handset Bad Bad

24
Table 6.2 Change in Number of IP Telephony Users
2004.3 2004.9 2005.3 2005.9 2006.3 2006.9
0ABJ - - 0.2 0.5 1.4 2.7
050 5.3 7.0 8.1 9.3 10.0 10.3
Total 5.3 7.0 8.3 9.8 11.5 13.0
Note: Figures are million.
Source: MIC (2005a)

25
Table 6.3: Reasons for Using IP Telephony
Bundled service Discounted
services
Cheap rates Friends
subscription
Friends
recommendation
Future diffusion
of IP telephony
QoS upgrade Others
48.4% 7.0% 30.3% 6.8% 2.1% 2.5% 1.2% 1.7%
Note: Single answers
Source: MIC (2005a)

26
Table 6.4: Reasons for Not Using IP Telephony
Little
knowledge
Not using
frequently
Satisfied with
Wireline phone
Phone number
changes
Poor quality of
service
Restricted call
destinations
Unavailable
areas
Procedures
troublesome
Others
25.0% 22.0% 17.7% 8.3% 4.7% 4.3% 3.7% 3.0% 11.3%
Note: Single answers
Source: MIC (2005a)
27
Table 6.5: Market Shares of IP Telephony Operators
Softbank BB NTT Com KDDI Plala Net Nifty Japan Telecom Others
64.9% 8.3% 5.6% 3.3% 3.1% 2.3% 12.5%
Note: Single answers
Source: MIC (2005a)

28
Table 6.6: Shares of Internet Connections by IP Telephony Customers
ADSL FTTH CATV Others
88.7% 6.9% 2.5% 1.9%
Note: Single answers
Source: MIC (2005a)

29
Table 6.7: Overall Satisfaction with IP Telephony
Satisfied Not satisfied Service
72.6% 27.4%
Cheap Moderate Expensive Call charges
31.6% 65.8% 2.7%
Good Moderate Bad Quality of
service 11.4% 55.5% 33.0%
Note: Single answers
Source: MIC (2005a)

30
Table 6.8: Advantages of IP Telephony
Cheap rates Flat rates Convenience Nothing Others
49.6% 37.9% 6.8% 4.7% 1.0%
Note: Single answers
Source: MIC (2005a)

31
Table 6.9: Shortcomings of IP Telephony
Inability of
emergency call
Poor voice
quality
Phone number
changes
Inability of
FAX sending Nothing Others
28.5% 27.7% 16.4% 10.8% 12.8% 3.8%
Note: Single answers
Source: MIC (2005a)

32
Figure 6.1: Questionnaire sample
Source: Ida, Kinoshita, and Sato (2007)
Alternative 1 Alternative 2 Alternative 3
Only Fixed PhoneBoth Fixed Phone and
IP PhoneOnly IP Phone
¥1,400 ¥1,600 ¥400
(Fixed Phone) ¥1,400 ¥1,200 --
(IP Phone) -- ¥400 ¥400
(by using fixed phone)
(by using fixed phone) Good by using IP phone
Good by using IP phone Good
Good
(by using fixed phone)
(by using fixed phone) Possible by using IP phone
Possible by using IP phone Possible
Impossible
(by using fixed phone) (by using fixed phone) by using IP phone
Possible Possible Impossible
(by using fixed phone) (by using fixed phone) by using IP phone
Possible Possible Impossible
by using IP phone
by using pre-selection by using IP phone Flat ¥0
Flat ¥20 Flat ¥4
(by using fixed phone)
80 at maximum
(by using fixed phone)
¥80 at maximum
Other Attributes
Voice Quality
Number Portability
(03, 06 and so on)
Emergency Calling
(Police, Fire Station)
FAX Usage
Call Charge
(day time, long-
distance)
Service
Basic Monthly Charge
(Breakdown)
33
Table 6.10 Basic statistics
Note: Figures are sample means of chosen alternatives.
Source Ida, Kinoshita, and Sato (2007)
Alternative Choice No. Choice Ratio Monthly Charge Voice Quality Number Portability Emergency Calls FAX Usage Call Charges
1 (Only Fixed Phone) 1751 0.44 ¥1,389.38 1.00 1.00 1.00 1.00 ¥17.07
2 (Parallel Usage) 1422 0.36 ¥1,622.36 0.48 0.53 1.00 1.00 ¥3.78
3 (Only IP Phone) 827 0.21 ¥318.86 0.54 0.57 0.54 0.43 ¥3.43
34
Table 6.11: Estimation results
Source Ida, Kinoshita, and Sato (2007)
Parameter Pooled Data FTTH CATV ADSL BB NB
-0.00100 -0.00105 -0.00105 -0.00080 -0.00096 -0.00122
0.00011 0.00022 0.00022 0.00021 0.00012 0.00025
0.59873 0.57475 0.73401 0.56260 0.62015 0.54197
0.05853 0.11672 0.11818 0.11399 0.06696 0.12202
0.37706 0.38882 0.22493 0.49633 0.37206 0.41418
0.05474 0.10912 0.10880 0.10581 0.06213 0.11803
0.82917 0.96145 0.84335 0.77991 0.85629 0.75931
0.08626 0.16937 0.16625 0.16297 0.09574 0.20690
0.33052 0.23825 0.40102 0.34462 0.32752 0.37048
0.08410 0.16552 0.16221 0.15936 0.09357 0.19989
-0.01382 -0.01153 -0.01565 -0.01361 -0.01362 -0.01628
0.00513 0.01025 0.01027 0.01024 0.00590 0.01054
0.92057 0.85091 0.89773 0.32221 0.68310 1.84472
0.17805 0.35077 0.34794 0.34232 0.19991 0.40431
1.28470 1.26507 1.07441 0.87835 1.06227 2.18296
0.17112 0.33788 0.33280 0.32267 0.19073 0.39905
No. of observations 4000 1000 1000 1000 3000 1000
Log Likelihood -4100.352 -1032.072 -1021.674 -1049.380 -3114.960 -956.486
Note: Upper row denotes estimates. Lower row denotes standard errors.
FAX Usage
Call Charges
Alt1 Constant
Alt2 Constant
Monthly Charge
Voice Quality
Number Portability
Emergency Calls
35
Table 6.12 Parameters-equality test
Source Ida, Kinoshita, and Sato (2007)
FTTH CATV ADSL
6.938
Not rejected
8.092 20.558
Not rejected Rejected
33.4282 41.4582 56.7282
Rejected Rejected Rejected
---
ADSL ---
CATV
NB
Note1: X20.05(8)=15.51
Note2 X2=57.81 in the case of BB vs. NB
---
36
Table 6.13: WTP
Source Ida, Kinoshita, and Sato (2007)
WTP Voice Quality Number Portability Emergency Call FAX Usage Call Charge
Pooled Data ¥598.52 ¥376.93 ¥828.88 ¥330.41 ¥13.82
FTTH ¥545.55 ¥369.06 ¥912.60 ¥226.14 ¥10.94
CATV ¥697.67 ¥213.79 ¥801.60 ¥381.16 ¥14.88
ADSL ¥704.57 ¥621.57 ¥976.70 ¥431.57 ¥17.05
BB ¥647.42 ¥388.42 ¥893.94 ¥341.92 ¥14.22
NB ¥442.76 ¥338.36 ¥620.31 ¥302.66 ¥13.30

37
Table 6.14: Comparison between 050- and 0ABJ-types of IP telephony
Source Ida, Kinoshita, and Sato (2007)
Choice Probability Average 050 0ABJ
Pool Data 0.22 0.08 0.43
FTTH 0.23 0.09 0.46
CATV 0.24 0.09 0.47
ADSL 0.27 0.10 0.50
BB 0.25 0.09 0.48
NB 0.13 0.05 0.29
Alternative 3 (Only IP Phone)

38
Table 6.15: Household IP telephony penetration rates projections for 2009
Scenario 1: The values of all attributes are set to the sample means.
Scenario 2: The values of voice quality, number portability, emergency calling, FAX usage are set to one (i.e., 0ABJ-type IP telephony) while basic monthly and
calling charges are set to the sample means.
Source: Ida, Kinoshita, and Sato (2007)
Scenario 1 Scenario 2 Scenario 1 Scenario 2
(Average) (0ABJ-type) (Average) (0ABJ-type)
FTTH 10.6% 13.5% FTTH 4.2% 7.2%CATV 4.0% 5.1% CATV 1.7% 2.9%ADSL 20.6% 25.5% ADSL 8.5% 13.8%Total 35.1% 44.1% Total 14.4% 23.9%
Including Parallel Usage (Alternatives 2 and 3) Only IP telephony (Alternative 3)