Embed Size (px)
Citation preview
Chapter 6Properties, Sources, and Detection of Radiation
In the preceding five chapters, we introduced basic concepts of symmetry, and dis-cussed the structure of crystals in terms of three-dimensional periodic arrays ofatoms and/or molecules, sometimes perturbed by various modulation functions. Indoing so, we implicitly assumed that this is indeed the reality. Now it is time to thinkabout the problem from a different point of view: how atoms or molecules can beobserved – either directly or indirectly – and thus, how is it possible to determine thecrystal structure of a material and verify the concepts of crystallographic symmetry.
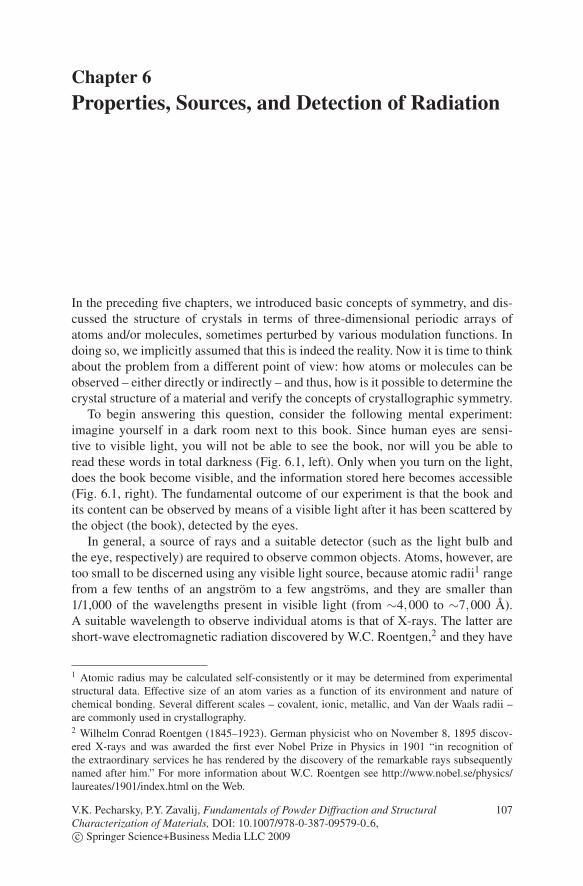
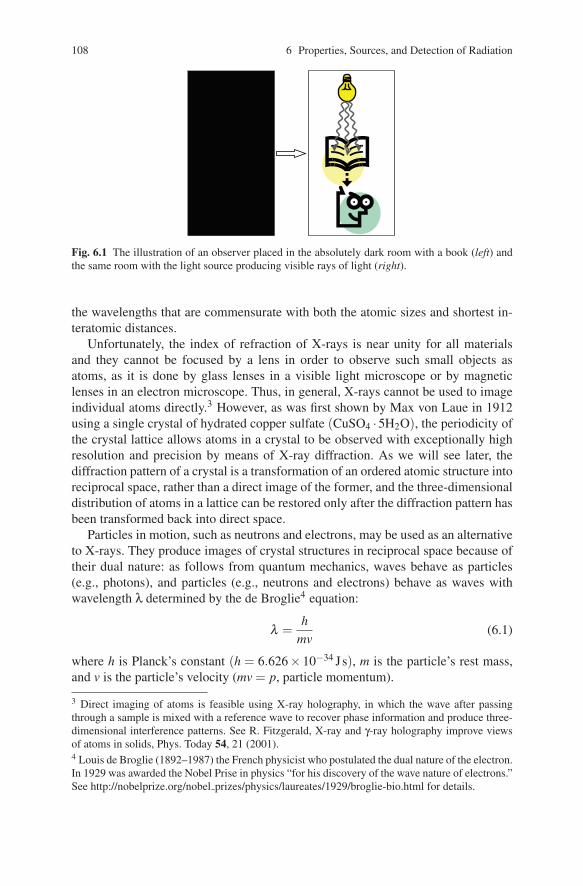
To begin answering this question, consider the following mental experiment:imagine yourself in a dark room next to this book. Since human eyes are sensi-tive to visible light, you will not be able to see the book, nor will you be able toread these words in total darkness (Fig. 6.1, left). Only when you turn on the light,does the book become visible, and the information stored here becomes accessible(Fig. 6.1, right). The fundamental outcome of our experiment is that the book andits content can be observed by means of a visible light after it has been scattered bythe object (the book), detected by the eyes.
In general, a source of rays and a suitable detector (such as the light bulb andthe eye, respectively) are required to observe common objects. Atoms, however, aretoo small to be discerned using any visible light source, because atomic radii1 rangefrom a few tenths of an angstrom to a few angstroms, and they are smaller than1/1,000 of the wavelengths present in visible light (from ∼4,000 to ∼7,000 A).A suitable wavelength to observe individual atoms is that of X-rays. The latter areshort-wave electromagnetic radiation discovered by W.C. Roentgen,2 and they have
1 Atomic radius may be calculated self-consistently or it may be determined from experimentalstructural data. Effective size of an atom varies as a function of its environment and nature ofchemical bonding. Several different scales – covalent, ionic, metallic, and Van der Waals radii –are commonly used in crystallography.2 Wilhelm Conrad Roentgen (1845–1923). German physicist who on November 8, 1895 discov-ered X-rays and was awarded the first ever Nobel Prize in Physics in 1901 “in recognition ofthe extraordinary services he has rendered by the discovery of the remarkable rays subsequentlynamed after him.” For more information about W.C. Roentgen see http://www.nobel.se/physics/laureates/1901/index.html on the Web.
V.K. Pecharsky, P.Y. Zavalij, Fundamentals of Powder Diffraction and Structural 107Characterization of Materials, DOI: 10.1007/978-0-387-09579-0 6,c© Springer Science+Business Media LLC 2009
108 6 Properties, Sources, and Detection of Radiation
Fig. 6.1 The illustration of an observer placed in the absolutely dark room with a book (left) andthe same room with the light source producing visible rays of light (right).
the wavelengths that are commensurate with both the atomic sizes and shortest in-teratomic distances.
Unfortunately, the index of refraction of X-rays is near unity for all materialsand they cannot be focused by a lens in order to observe such small objects asatoms, as it is done by glass lenses in a visible light microscope or by magneticlenses in an electron microscope. Thus, in general, X-rays cannot be used to imageindividual atoms directly.3 However, as was first shown by Max von Laue in 1912using a single crystal of hydrated copper sulfate (CuSO4 ·5H2O), the periodicity ofthe crystal lattice allows atoms in a crystal to be observed with exceptionally highresolution and precision by means of X-ray diffraction. As we will see later, thediffraction pattern of a crystal is a transformation of an ordered atomic structure intoreciprocal space, rather than a direct image of the former, and the three-dimensionaldistribution of atoms in a lattice can be restored only after the diffraction pattern hasbeen transformed back into direct space.
Particles in motion, such as neutrons and electrons, may be used as an alternativeto X-rays. They produce images of crystal structures in reciprocal space because oftheir dual nature: as follows from quantum mechanics, waves behave as particles(e.g., photons), and particles (e.g., neutrons and electrons) behave as waves withwavelength λ determined by the de Broglie4 equation:
λ =h
mv(6.1)
where h is Planck’s constant (h = 6.626× 10⁻³⁴ Js), m is the particle’s rest mass,and v is the particle’s velocity (mv = p, particle momentum).
3 Direct imaging of atoms is feasible using X-ray holography, in which the wave after passingthrough a sample is mixed with a reference wave to recover phase information and produce three-dimensional interference patterns. See R. Fitzgerald, X-ray and γ-ray holography improve viewsof atoms in solids, Phys. Today 54, 21 (2001).4 Louis de Broglie (1892–1987) the French physicist who postulated the dual nature of the electron.In 1929 was awarded the Nobel Prise in physics “for his discovery of the wave nature of electrons.”See http://nobelprize.org/nobel prizes/physics/laureates/1929/broglie-bio.html for details.
6.1 Nature of X-Rays 109
For example, a neutron (rest mass, m = 1.6749×10⁻²⁷ kg) moving at a constantvelocity v = 3,000m/s will also behave as a wave with λ = 1.319 A. Moreover,charged particles, for example, electrons, can be focused using magnetic lenses.Thus, modern high-resolution electron microscopes allow direct imaging of atomicstructures (for the most part in two dimensions on a surface) with the resolution suf-ficient to distinguish individual atoms. Direct imaging methods, however, requiresophisticated equipment and the accuracy in determining atomic positions is sub-stantially lower than that possible by means of diffraction techniques.5 Hence, directvisualization of a structure with atomic resolution is invaluable in certain applica-tions, but the three-dimensional crystal structures are determined exclusively fromdiffraction data. For example, electron microscopy may be used to determine unitcells or modulation vectors, both of which are valuable data that may be furtheremployed in solving a crystal structure using diffraction methods, and specifically,powder diffraction.
Nearly immediately after their discovery, X-rays were put to use to study the in-ternal structure of objects that are opaque to visible light but transparent to X-rays,for example, parts of a human body using radiography, which takes advantage ofvarying absorption: bones absorb X-rays stronger than surrounding tissues. It is in-teresting to note that the lack of understanding of their nature, which did not occuruntil 1912, did not prevent the introduction of X-rays into medicine and engineer-ing. Today, the nature and the properties of X-rays and other types of radiation arewell-understood, and they are briefly considered in this chapter.
6.1 Nature of X-Rays
Electromagnetic radiation is generated every time when electric charge acceleratesor decelerates. It consists of transverse waves where electric (E) and magnetic (H)vectors are perpendicular to one another and to the propagation vector of the wave(k), see Fig. 6.2, top. The X-rays have wavelengths from ∼0.1 to ∼100 A, which arelocated between γ-radiation and ultraviolet rays as also shown in Fig. 6.2, bottom.The wavelengths, most commonly used in crystallography, range between ∼0.5 and∼2.5 A since they are of the same order of magnitude as the shortest interatomic dis-tances observed in both organic and inorganic materials. Furthermore, these wave-lengths can be easily produced in almost every research laboratory.
5 Despite recent progress in the three-dimensional X-ray holography [e.g., see M. Tegze, G. Faigel,S. Marchesini, M. Belakhovsky, and A. I. Chumakov, Three-dimensional imaging of atoms withisotropic 0.5 A resolution, Phys. Rev. Lett. 82, 4847 (1999)], which in principle enables visu-alization of the atomic structure in three dimensions, its accuracy in determining coordinates ofatoms and interatomic distances is much lower than possible by employing conventional diffractionmethods.

110 6 Properties, Sources, and Detection of Radiation
mic
row
ave
Wavelength, λ (m)10−12 10−11 10−10 10−9 10−8 10−7 10−6 10−5 10−4 10−3 10−2 10−1 100
γ-ra
ys
ultr
avio
let
visibl
e
infr
ared
radi
o
X-r
ays
E
H
k
Wavelength, λ
Wavelength, λ
Fig. 6.2 Top – the schematic of the transverse electromagnetic wave in which electric (E) andmagnetic (H) vectors are mutually perpendicular, and both are perpendicular to the direction ofthe propagation vector of the wave, k. The wavelength, λ, is the distance between the two neigh-boring wave crests. Bottom – the spectrum of the electromagnetic waves. The range of typicalX-ray wavelengths is shaded. The boundaries between different types of electromagnetic wavesare diffuse.
6.2 Production of X-Rays
The X-rays are usually generated using two different methods or sources. The first isa device, which is called an X-ray tube, where electromagnetic waves are generatedfrom impacts of high-energy electrons with a metal target. These are the simplestand the most commonly used sources of X-rays that are available in a laboratory ofany size, and thus, an X-ray tube is known as a laboratory or a conventional X-raysource. Conventional X-ray sources usually have a low efficiency, and their bright-ness6 is fundamentally limited by the thermal properties of the target material. Thelatter must be continuously cooled because nearly all kinetic energy of the acceler-ated electrons is converted into heat when they decelerate rapidly (and sometimesinstantly) during the impacts with a metal target.
The second is a much more advanced source of X-ray radiation – the synchrotron,where high energy electrons are confined in a storage ring. When they move in acircular orbit, electrons accelerate toward the center of the ring, thus emitting elec-tromagnetic radiation. The synchrotron sources are extremely bright (or brilliant7)
6 Brightness is measured as photon flux – a number of photons per second per unit area – wherethe area is expressed in terms of the corresponding solid angle in the divergent beam. Brightnessis different from intensity of the beam, which is the total number of photons leaving the target,because intensity can be easily increased by increasing the area of the target irradiated by electronswithout increasing brightness.7 The quality of synchrotron beams is usually characterized by brilliance, which is defined asbrightness divided by the product of the source area (in mm2) and a fraction of a useful photon
6.2 Production of X-Rays 111
since thermal losses are minimized, and there is no target to cool. Their brightnessis only limited by the flux of electrons in the high energy beam. Today, the so-calledthird generation of synchrotrons is in operation, and their brilliance exceeds that ofthe conventional X-ray tube by nearly ten orders of magnitude.
Obviously, given the cost of both the construction and maintenance of a syn-chrotron source, owning one would be prohibitively expensive and inefficient foran average crystallographic laboratory. All synchrotron sources are multiple-userfacilities, which are constructed and maintained using governmental support (e.g.,they are supported by the United States Department of Energy and National ScienceFoundation in the United States, and by similar agencies in Europe, Japan, and othercountries).
In general, there is no principal difference in the diffraction phenomena usingthe synchrotron and conventional X-ray sources, except for the presence of severalhighly intense peaks with fixed wavelengths in the conventionally obtained X-rayspectrum and their absence, that is, the continuous distribution of photon energieswhen using synchrotron sources. Here and throughout the book, the X-rays fromconventional sources are of concern, unless noted otherwise.
6.2.1 Conventional Sealed X-Ray Sources
As noted earlier, the X-ray tube is a conventional laboratory source of X-rays. Thetwo types of X-ray tubes in common use today are the sealed tube and the rotatinganode tube. The sealed tube consists of a stationary anode coupled with a cathode,and both are placed inside a metal/glass or a metal/ceramic container sealed underhigh vacuum, as shown in Fig. 6.3.
The X-ray tube assembly is a simple and maintenance-free device. However,the overall efficiency of an X-ray tube is very low – approximately 1% or less.Most of the energy supplied to the tube is converted into heat, and therefore, theanode must be continuously cooled with chilled water to avoid target meltdown.The input power to the sealed X-ray tube (∼0.5 to 3kW) is, therefore, limited bythe tube’s ability to dissipate heat, but the resultant energy of the usable X-ray beamis much lower than 1% of the input power because only a small fraction of thegenerated photons exits through each window. Additional losses occur during themonochromatization and collimation of the beam (see Sect. 11.2).
In the X-ray tube, electrons are emitted by the cathode, usually electrically heatedtungsten filament, and they are accelerated toward the anode by a high electrostaticpotential (30 to 60 kV) maintained between the cathode and the anode. The typicalcurrent in a sealed tube is between 10 and 50 mA. The X-rays are generated by theimpacts of high-energy electrons with the metal target of a water-cooled anode, andthey exit the tube through beryllium (Be) windows, as shown in Figs. 6.3 and 6.4.
energy, i.e., bandwidth (see, for example, J. Als-Nielsen and D. McMorrow, Elements of modernX-ray physics, Wiley, New York (2001)).
112 6 Properties, Sources, and Detection of Radiation
Water
X-raysX-rays
Be windowAnode
_e
Cathode
Be windows
Coupling to a highvoltage cable
Water in
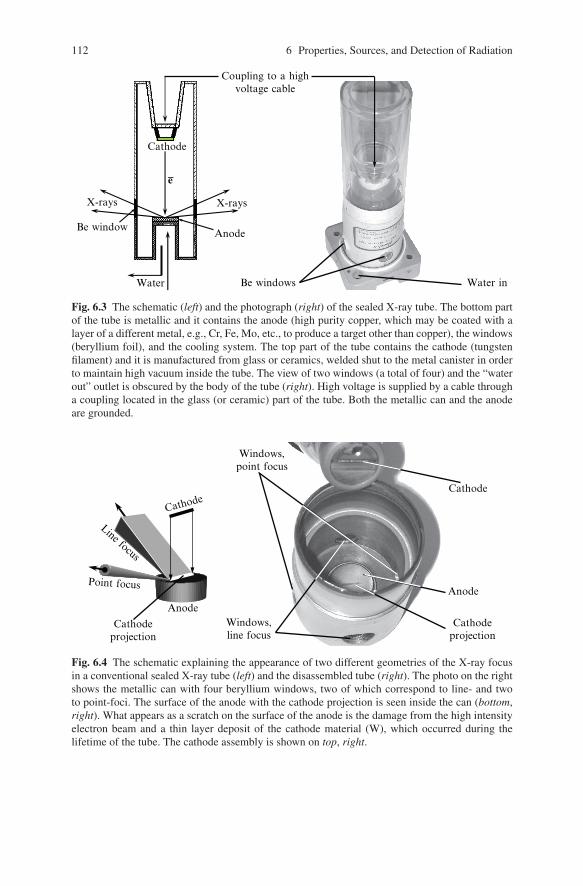
Fig. 6.3 The schematic (left) and the photograph (right) of the sealed X-ray tube. The bottom partof the tube is metallic and it contains the anode (high purity copper, which may be coated with alayer of a different metal, e.g., Cr, Fe, Mo, etc., to produce a target other than copper), the windows(beryllium foil), and the cooling system. The top part of the tube contains the cathode (tungstenfilament) and it is manufactured from glass or ceramics, welded shut to the metal canister in orderto maintain high vacuum inside the tube. The view of two windows (a total of four) and the “waterout” outlet is obscured by the body of the tube (right). High voltage is supplied by a cable througha coupling located in the glass (or ceramic) part of the tube. Both the metallic can and the anodeare grounded.
Windows,line focus
Anode
Cathode
Windows,point focus
Cathodeprojection
Cathode
Anode
Cathodeprojection
Point focus
Line focus
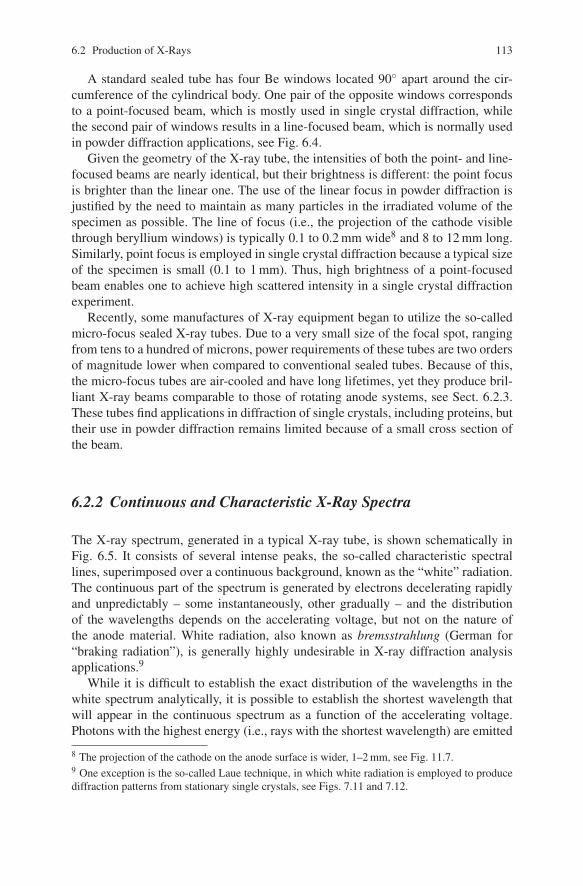
Fig. 6.4 The schematic explaining the appearance of two different geometries of the X-ray focusin a conventional sealed X-ray tube (left) and the disassembled tube (right). The photo on the rightshows the metallic can with four beryllium windows, two of which correspond to line- and twoto point-foci. The surface of the anode with the cathode projection is seen inside the can (bottom,right). What appears as a scratch on the surface of the anode is the damage from the high intensityelectron beam and a thin layer deposit of the cathode material (W), which occurred during thelifetime of the tube. The cathode assembly is shown on top, right.
6.2 Production of X-Rays 113
A standard sealed tube has four Be windows located 90◦ apart around the cir-cumference of the cylindrical body. One pair of the opposite windows correspondsto a point-focused beam, which is mostly used in single crystal diffraction, whilethe second pair of windows results in a line-focused beam, which is normally usedin powder diffraction applications, see Fig. 6.4.
Given the geometry of the X-ray tube, the intensities of both the point- and line-focused beams are nearly identical, but their brightness is different: the point focusis brighter than the linear one. The use of the linear focus in powder diffraction isjustified by the need to maintain as many particles in the irradiated volume of thespecimen as possible. The line of focus (i.e., the projection of the cathode visiblethrough beryllium windows) is typically 0.1 to 0.2 mm wide8 and 8 to 12 mm long.Similarly, point focus is employed in single crystal diffraction because a typical sizeof the specimen is small (0.1 to 1 mm). Thus, high brightness of a point-focusedbeam enables one to achieve high scattered intensity in a single crystal diffractionexperiment.
Recently, some manufactures of X-ray equipment began to utilize the so-calledmicro-focus sealed X-ray tubes. Due to a very small size of the focal spot, rangingfrom tens to a hundred of microns, power requirements of these tubes are two ordersof magnitude lower when compared to conventional sealed tubes. Because of this,the micro-focus tubes are air-cooled and have long lifetimes, yet they produce bril-liant X-ray beams comparable to those of rotating anode systems, see Sect. 6.2.3.These tubes find applications in diffraction of single crystals, including proteins, buttheir use in powder diffraction remains limited because of a small cross section ofthe beam.
6.2.2 Continuous and Characteristic X-Ray Spectra
The X-ray spectrum, generated in a typical X-ray tube, is shown schematically inFig. 6.5. It consists of several intense peaks, the so-called characteristic spectrallines, superimposed over a continuous background, known as the “white” radiation.The continuous part of the spectrum is generated by electrons decelerating rapidlyand unpredictably – some instantaneously, other gradually – and the distributionof the wavelengths depends on the accelerating voltage, but not on the nature ofthe anode material. White radiation, also known as bremsstrahlung (German for“braking radiation”), is generally highly undesirable in X-ray diffraction analysisapplications.9
While it is difficult to establish the exact distribution of the wavelengths in thewhite spectrum analytically, it is possible to establish the shortest wavelength thatwill appear in the continuous spectrum as a function of the accelerating voltage.Photons with the highest energy (i.e., rays with the shortest wavelength) are emitted
8 The projection of the cathode on the anode surface is wider, 1–2 mm, see Fig. 11.7.9 One exception is the so-called Laue technique, in which white radiation is employed to producediffraction patterns from stationary single crystals, see Figs. 7.11 and 7.12.
114 6 Properties, Sources, and Detection of Radiation
Wavelength, λ
Inte
nsity
Kα1
Kα2
KβλSW
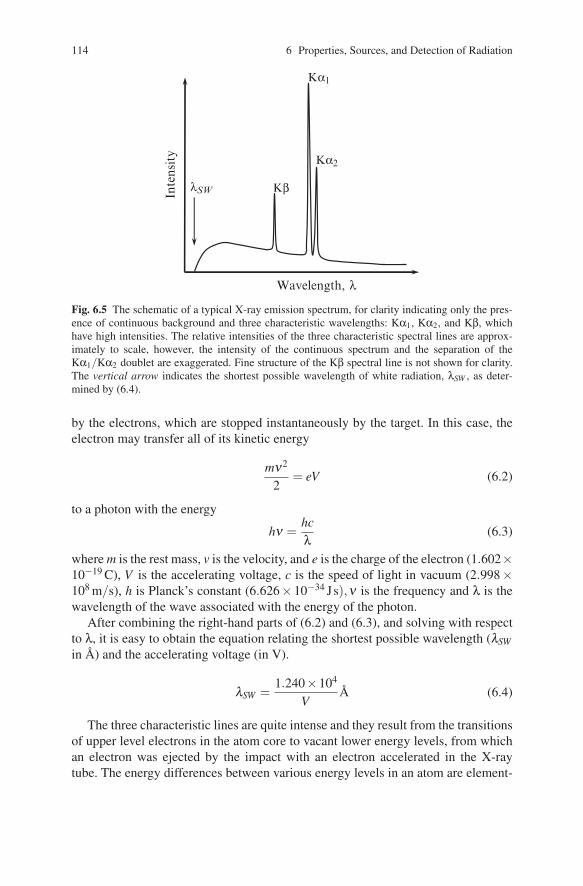
Fig. 6.5 The schematic of a typical X-ray emission spectrum, for clarity indicating only the pres-ence of continuous background and three characteristic wavelengths: Kα1, Kα2, and Kβ, whichhave high intensities. The relative intensities of the three characteristic spectral lines are approx-imately to scale, however, the intensity of the continuous spectrum and the separation of theKα1/Kα2 doublet are exaggerated. Fine structure of the Kβ spectral line is not shown for clarity.The vertical arrow indicates the shortest possible wavelength of white radiation, λSW , as deter-mined by (6.4).
by the electrons, which are stopped instantaneously by the target. In this case, theelectron may transfer all of its kinetic energy
mν2
2= eV (6.2)
to a photon with the energy
hν =hcλ
(6.3)
where m is the rest mass, v is the velocity, and e is the charge of the electron (1.602×10⁻¹⁹ C), V is the accelerating voltage, c is the speed of light in vacuum (2.998×10⁸ m/s), h is Planck’s constant (6.626× 10⁻³⁴ Js),ν is the frequency and λ is thewavelength of the wave associated with the energy of the photon.
After combining the right-hand parts of (6.2) and (6.3), and solving with respectto λ, it is easy to obtain the equation relating the shortest possible wavelength (λSWin A) and the accelerating voltage (in V).
λSW =1.240×10⁴
VA (6.4)
The three characteristic lines are quite intense and they result from the transitionsof upper level electrons in the atom core to vacant lower energy levels, from whichan electron was ejected by the impact with an electron accelerated in the X-raytube. The energy differences between various energy levels in an atom are element-
6.2 Production of X-Rays 115
Table 6.1 Characteristic wavelengths of five common anode materials and the K absorption edgesof suitable β-filter materials.10
Anode Wavelength (A) β filter K absorptionmaterial edge (A)
Kαa Kα1 Kα2 Kβ
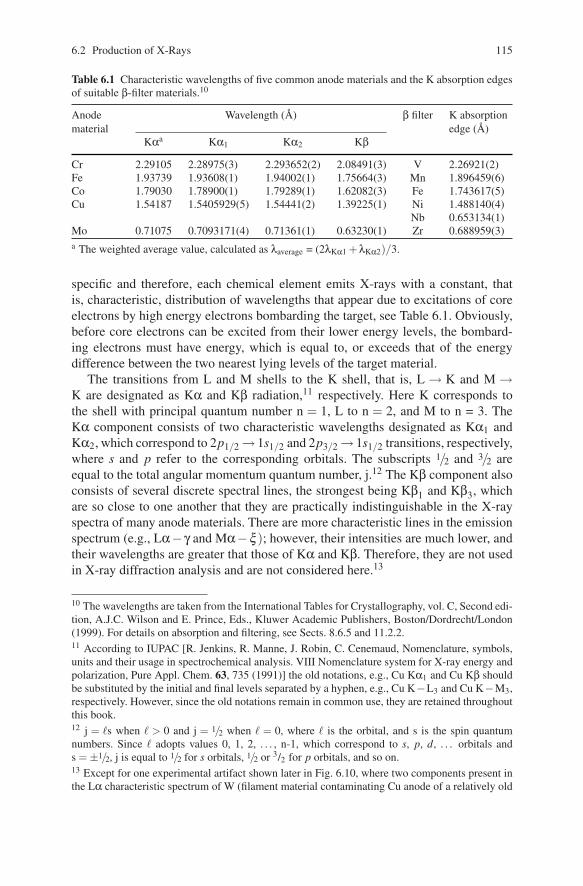
Cr 2.29105 2.28975(3) 2.293652(2) 2.08491(3) V 2.26921(2)Fe 1.93739 1.93608(1) 1.94002(1) 1.75664(3) Mn 1.896459(6)Co 1.79030 1.78900(1) 1.79289(1) 1.62082(3) Fe 1.743617(5)Cu 1.54187 1.5405929(5) 1.54441(2) 1.39225(1) Ni 1.488140(4)
Nb 0.653134(1)Mo 0.71075 0.7093171(4) 0.71361(1) 0.63230(1) Zr 0.688959(3)a The weighted average value, calculated as λaverage = (2λKα1 +λKα2)/3.
specific and therefore, each chemical element emits X-rays with a constant, thatis, characteristic, distribution of wavelengths that appear due to excitations of coreelectrons by high energy electrons bombarding the target, see Table 6.1. Obviously,before core electrons can be excited from their lower energy levels, the bombard-ing electrons must have energy, which is equal to, or exceeds that of the energydifference between the two nearest lying levels of the target material.
The transitions from L and M shells to the K shell, that is, L → K and M →K are designated as Kα and Kβ radiation,11 respectively. Here K corresponds tothe shell with principal quantum number n = 1, L to n = 2, and M to n = 3. TheKα component consists of two characteristic wavelengths designated as Kα1 andKα2, which correspond to 2p1/2 → 1s1/2 and 2p3/2 → 1s1/2 transitions, respectively,where s and p refer to the corresponding orbitals. The subscripts 1/2 and 3/2 areequal to the total angular momentum quantum number, j.12 The Kβ component alsoconsists of several discrete spectral lines, the strongest being Kβ1 and Kβ3, whichare so close to one another that they are practically indistinguishable in the X-rayspectra of many anode materials. There are more characteristic lines in the emissionspectrum (e.g., Lα− γ and Mα−ξ ); however, their intensities are much lower, andtheir wavelengths are greater that those of Kα and Kβ. Therefore, they are not usedin X-ray diffraction analysis and are not considered here.13
10 The wavelengths are taken from the International Tables for Crystallography, vol. C, Second edi-tion, A.J.C. Wilson and E. Prince, Eds., Kluwer Academic Publishers, Boston/Dordrecht/London(1999). For details on absorption and filtering, see Sects. 8.6.5 and 11.2.2.11 According to IUPAC [R. Jenkins, R. Manne, J. Robin, C. Cenemaud, Nomenclature, symbols,units and their usage in spectrochemical analysis. VIII Nomenclature system for X-ray energy andpolarization, Pure Appl. Chem. 63, 735 (1991)] the old notations, e.g., Cu Kα1 and Cu Kβ shouldbe substituted by the initial and final levels separated by a hyphen, e.g., Cu K−L3 and Cu K−M3,respectively. However, since the old notations remain in common use, they are retained throughoutthis book.12 j = �s when � > 0 and j = 1/2 when � = 0, where � is the orbital, and s is the spin quantumnumbers. Since � adopts values 0, 1, 2, . . . , n-1, which correspond to s, p, d, . . . orbitals ands = ±1/2, j is equal to 1/2 for s orbitals, 1/2 or 3/2 for p orbitals, and so on.13 Except for one experimental artifact shown later in Fig. 6.10, where two components present inthe Lα characteristic spectrum of W (filament material contaminating Cu anode of a relatively old
116 6 Properties, Sources, and Detection of Radiation
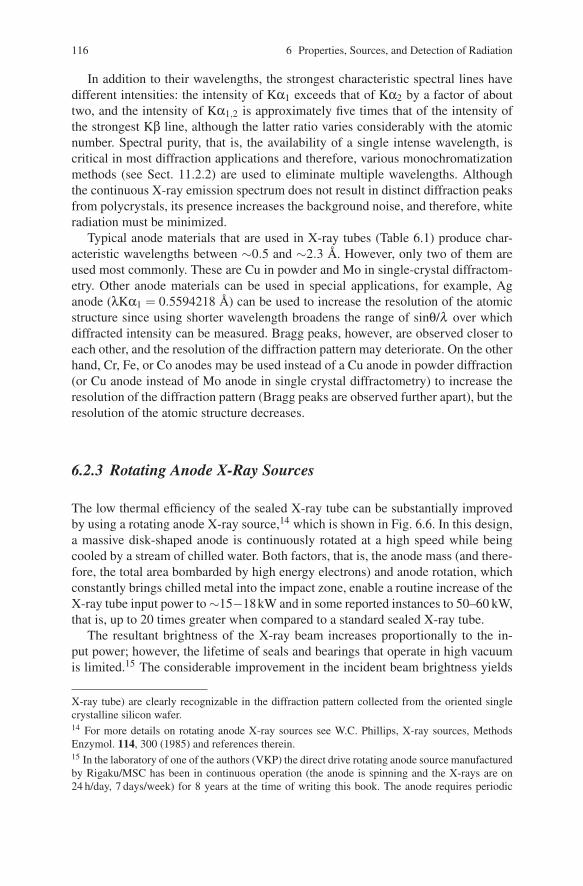
In addition to their wavelengths, the strongest characteristic spectral lines havedifferent intensities: the intensity of Kα1 exceeds that of Kα2 by a factor of abouttwo, and the intensity of Kα1,2 is approximately five times that of the intensity ofthe strongest Kβ line, although the latter ratio varies considerably with the atomicnumber. Spectral purity, that is, the availability of a single intense wavelength, iscritical in most diffraction applications and therefore, various monochromatizationmethods (see Sect. 11.2.2) are used to eliminate multiple wavelengths. Althoughthe continuous X-ray emission spectrum does not result in distinct diffraction peaksfrom polycrystals, its presence increases the background noise, and therefore, whiteradiation must be minimized.
Typical anode materials that are used in X-ray tubes (Table 6.1) produce char-acteristic wavelengths between ∼0.5 and ∼2.3 A. However, only two of them areused most commonly. These are Cu in powder and Mo in single-crystal diffractom-etry. Other anode materials can be used in special applications, for example, Aganode (λKα1 = 0.5594218 A) can be used to increase the resolution of the atomicstructure since using shorter wavelength broadens the range of sinθ/λ over whichdiffracted intensity can be measured. Bragg peaks, however, are observed closer toeach other, and the resolution of the diffraction pattern may deteriorate. On the otherhand, Cr, Fe, or Co anodes may be used instead of a Cu anode in powder diffraction(or Cu anode instead of Mo anode in single crystal diffractometry) to increase theresolution of the diffraction pattern (Bragg peaks are observed further apart), but theresolution of the atomic structure decreases.
6.2.3 Rotating Anode X-Ray Sources
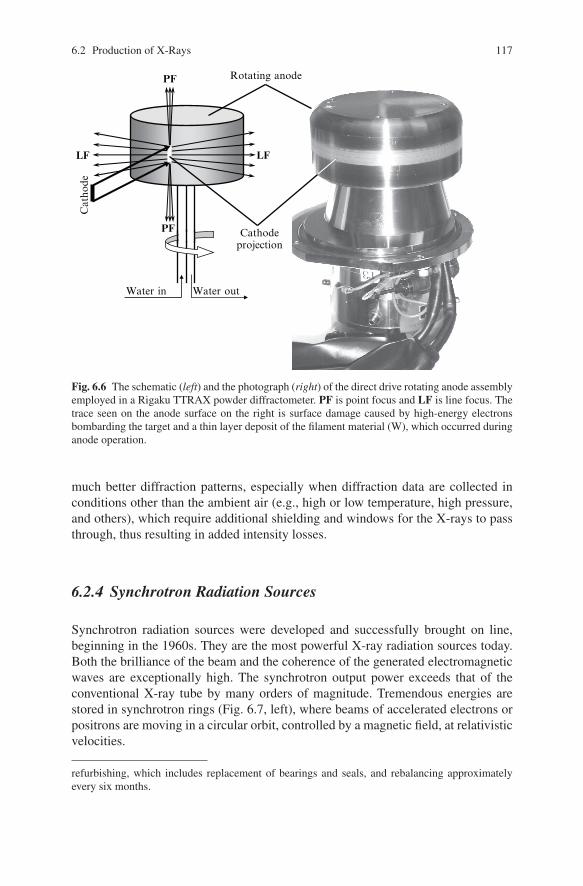
The low thermal efficiency of the sealed X-ray tube can be substantially improvedby using a rotating anode X-ray source,14 which is shown in Fig. 6.6. In this design,a massive disk-shaped anode is continuously rotated at a high speed while beingcooled by a stream of chilled water. Both factors, that is, the anode mass (and there-fore, the total area bombarded by high energy electrons) and anode rotation, whichconstantly brings chilled metal into the impact zone, enable a routine increase of theX-ray tube input power to ∼15−18kW and in some reported instances to 50–60 kW,that is, up to 20 times greater when compared to a standard sealed X-ray tube.
The resultant brightness of the X-ray beam increases proportionally to the in-put power; however, the lifetime of seals and bearings that operate in high vacuumis limited.15 The considerable improvement in the incident beam brightness yields
X-ray tube) are clearly recognizable in the diffraction pattern collected from the oriented singlecrystalline silicon wafer.14 For more details on rotating anode X-ray sources see W.C. Phillips, X-ray sources, MethodsEnzymol. 114, 300 (1985) and references therein.15 In the laboratory of one of the authors (VKP) the direct drive rotating anode source manufacturedby Rigaku/MSC has been in continuous operation (the anode is spinning and the X-rays are on24 h/day, 7 days/week) for 8 years at the time of writing this book. The anode requires periodic
6.2 Production of X-Rays 117
Rotating anodeC
atho
de
Water in Water out
Cathodeprojection
LFLF
PF
PF
Fig. 6.6 The schematic (left) and the photograph (right) of the direct drive rotating anode assemblyemployed in a Rigaku TTRAX powder diffractometer. PF is point focus and LF is line focus. Thetrace seen on the anode surface on the right is surface damage caused by high-energy electronsbombarding the target and a thin layer deposit of the filament material (W), which occurred duringanode operation.
much better diffraction patterns, especially when diffraction data are collected inconditions other than the ambient air (e.g., high or low temperature, high pressure,and others), which require additional shielding and windows for the X-rays to passthrough, thus resulting in added intensity losses.
6.2.4 Synchrotron Radiation Sources
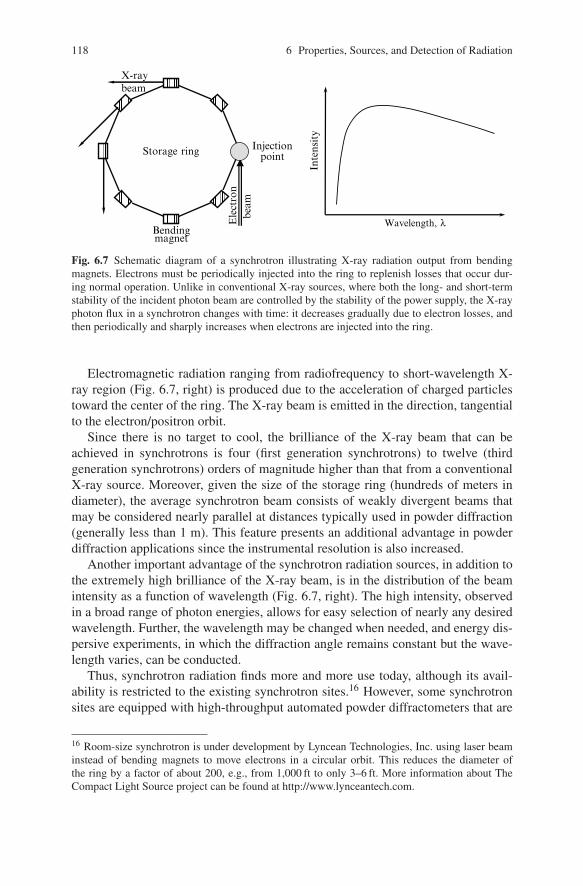
Synchrotron radiation sources were developed and successfully brought on line,beginning in the 1960s. They are the most powerful X-ray radiation sources today.Both the brilliance of the beam and the coherence of the generated electromagneticwaves are exceptionally high. The synchrotron output power exceeds that of theconventional X-ray tube by many orders of magnitude. Tremendous energies arestored in synchrotron rings (Fig. 6.7, left), where beams of accelerated electrons orpositrons are moving in a circular orbit, controlled by a magnetic field, at relativisticvelocities.
refurbishing, which includes replacement of bearings and seals, and rebalancing approximatelyevery six months.
118 6 Properties, Sources, and Detection of Radiation
X-raybeam
Ele
ctro
nbe
amBendingmagnet
Storage ring Injectionpoint
Wavelength, λ
Inte
nsity
Fig. 6.7 Schematic diagram of a synchrotron illustrating X-ray radiation output from bendingmagnets. Electrons must be periodically injected into the ring to replenish losses that occur dur-ing normal operation. Unlike in conventional X-ray sources, where both the long- and short-termstability of the incident photon beam are controlled by the stability of the power supply, the X-rayphoton flux in a synchrotron changes with time: it decreases gradually due to electron losses, andthen periodically and sharply increases when electrons are injected into the ring.
Electromagnetic radiation ranging from radiofrequency to short-wavelength X-ray region (Fig. 6.7, right) is produced due to the acceleration of charged particlestoward the center of the ring. The X-ray beam is emitted in the direction, tangentialto the electron/positron orbit.
Since there is no target to cool, the brilliance of the X-ray beam that can beachieved in synchrotrons is four (first generation synchrotrons) to twelve (thirdgeneration synchrotrons) orders of magnitude higher than that from a conventionalX-ray source. Moreover, given the size of the storage ring (hundreds of meters indiameter), the average synchrotron beam consists of weakly divergent beams thatmay be considered nearly parallel at distances typically used in powder diffraction(generally less than 1 m). This feature presents an additional advantage in powderdiffraction applications since the instrumental resolution is also increased.
Another important advantage of the synchrotron radiation sources, in addition tothe extremely high brilliance of the X-ray beam, is in the distribution of the beamintensity as a function of wavelength (Fig. 6.7, right). The high intensity, observedin a broad range of photon energies, allows for easy selection of nearly any desiredwavelength. Further, the wavelength may be changed when needed, and energy dis-persive experiments, in which the diffraction angle remains constant but the wave-length varies, can be conducted.
Thus, synchrotron radiation finds more and more use today, although its avail-ability is restricted to the existing synchrotron sites.16 However, some synchrotronsites are equipped with high-throughput automated powder diffractometers that are
16 Room-size synchrotron is under development by Lyncean Technologies, Inc. using laser beaminstead of bending magnets to move electrons in a circular orbit. This reduces the diameter ofthe ring by a factor of about 200, e.g., from 1,000 ft to only 3–6 ft. More information about TheCompact Light Source project can be found at http://www.lynceantech.com.
6.3 Other Types of Radiation 119
made available to a broad scientific community. For example, beamline 11-BM,designed by Brian Toby at the APS, is equipped with a 12-channel analyzer systemand 100+ samples robotic changer, and is available for rapid access using mail-inservice.17 Some of the well-known sites are the ALS – Advanced Light Source atBerkeley Lab, APS – Advanced Photon Source at Argonne National Laboratory,NSLS – National Synchrotron Light Source at Brookhaven National Laboratory,SRS – Synchrotron Radiation Source at Daresbury Laboratory, ESRF – EuropeanSynchrotron Radiation Facility in Grenoble, and others.18
6.3 Other Types of Radiation
Other types of radiation that are commonly used in diffraction analysis are neutronsand electrons. The properties of both are compared with those of X-rays in Table 6.2.
Neutrons are usually produced in nuclear reactors; they have variable energy andtherefore, a white spectrum. Maximum flux of neutrons is usually obtained in anangstrom range of wavelengths. The main differences when compared to X-rays areas follows: (i) neutrons are scattered by nuclei, which are much smaller than electronclouds, and the scattering occurs on points; (ii) scattering factors of elements remainconstant over the whole range of Bragg angles; (iii) scattering functions are notproportional to the atomic number, and they are different for different isotopes ofthe same chemical element. Furthermore, since neutrons have spins, they interactwith the unpaired electron spins (magnetic moments) and thus neutron diffractiondata are commonly used to determine ordered magnetic structures. Other differencesbetween neutrons and X-rays are nonessential in the general diffraction theory.
One of the biggest disadvantages of the conventional (reactor-generated) neutronsources is relatively low neutron flux at useful energies and weak interactions ofneutrons with matter. Hence, a typical neutron experiment calls for 1 to 5 cm3 ofa material.19 This problem is addressed in the new generation of highly intensepulsed (spallation) neutron sources.20 In a spallation neutron source, bunches ofprotons are accelerated to high energies, and then released, bombarding a heavymetal target in short but extremely potent pulses. The collision of each proton witha heavy metal nucleus results in many expelled (spalled or knocked out) neutrons atvarious energies. The resultant highly intense (∼102 times higher flux than in any
17 See http://11bm.xor.aps.anl.gov/.18 Web links to worldwide synchrotron and neutron facilities can be found at http://www.iucr.org/cww-top/rad.index.html.19 This volume is a few orders of magnitude greater than needed for an X-ray diffraction ex-periment. Some of the third generation, high-flux neutron sources allow measurements of muchsmaller amounts, e.g., as little as 1mm3, but acceptable levels of the scattered intensity are gener-ally achieved by sacrificing resolution.20 The most powerful operational pulsed neutron source is SNS – the Spallation Neutron Source –at the Oak Ridge National Laboratory (http://www.sns.gov/). The next is ISIS, which is located atthe Rutherford Appleton Laboratory in the UK (http://www.isis.rl.ac.uk/).
120 6 Properties, Sources, and Detection of Radiation
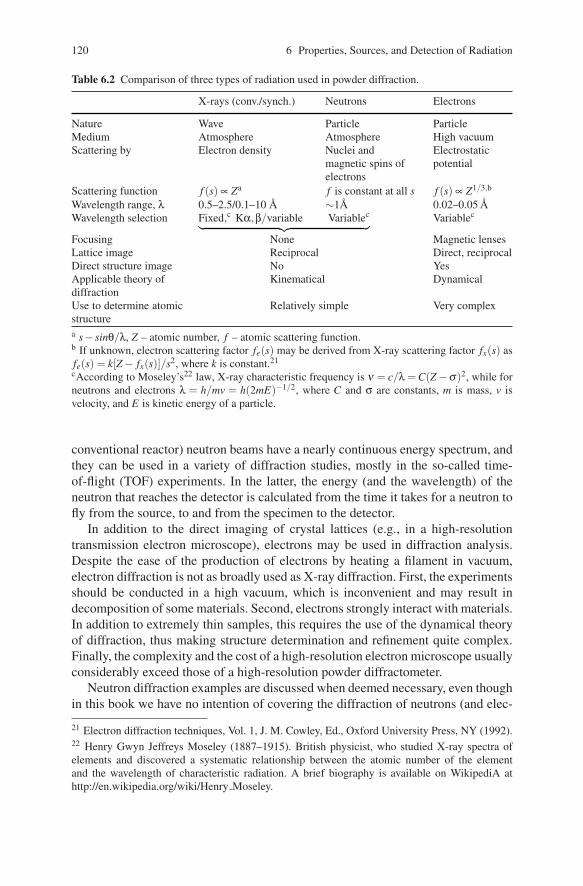
Table 6.2 Comparison of three types of radiation used in powder diffraction.
X-rays (conv./synch.) Neutrons Electrons
Nature Wave Particle ParticleMedium Atmosphere Atmosphere High vacuumScattering by Electron density Nuclei and
magnetic spins ofelectrons
Electrostaticpotential
Scattering function f (s) ∝ Za f is constant at all s f (s) ∝ Z1/3,b
Wavelength range, λ 0.5–2.5/0.1–10 A ∼1A 0.02–0.05 AWavelength selection Fixed,c Kα,β/variable Variablec︸ ︷︷ ︸ Variablec
Focusing None Magnetic lensesLattice image Reciprocal Direct, reciprocalDirect structure image No YesApplicable theory ofdiffraction
Kinematical Dynamical
Use to determine atomicstructure
Relatively simple Very complex
a s− sinθ/λ, Z – atomic number, f – atomic scattering function.b If unknown, electron scattering factor fe(s) may be derived from X-ray scattering factor fx(s) asfe(s) = k[Z − fx(s)]/s2, where k is constant.21
cAccording to Moseley’s22 law, X-ray characteristic frequency is ν = c/λ = C(Z −σ)2, while forneutrons and electrons λ = h/mv = h(2mE)−1/2, where C and σ are constants, m is mass, v isvelocity, and E is kinetic energy of a particle.
conventional reactor) neutron beams have a nearly continuous energy spectrum, andthey can be used in a variety of diffraction studies, mostly in the so-called time-of-flight (TOF) experiments. In the latter, the energy (and the wavelength) of theneutron that reaches the detector is calculated from the time it takes for a neutron tofly from the source, to and from the specimen to the detector.
In addition to the direct imaging of crystal lattices (e.g., in a high-resolutiontransmission electron microscope), electrons may be used in diffraction analysis.Despite the ease of the production of electrons by heating a filament in vacuum,electron diffraction is not as broadly used as X-ray diffraction. First, the experimentsshould be conducted in a high vacuum, which is inconvenient and may result indecomposition of some materials. Second, electrons strongly interact with materials.In addition to extremely thin samples, this requires the use of the dynamical theoryof diffraction, thus making structure determination and refinement quite complex.Finally, the complexity and the cost of a high-resolution electron microscope usuallyconsiderably exceed those of a high-resolution powder diffractometer.
Neutron diffraction examples are discussed when deemed necessary, even thoughin this book we have no intention of covering the diffraction of neutrons (and elec-
21 Electron diffraction techniques, Vol. 1, J. M. Cowley, Ed., Oxford University Press, NY (1992).22 Henry Gwyn Jeffreys Moseley (1887–1915). British physicist, who studied X-ray spectra ofelements and discovered a systematic relationship between the atomic number of the elementand the wavelength of characteristic radiation. A brief biography is available on WikipediA athttp://en.wikipedia.org/wiki/Henry Moseley.
6.4 Detection of X-Rays 121
trons) at any significant depth. Interested readers can find more information onelectron and neutron diffraction in some of the references provided at the end ofthis chapter.
6.4 Detection of X-Rays
The detector is an integral part of any diffraction analysis system, and its major roleis to measure the intensity and, sometimes, the direction of the scattered beam. Thedetection is based on the ability of X-rays to interact with matter and to produce cer-tain effects or signals, for example, to generate particles, waves, electrical current,etc., which can be easily registered. In other words, each photon entering the detec-tor generates a specific event, better yet, a series of events that can be recognized,and from which the total photon count (intensity) can be determined. Obviously, thedetector must be sensitive to X-rays (or in general to the radiation being detected),and should have an extended dynamic range and low background noise.23
6.4.1 Detector Efficiency, Linearity, Proportionality and Resolution
An important characteristic of any detector is how efficiently it collects X-ray pho-tons and then converts them into a measurable signal. Detector efficiency is deter-mined by first, a fraction of X-ray photons that pass through the detector window(the higher, the better) and second, a fraction of photons that are absorbed by thedetector and thus result in a series of detectable events (again, the higher, the bet-ter). The product of the two fractions, which is known as the absorption or quantumefficiency, should usually be between 0.5 and 1.
The efficiency of modern detectors is quite high, in contrast to the X-ray film,which requires multiple photons to activate a single grain of photon-sensitive silverhalide. It is important to keep in mind that the efficiency depends on the type of thedetector and it normally varies with the wavelength for the same type of the detector.The need for high efficiency is difficult to overestimate since every missed (i.e., notabsorbed by the detector) photon is simply a lost photon. It is nearly impossible toaccount for the lost photons by any amplification method, no matter how far theamplification algorithm has been advanced.
The linearity of the detector is critical in obtaining correct intensity measure-ments (photon count). The detector is considered linear when there is a linear depen-dence between the photon flux (the number of photons entering through the detectorwindow in one second) and the rate of signals generated by the detector (usually the
23 For the purpose of this consideration, the dynamic range is the ability of the detector to countphotons at both the low and high fluxes with the same effectiveness, and by the background noisewe mean the events similar to those generated by the absorbed photons, but occurring randomlyand spontaneously in the detector without photons entering the detector.
122 6 Properties, Sources, and Detection of Radiation
number of voltage pulses) per second. In any detector, it takes some time to absorba photon, convert it into a voltage pulse, register the pulse, and reset the detectorto the initial state, that is, make it ready for the next operation. This time is usuallyknown as the dead time of the detector – the time during which the detector remainsinactive after it has just registered a photon.
The presence of the dead time always decreases the registered intensity. Thiseffect, however, becomes substantial only at high photon fluxes. When the detectoris incapable of counting every photon due to the dead time, some of them could beabsorbed by the detector but remain unaccounted, that is, become lost photons. It issaid that the detector becomes nonlinear under these conditions. Thus the linearityof the detector can be expressed as: (i) the maximum flux in photons per second thatcan be reliably counted (the higher the better); (ii) the dead time (the shorter, thebetter), or (iii) the percentage of the loss of linearity at certain high photon flux (thelower percentage, the better). The latter is compared for several different types ofdetectors in Table 6.3 along with other characteristics.
The proportionality of the detector determines how the size of the generated volt-age pulse is related to the energy of the X-ray photon. Since X-ray photons producea certain amount of events (ion pairs, photons of visible light, etc.), and each eventrequires certain energy, the number of events is generally proportional to the energyof the X-ray photon and therefore, to the inverse of its wavelength. The amplitudeof the generated signal is normally proportional to the number of these events andthus, it is proportional to the X-ray photon energy, which could be used in pulse-height discrimination. Usually, the high proportionality of the detector enables oneto achieve additional monochromatization of the X-ray beam in a straightforwardfashion: during the registration, the signals that are too high or too low and thus cor-respond to photons with exceedingly high or exceedingly low energies, respectively,are simply not counted.
Finally, the resolution of the detector characterizes its ability to resolve X-rayphotons of different energy and wavelength. The resolution (R) is defined as follows:
R(%) =
√δVV
100% (6.5)
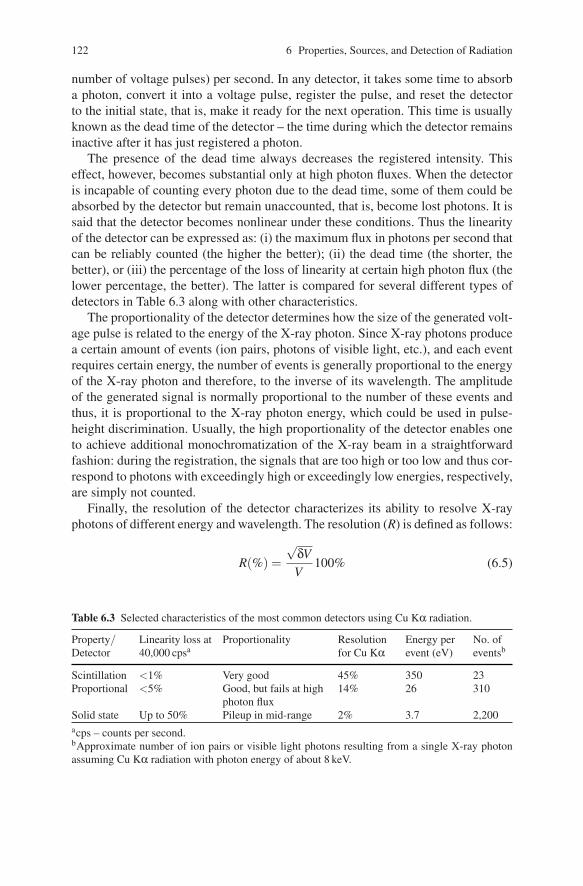
Table 6.3 Selected characteristics of the most common detectors using Cu Kα radiation.
Property/Detector
Linearity loss at40,000 cpsa
Proportionality Resolutionfor Cu Kα
Energy perevent (eV)
No. ofeventsb
Scintillation <1% Very good 45% 350 23Proportional <5% Good, but fails at high
photon flux14% 26 310
Solid state Up to 50% Pileup in mid-range 2% 3.7 2,200acps – counts per second.bApproximate number of ion pairs or visible light photons resulting from a single X-ray photonassuming Cu Kα radiation with photon energy of about 8 keV.
6.4 Detection of X-Rays 123
where V is the average height of the voltage pulse and δV is the spread of voltagepulses. The latter is also defined as the full width at half-maximum of the pulseheight distribution in Volts. The resolution for Cu Kα radiation for the main typesof detectors is listed in Table 6.3. Thus, the resolution is a function of both the num-ber of the events generated by a single photon and the energy required to generatethe event, and it is critically dependent on how small is the spread in the numberof events generated by different photons with identical energy. In other words, highresolution is only viable when every photon is absorbed completely, which is dif-ficult to achieve when the absorbing medium is gaseous, but is nearly ideal in thesolid state simply due to the difference in their densities (see Sect. 8.6.5).
6.4.2 Classification of Detectors
Historically, the photographic film is the first and the oldest detector of X-rays,which was in use for many decades. Just as the visible light, the X-ray photonsexcite fine particles of silver halide when the film is exposed to X-rays. During thedevelopment, the exposed halide particles are converted into black metallic silvergrains. Only the activated silver halide particles, that is, those that absorbed severalX-ray photons (usually at least 3–5 photons), turn into metallic silver.
This type of detector is simple but is no longer in common use due to its lowproportionality range, and limited spatial and energy resolution. Moreover, the film-development process introduces certain inconveniences and is time consuming.Finally, the information stored on the developed photographic film is difficult todigitize.
In modern detectors the signal, which is usually an electric current, is easily dig-itized and transferred to a computer for further processing and analysis. In general,detectors could be broadly divided into two categories: ratemeters and true counters.In a ratemeter, the readout is performed after hardware integration, which results,for example, in the electrical current or a voltage signal that is proportional to theflux of photons entering the detector. True counters, on the other hand, count in-dividual photons entering through the detector window and being absorbed by thedetector.
Hence, the photographic film vaguely resembles a ratemeter, because the inten-sity is extracted from the degree of darkening of the spots found on the film – thedarker the spot, the higher the corresponding intensity as a larger number of pho-tons have been absorbed by the spot on the film surface. The three most commonlyutilized types of X-ray detectors today are gas proportional, scintillation, and solid-state detectors, all of which are true counters.
Yet another classification of detectors is based on whether the detector is capableof resolving the location where the photon has been absorbed and thus, whether theycan detect the direction of the beam in addition to counting the number of photons.Conventional gas proportional, scintillation, and solid-state detectors do not support
124 6 Properties, Sources, and Detection of Radiation
f(2θ)
f(2θ)
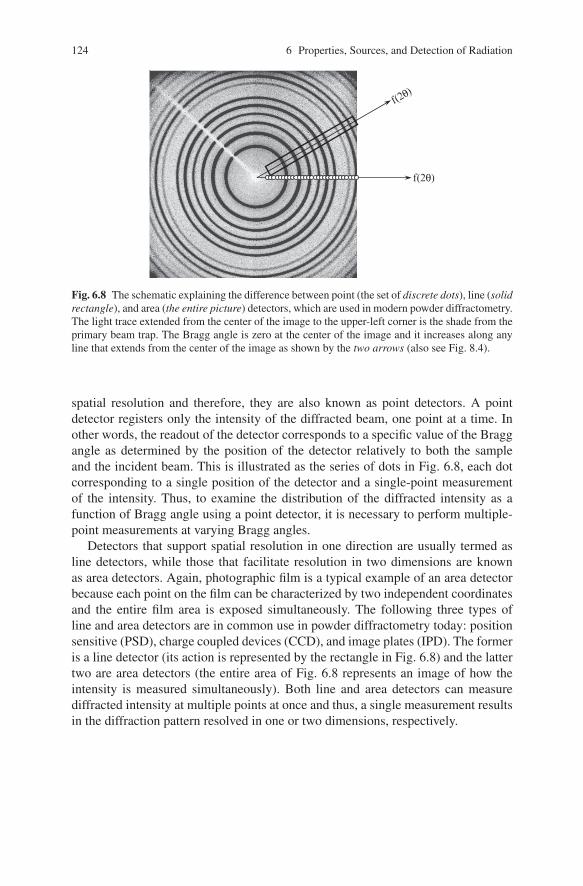
Fig. 6.8 The schematic explaining the difference between point (the set of discrete dots), line (solidrectangle), and area (the entire picture) detectors, which are used in modern powder diffractometry.The light trace extended from the center of the image to the upper-left corner is the shade from theprimary beam trap. The Bragg angle is zero at the center of the image and it increases along anyline that extends from the center of the image as shown by the two arrows (also see Fig. 8.4).
spatial resolution and therefore, they are also known as point detectors. A pointdetector registers only the intensity of the diffracted beam, one point at a time. Inother words, the readout of the detector corresponds to a specific value of the Braggangle as determined by the position of the detector relatively to both the sampleand the incident beam. This is illustrated as the series of dots in Fig. 6.8, each dotcorresponding to a single position of the detector and a single-point measurementof the intensity. Thus, to examine the distribution of the diffracted intensity as afunction of Bragg angle using a point detector, it is necessary to perform multiple-point measurements at varying Bragg angles.
Detectors that support spatial resolution in one direction are usually termed asline detectors, while those that facilitate resolution in two dimensions are knownas area detectors. Again, photographic film is a typical example of an area detectorbecause each point on the film can be characterized by two independent coordinatesand the entire film area is exposed simultaneously. The following three types ofline and area detectors are in common use in powder diffractometry today: positionsensitive (PSD), charge coupled devices (CCD), and image plates (IPD). The formeris a line detector (its action is represented by the rectangle in Fig. 6.8) and the lattertwo are area detectors (the entire area of Fig. 6.8 represents an image of how theintensity is measured simultaneously). Both line and area detectors can measurediffracted intensity at multiple points at once and thus, a single measurement resultsin the diffraction pattern resolved in one or two dimensions, respectively.
6.4 Detection of X-Rays 125
6.4.3 Point Detectors
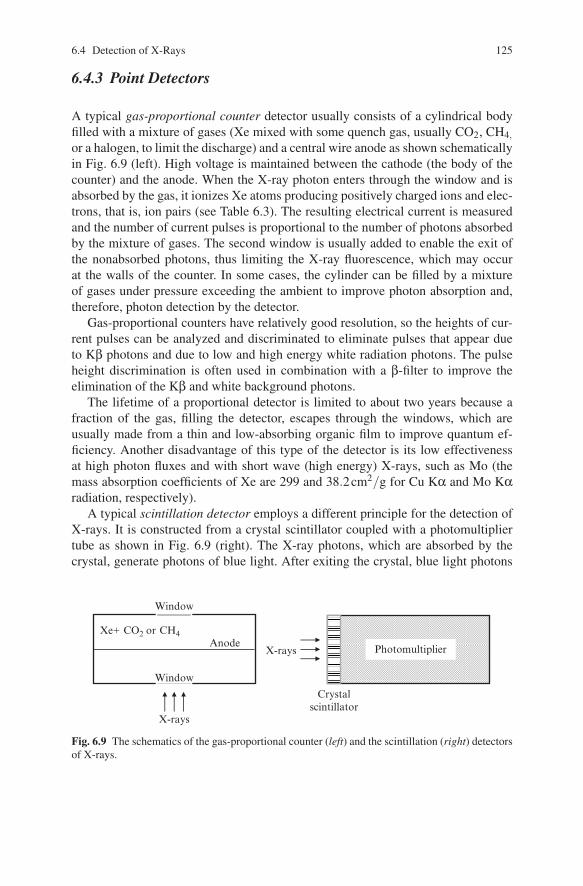
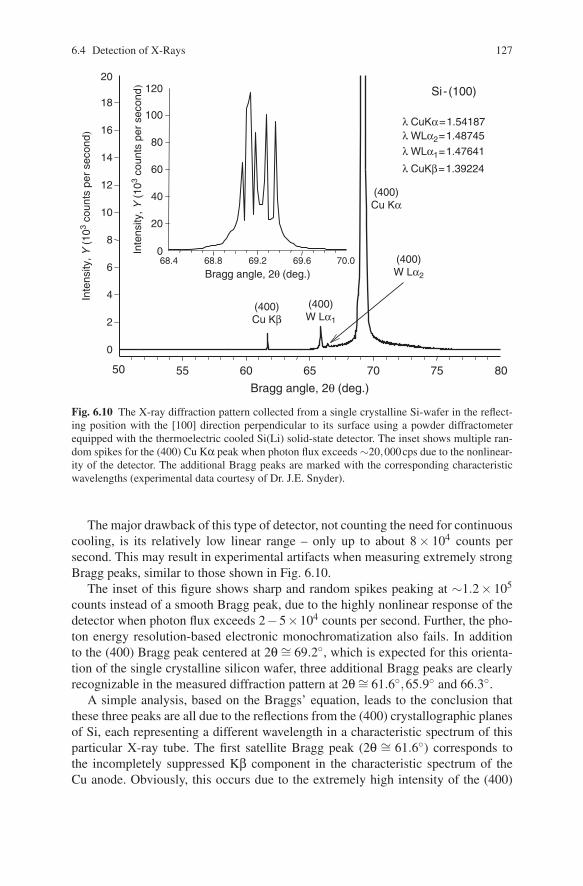
A typical gas-proportional counter detector usually consists of a cylindrical bodyfilled with a mixture of gases (Xe mixed with some quench gas, usually CO2, CH4,
or a halogen, to limit the discharge) and a central wire anode as shown schematicallyin Fig. 6.9 (left). High voltage is maintained between the cathode (the body of thecounter) and the anode. When the X-ray photon enters through the window and isabsorbed by the gas, it ionizes Xe atoms producing positively charged ions and elec-trons, that is, ion pairs (see Table 6.3). The resulting electrical current is measuredand the number of current pulses is proportional to the number of photons absorbedby the mixture of gases. The second window is usually added to enable the exit ofthe nonabsorbed photons, thus limiting the X-ray fluorescence, which may occurat the walls of the counter. In some cases, the cylinder can be filled by a mixtureof gases under pressure exceeding the ambient to improve photon absorption and,therefore, photon detection by the detector.
Gas-proportional counters have relatively good resolution, so the heights of cur-rent pulses can be analyzed and discriminated to eliminate pulses that appear dueto Kβ photons and due to low and high energy white radiation photons. The pulseheight discrimination is often used in combination with a β-filter to improve theelimination of the Kβ and white background photons.
The lifetime of a proportional detector is limited to about two years because afraction of the gas, filling the detector, escapes through the windows, which areusually made from a thin and low-absorbing organic film to improve quantum ef-ficiency. Another disadvantage of this type of the detector is its low effectivenessat high photon fluxes and with short wave (high energy) X-rays, such as Mo (themass absorption coefficients of Xe are 299 and 38.2cm2/g for Cu Kα and Mo Kαradiation, respectively).
A typical scintillation detector employs a different principle for the detection ofX-rays. It is constructed from a crystal scintillator coupled with a photomultipliertube as shown in Fig. 6.9 (right). The X-ray photons, which are absorbed by thecrystal, generate photons of blue light. After exiting the crystal, blue light photons
X-rays
Crystalscintillator
Photomultiplier
Window
X-rays
Window
AnodeXe+ CO2 or CH4
Fig. 6.9 The schematics of the gas-proportional counter (left) and the scintillation (right) detectorsof X-rays.
126 6 Properties, Sources, and Detection of Radiation
are converted into electrons in a photomultiplier and amplified, and the resultantvoltage pulses are registered as photon counts.
The crystal scintillator is usually made from cleaved, optically clear sodium io-dide (NaI) activated with ∼1% of Tl. The crystals are hydroscopic and thus, theyare usually sealed in a vacuum tight enclosure with a thin Be window in the front(X-rays entry window) and high quality optical glass in the back (blue light photonsexit window). The crystal is usually mounted on the photomultiplier tube using aviscous fluid that minimizes the refraction of blue light on the interface between thecrystal and the photomultiplier.
Unfortunately, due to the relatively high energy of blue light photons, the X-raywavelength resolution of the scintillation detector is quite low. Although, the ex-tremely short wavelengths (e.g., cosmic rays) can be discriminated and eliminated,the Kβ photons cannot be recognized and filtered out by the detector. Despite theirlow energy resolution, scintillation detectors are highly stable and effective; espe-cially at high photon fluxes (see Table 6.3). They have very short dead time andtherefore, extended linear range. Because of this, scintillation detectors are by farthe most commonly used detectors in the modern laboratory X-ray powder diffrac-tometry.
Yet another physical phenomenon is used in solid-state detectors, which are man-ufactured from high quality silicon or germanium single crystals doped with lithiumand commonly known as Si(Li) or Ge(Li) solid-state detectors. The interaction ofthe X-ray photon with the crystal (detector) produces electron–hole pairs in quanti-ties proportional to the energy of the photon divided by the energy needed to gen-erate a single pair. The latter is quite low and amounts to approximately 3.7 eV fora Si-based detector. The electric potential difference applied across the crystal re-sults in the photon-induced electric current, which is amplified and measured. Thecurrent is indeed proportional to the number of the generated electron–hole pairs.
In order to minimize noise and Li migration, the solid-state detector should becooled, usually to ∼80K. This can be done using liquid nitrogen, but it is quiteinconvenient to have a cryogenic container mounted on the detector arm, especiallysince the container needs to be refilled every few days. Thus, solid-state detectorscoupled with thermoelectric coolers have been developed and commercialized, andsuccessfully used in powder diffraction.
The substantial advantage of this type of detector is its high resolution at lowtemperature, even when compared with proportional counters (Table 6.3). Cooledsolid-state detectors facilitate excellent filtration of both the undesirable Kβ andwhite radiation, thus resulting in a very low background without a significant lossof the intensity of the Kα1/Kα2 doublets. It is worth noting that even the highestquality, perfectly aligned monochromator decreases the characteristic Kα intensityby a factor of two or more. Thus, with the cooled solid-state detector the monochro-mator is no longer needed unless the extreme spectral purity is an issue. Moreover,modern solid-state detectors may be tuned to suppress the Kα doublet and registeronly Kβ energies. The latter is only about 20% as strong as the Kα component ofthe characteristics spectrum, but it has a single intense wavelength, which may bequite useful when working with complex powder diffraction patterns.
6.4 Detection of X-Rays 127
Si-(100)
Bragg angle, 2θ (deg.)
55 60 65 70 75 80
Inte
nsity
, Y (
103
coun
ts p
er s
econ
d)
Inte
nsity
, Y (
103
coun
ts p
er s
econ
d)
50
0
2
4
6
8
10
12
14
16
18
20
(400)Cu Kβ
(400)Cu Kα
(400)W Lα1
(400)W Lα2
λ CuKα=1.54187
λ CuKβ=1.39224
λ WLα1=1.47641
λ WLα2=1.48745
Bragg angle, 2θ (deg.)68.4 68.8 69.2 69.6 70.00
20
40
60
80
100
120
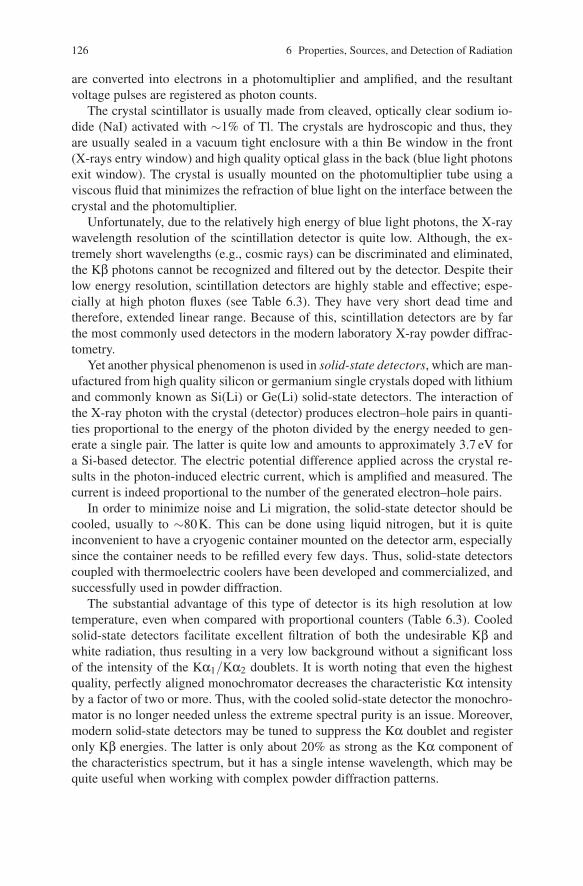
Fig. 6.10 The X-ray diffraction pattern collected from a single crystalline Si-wafer in the reflect-ing position with the [100] direction perpendicular to its surface using a powder diffractometerequipped with the thermoelectric cooled Si(Li) solid-state detector. The inset shows multiple ran-dom spikes for the (400) Cu Kα peak when photon flux exceeds ∼20,000cps due to the nonlinear-ity of the detector. The additional Bragg peaks are marked with the corresponding characteristicwavelengths (experimental data courtesy of Dr. J.E. Snyder).
The major drawback of this type of detector, not counting the need for continuouscooling, is its relatively low linear range – only up to about 8 × 10⁴ counts persecond. This may result in experimental artifacts when measuring extremely strongBragg peaks, similar to those shown in Fig. 6.10.
The inset of this figure shows sharp and random spikes peaking at ∼1.2× 10⁵
counts instead of a smooth Bragg peak, due to the highly nonlinear response of thedetector when photon flux exceeds 2−5×10⁴ counts per second. Further, the pho-ton energy resolution-based electronic monochromatization also fails. In additionto the (400) Bragg peak centered at 2θ ∼= 69.2◦, which is expected for this orienta-tion of the single crystalline silicon wafer, three additional Bragg peaks are clearlyrecognizable in the measured diffraction pattern at 2θ∼= 61.6◦,65.9◦ and 66.3◦.
A simple analysis, based on the Braggs’ equation, leads to the conclusion thatthese three peaks are all due to the reflections from the (400) crystallographic planesof Si, each representing a different wavelength in a characteristic spectrum of thisparticular X-ray tube. The first satellite Bragg peak (2θ ∼= 61.6◦) corresponds tothe incompletely suppressed Kβ component in the characteristic spectrum of theCu anode. Obviously, this occurs due to the extremely high intensity of the (400)
128 6 Properties, Sources, and Detection of Radiation
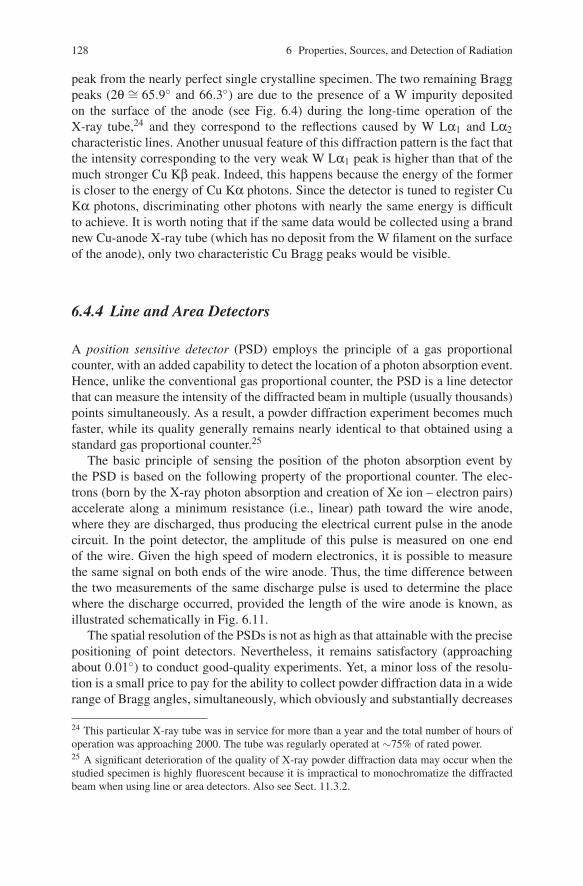
peak from the nearly perfect single crystalline specimen. The two remaining Braggpeaks (2θ ∼= 65.9◦ and 66.3◦) are due to the presence of a W impurity depositedon the surface of the anode (see Fig. 6.4) during the long-time operation of theX-ray tube,24 and they correspond to the reflections caused by W Lα1 and Lα2characteristic lines. Another unusual feature of this diffraction pattern is the fact thatthe intensity corresponding to the very weak W Lα1 peak is higher than that of themuch stronger Cu Kβ peak. Indeed, this happens because the energy of the formeris closer to the energy of Cu Kα photons. Since the detector is tuned to register CuKα photons, discriminating other photons with nearly the same energy is difficultto achieve. It is worth noting that if the same data would be collected using a brandnew Cu-anode X-ray tube (which has no deposit from the W filament on the surfaceof the anode), only two characteristic Cu Bragg peaks would be visible.
6.4.4 Line and Area Detectors
A position sensitive detector (PSD) employs the principle of a gas proportionalcounter, with an added capability to detect the location of a photon absorption event.Hence, unlike the conventional gas proportional counter, the PSD is a line detectorthat can measure the intensity of the diffracted beam in multiple (usually thousands)points simultaneously. As a result, a powder diffraction experiment becomes muchfaster, while its quality generally remains nearly identical to that obtained using astandard gas proportional counter.25
The basic principle of sensing the position of the photon absorption event bythe PSD is based on the following property of the proportional counter. The elec-trons (born by the X-ray photon absorption and creation of Xe ion – electron pairs)accelerate along a minimum resistance (i.e., linear) path toward the wire anode,where they are discharged, thus producing the electrical current pulse in the anodecircuit. In the point detector, the amplitude of this pulse is measured on one endof the wire. Given the high speed of modern electronics, it is possible to measurethe same signal on both ends of the wire anode. Thus, the time difference betweenthe two measurements of the same discharge pulse is used to determine the placewhere the discharge occurred, provided the length of the wire anode is known, asillustrated schematically in Fig. 6.11.
The spatial resolution of the PSDs is not as high as that attainable with the precisepositioning of point detectors. Nevertheless, it remains satisfactory (approachingabout 0.01◦) to conduct good-quality experiments. Yet, a minor loss of the resolu-tion is a small price to pay for the ability to collect powder diffraction data in a widerange of Bragg angles, simultaneously, which obviously and substantially decreases
24 This particular X-ray tube was in service for more than a year and the total number of hours ofoperation was approaching 2000. The tube was regularly operated at ∼75% of rated power.25 A significant deterioration of the quality of X-ray powder diffraction data may occur when thestudied specimen is highly fluorescent because it is impractical to monochromatize the diffractedbeam when using line or area detectors. Also see Sect. 11.3.2.
6.4 Detection of X-Rays 129
Window
X-rays
Window
Anode
t1t2
Counting electronics
Window
X-rays
Window
AnodeXe+CO2 or CH4 Xe+CO2 or CH4
Counting electronics
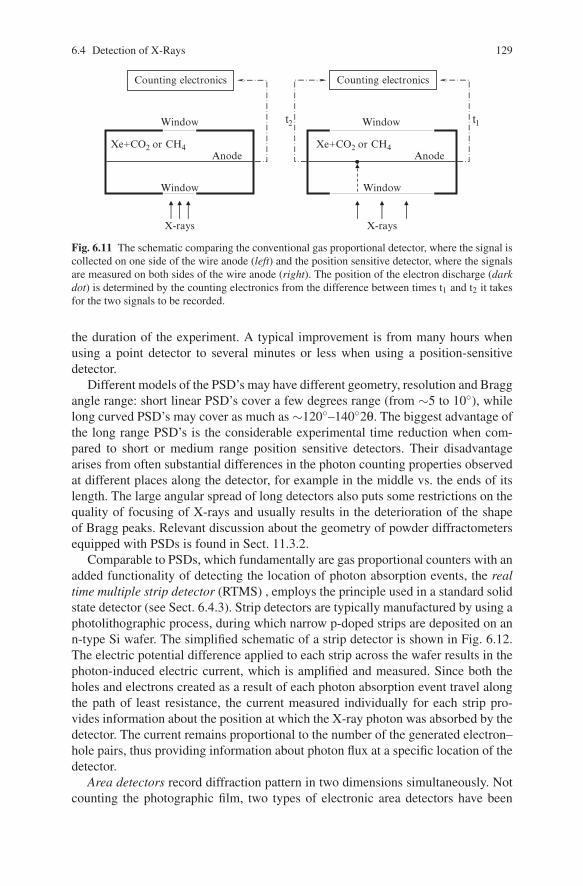
Fig. 6.11 The schematic comparing the conventional gas proportional detector, where the signal iscollected on one side of the wire anode (left) and the position sensitive detector, where the signalsare measured on both sides of the wire anode (right). The position of the electron discharge (darkdot) is determined by the counting electronics from the difference between times t1 and t2 it takesfor the two signals to be recorded.
the duration of the experiment. A typical improvement is from many hours whenusing a point detector to several minutes or less when using a position-sensitivedetector.
Different models of the PSD’s may have different geometry, resolution and Braggangle range: short linear PSD’s cover a few degrees range (from ∼5 to 10◦), whilelong curved PSD’s may cover as much as ∼120◦–140◦2θ. The biggest advantage ofthe long range PSD’s is the considerable experimental time reduction when com-pared to short or medium range position sensitive detectors. Their disadvantagearises from often substantial differences in the photon counting properties observedat different places along the detector, for example in the middle vs. the ends of itslength. The large angular spread of long detectors also puts some restrictions on thequality of focusing of X-rays and usually results in the deterioration of the shapeof Bragg peaks. Relevant discussion about the geometry of powder diffractometersequipped with PSDs is found in Sect. 11.3.2.
Comparable to PSDs, which fundamentally are gas proportional counters with anadded functionality of detecting the location of photon absorption events, the realtime multiple strip detector (RTMS) , employs the principle used in a standard solidstate detector (see Sect. 6.4.3). Strip detectors are typically manufactured by using aphotolithographic process, during which narrow p-doped strips are deposited on ann-type Si wafer. The simplified schematic of a strip detector is shown in Fig. 6.12.The electric potential difference applied to each strip across the wafer results in thephoton-induced electric current, which is amplified and measured. Since both theholes and electrons created as a result of each photon absorption event travel alongthe path of least resistance, the current measured individually for each strip pro-vides information about the position at which the X-ray photon was absorbed by thedetector. The current remains proportional to the number of the generated electron–hole pairs, thus providing information about photon flux at a specific location of thedetector.
Area detectors record diffraction pattern in two dimensions simultaneously. Notcounting the photographic film, two types of electronic area detectors have been

130 6 Properties, Sources, and Detection of Radiation
n-type Si
+−
holeelectron
X-r
ays
p-type strips
Fig. 6.12 The schematic of a strip detector.
advanced to a commercial status, and are being frequently used in modern X-raypowder diffraction analysis.
In a charge-coupled device detector, X-ray photons are converted by a phos-phor26 into visible light, which is captured using a charge-coupled device (CCD).The latter is a chip similar to (or even the same as) those used in modern digital cam-eras. In order to reliably measure a large area, in some detector designs the phosphormay be made several times larger than the chip, and then the generated visible lightis demagnified to the size of the chip by using fiber optics, while in other designsseveral chips (e.g., a 2×2 or 3×3 chip arrays) are glued together. Similar to solid-state detectors, CCD chips are cooled with thermoelectric cooling device to reducerandom (thermal) noise.
In an image plate detector (IPD) X-ray photons are also captured by a phos-phor.27 The excited phosphor pixels, however, are not converted into the signalsimmediately. Instead, the information is stored in the phosphor grains as a latentimage, in a way, similar to the activation of silver halide particles in the photo-graphic film during exposure. When the data collection is completed, the image isscanned (or “developed”) by a laser, which deactivates pixels that emit the storedenergy as a blue light. Visible light photons are then registered by a photomultiplierin a conventional manner, and the plate is reactivated by another laser. Image platesare integrating detectors with high counting rates and dynamic range but they haverelatively long readout times.
26 A typical CCD phosphor is Tb3+ doped Gd2O2S, which converts X-ray photons into visiblelight photons.27 A typical image plate phosphor is Eu2+ doped BaFBr. When exposed to X-rays, Eu2+ oxidizesto Eu3+. Thus produced electrons may either recombine with Eu3+ or they become trapped byF-vacancies in the crystal lattice of BaFBr. The trapped electrons may exist in this metastablestate for a long time. They are released when exposed to a visible light and emit blue photonsduring recombination with Eu3+ ions, e.g., see K. Takahashi, K. Khoda, J. Miyahara, Y. Kanemitsu,K. Amitani, and S. Shionoya, Mechanism of photostimulated luminescence in BaFX:Eu2+ (X =Cl, Br) phosphors, J. Luminesc. 31–32, 266 (1984).
6.6 Problems 131
Table 6.4 Qualitative comparison of the most common area detectors.
Parameter CCD IPD MWD
Active area size Small Large SmallReadout time Medium Long ShortCounting rate High High LowDynamic range Medium High MediumSpatial resolution High Low Low
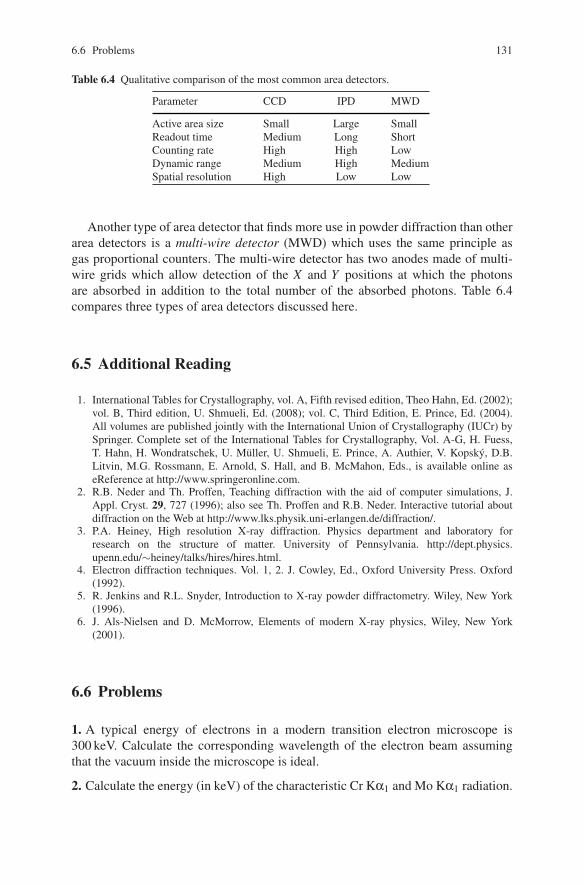
Another type of area detector that finds more use in powder diffraction than otherarea detectors is a multi-wire detector (MWD) which uses the same principle asgas proportional counters. The multi-wire detector has two anodes made of multi-wire grids which allow detection of the X and Y positions at which the photonsare absorbed in addition to the total number of the absorbed photons. Table 6.4compares three types of area detectors discussed here.
6.5 Additional Reading
1. International Tables for Crystallography, vol. A, Fifth revised edition, Theo Hahn, Ed. (2002);vol. B, Third edition, U. Shmueli, Ed. (2008); vol. C, Third Edition, E. Prince, Ed. (2004).All volumes are published jointly with the International Union of Crystallography (IUCr) bySpringer. Complete set of the International Tables for Crystallography, Vol. A-G, H. Fuess,T. Hahn, H. Wondratschek, U. Muller, U. Shmueli, E. Prince, A. Authier, V. Kopsky, D.B.Litvin, M.G. Rossmann, E. Arnold, S. Hall, and B. McMahon, Eds., is available online aseReference at http://www.springeronline.com.
2. R.B. Neder and Th. Proffen, Teaching diffraction with the aid of computer simulations, J.Appl. Cryst. 29, 727 (1996); also see Th. Proffen and R.B. Neder. Interactive tutorial aboutdiffraction on the Web at http://www.lks.physik.uni-erlangen.de/diffraction/.
3. P.A. Heiney, High resolution X-ray diffraction. Physics department and laboratory forresearch on the structure of matter. University of Pennsylvania. http://dept.physics.upenn.edu/∼heiney/talks/hires/hires.html.
4. Electron diffraction techniques. Vol. 1, 2. J. Cowley, Ed., Oxford University Press. Oxford(1992).
5. R. Jenkins and R.L. Snyder, Introduction to X-ray powder diffractometry. Wiley, New York(1996).
6. J. Als-Nielsen and D. McMorrow, Elements of modern X-ray physics, Wiley, New York(2001).
6.6 Problems
1. A typical energy of electrons in a modern transition electron microscope is300 keV. Calculate the corresponding wavelength of the electron beam assumingthat the vacuum inside the microscope is ideal.
2. Calculate the energy (in keV) of the characteristic Cr Kα1 and Mo Kα1 radiation.

132 6 Properties, Sources, and Detection of Radiation
3. You are in charge of buying a new powder diffractometer for your company.The company is in business of manufacturing alumina (Al2O3) based ceramics.The powder diffractometer is to become a workhorse instrument in the quality con-trol department. Routine experiments will include collecting powder diffraction datafrom ceramic samples to analyze their structure and phase composition. High datacollection speeds are critical because a typical daily number of samples to be ana-lyzed using the new equipment is 100+. The following options are available fromdifferent vendors:
Sealed Cu X-ray tube, scintillation detector; the lowest cost.Sealed Cu X-ray tube, solid state detector; $10,000 more than the first option.Sealed Cu X-ray tube, curved position sensitive detector; $25,000 more than the
first option.What recommendation will you make to you boss without a fear of being fired
during the first month after the delivery of the instrument?
Chapter 7Fundamentals of Diffraction
When X-rays propagate through a substance, the occurrence of the followingprocesses should be considered in the phenomenon of diffraction:
– Coherent scattering (Sect 7.1), which produces beams with the same wavelengthas the incident (primary) beam. In other words, the energy of the photons ina coherently scattered beam remains unchanged when compared to that in theprimary beam.
– Incoherent (or Compton1) scattering, in which the wavelength of the scatteredbeam increases due to partial loss of photon energy in collisions with core elec-trons (the Compton effect).
– Absorption of the X-rays, see Sect 8.6.5, in which some photons are dissipatedin random directions due to scattering, and some photons lose their energy byejecting electron(s) from an atom (i.e., ionization) and/or due to the photoelectriceffect (i.e., X-ray fluorescence).
Incoherent scattering is not essential when the interaction of X-rays with crys-tal lattices is of concern, and it is generally neglected. When absorption becomessignificant, it is usually taken into account as a separate effect. Thus, in the first ap-proximation only coherent scattering results in the diffraction from periodic latticesand is considered in this chapter.
Generally, the interaction of X-rays (or any other type of radiation with theproper wavelength) with a crystal is multifaceted and complex, and there are twodifferent levels of approximation – kinematical and dynamical theories of diffrac-tion. In the kinematical diffraction, a beam scattered once is not allowed to be scat-tered again before it leaves the crystal. Thus, the kinematical theory of diffraction isbased on the assumption that the interaction of the diffracted beam with the crystal
1 Arthur Holly Compton (1897–1962). The American physicist, best known for his discovery ofthe increase of wavelength of X-rays due to scattering of the incident radiation by free electrons –inelastic scattering of X-ray photons – known today as the Compton effect. With Charles ThomsonRees Wilson, Compton shared the Nobel Prize in physics in 1927 “for his discovery of the effectnamed after him.” See http://nobelprize.org/nobel prizes/physics/laureates/1927/compton-bio.htmlfor more information.
V.K. Pecharsky, P.Y. Zavalij, Fundamentals of Powder Diffraction and Structural 133Characterization of Materials, DOI: 10.1007/978-0-387-09579-0 7,c© Springer Science+Business Media LLC 2009
134 7 Fundamentals of Diffraction
is negligibly small. This requires the following postulations: (1) a crystal consists ofindividual mosaic blocks – crystallites2 – which are slightly misaligned with respectto one another; (2) the size of the crystallites is small, and (3) the misalignment ofthe crystallites is large enough, so that the interaction of X-rays with matter at thelength scale exceeding the size of mosaic blocks is negligible.
On the contrary, the theory of the dynamical diffraction accounts for scattering ofthe diffracted beam and other interactions of waves inside the crystal, and thus themathematical apparatus of the theory is quite complex. Dynamical effects becomesignificant and the use of the theory of dynamical diffraction is justified only whenthe crystals are nearly perfect, or when there is an exceptionally strong interactionof the radiation with the material. In the majority of crystalline materials, however,dynamical effects are weak and they are usually noticeable only when precise sin-gle crystal experiments are conducted. Even then, numerous dynamical effects (e.g.,primary and/or secondary extinction, simultaneous diffraction, thermal diffuse scat-tering, and others) are usually applied as corrections to the kinematical diffractionmodel.
The kinematical approach is simple, and adequately and accurately describes thediffraction of X-rays from mosaic crystals. This is especially true for polycrystallinematerials where the size of crystallites is relatively small. Hence, the kinematicaltheory of diffraction is used in this chapter and throughout this book.
7.1 Scattering by Electrons, Atoms and Lattices
It is well-known that when a wave interacts with and is scattered by a point object,the outcome of this interaction is a new wave, which spreads in all directions. Ifno energy loss occurs, the resultant wave has the same frequency as the incident(primary) wave and this process is known as elastic scattering. In three dimensions,the elastically scattered wave is spherical, with its origin in the point coinciding withthe object as shown schematically in Fig. 7.1.
When two or more points are involved, they all produce spherical waves with thesame λ, which interfere with each other simply by adding their amplitudes. If thetwo scattered waves with parallel-propagation vectors are completely in-phase, theresulting wave has its amplitude doubled (Fig. 7.2 top), while the waves, which arecompletely out-of-phase, extinguish one another as shown in Fig. 7.2 (bottom).
The first case seen in Fig. 7.2 is called constructive interference and the secondcase is termed as destructive interference. Constructive interference, which occurson periodic arrays of points, increases the resultant wave amplitude by many or-ders of magnitude and this phenomenon is one of the cornerstones in the theory ofdiffraction.
2 Crystallite usually means a tiny single crystal (microcrystal). Each particle in a polycrystallinematerial usually consists of multiple crystallites that join together in different orientations. A smallpowder particle can be a single crystallite as well.

7.1 Scattering by Electrons, Atoms and Lattices 135
Scattered sphericalwave
Incident wave
Fig. 7.1 The illustration of a spherical wave produced as a result of elastic scattering of the incidentwave by the point object (filled dot in the center of the dotted circle).
+
+
k
Fig. 7.2 The two limiting cases of the interaction between two waves with parallel propagationvectors (k): the constructive interference of two in-phase waves resulting in a new wave withdouble the amplitude (top), and the destructive interference of two completely out-of-phase wavesin which the resultant wave has zero amplitude, i.e., the two waves extinguish one another (bottom).
Diffraction can be observed only when the wavelength is of the same order ofmagnitude as the repetitive distance between the scattering objects. Thus, for crys-tals, the wavelength should be in the same range as the shortest interatomic dis-tances, that is, somewhere between ∼0.5 and ∼2.5 A. This condition is fulfilledwhen using electromagnetic radiation, which within the mentioned range of wave-lengths, are X-rays. It is important to note that X-rays scatter from electrons, so thatthe active scattering centers are not the nuclei, but the electrons, or more preciselythe electron density, periodically distributed in the crystal lattice.
The other two types of radiation that can diffract from crystals are neutron andelectron beams. Unlike X-rays, neutrons are scattered on the nuclei, while electrons,which have electric charge, interact with the electrostatic potential. Nuclei, theirelectronic shells (i.e., core electron density), and electrostatic potentials, are all dis-tributed similarly in the same crystal and their distribution is established by the crys-tal structure of the material. Thus, assuming a constant wavelength, the differences
136 7 Fundamentals of Diffraction
in the diffraction patterns when using various kinds of radiation are mainly in theintensities of the diffracted beams. The latter occurs because various types of ra-diation interact in their own way with different scattering centers. The X-rays arethe simplest, most accessible, and by far the most commonly used waves in powderdiffraction.
7.1.1 Scattering by Electrons
The origin of the electromagnetic wave elastically scattered by the electron can bebetter understood by recalling the fact that electrons are charged particles. Thus, anoscillating electric field (see Fig. 6.2) from the incident wave exerts a force on theelectric-charge (electron) forcing the electron to oscillate with the same frequencyas the electric-field component of the electromagnetic wave. The oscillating electronaccelerates and decelerates in concert with the varying amplitude of the electric fieldvector, and emits electromagnetic radiation, which spreads in all directions. In thisrespect, the elastically scattered X-ray beam is simply radiated by the oscillatingelectron; it has the same frequency and wavelength as the incident wave, and thistype of scattering is also known as coherent scattering.3
For the sake of simplicity, we now consider electrons as stationary points anddisregard the dependence of the scattered intensity4 on the scattering angle.5 Eachelectron then interacts with the incident X-ray wave producing a spherical elasticallyscattered wave, as shown in Fig. 7.1. Thus, the scattering of X-rays by a singleelectron yields an identical scattered intensity in every direction.
3 It is worth noting that coherency of the electromagnetic wave elastically scattered by the electronestablishes specific phase relationships between the incident and the scattered wave: their phasesare different by π (i.e., scatterred wave is shifted with respect to the incident wave exactly by λ/2).4 The scattered (diffracted) X-ray intensity recorded by the detector is proportional to the amplitudesquared.5 The absolute intensity of the X-ray wave coherently scattered by a single electron, I, is determinedfrom the Thomson equation:
I = I0Kr2
(1+ cos2 2θ
2
)
where I0 is the absolute intensity of the incident beam, K is constant (K = 7.94× 10⁻³⁰ m2), ris the distance from the electron to the detector in m, and θ is the angle between the propagationvector of the incident wave and the direction of the scattered wave. It is worth noting that in apowder diffraction experiment all prefactors in the right hand side of the Thomson’s equation areconstant and can be omitted. The only variable part is, therefore, a function of the Bragg angle,θ. It emerges because the incident beam is generally unpolarized but the scattered beam is alwayspartially polarized. This function, therefore, is called the polarization factor.
Thomson equation is named after sir Joseph John (J.J.) Thomson (1856–1940) – the Britishphysicist who has been credited with the discovery of an electron. In 1906 he received theNobel Prize in Physics “in recognition of the great merits of his theoretical and experimentalinvestigations on the conduction of electricity by gases.” See http://nobelprize.org/nobel prizes/physics/laureates/1906/thomson-bio.html for more information.
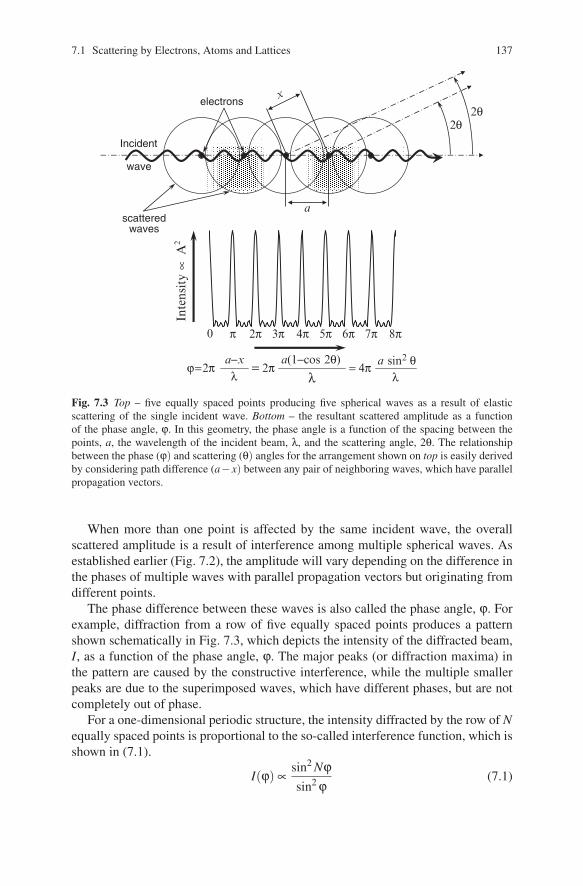
7.1 Scattering by Electrons, Atoms and Lattices 137
Inte
nsity
∝ A
2
λ= 4π
λ=
λϕ=2π 2π a sin2 θa(1−cos 2θ)a−x
0 π 2π 3π 4π 5π 6π 7π 8π
2θ2θ
x
a
electrons
scatteredwaves
Incident
wave
Fig. 7.3 Top – five equally spaced points producing five spherical waves as a result of elasticscattering of the single incident wave. Bottom – the resultant scattered amplitude as a functionof the phase angle, ϕ. In this geometry, the phase angle is a function of the spacing between thepoints, a, the wavelength of the incident beam, λ, and the scattering angle, 2θ. The relationshipbetween the phase (ϕ) and scattering (θ) angles for the arrangement shown on top is easily derivedby considering path difference (a−x) between any pair of neighboring waves, which have parallelpropagation vectors.
When more than one point is affected by the same incident wave, the overallscattered amplitude is a result of interference among multiple spherical waves. Asestablished earlier (Fig. 7.2), the amplitude will vary depending on the difference inthe phases of multiple waves with parallel propagation vectors but originating fromdifferent points.
The phase difference between these waves is also called the phase angle, ϕ. Forexample, diffraction from a row of five equally spaced points produces a patternshown schematically in Fig. 7.3, which depicts the intensity of the diffracted beam,I, as a function of the phase angle, ϕ. The major peaks (or diffraction maxima) inthe pattern are caused by the constructive interference, while the multiple smallerpeaks are due to the superimposed waves, which have different phases, but are notcompletely out of phase.
For a one-dimensional periodic structure, the intensity diffracted by the row of Nequally spaced points is proportional to the so-called interference function, which isshown in (7.1).
I(ϕ) ∝sin2 Nϕsin2ϕ
(7.1)
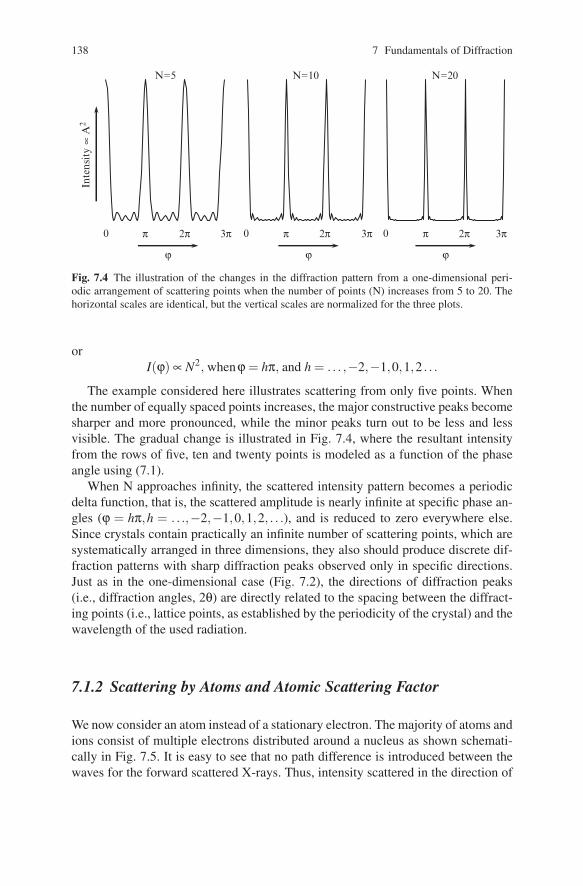
138 7 Fundamentals of Diffraction
ϕ ϕ ϕ
N=20In
tens
ity
∝ A
2 N=5
0 π 2π 3π
N=10
0 π 2π 3π 0 π 2π 3π
Fig. 7.4 The illustration of the changes in the diffraction pattern from a one-dimensional peri-odic arrangement of scattering points when the number of points (N) increases from 5 to 20. Thehorizontal scales are identical, but the vertical scales are normalized for the three plots.
orI(ϕ) ∝ N2, whenϕ = hπ, and h = . . . ,−2,−1,0,1,2 . . .
The example considered here illustrates scattering from only five points. Whenthe number of equally spaced points increases, the major constructive peaks becomesharper and more pronounced, while the minor peaks turn out to be less and lessvisible. The gradual change is illustrated in Fig. 7.4, where the resultant intensityfrom the rows of five, ten and twenty points is modeled as a function of the phaseangle using (7.1).
When N approaches infinity, the scattered intensity pattern becomes a periodicdelta function, that is, the scattered amplitude is nearly infinite at specific phase an-gles (ϕ = hπ,h = . . .,−2,−1,0,1,2, . . .), and is reduced to zero everywhere else.Since crystals contain practically an infinite number of scattering points, which aresystematically arranged in three dimensions, they also should produce discrete dif-fraction patterns with sharp diffraction peaks observed only in specific directions.Just as in the one-dimensional case (Fig. 7.2), the directions of diffraction peaks(i.e., diffraction angles, 2θ) are directly related to the spacing between the diffract-ing points (i.e., lattice points, as established by the periodicity of the crystal) and thewavelength of the used radiation.
7.1.2 Scattering by Atoms and Atomic Scattering Factor
We now consider an atom instead of a stationary electron. The majority of atoms andions consist of multiple electrons distributed around a nucleus as shown schemati-cally in Fig. 7.5. It is easy to see that no path difference is introduced between thewaves for the forward scattered X-rays. Thus, intensity scattered in the direction of
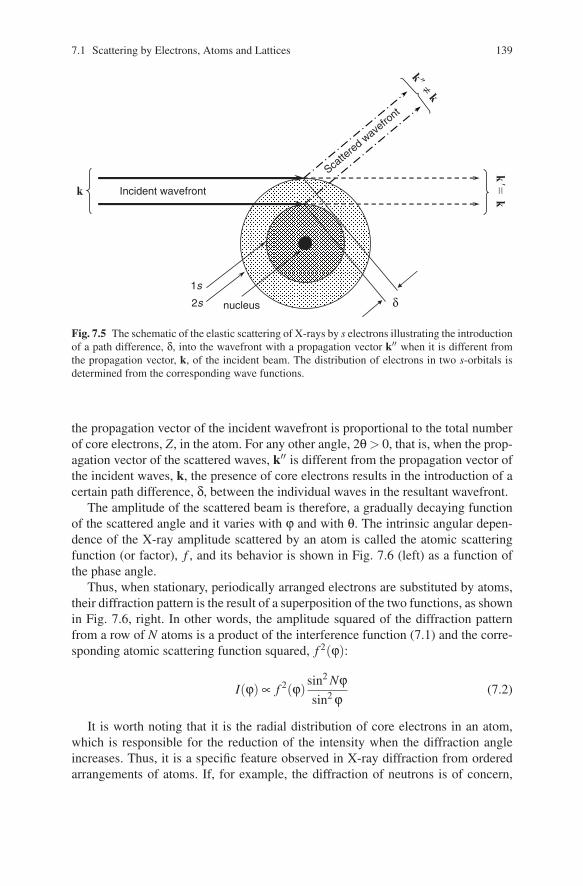
7.1 Scattering by Electrons, Atoms and Lattices 139
δ
k� ≠k
k�=
kk
nucleus2s
Incident wavefront
Scatte
red wave
front
1s
Fig. 7.5 The schematic of the elastic scattering of X-rays by s electrons illustrating the introductionof a path difference, δ, into the wavefront with a propagation vector k′′ when it is different fromthe propagation vector, k, of the incident beam. The distribution of electrons in two s-orbitals isdetermined from the corresponding wave functions.
the propagation vector of the incident wavefront is proportional to the total numberof core electrons, Z, in the atom. For any other angle, 2θ> 0, that is, when the prop-agation vector of the scattered waves, k′′ is different from the propagation vector ofthe incident waves, k, the presence of core electrons results in the introduction of acertain path difference, δ, between the individual waves in the resultant wavefront.
The amplitude of the scattered beam is therefore, a gradually decaying functionof the scattered angle and it varies with ϕ and with θ. The intrinsic angular depen-dence of the X-ray amplitude scattered by an atom is called the atomic scatteringfunction (or factor), f , and its behavior is shown in Fig. 7.6 (left) as a function ofthe phase angle.
Thus, when stationary, periodically arranged electrons are substituted by atoms,their diffraction pattern is the result of a superposition of the two functions, as shownin Fig. 7.6, right. In other words, the amplitude squared of the diffraction patternfrom a row of N atoms is a product of the interference function (7.1) and the corre-sponding atomic scattering function squared, f 2(ϕ):
I(ϕ) ∝ f 2(ϕ)sin2 Nϕsin2ϕ
(7.2)
It is worth noting that it is the radial distribution of core electrons in an atom,which is responsible for the reduction of the intensity when the diffraction angleincreases. Thus, it is a specific feature observed in X-ray diffraction from orderedarrangements of atoms. If, for example, the diffraction of neutrons is of concern,

140 7 Fundamentals of Diffraction
ϕ=0 ϕ=0ϕ(+)ϕ(-) ϕ(+)ϕ(-)
f 2 A2
0 π 2π 3π-π-2π-3π
Fig. 7.6 The schematic showing the dependence of the intensity scattered by an atom, i.e., theatomic scattering factor, f 2 ∝ A2, as a function of the phase angle (left), and the resultant decreaseof the intensity of the diffraction pattern from the row of five regularly spaced atoms, also as afunction of the phase angle (right).
they are scattered by nuclei, which may be considered as points. Hence, neutron-scattering functions (factors) are independent of the diffraction angle and they re-main constant for a given type of nuclei (also see Table 6.2).
7.1.3 Scattering by Lattices
The interference function in (7.2) describes a discontinuous distribution of the scat-tered intensity in the diffraction space.6 Assuming an infinite number of points ina one-dimensional periodic structure (N → ∞), the distribution of the scattered in-tensity is a periodic delta-function (as mentioned earlier), and therefore, diffractionpeaks occur only in specific points, which establish a one-dimensional lattice in thediffraction space. Hence, diffracted intensity is only significant at certain points,which are determined (also see (7.1), Figs. 7.4 and 7.6) from:
I(ϕ) ∝ f 2(ϕ)sin2 Nϕsin2ϕ
= f 2(ϕ)sin2 Nhπsin2 hπ
(7.3)
In three dimensions, a total of three integers (h, k and l)7 are required to definethe positions of intensity maxima in the diffraction space:
6 Diffraction space, in which diffraction peaks are arranged into a lattice, is identical to reciprocalspace.7 The integers h, k and l are identical to Miller indices.
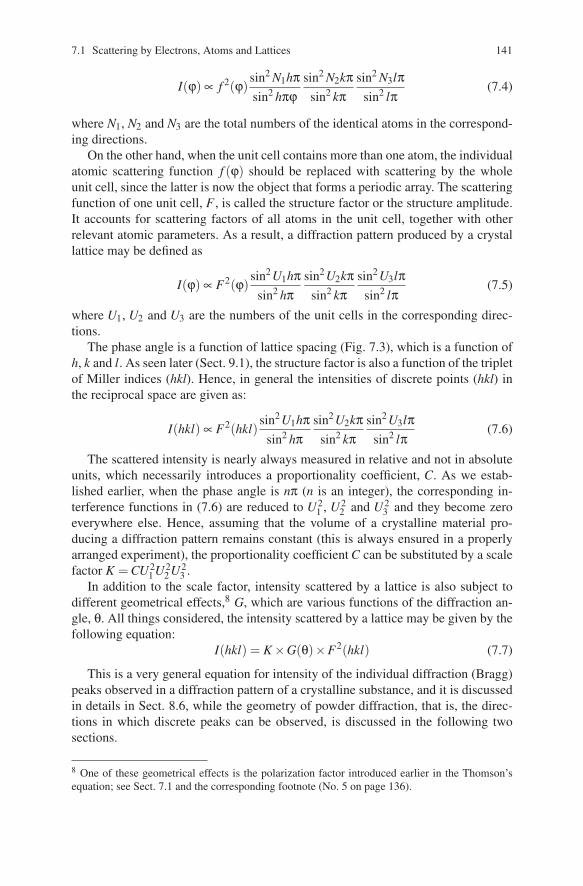
7.1 Scattering by Electrons, Atoms and Lattices 141
I(ϕ) ∝ f 2(ϕ)sin2 N1hπsin2 hπϕ
sin2 N2kπsin2 kπ
sin2 N3lπsin2 lπ
(7.4)
where N1, N2 and N3 are the total numbers of the identical atoms in the correspond-ing directions.
On the other hand, when the unit cell contains more than one atom, the individualatomic scattering function f (ϕ) should be replaced with scattering by the wholeunit cell, since the latter is now the object that forms a periodic array. The scatteringfunction of one unit cell, F , is called the structure factor or the structure amplitude.It accounts for scattering factors of all atoms in the unit cell, together with otherrelevant atomic parameters. As a result, a diffraction pattern produced by a crystallattice may be defined as
I(ϕ) ∝ F2(ϕ)sin2 U1hπ
sin2 hπsin2 U2kπ
sin2 kπsin2 U3lπ
sin2 lπ(7.5)
where U1, U2 and U3 are the numbers of the unit cells in the corresponding direc-tions.
The phase angle is a function of lattice spacing (Fig. 7.3), which is a function ofh, k and l. As seen later (Sect. 9.1), the structure factor is also a function of the tripletof Miller indices (hkl). Hence, in general the intensities of discrete points (hkl) inthe reciprocal space are given as:
I(hkl) ∝ F2(hkl)sin2 U1hπ
sin2 hπsin2 U2kπ
sin2 kπsin2 U3lπ
sin2 lπ(7.6)
The scattered intensity is nearly always measured in relative and not in absoluteunits, which necessarily introduces a proportionality coefficient, C. As we estab-lished earlier, when the phase angle is nπ (n is an integer), the corresponding in-terference functions in (7.6) are reduced to U2
1 , U22 and U2
3 and they become zeroeverywhere else. Hence, assuming that the volume of a crystalline material pro-ducing a diffraction pattern remains constant (this is always ensured in a properlyarranged experiment), the proportionality coefficient C can be substituted by a scalefactor K = CU2
1 U22 U2
3 .In addition to the scale factor, intensity scattered by a lattice is also subject to
different geometrical effects,8 G, which are various functions of the diffraction an-gle, θ. All things considered, the intensity scattered by a lattice may be given by thefollowing equation:
I(hkl) = K ×G(θ)×F2(hkl) (7.7)
This is a very general equation for intensity of the individual diffraction (Bragg)peaks observed in a diffraction pattern of a crystalline substance, and it is discussedin details in Sect. 8.6, while the geometry of powder diffraction, that is, the direc-tions in which discrete peaks can be observed, is discussed in the following twosections.
8 One of these geometrical effects is the polarization factor introduced earlier in the Thomson’sequation; see Sect. 7.1 and the corresponding footnote (No. 5 on page 136).

142 7 Fundamentals of Diffraction
7.2 Geometry of Diffraction by Lattices
Both direct and reciprocal spaces may be used to understand the geometry of dif-fraction by a lattice. Direct space concepts are intuitive, and therefore, we begin ourconsideration using physical space. Conversely, reciprocal space is extremely usefulin the visualization of diffraction patterns in general and from powders in particu-lar. In this section, therefore, we also show the relationships between geometricalconcepts of diffraction in physical and reciprocal spaces.
7.2.1 Laue Equations
The geometry of diffraction from a lattice, or in other words the relationships be-tween the directions of the incident and diffracted beams, was first given by Maxvon Laue in a form of three simultaneous equations, which are commonly known asLaue equations:
a(cosψ− cosϕ1) = hλb(cosψ− cosϕ2) = kλc(cosψ− cosϕ3) = lλ
(7.8)
Here a, b and c are the dimensions of the unit cell; ψ1−3 and ϕ1−3 are the anglesthat the incident and diffracted beams, respectively, form with the parallel rows ofatoms in three independent directions; the three integer indices h, k, and l have thesame meaning as in (7.6) and (7.7), that is, they are unique for each diffraction peakand define the position of the peak in the reciprocal space (also see Sect. 1.5), and λis the wavelength of the used radiation. The cosines, cosψi and cosϕi, are known asthe direction cosines of the incident and diffracted beams, respectively. Accordingto the formulation given by Laue, sharp diffraction peaks can only be observed whenall three equations in (7.8) are satisfied simultaneously as illustrated in Fig. 7.7.
Laue equations once again indicate that a periodic lattice produces diffractionmaxima at specific angles, which are defined by both the lattice repeat distances(a,b,c)and the wavelength (λ). Laue equations give the most general representationof a three-dimensional diffraction pattern and they may be used in the form of (7.8)to describe the geometry of diffraction from a single crystal.
7.2.2 Braggs’ Law
More useful in powder diffraction is the law formulated by W.H. Bragg and W.L.Bragg (see Footnote 11 on page 41). It establishes certain relationships among thediffraction angle (Bragg angle), wavelength, and interplanar spacing.
According to the Braggs, diffraction from a crystalline sample can be explainedand visualized by using a simple notion of mirror reflection of the incident X-ray
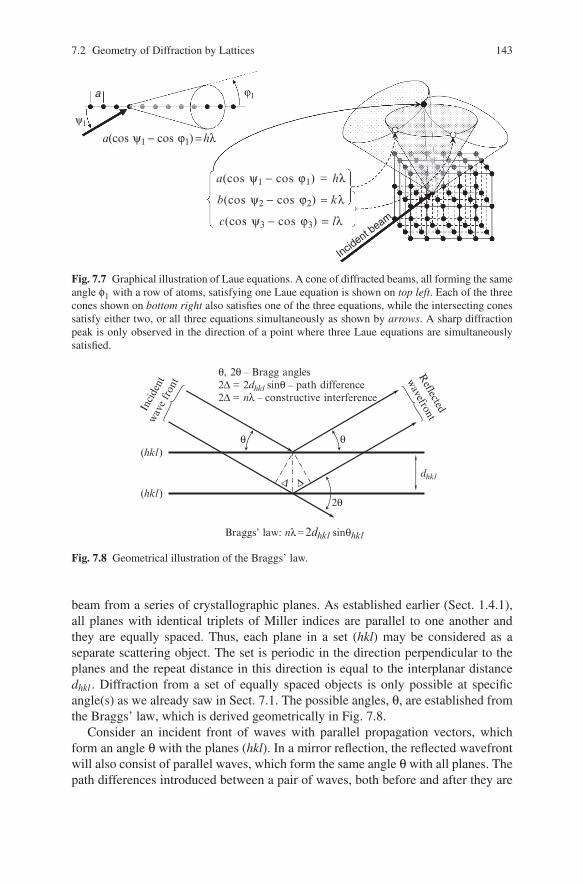
7.2 Geometry of Diffraction by Lattices 143
b(cos ψ2 − cos ϕ2) = kλ
c(cos ψ3 − cos ϕ3) = lλ
a(cos ψ1 − cos ϕ1) = hλ
a ϕ1
ψ1
a(cos ψ1 − cos ϕ1) = hλ
Incident b
eam
Fig. 7.7 Graphical illustration of Laue equations. A cone of diffracted beams, all forming the sameangle φ1 with a row of atoms, satisfying one Laue equation is shown on top left. Each of the threecones shown on bottom right also satisfies one of the three equations, while the intersecting conessatisfy either two, or all three equations simultaneously as shown by arrows. A sharp diffractionpeak is only observed in the direction of a point where three Laue equations are simultaneouslysatisfied.
θ, 2θ – Bragg angles2Δ = 2dhkl sinθ – path difference2Δ = nλ – constructive interference
Braggs’ law: nλ=2dhkl sinθhkl
(hkl )
(hkl )
θ θ
Δdhkl
2θ
Δ
Incide
ntwav
e fron
tR
eflected
wavefront
Fig. 7.8 Geometrical illustration of the Braggs’ law.
beam from a series of crystallographic planes. As established earlier (Sect. 1.4.1),all planes with identical triplets of Miller indices are parallel to one another andthey are equally spaced. Thus, each plane in a set (hkl) may be considered as aseparate scattering object. The set is periodic in the direction perpendicular to theplanes and the repeat distance in this direction is equal to the interplanar distancedhkl . Diffraction from a set of equally spaced objects is only possible at specificangle(s) as we already saw in Sect. 7.1. The possible angles, θ, are established fromthe Braggs’ law, which is derived geometrically in Fig. 7.8.
Consider an incident front of waves with parallel propagation vectors, whichform an angle θ with the planes (hkl). In a mirror reflection, the reflected wavefrontwill also consist of parallel waves, which form the same angle θ with all planes. Thepath differences introduced between a pair of waves, both before and after they are
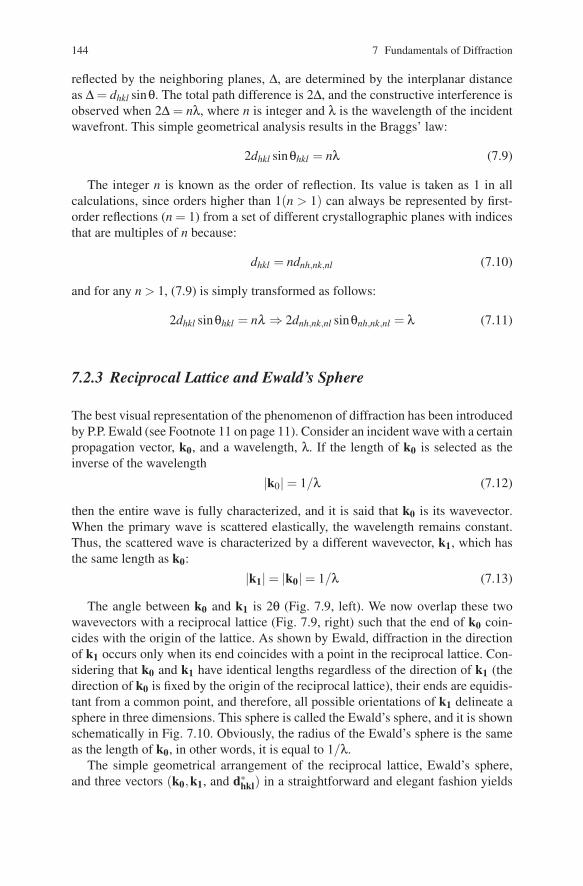
144 7 Fundamentals of Diffraction
reflected by the neighboring planes, Δ, are determined by the interplanar distanceas Δ = dhkl sinθ. The total path difference is 2Δ, and the constructive interference isobserved when 2Δ = nλ, where n is integer and λ is the wavelength of the incidentwavefront. This simple geometrical analysis results in the Braggs’ law:
2dhkl sinθhkl = nλ (7.9)
The integer n is known as the order of reflection. Its value is taken as 1 in allcalculations, since orders higher than 1(n > 1) can always be represented by first-order reflections (n = 1) from a set of different crystallographic planes with indicesthat are multiples of n because:
dhkl = ndnh,nk,nl (7.10)
and for any n > 1, (7.9) is simply transformed as follows:
2dhkl sinθhkl = nλ ⇒ 2dnh,nk,nl sinθnh,nk,nl = λ (7.11)
7.2.3 Reciprocal Lattice and Ewald’s Sphere
The best visual representation of the phenomenon of diffraction has been introducedby P.P. Ewald (see Footnote 11 on page 11). Consider an incident wave with a certainpropagation vector, k0, and a wavelength, λ. If the length of k0 is selected as theinverse of the wavelength
|k0| = 1/λ (7.12)
then the entire wave is fully characterized, and it is said that k0 is its wavevector.When the primary wave is scattered elastically, the wavelength remains constant.Thus, the scattered wave is characterized by a different wavevector, k1, which hasthe same length as k0:
|k1| = |k0| = 1/λ (7.13)
The angle between k0 and k1 is 2θ (Fig. 7.9, left). We now overlap these twowavevectors with a reciprocal lattice (Fig. 7.9, right) such that the end of k0 coin-cides with the origin of the lattice. As shown by Ewald, diffraction in the directionof k1 occurs only when its end coincides with a point in the reciprocal lattice. Con-sidering that k0 and k1 have identical lengths regardless of the direction of k1 (thedirection of k0 is fixed by the origin of the reciprocal lattice), their ends are equidis-tant from a common point, and therefore, all possible orientations of k1 delineate asphere in three dimensions. This sphere is called the Ewald’s sphere, and it is shownschematically in Fig. 7.10. Obviously, the radius of the Ewald’s sphere is the sameas the length of k0, in other words, it is equal to 1/λ.
The simple geometrical arrangement of the reciprocal lattice, Ewald’s sphere,and three vectors (k0,k1, and d∗
hkl) in a straightforward and elegant fashion yields
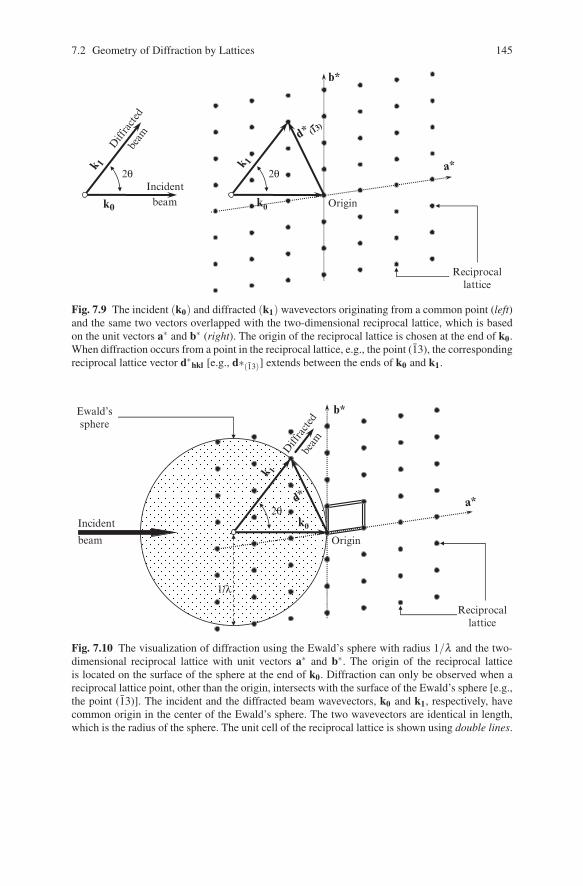
7.2 Geometry of Diffraction by Lattices 145
Origink0
k 1
2θ
b*
a*
Reciprocallattice
Diff
racted
beam
k0
k 1
2θIncident
beam
d* (13)
Fig. 7.9 The incident (k0) and diffracted (k1) wavevectors originating from a common point (left)and the same two vectors overlapped with the two-dimensional reciprocal lattice, which is basedon the unit vectors a∗ and b∗ (right). The origin of the reciprocal lattice is chosen at the end of k0.When diffraction occurs from a point in the reciprocal lattice, e.g., the point (13), the correspondingreciprocal lattice vector d∗
hkl [e.g., d∗(13)] extends between the ends of k0 and k1.
Incident
beam
Diff
racted
beam
Origin
1/λ
k0
k 1
d*2θ
b*
a*
Ewald’ssphere
Reciprocallattice
Fig. 7.10 The visualization of diffraction using the Ewald’s sphere with radius 1/λ and the two-dimensional reciprocal lattice with unit vectors a∗ and b∗. The origin of the reciprocal latticeis located on the surface of the sphere at the end of k0. Diffraction can only be observed when areciprocal lattice point, other than the origin, intersects with the surface of the Ewald’s sphere [e.g.,the point (13)]. The incident and the diffracted beam wavevectors, k0 and k1, respectively, havecommon origin in the center of the Ewald’s sphere. The two wavevectors are identical in length,which is the radius of the sphere. The unit cell of the reciprocal lattice is shown using double lines.
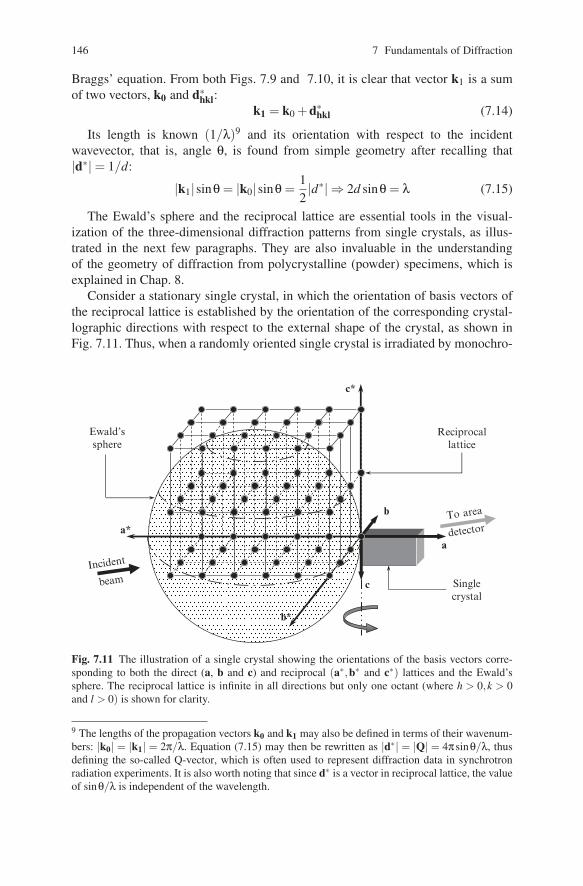
146 7 Fundamentals of Diffraction
Braggs’ equation. From both Figs. 7.9 and 7.10, it is clear that vector k1 is a sumof two vectors, k0 and d∗
hkl:k1 = k0 +d∗
hkl (7.14)
Its length is known (1/λ)9 and its orientation with respect to the incidentwavevector, that is, angle θ, is found from simple geometry after recalling that|d∗| = 1/d:
|k1|sinθ = |k0|sinθ =12|d∗| ⇒ 2d sinθ = λ (7.15)
The Ewald’s sphere and the reciprocal lattice are essential tools in the visual-ization of the three-dimensional diffraction patterns from single crystals, as illus-trated in the next few paragraphs. They are also invaluable in the understandingof the geometry of diffraction from polycrystalline (powder) specimens, which isexplained in Chap. 8.
Consider a stationary single crystal, in which the orientation of basis vectors ofthe reciprocal lattice is established by the orientation of the corresponding crystal-lographic directions with respect to the external shape of the crystal, as shown inFig. 7.11. Thus, when a randomly oriented single crystal is irradiated by monochro-
a*
c*
b*
c
b
a
Incident
beam
To area
detector
Singlecrystal
Reciprocallattice
Ewald’ssphere
Fig. 7.11 The illustration of a single crystal showing the orientations of the basis vectors corre-sponding to both the direct (a, b and c) and reciprocal (a∗,b∗ and c∗) lattices and the Ewald’ssphere. The reciprocal lattice is infinite in all directions but only one octant (where h > 0,k > 0and l > 0) is shown for clarity.
9 The lengths of the propagation vectors k0 and k1 may also be defined in terms of their wavenum-bers: |k0| = |k1| = 2π/λ. Equation (7.15) may then be rewritten as |d∗| = |Q| = 4πsinθ/λ, thusdefining the so-called Q-vector, which is often used to represent diffraction data in synchrotronradiation experiments. It is also worth noting that since d∗ is a vector in reciprocal lattice, the valueof sinθ/λ is independent of the wavelength.
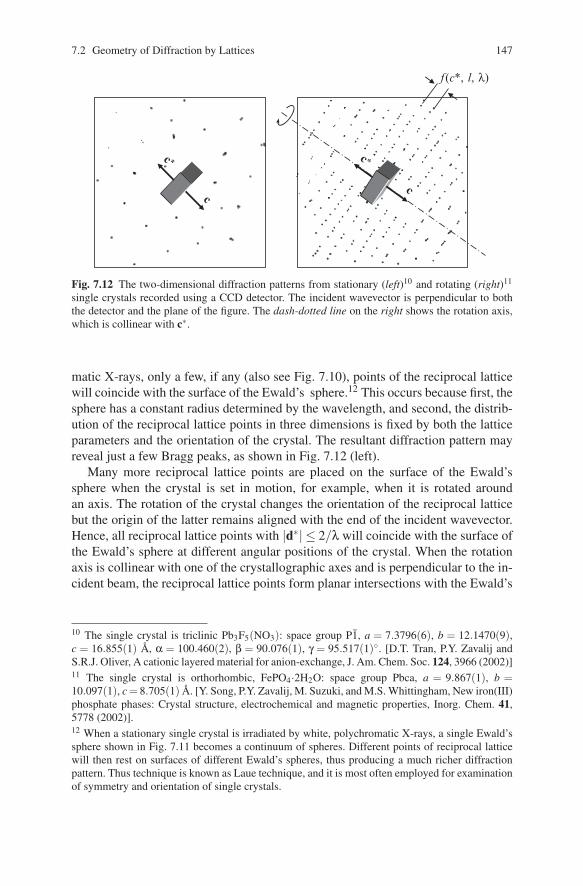
7.2 Geometry of Diffraction by Lattices 147
f(c*, l, λ)
c* c*
cc
Fig. 7.12 The two-dimensional diffraction patterns from stationary (left)10 and rotating (right)11
single crystals recorded using a CCD detector. The incident wavevector is perpendicular to boththe detector and the plane of the figure. The dash-dotted line on the right shows the rotation axis,which is collinear with c∗.
matic X-rays, only a few, if any (also see Fig. 7.10), points of the reciprocal latticewill coincide with the surface of the Ewald’s sphere.12 This occurs because first, thesphere has a constant radius determined by the wavelength, and second, the distrib-ution of the reciprocal lattice points in three dimensions is fixed by both the latticeparameters and the orientation of the crystal. The resultant diffraction pattern mayreveal just a few Bragg peaks, as shown in Fig. 7.12 (left).
Many more reciprocal lattice points are placed on the surface of the Ewald’ssphere when the crystal is set in motion, for example, when it is rotated aroundan axis. The rotation of the crystal changes the orientation of the reciprocal latticebut the origin of the latter remains aligned with the end of the incident wavevector.Hence, all reciprocal lattice points with |d∗| ≤ 2/λ will coincide with the surface ofthe Ewald’s sphere at different angular positions of the crystal. When the rotationaxis is collinear with one of the crystallographic axes and is perpendicular to the in-cident beam, the reciprocal lattice points form planar intersections with the Ewald’s
10 The single crystal is triclinic Pb3F5(NO3): space group P1, a = 7.3796(6), b = 12.1470(9),c = 16.855(1) A, α = 100.460(2), β = 90.076(1), γ = 95.517(1)◦. [D.T. Tran, P.Y. Zavalij andS.R.J. Oliver, A cationic layered material for anion-exchange, J. Am. Chem. Soc. 124, 3966 (2002)]11 The single crystal is orthorhombic, FePO4·2H2O: space group Pbca, a = 9.867(1), b =10.097(1), c = 8.705(1) A. [Y. Song, P.Y. Zavalij, M. Suzuki, and M.S. Whittingham, New iron(III)phosphate phases: Crystal structure, electrochemical and magnetic properties, Inorg. Chem. 41,5778 (2002)].12 When a stationary single crystal is irradiated by white, polychromatic X-rays, a single Ewald’ssphere shown in Fig. 7.11 becomes a continuum of spheres. Different points of reciprocal latticewill then rest on surfaces of different Ewald’s spheres, thus producing a much richer diffractionpattern. Thus technique is known as Laue technique, and it is most often employed for examinationof symmetry and orientation of single crystals.
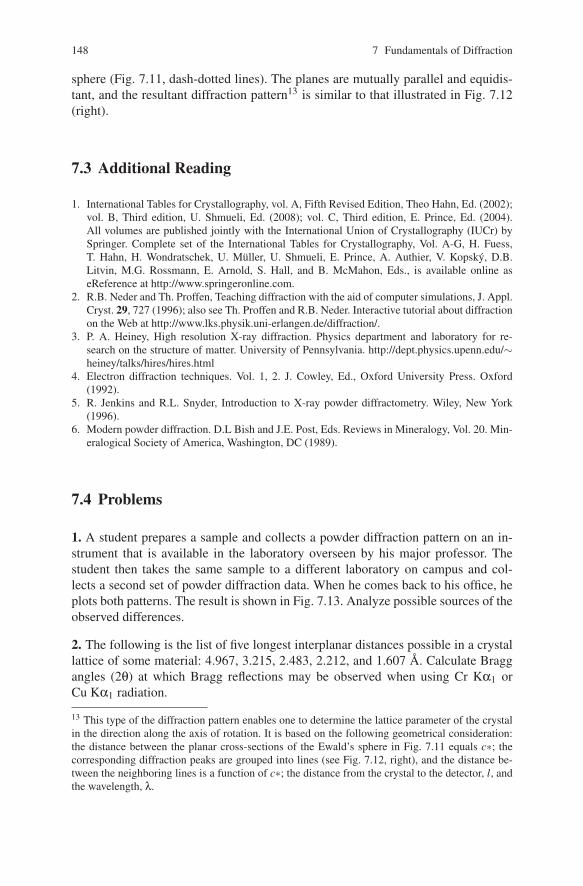
148 7 Fundamentals of Diffraction
sphere (Fig. 7.11, dash-dotted lines). The planes are mutually parallel and equidis-tant, and the resultant diffraction pattern13 is similar to that illustrated in Fig. 7.12(right).
7.3 Additional Reading
1. International Tables for Crystallography, vol. A, Fifth Revised Edition, Theo Hahn, Ed. (2002);vol. B, Third edition, U. Shmueli, Ed. (2008); vol. C, Third edition, E. Prince, Ed. (2004).All volumes are published jointly with the International Union of Crystallography (IUCr) bySpringer. Complete set of the International Tables for Crystallography, Vol. A-G, H. Fuess,T. Hahn, H. Wondratschek, U. Muller, U. Shmueli, E. Prince, A. Authier, V. Kopsky, D.B.Litvin, M.G. Rossmann, E. Arnold, S. Hall, and B. McMahon, Eds., is available online aseReference at http://www.springeronline.com.
2. R.B. Neder and Th. Proffen, Teaching diffraction with the aid of computer simulations, J. Appl.Cryst. 29, 727 (1996); also see Th. Proffen and R.B. Neder. Interactive tutorial about diffractionon the Web at http://www.lks.physik.uni-erlangen.de/diffraction/.
3. P. A. Heiney, High resolution X-ray diffraction. Physics department and laboratory for re-search on the structure of matter. University of Pennsylvania. http://dept.physics.upenn.edu/∼heiney/talks/hires/hires.html
4. Electron diffraction techniques. Vol. 1, 2. J. Cowley, Ed., Oxford University Press. Oxford(1992).
5. R. Jenkins and R.L. Snyder, Introduction to X-ray powder diffractometry. Wiley, New York(1996).
6. Modern powder diffraction. D.L Bish and J.E. Post, Eds. Reviews in Mineralogy, Vol. 20. Min-eralogical Society of America, Washington, DC (1989).
7.4 Problems
1. A student prepares a sample and collects a powder diffraction pattern on an in-strument that is available in the laboratory overseen by his major professor. Thestudent then takes the same sample to a different laboratory on campus and col-lects a second set of powder diffraction data. When he comes back to his office, heplots both patterns. The result is shown in Fig. 7.13. Analyze possible sources of theobserved differences.
2. The following is the list of five longest interplanar distances possible in a crystallattice of some material: 4.967, 3.215, 2.483, 2.212, and 1.607 A. Calculate Braggangles (2θ) at which Bragg reflections may be observed when using Cr Kα1 orCu Kα1 radiation.
13 This type of the diffraction pattern enables one to determine the lattice parameter of the crystalin the direction along the axis of rotation. It is based on the following geometrical consideration:the distance between the planar cross-sections of the Ewald’s sphere in Fig. 7.11 equals c∗; thecorresponding diffraction peaks are grouped into lines (see Fig. 7.12, right), and the distance be-tween the neighboring lines is a function of c∗; the distance from the crystal to the detector, l, andthe wavelength, λ.
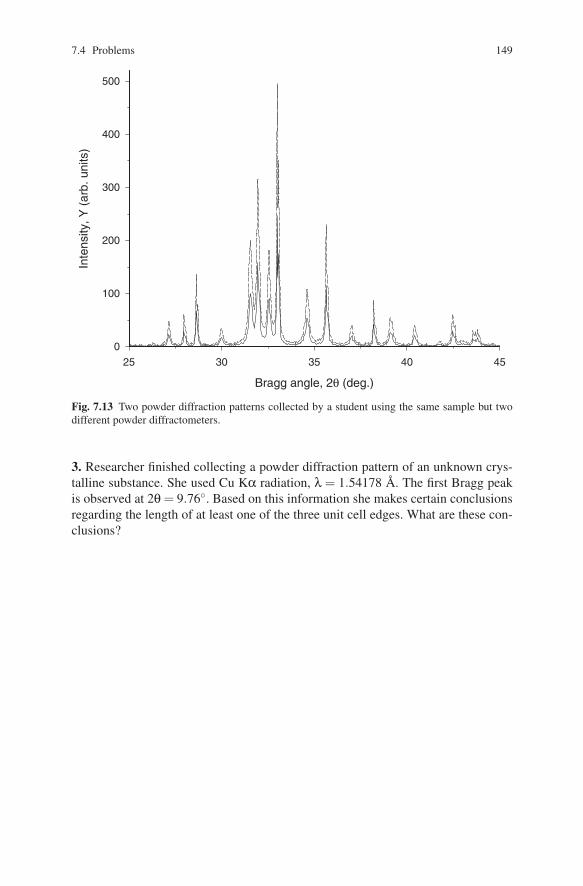
7.4 Problems 149
Bragg angle, 2θ (deg.)
25 30 35 40 45
Inte
nsity
, Y (
arb.
uni
ts)
0
100
200
300
400
500
Fig. 7.13 Two powder diffraction patterns collected by a student using the same sample but twodifferent powder diffractometers.
3. Researcher finished collecting a powder diffraction pattern of an unknown crys-talline substance. She used Cu Kα radiation, λ = 1.54178 A. The first Bragg peakis observed at 2θ = 9.76◦. Based on this information she makes certain conclusionsregarding the length of at least one of the three unit cell edges. What are these con-clusions?
Chapter 9Structure Factor
So far, we discussed all prefactors in (8.41), which were dependent on multipleparameters, except for the crystal structure of the material. The only remaining termis the structure factor, |Fhkl |2, which is the square of the absolute value of the so-called structure amplitude, Fhkl . It is this factor that includes multiple contributions,which are determined by the distribution of atoms in the unit cell and other structuralfeatures.
9.1 Structure Amplitude
When the unit cell contains only one atom, the resulting diffracted intensity is onlya function of the scattering ability of this atom (see Sect. 7.1.2). However, whenthe unit cell contains many atoms and they have different scattering ability, the am-plitude of the scattered wave is given by a complex function, which is called thestructure amplitude:
F(h) =n
∑j=1
gjt j(s) f j(s)exp(2πih ·xj) (9.1)
where:
– F(h) is the structure amplitude of a Bragg reflection with indices hkl, which arerepresented as vector h in three dimensions. The structure amplitude itself isoften shown in a vector form since it is a complex number;
– n is the total number of atoms in the unit cell and n includes all symmetricallyequivalent atoms;
– s is sinθhkl/λ;– gj is the population (or occupation) factor of the jth atom (gj = 1 for a fully
occupied site);– t j is the temperature factor, which describes thermal motions of the jth atom;
V.K. Pecharsky, P.Y. Zavalij, Fundamentals of Powder Diffraction and Structural 203Characterization of Materials, DOI: 10.1007/978-0-387-09579-0 9,c© Springer Science+Business Media LLC 2009
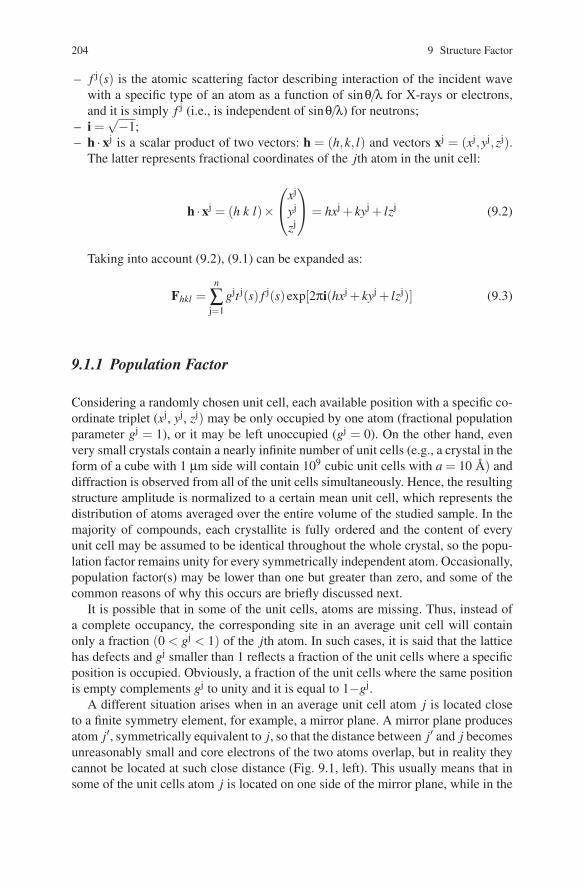
204 9 Structure Factor
– f j(s) is the atomic scattering factor describing interaction of the incident wavewith a specific type of an atom as a function of sinθ/λ for X-rays or electrons,and it is simply f j (i.e., is independent of sinθ/λ) for neutrons;
– i =√−1;
– h · xj is a scalar product of two vectors: h = (h,k, l) and vectors xj = (xj,yj,zj).The latter represents fractional coordinates of the jth atom in the unit cell:
h ·xj = (h k l)×
⎛⎝xj
yj
zj
⎞⎠ = hxj + kyj + lzj (9.2)
Taking into account (9.2), (9.1) can be expanded as:
Fhkl =n
∑j=1
gjt j(s) f j(s)exp[2πi(hxj + kyj + lzj)] (9.3)
9.1.1 Population Factor
Considering a randomly chosen unit cell, each available position with a specific co-ordinate triplet (xj, yj, zj) may be only occupied by one atom (fractional populationparameter gj = 1), or it may be left unoccupied (gj = 0). On the other hand, evenvery small crystals contain a nearly infinite number of unit cells (e.g., a crystal in theform of a cube with 1 μm side will contain 109 cubic unit cells with a = 10 A) anddiffraction is observed from all of the unit cells simultaneously. Hence, the resultingstructure amplitude is normalized to a certain mean unit cell, which represents thedistribution of atoms averaged over the entire volume of the studied sample. In themajority of compounds, each crystallite is fully ordered and the content of everyunit cell may be assumed to be identical throughout the whole crystal, so the popu-lation factor remains unity for every symmetrically independent atom. Occasionally,population factor(s) may be lower than one but greater than zero, and some of thecommon reasons of why this occurs are briefly discussed next.
It is possible that in some of the unit cells, atoms are missing. Thus, instead ofa complete occupancy, the corresponding site in an average unit cell will containonly a fraction (0 < gj < 1) of the jth atom. In such cases, it is said that the latticehas defects and gj smaller than 1 reflects a fraction of the unit cells where a specificposition is occupied. Obviously, a fraction of the unit cells where the same positionis empty complements gj to unity and it is equal to 1−gj.
A different situation arises when in an average unit cell atom j is located closeto a finite symmetry element, for example, a mirror plane. A mirror plane producesatom j′, symmetrically equivalent to j, so that the distance between j′ and j becomesunreasonably small and core electrons of the two atoms overlap, but in reality theycannot be located at such close distance (Fig. 9.1, left). This usually means that insome of the unit cells atom j is located on one side of the mirror plane, while in the
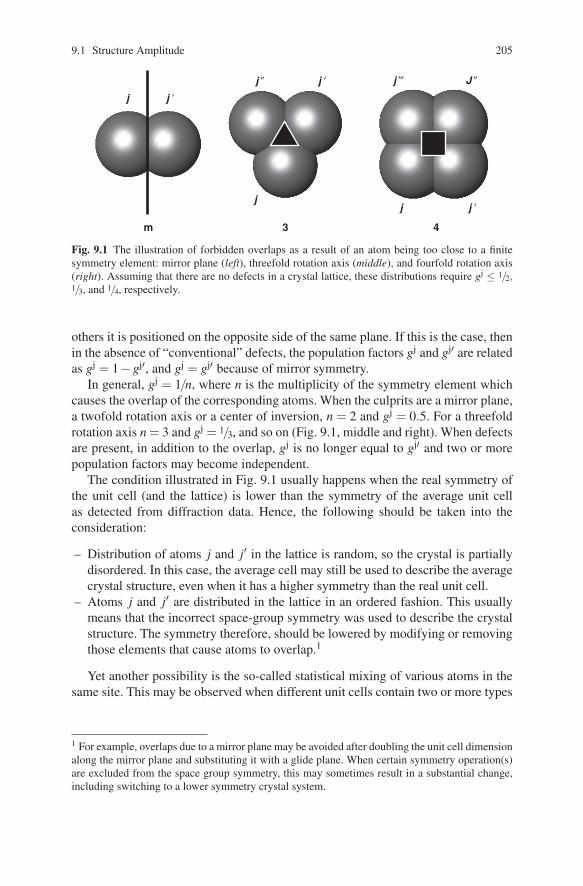
9.1 Structure Amplitude 205
m
j j �
3
j
j �j �
4
j j �
j � J �
Fig. 9.1 The illustration of forbidden overlaps as a result of an atom being too close to a finitesymmetry element: mirror plane (left), threefold rotation axis (middle), and fourfold rotation axis(right). Assuming that there are no defects in a crystal lattice, these distributions require gj ≤ 1/2,1/3, and 1/4, respectively.
others it is positioned on the opposite side of the same plane. If this is the case, thenin the absence of “conventional” defects, the population factors gj and gj′ are relatedas gj = 1−gj′, and gj = gj′ because of mirror symmetry.
In general, gj = 1/n, where n is the multiplicity of the symmetry element whichcauses the overlap of the corresponding atoms. When the culprits are a mirror plane,a twofold rotation axis or a center of inversion, n = 2 and gj = 0.5. For a threefoldrotation axis n = 3 and gj = 1/3, and so on (Fig. 9.1, middle and right). When defectsare present, in addition to the overlap, gj is no longer equal to gj′ and two or morepopulation factors may become independent.
The condition illustrated in Fig. 9.1 usually happens when the real symmetry ofthe unit cell (and the lattice) is lower than the symmetry of the average unit cellas detected from diffraction data. Hence, the following should be taken into theconsideration:
– Distribution of atoms j and j′ in the lattice is random, so the crystal is partiallydisordered. In this case, the average cell may still be used to describe the averagecrystal structure, even when it has a higher symmetry than the real unit cell.
– Atoms j and j′ are distributed in the lattice in an ordered fashion. This usuallymeans that the incorrect space-group symmetry was used to describe the crystalstructure. The symmetry therefore, should be lowered by modifying or removingthose elements that cause atoms to overlap.1
Yet another possibility is the so-called statistical mixing of various atoms in thesame site. This may be observed when different unit cells contain two or more types
1 For example, overlaps due to a mirror plane may be avoided after doubling the unit cell dimensionalong the mirror plane and substituting it with a glide plane. When certain symmetry operation(s)are excluded from the space group symmetry, this may sometimes result in a substantial change,including switching to a lower symmetry crystal system.
206 9 Structure Factor
of atoms in the same position.2 In the most general case, the occupational disordercan be expressed as:
g0 +m
∑j=1
gj = 1 (9.4)
where g0 represents the unoccupied fraction of the unit cells (i.e., defects) and m isthe number of different types of atoms that occupy given site position in differentunit cells.
In all cases considered in this section, population factor(s) could be refined, eventhough some of them may be constrained by symmetry or other relationships. Forexample when g0 = 0 and m = 3 in (9.4), the following constraint should be in effect:g3 = 1 – g1 – g2. Given the sensitivity of the population parameters to the potentiallyoverestimated symmetry, it is important to analyze their values, especially if theyconverge into simple factions, for example, 1/2,1/3 (see Fig. 9.1).
9.1.2 Temperature Factor (Atomic Displacement Factor)
At any temperature higher than absolute zero, certain frequencies in a phonon spec-trum of the crystal lattice are excited and as a result, atoms are in a continuousoscillating motion about their equilibrium positions, which are determined by co-ordinate triplets (x,y,z). To account for these vibrations, the so-called temperaturefactor is introduced into the general equation (9.1) of the structure amplitude.
It is worth noting that according to a recommendation issued by the InternationalUnion of Crystallography (IUCr), the corresponding parameters representing thetemperature factor should be referred as “atomic displacement parameters” insteadof the commonly used “temperature parameters” or “thermal parameters.” This sug-gestion is based on the fact that these parameters, when determined from X-raydiffraction experiment, represent the combined total of several effects in additionto displacements caused by thermal motion. They include deformation of the elec-tron density around the atom due to chemical bonding, improperly or not accountedabsorption, preferred orientation, porosity, and so on, even if they influence thestructure factor to a much lesser degree than thermal motion.
Oscillatory motions of atoms may be quite complex and, as a result, several dif-ferent levels of approximations in the expression of the temperature factor can beused. In the simplest form, the temperature factor of the jth atom is represented as:
t j = exp(−Bj sin2 θ
λ2
)(9.5)
2 Strictly speaking, it should be referred to as “practically the same position,” since different atomswould interact differently with their surroundings, thus causing locally different environments un-less their volumes and electronic properties are quite similar (e.g., Si and Ge; Fe3+ and Co3+,and other). Consequently, in the majority of cases, their positions (coordinates) are at least slightlydifferent. On the other hand, the differences in the positions of these atoms can rarely be detectedfrom diffraction experiment and are therefore, neglected.
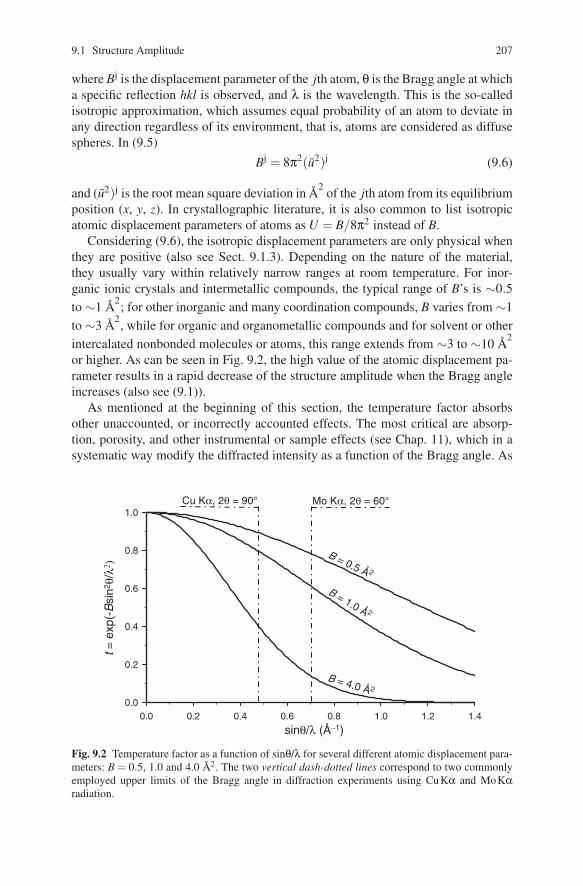
9.1 Structure Amplitude 207
where Bj is the displacement parameter of the jth atom, θ is the Bragg angle at whicha specific reflection hkl is observed, and λ is the wavelength. This is the so-calledisotropic approximation, which assumes equal probability of an atom to deviate inany direction regardless of its environment, that is, atoms are considered as diffusespheres. In (9.5)
Bj = 8π2(u2)j (9.6)
and (u2)j is the root mean square deviation in A2 of the jth atom from its equilibriumposition (x, y, z). In crystallographic literature, it is also common to list isotropicatomic displacement parameters of atoms as U = B/8π2 instead of B.
Considering (9.6), the isotropic displacement parameters are only physical whenthey are positive (also see Sect. 9.1.3). Depending on the nature of the material,they usually vary within relatively narrow ranges at room temperature. For inor-ganic ionic crystals and intermetallic compounds, the typical range of B’s is ∼0.5to ∼1 A2; for other inorganic and many coordination compounds, B varies from ∼1to ∼3 A2, while for organic and organometallic compounds and for solvent or otherintercalated nonbonded molecules or atoms, this range extends from ∼3 to ∼10 A2
or higher. As can be seen in Fig. 9.2, the high value of the atomic displacement pa-rameter results in a rapid decrease of the structure amplitude when the Bragg angleincreases (also see (9.1)).
As mentioned at the beginning of this section, the temperature factor absorbsother unaccounted, or incorrectly accounted effects. The most critical are absorp-tion, porosity, and other instrumental or sample effects (see Chap. 11), which in asystematic way modify the diffracted intensity as a function of the Bragg angle. As
0.0 0.2 0.4 0.6 0.8 1.0 1.2 1.40.0
0.2
0.4
0.6
0.8
1.0
sinθ/λ (Å−1)
t= e
xp(-
Bsi
n2θ/
λ2)
B = 0.5 Å 2
B = 1.0 Å 2
B = 4.0 Å2
Mo Kα, 2θ = 60°Cu Kα, 2θ = 90°
Fig. 9.2 Temperature factor as a function of sinθ/λ for several different atomic displacement para-meters: B = 0.5, 1.0 and 4.0 A2. The two vertical dash-dotted lines correspond to two commonlyemployed upper limits of the Bragg angle in diffraction experiments using CuKα and MoKαradiation.

208 9 Structure Factor
a result, the B parameters of all atoms may become negative. If this is the case,then the absorption correction should be reevaluated and re-refined or the experi-ment should be repeated to minimize the deleterious instrumental influence on thedistribution of intensities of Bragg peaks.
The next level of approximation accounts for the anisotropy of thermal motionsin a harmonic approximation, and describes atoms as ellipsoids in one of the threefollowing forms, which are, in fact, equivalent to one another:
t j = exp[−(βj11h2 +βj
22k2 +βj33l2 +2βj
12hk +2βj13hl +2βj
23kl)] (9.7)
t j = exp[− 14(Bj
11h2a∗2 +Bj22k2b∗2 +Bj
33l2c∗2
+2Bj12hka∗b∗ +2Bj
13hla∗c∗ +2Bj23klb∗c∗)]
(9.8)
t j = exp[−2π2(U j11h2a∗2 +U j
22k2b∗2 +U j33l2c∗2
+2U j12hka∗b∗ +2U j
13hla∗c∗ +2U j23klb∗c∗)]
(9.9)
where βj11 · · ·β
j23,B
j11 · · ·B
j23 and U j
11 · · ·Uj23 are the anisotropic atomic displacement
parameters (six parameters3 per atom).As follows from (9.8) and (9.9), the relationships between Bi j and Ui j are identi-
cal to that given in (9.6), and both are measured in A2. The βi j parameters in (9.7)are dimensionless but may be easily converted into Bi j or Ui j. Very high-qualitypowder diffraction data are needed to obtain dependable anisotropic displacementparameters and even then, they may be reliable only for those atoms that have largescattering factors (see Sect. 9.1.3).4 On the other hand, the refinement of anisotropicdisplacement parameters is essential when strongly scattering atoms are distinctlyanisotropic.
The anisotropic displacement parameters can also be represented in a format of atensor, Tij, that is, a square matrix symmetrical with respect to its principal diagonal.For Bi j it is given as:
Bij =
⎛⎝B11 B12 B13
B12 B22 B23B13 B23 B33
⎞⎠ (9.10)
and for other types of anisotropic displacement parameters ((9.7) and (9.9)) thematrices are identical, except that the corresponding elements are βi j and Ui j, re-
3 This is true for atoms located in the general site position (point symmetry 1), where all sixparameters are independent from one another. In special positions, some or all of the anisotropicdisplacement parameters is constrained by symmetry. For example, B13(β13, U13) and B23(β23,U23) for an atom located on a mirror plane perpendicular to Z-axis are constrained to 0.4 More often than not, the anisotropic atomic displacement parameters determined from powderdiffraction data affected by preferred orientation are incorrect (unphysical).
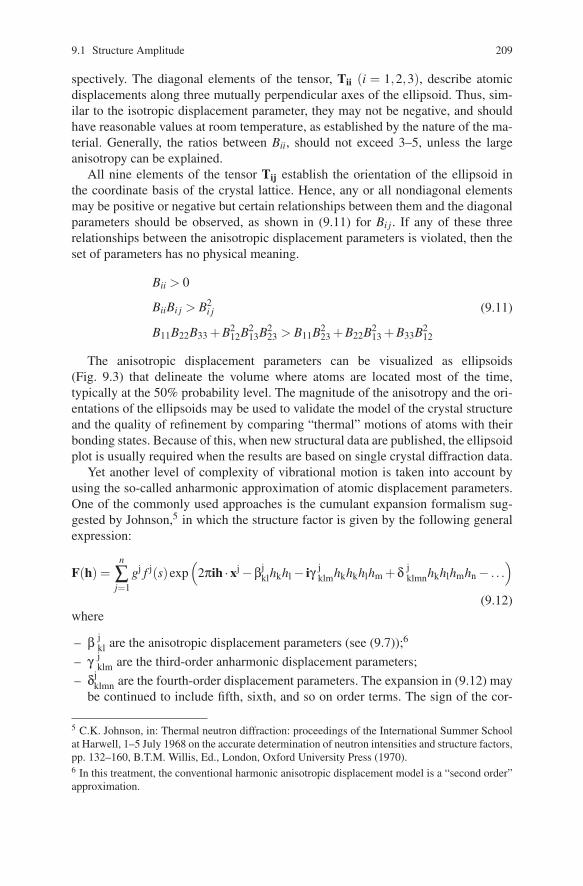
9.1 Structure Amplitude 209
spectively. The diagonal elements of the tensor, Tii (i = 1,2,3), describe atomicdisplacements along three mutually perpendicular axes of the ellipsoid. Thus, sim-ilar to the isotropic displacement parameter, they may not be negative, and shouldhave reasonable values at room temperature, as established by the nature of the ma-terial. Generally, the ratios between Bii, should not exceed 3–5, unless the largeanisotropy can be explained.
All nine elements of the tensor Tij establish the orientation of the ellipsoid inthe coordinate basis of the crystal lattice. Hence, any or all nondiagonal elementsmay be positive or negative but certain relationships between them and the diagonalparameters should be observed, as shown in (9.11) for Bi j. If any of these threerelationships between the anisotropic displacement parameters is violated, then theset of parameters has no physical meaning.
Bii > 0
BiiBi j > B2i j
B11B22B33 +B212B2
13B223 > B11B2
23 +B22B213 +B33B2
12
(9.11)
The anisotropic displacement parameters can be visualized as ellipsoids(Fig. 9.3) that delineate the volume where atoms are located most of the time,typically at the 50% probability level. The magnitude of the anisotropy and the ori-entations of the ellipsoids may be used to validate the model of the crystal structureand the quality of refinement by comparing “thermal” motions of atoms with theirbonding states. Because of this, when new structural data are published, the ellipsoidplot is usually required when the results are based on single crystal diffraction data.
Yet another level of complexity of vibrational motion is taken into account byusing the so-called anharmonic approximation of atomic displacement parameters.One of the commonly used approaches is the cumulant expansion formalism sug-gested by Johnson,5 in which the structure factor is given by the following generalexpression:
F(h) =n
∑j=1
gj f j(s)exp(
2πih ·xj −βjklhkhl − iγ j
klmhkhkhlhm +δ jklmnhkhlhmhn − . . .
)
(9.12)where
– β jkl are the anisotropic displacement parameters (see (9.7));6
– γ jklm are the third-order anharmonic displacement parameters;
– δjklmn are the fourth-order displacement parameters. The expansion in (9.12) may
be continued to include fifth, sixth, and so on order terms. The sign of the cor-
5 C.K. Johnson, in: Thermal neutron diffraction: proceedings of the International Summer Schoolat Harwell, 1–5 July 1968 on the accurate determination of neutron intensities and structure factors,pp. 132–160, B.T.M. Willis, Ed., London, Oxford University Press (1970).6 In this treatment, the conventional harmonic anisotropic displacement model is a “second order”approximation.
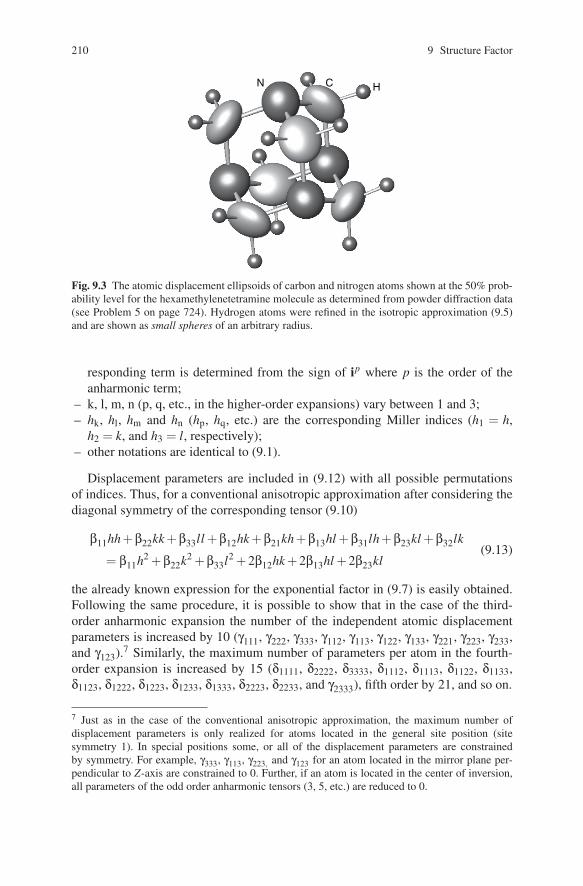
210 9 Structure Factor
HCN
Fig. 9.3 The atomic displacement ellipsoids of carbon and nitrogen atoms shown at the 50% prob-ability level for the hexamethylenetetramine molecule as determined from powder diffraction data(see Problem 5 on page 724). Hydrogen atoms were refined in the isotropic approximation (9.5)and are shown as small spheres of an arbitrary radius.
responding term is determined from the sign of ip where p is the order of theanharmonic term;
– k, l, m, n (p, q, etc., in the higher-order expansions) vary between 1 and 3;– hk, hl, hm and hn (hp, hq, etc.) are the corresponding Miller indices (h1 = h,
h2 = k, and h3 = l, respectively);– other notations are identical to (9.1).
Displacement parameters are included in (9.12) with all possible permutationsof indices. Thus, for a conventional anisotropic approximation after considering thediagonal symmetry of the corresponding tensor (9.10)
β11hh+β22kk +β33ll +β12hk +β21kh+β13hl +β31lh+β23kl +β32lk
= β11h2 +β22k2 +β33l2 +2β12hk +2β13hl +2β23kl(9.13)
the already known expression for the exponential factor in (9.7) is easily obtained.Following the same procedure, it is possible to show that in the case of the third-order anharmonic expansion the number of the independent atomic displacementparameters is increased by 10 (γ111, γ222, γ333, γ112, γ113, γ122, γ133, γ221, γ223, γ233,and γ123).7 Similarly, the maximum number of parameters per atom in the fourth-order expansion is increased by 15 (δ1111, δ2222, δ3333, δ1112, δ1113, δ1122, δ1133,δ1123, δ1222, δ1223, δ1233, δ1333, δ2223, δ2233, and γ2333), fifth order by 21, and so on.
7 Just as in the case of the conventional anisotropic approximation, the maximum number ofdisplacement parameters is only realized for atoms located in the general site position (sitesymmetry 1). In special positions some, or all of the displacement parameters are constrainedby symmetry. For example, γ333, γ113, γ223, and γ123 for an atom located in the mirror plane per-pendicular to Z-axis are constrained to 0. Further, if an atom is located in the center of inversion,all parameters of the odd order anharmonic tensors (3, 5, etc.) are reduced to 0.
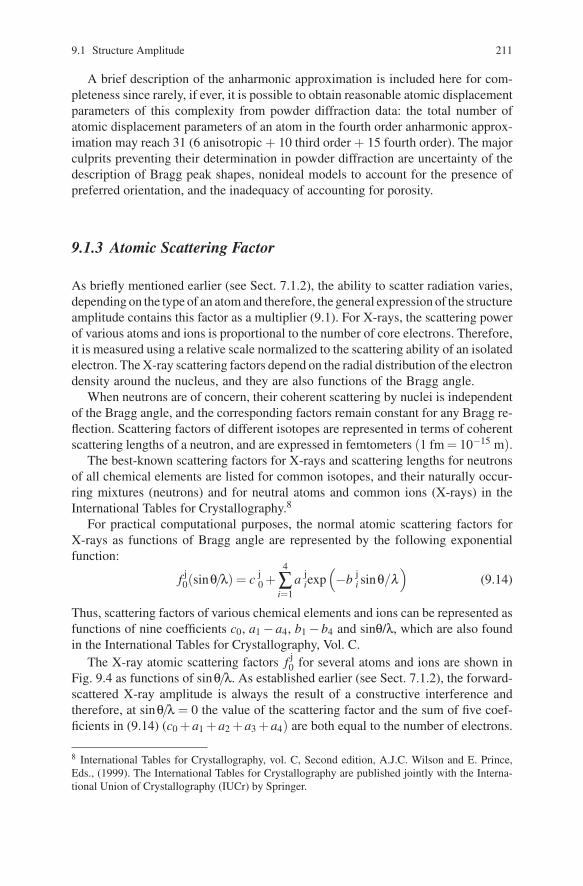
9.1 Structure Amplitude 211
A brief description of the anharmonic approximation is included here for com-pleteness since rarely, if ever, it is possible to obtain reasonable atomic displacementparameters of this complexity from powder diffraction data: the total number ofatomic displacement parameters of an atom in the fourth order anharmonic approx-imation may reach 31 (6 anisotropic + 10 third order + 15 fourth order). The majorculprits preventing their determination in powder diffraction are uncertainty of thedescription of Bragg peak shapes, nonideal models to account for the presence ofpreferred orientation, and the inadequacy of accounting for porosity.
9.1.3 Atomic Scattering Factor
As briefly mentioned earlier (see Sect. 7.1.2), the ability to scatter radiation varies,depending on the type of an atom and therefore, the general expression of the structureamplitude contains this factor as a multiplier (9.1). For X-rays, the scattering powerof various atoms and ions is proportional to the number of core electrons. Therefore,it is measured using a relative scale normalized to the scattering ability of an isolatedelectron. The X-ray scattering factors depend on the radial distribution of the electrondensity around the nucleus, and they are also functions of the Bragg angle.
When neutrons are of concern, their coherent scattering by nuclei is independentof the Bragg angle, and the corresponding factors remain constant for any Bragg re-flection. Scattering factors of different isotopes are represented in terms of coherentscattering lengths of a neutron, and are expressed in femtometers (1 fm = 10−15 m).
The best-known scattering factors for X-rays and scattering lengths for neutronsof all chemical elements are listed for common isotopes, and their naturally occur-ring mixtures (neutrons) and for neutral atoms and common ions (X-rays) in theInternational Tables for Crystallography.8
For practical computational purposes, the normal atomic scattering factors forX-rays as functions of Bragg angle are represented by the following exponentialfunction:
f j0(sinθ/λ) = c j
0 +4
∑i=1
a jiexp
(−b j
i sinθ/λ)
(9.14)
Thus, scattering factors of various chemical elements and ions can be represented asfunctions of nine coefficients c0, a1 − a4, b1 − b4 and sinθ/λ, which are also foundin the International Tables for Crystallography, Vol. C.
The X-ray atomic scattering factors f j0 for several atoms and ions are shown in
Fig. 9.4 as functions of sinθ/λ. As established earlier (see Sect. 7.1.2), the forward-scattered X-ray amplitude is always the result of a constructive interference andtherefore, at sinθ/λ = 0 the value of the scattering factor and the sum of five coef-ficients in (9.14) (c0 +a1 +a2 +a3 +a4) are both equal to the number of electrons.
8 International Tables for Crystallography, vol. C, Second edition, A.J.C. Wilson and E. Prince,Eds., (1999). The International Tables for Crystallography are published jointly with the Interna-tional Union of Crystallography (IUCr) by Springer.

212 9 Structure Factor
0
5
10
15
20
25
30
35
40
45
50
55
0 0.25 0.5 0.75 1 1.25 1.5
sinθ/λ
Sca
tterin
g fa
ctor
(el
ectr
ons)
H
O
V
Y
I
V+3
V+5
Fig. 9.4 Atomic scattering factors of H, O, V+5, V+3, V, Y and I as functions of sinθλ plotted inorder from the bottom to the top. Scattering factors of vanadium ions become nearly identical tothat of the neutral atom at sinθλ∼ 0.25, which corresponds to 2θ∼ 45◦(CuKα).
It is worth noting that the difference between scattering factors of neutral atoms andions (compare the plots for V, V3+ and V5+) is substantial only at low Bragg angles(more precisely, at low sinθ/λ). On the other hand, atoms in solids are rarely fullyionized, even in their highest oxidation states. Therefore, atomic scattering factorsfor neutral atoms usually give adequate approximation, and they are commonly usedin all calculations.
Considering Figs. 9.2 and 9.4, both the temperature and scattering factors de-crease exponentially with sinθ/λ. Hence, when the displacement parameter of anindividual atom becomes unphysical during a least squares refinement, this usuallymeans that the improper type of an atom has been placed in the suspicious site. Ifthe chemical element placed in a certain position has fewer electrons than it should,then during the refinement, its displacement parameter(s) becomes negative or muchlower than those of the correctly placed atoms. This reduction in the displacementparameters(s) ((9.5)–(9.9)) offsets the inadequately low scattering factor (9.14) byincreasing the temperature factor. Similarly, when the site has too many electronsthan it really does, displacement parameter(s) of the corresponding atom becomeunusually high during the refinement. Similar effects are observed in neutron dif-fraction.
Anomalies of displacement parameter(s) are also observed when an atom isplaced in a position that is empty or only partially occupied (i.e., the site has size-able defects). In this case, displacement parameter(s) become extremely large, effec-tively reducing the contribution from this atom to the structure factor (see Fig. 9.2).All sites, which have unusually low or unusually high displacement parameter(s),should be tested by refining population parameter(s), while setting the displacementparameters at some reasonable values to avoid possible, and sometimes severe cor-relations. This refinement may reveal the nature of the chemical element located
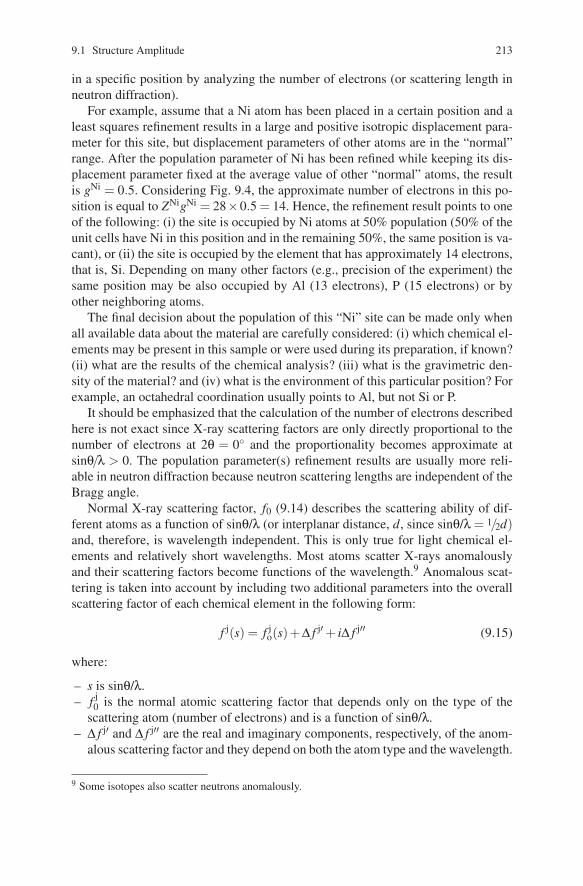
9.1 Structure Amplitude 213
in a specific position by analyzing the number of electrons (or scattering length inneutron diffraction).
For example, assume that a Ni atom has been placed in a certain position and aleast squares refinement results in a large and positive isotropic displacement para-meter for this site, but displacement parameters of other atoms are in the “normal”range. After the population parameter of Ni has been refined while keeping its dis-placement parameter fixed at the average value of other “normal” atoms, the resultis gNi = 0.5. Considering Fig. 9.4, the approximate number of electrons in this po-sition is equal to ZNigNi = 28×0.5 = 14. Hence, the refinement result points to oneof the following: (i) the site is occupied by Ni atoms at 50% population (50% of theunit cells have Ni in this position and in the remaining 50%, the same position is va-cant), or (ii) the site is occupied by the element that has approximately 14 electrons,that is, Si. Depending on many other factors (e.g., precision of the experiment) thesame position may be also occupied by Al (13 electrons), P (15 electrons) or byother neighboring atoms.
The final decision about the population of this “Ni” site can be made only whenall available data about the material are carefully considered: (i) which chemical el-ements may be present in this sample or were used during its preparation, if known?(ii) what are the results of the chemical analysis? (iii) what is the gravimetric den-sity of the material? and (iv) what is the environment of this particular position? Forexample, an octahedral coordination usually points to Al, but not Si or P.
It should be emphasized that the calculation of the number of electrons describedhere is not exact since X-ray scattering factors are only directly proportional to thenumber of electrons at 2θ = 0◦ and the proportionality becomes approximate atsinθ/λ > 0. The population parameter(s) refinement results are usually more reli-able in neutron diffraction because neutron scattering lengths are independent of theBragg angle.
Normal X-ray scattering factor, f0 (9.14) describes the scattering ability of dif-ferent atoms as a function of sinθ/λ (or interplanar distance, d, since sinθ/λ = 1/2d)and, therefore, is wavelength independent. This is only true for light chemical el-ements and relatively short wavelengths. Most atoms scatter X-rays anomalouslyand their scattering factors become functions of the wavelength.9 Anomalous scat-tering is taken into account by including two additional parameters into the overallscattering factor of each chemical element in the following form:
f j(s) = f jo(s)+Δ f j′ + iΔ f j′′ (9.15)
where:
– s is sinθ/λ.– f j
0 is the normal atomic scattering factor that depends only on the type of thescattering atom (number of electrons) and is a function of sinθ/λ.
– Δ f j′ and Δ f j′′ are the real and imaginary components, respectively, of the anom-alous scattering factor and they depend on both the atom type and the wavelength.
9 Some isotopes also scatter neutrons anomalously.

214 9 Structure Factor
The anomalous scattering factors are also listed in the International Tables forCrystallography for all chemical elements and commonly used wavelengths of lab-oratory X-rays. They can be measured or calculated for any wavelength, which isimportant when using synchrotron radiation.10 The anomalous scattering is usuallyat least an order of magnitude lower than normal scattering. Generally, the mag-nitude of the anomalous scattering factors is proportional to the wavelength, andinversely proportional to the number of electrons in an atom. Anomalous scatteringbecomes strong, and is at its maximum when the wavelength is near the correspond-ing absorption edge of an atom, as shown in Fig. 9.5. This effect may be used todiscriminate atoms that have similar conventional scattering factors (e.g., Cu andZn), which is most easily done using synchrotron radiation where the wavelengthcan be tuned at will.
−80
−60
−40
−20
0
20
401101001000
Gd
Energy, E (keV)
−100.01 0.1 1 10
−5
0
5
101101001000
Wavelength, λ (Å)0.01 0.1 1 10
Wavelength, λ (Å)
Ano
mal
ous
scat
terin
g fa
ctor
, Δf�
, Δf�
(e)
Ano
mal
ous
scat
terin
g fa
ctor
, Δf�
, Δf�
(e)
Δf �
Δf �
Δf �
Δf �
a b
Fe
Energy, E (keV)
Fig. 9.5 Anomalous scattering factors, Δ f ′ and Δ f ′′, of Fe and Gd as functions of wavelength(bottom scale) and photon energy (upper scale). Compare this figure with Fig. 8.20. Numericaldata used to produce the plots have been generated using a web-based interface at the LawrenceLivermore National Laboratory.11
10 The most precise values are obtained from experimental measurements. When one of the twoanomalous scattering coefficients is measured, the second can be relatively precisely calculatedusing Kramers–Kronig equation. More details about the anomalous scattering can be found in aspecial literature, e.g., see J. Als-Nielsen and D. McMorrow, Elements of modern X-ray physics,John Wiley & Sons, Ltd., New York (2001).11 http://physci.llnl.gov/Research/scattering/elastic.html. The interface has been created byLynn Kissel.
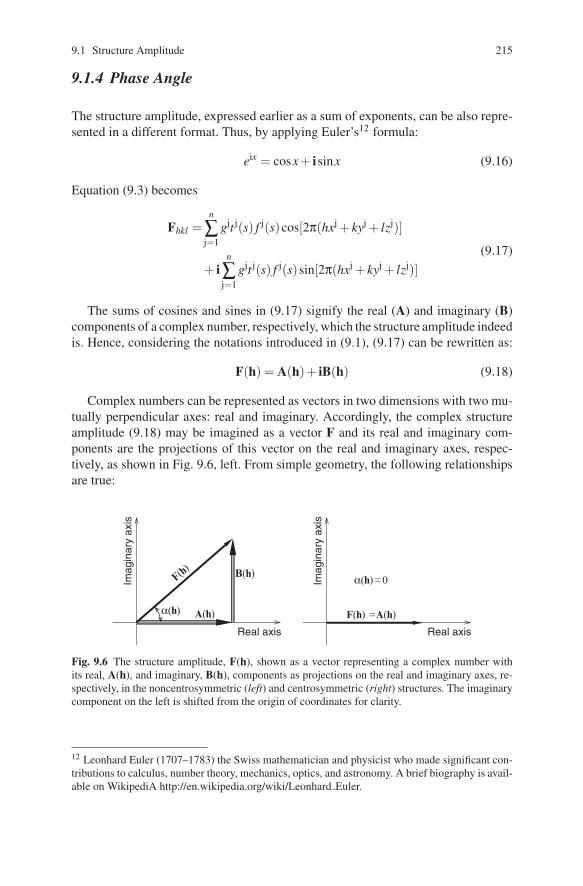
9.1 Structure Amplitude 215
9.1.4 Phase Angle
The structure amplitude, expressed earlier as a sum of exponents, can be also repre-sented in a different format. Thus, by applying Euler’s12 formula:
eix = cosx+ isinx (9.16)
Equation (9.3) becomes
Fhkl =n
∑j=1
gjt j(s) f j(s)cos[2π(hxj + kyj + lzj)]
+ in
∑j=1
gjt j(s) f j(s)sin[2π(hxj + kyj + lzj)](9.17)
The sums of cosines and sines in (9.17) signify the real (A) and imaginary (B)components of a complex number, respectively, which the structure amplitude indeedis. Hence, considering the notations introduced in (9.1), (9.17) can be rewritten as:
F(h) = A(h)+ iB(h) (9.18)
Complex numbers can be represented as vectors in two dimensions with two mu-tually perpendicular axes: real and imaginary. Accordingly, the complex structureamplitude (9.18) may be imagined as a vector F and its real and imaginary com-ponents are the projections of this vector on the real and imaginary axes, respec-tively, as shown in Fig. 9.6, left. From simple geometry, the following relationshipsare true:
Imag
inar
y ax
is
Real axis
Imag
inar
y ax
is
Real axis
F(h)
A(h)
B(h)
F(h) =A(h)α(h)
α(h)=0
Fig. 9.6 The structure amplitude, F(h), shown as a vector representing a complex number withits real, A(h), and imaginary, B(h), components as projections on the real and imaginary axes, re-spectively, in the noncentrosymmetric (left) and centrosymmetric (right) structures. The imaginarycomponent on the left is shifted from the origin of coordinates for clarity.
12 Leonhard Euler (1707–1783) the Swiss mathematician and physicist who made significant con-tributions to calculus, number theory, mechanics, optics, and astronomy. A brief biography is avail-able on WikipediA http://en.wikipedia.org/wiki/Leonhard Euler.
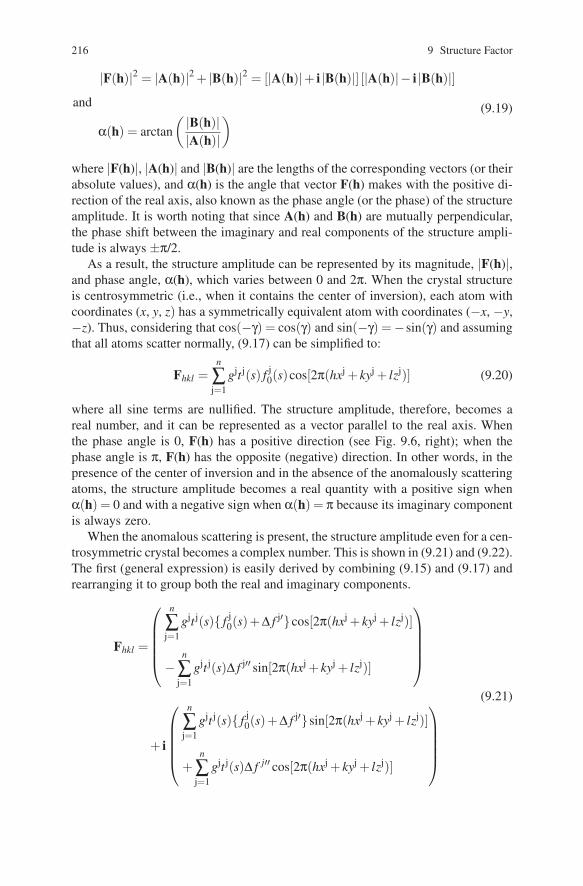
216 9 Structure Factor
|F(h)|2 = |A(h)|2 + |B(h)|2 = [|A(h)|+ i |B(h)|] [|A(h)|− i |B(h)|]and
α(h) = arctan(|B(h)||A(h)|
) (9.19)
where |F(h)|, |A(h)| and |B(h)| are the lengths of the corresponding vectors (or theirabsolute values), and α(h) is the angle that vector F(h) makes with the positive di-rection of the real axis, also known as the phase angle (or the phase) of the structureamplitude. It is worth noting that since A(h) and B(h) are mutually perpendicular,the phase shift between the imaginary and real components of the structure ampli-tude is always ±π/2.
As a result, the structure amplitude can be represented by its magnitude, |F(h)|,and phase angle, α(h), which varies between 0 and 2π. When the crystal structureis centrosymmetric (i.e., when it contains the center of inversion), each atom withcoordinates (x, y, z) has a symmetrically equivalent atom with coordinates (−x, −y,−z). Thus, considering that cos(−γ) = cos(γ) and sin(−γ) =−sin(γ) and assumingthat all atoms scatter normally, (9.17) can be simplified to:
Fhkl =n
∑j=1
gjt j(s) f j0(s)cos[2π(hxj + kyj + lzj)] (9.20)
where all sine terms are nullified. The structure amplitude, therefore, becomes areal number, and it can be represented as a vector parallel to the real axis. Whenthe phase angle is 0, F(h) has a positive direction (see Fig. 9.6, right); when thephase angle is π, F(h) has the opposite (negative) direction. In other words, in thepresence of the center of inversion and in the absence of the anomalously scatteringatoms, the structure amplitude becomes a real quantity with a positive sign whenα(h) = 0 and with a negative sign when α(h) = π because its imaginary componentis always zero.
When the anomalous scattering is present, the structure amplitude even for a cen-trosymmetric crystal becomes a complex number. This is shown in (9.21) and (9.22).The first (general expression) is easily derived by combining (9.15) and (9.17) andrearranging it to group both the real and imaginary components.
Fhkl =
⎛⎜⎜⎜⎜⎝
n
∑j=1
gjt j(s){ f j0(s)+Δ f j′}cos[2π(hxj + kyj + lzj)]
−n
∑j=1
gjt j(s)Δ f j′′ sin[2π(hxj + kyj + lzj)]
⎞⎟⎟⎟⎟⎠
+ i
⎛⎜⎜⎜⎜⎝
n
∑j=1
gjt j(s){ f j0(s)+Δ f j′}sin[2π(hxj + kyj + lzj)]
+n
∑j=1
gjt j(s)Δ f j′′ cos[2π(hxj + kyj + lzj)]
⎞⎟⎟⎟⎟⎠
(9.21)
9.2 Effects of Symmetry on the Structure Amplitude 217
The introduction of the center of inversion results in the cancellation of all sineterms in (9.21) and
Fhkl =n
∑j=1
gjt j(s){ f j0(s)+Δ f j′}cos[2π(hxj + kyj + lzj)]
+ in
∑j=1
gjt j(s)Δ f j′′ cos[2π(hxj + kyj + lzj)](9.22)
Recalling that usually Δ f j′′ << f j0 + Δ f j′, the absolute value of the imaginary
component in (9.21) is smaller than that of the real part, and phase angles remainclose to 0 or π in any centrosymmetric structure. In the noncentrosymmetric cases(9.21) the phase angles may adopt any value between 0 and 2π.
Concluding this section, it is worth noting that the measured integrated intensity(8.41) is proportional to the square of the structure amplitude. Thus, the relative ab-solute value of the structure amplitude is an easily measurable quantity – it can beobtained as a square root of intensity after dividing the latter by all known geomet-rical factors. The phase angle (or the sign in case of normally scattering centrosym-metric structures), however, remains unknown. In other words, phases are lost andcannot be determined directly from either a powder or a single crystal diffractionexperiment. This creates the so called “phase problem” in diffraction analysis, andits significance is discussed in Sect. 10.2.
9.2 Effects of Symmetry on the Structure Amplitude
Considering the most general expression of the structure amplitude, (9.21), its valueis defined by population and displacement parameters of all atoms present in theunit cell, their scattering ability, and coordinates. We know that coordinates andother parameters of atoms in the unit cell are related by symmetry. As was shown inChap. 4 ((4.20) and (4.29)), the coordinates of two symmetrically equivalent atoms(x and x′) are related as
x′= A ·x (9.23)
where x = (x,y,z,1), x′ = (x′,y′,z′,1), and A is an augmented matrix representinga symmetry operation. By expanding (9.23), substituting the result to express theidentical arguments of sine and cosine parts in (9.21) and regrouping it as shownin (9.24):
2πh ·x′ = 2π[
x(hr11 + kr21 + lr31)+ y(hr12 + kr22 + lr32)+z(hr13 + kr23 + lr33)+(ht1 + kt2 + lt3)
](9.24)
it is easy to see that the symmetry of the direct space (crystal structure) is carriedover into the reciprocal space by modifying structure amplitudes. Thus, the con-tribution of two symmetrically equivalent atoms x and x′ into the correspondingreciprocal lattice points, h and h′, may be expressed as:
h′ = AT·h (9.25)
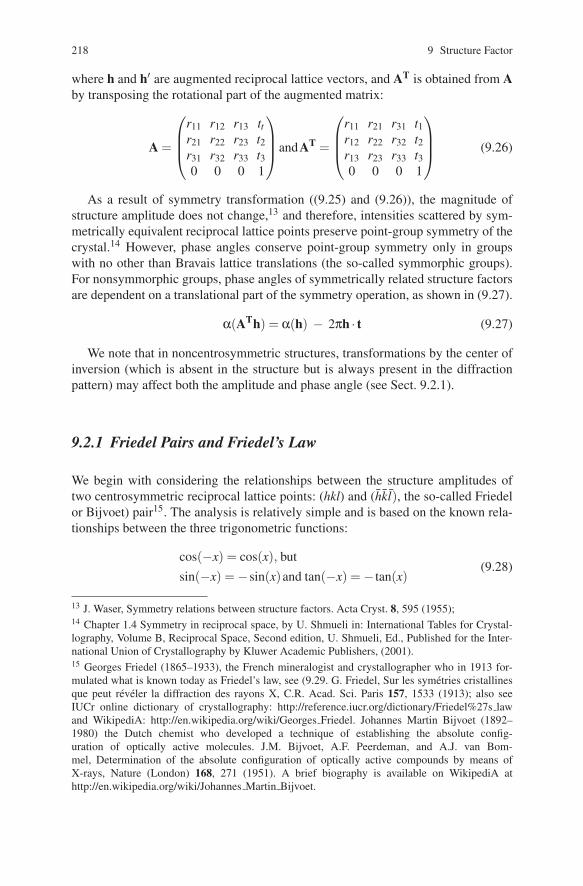
218 9 Structure Factor
where h and h′ are augmented reciprocal lattice vectors, and AT is obtained from Aby transposing the rotational part of the augmented matrix:
A =
⎛⎜⎜⎝
r11 r12 r13 ttr21 r22 r23 t2r31 r32 r33 t30 0 0 1
⎞⎟⎟⎠andAT =
⎛⎜⎜⎝
r11 r21 r31 t1r12 r22 r32 t2r13 r23 r33 t30 0 0 1
⎞⎟⎟⎠ (9.26)
As a result of symmetry transformation ((9.25) and (9.26)), the magnitude ofstructure amplitude does not change,13 and therefore, intensities scattered by sym-metrically equivalent reciprocal lattice points preserve point-group symmetry of thecrystal.14 However, phase angles conserve point-group symmetry only in groupswith no other than Bravais lattice translations (the so-called symmorphic groups).For nonsymmorphic groups, phase angles of symmetrically related structure factorsare dependent on a translational part of the symmetry operation, as shown in (9.27).
α(ATh) = α(h) − 2πh · t (9.27)
We note that in noncentrosymmetric structures, transformations by the center ofinversion (which is absent in the structure but is always present in the diffractionpattern) may affect both the amplitude and phase angle (see Sect. 9.2.1).
9.2.1 Friedel Pairs and Friedel’s Law
We begin with considering the relationships between the structure amplitudes oftwo centrosymmetric reciprocal lattice points: (hkl) and (hkl), the so-called Friedelor Bijvoet) pair15. The analysis is relatively simple and is based on the known rela-tionships between the three trigonometric functions:
cos(−x) = cos(x), butsin(−x) = −sin(x)and tan(−x) = − tan(x)
(9.28)
13 J. Waser, Symmetry relations between structure factors. Acta Cryst. 8, 595 (1955);14 Chapter 1.4 Symmetry in reciprocal space, by U. Shmueli in: International Tables for Crystal-lography, Volume B, Reciprocal Space, Second edition, U. Shmueli, Ed., Published for the Inter-national Union of Crystallography by Kluwer Academic Publishers, (2001).15 Georges Friedel (1865–1933), the French mineralogist and crystallographer who in 1913 for-mulated what is known today as Friedel’s law, see (9.29. G. Friedel, Sur les symetries cristallinesque peut reveler la diffraction des rayons X, C.R. Acad. Sci. Paris 157, 1533 (1913); also seeIUCr online dictionary of crystallography: http://reference.iucr.org/dictionary/Friedel%27s lawand WikipediA: http://en.wikipedia.org/wiki/Georges Friedel. Johannes Martin Bijvoet (1892–1980) the Dutch chemist who developed a technique of establishing the absolute config-uration of optically active molecules. J.M. Bijvoet, A.F. Peerdeman, and A.J. van Bom-mel, Determination of the absolute configuration of optically active compounds by means ofX-rays, Nature (London) 168, 271 (1951). A brief biography is available on WikipediA athttp://en.wikipedia.org/wiki/Johannes Martin Bijvoet.
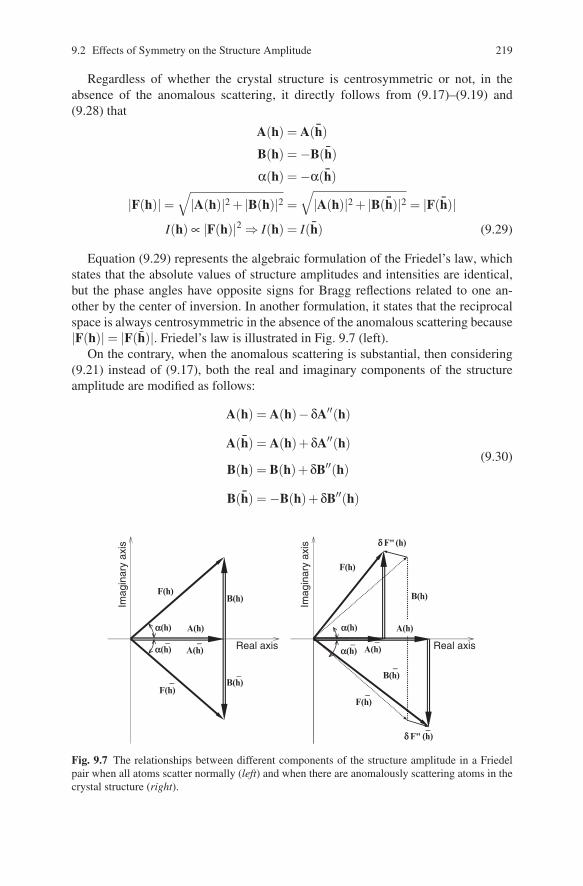
9.2 Effects of Symmetry on the Structure Amplitude 219
Regardless of whether the crystal structure is centrosymmetric or not, in theabsence of the anomalous scattering, it directly follows from (9.17)–(9.19) and(9.28) that
A(h) = A ¯(h)
B(h) = −B ¯(h)
α(h) = −α ¯(h)
|F(h)| =√|A(h)|2 + |B(h)|2 =
√|A(h)|2 + |B ¯(h)|2 = |F ¯(h)|
I(h) ∝ |F(h)|2 ⇒ I(h) = I ¯(h) (9.29)
Equation (9.29) represents the algebraic formulation of the Friedel’s law, whichstates that the absolute values of structure amplitudes and intensities are identical,but the phase angles have opposite signs for Bragg reflections related to one an-other by the center of inversion. In another formulation, it states that the reciprocalspace is always centrosymmetric in the absence of the anomalous scattering because|F(h)| = |F(h)|. Friedel’s law is illustrated in Fig. 9.7 (left).
On the contrary, when the anomalous scattering is substantial, then considering(9.21) instead of (9.17), both the real and imaginary components of the structureamplitude are modified as follows:
A(h) = A(h)−δA′′(h)
A ¯(h) = A(h)+δA′′(h)
B(h) = B(h)+δB′′(h)
B ¯(h) = −B(h)+δB′′(h)
(9.30)
Imag
inar
y ax
is
Real axis
F(h)B(h)
A(h)a(h) a(h)
F(h)_
F(h)_
B(h)_
A(h)_
A(h)_
a(h)_
a(h)_
Imag
inar
y ax
is
Real axis
F(h)
B(h)
(h)d F"_
(h)d F"
A(h)
B(h)_
Fig. 9.7 The relationships between different components of the structure amplitude in a Friedelpair when all atoms scatter normally (left) and when there are anomalously scattering atoms in thecrystal structure (right).
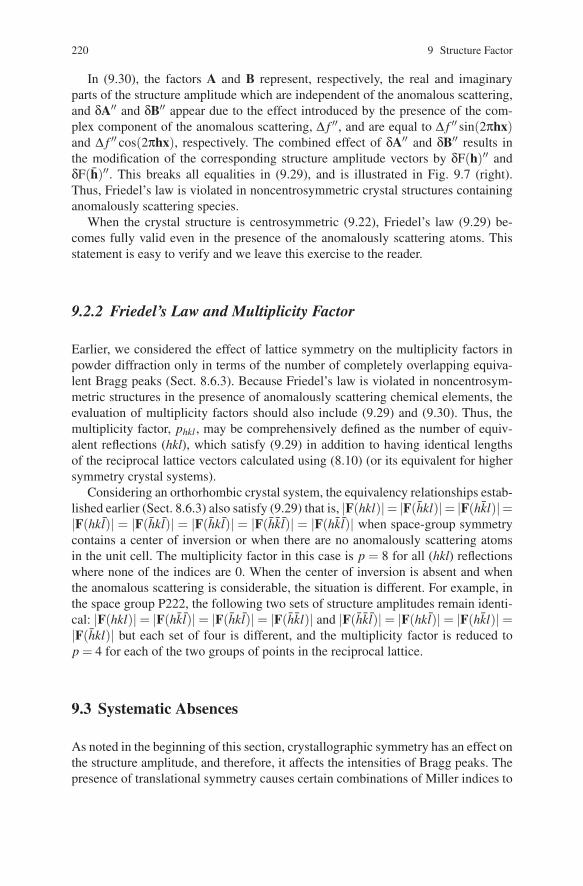
220 9 Structure Factor
In (9.30), the factors A and B represent, respectively, the real and imaginaryparts of the structure amplitude which are independent of the anomalous scattering,and δA′′ and δB′′ appear due to the effect introduced by the presence of the com-plex component of the anomalous scattering, Δ f ′′, and are equal to Δ f ′′ sin(2πhx)and Δ f ′′ cos(2πhx), respectively. The combined effect of δA′′ and δB′′ results inthe modification of the corresponding structure amplitude vectors by δF(h)′′ andδF(h)′′. This breaks all equalities in (9.29), and is illustrated in Fig. 9.7 (right).Thus, Friedel’s law is violated in noncentrosymmetric crystal structures containinganomalously scattering species.
When the crystal structure is centrosymmetric (9.22), Friedel’s law (9.29) be-comes fully valid even in the presence of the anomalously scattering atoms. Thisstatement is easy to verify and we leave this exercise to the reader.
9.2.2 Friedel’s Law and Multiplicity Factor
Earlier, we considered the effect of lattice symmetry on the multiplicity factors inpowder diffraction only in terms of the number of completely overlapping equiva-lent Bragg peaks (Sect. 8.6.3). Because Friedel’s law is violated in noncentrosym-metric structures in the presence of anomalously scattering chemical elements, theevaluation of multiplicity factors should also include (9.29) and (9.30). Thus, themultiplicity factor, phkl , may be comprehensively defined as the number of equiv-alent reflections (hkl), which satisfy (9.29) in addition to having identical lengthsof the reciprocal lattice vectors calculated using (8.10) (or its equivalent for highersymmetry crystal systems).
Considering an orthorhombic crystal system, the equivalency relationships estab-lished earlier (Sect. 8.6.3) also satisfy (9.29) that is, |F(hkl)|= |F(hkl)|= |F(hkl)|=|F(hkl)| = |F(hkl)| = |F(hkl)| = |F(hkl)| = |F(hkl)| when space-group symmetrycontains a center of inversion or when there are no anomalously scattering atomsin the unit cell. The multiplicity factor in this case is p = 8 for all (hkl) reflectionswhere none of the indices are 0. When the center of inversion is absent and whenthe anomalous scattering is considerable, the situation is different. For example, inthe space group P222, the following two sets of structure amplitudes remain identi-cal: |F(hkl)| = |F(hkl)| = |F(hkl)| = |F(hkl)| and |F(hkl)| = |F(hkl)| = |F(hkl)| =|F(hkl)| but each set of four is different, and the multiplicity factor is reduced top = 4 for each of the two groups of points in the reciprocal lattice.
9.3 Systematic Absences
As noted in the beginning of this section, crystallographic symmetry has an effect onthe structure amplitude, and therefore, it affects the intensities of Bragg peaks. Thepresence of translational symmetry causes certain combinations of Miller indices to
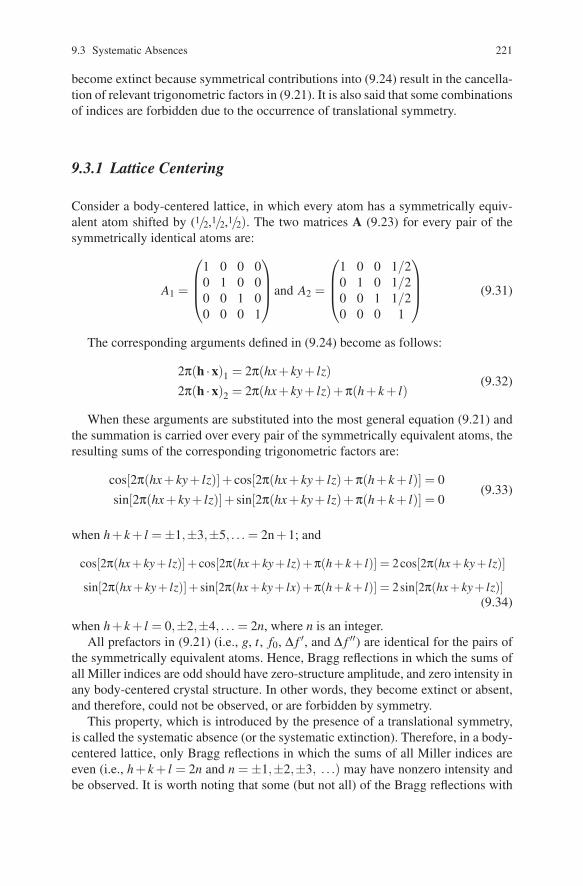
9.3 Systematic Absences 221
become extinct because symmetrical contributions into (9.24) result in the cancella-tion of relevant trigonometric factors in (9.21). It is also said that some combinationsof indices are forbidden due to the occurrence of translational symmetry.
9.3.1 Lattice Centering
Consider a body-centered lattice, in which every atom has a symmetrically equiv-alent atom shifted by (1/2,1/2,1/2). The two matrices A (9.23) for every pair of thesymmetrically identical atoms are:
A1 =
⎛⎜⎜⎝
1 0 0 00 1 0 00 0 1 00 0 0 1
⎞⎟⎟⎠and A2 =
⎛⎜⎜⎝
1 0 0 1/20 1 0 1/20 0 1 1/20 0 0 1
⎞⎟⎟⎠ (9.31)
The corresponding arguments defined in (9.24) become as follows:
2π(h ·x)1 = 2π(hx+ ky+ lz)2π(h ·x)2 = 2π(hx+ ky+ lz)+π(h+ k + l)
(9.32)
When these arguments are substituted into the most general equation (9.21) andthe summation is carried over every pair of the symmetrically equivalent atoms, theresulting sums of the corresponding trigonometric factors are:
cos[2π(hx+ ky+ lz)]+ cos[2π(hx+ ky+ lz)+π(h+ k + l)] = 0sin[2π(hx+ ky+ lz)]+ sin[2π(hx+ ky+ lz)+π(h+ k + l)] = 0
(9.33)
when h+ k + l = ±1,±3,±5, . . . = 2n+1; and
cos[2π(hx+ ky+ lz)]+ cos[2π(hx+ ky+ lz)+π(h+ k + l)] = 2cos[2π(hx+ ky+ lz)]
sin[2π(hx+ ky+ lz)]+ sin[2π(hx+ ky+ lx)+π(h+ k + l)] = 2sin[2π(hx+ ky+ lz)](9.34)
when h+ k + l = 0,±2,±4, . . . = 2n, where n is an integer.All prefactors in (9.21) (i.e., g, t, f0, Δ f ′, and Δ f ′′) are identical for the pairs of
the symmetrically equivalent atoms. Hence, Bragg reflections in which the sums ofall Miller indices are odd should have zero-structure amplitude, and zero intensity inany body-centered crystal structure. In other words, they become extinct or absent,and therefore, could not be observed, or are forbidden by symmetry.
This property, which is introduced by the presence of a translational symmetry,is called the systematic absence (or the systematic extinction). Therefore, in a body-centered lattice, only Bragg reflections in which the sums of all Miller indices areeven (i.e., h+ k + l = 2n and n = ±1,±2,±3, . . .) may have nonzero intensity andbe observed. It is worth noting that some (but not all) of the Bragg reflections with
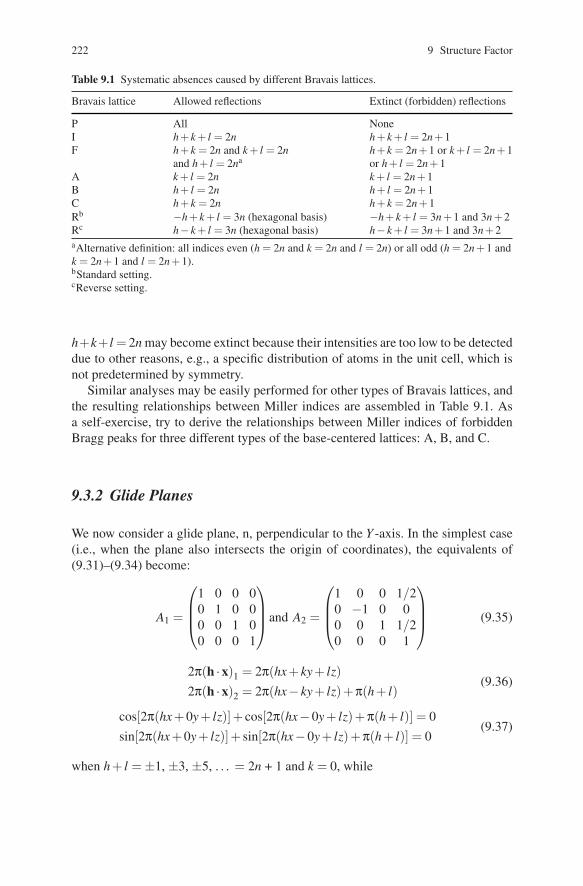
222 9 Structure Factor
Table 9.1 Systematic absences caused by different Bravais lattices.
Bravais lattice Allowed reflections Extinct (forbidden) reflections
P All NoneI h+ k + l = 2n h+ k + l = 2n+1F h+ k = 2n and k + l = 2n
and h+ l = 2nah+ k = 2n+1 or k + l = 2n+1or h+ l = 2n+1
A k + l = 2n k + l = 2n+1B h+ l = 2n h+ l = 2n+1C h+ k = 2n h+ k = 2n+1Rb −h+ k + l = 3n (hexagonal basis) −h+ k + l = 3n+1 and 3n+2Rc h− k + l = 3n (hexagonal basis) h− k + l = 3n+1 and 3n+2aAlternative definition: all indices even (h = 2n and k = 2n and l = 2n) or all odd (h = 2n+1 andk = 2n+1 and l = 2n+1).bStandard setting.cReverse setting.
h+k+ l = 2n may become extinct because their intensities are too low to be detecteddue to other reasons, e.g., a specific distribution of atoms in the unit cell, which isnot predetermined by symmetry.
Similar analyses may be easily performed for other types of Bravais lattices, andthe resulting relationships between Miller indices are assembled in Table 9.1. Asa self-exercise, try to derive the relationships between Miller indices of forbiddenBragg peaks for three different types of the base-centered lattices: A, B, and C.
9.3.2 Glide Planes
We now consider a glide plane, n, perpendicular to the Y -axis. In the simplest case(i.e., when the plane also intersects the origin of coordinates), the equivalents of(9.31)–(9.34) become:
A1 =
⎛⎜⎜⎝
1 0 0 00 1 0 00 0 1 00 0 0 1
⎞⎟⎟⎠and A2 =
⎛⎜⎜⎝
1 0 0 1/20 −1 0 00 0 1 1/20 0 0 1
⎞⎟⎟⎠ (9.35)
2π(h ·x)1 = 2π(hx+ ky+ lz)2π(h ·x)2 = 2π(hx− ky+ lz)+π(h+ l)
(9.36)
cos[2π(hx+0y+ lz)]+ cos[2π(hx−0y+ lz)+π(h+ l)] = 0sin[2π(hx+0y+ lz)]+ sin[2π(hx−0y+ lz)+π(h+ l)] = 0
(9.37)
when h+ l = ±1, ±3, ±5, . . . = 2n + 1 and k = 0, while

9.3 Systematic Absences 223
Table 9.2 Combinations of indices which are allowed by various glide planes.
Glide plane Orientationa Reflection type Allowed reflectionsb
a (010) h0l h = 2n(001) hk0 h = 2n(110) hhl h = 2n
b (100) 0kl k = 2n(001) hk0 k = 2n
c (100) 0kl l = 2n(010) h0l l = 2n(110) hhl l = 2n(110) hhl l = 2n
d (100) 0kl k + l = 4n (k, l = 2n)(010) h0l h+ l = 4n (h, l = 2n)(001) hk0 h+ k = 4n (h,k = 2n)(110) hhl 2h+ l = 4n (l = 2n)
n (100) 0kl k + l = 2n(010) h0l h+ l = 2n(001) hk0 h+ k = 2n(110) hhl l = 2n
a The orientations are given as the crystallographic indices of the corresponding plane.b All other reflections are forbidden.
cos[2π(hx+0y+ lz)]+ cos[2π(hx−0y+ lz)+π(h+ l)] = 2cos[2π(hx+ lz)]sin[2π(hx+0y+ lz)]+ sin[2π(hx−0y+ lz)+π(h+ l)] = 2sin[2π(hx+ lz)]
(9.38)when h+ l = 0, ±2, ±4, . . . = 2n and k = 0. Note that (9.37) and (9.38) cannot besimplified when k �= 0.
Hence, Bragg peaks (h0l) in which the sum of h and l is odd should have zero-structure amplitude and zero intensity due to the presence of the glide plane n in thisorientation. Only Bragg peaks in which the sum of these Miller indices is even (i.e.,h+ l = 2n) may have nonzero intensity and be observed. We note that the presenceof this glide plane only affects Bragg peaks with k = 0 because of the change of thesign of ky in (9.36). Again, some (but not all) reflections h0l with h+ l = 2n may beabsent due to peculiarities of a crystal structure, not associated with the presence ofthe glide plane n, but no peaks with h+ l = 2n+1 can be observed.
Similar analyses may be performed for other types of glide planes in different ori-entations, and not necessarily traversing the origin of coordinates (as an exercise tryto derive the relationships between Miller indices of the systematically absent Braggpeaks for a glide plane, a, perpendicular to Y and Z directions). The relationshipsbetween allowed-Miller indices for various glide planes in different orientations areshown in Table 9.2.
9.3.3 Screw Axes
Consider a screw axis, 21, parallel to the Y -axis. The equivalents of (9.31)–(9.34)when the axis passes through the origin of coordinates are as follows:
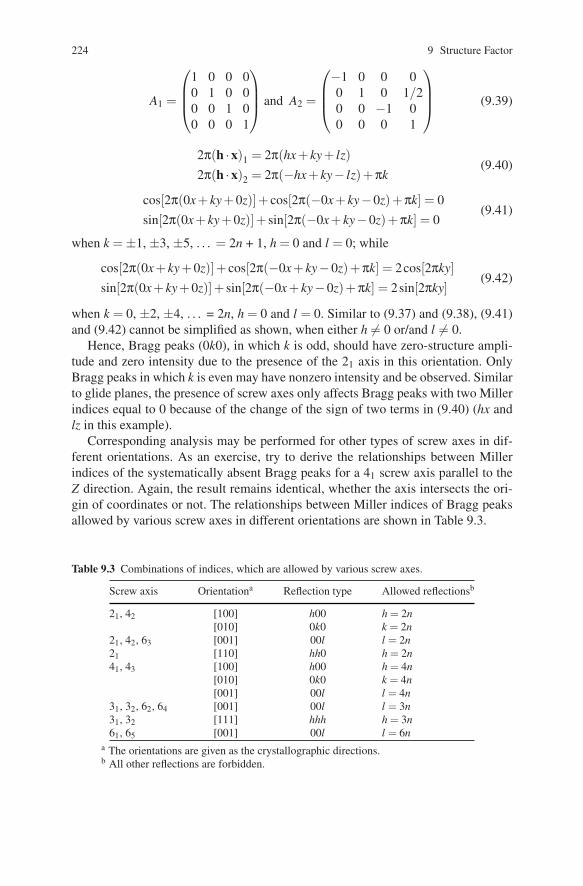
224 9 Structure Factor
A1 =
⎛⎜⎜⎝
1 0 0 00 1 0 00 0 1 00 0 0 1
⎞⎟⎟⎠ and A2 =
⎛⎜⎜⎝−1 0 0 00 1 0 1/20 0 −1 00 0 0 1
⎞⎟⎟⎠ (9.39)
2π(h ·x)1 = 2π(hx+ ky+ lz)2π(h ·x)2 = 2π(−hx+ ky− lz)+πk
(9.40)
cos[2π(0x+ ky+0z)]+ cos[2π(−0x+ ky−0z)+πk] = 0sin[2π(0x+ ky+0z)]+ sin[2π(−0x+ ky−0z)+πk] = 0
(9.41)
when k = ±1, ±3, ±5, . . . = 2n + 1, h = 0 and l = 0; while
cos[2π(0x+ ky+0z)]+ cos[2π(−0x+ ky−0z)+πk] = 2cos[2πky]sin[2π(0x+ ky+0z)]+ sin[2π(−0x+ ky−0z)+πk] = 2sin[2πky]
(9.42)
when k = 0, ±2, ±4, . . . = 2n, h = 0 and l = 0. Similar to (9.37) and (9.38), (9.41)and (9.42) cannot be simplified as shown, when either h �= 0 or/and l �= 0.
Hence, Bragg peaks (0k0), in which k is odd, should have zero-structure ampli-tude and zero intensity due to the presence of the 21 axis in this orientation. OnlyBragg peaks in which k is even may have nonzero intensity and be observed. Similarto glide planes, the presence of screw axes only affects Bragg peaks with two Millerindices equal to 0 because of the change of the sign of two terms in (9.40) (hx andlz in this example).
Corresponding analysis may be performed for other types of screw axes in dif-ferent orientations. As an exercise, try to derive the relationships between Millerindices of the systematically absent Bragg peaks for a 41 screw axis parallel to theZ direction. Again, the result remains identical, whether the axis intersects the ori-gin of coordinates or not. The relationships between Miller indices of Bragg peaksallowed by various screw axes in different orientations are shown in Table 9.3.
Table 9.3 Combinations of indices, which are allowed by various screw axes.
Screw axis Orientationa Reflection type Allowed reflectionsb
21, 42 [100] h00 h = 2n[010] 0k0 k = 2n
21, 42, 63 [001] 00l l = 2n21 [110] hh0 h = 2n41, 43 [100] h00 h = 4n
[010] 0k0 k = 4n[001] 00l l = 4n
31, 32, 62, 64 [001] 00l l = 3n31, 32 [111] hhh h = 3n61, 65 [001] 00l l = 6n
a The orientations are given as the crystallographic directions.b All other reflections are forbidden.
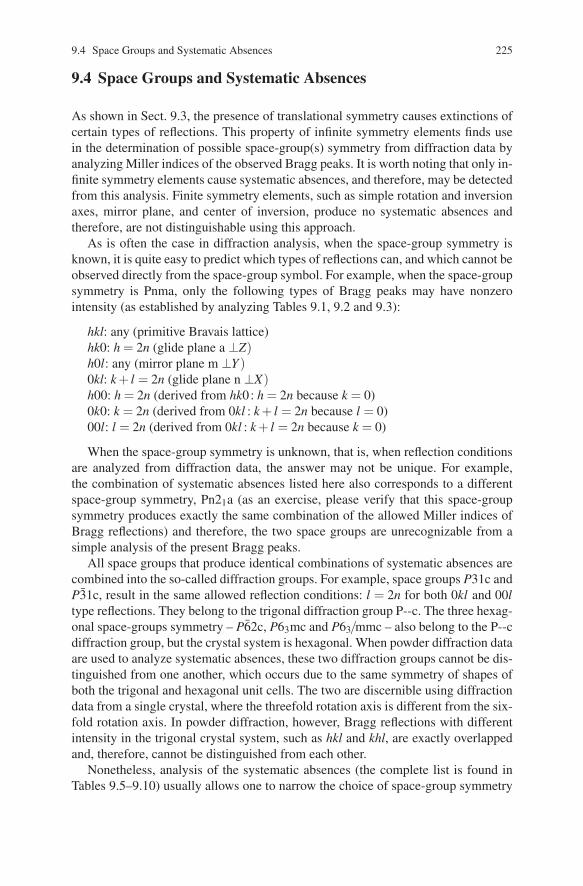
9.4 Space Groups and Systematic Absences 225
9.4 Space Groups and Systematic Absences
As shown in Sect. 9.3, the presence of translational symmetry causes extinctions ofcertain types of reflections. This property of infinite symmetry elements finds usein the determination of possible space-group(s) symmetry from diffraction data byanalyzing Miller indices of the observed Bragg peaks. It is worth noting that only in-finite symmetry elements cause systematic absences, and therefore, may be detectedfrom this analysis. Finite symmetry elements, such as simple rotation and inversionaxes, mirror plane, and center of inversion, produce no systematic absences andtherefore, are not distinguishable using this approach.
As is often the case in diffraction analysis, when the space-group symmetry isknown, it is quite easy to predict which types of reflections can, and which cannot beobserved directly from the space-group symbol. For example, when the space-groupsymmetry is Pnma, only the following types of Bragg peaks may have nonzerointensity (as established by analyzing Tables 9.1, 9.2 and 9.3):
hkl: any (primitive Bravais lattice)hk0: h = 2n (glide plane a ⊥Z)h0l: any (mirror plane m ⊥Y )0kl: k + l = 2n (glide plane n ⊥X)h00: h = 2n (derived from hk0: h = 2n because k = 0)0k0: k = 2n (derived from 0kl : k + l = 2n because l = 0)00l: l = 2n (derived from 0kl : k + l = 2n because k = 0)
When the space-group symmetry is unknown, that is, when reflection conditionsare analyzed from diffraction data, the answer may not be unique. For example,the combination of systematic absences listed here also corresponds to a differentspace-group symmetry, Pn21a (as an exercise, please verify that this space-groupsymmetry produces exactly the same combination of the allowed Miller indices ofBragg reflections) and therefore, the two space groups are unrecognizable from asimple analysis of the present Bragg peaks.
All space groups that produce identical combinations of systematic absences arecombined into the so-called diffraction groups. For example, space groups P31c andP31c, result in the same allowed reflection conditions: l = 2n for both 0kl and 00ltype reflections. They belong to the trigonal diffraction group P--c. The three hexag-onal space-groups symmetry – P62c, P63mc and P63/mmc – also belong to the P--cdiffraction group, but the crystal system is hexagonal. When powder diffraction dataare used to analyze systematic absences, these two diffraction groups cannot be dis-tinguished from one another, which occurs due to the same symmetry of shapes ofboth the trigonal and hexagonal unit cells. The two are discernible using diffractiondata from a single crystal, where the threefold rotation axis is different from the six-fold rotation axis. In powder diffraction, however, Bragg reflections with differentintensity in the trigonal crystal system, such as hkl and khl, are exactly overlappedand, therefore, cannot be distinguished from each other.
Nonetheless, analysis of the systematic absences (the complete list is found inTables 9.5–9.10) usually allows one to narrow the choice of space-group symmetry
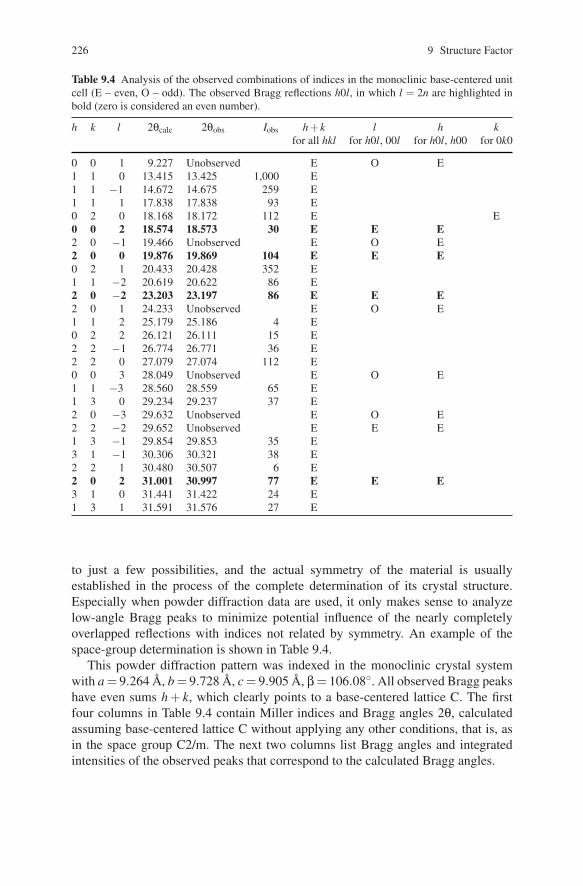
226 9 Structure Factor
Table 9.4 Analysis of the observed combinations of indices in the monoclinic base-centered unitcell (E – even, O – odd). The observed Bragg reflections h0l, in which l = 2n are highlighted inbold (zero is considered an even number).
h k l 2θcalc 2θobs Iobs h+ k l h kfor all hkl for h0l, 00l for h0l, h00 for 0k0
0 0 1 9.227 Unobserved E O E1 1 0 13.415 13.425 1,000 E1 1 −1 14.672 14.675 259 E1 1 1 17.838 17.838 93 E0 2 0 18.168 18.172 112 E E0 0 2 18.574 18.573 30 E E E2 0 −1 19.466 Unobserved E O E2 0 0 19.876 19.869 104 E E E0 2 1 20.433 20.428 352 E1 1 −2 20.619 20.622 86 E2 0 −2 23.203 23.197 86 E E E2 0 1 24.233 Unobserved E O E1 1 2 25.179 25.186 4 E0 2 2 26.121 26.111 15 E2 2 −1 26.774 26.771 36 E2 2 0 27.079 27.074 112 E0 0 3 28.049 Unobserved E O E1 1 −3 28.560 28.559 65 E1 3 0 29.234 29.237 37 E2 0 −3 29.632 Unobserved E O E2 2 −2 29.652 Unobserved E E E1 3 −1 29.854 29.853 35 E3 1 −1 30.306 30.321 38 E2 2 1 30.480 30.507 6 E2 0 2 31.001 30.997 77 E E E3 1 0 31.441 31.422 24 E1 3 1 31.591 31.576 27 E
to just a few possibilities, and the actual symmetry of the material is usuallyestablished in the process of the complete determination of its crystal structure.Especially when powder diffraction data are used, it only makes sense to analyzelow-angle Bragg peaks to minimize potential influence of the nearly completelyoverlapped reflections with indices not related by symmetry. An example of thespace-group determination is shown in Table 9.4.
This powder diffraction pattern was indexed in the monoclinic crystal systemwith a = 9.264 A, b = 9.728 A, c = 9.905 A, β= 106.08◦. All observed Bragg peakshave even sums h + k, which clearly points to a base-centered lattice C. The firstfour columns in Table 9.4 contain Miller indices and Bragg angles 2θ, calculatedassuming base-centered lattice C without applying any other conditions, that is, asin the space group C2/m. The next two columns list Bragg angles and integratedintensities of the observed peaks that correspond to the calculated Bragg angles.
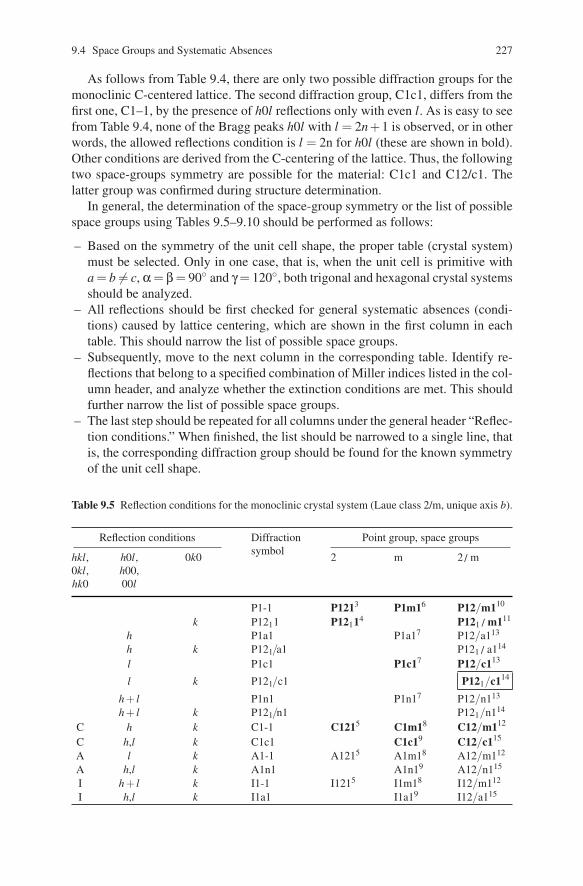
9.4 Space Groups and Systematic Absences 227
As follows from Table 9.4, there are only two possible diffraction groups for themonoclinic C-centered lattice. The second diffraction group, C1c1, differs from thefirst one, C1–1, by the presence of h0l reflections only with even l. As is easy to seefrom Table 9.4, none of the Bragg peaks h0l with l = 2n+1 is observed, or in otherwords, the allowed reflections condition is l = 2n for h0l (these are shown in bold).Other conditions are derived from the C-centering of the lattice. Thus, the followingtwo space-groups symmetry are possible for the material: C1c1 and C12/c1. Thelatter group was confirmed during structure determination.
In general, the determination of the space-group symmetry or the list of possiblespace groups using Tables 9.5–9.10 should be performed as follows:
– Based on the symmetry of the unit cell shape, the proper table (crystal system)must be selected. Only in one case, that is, when the unit cell is primitive witha = b �= c, α= β= 90◦ and γ= 120◦, both trigonal and hexagonal crystal systemsshould be analyzed.
– All reflections should be first checked for general systematic absences (condi-tions) caused by lattice centering, which are shown in the first column in eachtable. This should narrow the list of possible space groups.
– Subsequently, move to the next column in the corresponding table. Identify re-flections that belong to a specified combination of Miller indices listed in the col-umn header, and analyze whether the extinction conditions are met. This shouldfurther narrow the list of possible space groups.
– The last step should be repeated for all columns under the general header “Reflec-tion conditions.” When finished, the list should be narrowed to a single line, thatis, the corresponding diffraction group should be found for the known symmetryof the unit cell shape.
Table 9.5 Reflection conditions for the monoclinic crystal system (Laue class 2/m, unique axis b).
Reflection conditions Diffraction Point group, space groups
hkl, h0l, symbol
0kl, h00,0k0 2 m 2/ m
hk0 00l
P1-1 P1213 P1m16 P12/m110
k P1211 P12114 P121 / m111
h P1a1 P1a17 P12/a113
h k P121/a1 P121 / a114
l P1c1 P1c17 P12/c113
l k P121/c1 P121/c114
h+ l P1n1 P1n17 P12/n113
h+ l k P121/n1 P121/n114
C h k C1-1 C1215 C1m18 C12/m112
C h,l k C1c1 C1c19 C12/c115
A l k A1-1 A1215 A1m18 A12/m112
A h,l k A1n1 A1n19 A12/n115
I h+ l k I1-1 I1215 I1m18 I12/m112
I h,l k I1a1 I1a19 I12/a115

228 9 Structure Factor
Table 9.6 Reflection conditions for the orthorhombic crystal system (Laue class mmm).
Reflection conditions Diffraction Point group, space groups
hkl 0kl h0l hk0 h00 0k0 00l symbol 222 mm2 mmmm2m2mm
P--- P22216 Pmm225 Pmmm47
Pm2m25
P2mm25
l P--21 P222171
k P-21- P221217
k l P-2121 P2212181
h P21-- P212217
h l P21-21 P2122181
h k P2121- P2121218
P21212191
h k l P212121h h P--a Pm2a28
P21ma26 Pmma51
k k P--b Pm21b26
P2mb28 Pmmb51
h+k h k P--n Pm21n31
P21mn31 Pmmn59
h h P-a- Pma228 Pmam51
P21am26
h h h P-aa P2aa27 Pmaa49
h k h k P-ab P21ab29 Pmab57
h h+k h k P-an P2an30 Pman53
l l P-c- Pmc2261
P2cm28 Pmcm51
l h h l P-ca P21ca29 Pmca57
l k k l P-cb P2cb32 Pmcb55
l h+k h k l P-cn P21cn33 Pmcn62
h+ l h l P-n- Pmn2311
P21nm31 Pmnm59
h+ l h h l P-na P2na30 Pmna53
h+ l k h k l P-nb P21nb33 Pmnb62
h+ l h+k h k l P-nn P2nn34 Pmnn58
k k Pb-- Pbm228
Pb21m26 Pbmm51
k h h k Pb-a Pb21a29 Pnma57
k k k Pb-b Pb2b27 Pbmb49
k h+k h k Pb-n Pb2n30 Pbmn53
k h h k Pba- Pba232 Pbam55
k h h h k Pbaa Pbaa54
k h k h k Pbab Pbab54
k h h+k h k Pban Pban50
k l k l Pbc- Pbc2291 Pbcm57
k l h h k l Pbca Pbca61
k l k k l Pbcb Pbcb54
k l h+k h k l Pbcn Pbcn60
(Continued)
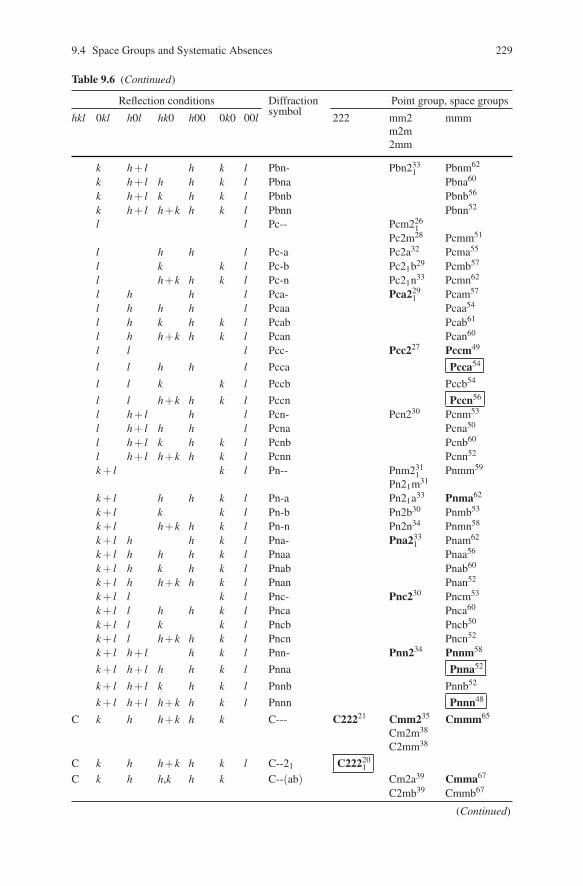
9.4 Space Groups and Systematic Absences 229
Table 9.6 (Continued)
Reflection conditions Diffraction Point group, space groups
hkl 0kl h0l hk0 h00 0k0 00l symbol 222 mm2 mmmm2m2mm
k h+ l h k l Pbn- Pbn2331 Pbnm62
k h+ l h h k l Pbna Pbna60
k h+ l k h k l Pbnb Pbnb56
k h+ l h+k h k l Pbnn Pbnn52
l l Pc-- Pcm2261
Pc2m28 Pcmm51
l h h l Pc-a Pc2a32 Pcma55
l k k l Pc-b Pc21b29 Pcmb57
l h+k h k l Pc-n Pc21n33 Pcmn62
l h h l Pca- Pca2291 Pcam57
l h h h l Pcaa Pcaa54
l h k h k l Pcab Pcab61
l h h+k h k l Pcan Pcan60
l l l Pcc- Pcc227 Pccm49
l l h h l Pcca Pcca54
l l k k l Pccb Pccb54
l l h+k h k l Pccn Pccn56
l h+ l h l Pcn- Pcn230 Pcnm53
l h+ l h h l Pcna Pcna50
l h+ l k h k l Pcnb Pcnb60
l h+ l h+k h k l Pcnn Pcnn52
k + l k l Pn-- Pnm2311 Pnmm59
Pn21m31
k + l h h k l Pn-a Pn21a33 Pnma62
k + l k k l Pn-b Pn2b30 Pnmb53
k + l h+k h k l Pn-n Pn2n34 Pnmn58
k + l h h k l Pna- Pna2331 Pnam62
k + l h h h k l Pnaa Pnaa56
k + l h k h k l Pnab Pnab60
k + l h h+k h k l Pnan Pnan52
k + l l k l Pnc- Pnc230 Pncm53
k + l l h h k l Pnca Pnca60
k + l l k k l Pncb Pncb50
k + l l h+k h k l Pncn Pncn52
k + l h+ l h k l Pnn- Pnn234 Pnnm58
k + l h+ l h h k l Pnna Pnna52
k + l h+ l k h k l Pnnb Pnnb52
k + l h+ l h+k h k l Pnnn Pnnn48
C k h h+k h k C--- C22221 Cmm235 Cmmm65
Cm2m38
C2mm38
C k h h+k h k l C--21 C222201
C k h h,k h k C--(ab) Cm2a39 Cmma67
C2mb39 Cmmb67
(Continued)
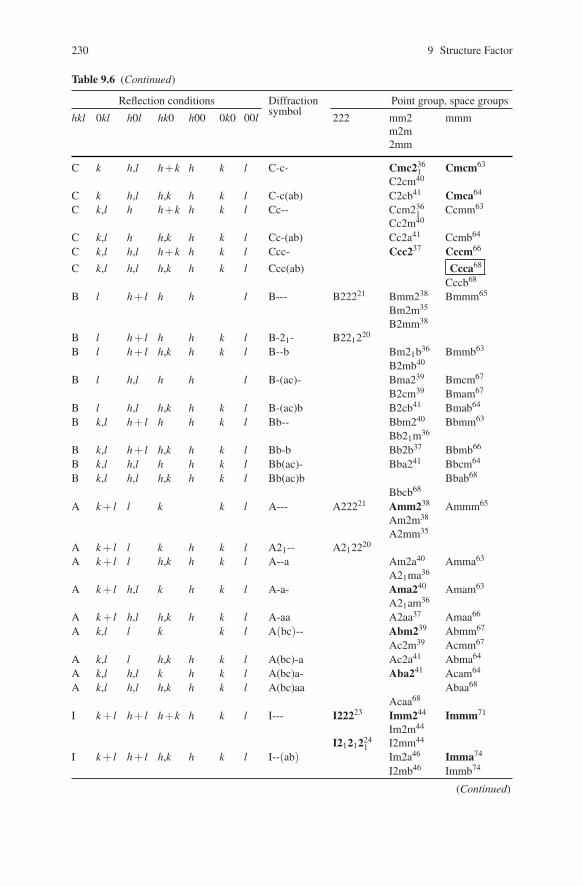
230 9 Structure Factor
Table 9.6 (Continued)
Reflection conditions Diffraction Point group, space groups
hkl 0kl h0l hk0 h00 0k0 00l symbol 222 mm2 mmmm2m2mm
C k h,l h+k h k l C-c- Cmc2361 Cmcm63
C2cm40
C k h,l h,k h k l C-c(ab) C2cb41 Cmca64
C k,l h h+k h k l Cc-- Ccm2361 Ccmm63
Cc2m40
C k,l h h,k h k l Cc-(ab) Cc2a41 Ccmb64
C k,l h,l h+k h k l Ccc- Ccc237 Cccm66
C k,l h,l h,k h k l Ccc(ab) Ccca68
Cccb68
B l h+ l h h l B--- B22221 Bmm238 Bmmm65
Bm2m35
B2mm38
B l h+ l h h k l B-21- B221220
B l h+ l h,k h k l B--b Bm21b36 Bmmb63
B2mb40
B l h,l h h l B-(ac)- Bma239 Bmcm67
B2cm39 Bmam67
B l h,l h,k h k l B-(ac)b B2cb41 Bmab64
B k,l h+ l h h k l Bb-- Bbm240 Bbmm63
Bb21m36
B k,l h+ l h,k h k l Bb-b Bb2b37 Bbmb66
B k,l h,l h h k l Bb(ac)- Bba241 Bbcm64
B k,l h,l h,k h k l Bb(ac)b Bbab68
Bbcb68
A k + l l k k l A--- A22221 Amm238 Ammm65
Am2m38
A2mm35
A k + l l k h k l A21-- A212220
A k + l l h,k h k l A--a Am2a40 Amma63
A21ma36
A k + l h,l k h k l A-a- Ama240 Amam63
A21am36
A k + l h,l h,k h k l A-aa A2aa37 Amaa66
A k,l l k k l A(bc)-- Abm239 Abmm67
Ac2m39 Acmm67
A k,l l h,k h k l A(bc)-a Ac2a41 Abma64
A k,l h,l k h k l A(bc)a- Aba241 Acam64
A k,l h,l h,k h k l A(bc)aa Abaa68
Acaa68
I k + l h+ l h+k h k l I--- I22223 Imm244 Immm71
Im2m44
I21212241 I2mm44
I k + l h+ l h,k h k l I--(ab) Im2a46 Imma74
I2mb46 Immb74
(Continued)
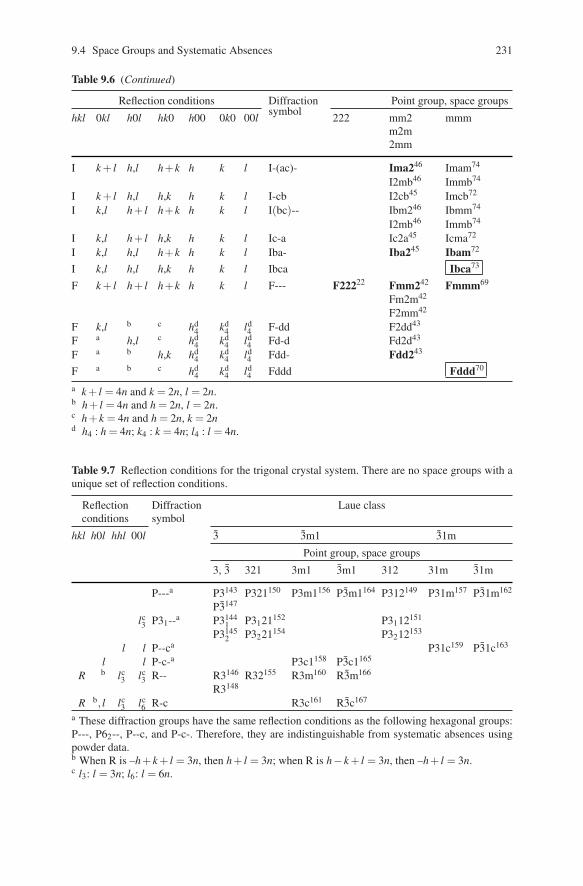
9.4 Space Groups and Systematic Absences 231
Table 9.6 (Continued)
Reflection conditions Diffraction Point group, space groups
hkl 0kl h0l hk0 h00 0k0 00l symbol 222 mm2 mmmm2m2mm
I k + l h,l h+k h k l I-(ac)- Ima246 Imam74
I2mb46 Immb74
I k + l h,l h,k h k l I-cb I2cb45 Imcb72
I k,l h+ l h+k h k l I(bc)-- Ibm246 Ibmm74
I2mb46 Immb74
I k,l h+ l h,k h k l Ic-a Ic2a45 Icma72
I k,l h,l h+k h k l Iba- Iba245 Ibam72
I k,l h,l h,k h k l Ibca Ibca73
F k + l h+ l h+k h k l F--- F22222 Fmm242 Fmmm69
Fm2m42
F2mm42
F k,l b c hd4 kd
4 ld4 F-dd F2dd43
F a h,l c hd4 kd
4 ld4 Fd-d Fd2d43
F a b h,k hd4 kd
4 ld4 Fdd- Fdd243
F a b c hd4 kd
4 ld4 Fddd Fddd70
a k + l = 4n and k = 2n, l = 2n.b h+ l = 4n and h = 2n, l = 2n.c h+ k = 4n and h = 2n, k = 2nd h4 : h = 4n; k4 : k = 4n; l4 : l = 4n.
Table 9.7 Reflection conditions for the trigonal crystal system. There are no space groups with aunique set of reflection conditions.
Reflectionconditions
Diffractionsymbol
Laue class
hkl h0l hhl 00l 3 3m1 31m
Point group, space groups
3, 3 321 3m1 3m1 312 31m 31m
P---a P3143 P321150 P3m1156 P3m1164 P312149 P31m157 P31m162
P3147
lc3 P31--a P3144
1 P3121152 P3112151
P31452 P3221154 P3212153
l l P--ca P31c159 P31c163
l l P-c-a P3c1158 P3c1165
R b lc3 lc
3 R-- R3146 R32155 R3m160 R3m166
R3148
R b, l lc3 lc
6 R-c R3c161 R3c167
a These diffraction groups have the same reflection conditions as the following hexagonal groups:P---, P62--, P--c, and P-c-. Therefore, they are indistinguishable from systematic absences usingpowder data.b When R is –h+ k + l = 3n, then h+ l = 3n; when R is h− k + l = 3n, then –h+ l = 3n.c l3: l = 3n; l6: l = 6n.
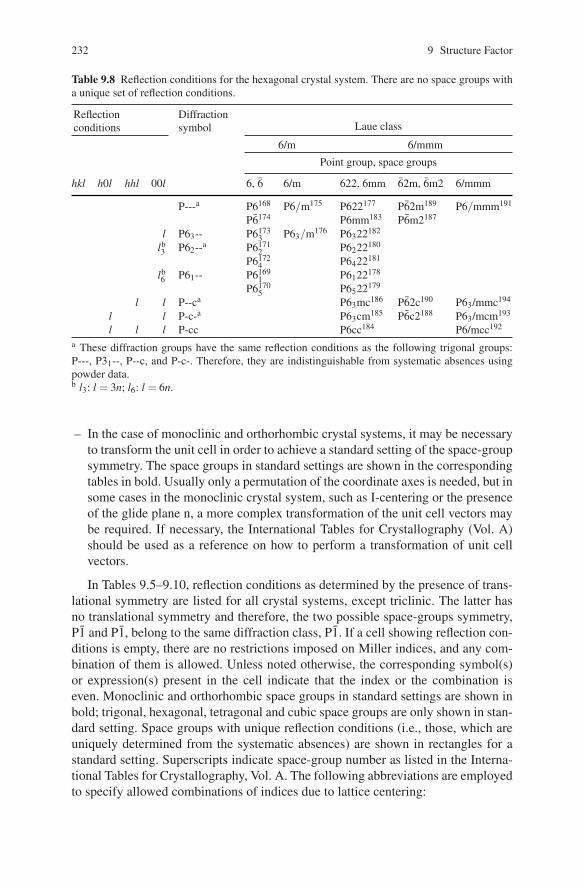
232 9 Structure Factor
Table 9.8 Reflection conditions for the hexagonal crystal system. There are no space groups witha unique set of reflection conditions.
Reflectionconditions
Diffractionsymbol Laue class
6/m 6/mmm
Point group, space groups
hkl h0l hhl 00l 6, 6 6/m 622, 6mm 62m, 6m2 6/mmm
P---a P6168 P6/m175 P622177 P62m189 P6/mmm191
P6174 P6mm183 P6m2187
l P63-- P61733 P63/m176 P6322182
lb3 P62--a P6171
2 P6222180
P61724 P6422181
lb6 P61-- P6169
1 P6122178
P61705 P6522179
l l P--ca P63mc186 P62c190 P63/mmc194
l l P-c-a P63cm185 P6c2188 P63/mcm193
l l l P-cc P6cc184 P6/mcc192
a These diffraction groups have the same reflection conditions as the following trigonal groups:P---, P31--, P--c, and P-c-. Therefore, they are indistinguishable from systematic absences usingpowder data.b l3: l = 3n; l6: l = 6n.
– In the case of monoclinic and orthorhombic crystal systems, it may be necessaryto transform the unit cell in order to achieve a standard setting of the space-groupsymmetry. The space groups in standard settings are shown in the correspondingtables in bold. Usually only a permutation of the coordinate axes is needed, but insome cases in the monoclinic crystal system, such as I-centering or the presenceof the glide plane n, a more complex transformation of the unit cell vectors maybe required. If necessary, the International Tables for Crystallography (Vol. A)should be used as a reference on how to perform a transformation of unit cellvectors.
In Tables 9.5–9.10, reflection conditions as determined by the presence of trans-lational symmetry are listed for all crystal systems, except triclinic. The latter hasno translational symmetry and therefore, the two possible space-groups symmetry,P1 and P1, belong to the same diffraction class, P1. If a cell showing reflection con-ditions is empty, there are no restrictions imposed on Miller indices, and any com-bination of them is allowed. Unless noted otherwise, the corresponding symbol(s)or expression(s) present in the cell indicate that the index or the combination iseven. Monoclinic and orthorhombic space groups in standard settings are shown inbold; trigonal, hexagonal, tetragonal and cubic space groups are only shown in stan-dard setting. Space groups with unique reflection conditions (i.e., those, which areuniquely determined from the systematic absences) are shown in rectangles for astandard setting. Superscripts indicate space-group number as listed in the Interna-tional Tables for Crystallography, Vol. A. The following abbreviations are employedto specify allowed combinations of indices due to lattice centering:
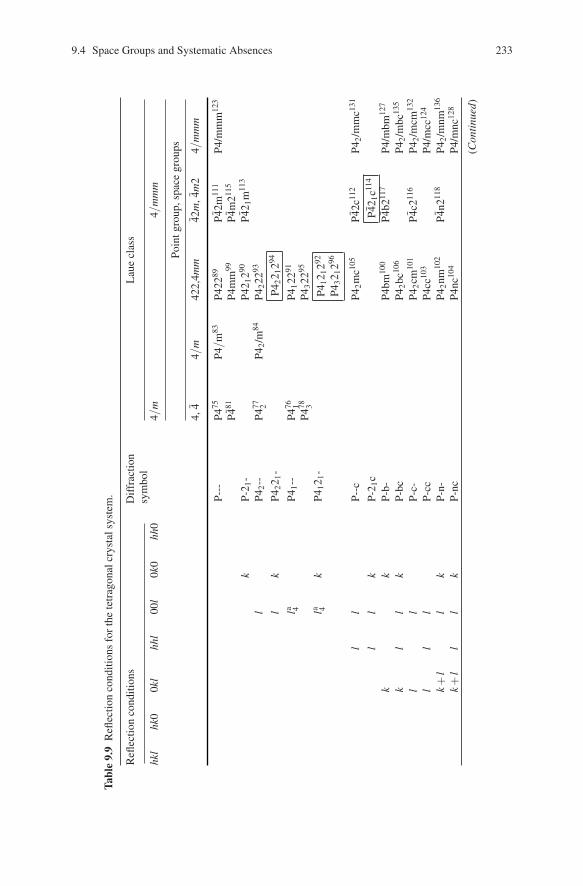
9.4 Space Groups and Systematic Absences 233
Tabl
e9.
9R
eflec
tion
cond
ition
sfo
rthe
tetr
agon
alcr
ysta
lsys
tem
.
Refl
ectio
nco
nditi
ons
Diff
ract
ion
sym
bol
Lau
ecl
ass
hkl
hk0
0kl
hhl
00l
0k0
hh0
4/m
4/m
mm
Poin
tgro
up,s
pace
grou
ps
4,4
4/m
422,
4mm
42m
,4m
24/
mm
m
P---
P475
P481
P4/m
83P4
2289
P4m
m99
P42m
111
P4m
2115
P4/m
mm
123
kP-
2 1-
P42 1
290P4
2 1m
113
lP4
2--
P477 2
P42/
m84
P422
293
lk
P422
1-P4
2212
94
la 4P4
1--
P476 1
P478 3
P412
291
P432
295
la 4k
P412
1-P4
1212
92
P432
1296
ll
P--c
P42m
c105
P42c
112
P42/
mm
c131
ll
kP-
2 1c
P42 1
c114
kk
P-b-
P4bm
100
P4b2
117
P4/m
bm12
7
kl
lk
P-bc
P42b
c106
P42/
mbc
135
ll
P-c-
P42c
m10
1P4
c211
6P4
2/m
cm13
2
ll
lP-
ccP4
cc10
3P4
/mcc
124
k+
ll
kP-
n-P4
2nm
102
P4n2
118
P42/
mnm
136
k+
ll
lk
P-nc
P4nc
104
P4/m
nc12
8
(Con
tinue
d)

234 9 Structure Factor
Tabl
e9.
9(C
ontin
ued)
Refl
ectio
nco
nditi
ons
Diff
ract
ion
sym
bol
Lau
ecl
ass
hkl
hk0
0kl
hhl
00l
0k0
hh0
4/m
4/m
mm
Poin
tgro
up,s
pace
grou
ps
4,4
4/m
422,
4mm
42m
,4m
24/
mm
m
h+
kk
Pn--
P4/n
85P4
/nm
m12
9
h+
kl
kP4
2/n-
-P4
2/n86
h+
kl
lk
Pn-c
P42/
nmc13
7
P4/n
bm12
5
P42/
nbc13
3
P42/
ncm
138
P4/n
cc13
0
P42/
nnm
134
P4/n
nc12
6
h+
kk
kPn
b-h+
kk
ll
kPn
bch+
kl
lk
Pnc-
h+
kl
ll
kPn
cch+
kk+
ll
kPn
n-h+
kk+
ll
lk
Pnnc
Ih+
kk+
ll
lk
I---
I479
I482
I4/m
87I4
2297
I4m
m10
7I4
2m12
1
I4m
2119
I4/m
mm
139
Ih+
kk+
ll
la 4k
I41-
-I4
80 1I4
12298
Ih+
kk+
lb
la 4k
hI-
-dI4
1md10
9I4
2d12
2
Ih+
kk,
ll
lk
I-c-
I4cm
108
I4c2
120
I4/m
cm14
0
Ih+
kk,
lb
la 4k
hI-
cdI4
1cd11
0
Ih,
kk+
ll
la 4k
I41/
a--
I41/
a88
Ih,
kk+
lb
la 4k
hIa
-dI4
1/am
d141
I41/
acd14
2
Ih,
kk,
lb
la 4k
hIa
cda
l 4:l
=4n
.b
2h+
l=4n
;l=
2n.
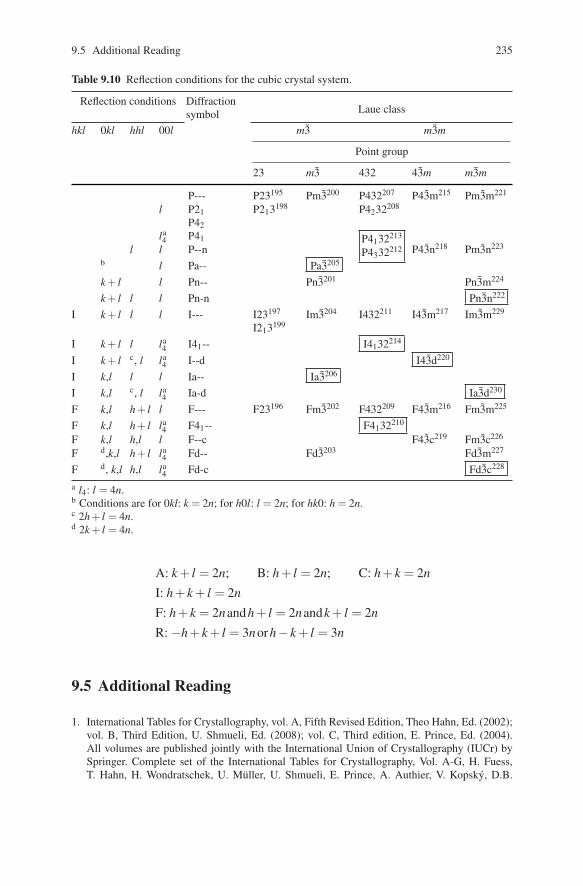
9.5 Additional Reading 235
Table 9.10 Reflection conditions for the cubic crystal system.
Reflection conditions Diffractionsymbol Laue class
hkl 0kl hhl 00l m3 m3m
Point group
23 m3 432 43m m3m
P--- P23195 Pm3200 P432207 P43m215 Pm3m221
l P21P42
P213198 P4232208
la4 P41 P4132213
P4332212l l P--n P43n218 Pm3n223
b l Pa-- Pa3205
k + l l Pn-- Pn3201 Pn3m224
k + l l l Pn-n Pn3n222
I k + l l l I--- I23197
I213199Im3204 I432211 I43m217 Im3m229
I k + l l la4 I41-- I4132214
I k + l c, l la4 I--d I43d220
I k,l l l Ia-- Ia3206
I k,l c, l la4 Ia-d Ia3d230
F k,l h+ l l F--- F23196 Fm3202 F432209 F43m216 Fm3m225
F k,l h+ l la4 F41-- F4132210
F k,l h,l l F--c F43c219 Fm3c226
F d,k,l h+ l la4 Fd-- Fd3203 Fd3m227
F d, k,l h,l la4 Fd-c Fd3c228
a l4: l = 4n.b Conditions are for 0kl: k = 2n; for h0l: l = 2n; for hk0: h = 2n.c 2h+ l = 4n.d 2k + l = 4n.
A: k + l = 2n; B: h+ l = 2n; C: h+ k = 2n
I: h+ k + l = 2n
F: h+ k = 2nandh+ l = 2nandk + l = 2n
R: −h+ k + l = 3norh− k + l = 3n
9.5 Additional Reading
1. International Tables for Crystallography, vol. A, Fifth Revised Edition, Theo Hahn, Ed. (2002);vol. B, Third Edition, U. Shmueli, Ed. (2008); vol. C, Third edition, E. Prince, Ed. (2004).All volumes are published jointly with the International Union of Crystallography (IUCr) bySpringer. Complete set of the International Tables for Crystallography, Vol. A-G, H. Fuess,T. Hahn, H. Wondratschek, U. Muller, U. Shmueli, E. Prince, A. Authier, V. Kopsky, D.B.
236 9 Structure Factor
Litvin, M.G. Rossmann, E. Arnold, S. Hall, and B. McMahon, Eds., is available online aseReference at http://www.springeronline.com.
2. Modern powder diffraction. D.L Bish and J.E. Post, Eds. Reviews in Mineralogy, Vol. 20. Min-eralogical Society of America, Washington, DC (1989).
3. R. Jenkins and R.L. Snyder, Introduction to X-ray powder diffractometry. Wiley, New York(1996).
4. J. Als-Nielsen and D. McMorrow, Elements of modern X-ray physics, Wiley, New York, (2001).5. W. Clegg, Synchrotron chemical crystallography. J. Chem. Soc., Dalton Trans. 19, 3223 (2000).
9.6 Problems
1. A student collected a powder diffraction pattern from an organometallic com-pound on a standard powder diffractometer equipped with a sealed Cu Kα X-raytube. She noticed that scattered intensity decays rapidly and she could not see anyBragg peaks beyond 2θ= 60◦. Her goal is to have reliable intensities at 90◦ or higherof 2θ. She thinks for a minute and then calls the crystallography lab at her universityto schedule time on one of their units. The lab has three powder diffractometers, allequipped with Cu Kα X-ray tubes: a rotating anode unit operating at ambient en-vironment, and two sealed tube units, one with a cryogenic attachment (the lowesttemperature is 77 K), and another with a furnace (the highest temperature 1,100 K).The student asked for time on which unit and why?
2. Consider Fig. 10.1 in Chap. 10, which shows powder diffraction patterns col-lected from the same material (CeRhGe3) at room temperature (T ∼= 295K) usingX-rays and at T = 200 K using neutrons. Setting aside differences between intensi-ties of individual Bragg peaks, the most obvious overall difference between the twosets of diffraction data is that diffracted intensity is only slightly suppressed towardhigh Bragg angles (sinθ/λ) in neutron diffraction, while it is considerably lower inthe case of X-ray data. Can you explain why?
3. Establish which combinations of indices are allowed and which are forbidden inthe space-group symmetry Cmc21. List symmetry elements that cause each groupof reflections to become extinct?
4. Powder diffraction pattern of a compound with unknown crystal structure was in-dexed with the following unit cell parameters (shown approximately): a = 10.34 A,b = 6.02 A, c = 4.70 A, α = 90◦, β = 90◦ and γ = 90◦. The list of all Bragg peaksobserved from 15◦– 60◦ 2θ is shown in Table 9.11. Analyze systematic absences (ifany) present in this powder diffraction pattern, and suggest possible space-groupssymmetry for the material.
5. Powder diffraction pattern of a compound with an unknown crystal structure wasindexed with the following unit cell parameters: a = b = 4.07 A, c = 16.3 A, α= β=90◦, γ = 120◦. The list of all Bragg peaks observed from 2◦ to 120◦ 2θ is shown inTable 9.12. Analyze systematic absences (if any) present in this powder diffractionpattern, and suggest possible space-groups symmetry for the material.
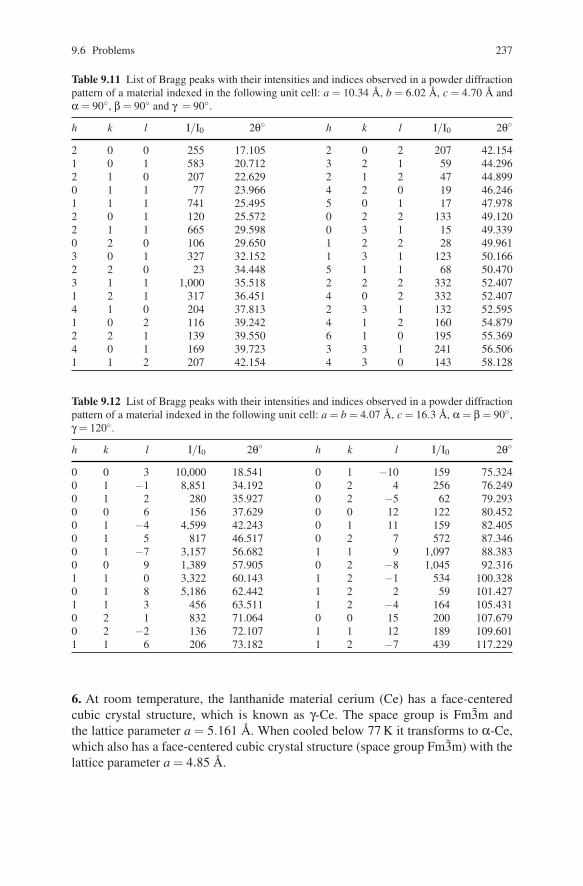
9.6 Problems 237
Table 9.11 List of Bragg peaks with their intensities and indices observed in a powder diffractionpattern of a material indexed in the following unit cell: a = 10.34 A, b = 6.02 A, c = 4.70 A andα = 90◦, β = 90◦ and γ = 90◦.
h k l I/I0 2θ◦ h k l I/I0 2θ◦
2 0 0 255 17.105 2 0 2 207 42.1541 0 1 583 20.712 3 2 1 59 44.2962 1 0 207 22.629 2 1 2 47 44.8990 1 1 77 23.966 4 2 0 19 46.2461 1 1 741 25.495 5 0 1 17 47.9782 0 1 120 25.572 0 2 2 133 49.1202 1 1 665 29.598 0 3 1 15 49.3390 2 0 106 29.650 1 2 2 28 49.9613 0 1 327 32.152 1 3 1 123 50.1662 2 0 23 34.448 5 1 1 68 50.4703 1 1 1,000 35.518 2 2 2 332 52.4071 2 1 317 36.451 4 0 2 332 52.4074 1 0 204 37.813 2 3 1 132 52.5951 0 2 116 39.242 4 1 2 160 54.8792 2 1 139 39.550 6 1 0 195 55.3694 0 1 169 39.723 3 3 1 241 56.5061 1 2 207 42.154 4 3 0 143 58.128
Table 9.12 List of Bragg peaks with their intensities and indices observed in a powder diffractionpattern of a material indexed in the following unit cell: a = b = 4.07 A, c = 16.3 A, α = β = 90◦,γ = 120◦.
h k l I/I0 2θ◦ h k l I/I0 2θ◦
0 0 3 10,000 18.541 0 1 −10 159 75.3240 1 −1 8,851 34.192 0 2 4 256 76.2490 1 2 280 35.927 0 2 −5 62 79.2930 0 6 156 37.629 0 0 12 122 80.4520 1 −4 4,599 42.243 0 1 11 159 82.4050 1 5 817 46.517 0 2 7 572 87.3460 1 −7 3,157 56.682 1 1 9 1,097 88.3830 0 9 1,389 57.905 0 2 −8 1,045 92.3161 1 0 3,322 60.143 1 2 −1 534 100.3280 1 8 5,186 62.442 1 2 2 59 101.4271 1 3 456 63.511 1 2 −4 164 105.4310 2 1 832 71.064 0 0 15 200 107.6790 2 −2 136 72.107 1 1 12 189 109.6011 1 6 206 73.182 1 2 −7 439 117.229
6. At room temperature, the lanthanide material cerium (Ce) has a face-centeredcubic crystal structure, which is known as γ-Ce. The space group is Fm3m andthe lattice parameter a = 5.161 A. When cooled below 77 K it transforms to α-Ce,which also has a face-centered cubic crystal structure (space group Fm3m) with thelattice parameter a = 4.85 A.

238 9 Structure Factor
(a) Calculate Bragg angles (2θ) for all Bragg peaks that may be observed between0 and 100◦ 2θ using Cu Kα radiation λ = 1.54178 A for both α- and γ-Ce.
(b) Sketch diagrams of both diffraction patterns indicating only the positions of pos-sible diffraction peaks.
(c) Discuss the differences between the two diffraction patterns (if any) you expectto see when the actual diffraction patterns are collected.