Embed Size (px)
Citation preview

LIVING IN THE ENVIRONMENT 17TH MILLER/SPOOLMAN
Chapter 6
The Human Population and Its Impact

6-1 How Many People Can the Earth Support?
• Concept 6-1 We do not know how long we can continue increasing the earth’s carrying capacity for humans without seriously degrading the life-support system that keeps us and many other species alive.

Core Case Study: Slowing Population
Growth in China: A Success Story
• 1.3 billion people
• Promotes one-child families
• Contraception, abortion, sterilization
• Fast-growing economy
• Serious resource and environmental problems
Crowded Street in China
Fig. 6-1, p. 125

Human Population Growth Continues but It Is Unevenly Distributed (1)
• Reasons for human population increase • Movement into new habitats and climate zones
• Early and modern agriculture methods
• Control of infectious diseases through • Sanitation systems
• Antibiotics
• Vaccines
• Health care
• Most population growth over last 100 years due to drop in death rates

Human Population Growth Continues but It Is Unevenly Distributed (2)
• Population growth in developing countries is increasing 9 times faster than developed countries
• 2050
• 95% of growth in developing countries
• 7.8-10.8 billion people
• Should the optimum sustainable population be based on cultural carrying capacity?

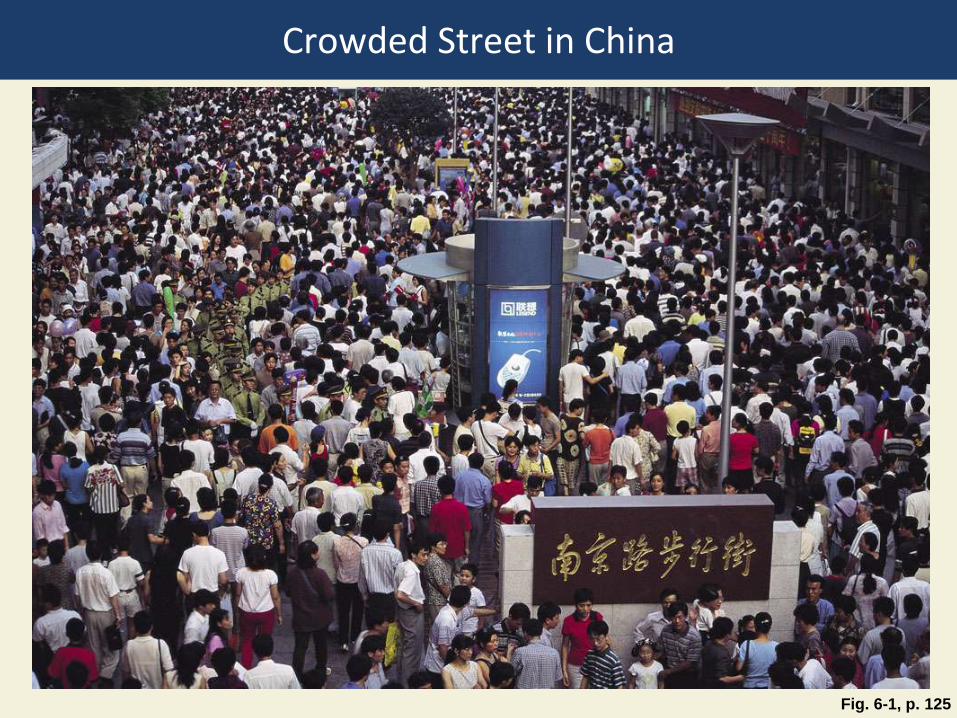
Human Population Growth
Fig. 1-18, p. 21
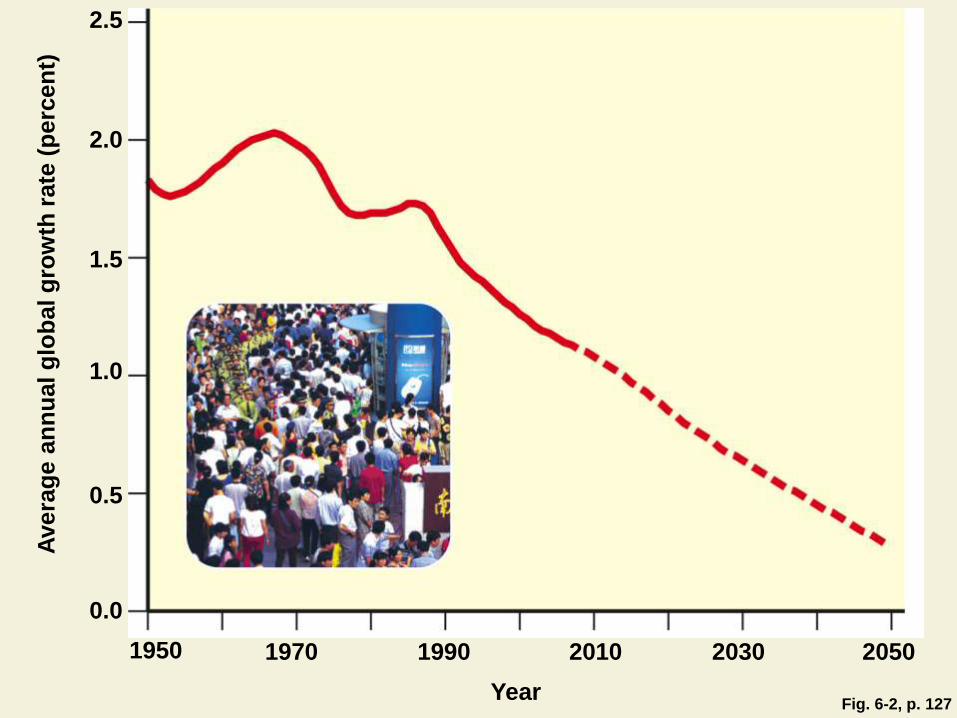
Fig. 6-2, p. 127
2.5
2.0
1.5
1.0
0.5
Ave
rag
e a
nn
ual g
lob
al g
row
th r
ate
(p
erc
en
t)
0.0
1970 1990 2010 2030 2050
Year
1950

Population Time Line: 10,000 BC - 2042
Figure 3, Supplement 9

Annual Growth Rate of World Population, 1950-2010
Fig. 6-2, p. 127
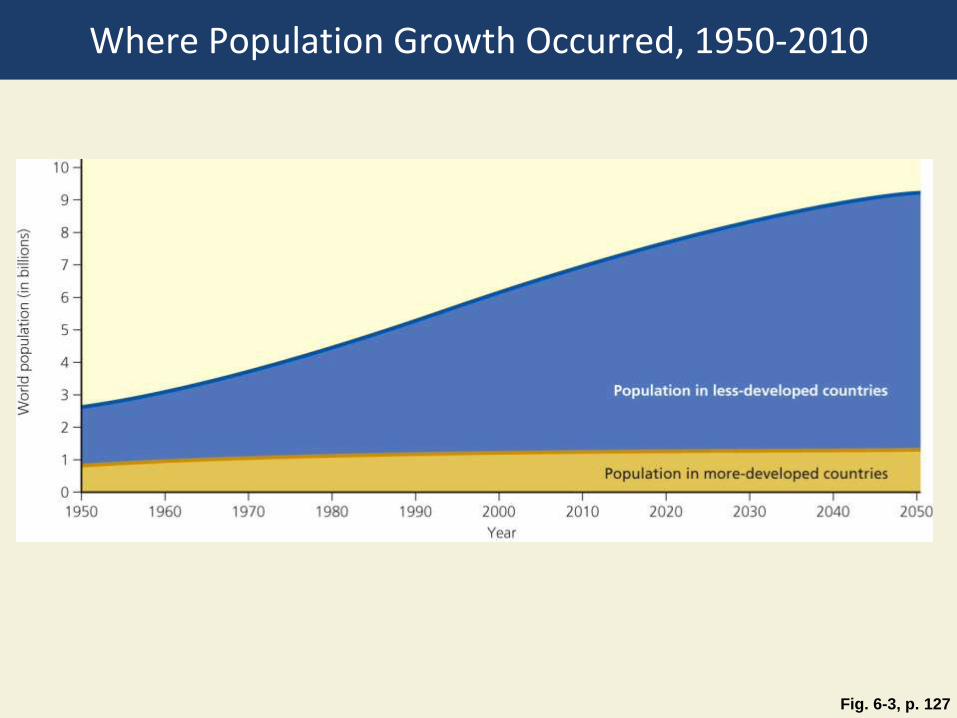
Where Population Growth Occurred, 1950-2010
Fig. 6-3, p. 127
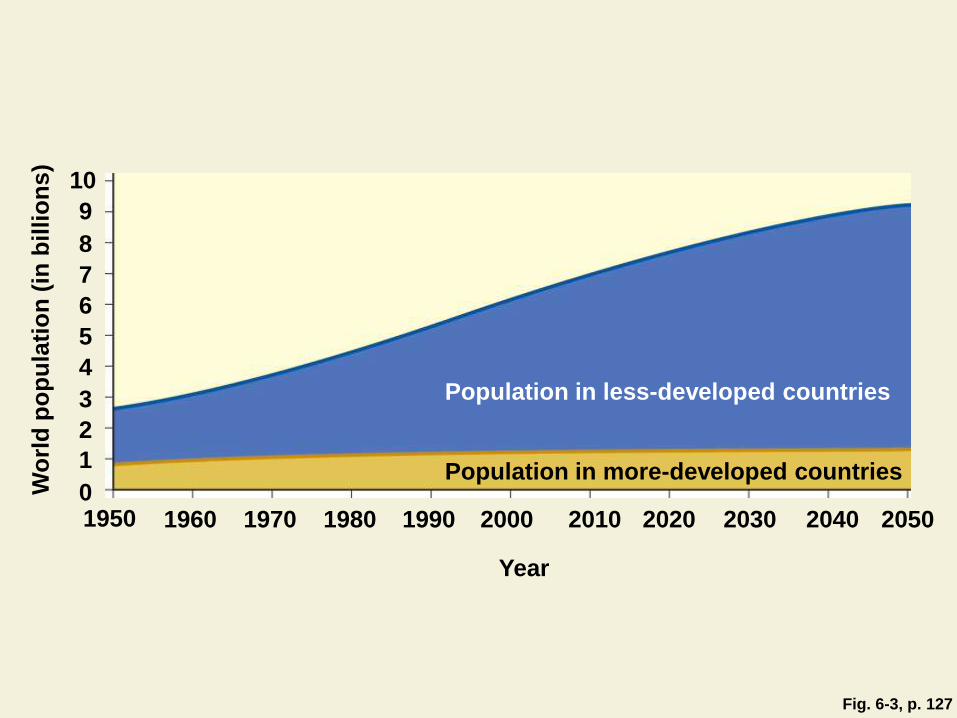
Fig. 6-3, p. 127
10
9
8
7
6
5
4
3 Population in less-developed countries
Wo
rld
po
pu
lati
on
(in
bil
lio
ns)
2
1 Population in more-developed countries
0 1960 1970 1980 1990 2000 2010 2020 2030 2040 2050 1950
Year

Five Most Populous Countries, 2010 and 2050
Fig. 6-4, p. 127
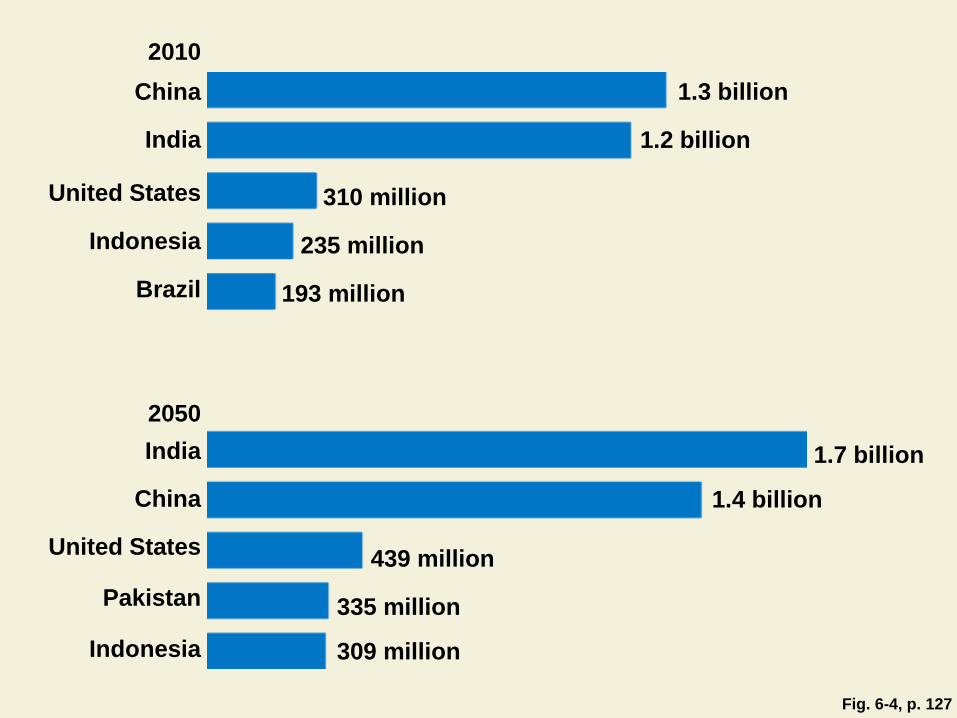
Fig. 6-4, p. 127
2010
China 1.3 billion
United States 310 million
India 1.2 billion
Indonesia 235 million
Brazil 193 million
2050
India 1.7 billion
China 1.4 billion
United States 439 million
Pakistan 335 million
Indonesia 309 million

Fig. 6-A, p. 128
11 UN high-fertility variant (2008 revision)
U.S. Census Bureau (2008 update)
10
UN low-fertility variant (2008 revision) IIASA (2007 update)
9
8
Wo
rld
po
pu
lati
on
(in
bil
lio
ns)
7
6
2010 2020 2030 2040 2050
Year
UN medium-fertility variant (2008 revision)
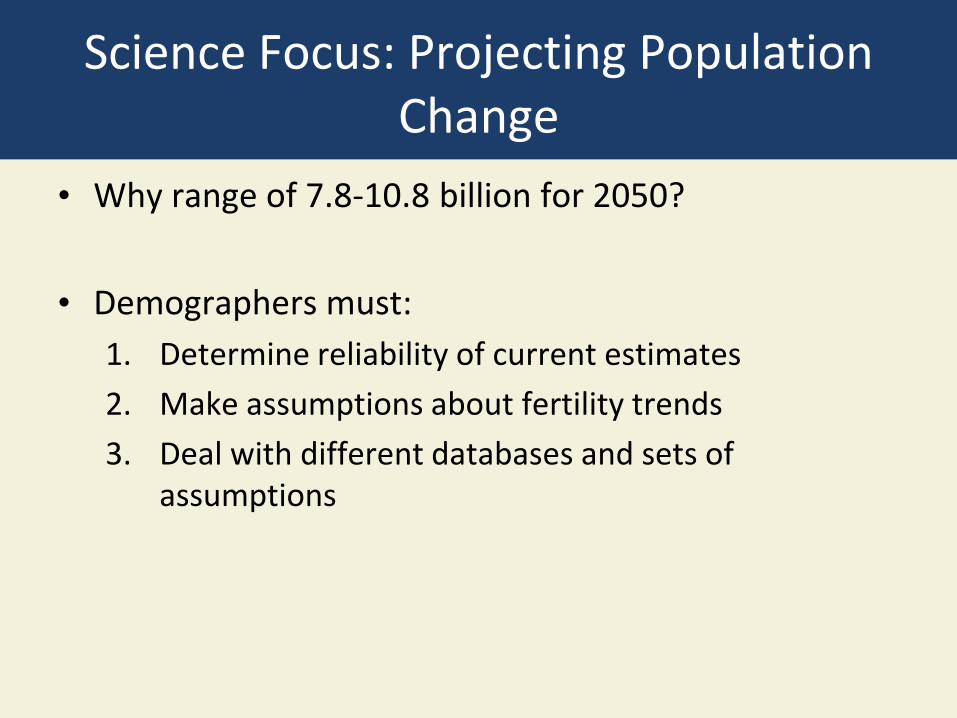
Science Focus: Projecting Population Change
• Why range of 7.8-10.8 billion for 2050?
• Demographers must:
1. Determine reliability of current estimates
2. Make assumptions about fertility trends
3. Deal with different databases and sets of assumptions

World Population Projections to 2050
Fig. 6-A, p. 128

Science Focus: How Long Can The Human Population Keep Growing?
• Thomas Malthus and population growth: 1798
• Overpopulation and overconsumption
• Will technology increase human carrying capacity?
• Can the human population grow indefinitely?
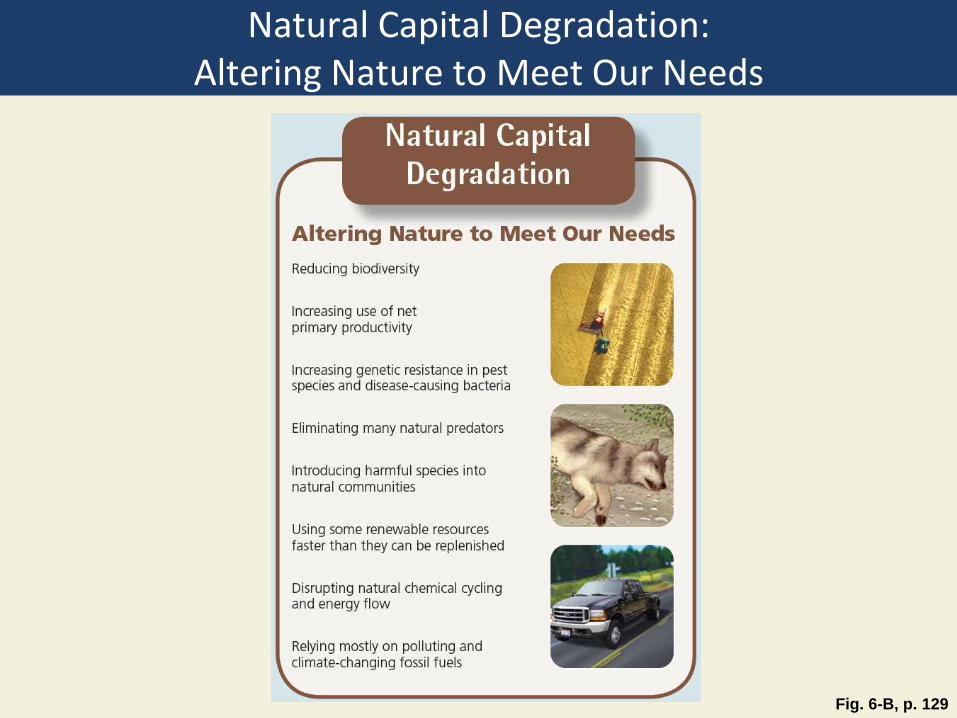
Natural Capital Degradation: Altering Nature to Meet Our Needs
Fig. 6-B, p. 129

Fig. 6-B, p. 129
Natural Capital Degradation
Altering Nature to Meet Our Needs
Reducing biodiversity
Increasing use of net primary
productivity
Increasing genetic resistance in
pest species and disease-causing
bacteria
Eliminating many natural
predators
Introducing harmful species into
natural communities
Using some renewable resources
faster than they can be replenished
Disrupting natural chemical cycling
and energy flow
Relying mostly on polluting and
climate-changing fossil fuels
6-2 What Factors Influence the Size of the Human Population?
• Concept 6-2A Population size increases because of births and immigration, and decreases through deaths and emigration.
• Concept 6-2B The average number of children born to women in a population (total fertility rate) is the key factor that determines population size.

The Human Population Can Grow, Decline, or Remain Fairly Stable
• Population change • Births: fertility
• Deaths: mortality
• Migration
• Population change =
(births + immigration) – (deaths + emigration)
• Crude birth rate: # live births/1000/year
• Crude death rate: # deaths/1000/year

Women Having Fewer Babies but Not Few Enough to Stabilize the World’s Population
• Fertility rate • number of children born to a woman during her
lifetime
• Replacement-level fertility rate • Average number of children a couple must have to
replace themselves
• 2.1 in developed countries
• Up to 2.5 in developing countries
• Total fertility rate (TFR) • Average number of children born to women in a
population

Total fertility rate, 1955-2010
Fig. 6-5, p. 130

Fig. 6-5, p. 130
8
7 Less-developed
countries
6
5 World
To
tal fe
rtil
ity r
ate
(ch
ild
ren
per
wo
man
)
3
More-
developed
countries
4
2
1955 1970 1990 2010 2030 2050
1
Year

2010 Rate of Population Increase
Figure 11, Supplement 8

Figure 12, Supplement 8
Total Fertility Rate

Case Study: The U.S. Population Is Growing Rapidly
• Population still growing and not leveling off
• 76 million in 1900
• 310 million in 2010
• Drop in TFR in U.S.
• Rate of population growth has slowed
• Changes in lifestyle in the U.S. during the 20th century

U.S. TFRs and birth rates 1917-2010
Fig. 6-6, p. 131

Fig. 6-6, p. 131
4.0
3.5
2.5
Baby boom
(1946–64)
Replacement
level
Bir
ths
pe
r w
om
an
0.5
0
1920 1930 1940 1950 1960 1970 1980 1990 2000 2010 Year
32
30
28
26
24
22
20
18
16
14
0
transition Depression Baby boom Baby bust Echo baby boom
Demographic End of World War II
Bir
ths
pe
r th
ou
sa
nd
po
pu
lati
on
1920 1930 1940 1950 1960 1970 1980 1990 2000 2010
Year
2.1 2.0
1.0
1.5
3.0

Fig. 6-7, p. 132
20th Century Lifestyle Changes in the U.S.

Fig. 6-7, p. 132
Life expectancy
Married women
working outside the
home 81%
8%
77 years 47 years
High school
graduates 83%
Homes with flush
toilets 98%
Homes with
electricity 2%
99%
10%
15%
People living in
suburbs 10%
52%
1900 Hourly
manufacturing
job wage
$3 2000
$15
Homicides per
100,000 people 1.2
5.8

77 years Life expectancy 47 years
1900
2000
Married women working
outside the home 8%
81%
High school
graduates
15%
83%
Homes with flush
toilets
10%
98%
Homes with
electricity 2%
99%
Living in
suburbs
10%
52%
Hourly manufacturing job
wage (adjusted for inflation) $3
$15
Homicides per
100,000 people
1.2
5.8 Stepped Art
Fig. 6-7, p. 132

Several Factors Affect Birth Rates and Fertility Rates (1)
• Children as part of the labor force
• Cost of raising and educating children
• Availability of private and public pension
• Urbanization
• Educational and employment opportunities for women

Several Factors Affect Birth Rates and Fertility Rates (2)
• Average age of a woman at birth of first child
• Availability of legal abortions
• Availability of reliable birth control methods
• Religious beliefs, traditions, and cultural norms
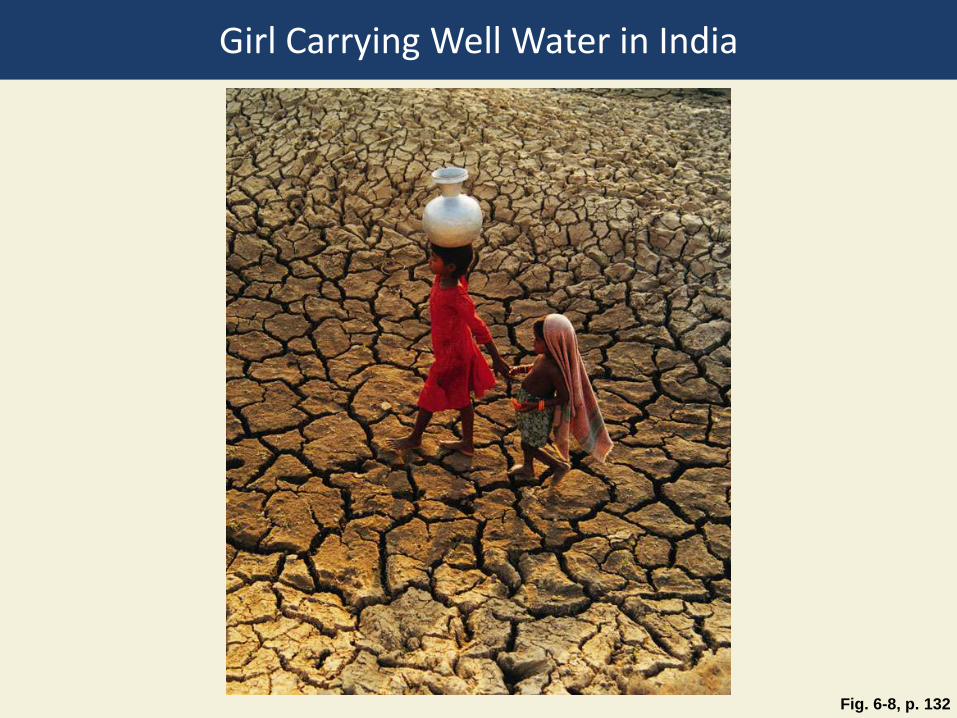
Fig. 6-8, p. 132
Girl Carrying Well Water in India

Fig. 6-9, p. 133
Child Laborers in India
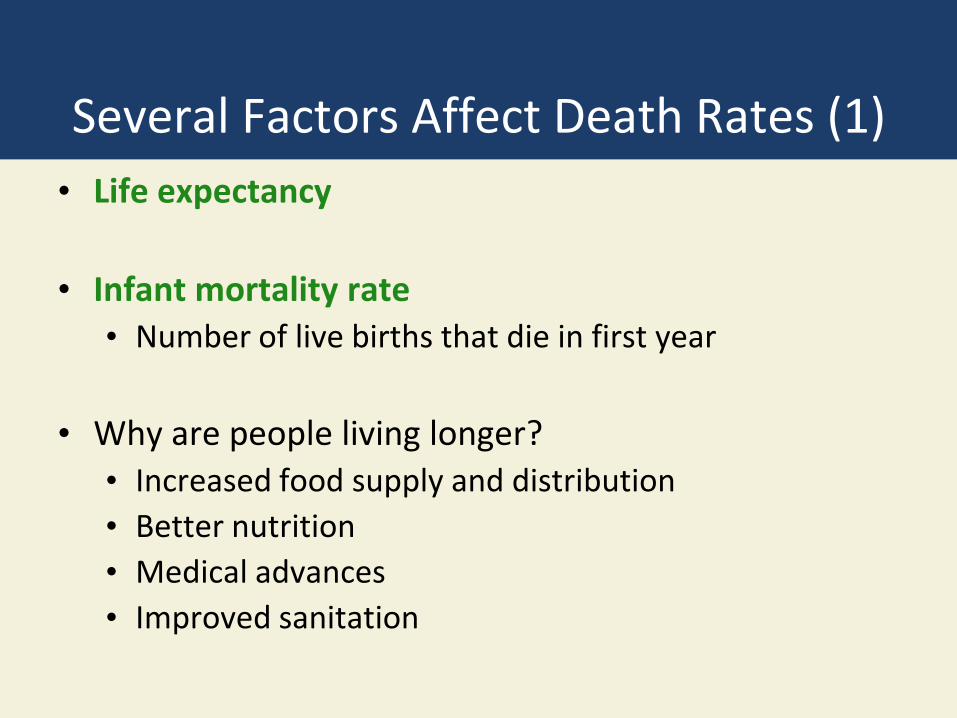
Several Factors Affect Death Rates (1)
• Life expectancy
• Infant mortality rate • Number of live births that die in first year
• Why are people living longer? • Increased food supply and distribution
• Better nutrition
• Medical advances
• Improved sanitation

Several Factors Affect Death Rates (2)
• U.S. is 54th in world for infant mortality rate
• U.S. infant mortality rate high due to
• Inadequate health care for poor women during pregnancy and their infants
• Drug addiction among pregnant women
• High birth rate among teenagers

Fig. 6-10, p. 134
Infant Mortality Rates, 1950-2010
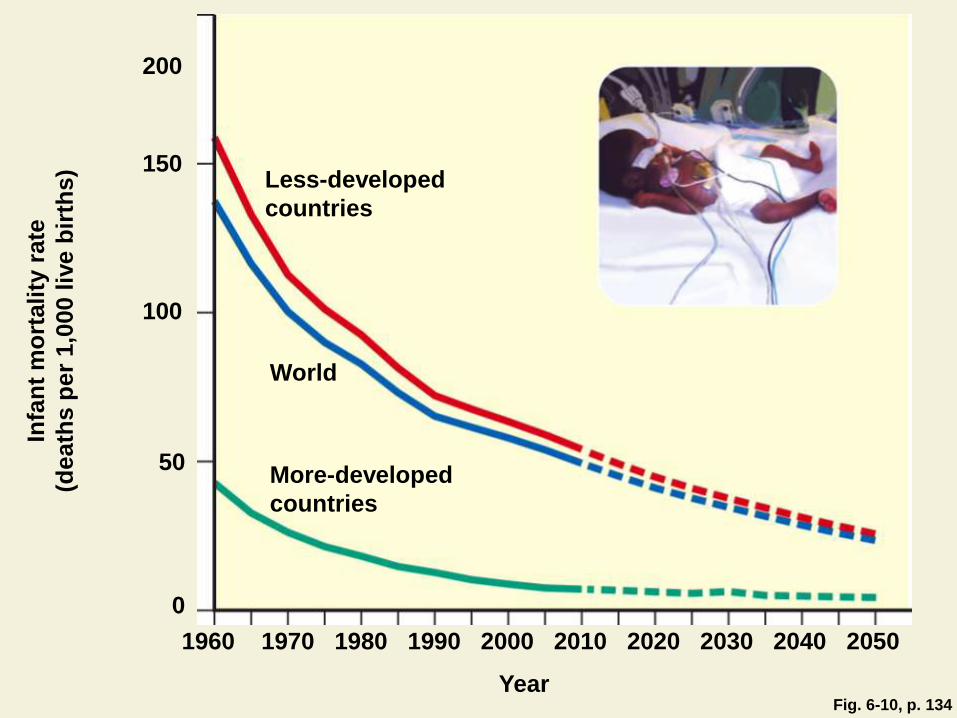
Fig. 6-10, p. 134
200
150 Less-developed
countries
100
World
Infa
nt
mo
rtali
ty r
ate
(death
s p
er
1,0
00 l
ive b
irth
s)
50 More-developed
countries
0
1960 1970 1980 1990 2000 2010 2020 2030 2040 2050
Year

Figure 13, Supplement 8
Infant Mortality Rates in 2010

Migration Affects an Area’s Population Size
• Economic improvement
• Religious freedom
• Political freedom
• Wars
• Environmental refugees

Case Study: The United States: A Nation of Immigrants
• Historical role of immigration in the U.S.
• Legal immigration
• Illegal immigration
• Controversy over immigration policy
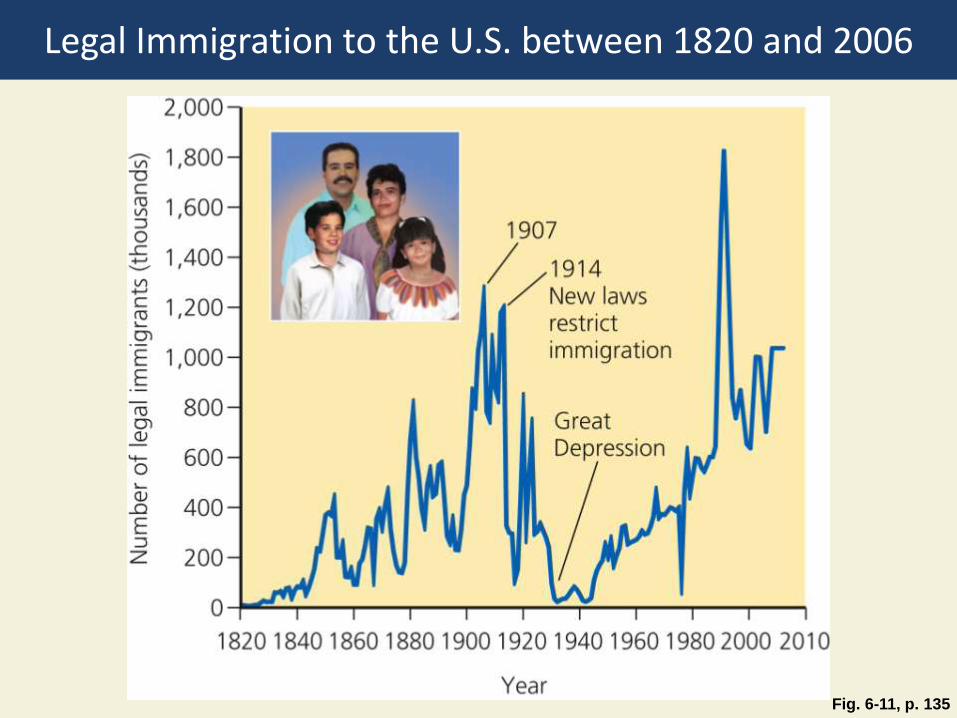
Fig. 6-11, p. 135
Legal Immigration to the U.S. between 1820 and 2006
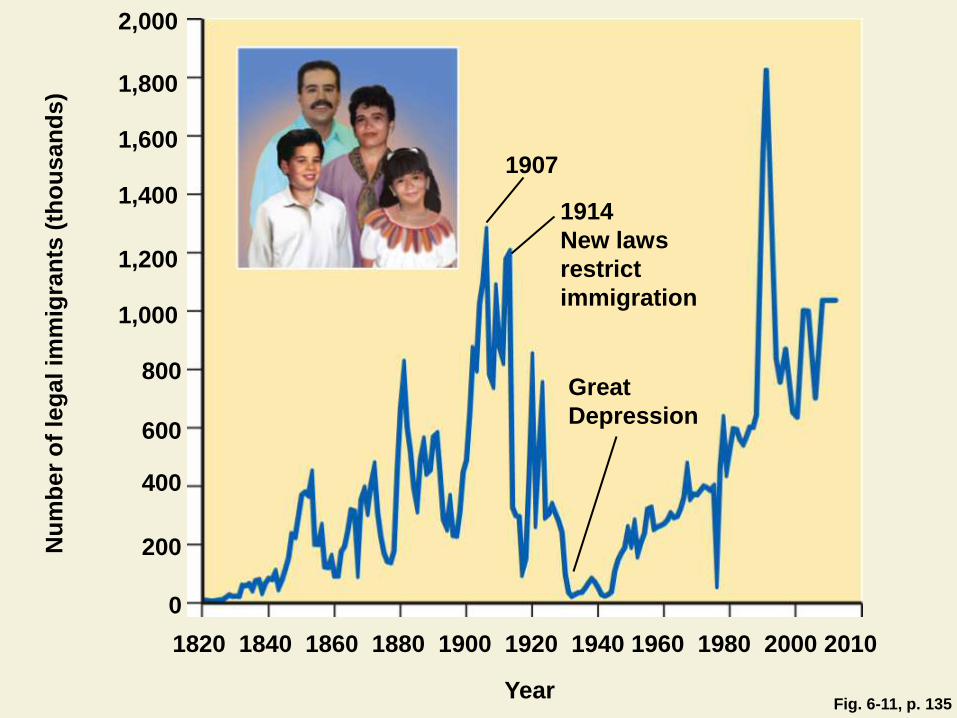
Fig. 6-11, p. 135
2,000
1,800
1,600 1907
1,400 1914
New laws
restrict
immigration
1,200
1,000
800 Great
Depression 600
400
Nu
mb
er
of
leg
al im
mig
ran
ts (
tho
usan
ds)
200
1820 1840 1860 1880 1900 1920 1940 1960 1980 2000 2010
Year
0

6-3 How Does a Population’s Age Structure Affect Its Growth or Decline?
• Concept 6-3 The numbers of males and females in young, middle, and older age groups determine how fast a population grows or declines.

A Population’s Age Structure Helps Us Make Projections
• Age structure categories
• Prereproductive ages (0-14)
• Reproductive ages (15-44)
• Postreproductive ages (45 and older)
• Seniors are the fastest-growing age group

Fig. 6-12, p. 136
Generalized Population Age-Structure Diagrams
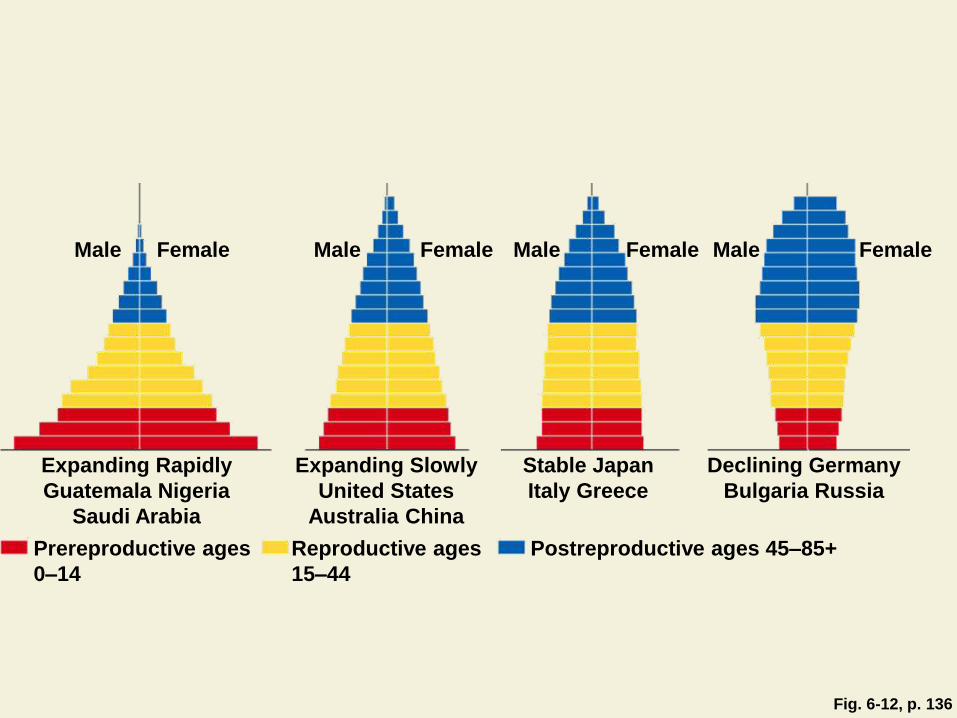
Fig. 6-12, p. 136
Male Female Male Female Male Female Male Female
Expanding Rapidly
Guatemala Nigeria
Saudi Arabia
Expanding Slowly
United States
Australia China
Stable Japan
Italy Greece
Declining Germany
Bulgaria Russia
Prereproductive ages
0–14
Reproductive ages
15–44
Postreproductive ages 45–85+

Fig. 6-13, p. 136
Population Structure by Age and Sex in Developing and Developed Countries

Case Study: The American Baby Boom
• 79 million people, 36% of adults
• Affect politics and economics
• Now becoming senior citizens
• Graying of America

Fig. 6-14, p. 137
Tracking the Baby-Boom Generation in the United States

Populations Made Up of Mostly Older People Can Decline Rapidly
• Slow decline
• Manageable
• Rapid decline
• Severe economic problems
• How pay for services for elderly
• Proportionally fewer young people working
• Labor shortages
• Severe social problems

Fig. 6-15, p. 138
Some Problems with Rapid Population Decline

Fig. 6-15, p. 138
Some Problems with Rapid Population Decline
Can threaten economic growth
Labor shortages
Less government revenues with fewer
workers
Less entrepreneurship and new business
formation
Less likelihood for new technology
development
Increasing public deficits to fund higher
pension and health-care costs
Pensions may be cut and retirement age
increased

Populations Can Decline from a Rising Death Rate: The AIDS Tragedy
• 27 million killed: 1981-2009
• Many young adults die: loss of most productive workers
• Sharp drop in life expectancy
• International community
• Reduce the spread of HIV through education and health care
• Financial assistance and volunteers

Fig. 6-16, p. 139
Botswana Age Structure, With and Without AIDS
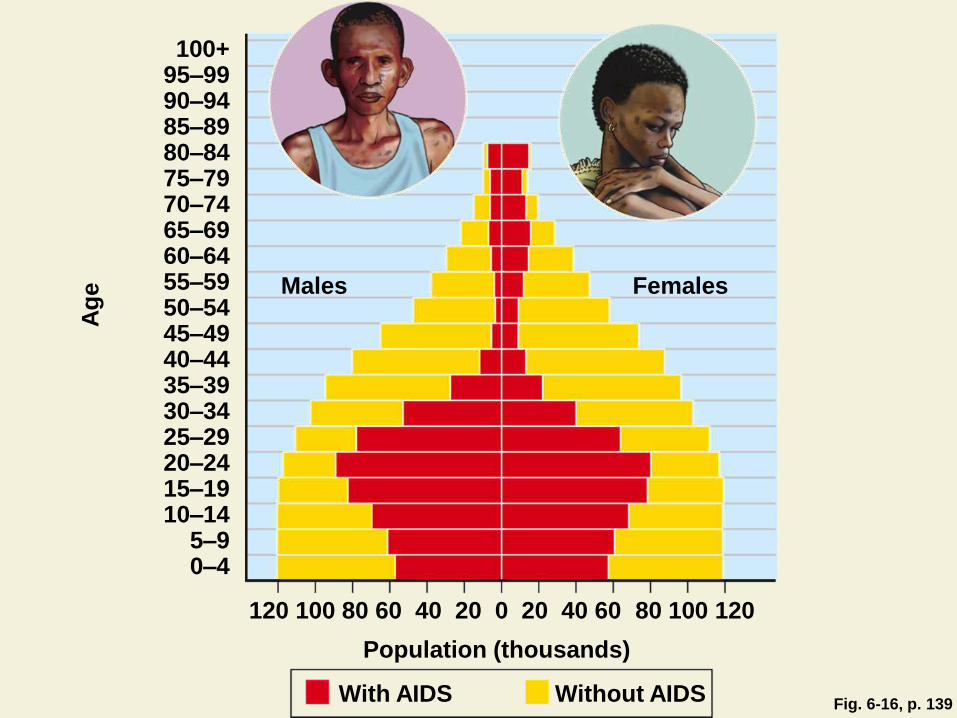
Fig. 6-16, p. 139
100+ 95–99 90–94 85–89 80–84 75–79 70–74 65–69 60–64 55–59 50–54 45–49 40–44 35–39 30–34 25–29 20–24 15–19 10–14
5–9 0–4
Males Females
Ag
e
80 100 120
With AIDS Without AIDS
Population (thousands)
120 100 80 60 40 20 0 20 40 60

6-4 How Can We Slow Human Population Growth?
• Concept 6-4 We can slow human population growth by reducing poverty, elevating the status of women, and encouraging family planning.

As Countries Develop, Their Populations Tend to Grow More Slowly
• Demographic transition
• First death rates decline
• Then birth rates decline
• Four stages
1. Preindustrial
2.Transitional
3. Industrial
4.Postindustrial
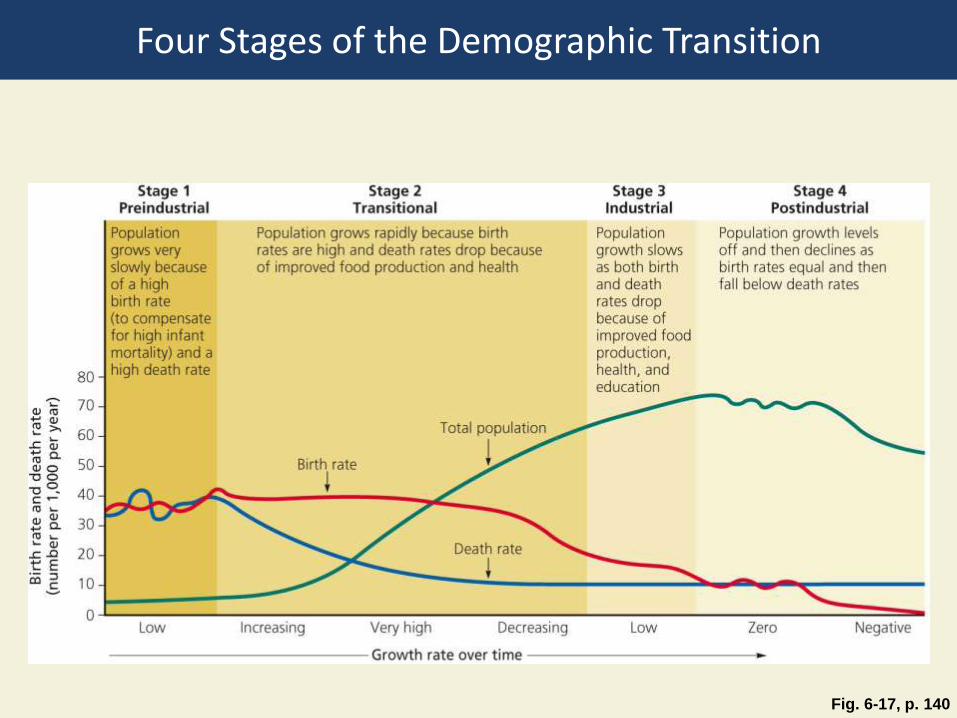
Fig. 6-17, p. 140
Four Stages of the Demographic Transition
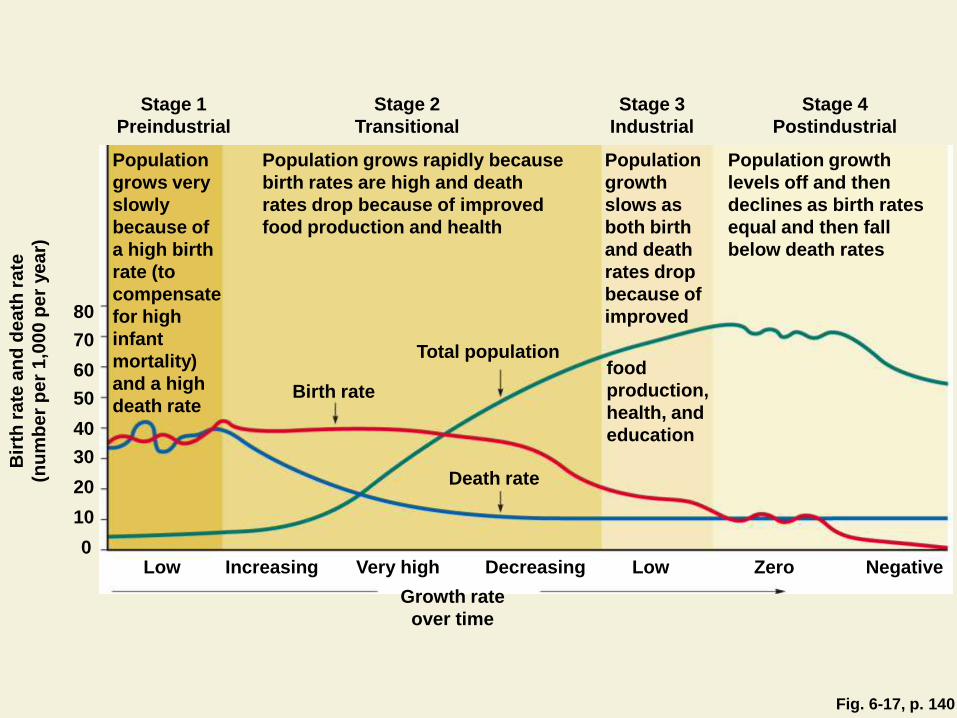
Fig. 6-17, p. 140
Stage 1
Preindustrial
Stage 2
Transitional
Stage 3
Industrial
Stage 4
Postindustrial
Population
grows very
slowly
because of
a high birth
rate (to
compensate
for high
infant
mortality)
and a high
death rate
Population grows rapidly because
birth rates are high and death
rates drop because of improved
food production and health
Population
growth
slows as
both birth
and death
rates drop
because of
improved
Population growth
levels off and then
declines as birth rates
equal and then fall
below death rates
80
70
60 Total population
50 Birth rate
40
30
20 Death rate
Bir
th r
ate
an
d d
ea
th r
ate
(nu
mb
er
pe
r 1
,00
0 p
er
ye
ar)
10
0 Low Increasing Very high Decreasing Low Zero Negative
Growth rate
over time
food
production,
health, and
education

Death rate
Total population
Birth rate
Population grows rapidly
because birth rates are high and
death rates drop because of
improved food production and
health
Decreasing
Stage 2
Transitional
Increasing Very high
Stepped Art
Population growth
levels off and then
declines as birth
rates equal and
then fall below
death rates
Stage 4
Postindustrial
Negative Zero
Population
grows very
slowly because
of a high
birth rate
(to compensate
for high infant
mortality) and a
high death rate
Stage 1
Preindustrial
Growth rate over time
80
70
60
50
40
30
20
10
0
Bir
th r
ate
an
d d
ea
th r
ate
(nu
mb
er
pe
r 1
,00
0 p
er
ye
ar)
Low
Population growth
slows as both birth
and death rates
drop because of
improved food
production, health,
and education
Stage 3
Industrial
Low
Fig. 6-17, p. 140
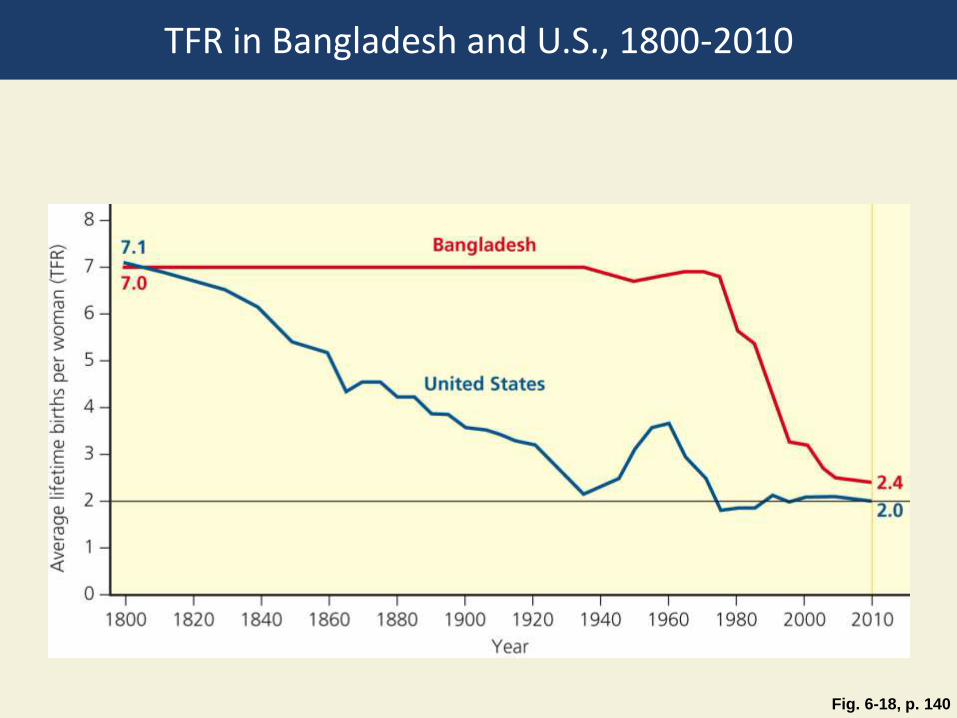
Fig. 6-18, p. 140
TFR in Bangladesh and U.S., 1800-2010

Fig. 6-18, p. 140
8
7 7.0
7.1 Bangladesh
6
5
United States 4
3
2 2.4
Ave
rag
e l
ifeti
me b
irth
s p
er
wo
man
(T
FR
)
1
0 1800 1820 1840 1860 1880 1900 1920 1940 1960 1980 2000 2010
2.0
Year

Fig. 6-19, p. 141
Slum in India

Empowering Women Can Slow Population Growth
• Factors that decrease total fertility rates:
• Education
• Paying jobs
• Ability to control fertility
• Women
• Do most of the domestic work and child care
• Provide unpaid health care
• 2/3 of all work for 10% of world’s income
• Discriminated against legally and culturally

Fig. 6-20, p. 141
Burkina Faso Women Hauling Fuelwood

Promote Family Planning • Family planning in less-developed countries
• Responsible for a 55% drop in TFRs
• Financial benefits: money spent on family planning saves far more in health, education costs
• Two problems
1.42% pregnancies unplanned, 26% end with abortion
2.Many couples do not have access to family planning

Case Study: Slowing Population Growth in India
• 1.2 billion people, most populous country in 2015
• Problems
• Poverty
• Malnutrition
• Environmental degradation
• Bias toward having male children
• Poor couples want many children
• Only 48% of couples use family planning
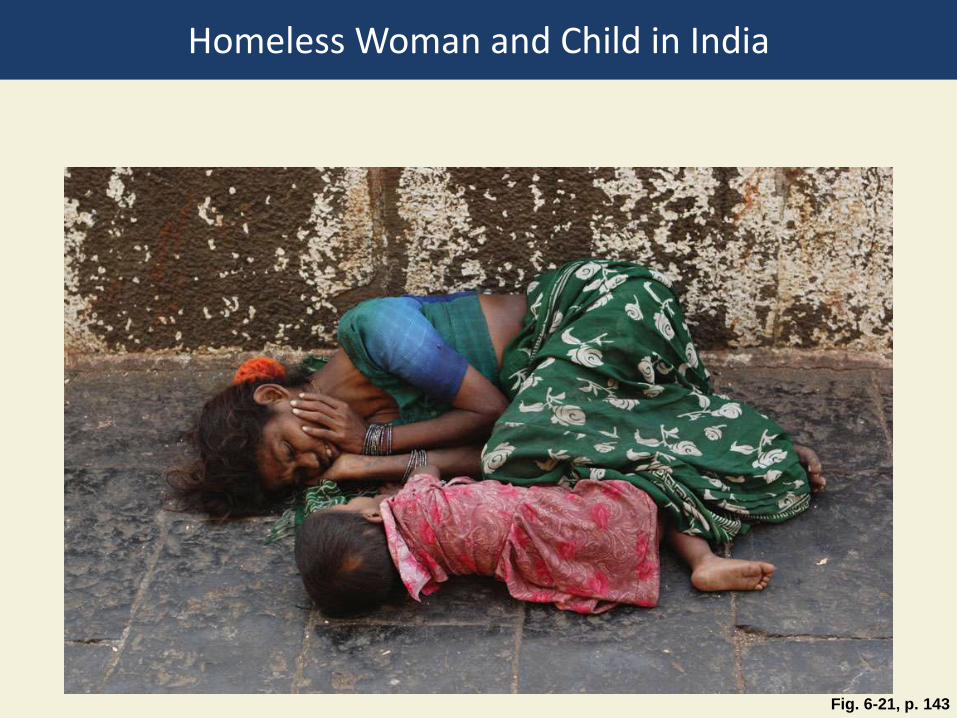
Fig. 6-21, p. 143
Homeless Woman and Child in India

Three Big Ideas
1. The human population is increasing rapidly and may soon bump up against environmental limits.
2. Even if population growth were not a serious problem, the increasing use of resources per person is expanding the overall human ecological footprint and putting a strain on the earth’s resources.

Three Big Ideas
3. We can slow population growth by reducing poverty through economic development, elevating the status of women, and encouraging family planning.