Embed Size (px)
Citation preview
131
CHAPTER 7—COORDINATION PATTERNS
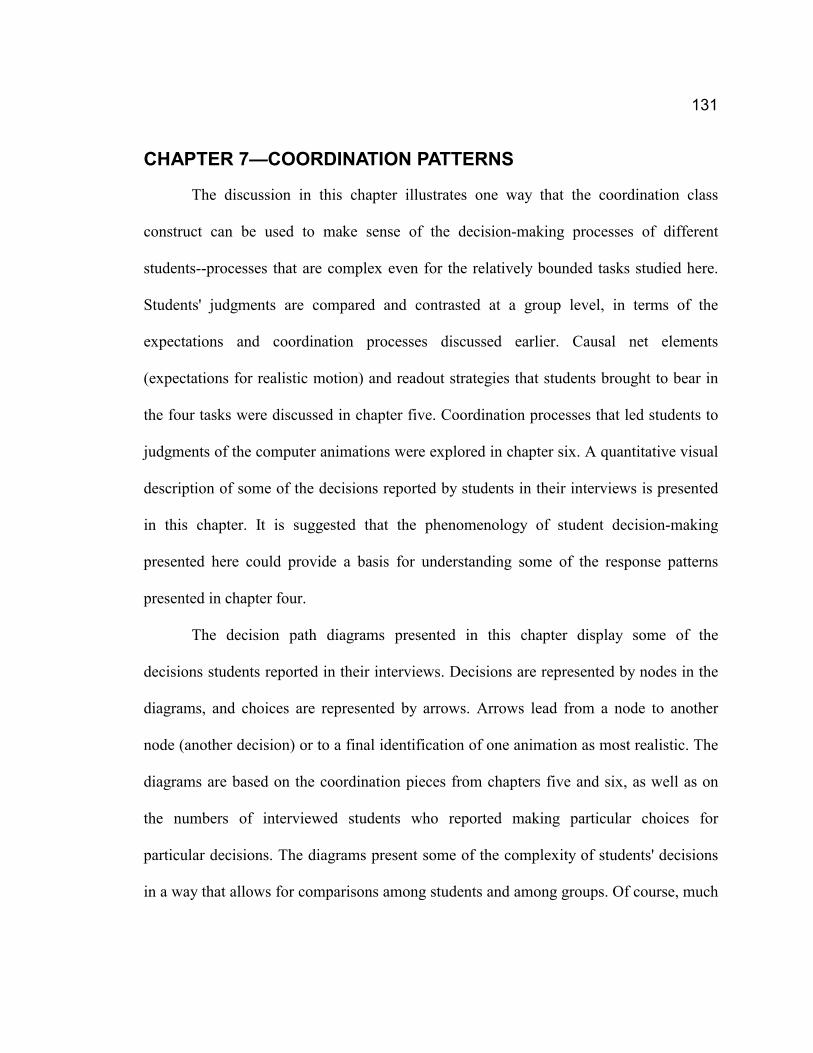
The discussion in this chapter illustrates one way that the coordination class
construct can be used to make sense of the decision-making processes of different
students--processes that are complex even for the relatively bounded tasks studied here.
Students' judgments are compared and contrasted at a group level, in terms of the
expectations and coordination processes discussed earlier. Causal net elements
(expectations for realistic motion) and readout strategies that students brought to bear in
the four tasks were discussed in chapter five. Coordination processes that led students to
judgments of the computer animations were explored in chapter six. A quantitative visual
description of some of the decisions reported by students in their interviews is presented
in this chapter. It is suggested that the phenomenology of student decision-making
presented here could provide a basis for understanding some of the response patterns
presented in chapter four.
The decision path diagrams presented in this chapter display some of the
decisions students reported in their interviews. Decisions are represented by nodes in the
diagrams, and choices are represented by arrows. Arrows lead from a node to another
node (another decision) or to a final identification of one animation as most realistic. The
diagrams are based on the coordination pieces from chapters five and six, as well as on
the numbers of interviewed students who reported making particular choices for
particular decisions. The diagrams present some of the complexity of students' decisions
in a way that allows for comparisons among students and among groups. Of course, much

132
of the complexity inherent in student coordination is hidden; the decision path diagrams
make some complexity digestible without hiding all of it. No claim is made that the
diagrams directly represent students' coordination systems; however, they do represent
the behavior of coordination systems for a pair of situations. This is useful in itself, and is
useful as a step in exploring students' coordination systems.
Decision path diagrams will be presented for the one-ball and two-ball V-valley
tasks. For each decision in the diagrams, the percentages of interviewed physics students
and psychology students making each choice are presented. The diagrams highlight
similarities in the coordination of physics students and psychology students for the one-
ball V-valley task, and also with the coordination of psychology students for the two-ball
V-valley task. In addition, the diagrams highlight the uniqueness of physics students'
coordination in the two-ball V-valley task; their choices appear in a different part of the
decision path diagram than do those of psychology students, a part of the diagram that
was not accessible in the one-ball V-valley task. These similarities and differences in
coordination echo similarities and differences in the response patterns presented in
chapter four.
7.1 REVIEW: EXPECTATION / READOUT PAIRS
In chapter six, readouts were described as linking students' expectations about
realistic motion to their judgments. The coordination process described most often by
students was the observation of some feature of an animation (a readout) inconsistent
with an expectation for realistic motion (a causal net element). This process allowed
133
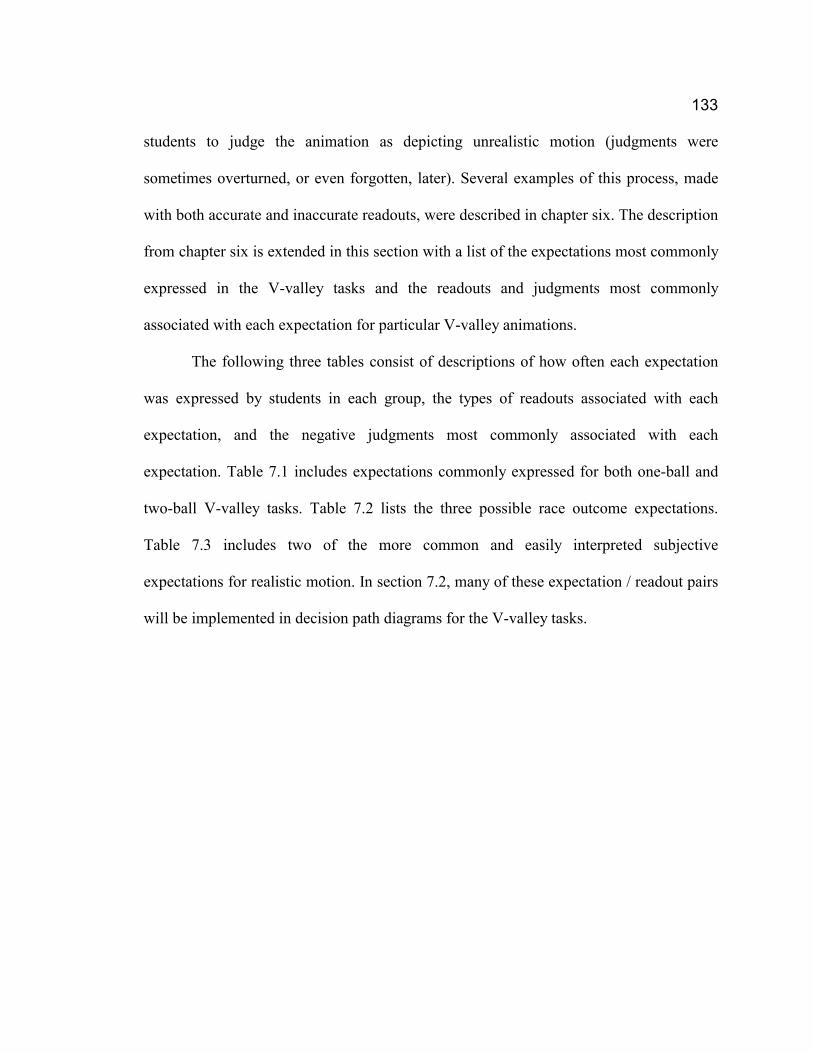
students to judge the animation as depicting unrealistic motion (judgments were
sometimes overturned, or even forgotten, later). Several examples of this process, made
with both accurate and inaccurate readouts, were described in chapter six. The description
from chapter six is extended in this section with a list of the expectations most commonly
expressed in the V-valley tasks and the readouts and judgments most commonly
associated with each expectation for particular V-valley animations.
The following three tables consist of descriptions of how often each expectation
was expressed by students in each group, the types of readouts associated with each
expectation, and the negative judgments most commonly associated with each
expectation. Table 7.1 includes expectations commonly expressed for both one-ball and
two-ball V-valley tasks. Table 7.2 lists the three possible race outcome expectations.
Table 7.3 includes two of the more common and easily interpreted subjective
expectations for realistic motion. In section 7.2, many of these expectation / readout pairs
will be implemented in decision path diagrams for the V-valley tasks.

134
Expectations commonly expressed for both V-valley tasks
ACCELDOWN
and DECELUP
expectations for
slopes
�� Nearly universal for students with identifiable expectations.
�� Associated with fixed-referent and relative motion readouts.
�� Accurate readouts rule out [constvx] and [sl]; inaccurate
DECELUP-related readouts rule out [real] animations.
NOGAIN �� Nearly universal in one-ball V-valley task; often not expressed
by physics students in two-ball V-valley task.
�� Associated with fixed-referent readouts.
�� Accurate readouts rule out [fst] and [fsl] animations.
SAMESPEED
expectation for
initial and final
shelves
�� Common for physics students; rare for psychology students.
�� Associated with (sometimes imprecise) fixed-referent and
(sometimes inappropriate) relative motion readouts.
�� Accurate readouts rule out [fsl] and [sl] animations.
�� Effect on two-ball judgments amplified by connection to TIE
expectation and inappropriate relative motion readouts.
Table 7.1 Selected properties of expectations commonly expressed in one- and two-
ball V-valley tasks, including potential effects of expectation / readout combinations
on student judgments.
Students usually reported accurate ACCELDOWN-related observations. Readouts
related to the DECELUP expectation were normally accurate for all animations except
[real], which students often judged to violate the DECELUP expectation. Students'
135
NOGAIN-related judgments for the [fst] animations are described in chapter six; some
students also reported NOGAIN-related readouts for the [fsl] animations. The
SAMESPEED expectation was expressed by many more physics students than
psychology students; SAMESPEED-related readouts were apparently imprecise for one-
ball animations, so that even students expressing the SAMESPEED expectation were
sometimes unable to rule out the one-ball V-valley [fsl] animation. Thus, the
SAMESPEED expectation appeared to have a small effect on many students' judgments
in the one-ball V-valley task. The SAMESPEED expectation apparently had a more
robust effect on physics students' two-ball judgments, through its connection to the TIE
expectation; several physics students spoke as if the two expectations were
interchangeable.
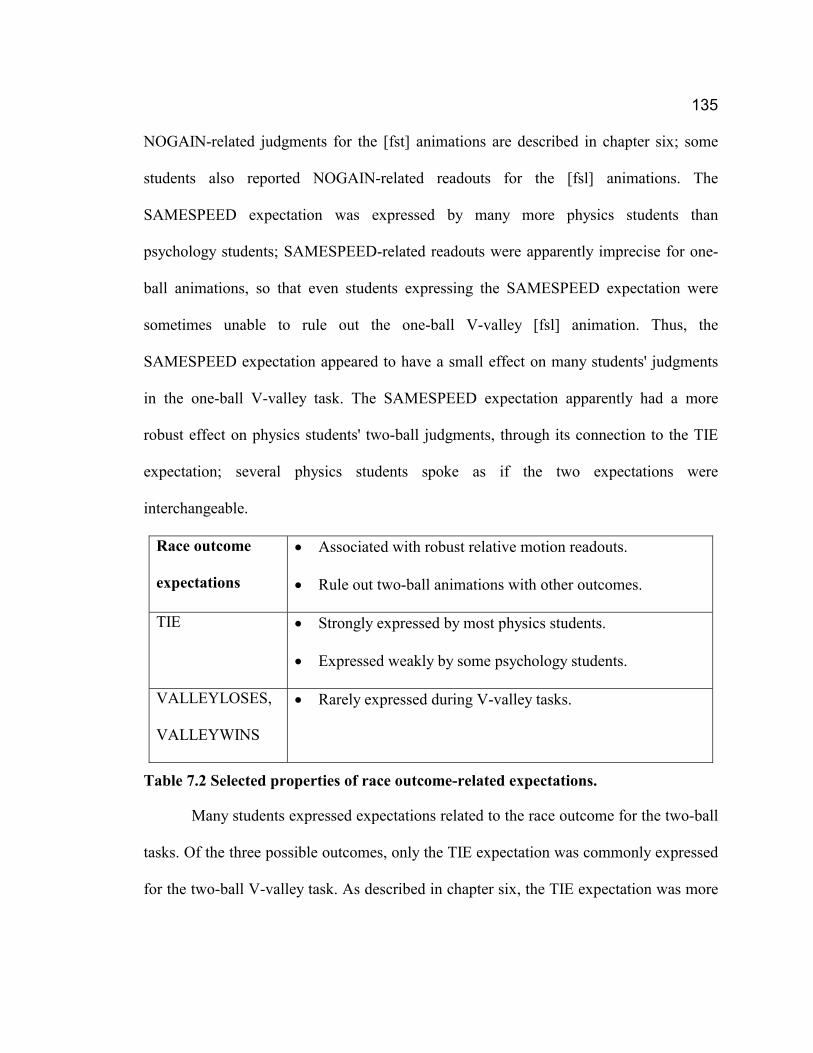
Race outcome
expectations
�� Associated with robust relative motion readouts.
�� Rule out two-ball animations with other outcomes.
TIE �� Strongly expressed by most physics students.
�� Expressed weakly by some psychology students.
VALLEYLOSES,
VALLEYWINS
�� Rarely expressed during V-valley tasks.
Table 7.2 Selected properties of race outcome-related expectations.
Many students expressed expectations related to the race outcome for the two-ball
tasks. Of the three possible outcomes, only the TIE expectation was commonly expressed
for the two-ball V-valley task. As described in chapter six, the TIE expectation was more
136
commonly and more confidently expressed by physics students than by psychology
students. Many psychology students expressed no preference for the race outcome in the
two-ball V-valley task.
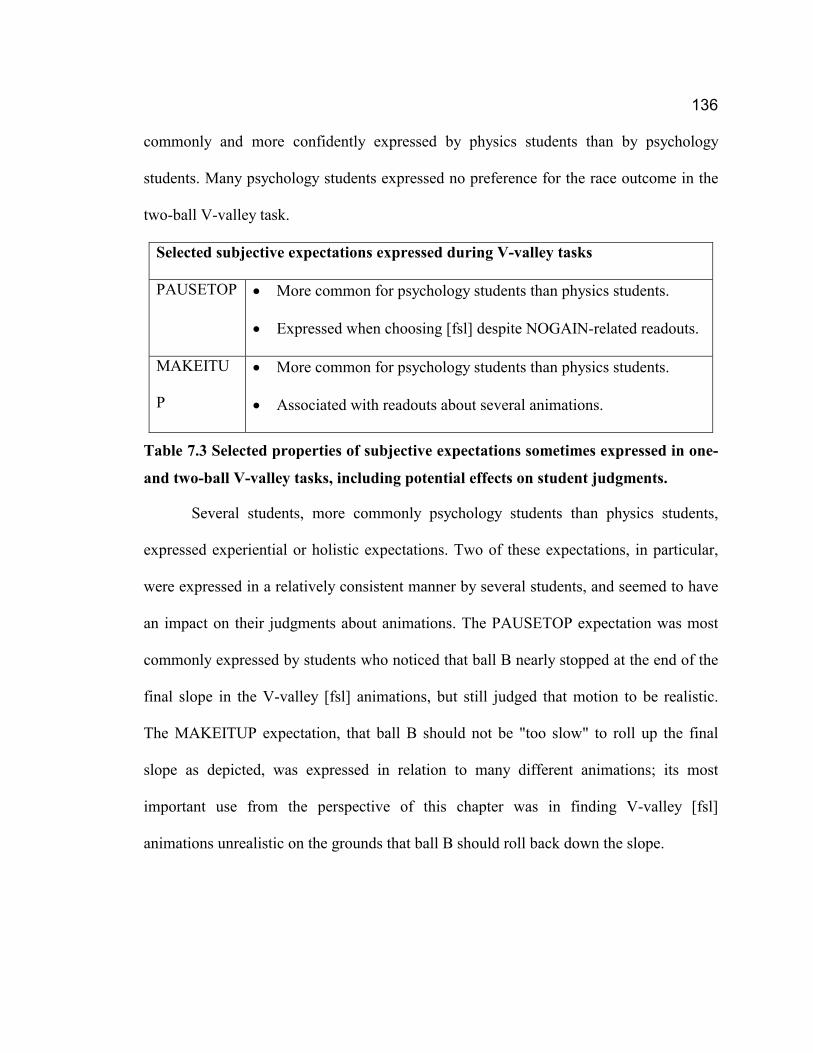
Selected subjective expectations expressed during V-valley tasks
PAUSETOP �� More common for psychology students than physics students.
�� Expressed when choosing [fsl] despite NOGAIN-related readouts.
MAKEITU
P
�� More common for psychology students than physics students.
�� Associated with readouts about several animations.
Table 7.3 Selected properties of subjective expectations sometimes expressed in one-
and two-ball V-valley tasks, including potential effects on student judgments.
Several students, more commonly psychology students than physics students,
expressed experiential or holistic expectations. Two of these expectations, in particular,
were expressed in a relatively consistent manner by several students, and seemed to have
an impact on their judgments about animations. The PAUSETOP expectation was most
commonly expressed by students who noticed that ball B nearly stopped at the end of the
final slope in the V-valley [fsl] animations, but still judged that motion to be realistic.
The MAKEITUP expectation, that ball B should not be "too slow" to roll up the final
slope as depicted, was expressed in relation to many different animations; its most
important use from the perspective of this chapter was in finding V-valley [fsl]
animations unrealistic on the grounds that ball B should roll back down the slope.
137
7.2 REPRESENTING STUDENT COORDINATION
In the course of choosing animations as "most realistic", interviewed students
reported several judgments about individual animations. In this section, the judgments of
students from the two groups of interviews (twenty six students from a psychology
course and twenty four students from a physics course) are represented quantitatively as
path diagrams. The decision path diagrams were built from the coordination processes
reviewed in the previous section as well as the feedback process described in chapter six.
Judgment patterns for the one-ball and two-ball V-valley tasks are presented here.
Comparison of diagrams for the two tasks demonstrates how the addition of the second
ball increased the complexity and variety of student judgments.
The set of connections implemented in each diagram was determined by analysis
of the decisions reported by interviewed students, where such analysis was possible.
(Some decisions were not reported explicitly enough to allow for confident analysis; in
addition, the twelve interviews with physics students that were not tape-recorded were
useful only for counting judgments about which the interviewer happened to write notes.)
The diagrams take the form of nodes, which represent decisions, connected by arrows to
other nodes and to boxes, which represent final animation choices. Each connecting
arrow is annotated with an abbreviated description of the choice represented by the arrow
and the percentages of students who apparently made that decision. The percentages
reported for each connecting arrow represent the fractions of students reporting a
particular decision for the judgment represented by a particular node, so that percentages
138
sum to 100% for arrows pointing out from a node. The percentages reported in a box
(final choice) are calculated as the product of percentages for all arrows in the path
leading to that box. Percentages in each box represent the overall fractions of students
reaching that box, so that the percentages in all of a diagram's boxes sum to 100%.
Percentages for psychology students (physics students) are labeled LT (MT), consistent
with the group labeling system from chapter four.
7.2.1 One-ball V-valley decision paths
Figure 7.1 summarizes the judgment patterns of students from each group in the
one-ball V-valley task. Decision paths for all students begin at node A and end at a box,
which represents a final animation choice. Paths are intended to indicate a series of
decisions; a student following the path ABE[sl] will have reported different decisions
than a student following the path ABCD[sl], even though the two students identified the
same animation as depicting realistic motion. Paths are not intended to depict a time
order for decisions; two students following the path ABCD[real], for example, will have
reported similar decisions, but will not necessarily have made or reported them in the
same order. Node D, however, which represents a decision that involves feedback, can
only be reached after all five animations have been judged unrealistic. (To indicate that
the decision at node D involves feedback, arrows leading from node D have dashed lines
and are described with italicized text.)
As the description of the arrow from node A to node B indicates, all interviewed
students who described observations about the [fst] animation expressed the NOGAIN
139
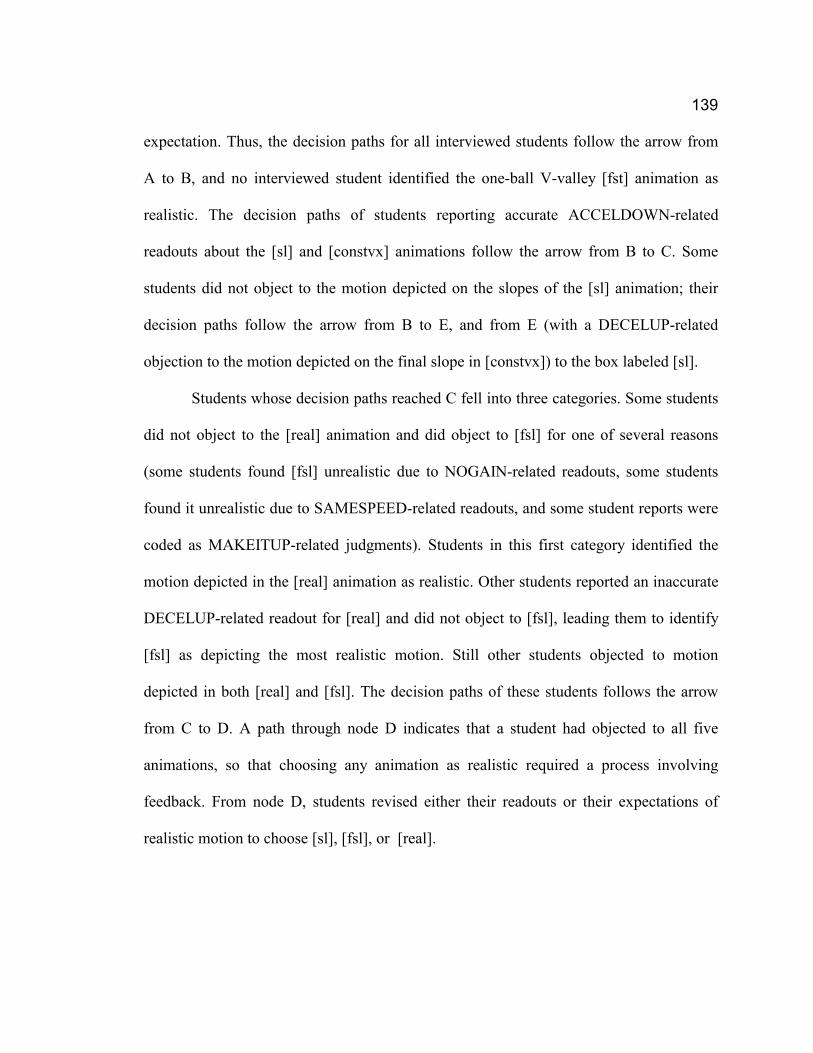
expectation. Thus, the decision paths for all interviewed students follow the arrow from
A to B, and no interviewed student identified the one-ball V-valley [fst] animation as
realistic. The decision paths of students reporting accurate ACCELDOWN-related
readouts about the [sl] and [constvx] animations follow the arrow from B to C. Some
students did not object to the motion depicted on the slopes of the [sl] animation; their
decision paths follow the arrow from B to E, and from E (with a DECELUP-related
objection to the motion depicted on the final slope in [constvx]) to the box labeled [sl].
Students whose decision paths reached C fell into three categories. Some students
did not object to the [real] animation and did object to [fsl] for one of several reasons
(some students found [fsl] unrealistic due to NOGAIN-related readouts, some students
found it unrealistic due to SAMESPEED-related readouts, and some student reports were
coded as MAKEITUP-related judgments). Students in this first category identified the
motion depicted in the [real] animation as realistic. Other students reported an inaccurate
DECELUP-related readout for [real] and did not object to [fsl], leading them to identify
[fsl] as depicting the most realistic motion. Still other students objected to motion
depicted in both [real] and [fsl]. The decision paths of these students follows the arrow
from C to D. A path through node D indicates that a student had objected to all five
animations, so that choosing any animation as realistic required a process involving
feedback. From node D, students revised either their readouts or their expectations of
realistic motion to choose [sl], [fsl], or [real].
140
[fst]: LT 0%, MT 0%
[sl]: LT 20%, MT 8%
[constvx]: LT 0%, MT 0%
A B
E
C
D
[fsl]: LT 27%, MT 46%
[real]: LT 48%, MT 46%
ACCELDOWNLT 80%, MT 92%
both: LT 40%, MT 43%
NOGAIN, SAMESPEED, or MAKEUP (in [fsl]): LT 40%, MT 36%
bad [real] readout: LT 20%, MT 21%
accept [real]: LT 50%, MT 33%
accept [fsl]: LT 33%, MT 67%
DECELUP: LT100%, MT 100%
LT 20%, MT 8%
[sl]: LT 5%, MT 0%
accept [sl]: LT 17%, MT 0%
NOGAIN: LT 100%, MT 100%
Figure 7.1 Decision paths for the one-ball V-valley task.
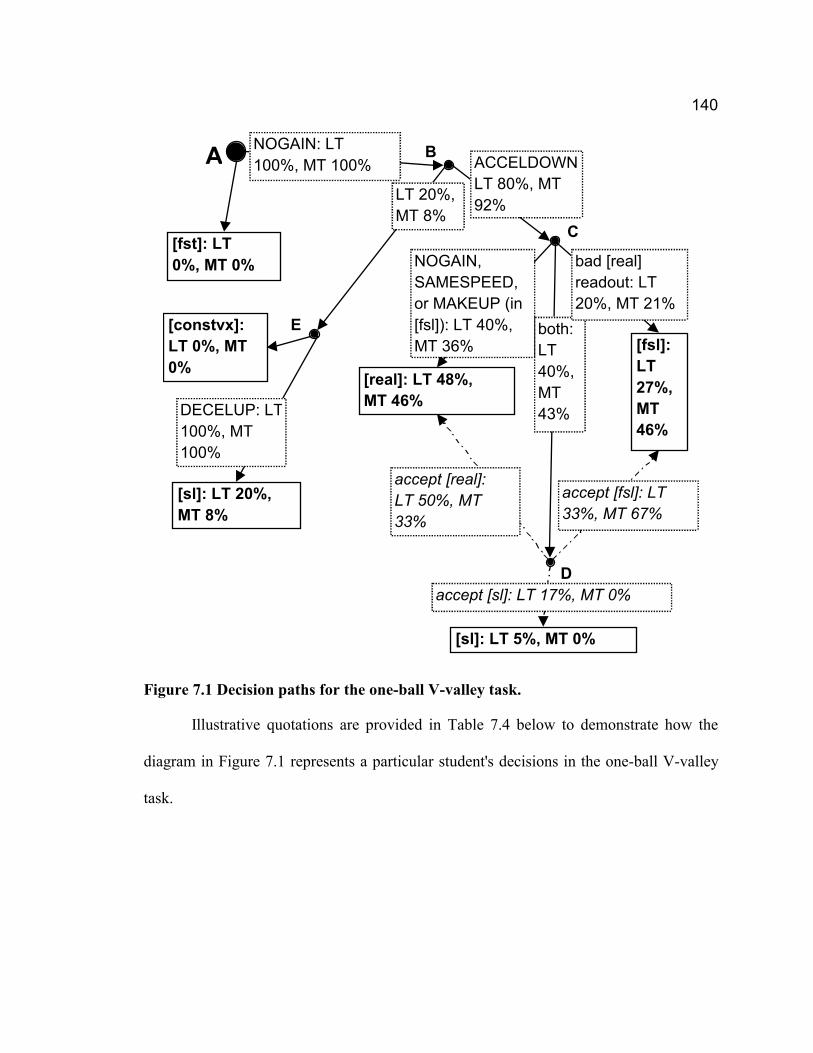
Illustrative quotations are provided in Table 7.4 below to demonstrate how the
diagram in Figure 7.1 represents a particular student's decisions in the one-ball V-valley
task.
141
Node
progression
Transcript excerpts from Felix, a physics student, in the one-
ball V-valley task
A � B
(NOGAIN)
Alright, that looks a little funny, because it almost comes to a
stop there and then picks up speed.
B � C for [sl]
(ACCELDOWN
)
…seems like, oh, 3[sl]'s wrong. <Interviewer: 3[sl]'s wrong?>
Well, it looks like it doesn't pick up any speed on that slope. It
should…
C � D � [fsl]
(objects to [fsl]
and presumably
[real], but revises
SAMESPEED
expectation to
choose [fsl])
…Essentially number 4[fsl] again but still, I don't know, seems
like it loses too much like it almost comes to a stop, and
<indecipherable> like perpetual motion once it comes to the top
<Interviewer: So tell me what you like about 4[fsl]> Um, the
other ones it seem like, 'cause ideally when it comes to the top it
should have the same velocity that it does right here…
<Interviewer: Why is that?> Um, potential energy, gets
transferred to kinetic energy, I mean the ball's rolling so you lose
a little torque, but, um, it slows down considerably when it comes
to the top of this, and that's ideally what it should do, so yeah, I
guess let me say number 4[fsl] again.
Table 7.4 Excerpts illustrating a physics student's progress through the one-ball V-
valley decision path diagram.
The decision paths representing coordination by most psychology students (LT)
and by most physics students (MT) are remarkably similar for the one-ball V-valley task.
Except for a smaller percentage of LT than MT students reporting ACCELDOWN-
related objections at node B, and somewhat different distributions of feedback-related
142
judgments from node D, they are virtually identical when viewed at this level of detail.
(Note, for example, that splitting the path from C to the [real] box into an arrow for each
specific objection to [fsl] might reveal some finer-grained differences between path
distributions for the two groups.) The coordination of the majority of students from each
group led through node C (and for many students in each group, node D) to a final choice
of [fsl] or [real].
7.2.2 Two-ball V-valley decision paths
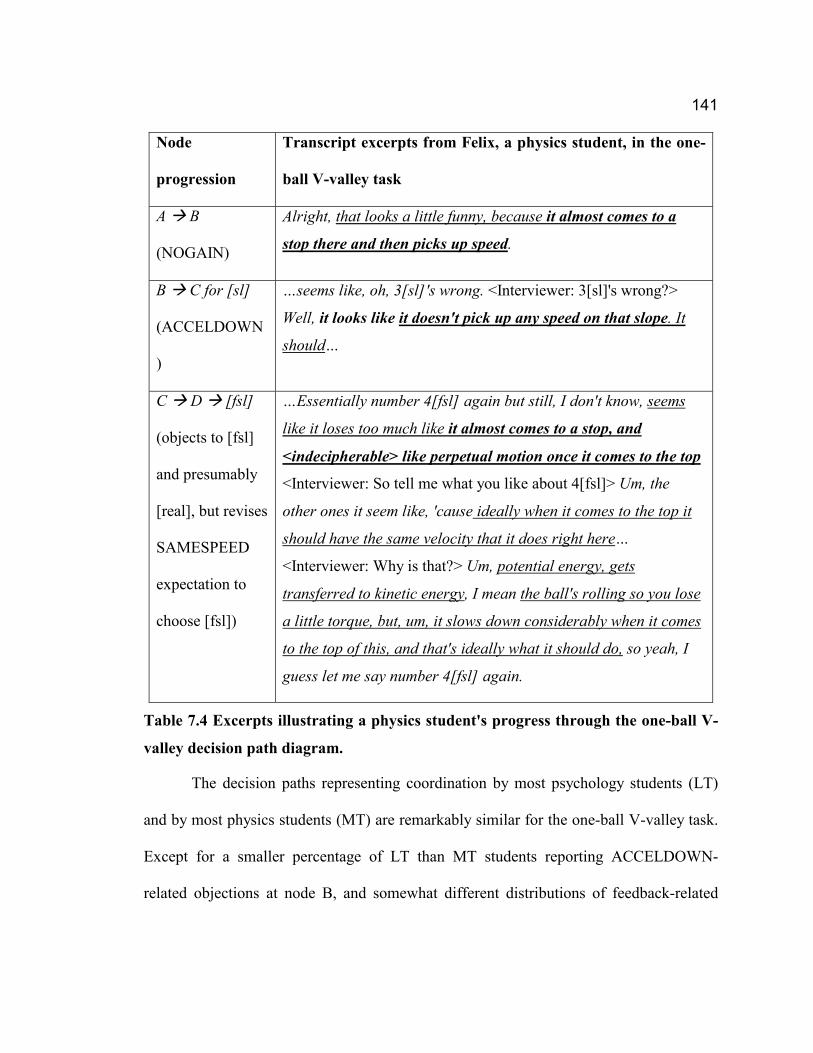
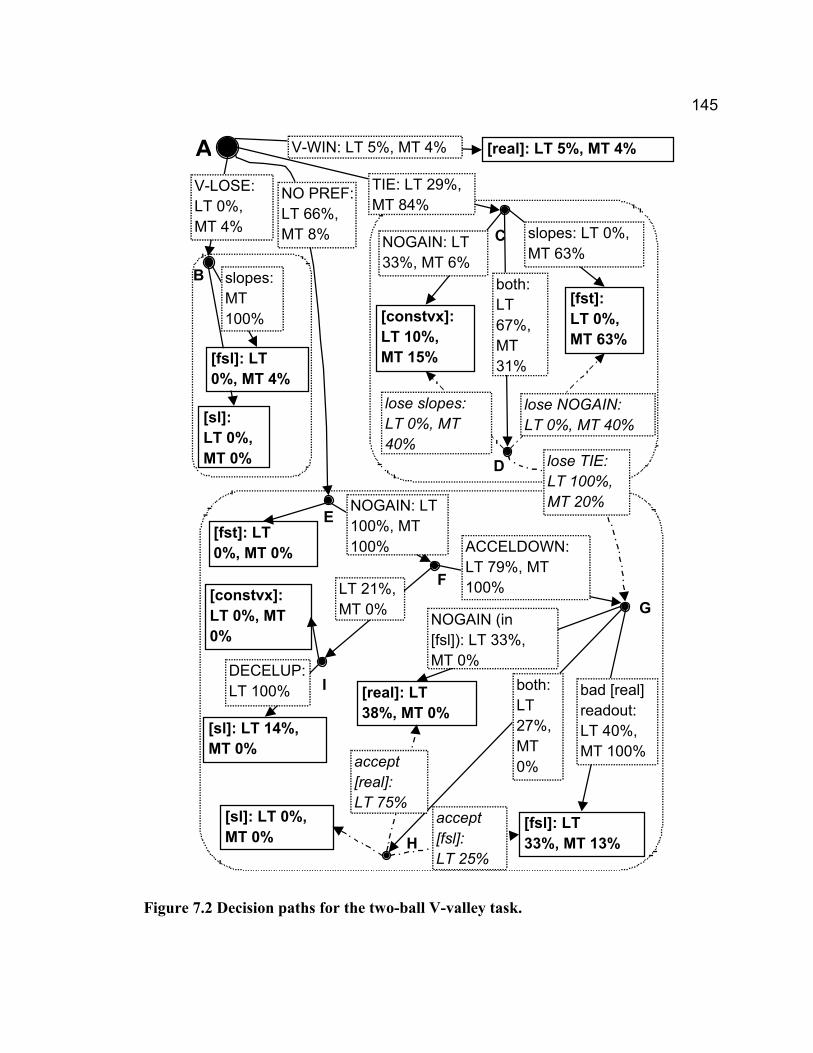
Figure 7.2 summarizes the judgment patterns of students from each group in the
two-ball V-valley task. Decision paths for all students begin at node A and end at a box,
which represents a final animation choice. Node A represents the choice among race
outcomes.
Two animations depict ball B losing the race, so that an expression of the
VALLEYLOSES expectation did not narrow the field to one choice. Therefore, the "V-
LOSE" arrow leads from A to B, where node B represents a choice between the [sl] and
[fsl] animations. Students whose decision paths led to node B, and who made appropriate
ACCELDOWN-related readouts and judgments, would follow the arrow labeled "slopes"
to identify the [fsl] animation as depicting the most realistic motion; others might follow
the arrow leading from B to the [sl] animation. Only one interviewed student for whom a
decision path could be traced clearly expressed a belief that ball B should win the V-
valley race. That student's decision path appeared to be AB[fsl].
143
Two interviewed students (one physics student and one psychology student)
clearly expressed the VALLEYWINS expectation in the two-ball V-valley. Their
decision paths appeared to follow the arrow labeled "V-WIN", and they identified the
[real] animation as most realistic. Although these two students made specific motion-
related objections to some animations, race outcome was apparently important to their
decision, and they described ruling out some animations because of their race outcomes.
The majority of interviewed physics students (labeled MT in the diagram) and
some psychology students (LT) clearly indicated their expectation that the two balls
should tie in the V-valley race. Their decision paths led to node C. Three arrows lead
from C, indicating the three choices observed among students who expressed the TIE
expectation. Some students reported NOGAIN-related readouts for [fst] and no
objections to [constvx]. The decision paths of these students followed the arrow labeled
"NOGAIN" to the [constvx] box. Some physics students reported ACCELDOWN- or
DECELUP-related objections to [constvx] but no objections to [fst]. Their decision paths
followed the arrow labeled "slopes" to the [fst] box. Other students found the motions
depicted in both [constvx] and [fst] to be unrealistic, so that their decision paths led to
node D. Students reaching node D had ruled out each of the five animations as
unrealistic, so that each arrow leading from node D represents a process involving
feedback. To reach [constvx] from node D, a student had to align his or her expectations
and readouts for [constvx] by revising expectations related to speed changes on the valley
slopes or revising readouts related to speed changes in the [constvx] animation. Students
144
who reached [fst] from D reported either distrusting their NOGAIN-related readouts or
lowering their expectations about how realistic the motion depicted in even the "most
realistic" animation should look. The third arrow, leading from D to G, indicates that
some students lost confidence in the TIE expectation altogether, and re-considered the
realism of non-tying animations.
The fourth arrow from A leads to E. This arrow indicates that some students (the
majority of interviewed psychology students) expressed no clear preference for the race
outcome. Nodes E through I in Figure 7.2 are very similar to nodes A through E in Figure
7.1. A slight deviation from a strict analogy is that students whose decision paths led
from node G to the [real] box all reported NOGAIN-related objections to [fsl], rather than
one or more of the objections encompassed by the arrow from C to D in Figure 7.1.
145
I
G
A
C
D
B[fst]: LT 0%, MT 63%
H
[constvx]: LT 10%, MT 15%
slopes: LT 0%, MT 63%
both: LT 67%, MT 31%
lose NOGAIN: LT 0%, MT 40%
NOGAIN: LT 33%, MT 6%
lose slopes: LT 0%, MT 40%
slopes: MT 100%
[real]: LT 5%, MT 4%
V-LOSE: LT 0%, MT 4%
V-WIN: LT 5%, MT 4%
[fsl]: LT 33%, MT 13%
[sl]: LT 0%, MT 0%
[real]: LT 38%, MT 0%
[fst]: LT 0%, MT 0%
[sl]: LT 14%, MT 0%
[constvx]: LT 0%, MT 0%
E
F
ACCELDOWN: LT 79%, MT 100%
NOGAIN (in [fsl]): LT 33%, MT 0%
accept [real]: LT 75%
accept [fsl]: LT 25%
both: LT 27%, MT 0%
LT 21%, MT 0%
NOGAIN: LT 100%, MT 100%
TIE: LT 29%, MT 84%
[sl]: LT 0%, MT 0% lose TIE:
LT 100%, MT 20%
NO PREF:LT 66%, MT 8%
[fsl]: LT 0%, MT 4%
bad [real] readout: LT 40%, MT 100%
DECELUP: LT 100%
Figure 7.2 Decision paths for the two-ball V-valley task.
146
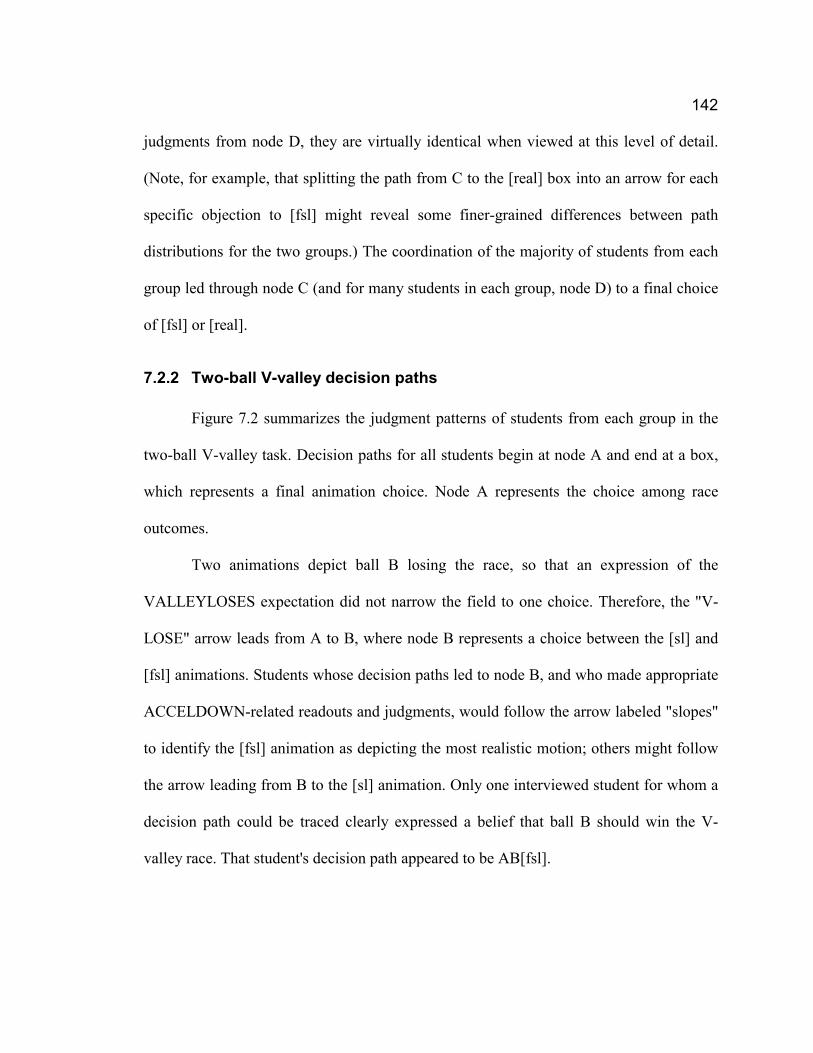
Illustrative quotations are provided in Table 7.5 below to demonstrate how the
diagram in Figure 7.2 represents a particular student's decisions in the two-ball V-valley
task.

147
Node
progression
Transcript excerpts from Stephen, a psychology student, in
the two-ball V-valley task
A � C and
initially to [fst]
(ACCELDOWN,
DECELUP, TIE)
[in constvx]…it doesn’t seem that realistic to me that they're at
the same point all the way along, I would imagine … that it
accelerates and decelerates … [in fst] …the top one seems to be
going more at a steady speed while the bottom one goes faster
and then slower and they end up pretty much at the same place
that, that seems realistic to me.
DECELUP
readout problem
[in real] …that seems like the effect of going up the hill doesn’t
really slow it down as much as I…
ACCELDOWN [in sl]…this one doesn’t seem very realistic to me, number 4[sl],
… going down that ramp it doesn’t seem like that ball picks up
really any speed.
TIE [in fsl] … I still don’t think that it would slow down that much
that it would, that the top one would pass it, it doesn't seem as
realistic to me.
D � G
NOGAIN causes
feedback to lose
TIE expectation
[fst again] … I think I like … 2[fst] … hold on, hmm … right at
the very end it seems to almost accelerate more than would be
realistic … it's really almost stopped there and what makes it get
that last little push to get over the top? So, now I'm not sure about
2[fst].
G � [fsl]
DECELUP
readout problem
I guess it's between 3[real] and 5[fsl] … I guess I would go more
with 5[fsl] because it does, it doesn’t seem like it slows down
coming up the ramp as much on 3[real].
Table 7.5 Excerpts illustrating a psychology student's progress through the two-ball
V-valley decision path diagram.
148
The resemblance between the decision paths for the group of interviewed
psychology (LT) students, for the two-ball V-valley task in Figure 7.2 and the one-ball V-
valley task in Figure 7.1, is remarkable. The coordination of the majority of interviewed
psychology students in the two-ball V-valley task led through node G (and for many
students in each group, node H) to a final choice of [fsl] or [real], just as their
coordination in the one-ball V-valley task led to the analogous section of the one-ball V-
valley decision path diagram. Most of those students expressed no clear preference for
the race outcome, so that their decision paths led from node A to node G through nodes E
and F. Even among psychology students expressing the TIE expectation, however, most
decision paths did not end in the TIE-related section of the decision path diagram, but
instead passed through nodes C and D to node G. The group of interviewed psychology
students appears to have made similar coordinations for the one-ball and two-ball V-
valley tasks. Although individual psychology students may not have coordinated
invariantly across the two tasks, the collection of decision paths taken by the group as a
whole did appear to be consistent across the two tasks. As a group, the interviewed
psychology students were not particularly sensitive to the shift in context from the one-
ball to the two-ball task. (Note that relative motion readout strategies could be
implemented in the two-ball task but not in the one-ball task, so there may have been
coordination differences, even for students completely free of race outcome expectations,
that would not be apparent from the diagrams as constructed here.)
149
In contrast, the collection of two-ball V-valley decision paths for interviewed
physics students differs markedly decision paths for the same group of students in the
one-ball V-valley task. Decision paths for the majority of physics students in the two-ball
V-valley task ended in the TIE-related area of the decision path diagram, leading through
node C (and for some students, node D) to a final choice of [fst] or [constvx]. In the one-
ball V-valley decision path diagram, there is no analogous section. The collection of
decisions made by the group of interviewed physics students appears, from this point of
view, to be highly sensitive to the one-ball to two-ball context shift.
7.3 COMPARING WITH LARGE N PATTERNS
In chapter four, V-valley response distributions were presented for large groups of
students. Among the patterns found were that:
�� LT and MT students produced similar response distributions for the one-ball task;
�� MT response distributions for the two-ball task were very different from those for the
one-ball task; and
�� LT response distributions for the two-ball task were more similar to one-ball response
distributions than to two-ball MT response distributions.
How do these patterns relate to patterns of coordination? Similarities and
differences in response distributions do not necessarily correspond to similarities and
differences in underlying coordination processes; Figure 7.1 and Figure 7.2 show that the
same response can be reached through different coordination paths, while similar
coordination paths can lead to choices of animations with different features. For lecture
150
presentations of the tasks, no information about students' coordination is available.
However, coordination patterns for interviewed students, presented in the previous
section, can be summarized as a virtual echo of the response patterns described above.
Among the patterns found were that:
�� the decisions of LT and MT students were distributed over similar paths for the one-
ball task;
�� the decisions of MT students for the two-ball task were distributed very differently
from those for the one-ball task; and
�� the decisions of LT students for the two-ball task were distributed over paths more
similar to one-ball decision paths than to two-ball MT decision paths.
The similarity in patterns raises the possibility that LT and MT students in the
large group presentations of the tasks may have used coordination processes similar to
those used by the interviewed students. Figure 7.3 and Figure 7.4 suggest that this may be
the case. Each figure presents the response patterns of a large group of students alongside
the percentages reaching each response in the path diagrams. (Note that the "path
diagram" percentages are not identical to the response patterns for the complete groups of
interviewed students. They represent only the 15-20 interviewed students from each
group for whom decision paths could reasonably be determined.) Error bars proportional
to the square root of the number reaching each response are shown, using a nominal
sample size of N=20 for the path diagrams.
151
LT students
0%
10%
20%
30%
40%
50%
60%
70%
one-ball V-valley task two-ball V-valley task
LT students (N=329)Path Diagrams
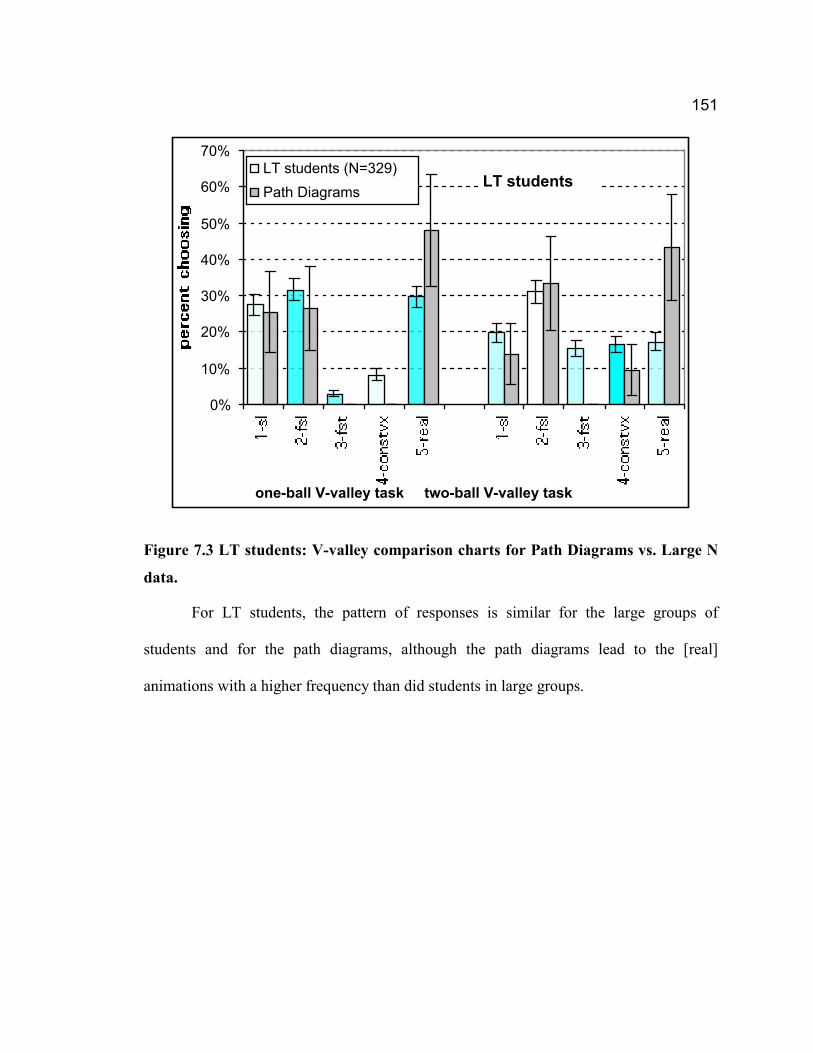
Figure 7.3 LT students: V-valley comparison charts for Path Diagrams vs. Large N
data.
For LT students, the pattern of responses is similar for the large groups of
students and for the path diagrams, although the path diagrams lead to the [real]
animations with a higher frequency than did students in large groups.
152
MT students
0%
10%
20%
30%
40%
50%
60%
70%
80%
90%
one-ball V-valley task two-ball V-valley task
MT students (N=317)Path Diagrams
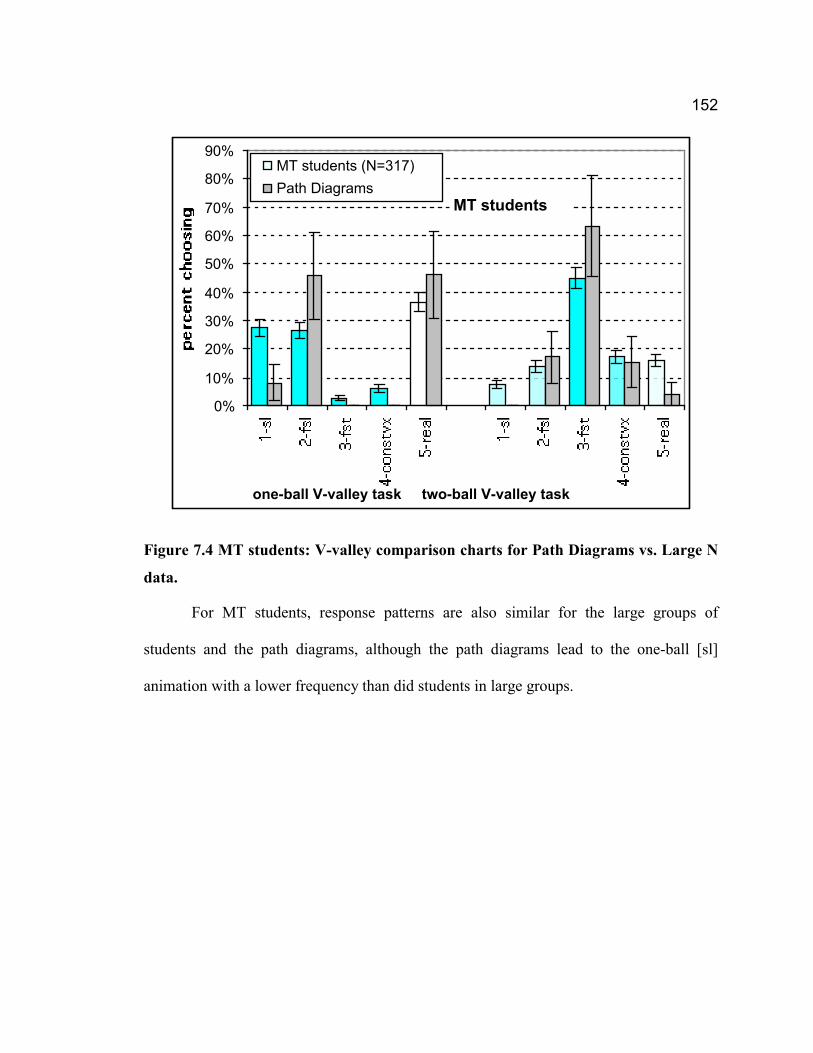
Figure 7.4 MT students: V-valley comparison charts for Path Diagrams vs. Large N
data.
For MT students, response patterns are also similar for the large groups of
students and the path diagrams, although the path diagrams lead to the one-ball [sl]
animation with a lower frequency than did students in large groups.