Embed Size (px)
Citation preview

Chapter 9b
•One-Tailed Test about a Population Mean: One-Tailed Test about a Population Mean: Small-Sample Case (Small-Sample Case (nn < 30) < 30)
•Tests about a Population ProportionTests about a Population Proportion
Using the Using the ppValueValue
4. Compute the value of the test statistic.4. Compute the value of the test statistic.
5. Compute the 5. Compute the pp–value.–value.
6. Determine whether to reject 6. Determine whether to reject HH00..
Because Because pp–value = .0021 < –value = .0021 < = .05, we reject = .05, we reject HH00..
One-Tailed Test about a Population Mean:One-Tailed Test about a Population Mean:Small-Sample Case (Small-Sample Case (nn < 30) < 30)
The The pp -value computed by Excel is .0021 -value computed by Excel is .0021
0 68.2 65 3.37
/ 3.8/ 16x
ts n
0 68.2 65
3.37/ 3.8/ 16x
ts n

n n >> 30 ? 30 ?
known ?known ?
Popul. Popul. approx.approx.normal normal
?? known ?known ?
Use Use ss to toestimate estimate
Use Use ss to toestimate estimate
Increase Increase nnto to >> 30 30
YesYes
YesYes
YesYes
YesYes
NoNo
NoNo
NoNo
NoNo
Summary of Test Statistics to be Used in aSummary of Test Statistics to be Used in aHypothesis Test about a Population MeanHypothesis Test about a Population Mean
/
xz
n
/
xz
n
/
xzs n
/
xzs n
/
xz
n
/
xz
n
/
xts n
/
xts n

The equality part of the hypotheses always appearsThe equality part of the hypotheses always appears in the null hypothesis.in the null hypothesis. In general, a hypothesis test about the value of aIn general, a hypothesis test about the value of a population proportion population proportion pp must take one of themust take one of the
following three forms (where following three forms (where pp00 is the hypothesized is the hypothesized
value of the population proportion).value of the population proportion).
A Summary of Forms for Null and A Summary of Forms for Null and Alternative Hypotheses about a Alternative Hypotheses about a
Population ProportionPopulation Proportion
One-tailedOne-tailed(lower tail)(lower tail)
One-tailedOne-tailed(upper tail)(upper tail)
Two-tailedTwo-tailed
0 0: H p p0 0: H p p
0: aH p p 0: aH p p0: aH p p 0: aH p p0 0: H p p0 0: H p p 0 0: H p p0 0: H p p
0: aH p p 0: aH p p

• Test Statistic
zp p
p
0
z
p p
p
0
pp p
n
0 01( ) pp p
n
0 01( )
Tests about a Population ProportionTests about a Population Proportion
where:where:

Rejection RuleRejection Rule
HH00: : pppp Reject Reject HH0 0 if z > zif z > z
Reject Reject HH0 0 if z < -zif z < -z
Reject Reject HH0 0 if |z| > if |z| > zz
HH00: : pppp
HH00: : pppp
Tests about a Population ProportionTests about a Population Proportion

Example: NSC
• Two-Tailed Test about a Population Proportion
For a Christmas and New Year’s week,
the National Safety Council estimated
that 500 people would be killed and
25,000 injured on the nation’s roads.
The NSC claimed that 50% of the
accidents would be caused by
drunk driving.

Example: NSCExample: NSC
Two-Tailed Test about a Population ProportionTwo-Tailed Test about a Population Proportion
A sample of 120 accidents showedA sample of 120 accidents showed
that 67 were caused by drunk driving.that 67 were caused by drunk driving.
Use these data to test the NSC’s claimUse these data to test the NSC’s claim
with with = 0.05. = 0.05.

Two-Tailed Test about aTwo-Tailed Test about aPopulation ProportionPopulation Proportion
1. Determine the hypotheses.1. Determine the hypotheses.
2. Specify the level of significance.2. Specify the level of significance.
3. Select the test statistic.3. Select the test statistic.
= .05= .05
4. State the rejection rule.4. State the rejection rule.Reject Reject HH00 if | if |zz|> 1.96|> 1.96
Using the Test StatisticUsing the Test Statistic
(two-tailed test)(two-tailed test)
0: .5H p0: .5H p: .5aH p: .5aH p
zp p
p
0
z
p p
p
0
Two-Tailed Test about aTwo-Tailed Test about aPopulation ProportionPopulation Proportion
Using the Test StatisticUsing the Test Statistic
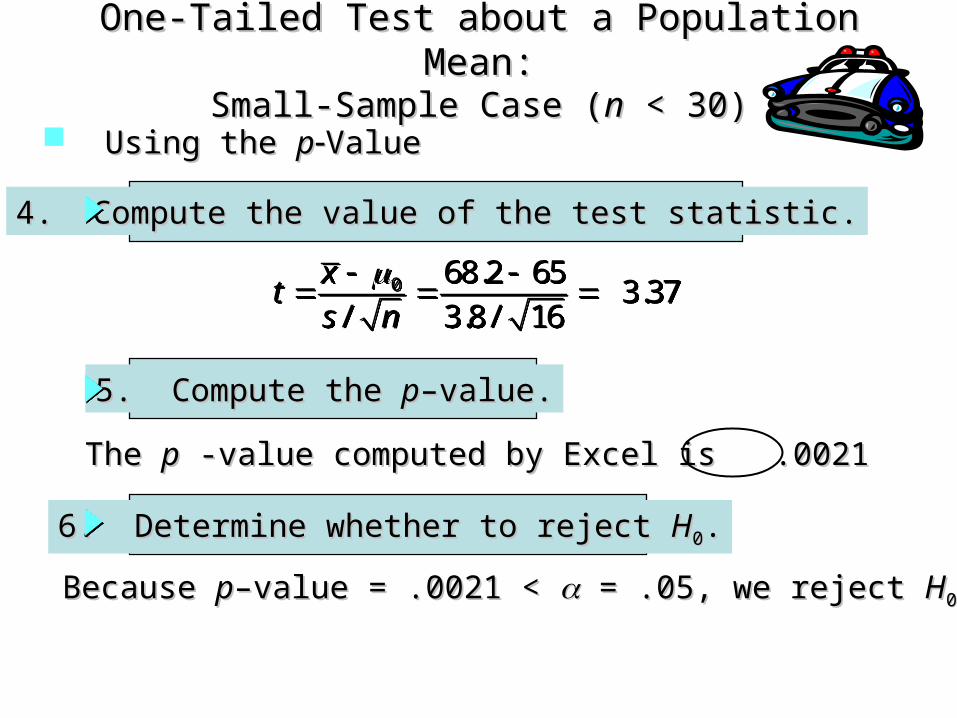
5. Compute the value of the test statistic.5. Compute the value of the test statistic.
0 (67/ 120) .5 1.278
.045644p
p pz
0 (67/ 120) .5 1.278
.045644p
p pz
0 0(1 ) .5(1 .5).045644
120p
p pn
0 0(1 ) .5(1 .5).045644
120p
p pn
a common errora common erroris to use inis to use inthis formula this formula
pp

Two-Tailed Test about aTwo-Tailed Test about aPopulation ProportionPopulation Proportion
Using the Test StatisticUsing the Test Statistic
6. Determine whether to reject 6. Determine whether to reject HH00..
Because 1.278 > -1.96 and < 1.96, we cannot reject Because 1.278 > -1.96 and < 1.96, we cannot reject HH00..

Formula WorksheetFormula Worksheet
Using Excel to Conduct HypothesisUsing Excel to Conduct HypothesisTests about a Population ProportionTests about a Population Proportion
Note: Rows 14-121 are not shown.Note: Rows 14-121 are not shown.
A B C
1Drunk
Driving Sample Size 1202 No Number of "Yes" =COUNTIF(A2:A121,"Yes")3 Yes Sample Proportion =C2/C14 No 5 Yes Lev. of Signif. 0.056 No Crit. Value (lower) =NORMSINV(C5/2)7 Yes Crit. Value (upper) =NORMSINV(1-C5/2)8 Yes9 No Hypoth. Value 0.510 No Standard Error =SQRT(C3*(1-C3)/C1)11 Yes Test Statistic =(C3-C8)/C912 Yes p -Value =2*(1-NORMSDIST(C11))13 Yes Conclusion =IF(C12<C5,"Reject","Do Not Reject")

Using Excel to Conduct HypothesisUsing Excel to Conduct HypothesisTests about a Population ProportionTests about a Population Proportion
Value WorksheetValue WorksheetA B C
1Drunk
Driving Sample Size 1202 No Number of "Yes" 673 Yes Sample Proportion 0.55834 No 5 Yes Lev. of Signif. 0.056 No Crit. Value (lower) -1.9607 Yes Crit. Value (upper) 1.9608 Yes9 No Hypoth. Value 0.510 No Standard Error 0.045611 Yes Test Statistic 1.27812 Yes p -Value 0.20113 Yes Conclusion Do Not Reject
Note: Rows 14-121 are not shown.Note: Rows 14-121 are not shown.

Using the Using the ppValueValue
4. Compute the value of the test statistic.4. Compute the value of the test statistic.
5. Compute the 5. Compute the pp–value.–value.
6. Determine whether to reject 6. Determine whether to reject HH00..
Because Because pp–value = .201 > –value = .201 > = .05, we cannot reject = .05, we cannot reject HH00..
The The pp -value computed by Excel is .201 -value computed by Excel is .201
37.316/8.3
652.68
/0
ns
xt
37.3
16/8.3
652.68
/0
ns
xt
Two-Tailed Test about aTwo-Tailed Test about aPopulation ProportionPopulation Proportion