Embed Size (px)
Citation preview

35
CHAPTER III
Józef Koc1, Paweł Skonieczek2, Marcin Duda1
POTENTIAL FOR SEWAGE WATER PURIFICATION IN
AN AQUEOUS ENVIRONMENT BY A CONSTRUCTED
WETLAND
Introduction
Modern development and improvement of the quality of life has been accompanied by increasing populations outside big cities. Formerly rural areas are frequently assuming non-agricultural functions such as settlement, services, logistics, industry and recreation. This has resulted in an increase in the amount of waste matter and acceleration of its circulation; as sewage and waste it also becomes a threat to the environment. Many years without sewerage systems and sewage treatment plants or systems of waste collection and disposal, with waste management systems based on makeshift septic tanks and rubbish dumps, has resulted in an accumulation of waste in the environment, mainly in the soil and subsurface water. Contaminants have been spreading and contributing to increased fertility of underground waters and small streams. Such streams are also fed with discharges from sewage treatment plants, which has negative consequence because systems of lower treatment effectiveness and higher biogenic element concentrations in post-treatment waters are acceptable due to a low building density and the small amounts of sewage for treatment (Ministry Regulation of 29.11.2002). As a result, waters are polluted by the following types of contaminations (KOC 1994): − from natural sources
• products of rock erosion; • products of organic matter transformations in soil;• secretions and excrements of living organisms; • substances contained in atmospheric precipitation;
− from agricultural sources • components or mineral and organic fertilizers which have not been taken up
by plants; • remains of pesticides which have not been decomposed; • remains of fuels and products of their combustion; • animal excrements as sewage from animal breeding farms; • runoff from fodder silos and fodder storage houses;• excrements of animals which are permanently grazing, washed down by
rain;
36
− from non-agricultural sources • rainwater runoffs from roads and hardened areas; • contaminations of transport-related origin from transport routes; • runoff from legal and illegal rubbish dumps; • products of fuel combustion; • sewage treatment plant discharges; • inflow of contaminated rainwater from urban areas; In this case, water carries elements of natural matter circulation combined with
contaminants from the environment and those produced by day-to-day activities of rural area inhabitants. Sewage discharges from treatment plants often cause the quality of water in small streams to deteriorate due to higher acceptable limits of contaminations and biogenic element concentrations as well as a higher contribution of sewage discharge in flowing water than is the case with large urban agglomerations, where discharges from treatment plants flow off to bigger rivers (TUCHOLSKI et al. 2007). Therefore, rural area sanitation schemes are being carried out to prevent increases in environment pollution, but their effects are below expectations.
The unsatisfactory rate of improvement of water quality puts Poland at odds with the commitments it has made under international agreements (GUS, 2009). By ratifying the Helsinki Convention, Poland committed itself to take steps to arrest the growth fertility of the Baltic Sea by improving the quality of inflowing rivers (which are largely dependent on the quality of their tributaries), including the elementary watersheds in the upper parts of the drainage basins.
Consequently, a crucial task is to improve the water quality in small streams. It is a difficult problem and closely dependent on the natural factors which govern the matter and energy circulation in the environment which has been considerably transformed throughout the country.
Natural factors affecting water quality in rural areas
The transformation of primeval landscape into agriculturally-utilized areas has affected hydrographic conditions by shortening and simplifying water circulation cycles. The gradual increase in field and pasture areas at the expense of forests has brought about a reduction of soil retention and deterioration of infiltration conditions, while at the same time facilitating surface runoff of rainwater. These processes have resulted in negative transformations of natural biogeochemical cycles (STACHOWICZ 1997). The situation has been aggravated by drainage run-off, which accelerates substance outflow from the soil (BOROWIEC, ZABŁOCKI 1990, KOC, SZYMCZYK 2001).
Agricultural contaminates are primarily area-related. They include mineral and organic fertilizers applied in field cultivation as well as erosion-related surface run-off from rural areas (PAWLIK-DOBROWOLSKI 1990; WODNO-BILANSOWE... 1998). Agricultural contaminates also originate in dispersed point sources, such as homesteads (residential buildings and septic tanks) and objects related to animal production (livestock buildings, manure heaps, tanks of animal slurry and liquid manure, silos and silage heaps, etc.). The intensity of contaminate inflow to water

37
from the sources scattered around the area depends on various factors, including: land use, size of the area and its inclination, soil type, vegetation, population density. Substance migration from soil with water is largely affected by the type of agricultural activity, including: type of cultivated plants, coverage of soil with vegetation, level and manner of organic and mineral fertilization, mass of post-harvest remains decomposed in autumn and in winter and livestock density (PAWLIK-DOBROWOLSKI 1990; GIERCUSZKIEWICZ-BAJTLIK 1990; WODNO-BILANSOWE... 1998). An important role in the process is also played by hydrological and soil-related factors, i.e. the amount and distribution of rainfall and spring thaw water, occurrence of torrential rain, intensity of surface run-off, type of soil, organic matter content in soil and air-water relations (WODNO-BILANSOWE... 1998).
It is of fundamental importance for the quality of water in elementary drainage basins how many nutrients are discharged by small sewage treatment plants and how many nutrients are supplied to rural areas in order to boost agricultural production. This can be controlled by calculating a balance of biogenic elements on different scales: for the country, the region, the drainage basin and by monitoring water condition.
According to DYMACZEWSKI et al. (1997) and HARTMANN (1999), specific saprobic zones, with different types of organisms dominating, form in the stream flow below the sewage discharge inflow, depending on the stream load with impurities. The following saprobic zones are identified: a deoxidation and degradation zone, situated immediately below the discharge site of improperly treated or untreated sewage (polysorbic zone); intermediate zones, where aerobic conditions are being restored, (�- and �-mesosaprobic zones); a water restoration zone or unpolluted zone (oligosaprobic).
Impurities flowing into the streams and water bodies are reduced, but this is the case only until the threshold of water ability to self-purify is exceeded. The process results in the formation of mineral forms of biogenic elements. Those which flow in from various sources form the base of primary production, whose size exceeds the consumptive capabilities of higher links in the food chain. Excess primary production is decomposed by destruents, often under a shortage of oxygen, with toxic substances excreted and non-mineralized organic substance accumulated. In effect, biogenic inflow in excess of absorptive capabilities in hydrobiocenoses results in secondary water contamination, especially in water bodies with low water exchange indices in a lake-river system.
Degradation of aqueous ecosystems results in upsetting the balance between the amount of contaminations of human origin and the capability of their neutralization in the environment, i.e. of self-purification. This is the reason for increasing environment pollution, excessive eutrophication and water productivity.
The decrease in pollution growth rate and reduction of pollution in small streams is insufficient given the necessity to achieve a significant improvement in water quality and lowering of the concentration of contaminations and biogenic elements carried with water to the Baltic Sea. More effective sewage management should include highly effective biological processes which stimulate biological transformations and result in water purification (WÓJCIK 1993, STRUTY�SKI 1997).
Each undertaking aimed at reducing the load of impurities in surface waters is worth considering, especially if it requires small investment outlays. It is of great

38
importance in reducing the migration of nutrients to waters to properly manage the banks of streams and coasts of water bodies and to create buffer zones (SÖDERGREN
1993; HAYCOCK et al. 1996; KOC et al. 2001). Seeking new methods of effective utilization of existing objects in environment
protection involves studies of constructed wetlands. Characteristic features of such objects include shallow depth, high heating/cooling rate and intense mixing –factors which play an important role in matter transformations. The intensity of biogenic elements absorption in a water body depends mainly on the season of the year, the size of inflowing loads of impurities and the retention time. Studies have been carried out in order to determine the reduction of concentrations and loads of impurities in a stream carrying water from a forest and agricultural area which was additionally contaminated with sewage from a sewage treatment plant, after flowing through a constructed wetland. Rural area sanitation schemes provide the possibility of channelling off sewage to larger, more effective treatment plants to reduce impurity loads in this type of object. It is also important to determine how a constructed wetland and the sludge accumulated in it will behave both during and after a period of sewage discharge to the stream.
Fundamentals of constructed wetlands operating as biogeochemical
barriers in the environment
When seeking methods of surface water protection against eutrophication, a possibility was suggested of using small constructed wetlands as impurity eliminators (CZAMARA 2002). The amount and temporal variability of impurities inflowing to water bodies depends on:
• use of watersheds above a constructed wetland; • seasons of the year and the related periods of vegetation and agricultural
procedures; • torrential rains and erosion-causing run-offs during intensive thaws; • intensity of run-off from the drainage systems which supply water bodies; • sewage inflow from settlements and loads of impurities carried by it. Constructed wetlands should be situated below the existing inflows carrying
increased loads of impurities. A newly constructed wetland in a stream valley results in the following: • changes in matter and energy circulation within the system; • creation of a new eco-system with a clear tendency to self-organize which is
intended to achieve stable equilibrium; • change of intensity of factors which regulate the matter and energy
circulation rate. The presence of a constructed wetland along the stream flow route reduces the
water flow rate, which results in sedimentation of impurities carried with water (PARZONKA 1991, MADEYSKI, TARNAWSKI 2004). A decrease in the water flow rate in the initial part of the wetland results in separation of sedimenting particles by size and specific weight. The largest mineral particles sediment first, followed by smaller and smaller ones in consecutive sections of the stream. Organic-mineral and organic

39
(colloidal) particles do not sediment until they reach the middle part of the wetland and before the weir, where the flow rate is the lowest. The substances dissolved in water may form insoluble deposits of calcium sulphates and phosphates and aluminum and iron phosphates.
Biogenic substances dissolved in water are taken up by plants and contribute to the production of organic mass (primary production) in the wetland. After being consumed, plants are returned to water as excrements of herbivores and predators. A special role is attributed to macrophytes, which act as filters of suspensions in the littoral zone. CHUDYBA and KALWASI�SKI (1998) claim that retaining inflowing matter in the littoral zone is closely connected with the presence of higher plants. Their morphological structure, combined with appropriate growth density, turns them into mechanical filters. This effect applies mainly to dispersed impurities with high levels of suspension. Settlement of suspensions on plants is closely related to decreased water flow in the littoral zone. The largest amount of suspensions is retained by spiked water-milfoil (Myriophyllum spicatum L.), and the smallest is retained by aquatic moss (Fontinalis antypyretica). Higher plants also retain oil and petrochemical impurities. Discussion of the role of littoral as a filter must not be confined to mechanical action of macrophytes. Higher vegetation can take up organic and mineral substances and use them in metabolism, or accumulate them in cells. Many authors claim that macrophytes are a fundamental factor which affects water quality in water bodies, and the more of them there are, the more capable the water bodies are of self-purifying (SZYPEREK 2003). As the eutrophication and primary production increases, the food chain breaks down due to biomass excess, reduced amount of light reaching the depth of water as well as a shortage of oxygen in the water during periods when no photosynthesis takes place (night, winter) and its consumption for plant respiration. The living conditions of herbivores and predators deteriorate. Unconsumed plants settle and become part of bottom deposits. Sedimenting substances carried with water which are produced in the constructed wetland form a deposit layer, which is initially resuspended and decomposed. As time passes, the deeper layers of more intensely mineralized sediments stabilize and fresh layers are superimposed on them. Water movement in the constructed wetland causes deposits to accumulate in its deepest places where deposits containing more organic matter settle due to slower sedimentation in the flowing water and its easy transport with water currents. An excessively high content of biogenic substances in water contributes to development of vegetation in the littoral and sub-littoral zone and in shallow waters. Due to intensive eutrophication, competition is won by plants with high nutritional needs and those which produce high levels of biomass. Impurities are absorbed and substances sediment in the overgrown zone of the constructed wetland. Water and macrophyte movement, caused mainly by wind, disturbs the sediments and brings about their mineralization and transfers them to deeper layers of the wetland (SIWEK et al. 2009). However, intense growth of phytoplankton in over-fertile wetlands reduces light access to the water depths and brings about extinction of submerged and partly submerged plants. Oxygen shortage in water may occur as it is consumed in respiration.
Impurities carried with water are removed by sedimentation, precipitation of insoluble compounds, coagulation of dispersed colloids and biosorption. This produces sediments which are transferred, resuspended and decomposed – resulting
40
in the release of accumulated substances. The initial period of the constructed wetland existence is dominated by the processes of water purification and its renewal. This is followed by a period of equilibrium of the processes of impurity trapping and release from sediments. The wetland then stops playing the role of a biogeochemical barrier. This is preceded by a transition period when the wetland plays its role only during the vegetation period. The biological, physicochemical and chemical processes mentioned above, and especially the equilibrium between impurity absorption and release, are considerably affected by weather conditions, including temperature, wind and light, as well as the amount of inflowing impurity loads. Therefore, after the initial period of the wetland existence, when water is purified all year round, it is highly effective in water purification during the vegetation period, but its effectiveness is reduced outside it, especially in winter. When the phase begins with water being purified in summer and contaminated in winter due to the domination of impurity release from sediments, it is a sign that the water body has to be rehabilitated by sediment removal or stabilization.
The equilibrium between impurity absorption and release depends on its concentration in flowing water. If impurity inflow to a constructed wetland (which purifies strongly contaminated waters) ceases, e.g. because sewage treatment plant effluent is channeled off outside the drainage basin, such a wetland may become a source of impurities due to a shift in the equilibrium towards impurity release from sediments. The wetland is supplied with biogenic substances and impurities from within (BORÓWKA 2007). Hence, after a period when the wetland is used as a biogeochemical barrier for the impurities carried with water, its control (and frequent rehabilitation) is necessary.
The high effectiveness of water purification by macrophytes has encouraged the use of artificial systems mimicking marsh ecosystems in the purification processes of sewage and sewage-contaminated waters. Natural treatment facilities make use of the ability of the soil and vegetation of marshy ecosystems to retain and decompose impurities present in waters and sewage. Constructed wetlands which mimic marshy ecosystems are more effective in purification than natural water bodies (COVENEY 2002).
Using constructed wetlands to reduce impurity loads inflow leads to their degradation. Water bodies situated in urban drainage basins and those in the vicinity of farms are particularly susceptible to degradation. Surface run-off from built-up areas carries impurities at high concentrations, including nitrogen and phosphorus. It is important to determine the threshold values and impurity loads absorbable by these systems. They could provide a basis for calculating the maximum acceptable anthropogenic loads in systems of small streams and constructed wetlands on their way. Such systems usually receive effluent from rural sewage treatment plants. Failure to find an accurate solution to the problem results in progressive degradation of the rural areas where small streams are particularly valuable, performing many functions that no other systems can perform.
Owing to their features, small water bodies are specific ecosystems which are significantly different from each other and different from other environments in our climatic zone. They can perform several valuable and complex functions. These include: biocenotic, hydrologic, sozologic, landscape-related, educational, economic, leisure-related (KOC et al. 2001). Consequently, their use in order to

41
improve water quality has to be subordinated to its broader biocenotic role in the environment. It seems that the complicated relations that govern them have not been sufficiently explored and require new research into their operation, natural importance and transformation.
Studies of the operation of a constructed wetland situated in a stream
flow
The issue of the effectiveness of a constructed wetland as a filter of impurities carried with the stream water is illustrated by a study conducted in the Olsztyn Lake District. The operation of a constructed wetland situated on a stream carrying water contaminated with effluent from a sewage treatment plant was examined in a small closed-circulation object, typical of rural areas – the drainage basin of the stream of Sz�bruk, whose waters flow into Lake Wulpi�skie. The stream is 5.1 km long and its drainage basin area is 13.2 km²; it is an agricultural area with human settlements, forest accounts for 30% of its area. There are 630 people living there.
The study determined the relationship between the environment components and the factors affecting the operation of the stream-constructed wetland system, including especially: hydrological relationships, variability of water and sewage composition caused by various factors (intensified anthropo-pressure, season of the year, topographic and weather conditions), as well as the effect of various ecosystem parts (water, bottoms, vegetation) on self-purification of flowing water.
In the backwater area, the water of the stream of Sz�bruk may flow into the pond or through the surrounding ditch which is a continuation of the stream around the pond, or divided into the outflow into the pond and the surrounding ditch. Agricultural area runoff flows into the main stream, to the surrounding ditch and directly to the pond. The outflow from the pond and from the surrounding ditch below the pond join and flow on as the Sz�bruk stream to Lake Wulpi�skie.
A constructed wetland, where fish used to be bred, is now a water body which intercepts point and area impurities flowing in with the stream, which collects water from the drainage basin. This creates a peculiar aspect of the wetland as a specific biogeochemical barrier for biogenic substances inflowing directly to Lake Wulpi�skie. The wetland acts as a biofilter – it intercepts and accumulates biogenic substances, thereby protecting the lake waters, and evolves as its eutrophication level, biocenosis and bottom deposits change.
Evaluation of the water quality was based on the physicochemical analyses in 4 cross-sections of the water in the Sz�bruk stream on two tributaries flowing in from the drainage basin and on the outflow from the constructed wetland (Fig. 1). During the period covered by the study, samples of water were taken from the stream and from the constructed wetland every month.
The studies were conducted during a period when two sewage treatment plants – no. 1 in Unieszewo and no. 2 in Sz�bruk – were in operation, when their outflows were channeled off to the Sz�bruk stream (2002-2003). This was also when a sewerage system was operating in the area and the sewage from the settlements was channeled off to a treatment plant situated outside the drainage basin (2006-2007).

42
Fig. 1 Positions of measurement sites in the Sz�bruk stream drainage basin
Water flow was measured with an electromagnetic flowmeter manufactured by Valeport, model 801 (UK).
Unit water outflow at different measurement sites varied throughout the study period. The unit inflows determined in the study were affected by the size of the drainage area above the flow measurement site.
The water flow up to the place where it was divided into the surrounding ditch and the constructed wetland increased with the size of the drainage basin, which is consistent with the fundamental relationship between the increase of waterflow in a stream with the increasing area of its drainage basin. Such streams are referred to

43
as draining streams (BYCZKOWSKI 1996). Different situation was in the case of the flow in the surrounding ditch supplied from the agricultural drainage basin and in the outflow from the constructed wetland. This was caused by evaporation from the water surface and by transpiration of emergent vegetation. The highest (extreme) fluctuations of water inflow – from no inflow to the highest observed in the system – were recorded in the inflow to the drained areas. The constructed wetland may play the role of outflow regulator because its structure reduces rapid outflow fluctuations; it can also receive large amounts of water and release it after a period of delay (Fig. 2).
0
10
20
30
40
50
dm-3. s-1
average 14,2 26,8 5,3 3,6 15,4 3,1 18,5
min 7,2 12,2 0,0 0,2 0,0 0,0 2,1
max 33,1 92,1 40,2 18,6 94,8 24,1 103,9
1 2 3 4 5 6 7
Fig. 2 Water flow at specific flow measurement sites [dm-3. s-1], description of flow measurement sites as per Table 1
The effect of the constructed wetland on impurity concentrations and
loads in flowing waters
It is very difficult to monitor the processes of impurity loads flowing through water bodies in natural conditions due to their complexity and temporal variability. The processes’ dynamics are associated with the variability of factors which affect the supply of external impurity loads and changes that take place inside the water bodies.
In general, the lowest values of the parameters were determined in the upper parts of the Sz�bruk stream (measurement site no. 1) where it carries waters from the agricultural and forest drainage basin (Table1). The water is regarded as good quality water [REGULATION …]. The concentration of impurities grew with the increase in the drainage basin area and was especially high during the period when the treatment plants were in operation.
Discharge from the Unieszewo treatment plant, which consisted of three filtration plots and two tanks, supplied 7.8 m3 of pre-treated sewage a day, which is equivalent to 0.09 dm-3.s-1. These amounts did not significantly increase the flow. The Sz�bruk treatment plant, which worked periodically with two stoppages for clearing and sewage discharge to the stream, daily discharged 50 m3 of pre-treated sewage. The sewage was discharged twice a day for 30 minutes. First, it reached the intermediate ditch, which considerably prolonged the time of inflow of pre-treated sewage to the Sz�bruk stream (measurement site no. 2). This prevented any

44
significant flow increase in the stream and made it dilute, which favours self-purification. The total daily inflow of sewage from both treatment plants to the Sz�bruk stream was 58 m3. Sewage contributed 2.5% to the temporary flow and 33% at the time of discharge (Fig. 2).
Effluent from the first treatment plant lowered the water quality, which manifested itself in an increase in the analyzed parameter values. However, the increase was small compared to the impact of effluent from treatment plant no.2; this allowed the stream to retain its ability to self-purify. It was only after sewage was discharged from treatment plant no. 2 (in Sz�bruk) that water quality dramatically deteriorated, with a resulting oxygen deficit (KOC ET AL. 2004). The tested parameters values increased, and those of ChODCr, Ntot, Ptot, K, Na, Cl even multiplied during the sewage discharge. The water quality in the stream deteriorated at that time and was classed as category III (medium quality water).
Water contaminated with sewage, self-purified while flowing through the constructed wetland situated below (Table 1). Ash content was reduced by 28%, ChODCr by 40%, conductivity by 45%, total nitrogen by 88%, total phosphorus by 84%, potassium by 68%, magnesium by 7%, sodium by 76%, chlorine by 59% and sulphates by 61%, calcium concentration increased by 33%. However, the quality improvement in the part of water that flowed through the surrounding ditch was much smaller. The dry residue content decreased by 13%, ash content by 8%, ChOD by 51%, conductivity by 30%, total nitrogen by 70%, total phosphorus by 90%, potassium by 56%, sodium by 74%, chlorine by 52, sulphates by 58%, calcium concentration increased by 55% and that of magnesium - by 1%. The better water quality improvement in the constructed wetland as compared to the surrounding ditch must be attributed to slower water flow, which ensured more favourable conditions for biological and physicochemical processes. A decrease in the concentration of water impurities during the water flow through their wetland is not fully equivalent to the actual effect of the process due to a significant reduction in water volume as a result of evaporation (Fig. 2).
Only after flowing through the constructed wetland, where its oxygenation improved and suspension sedimentation and mineral substances phytosorption took place, did the tested parameters return to the values from before the sewage discharge from the treatment plant. The water quality can be regarded as restored. During the sewage discharge from the treatment plant in Sz�bruk, the values of all the parameters at the outflow to the lake, except for Ca and Mg, were lower than at the site before the inflow to the constructed wetland, despite an increase in the drainage basin area and inflow of impurities. The constructed wetland not only reduced the load of impurities discharged from the treatment plant, but also that inflowing from the drainage basin. The nutrients present in the contaminated water (and subsequently flowing through the constructed wetland of considerable area – 24.8 ha) were used for primary and secondary production in those ecosystems and accumulated in their bottom deposits (ALLAN 1998).

45
Table 1Concentration of substances dissolved in the water of the stream of Sz�bruk, carrying water from agricultural areas and from sewage treatment plants (mgdm-3)
Measurement site Dry residue Ash ChOD Conducti
vity Ntot Ptot
Potassium
Calcium Magnes
ium Sodium
Chlorine
Sulphates
216*192-272**
137102-164
14.68.4-26.0
241155-281
1.731.02-2.81
0.190.11-0.31
1.00.6-1.7
43.440.8-46.4
5.53.7-6.7
4.33.6-4.8
76-8
52.823.9-117.8 Forest runoff (1)
±23*** ±20 ±5.8 ±43 ±0.57 ±0.069 ±0.3 ±1.7 ±0.9 ±0.3 ±1 ±30.71
350220-948
215140-532
23.98.4-56.8
360291-555
4.511.05-19.88
0.5650.22-2.84
3.21.0-8.4
53.240.8-69.6
8.24.5-17.6
8.04.4-23.5
97-12
57.433.4-134.1 Before the wetland (2)
±207 ±112 ±12.7 ±74 ±5.63 ±0.76 ±2.4 ±8.4 ±3.6 ±5.2 ±2 ±31.6
420312-784
261128-496
67.621.6-136
675419-1230
26.2512.60-41.58
3.551.02-7.82
10.81.3-34.2
49.435.6-67.4
9.45.1-19.2
32.64.8-97.8
279-42
121.1625.0-280.9
Before the wetland at the time of sewage
discharge (2a) ±138 ±100 ±43.2 ±224 ±10.65 ±2.48 ±8.5 ±9.5 ±4.0 ±25.9 ±12 ±84.0
365231-923
222145-516
25.413.3-56.7
373315-556
5.422.51-20.02
0.690.32-2.88
3.51.3-8.5
53.040.9-69.5
8.44.7-17.7
9.05.2-23.7
108-12
60.0637.71-131.27
Before the wetland – 24 h average (2b)
±203 ±110 ±12.1 ±74 ±5.27 ±0.74 ±2.3 ±8.4 ±3.7 ±5.1 ±1 ±29.48
529212-936
447112-692
43.823.2-59.2
639205-888
7.822.30-23.30
0.150.04-0.28
4.02.2-6.9
101.231.4-188.0
14.14.4-26.2
7.61.8-10.5
155-22
138.534.7-529.4
Inflow through the drain pipe to the
wetland (3) ±270 ±191 ±11.1 ±267 ±6.81 ±0.095 ±1.6 ±56.1 ±7.1 ±2.7 ±5 ±149.5
372236-604
189144-284
40.930.0-69.2
372264-527
3.161.66-7.30
0.360.17-0.67
3.50.9-6.2
65.836.2-103.0
8.85.7-12.0
7.94.8-12.0
119-16
46.818.1-74.2 Outflow from the
wetland (4) ±130 ±41 ±11.5 ±77 ±1.86 ±0.15 ±1.9 ±21.8 ±2.1 ±1.9 ±2 ±17.7
630344-784
371160-572
42.625.0-56
775361-1042
8.504.99-13.04
0.330.08-1.36
10.18.2-13.4
104.253.1-152.0
14.76.7-23.6
11.64.0-15.8
2819-38
122.764.8-414.2
Inflow through the drain pipe to the
surrounding ditch (5) ±138 ±131 ±10.8 ±190 ±2.78 ±0.43 ±2.0 ±33.1 ±5.7 ±3.5 ±6 ±110.4
365236-464
240136-292
33.124.8-47.6
471220-629
3.851.79-6.51
0.360.10-0.92
4.81.3-8.4
76.931.3-101.0
9.54.2-14.6
8.52.9-10.5
139-18
51.124.0-82.8 Outflow from the
surrounding ditch (6) ±81 ±52 ±6.5 ±115 ±1.71 ±0.21 ±2.2 ±20.3 ±3.6 ±2.2 ±4 ±18.7
332248-408
236132-316
31.724.0-39.6
442291-540
3.531.14-6.66
0.350.19-0.48
4.41.0-7.6
74.943.4-111.0
9.55.2-11.7
8.02.5-10.5
139-18
47.023.8-92.5 Outflow to the lake (7)
±58 ±53 ±4.0 ±70 ±1.91 ±0.11 ±2.1 ±17.6 ±1.9 ±2.3 ±3 ±19.6
* average, ** min-max, *** ±SD
45

46
An analysis of the impurity load carried with water showed that it was considerably reduced after the water had flowed through the constructed wetland (Table 2). The dry residue load decreased by 87%, ashes – by 90%, ChODCr - by 80%, total nitrogen - by 93%, total phosphorus - by 92%, potassium - by 87%, calcium - by 85%, magnesium - by 87%, sodium - by 88%, chlorine - by 86% and sulphates - by 91%. The reduction level of the load of impurities were found to be lower in the surrounding ditch: 55% for dry residue, 54% for ash, 54% for ChODCr, 53% for total nitrogen, 25% for total phosphorus, 67% for potassium, 58% for calcium, 56% for magnesium, 48% for sodium, 67% for chlorine and 59% for sulphates. The system consisting of the surrounding ditch and the constructed wetland brought about reduction of the dry residue by 70%, ash - by 73%, ChODCr by 67%, total nitrogen - by 75%, total phosphorus - by 86%, potassium - by 60%, calcium - by 67%, magnesium - by 70%, sodium - by 74%, chlorine - by 61% and sulphates - by 71%.
Table 2 Load of dissolved substances in the water of the stream of Sz�bruk carrying impurities from
sewage treatment plants and agricultural areas (kgyear-1)
Measurement site
Dry residue
Ash ChOD Ntot Ptot K Ca Mg Na Cl Sulpha-
tes
Forest runoff (1)
96932 61487 6566 777 86 450 19505 2463 1937 3005 23764
Before the wetland, 24-
hour average(2)
309230 188061 21525 4588 584 2987 44882 7116 7655 8498 50853
Stream inflow to the wetland (2)
222893 135554 15515 3307 421 2153 32351 5129 5518 6125 36655
Stream inflow to the surrounding
ditch (2)
86337 52507 6010 1281 163 834 12531 1987 2137 2373 14198
Drain pipe inflow to the wetland (3)
59377 50128 4913 878 16 450 11360 1582 853 1628 15548
Outflow from the
wetland (4) 36367 18486 3997 309 35 347 6434 859 767 1089 4574
Drain pipe inflow to the surrounding
ditch (5)
106292 62594 7185 1433 55 1708 17582 2482 1961 4777 20714
Outflow from the
surrounding ditch (6)
176908 116355 16027 1861 172 2306 37208 4616 4138 6447 24726
Outflow to the lake (7)
192647 137153 18378 2049 201 2548 43435 5507 4647 7464 27257

47
Load of biogenic substances in bottom deposits
Bottom deposits in rivers and water bodies are a useful geomedium used in control of the quality of surface waters in terms of the level of eutrophication and contamination with heavy metals and harmful chemical compounds. Since the concentrations of harmful substances in deposits are several times higher than in water, an analysis of deposits enables detection and monitoring of changes of their content even when the level of contamination is relatively low (URBAN et al. 1997; BAUDO, BELTRAMI 2001). Therefore, analyses of deposits near various sites of contamination, e.g. near the sites of sewage discharge, are important in monitoring the level of environment pollution.
Impurities and detritus settle on a continuous basis and form bottom deposits, which are a kind of “archive”. Deposit particles bind both biogenic substances and heavy metals, which are among the most persistent toxic substances entering aqueous ecosystems (BAUDO, BELTRAMI 2001; SOBCZY�SKI, SIEPAK 2001). The process of settlement of particles, formation of a deposit layer on the water bodies bottom and consolidation of such a layer depend on a number of factors (Parzonka 1991), which can be divided into geomorphologic, hydraulic, hydrodynamic and exploitational factors. The processes are greatly affected by the particle features, their accumulation, organic matter content and the presence of soluble salts in water.
The bottom deposit sampling sites are shown in Fig. 3. The bottom deposits varied in terms of thickness and physicochemical properties (Table 3, 4). The highest thickness was recorded for the cores taken in the middle of the constructed wetland – up to 20 cm at a water depth of 1.51 m, whereas the lowest thickness was recorded in the stream flow. In fact, there was no typical layer of bottom deposits as is usually the case with water bodies. The stream bottom is covered with a coarse material, as finer particles are washed away, especially with increased flow, and are transported along the stream. They settle when the flow rate decreases or when they meet with the vegetation resistance or when flowing through the constructed wetland (MADEYSKI, TARNAWSKI 2004).
Due to the small thickness and low variability in terms of the colour and structure of the bottom deposits from the stream and the constructed wetland (probably due to their age), the cores of those deposits were not divided into layers.
The pH value of the sediments in the research site ranged from 4.98 in KCL (5.34 in H2O) to 7.66 (7.45 in H2O). The lowest values were found at the first line in the wetland where contaminated water flows in (Table 3). The pH value was recorded in the 10-20 cm layer of the water body (Table 4). The lowest concentration of carbonates was recorded in the initial sections of the wetland in the 10-20 cm layer (0.13%) whereas the highest (67.89%) was in the final section of the surrounding ditch.
The bottom deposits varied in terms of the content of biogenic compounds (Table 5, 6).
Of the elements whose content in the bottom deposits were analyzed, calcium dominated, which is a consequence of it flowing in from the drainage basin. In general, the largest concentrations of Ca were recorded in the sample taken in the final section of the surrounding ditch (measurement site no. 8), where the parameter value was 100100 mg Ca⋅kg-1 d.m. The lowest concentrations of the element were

48
recorded below the forest runoff inflow – 858 mg Ca⋅kg-1 d.m. The chemical compositions of the sediments can modify the substrate, which was the case with Ca. Calcium content was the most variable, both in the vertical and horizontal profile. An over 4-fold difference in the element concentration was recorded in the wetland between the neighbouring measurement sites.
Fig. 3. Sites of bottom deposits sampling in the stream and in the constructed wetland
Nitrogen is another element whose content differs from that of the others; however, it dominates mainly in the wetland, both in the 0-10 cm and in the 10-20 cm layers. This shows that the element accumulates in the pond bottom, which considerably contributes to the protection of the next system component – the lake. The highest concentrations of nitrogen were recorded in the sediments of the central part of the pond, close to the depths. The values were the highest both in the surface layer 0-10cm (15.6 g⋅kg-1 d.m.) and in the layer 10-20cm (16.0 g⋅kg-1 d.m.); this

49
shows that sediments flow and settle in the deepest places of the wetlands. It is in the central part of the pond (measurement site 11b) that bottom deposits of up to 20 cm thick were recorded, whereas 3-cm layers occurred in the extreme lines of sediment sampling - 10 a, c and 11 a, c. SKWIERAWSKI (2003) showed the concentration and distribution of nitrogen to be strongly correlated with the amount of organic matter, which indicates that the nitrogen in the sediments is mainly found in organic compounds. The dominant position of nitrogen in bottom deposits has been reported by SZYPEREK (2004), who recorded the highest contents of nitrogen in tributaries, MÜLLER et al. (1998) in lakes of Central Europe (63-Switzerland, 2-France, 3-Italy), and GAWRO�SKA (1989) in sediments of Lake B�skie.
Phosphorus content ranged from 218 mg⋅kg-1 d.m. below forest runoff inflow to 1788 mg⋅kg-1 d.m. in the initial section of the pond and at the outflow to the lake, which – as was the case with nitrogen – is indicative of the effect of the drainage basin on biogenic compounds depositing in sediments. That the pond was supplied by runoff from the drainage basins is indicated by a decrease in the phosphorus concentration with increasing distance from the inflow site. The concentration of the element in bottom deposits may result from its intense exchange in the sediment-water interface. The amount of phosphorus released from sediments to water may be particularly high, especially during the vegetation period, when primary production demand for the element is high, but also when conditions favour re-suspension and with oxygen deficit (KAJAK 2001). Accumulated in sediments and being the main factor in water eutrophication, phosphorus plays a double role in bottom deposits. On the one hand, the considerable amounts of phosphorus retained in the deposits shows that deposits are effective as a trap for phosphorus migrating in the environment but, on the other hand, high concentrations of phosphorus may trigger processes which take place in a water body, accelerating its turning into land (SKWIERAWSKI 2003). Under anaerobic conditions or under such that favour resuspension (water rippling at small depths), the amount of phosphorus released to water may be very high, especially during the vegetation period (KAJAK 2001).
Potassium is not regarded as an element which affects the process of eutrophication, but it is used in agriculture and may be an indicator of the intensity of agricultural soil use in the drainage basin. Its content ranged from 996 mg⋅kg-1
d.m. in the bottom deposits below the forest drainage basin to 6308 mg⋅kg-1 d.m. in the deposits of the central part of the pond. No significant differences were recorded between the surface and subsurface layers.
The highest concentrations of magnesium were found in samples taken in the central part of the pond – 5126 mg⋅kg-1 d.m. in the layer 10-20 cm. The lowest concentration was found below the forest drainage basin 362 mg⋅kg-1 d.m.
As compared to other macroelements, the concentration of Na and S in the analyzed samples was less varied.
Analysis of bottom deposit cores provides grounds for examination of the abundance of selected macroelements in the deposits. They show the variability of component concentration through the pond bottom in the cross section and the longitudinal section, from the inflow to the outflow. It is a general tendency that larger amounts of macroelements accumulate along the pond axis and their accumulation depends on the deposits thickness. The concentration of elements, i.e. Mg, Na, decreased as the distance from the supply site increased.

50
Table 3 Some physical properties and selected elements (mg⋅kg-1 d.m.) in the surface layer of the bottom deposits – 0-10 cm
NrSampling site
pH in KCl
pH in H2O
% CaCO3 % d.m.%
Org. matter
N P K Ca Mg Na S Cl
1 After the flows join below the forest 7.14 7.25 0.42 80.3 0.51 240 218 996 858 362 134 200 4
2 Below the Unieszewo treatment plant 7.18 7.13 0.25 74.5 2.59 - - - - - - - -
3 Below the Sz�bruk treatment plant 7.38 7.31 12.26 75.4 3.50 1290 610 3652 59345 4824 475 900 16
4 Beginning of the surrounding ditch 6.93 6.86 3.70 66.5 3.65 - - - - - - - -
5 Surrounding ditch 7.54 7.31 2.22 75.1 2.00 - - - - - - - -
6 Surrounding ditch 7.39 7.30 0.72 70.5 3.65 1390 610 2324 24668 2050 230 1100 13
7 Surrounding ditch below the agricultural drainage basin inflow
7.27 7.22 4.65 54.2 7.10 - - - - - - - -
8 End of the surrounding ditch 7.23 7.25 67.89 46.8 6.00 2060 1395 2656 100100 3377 653 1700 22
9 After joining the wetland outflow 7.02 7.15 11.24 53.8 6.30 3170 1788 3984 52910 3377 490 1400 23
a 6.72 6.87 2.25 26.1 23.63 9630 1788 3320 10296 4040 475 1600 22
b 5.77 6.03 0.25 34.9 13.75 4940 1788 3320 2574 1387 341 1700 18 10 Constructed wetland,
beginning
c 4.98 5.34 0.42 20.3 33.13 13210 1177 4980 5148 1447 326 2300 30
a 6.79 7.07 16.07 19.0 26.85 - - - - - - - -
b 6.10 6.41 0.32 18.8 35.53 15550 1003 4980 2860 4703 549 2900 52 11Constructed wetland,
center
c 6.49 7.12 7.64 31.4 16.75 - - - - - - - -
a 7.03 7.15 10.4 42.5 9.43 4370 610 2988 35750 2472 475 1400 22
b 6.73 6.91 6.26 20.6 25.80 11420 610 4980 25025 4824 564 2900 44 12Constructed wetland,
end
c 7.09 7.30 2.21 56.4 6.39 3070 785 2324 10010 2653 326 1000 15
- not determined
50

51
Table 4
Some physical properties and selected elements (mg⋅kg-1 d.m.) in the layer of the bottom deposits from 10 to 20 cm
Nr Sampling site
pH in KCL pH in H2O
% CaCO3 % d.m.%
Org. matter N P K Ca Mg Na S Cl
a 7.08 7.37 3.82 52.7 11.67 5160 785 2988 12870 4040 371 900 14
b 6.77 6.99 0.85 56.4 7.49 2900 1177 3320 4433 1387 223 1000 9
10
Constructed wetland,
beginning
c 5.24 5.78 0.13 37.6 23.06 10080 1003 4980 1430 4100 482 1900 22
a 6.83 7.22 38.6 33.0 16.20 - - - - - - - -
b 5.43 5.93 0.32 22.9 30.77 16030 785 6308 1430 5126 549 2300 33 11 Constructed
wetland, center
c 6.89 7.28 4.12 46.5 13.55 - - - - - - - -
a 7.05 7.27 20.37 45.6 9.66 4240 610 3320 42900 3075 519 1500 25
b 6.79 7.27 6.79 42.4 14.18 7030 610 3320 92950 3980 564 1500 25 12 Constructed wetland, end
c 7.00 7.38 3.73 60.3 7.29 3670 610 2988 10010 3678 341 900 17
- not determined
51
52
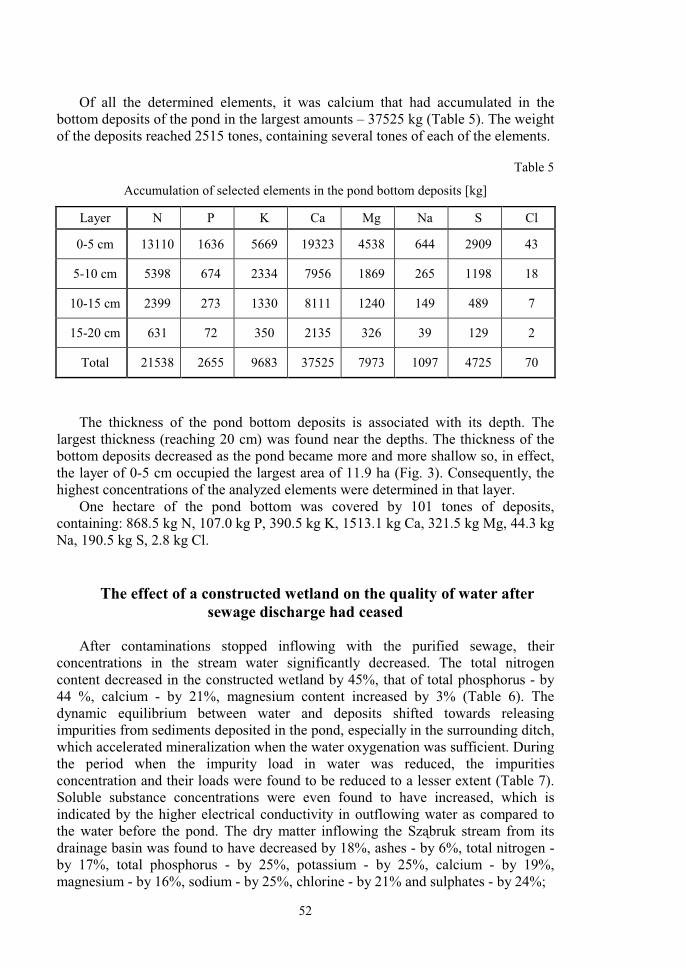
Of all the determined elements, it was calcium that had accumulated in the bottom deposits of the pond in the largest amounts – 37525 kg (Table 5). The weight of the deposits reached 2515 tones, containing several tones of each of the elements.
Table 5
Accumulation of selected elements in the pond bottom deposits [kg]
Layer N P K Ca Mg Na S Cl
0-5 cm 13110 1636 5669 19323 4538 644 2909 43
5-10 cm 5398 674 2334 7956 1869 265 1198 18
10-15 cm 2399 273 1330 8111 1240 149 489 7
15-20 cm 631 72 350 2135 326 39 129 2
Total 21538 2655 9683 37525 7973 1097 4725 70
The thickness of the pond bottom deposits is associated with its depth. The largest thickness (reaching 20 cm) was found near the depths. The thickness of the bottom deposits decreased as the pond became more and more shallow so, in effect, the layer of 0-5 cm occupied the largest area of 11.9 ha (Fig. 3). Consequently, the highest concentrations of the analyzed elements were determined in that layer.
One hectare of the pond bottom was covered by 101 tones of deposits, containing: 868.5 kg N, 107.0 kg P, 390.5 kg K, 1513.1 kg Ca, 321.5 kg Mg, 44.3 kg Na, 190.5 kg S, 2.8 kg Cl.
The effect of a constructed wetland on the quality of water after
sewage discharge had ceased
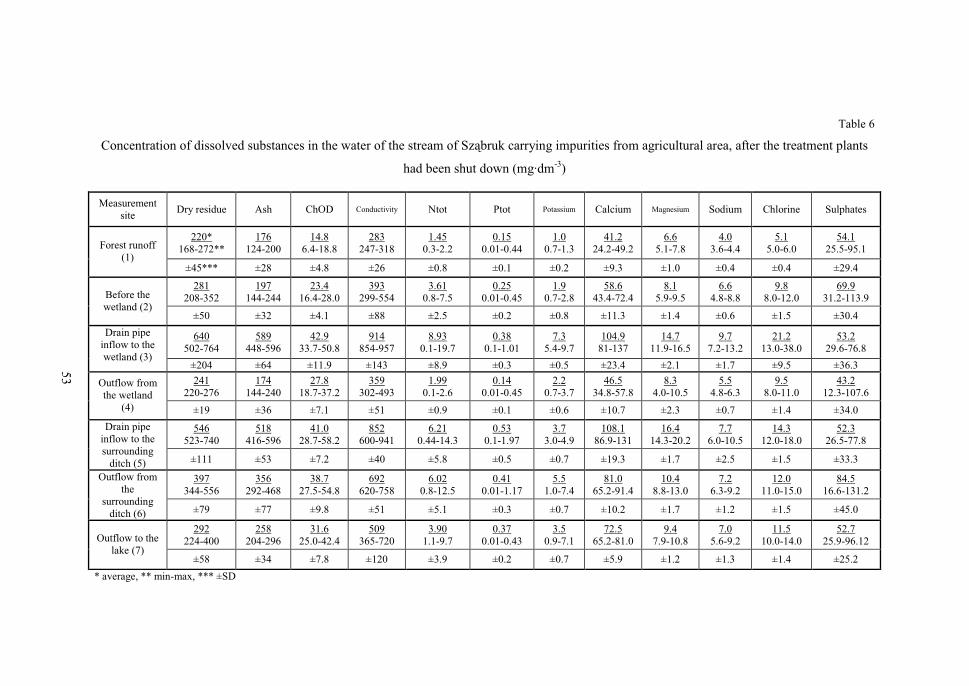
After contaminations stopped inflowing with the purified sewage, their concentrations in the stream water significantly decreased. The total nitrogen content decreased in the constructed wetland by 45%, that of total phosphorus - by 44 %, calcium - by 21%, magnesium content increased by 3% (Table 6). The dynamic equilibrium between water and deposits shifted towards releasing impurities from sediments deposited in the pond, especially in the surrounding ditch, which accelerated mineralization when the water oxygenation was sufficient. During the period when the impurity load in water was reduced, the impurities concentration and their loads were found to be reduced to a lesser extent (Table 7). Soluble substance concentrations were even found to have increased, which is indicated by the higher electrical conductivity in outflowing water as compared to the water before the pond. The dry matter inflowing the Sz�bruk stream from its drainage basin was found to have decreased by 18%, ashes - by 6%, total nitrogen - by 17%, total phosphorus - by 25%, potassium - by 25%, calcium - by 19%, magnesium - by 16%, sodium - by 25%, chlorine - by 21% and sulphates - by 24%;
53
Table 6
Concentration of dissolved substances in the water of the stream of Sz�bruk carrying impurities from agricultural area, after the treatment plants
had been shut down (mgdm-3)
Measurement site
Dry residue Ash ChOD Conductivity Ntot Ptot Potassium Calcium Magnesium Sodium Chlorine Sulphates
220*168-272**
176124-200
14.86.4-18.8
283247-318
1.450.3-2.2
0.150.01-0.44
1.00.7-1.3
41.224.2-49.2
6.65.1-7.8
4.03.6-4.4
5.15.0-6.0
54.125.5-95.1 Forest runoff
(1) ±45*** ±28 ±4.8 ±26 ±0.8 ±0.1 ±0.2 ±9.3 ±1.0 ±0.4 ±0.4 ±29.4
281208-352
197144-244
23.416.4-28.0
393299-554
3.610.8-7.5
0.250.01-0.45
1.90.7-2.8
58.643.4-72.4
8.15.9-9.5
6.64.8-8.8
9.88.0-12.0
69.931.2-113.9 Before the
wetland (2) ±50 ±32 ±4.1 ±88 ±2.5 ±0.2 ±0.8 ±11.3 ±1.4 ±0.6 ±1.5 ±30.4
640502-764
589448-596
42.933.7-50.8
914854-957
8.930.1-19.7
0.380.1-1.01
7.35.4-9.7
104.981-137
14.711.9-16.5
9.77.2-13.2
21.213.0-38.0
53.229.6-76.8
Drain pipe inflow to the wetland (3)
±204 ±64 ±11.9 ±143 ±8.9 ±0.3 ±0.5 ±23.4 ±2.1 ±1.7 ±9.5 ±36.3
241220-276
174144-240
27.818.7-37.2
359302-493
1.990.1-2.6
0.140.01-0.45
2.20.7-3.7
46.534.8-57.8
8.34.0-10.5
5.54.8-6.3
9.58.0-11.0
43.212.3-107.6
Outflow from the wetland
(4) ±19 ±36 ±7.1 ±51 ±0.9 ±0.1 ±0.6 ±10.7 ±2.3 ±0.7 ±1.4 ±34.0
546523-740
518416-596
41.028.7-58.2
852600-941
6.210.44-14.3
0.530.1-1.97
3.73.0-4.9
108.186.9-131
16.414.3-20.2
7.76.0-10.5
14.312.0-18.0
52.326.5-77.8
Drain pipe inflow to the surrounding
ditch (5) ±111 ±53 ±7.2 ±40 ±5.8 ±0.5 ±0.7 ±19.3 ±1.7 ±2.5 ±1.5 ±33.3
397344-556
356292-468
38.727.5-54.8
692620-758
6.020.8-12.5
0.410.01-1.17
5.51.0-7.4
81.065.2-91.4
10.48.8-13.0
7.26.3-9.2
12.011.0-15.0
84.516.6-131.2
Outflow from the
surrounding ditch (6) ±79 ±77 ±9.8 ±51 ±5.1 ±0.3 ±0.7 ±10.2 ±1.7 ±1.2 ±1.5 ±45.0
292224-400
258204-296
31.625.0-42.4
509365-720
3.901.1-9.7
0.370.01-0.43
3.50.9-7.1
72.565.2-81.0
9.47.9-10.8
7.05.6-9.2
11.510.0-14.0
52.725.9-96.12 Outflow to the
lake (7) ±58 ±34 ±7.8 ±120 ±3.9 ±0.2 ±0.7 ±5.9 ±1.2 ±1.3 ±1.4 ±25.2
* average, ** min-max, *** ±SD
53

54
however, ChODCr increased by 5%. This was the result of sediment re-suspension and mineralization, as well as primary production in the pond. The study showed that the initially achieved good effects of purification of highly contaminated waters in the pond gradually worsen.
Passing water of lower contamination level through a constructed wetland previously used for water purification results in reduced process effectiveness. The decrease in the water contamination level in a ditch system shows that if clean water is introduced in the next stage, its quality may deteriorate as a result of the object washing-out.
Table 7
Load of dissolved substances in the water of the stream of Sz�bruk, carrying impurities from an agricultural area (kgyear-1)
Measurement site
Dry residue
Ash ChOD Ntot Ptot K Ca Mg Na Cl Sulphates
Forest runoff (1)
75900 60720 5117 500 51 357 14225 2271 1380 1783 18653
Before the wetland(2)
165143 115835 13746 2119 147 1859 34388 4735 3854 5772 41007
Stream inflow to the wetland (2)
66057 46334 5498 848 67 744 13755 1894 1542 2309 16402
Stream inflow to the surrounding
ditch (2)
99086 69501 8247 1271 80 1115 20633 2841 2313 3463 24604
Drain pipe inflow to the wetland (3)
12864 12422 985 214 9 91 2595 394 184 344 1251
Outflow from the
wetland (4) 56472 40872 6501 466 40 449 10873 1958 1291 2223 10119
Drain pipe inflow to the surrounding
ditch (5)
30736 25848 2046 298 25 350 5035 706 464 1016 2553
Outflow from the
surrounding ditch (6)
113810 104120 11043 1715 96 1278 23076 2955 2071 3420 24088
Outflow to the lake (7)
170282 144992 17545 2181 136 1726 33949 4912 3362 5643 34208
55
Table 8
Load of substances carried in the water of Sz�bruk stream (kgyear-1)
Load Dry
residue Ash ChOD Ntot Ptot K Ca Mg Na Cl Sulphates
During the period of sewage discharge
Inflowing to the wetland
282270 185682 20428 4185 437 2603 43711 6711 6371 7753 52203
Outflowing from the wetland
36367 18486 3997 309 35 347 6434 859 767 1089 4574
Difference 245903 167196 16431 3876 402 2256 37277 5852 5604 6664 47629
Inflowing to the ditch
192629 115101 13195 2714 218 2542 30113 4469 4098 7150 34912
Outflowing from the
surrounding ditch
176908 116355 16027 1861 172 2306 37208 4616 4138 6447 24726
Difference 15721 -1254 -2832 853 46 236 -7095 -147 -40 703 10186
During the period without sewage discharge
Inflowing to the wetland
78921 58756 6483 1062 76 835 16350 2288 1726 2653 17653
Outflowing from the wetland
56472 40872 6501 466 40 449 10873 1958 1291 2223 10119
Difference 22449 17884 -18 596 36 386 5477 330 435 430 7534
Inflowing to the ditch
129822 95349 10293 1569 105 1465 25668 3547 2777 4479 27157
Outflowing from the
surrounding ditch
113810 104120 11043 1715 96 1278 23076 2955 2071 3420 24088
Difference 16012 -8771 -750 -146 9 187 2592 592 706 1059 3069
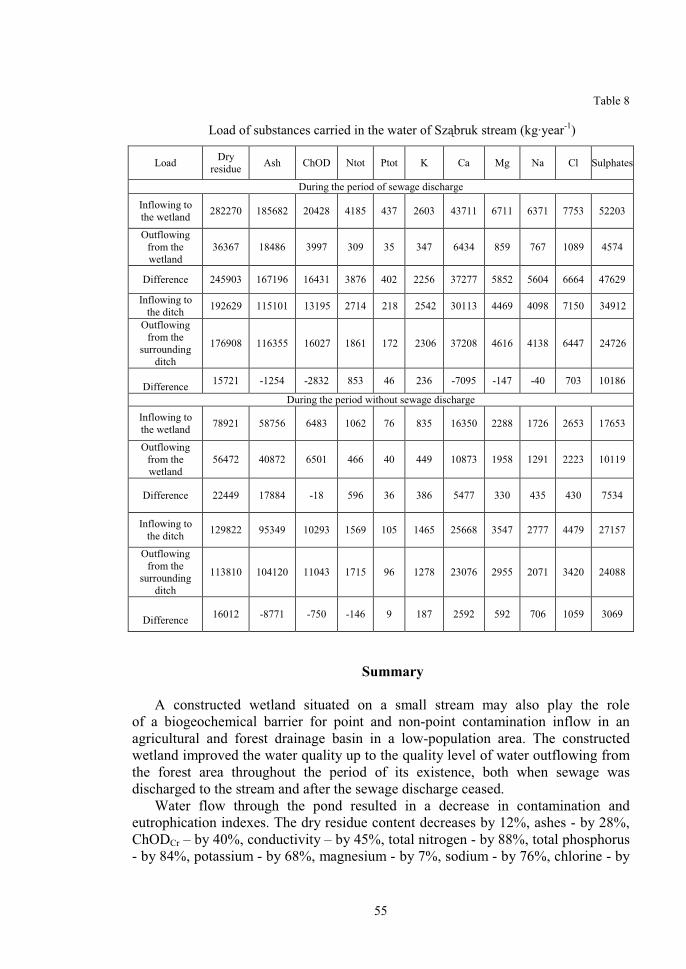
Summary
A constructed wetland situated on a small stream may also play the role of a biogeochemical barrier for point and non-point contamination inflow in an agricultural and forest drainage basin in a low-population area. The constructed wetland improved the water quality up to the quality level of water outflowing from the forest area throughout the period of its existence, both when sewage was discharged to the stream and after the sewage discharge ceased.
Water flow through the pond resulted in a decrease in contamination and eutrophication indexes. The dry residue content decreases by 12%, ashes - by 28%, ChODCr – by 40%, conductivity – by 45%, total nitrogen - by 88%, total phosphorus - by 84%, potassium - by 68%, magnesium - by 7%, sodium - by 76%, chlorine - by

56
59% and sulphates - by 61%. Except for the dry matter content, the reduction of these parameters was considerably greater in the water flowing through the pond than in the surrounding ditch.
Water flow through the pond resulted in reduction of dry matter content by 87%, ashes - by 90%, ChODCr - by 80%, total nitrogen - by 93%, total phosphorus - by 92%, potassium - by 87%, calcium - by 85%, magnesium - by 87%, sodium - by 88%, chlorine - by 86% and sulphates - by 91%. Reduction of impurities load is much greater than that of the concentrations, as water loss by evaporation and plant transpiration is greater.
The effectiveness of water purification is higher in the vegetation period than in winter, which is a confirmation of the thesis that the main role in water purification is played by biological processes, which depend on temperature and solar exposure.
The pond was degraded over the many years of its existence, which is indicated by its being overgrown by nitrophilous rush vegetation and sediment accumulation on the bottom, which are more abundant in nitrogen and phosphorus than are typical sediments in lakes which are not loaded with sewage.
Water movement in the pond and the biological processes result in accumulation of mainly mineral deposits at the water inflow to the pond, with the contribution of organic matter and biogenic substances increasing in the further parts of the pond. The highest accumulation of deposits was recorded in the depths and before the weir.
Reduction of the pond load with impurities by diverting the sewage discharge outside the drainage basin resulted in a change of relations between the processes of accumulation and release of impurities due to their lower concentration in the inflowing water; the effectiveness of impurities and biogenic compounds reduction in the water flowing through the pond decreased.
Accumulation of deposits in the lake cove where the water from the stream flows in is a sign that the water quality improvement is insufficient. Further quality improvement can be achieved by passing all the stream water through the pond (but, in that case, it would have to be larger) or by a series of ponds (“bead-on-a-string” system) on the stream.
Constructed wetlands which act as natural sewage treatment plants should be rehabilitated as the effectiveness of water purification decreases over time, with the intensity dependent upon the impurity load-to-wetland volume ratio. A non-rehabilitated wetland may periodically reduce the water quality as a result of lowering the accumulation/release ratio, which may happen during unfavourable periods, such as a rapid flow increase in winter or water waving.
The study was financed by funds for financing scientific research in the years 2007-2010

57
References
ALLAN J. D. 1998. Ekologia wód płyn�cych. Wyd. Nauk. PWN, Warszawa pp. 451.BAUDO R., BELTRAMI M., 2001. Chemical composition of Lake Orta sediments. J. Limnol., 60(2): 213-236. BOROWIEC S., ZABŁOCKI Z. 1990. Czynniki kształtuj�ce chemizm wód powierzchniowych
i odcieków drenarskich obszarów rolniczych Polski północno-wschodniej. Mater. semin. IMUZ, 27: 25-30.
BORÓWKA R., 2007. Geochemiczne badania osadów dennych w jeziorach strefy umiarkowanej. Stud. Limn. Et. Tel. 1(1): 33-42.
BYCZKOWSKI A. 1996. Hydrologia. Wydaw. SGGW Warszawa pp. 375. CHUDYBA H., KALWASI�SKI K. 1998. Samooczyszczanie wody. Nowocz. Roln. 05.06. pp. 48. COVENEY M. F., STITES D. L., LOWE E. F., BATTOE L. E., CONROW R. 2002. Nutrient removal
from eutrophic lake water by wetland filtration. Ecological Engineering 19: 141-159. CZAMARA W., WIATKOWSKI M. 2002. Zastosowanie zbiornika wst�pnego w M�ciwojowie do ochrony retencjonowanej wody. Roczniki Akademii Rolniczej w Poznaniu, CCCXLII: 43-52. GAWRO�SKA H., 1989. Skład chemiczny osadów dennych Jeziora B�skiego. Acad. Agricult.
Tech. Olst. ProtectioAquarum et Piscatoria, No 17: 35-43. GIERCUSZKIEWICZ-BAJTLIK M. 1990. Charakterystyka obszarowych �ródeł zanieczyszcze� w
Polsce. W: Zanieczyszczenia obszarowe w zlewniach rolniczych. Mater. semin. IMUZ Falenty 26: 143-161.
GUS 2009. Ochrona �rodowiska. GUS Warszawa HAYCOCK N.E., PINAY G., BURT T.P., GOULDING K.W.T. 1996. Buffer zones: Current
concerns and future directions. W: Buffer zones: their processes and potential in water protection. Proc. Int. Conf. Buffer Zones, Quest Environmental, Hertfordshire, UK: 305-312.
KAJAK Z., 2001. Hydrobiologia, limnologia. Ekosystemy wód �ródl�dowych. Wyd. Nauk. PWN Warszawa, pp. 359.
KOC J. 1994. Zagro�enia �rodowiska rolniczego. Rodzaje �ródła rozmiary i skutki. O�rodek Doradstwa Rolniczego w Olsztynie pp 146.
KOC J., CYMES I., SKWIERAWSKI A., SZYPEREK U. 2001. Znaczenie ochrony małych zbiorników wodnych w krajobrazie rolniczym. Zesz. Probl. Post. Nauk Roln., 476: 397-407.
KOC J., SZYMCZYK S. 2001. Wpływ u�ytkowania obszarów rolniczych na eutrofizacj� wód. Agrarna oswita i nauka na poczatku tretego tisjaczolietia. Materiali Mi�narodnoj naukowo-prakticznoj konfierencji, 18-21 IX 2001, Lwów, t. I: 68-76.
KOC J., TUCHOLSKI S., SKONIECZEK P. 2004. Znaczenie zbiornika wst�pnego w ochronie jeziora przed zanieczyszczeniami ze zlewni rolniczo-le�nej. Cz. I Ogólne wska�niki zanieczyszcze�. Zesz. Probl. Post. Nauk Roln., 499: 137-143.
MADEYSKI M., TARNAWSKI M., 2004. Przebieg procesu sedymentacji osadów dennych małych zbiorników wodnych. Rocz. AR Pozna�, Melior. In�. �rod. 25 (357): 345-353.
MÜLLER B., LOTTER A. F., STURM M., AMMANN A., 1998. Influance of catchment quality and altitude on the water and sediment composition of 68 small lakes in Central Europe.Aquat. Sci. 60: 316-337.
PARZONKA W., 1991. Erozja, transport i sedymentacja rumowiska w rzekach i zbiornikach.Materiały XI Szkoły Hydrauliki IBW PAN, Gda�sk: 81-99.
PAWLIK-DOBROWOLSKI J. 1990. �ródła substancji chemicznych w zlewni, ich klasyfikacja i metody obliczania. In: Zanieczyszczenia obszarowe w zlewniach rolniczych. Mater. semin. IMUZ Falenty 26: 7-16.

58
Rozporz�dzenie Ministra �rodowiska z dnia 20 sierpnia 2008 r. w sprawie sposobu klasyfikacji stanu jednolitych cz��ci wód powierzchniowych. Dz. U. Nr 162, poz. 1008.
SIWEK H., WŁODARCZYK M., BRZOSTKOWSKA �ELECHOWSKA D., WACHOWICZ M. 2009. Wpływ wybranych parametrów fizyko-chemicznych osadu na zawarto�� nieorganicznych form fosforu w osadach dennych małych zbiorników polimiktycznych. Acta Agrophysica, 13(2), 497-503.
SKWIERAWSKI A., 2003. Skład chemiczny osadów dennych małych zbiorników wodnych jako odzwierciedlenie nasilenia procesów antropopresji w krajobrazie rolniczym. Chem. In�. Ekol., 10 (S1): 159-169.
SÖDERGREN A. 1993. Role of aquatic surface microlayer in the dynamics of nutrients and organic compounds in lakes, with implication for their ecotones. Hydrobiologia 251: 217-225.
SOMOROWSKI CZ. (Red). 1998. Wodno-bilansowe kryteria kształtowania siedlisk w ciekach w krajobrazie rolniczym. SGGW Warszawa.
STACHOWICZ K. 1995. Migracja wodna składników pokarmowych ze zlewni rolniczych. Człowiek i �rodowisko. Instytut Gospodarki Przestrzennej i Komunalnej. Warszawa, 19 (1): 125 – 141.
STRUTY�SKI J., GAŁKA A. 1997. Stawy rybne jako bariery dla zanieczyszcze� wnoszonych z wodami zasilaj�cymi. Rocz. AR Pozna�: 319 – 325.
SZYPEREK U. 2003. Oczka wodne jako bariera biogeochemiczna w krajobrazie pojeziernym.Praca doktorska, UWM w Olsztynie, pp. 163.
SZYPEREK U. 2004. Zawarto�� i akumulacja składników biogennych w osadach dennych oczka wodnego w zlewni intensywnie u�ytkowanej rolniczo. Nawozy i Nawo�enie 2 (19): 108-117.
TUCHOLSKI S., DUDA M., SKONIECZEK P. 2007. Self-purification of waters polluted with sewage in the retention reservoir. Ekol. Chem. And Eng. T14. Nr 52: 147-157.
URBAN N. R., DINKEL CH., WEHRLI B.1997. Solute transfer across the sediment surface of a eutrophic lake: I Porewater profiles from dialysis samplers. Aquat. sci. Birkhäuser Verlag, Basel, 59: 1–25.
WÓJCIK D., JARZ BEK A. 1993. Wpływ zbiorników wodnych o zró�nicowanych parametrach przepływu wody na wybrane substancje pokarmowe. „Współczesne problemy in�ynierii wodnej”, Szklarska Por�ba: 237-244.
1Józef Koc,
1Marcin Duda
Department of Land Improvement and Environmental Management University of Warmia and Mazury in Olsztyn pl. Łódzki 2, 10-718 Olsztyn, POLAND e-mail: [email protected] 2Paweł Skonieczek
Department of Environmental Protection Engineering University of Warmia and Mazury in Olsztyn ul. Prawoche�skiego 1, 10-957 Olsztyn, POLAND e-mail: [email protected]