Embed Size (px)
Citation preview
31
CHAPTER III
RESEARCH METHODOLOGY
In this part, the writer will describe about research method that is used in
conducting the research. It is purpose to answer the problem of the study. This
chapter consists of research design, population and sample, instruments of the
study, validity, reliability, data collection procedures, and data analysis.
A. Research Design
In the study, the writer investigated the role of the students‟ learning
motivation toward the students‟ reading comprehension. Thus, it applied
correlational design to understand relationships among learning motivation and
the students‟ reading comprehension where it was traditionally classified as
relationship study or prediction study.103
Correlational approach was
nonexperimental research which employs data derived from preexisting variables
with the purpose to assess or understand the relationships among two or more
variables in a single group.104
It also produced indexes or a correlation coefficient
that show the direction and the strength of relationships among variables, taking
into account the entire range of these variables.105
Therefore, the writer used
correlational approach in the study to measure the strength of relationship
between learning motivation and reading comprehension of the freshman students
of English Study Program of STAIN Palangkaraya.
103
Donna M. Johnson, Approaches to Research, p. 51.
104
Donald Ary and Lucy Cheser Jacobs, Chris Sorensen, and Asghar Razavieh,
Introduction to Research, p. 349.
105
Ibid., p. 350.
32
The writer explored the students learning motivation based on Gardner‟s
theory of motivation in the social dimension, integrative and instrumental
motivation which refers to the students‟ goal of learning English. Then, the writer
explored the students‟ reading comprehension through some texts which had to
answer in multiple choices. Furthermore, the result of exploring the students‟
learning motivation and the students‟ reading comprehension would be presented
in numerical result which based the statement that correlational approach was by
nature quantitative.106
So, it used quantitative as the research approach.
B. Population and Sample
The population of the study was all of the freshman students of English
Study Program of STAIN Palangka Raya in academic years of 2012/2013 who
lived in Islamic Boarding College „Ma‟had Al Jami‟ah‟ of STAIN Palangka Raya.
The number of population is about 101 students. Then, the sample of the study
would be taken from all of the population because the writer considered that all of
students had similar in learning of English for at least six years and they had to
passed the national exam in 12th
grade as a requirement of graduation which need
enough preparation. Moreover, the taking of population as the sample of the study
was to decrease the opportunity of error in generalization. It bases on the
statement that the more the number of samples close to the population, the smaller
the chance of generalization error and conversely the smaller the number of
106
Donna M. Johnson, Approaches to Research in Second Language Learning, New
York: Longman, 1992, p. 53.
33
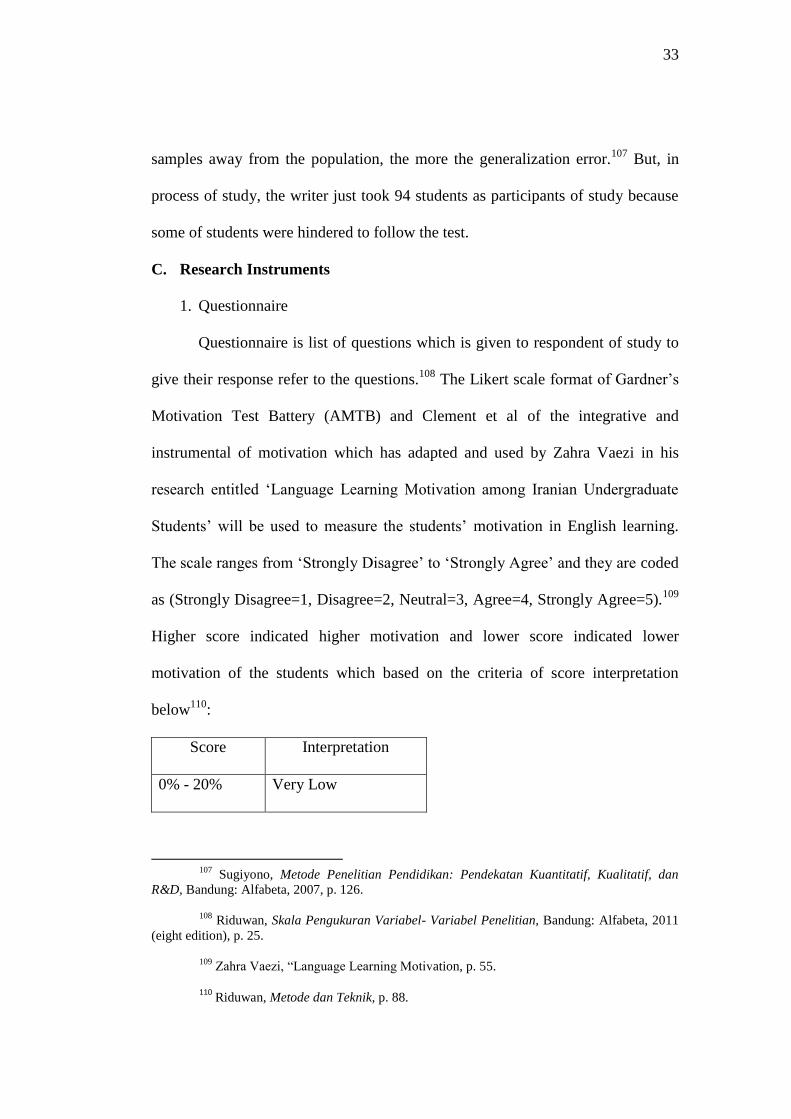
samples away from the population, the more the generalization error.107
But, in
process of study, the writer just took 94 students as participants of study because
some of students were hindered to follow the test.
C. Research Instruments
1. Questionnaire
Questionnaire is list of questions which is given to respondent of study to
give their response refer to the questions.108
The Likert scale format of Gardner‟s
Motivation Test Battery (AMTB) and Clement et al of the integrative and
instrumental of motivation which has adapted and used by Zahra Vaezi in his
research entitled „Language Learning Motivation among Iranian Undergraduate
Students‟ will be used to measure the students‟ motivation in English learning.
The scale ranges from „Strongly Disagree‟ to „Strongly Agree‟ and they are coded
as (Strongly Disagree=1, Disagree=2, Neutral=3, Agree=4, Strongly Agree=5).109
Higher score indicated higher motivation and lower score indicated lower
motivation of the students which based on the criteria of score interpretation
below110
:
Score Interpretation
0% - 20% Very Low
107
Sugiyono, Metode Penelitian Pendidikan: Pendekatan Kuantitatif, Kualitatif, dan
R&D, Bandung: Alfabeta, 2007, p. 126.
108
Riduwan, Skala Pengukuran Variabel- Variabel Penelitian, Bandung: Alfabeta, 2011
(eight edition), p. 25.
109
Zahra Vaezi, “Language Learning Motivation, p. 55.
110
Riduwan, Metode dan Teknik, p. 88.
34
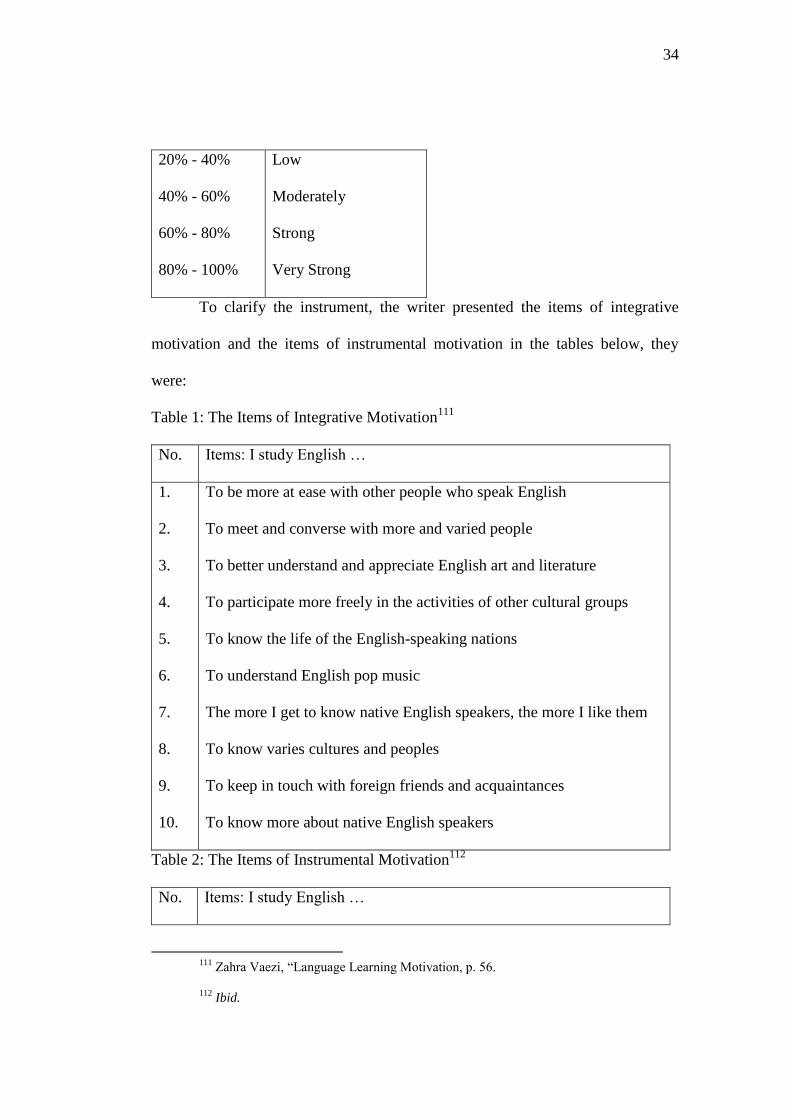
20% - 40%
40% - 60%
60% - 80%
80% - 100%
Low
Moderately
Strong
Very Strong
To clarify the instrument, the writer presented the items of integrative
motivation and the items of instrumental motivation in the tables below, they
were:
Table 1: The Items of Integrative Motivation111
No. Items: I study English …
1.
2.
3.
4.
5.
6.
7.
8.
9.
10.
To be more at ease with other people who speak English
To meet and converse with more and varied people
To better understand and appreciate English art and literature
To participate more freely in the activities of other cultural groups
To know the life of the English-speaking nations
To understand English pop music
The more I get to know native English speakers, the more I like them
To know varies cultures and peoples
To keep in touch with foreign friends and acquaintances
To know more about native English speakers
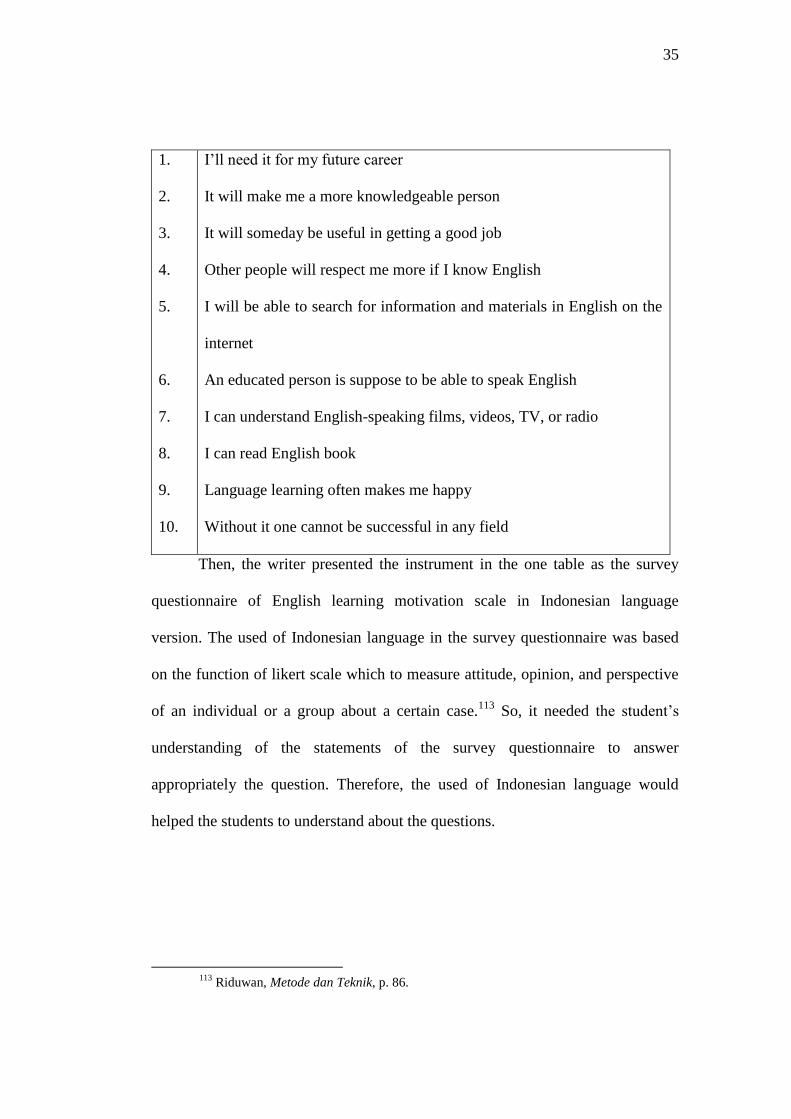
Table 2: The Items of Instrumental Motivation112
No. Items: I study English …
111
Zahra Vaezi, “Language Learning Motivation, p. 56.
112
Ibid.
35
1.
2.
3.
4.
5.
6.
7.
8.
9.
10.
I‟ll need it for my future career
It will make me a more knowledgeable person
It will someday be useful in getting a good job
Other people will respect me more if I know English
I will be able to search for information and materials in English on the
internet
An educated person is suppose to be able to speak English
I can understand English-speaking films, videos, TV, or radio
I can read English book
Language learning often makes me happy
Without it one cannot be successful in any field
Then, the writer presented the instrument in the one table as the survey
questionnaire of English learning motivation scale in Indonesian language
version. The used of Indonesian language in the survey questionnaire was based
on the function of likert scale which to measure attitude, opinion, and perspective
of an individual or a group about a certain case.113
So, it needed the student‟s
understanding of the statements of the survey questionnaire to answer
appropriately the question. Therefore, the used of Indonesian language would
helped the students to understand about the questions.
113
Riduwan, Metode dan Teknik, p. 86.
36
2. Test
Test was question or examination to measure one‟s knowledge,
intelligence, ability, or attitude.114
In this study, the writer would measure the
students‟ achievement of reading skill. Then, the multiple-choice reading
comprehension test would be used to measure the students‟ comprehension of the
text. The multiple-choice reading comprehension tests were used because it was
able to evaluate the students‟ reading comprehension efficiently.115
In the study,
the students would answer 50 multiple-choice reading comprehension test items
which the material was reading question of the final national exam.116
Then, it
served five answer choices for each question which were signed by (A), (B), (C),
(D) and (E). The serving five of the answer choices were to decrease the
percentage of possibility answering the question truly merely through guessing
process where the more value of choice the smaller possibility the answer of
guessing process was true.117
In other hand, the multiple choice had some surplus
as a test, it had smaller percentage to answer truly through guessing process than
The True-False test, the scope of test material was wider than other form of test,
the way to answer was simple, the way to check the answer was also simple so it
114
Riduwan, Skala Pengukuran Variabel, p. 30.
115
Hui-Ju Wu, “Anxiety and Reading Comprehension Performance in English as a
Foreign Language,” ASIAN EFL Journal, Vol. 13, No. 2, June 2011, p. 284.
116
http://www.khazanahpustaka.co.cc, (online Mei 8, 2012).
117
M. Soenardi Djiwandono, Tes Bahasa: Pegangan Bagi Pengajar Bahasa, Indonesia:
PT Macanan Jaya Cemerlang, 2008, p. 42.
37
was proper to use as a test in big population of the study, and the analysis of each
test item or the whole of test was easier.118
D. Validity
Validity was defined as the extent to which scores on a test enable one to
make meaningful and appropriate interpretations.119
In validity of data, a measure
was also called valid if it measures what it was intended to measure.120
Every test
of a research should be as valid as the constructor can make it, whether the test
was a short, informal classroom test or a public examination.121
Then, in this
study, validity was classified into three types of validation, content validity, face
validity, and construct validity which they exist to find internal validity of
instrument. An instrument was called having internal validity if its criteria
theoretically reflected what would be measured.122
1. Content Validity
Content validity referred to the representativeness of a measurement
regarding the phenomenon about which the writer want to inform.123
An
instrument which formed in a test to measure achievement should had content
118
Ibid.
119
Donald Ary and Lucy Cheser Jacobs, Chris Sorensen, and Asghar Razavieh,
Introduction to Research, p. 224.
120
Donna M. Johnson, Approaches to Research, p. 53.
121
J. B. Heaton, Language Testing, England: Longman, 1987, p. 153.
122
Sugiyono, Metode Penelitian Pendidikan, p. 174.
123
Alison Mackey and Susan M. Gass, Second Language Research: Methodology and
Design, London: Lawrence Erlbaum Associates, Inc, 2005, p. 107.
38
validity.124
Then, in this study the writer measured the students‟ reading
comprehension, thus the writer used the multiple-choice reading comprehension
test which the material include some of texts that can measure their
comprehension of reading English texts.
2. Face Validity
Face validity was closely related to the notion of content validity and
referred to the familiarity of an instrument and how easy it used to convince
others that there was content validity to it.125
In this study, to measure the
students‟ reading comprehension, the writer used the multiple-choice reading
comprehension test which the material was taken from reading question of the
final national exam. Therefore, the students have studied the material before they
are administering to college and they have done the final national exam as
requirement of graduation.
3. Construct Validity
Construct validity referred to the degree to which the research adequately
captures the construct of interest.126
An instrument whether it was formed in a test
or formed in a non test, it should contain construct validity. In this study, the
writer measured the students‟ learning motivation for the purpose of correlating it
with reading comprehension in the first semester students at college. To measure
the students‟ reading comprehension, the writer used the multiple choice items of
124
Sugiyono, Metode Penelitian Pendidikan, p. 176.
125
Alison Mackey and Susan M. Gass, Second Language Research.
126
Ibid., p. 108.
39
National Final Exam which had been put in a test. Therefore, the multiple choice
items were valid because the result of the items has been used as consideration to
decide the student graduation.127
The validity of the National Final Exam items
was also supported by Prof Mungin Eddy Wibowo as a member of National
Education Standards (Badan Standar Nasional Pendidikan) who said that the items
of National Exam had been prepared according to standardization and refer to the
principle as valid, credible, and objective.128
Then, to measure learning
motivation, the writer used the Likert scale format of Gardner‟s Motivation Test
Battery (AMTB) and Clement et al of the integrative and instrumental of
motivation which had adapted and used by Zahra Vaezi in his research entitled
„Language Learning Motivation among Iranian Undergraduate Students‟. So, it
had been put to a test of study. The writer adapted it based on the fact of field,
where the subject of the study was the Indonesian students. Therefore, it served in
Indonesian language. The purpose of adaptation was to find the external validity
of instrument where an instrument considers having external validity if the criteria
of instrument arranged based on the existing empirical fact.129
Then, to measure
the validity of the instrument, the writer used the formulation of Product Moment
by Pearson as follows130
:
127
M. Soenardi Djiwandono, Tes Bahasa: Pegangan, p. 166.
128
Institut Manajemen Telkom. BSNP: Dibuat Sesuai Standar Soal UN.
http://www.imtelkom.ac.id/id/component/content/article/4222-20apriledu2.html (online September
24, 2012).
129
Sugiyono, Metode Penelitian Pendidikan, p. 174.
130
Anas Sudijono, Pengantar Statistik Pendidikan, Jakarta: PT Raja Grafindo Persada,
2005, p. 206.
40
xyr =
2222 YYNXXN
YXXYN
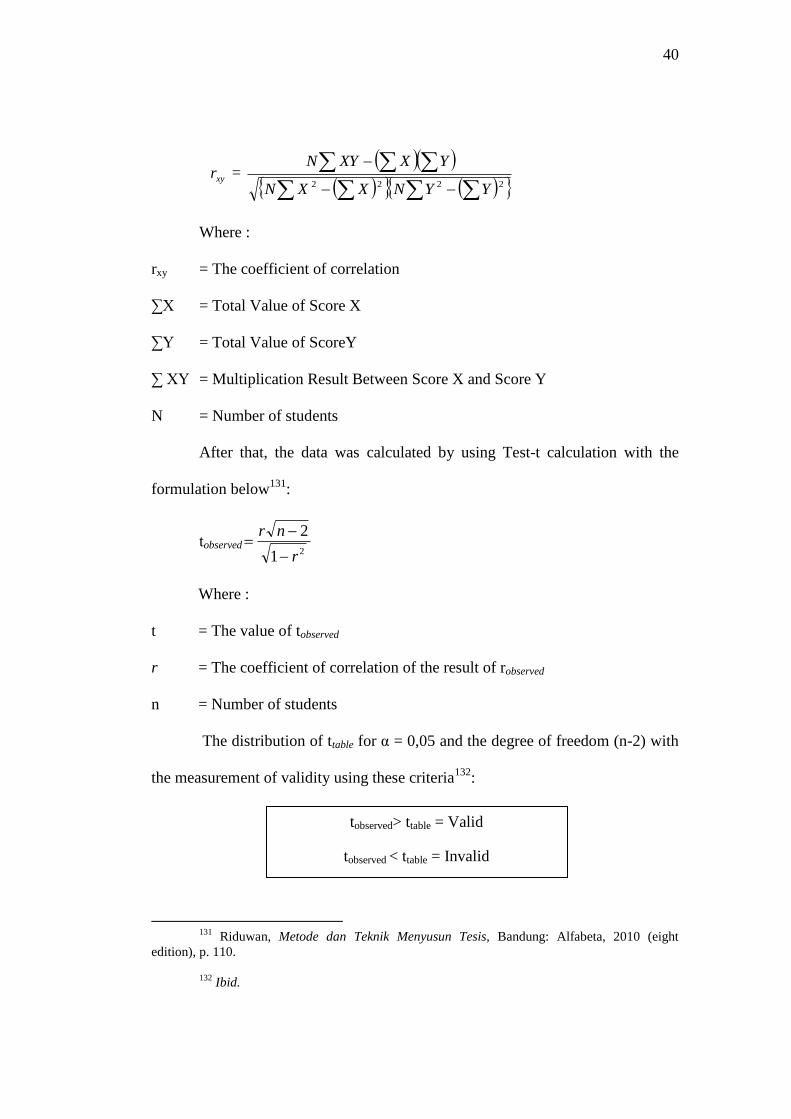
Where :
rxy = The coefficient of correlation
∑X = Total Value of Score X
∑Y = Total Value of ScoreY
∑ XY = Multiplication Result Between Score X and Score Y
N = Number of students
After that, the data was calculated by using Test-t calculation with the
formulation below131
:
tobserved21
2
r
nr
Where :
t = The value of tobserved
r = The coefficient of correlation of the result of robserved
n = Number of students
The distribution of ttable for α = 0,05 and the degree of freedom (n-2) with
the measurement of validity using these criteria132
:
131
Riduwan, Metode dan Teknik Menyusun Tesis, Bandung: Alfabeta, 2010 (eight
edition), p. 110.
132
Ibid.
tobserved> ttable = Valid
tobserved < ttable = Invalid
41
To know the validity level of the instrument, the result of the test was
interpreted to the criteria of correlation index ( r ) as follows133
:
0,800 – 1,000 = Very High Validity
0,600 – 0,799 = High Validity
0,400 – 0,599 = Fair Validity
0,200 – 0,399 = Poor Validity
0,000 – 0,199 = Very Poor Validity (invalid)
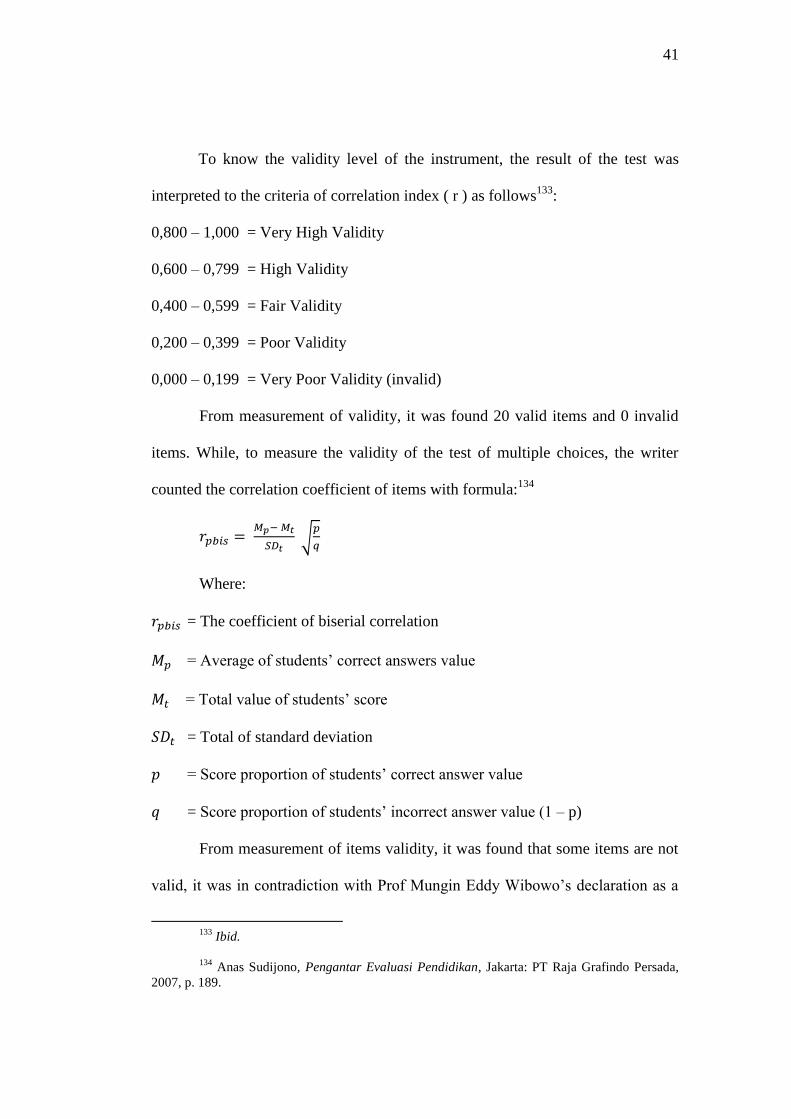
From measurement of validity, it was found 20 valid items and 0 invalid
items. While, to measure the validity of the test of multiple choices, the writer
counted the correlation coefficient of items with formula:134
√
Where:
= The coefficient of biserial correlation
= Average of students‟ correct answers value
= Total value of students‟ score
= Total of standard deviation
= Score proportion of students‟ correct answer value
= Score proportion of students‟ incorrect answer value (1 – p)
From measurement of items validity, it was found that some items are not
valid, it was in contradiction with Prof Mungin Eddy Wibowo‟s declaration as a
133
Ibid.
134
Anas Sudijono, Pengantar Evaluasi Pendidikan, Jakarta: PT Raja Grafindo Persada,
2007, p. 189.
42
member of National Education Standards (Badan Standar Nasional pendidikan)
who said that the items of Natioanal Exam had been prepared according to
standardization and refer to the principle as valid, credible, and objective.
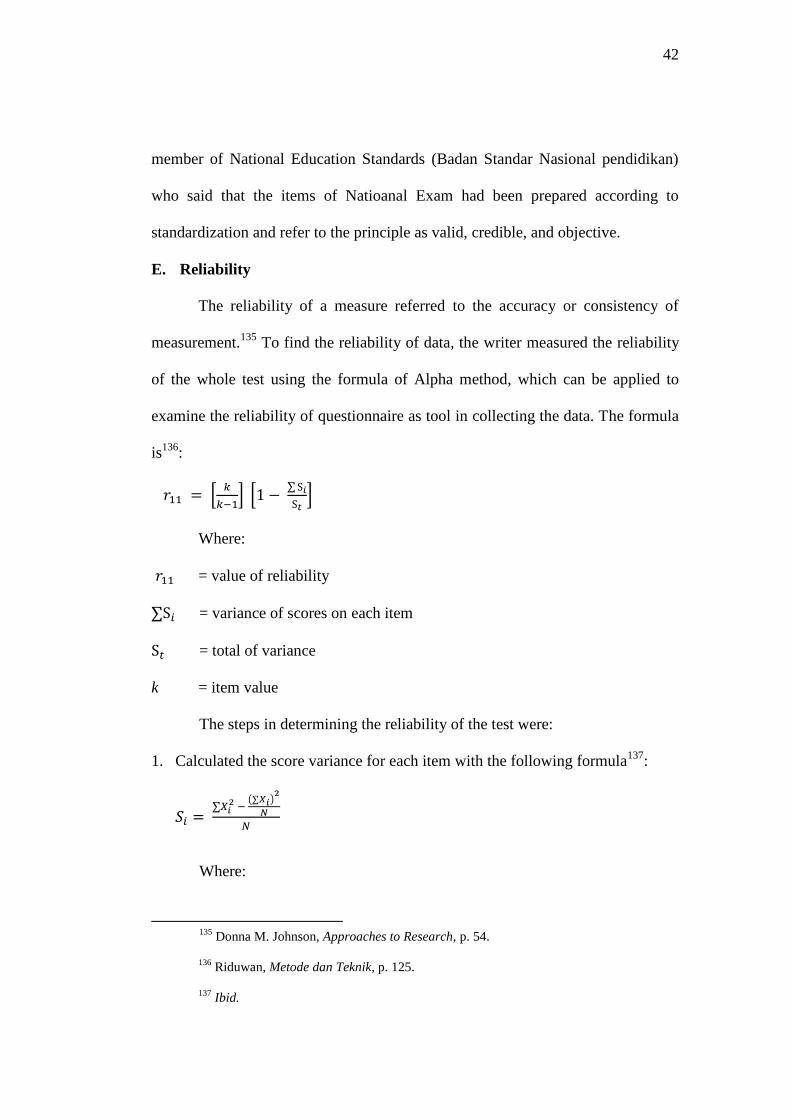
E. Reliability
The reliability of a measure referred to the accuracy or consistency of
measurement.135
To find the reliability of data, the writer measured the reliability
of the whole test using the formula of Alpha method, which can be applied to
examine the reliability of questionnaire as tool in collecting the data. The formula
is136
:
[
] [
∑
]
Where:
= value of reliability
∑ = variance of scores on each item
= total of variance
k = item value
The steps in determining the reliability of the test were:
1. Calculated the score variance for each item with the following formula137
:
∑
(∑ )
Where:
135
Donna M. Johnson, Approaches to Research, p. 54.
136
Riduwan, Metode dan Teknik, p. 125.
137
Ibid.
43
= score variance for each item
= sum of squares Xi item
( ) = number of Xi items squared
N = the number of respondents
2. Then sum the variances of all items with the formula : ∑Si = S1+S2+S3 … Sn
Where:
∑Si = the number of variance of all items
S1+S2+S3 … Sn = variance of 1, 2, 3 … n of item.
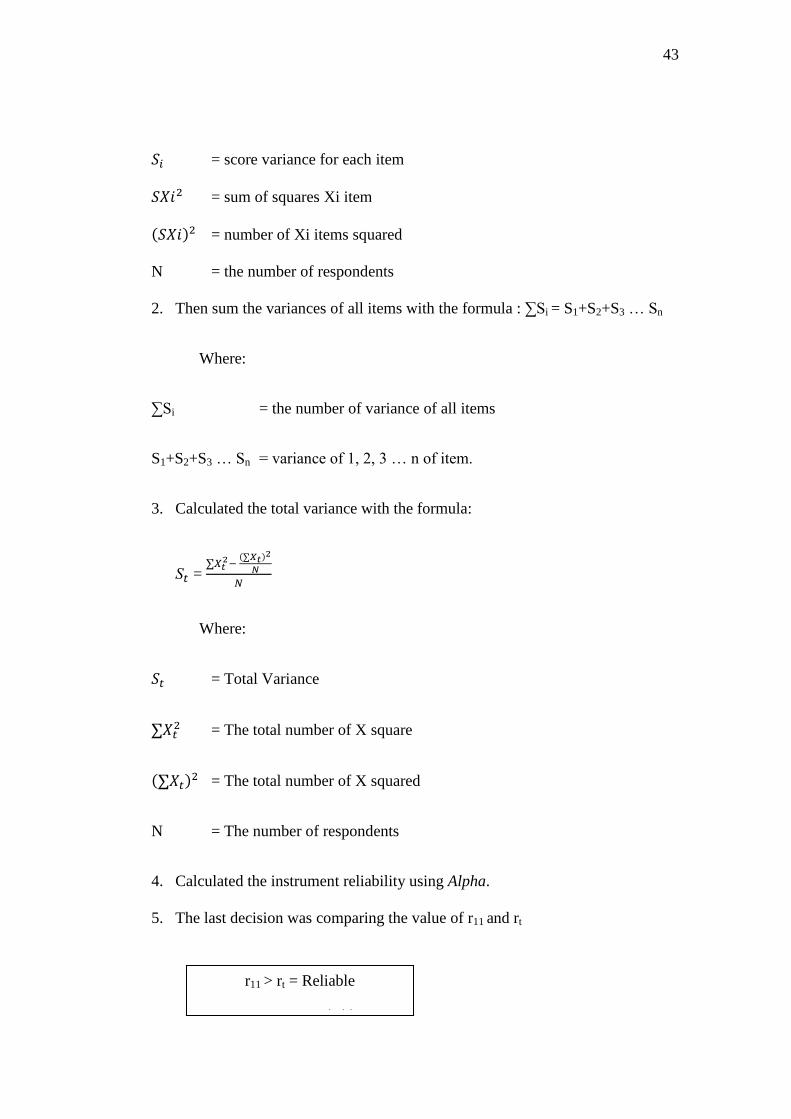
3. Calculated the total variance with the formula:
= ∑
(∑ )
Where:
= Total Variance
∑ = The total number of X square
(∑ ) = The total number of X squared
N = The number of respondents
4. Calculated the instrument reliability using Alpha.
5. The last decision was comparing the value of r11 and rt
r11 > rt = Reliable
r11< rt = Not Reliable
44
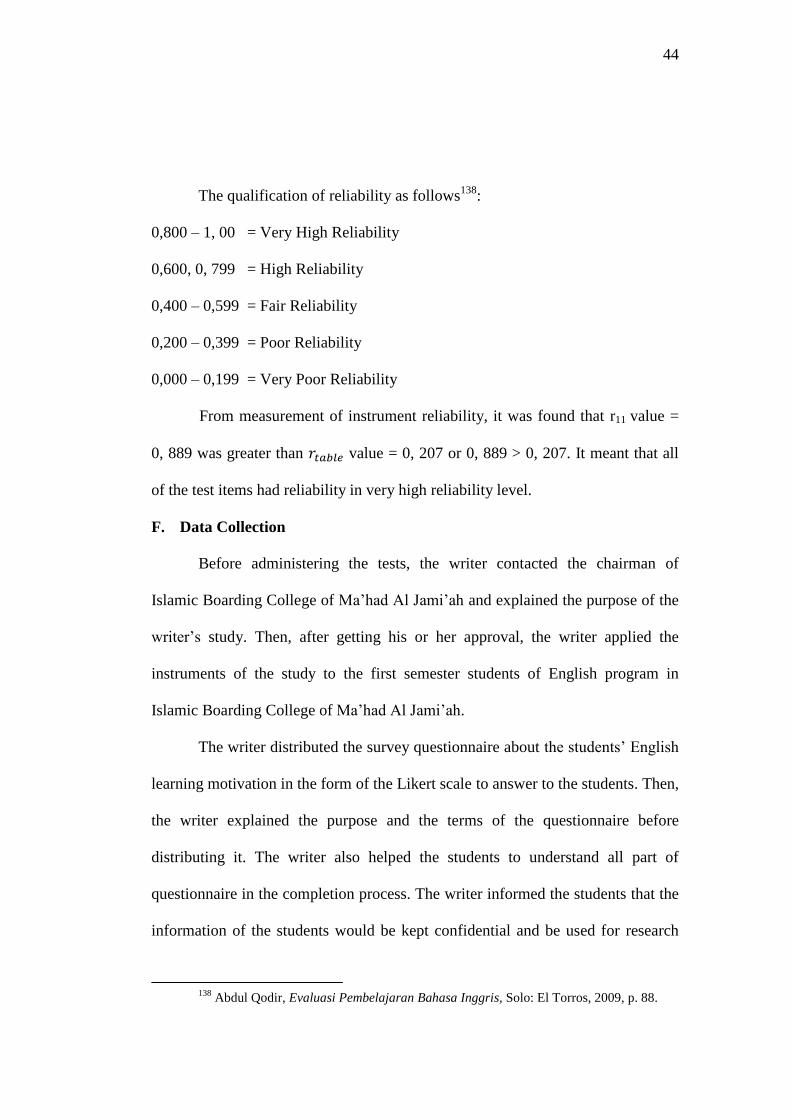
The qualification of reliability as follows138
:
0,800 – 1, 00 = Very High Reliability
0,600, 0, 799 = High Reliability
0,400 – 0,599 = Fair Reliability
0,200 – 0,399 = Poor Reliability
0,000 – 0,199 = Very Poor Reliability
From measurement of instrument reliability, it was found that r11 value =
0, 889 was greater than value = 0, 207 or 0, 889 > 0, 207. It meant that all
of the test items had reliability in very high reliability level.
F. Data Collection
Before administering the tests, the writer contacted the chairman of
Islamic Boarding College of Ma‟had Al Jami‟ah and explained the purpose of the
writer‟s study. Then, after getting his or her approval, the writer applied the
instruments of the study to the first semester students of English program in
Islamic Boarding College of Ma‟had Al Jami‟ah.
The writer distributed the survey questionnaire about the students‟ English
learning motivation in the form of the Likert scale to answer to the students. Then,
the writer explained the purpose and the terms of the questionnaire before
distributing it. The writer also helped the students to understand all part of
questionnaire in the completion process. The writer informed the students that the
information of the students would be kept confidential and be used for research
138
Abdul Qodir, Evaluasi Pembelajaran Bahasa Inggris, Solo: El Torros, 2009, p. 88.
45
purpose only. After the students completing the survey questionnaire individually,
the writer distributed the reading comprehension test in the form of multiple
choices of some reading texts of the final national exam. It was aimed to measure
the students‟ reading comprehension of English text. Then, after finding the
students‟ answer, the writer analyzed and measured the correlation coefficient of
the data.
G. Data Analysis
In data analysis of the study, the writer obtained a measure of the amount
of students‟ learning motivation and a measure of students‟ reading
comprehension. To measure the students‟ learning motivation, the writer counted
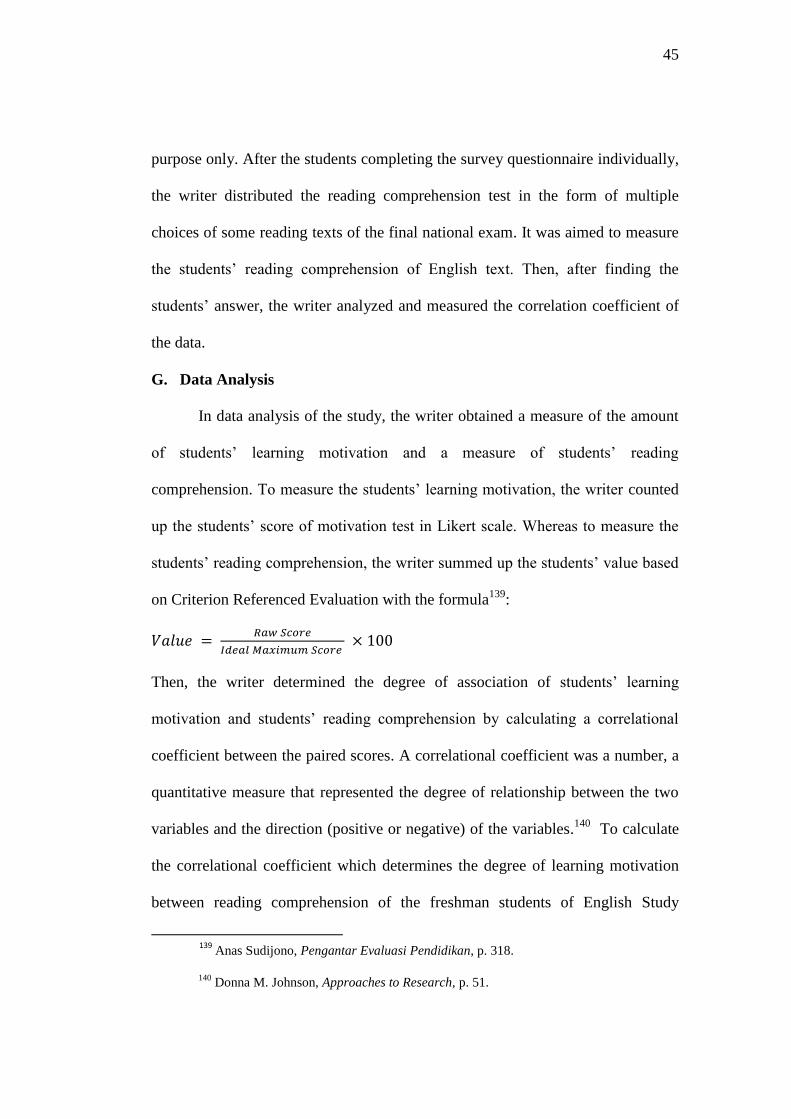
up the students‟ score of motivation test in Likert scale. Whereas to measure the
students‟ reading comprehension, the writer summed up the students‟ value based
on Criterion Referenced Evaluation with the formula139
:
Then, the writer determined the degree of association of students‟ learning
motivation and students‟ reading comprehension by calculating a correlational
coefficient between the paired scores. A correlational coefficient was a number, a
quantitative measure that represented the degree of relationship between the two
variables and the direction (positive or negative) of the variables.140
To calculate
the correlational coefficient which determines the degree of learning motivation
between reading comprehension of the freshman students of English Study
139
Anas Sudijono, Pengantar Evaluasi Pendidikan, p. 318.
140
Donna M. Johnson, Approaches to Research, p. 51.
46
Program of Ma‟had Al Jami‟ah, the writer used a Pearson product moment
correlation. The writer used it because Pearson product moment correlation
coefficient (Pearson r) can indicates both the direction and the magnitude of the
relationship between two variables.141
It was also appropriate to use when the
variables to be correlated are normally distributed and measured on an interval or
ration scale.142
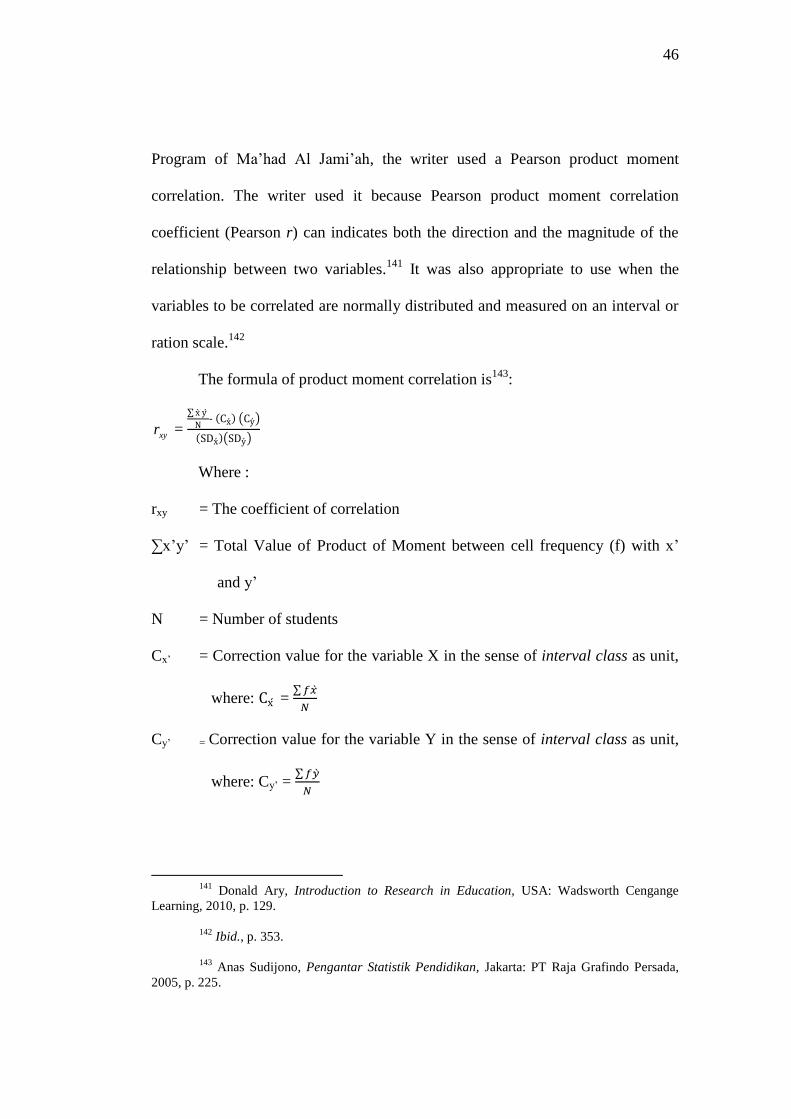
The formula of product moment correlation is143
:
xyr =
∑
- ( ) ( )
( )( )
Where :
rxy = The coefficient of correlation
∑x‟y‟ = Total Value of Product of Moment between cell frequency (f) with x‟
and y‟
N = Number of students
Cx‟ = Correction value for the variable X in the sense of interval class as unit,
where: = ∑
Cy‟ = Correction value for the variable Y in the sense of interval class as unit,
where: Cy‟ = ∑
141
Donald Ary, Introduction to Research in Education, USA: Wadsworth Cengange
Learning, 2010, p. 129.
142
Ibid., p. 353.
143
Anas Sudijono, Pengantar Statistik Pendidikan, Jakarta: PT Raja Grafindo Persada,
2005, p. 225.
47
= Standard deviation of variable X, in the sense of interval class as a unit,
so i=1.
= Standard deviation of variable Y, in the sense of interval class as a unit,
so i=1.
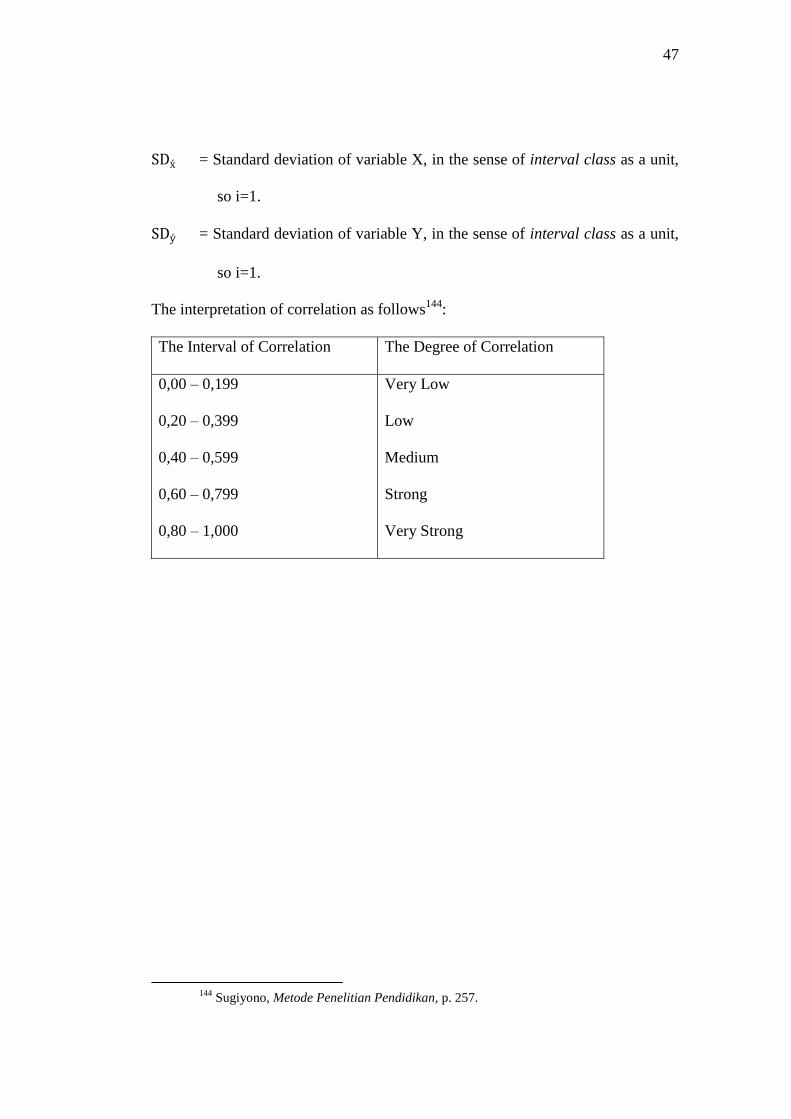
The interpretation of correlation as follows144
:
The Interval of Correlation The Degree of Correlation
0,00 – 0,199
0,20 – 0,399
0,40 – 0,599
0,60 – 0,799
0,80 – 1,000
Very Low
Low
Medium
Strong
Very Strong
144
Sugiyono, Metode Penelitian Pendidikan, p. 257.