Embed Size (px)
Citation preview

CITY OF LACEY SYSTEM ANALYSIS
CAROLLO ENGINEERS 8-1 February 2013 pw://Carollo/Documents/Client/WA/Lacey/8142A01/Deliverables/Chapters
CHAPTER NO. 8
SYSTEM ANALYSIS
8.1 INTRODUCTION
The purpose of this chapter is to summarize the City’s water distribution system deficiencies, by evaluating the capacity of storage facilities, pump stations, pressure reducing valve (PRV) stations, and pipelines. The evaluation of the pipeline capacities was conducted using the City’s H2ONet hydraulic model. The remaining capacity evaluations were conducted in Microsoft Excel. Improvements identified in this chapter are summarized in the Capital Improvements Plan (CIP) in Chapter 10.
8.2 SUPPLY SCENARIOS
All analyses are based on the demand and supply scenarios described in Table 8.1. There are a total of four scenarios:
Short-term, 6-year (2015);
Medium-term, 10-year (2019); and
Long-term, 20-year (2029) – Alternative 1 with Well 4 (S04) improvements.
Long-term, 20-year (2029) – Alternative 2 with Well 1 (S01) improvements.
The scenarios are based on the source of supply analysis presented in Chapter 4. The modeling to inform the conclusions of Chapter 8 was completed prior to the approval of several water right applications, which in turn necessitated revision of Chapter 4. Specifically, since the water system modeling was completed the supply scenarios were revised by extending the Olympia supply agreement and accelerating an increase in production at S27 (Evergreen) due to concerns about the City’s ability to meet ADD at various stages of the supply strategy. The storage component of this analysis has been updated to reflect the changes because it was shown to be deficient in the short-term using the original supply strategy. Other components of this analysis were not updated because they focus on meeting MDD and instantaneous pumping ability, changes to the supply strategy did not reduce the City’s ability to pump during any of the planning periods and demand projections have been revised down in the short and mid-term. The net effect of these changes is that the demand projections begin lower than originally projected, and grow to approximately the same final demand as the original projections in the year 2029, while the available supply has been increased in the short and mid-term. These changes do not adversely impact the hydraulic analysis and the supply portion is the only component that has been updated.
The original supply strategy, which was used for all analysis components except storage analysis, includes the following:
Maintain existing supplies, except as noted below.
In the short term (in 2011), remove the existing Olympia supply, and add G2-30248 (Hawks Prairie) and G2-30249 (Betti).

CITY OF LACEY SYSTEM ANALYSIS
CAROLLO ENGINEERS 8-2 February 26, 2013 pw://Carollo/Documents/Client/WA/Lacey/8142A01/Deliverables/Chapters/Ch08.docx
In the mid term, add the Olympia Brewery rights.
In the long term, add G2-30251 (Marvin) and G2-29304 (Evergreen), as well as either Well S04 improvements (Scenario 1) or Well S01 improvements (Scenario 2).
The updated supply strategy that was used for the storage analysis includes the following:
Maintain existing supplies, except as noted below.
In the short term (in 2014), add G2-30248 (Hawks Prairie) and G2-30249 (Betti).
In the mid term (2017), remove the existing Olympia supply and add G2-29304 (Evergreen).
In the long term, add the Olympia Brewery rights and G2-30251 (Marvin)
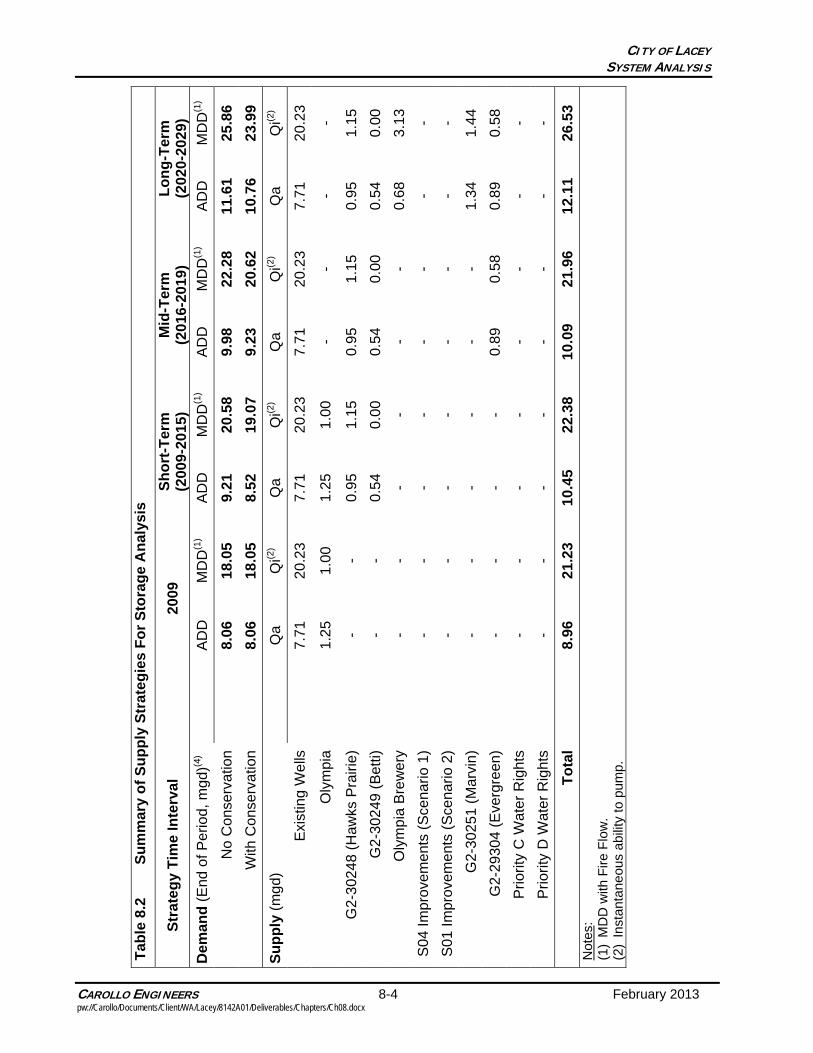
Neither of the well improvement projects were included in the storage analysis. Both the original and updated supply strategy scenarios are explained in more detail in Tables 8.1 and 8.2, respectively.

CITY OF LACEYSYSTEM ANALYSIS
CAROLLO ENGINEERS 8-3 February 2013 pw://Carollo/Documents/Client/WA/Lacey/8142A01/Deliverables/Chapters/Ch08.docx
Tab
le 8
.1
Su
mm
ary
of
Ori
gin
al S
up
ply
Str
ateg
ies
Fo
r H
ydra
ulic
Mo
del
ing
An
alys
is
Str
ateg
y T
ime
Inte
rval
20
09
Sh
ort
-Ter
m
(200
9-20
15)
Mid
-Ter
m
(201
6-20
19)
Lo
ng
-Ter
m
(202
0-20
29)
Dem
and
(E
nd o
f Per
iod,
mgd
)(4)
AD
D
MD
D(1
) A
DD
M
DD
(1)
AD
D
MD
D(1
) A
DD
M
DD
(1)
No
Con
serv
atio
n
8.06
18
.05
9.21
20
.58
9.98
22
.28
11.6
1 25
.86
With
Con
serv
atio
n
8.06
18
.05
8.52
19
.07
9.23
20
.62
10.7
6 23
.99
Su
pp
ly (
mg
d)
Qa
Q
i(2)
Qa
Q
i(2)
Qa
Q
i(2)
Qa
Q
i(2)
Exi
stin
g W
ells
7.
71
20.2
3 7.
71
20.2
3 7.
71
20.2
3 7.
71
20.2
3
Oly
mpi
a 1.
25
1.00
1.
25(3
) 1.
00(3
) -
- -
-
G2-
3024
8 (H
awks
Pra
irie)
-
- 0.
95
1.15
0.
95
1.15
0.
95
1.15
G2-
3024
9 (B
etti)
-
- 0.
54
0.00
0.
54
0.00
0.
54
0.00
Oly
mpi
a B
rew
ery
- -
- -
0.68
3.
13
0.68
3.
13
S04
Impr
ovem
ents
(S
cena
rio 1
) -
- -
- -
- 0.
00
2.38
S01
Impr
ovem
ents
(S
cena
rio 2
) -
- -
- -
- 0.
00
0.53
G2-
3025
1 (M
arvi
n)
- -
- -
- -
1.34
1.
44
G2-
2930
4 (E
verg
reen
) -
- -
- 0.
89(3
) 0.
58(3
) 0.
89
0.58
Prio
rity
C W
ater
Rig
hts
- -
- -
- -
- -
Prio
rity
D W
ater
Rig
hts
- -
- -
- -
- -
To
tal
(Sce
nar
io 1
) 8.
96
21.2
3 10
.45
22.3
8 10
.77
25.0
9 12
.11
28.9
1
To
tal
(Sce
nar
io 2
) 8.
96
21.2
3 10
.45
22.3
8 10
.77
25.0
9 12
.11
27
.06
Not
es:
(1)
MD
D w
ith F
ire F
low
. (2
) In
stan
tane
ous
abili
ty to
pum
p.
(3)
Oly
mpi
a ha
s be
en e
xten
ded
thro
ugh
2016
and
the
sche
dule
for
Eve
rgre
en h
as b
een
acce
lera
ted
sinc
e th
e an
alys
is w
as p
erfo
rmed
. (4
) D
eman
d fo
reca
sts
used
for
hydr
aulic
mod
elin
g w
ere
base
d on
dat
a av
aila
ble
in 2
009
and
have
sin
ce b
een
foun
d to
ove
rsta
te g
row
th a
nd
cons
umpt
ion
rate
s.
CITY OF LACEYSYSTEM ANALYSIS
CAROLLO ENGINEERS 8-4 February 2013 pw://Carollo/Documents/Client/WA/Lacey/8142A01/Deliverables/Chapters/Ch08.docx
Tab
le 8
.2
Su
mm
ary
of
Su
pp
ly S
trat
egie
s F
or
Sto
rag
e A
nal
ysis
Str
ateg
y T
ime
Inte
rval
2009
S
ho
rt-T
erm
(2
009-
2015
) M
id-T
erm
(2
016-
2019
) L
on
g-T
erm
(2
020-
2029
)
Dem
and
(E
nd o
f Per
iod,
mgd
)(4)
A
DD
M
DD
(1)
AD
D
MD
D(1
) A
DD
M
DD
(1)
AD
D
MD
D(1
)
No
Con
serv
atio
n
8.
06
18.0
5 9.
21
20.5
8 9.
98
22.2
8 11
.61
25.8
6
With
Con
serv
atio
n
8.
06
18.0
5 8.
52
19.0
7 9.
23
20.6
2 10
.76
23.9
9
Su
pp
ly (
mg
d)
Q
a
Qi(2
) Q
a
Qi(2
) Q
a
Qi(2
) Q
a
Qi(2
)
Exi
stin
g W
ells
7.71
20
.23
7.71
20
.23
7.71
20
.23
7.71
20
.23
Oly
mpi
a
1.25
1.
00
1.25
1.
00
- -
- -
G2-
3024
8 (H
awks
Pra
irie)
- -
0.95
1.
15
0.95
1.
15
0.95
1.
15
G2-
3024
9 (B
etti)
- -
0.54
0.
00
0.54
0.
00
0.54
0.
00
Oly
mpi
a B
rew
ery
-
- -
- -
- 0.
68
3.13
S04
Impr
ovem
ents
(S
cena
rio 1
)
- -
- -
- -
- -
S01
Impr
ovem
ents
(S
cena
rio 2
)
- -
- -
- -
- -
G2-
3025
1 (M
arvi
n)
-
- -
- -
- 1.
34
1.44
G2-
2930
4 (E
verg
reen
)
- -
- -
0.89
0.
58
0.89
0.
58
Prio
rity
C W
ater
Rig
hts
-
- -
- -
- -
-
Prio
rity
D W
ater
Rig
hts
-
- -
- -
- -
-
To
tal
8.
96
21.2
3 10
.45
22.3
8 10
.09
21.9
6 12
.11
26.5
3 N
otes
: (1
) M
DD
with
Fire
Flo
w.
(2)
Inst
anta
neou
s ab
ility
to p
ump.
CITY OF LACEY SYSTEM ANALYSIS
CAROLLO ENGINEERS 8-5 February 2013 pw://Carollo/Documents/Client/WA/Lacey/8142A01/Deliverables/Chapters/Ch08.docx
8.3 STORAGE ANALYSIS
Chapter 4 describes the City’s strategy to provide water to the entire system to meet the city-wide average day demand (ADD) and maximum day demand (MDD). The ability to meet these demands within each service area was also evaluated, as described herein. The following storage analysis reviews the policies and criteria established by the City, identifies the appropriate service areas for analysis, confirms the available sources of supply, reviews the available storage, establishes the storage requirements, and evaluates the possible storage deficit in each service level. The analysis considers demand and supply projections for the current, 6-, 10-, and 20-year scenarios presented in Table 8.2. Potential well improvements to wells 1 and 4 were not included in the storage analysis.
8.3.1 Policies & Criteria
Policies and criteria that pertain to the storage analysis are summarized in Tables 2.2, 2.3 and 2.5 in Chapter 2. The criteria generally stipulate that the City follow Department of Health Guidelines for calculating storage requirements, including allowing nesting of storage (using the same storage for both standby and fire suppression flow).
8.3.2 Service Levels
Storage requirements were compared to available storage in the City’s three major service levels. Service levels were grouped according to how they are served by storage as follows:
188 Service Level (includes the 188 and 211 Pressure Zones);
337 Service Level (includes the 337, 224, and 422 Pressure Zones); and
400 Service Level (includes the 400, 460, 375, and 275 Pressure Zones).
8.3.3 Reliable and Firm Supply Capacity
Some components of the storage requirements are based on providing storage during a power outage or inoperability of a supply source. These two conditions reduce the available supply and require additional storage to meet system demands. As discussed in Chapter 4, supplies are also limited by the “ability to pump” of the City’s wells. For this analysis, the following definitions are used regarding supply capacity:
Total Supply Capacity: the total ability to pump for all wells regardless of back-up power;
Firm Supply Capacity: the total supply capacity minus the largest source in that service area;
Reliable Supply Capacity: the total supply capacity minus wells without the ability to operate on auxiliary power in that service area.
Table 4 in Appendix S provides a summary of the sources of supply that serve the three major service levels, their reliable and firm supply capacity, and all new sources planned for each service area. Each of the storage service levels has more than one source of supply, thus all service levels have some firm supply capacity.

CITY OF LACEY SYSTEM ANALYSIS
CAROLLO ENGINEERS 8-6 February 2013 pw://Carollo/Documents/Client/WA/Lacey/8142A01/Deliverables/Chapters/Ch08.docx
As seen in Table 4 in Appendix S, ten of the City’s wells do not have the ability to be operated on auxiliary power, and are therefore assumed to be unreliable. Several wells have the ability to be operated on back-up power by connecting to a portable generator. The City has one 500-kW generator to power the larger wells, and one 125-kW generator for the smaller wells. The Hawks Prairie Site (including Well S19, Hawks Prairie Treatment Facility, the 400 Zone Booster Pump Station, and Hawks Prairie Reservoir) is the only site with a permanently installed on-site generator. All new sources are assumed to have provisions for back-up power and are thus reliable. The storage analysis uses the firm and reliable supply capacities, as defined above, when determining the equalizing and standby storage requirements.
8.3.4 Available Storage
The Lacey water system currently has a total of 13.09 million gallons (MG) of storage in seven reservoirs, as shown in Table 8.2. Table 1 in Appendix S provides the storage volume calculations. Table 8.2 also presents the service level served by each reservoir, the total storage available at each service level, and the net storage available after accounting for dead storage in each reservoir. The following section describes how the volume of storage available to each service level is reduced by dead storage.
8.3.4.1 Dead Storage
Dead Storage is the volume of water at the bottom of a storage tank that is unusable because it is physically too low to be withdrawn from the tank, or if withdrawn, the distribution system water pressure would fall below the acceptable criteria of 20 psi during a fire. Storage volume is considered dead if it is located below the outlet pipe and cannot be used because of system hydraulic limitations, or if it is located below the lowest water surface elevation that can provide 20 psi of pressure to the highest service connection in the service level.
Much of the storage in the City’s system is lost to dead storage due to the many standpipes in the system. Dead storage calculations, including the highest elevations served in each service level, are presented in Table 2 of Appendix S. The calculated dead storage for each reservoir is summarized in Table 8.3 below. Comments on individual facilities include:
The Union Mills and Steilacoom reservoirs have the largest volume of dead storage due to the high areas served by these standpipes.
Westside, Judd Hill, and Hawks Prairie Reservoirs all have booster pump stations, and are thus able to meet system pressures for the highest elevations served in their service level. The pumps at these stations are set to turn off when the water surface level in the reservoirs is at 10 feet above the base elevation. Therefore, the dead storage for these reservoirs is the volume of water when the reservoir is 10 feet full.
The Nisqually Reservoir has no dead storage as its base elevation is higher than the elevation required to provide 20 psi.
Dead storage for McAllister Reservoir was calculated assuming service to the highest elevations served in the 460 Zone. Though regular demands in the 460 Zone are served via the 460 Zone Booster Pump Station, fire service to this zone is delivered via gravity from McAllister Reservoir.

CITY OF LACEY SYSTEM ANALYSIS
CAROLLO ENGINEERS 8-7 February 2013 pw://Carollo/Documents/Client/WA/Lacey/8142A01/Deliverables/Chapters/Ch08.docx
Table 8.3 Available Storage
Reservoir Service Area Volume (MG) Dead Storage
(MG) Available
Storage (MG)
Westside 337 2.00 0.48 1.52
Judd Hill 337 0.51 0.07 0.44
Union Mills 337 2.20 1.31 0.89
Steilacoom 337 3.00 1.87 1.13
Subtotal 337 Service Level
7.71 3.73 3.98
McAllister 400 1.19 0.67 0.52
Hawks Prairie 400 4.04 0.48 3.57
Subtotal 400 Service Level
5.23 1.15 4.09
Nisqually 188 0.15 0.00(1) 0.15
Subtotal 188 Service Level
0.15 0.00 0.15
Total System 13.09 4.88 8.22
Notes: 1. No dead storage, as the reservoir is able to serve the highest elevation with the minimum
pressure requirement.
8.3.5 Storage Requirements
The following sections describe the storage requirements for each service level for each of the planning years. Following the Department of Health storage volume requirements (WAC 246-290-235(3) and Water System Design Manual, Chapter 9), the following five components of storage must be considered for any water system:
1. Operational Storage.
2. Equalizing Storage.
3. Standby Storage.
4. Fire Storage.
5. Dead Storage.
The five types of storage are shown in Figure 8.1. As discussed in the City’s policies and criteria, Lacey combines the requirements for Fire Storage and Standby Storage, by “nesting” these required volumes together. The following sections describe the requirements for each type of storage.

CITY OF LACEY SYSTEM ANALYSIS
CAROLLO ENGINEERS 8-8 February 2013 pw://Carollo/Documents/Client/WA/Lacey/8142A01/Deliverables/Chapters/Ch08.docx
Figure 8.1 Summary of Five Types of Storage Required by Department of Health
8.3.5.1 Operational Storage
Operational Storage is typically estimated based on the amount each reservoir drops prior to calling on the supply sources, and is measured as the volume of water stored between the pump call-off and pump call-on levels. This volume is dependent on the settings of the water level sensors controlling the well pumps and is designed to prevent excess cycling of pump motors.
Though City staff adjust the pump-on and pump-off elevation setpoints for each reservoir throughout the year (Chapter 9), the standard operating levels typically remain in the top 2 feet of each reservoir. Therefore, the operational storage volume was calculated based on this depth and the cross-sectional area of each reservoir, as shown in Table 3 of Appendix S. The Judd Hill Reservoir, which operates in conjunction with a booster pump station and well S06, is the only reservoir that does not fill or drain by gravity to/from the distribution system and is considered to contribute no operational storage to the system. Final operating storage requirements are shown in Table 8.4 for each of the planning years. Operational Storage is assumed to not change throughout the planning period.
Table 8.4 Operational Storage (MG)
Service Level 2015 2019 2029
337 Service Level 0.24 0.24 0.24
400 Service Level 0.12 0.12 0.12
188 Service Level 0.01 0.01 0.01
Notes:
1. All values are rounded to the nearest 0.01 MG.

CITY OF LACEY SYSTEM ANALYSIS
CAROLLO ENGINEERS 8-9 February 2013 pw://Carollo/Documents/Client/WA/Lacey/8142A01/Deliverables/Chapters/Ch08.docx
8.3.5.2 Equalizing Storage
Equalizing Storage is the volume needed to satisfy the peak hour demand (PHD) that exceeds the capacity of the supply system. WAC 246-290-230 (5) states:
New public water systems or additions to existing systems shall be designed with the capacity to deliver the design PHD quantity of water at 30 psi (210 kPA) under PHD flow conditions measured at all existing and proposed service water meters or along property lines adjacent to mains if no meter exists, and under the condition where all equalizing storage has been depleted.
Equalizing volume requirements for water systems that call on their supplies (as opposed to continuous pumping), are calculated using the following equation:
ES = (PHD – Qs)*150 minutes, but in no case less than zero.
Where: ES = Equalizing storage component, in gallons.
PHD = Peak hourly demand, in gpm.
Qs = Sum of all installed and active source of supply capacities, except emergency sources of supply, in gpm.
The Equalizing Storage requirements for each service level were calculated following this method, as presented in Tables 5, 6 and 7 in Appendix S. The Total Supply Capacity was used for each service level for Qs in the equation above. These calculations also assume that the 400 Service Level only utilizes the amount of supply required to meet its peak hour demands, with the remaining supply available to the lower 188 and 337 service levels. Table 7 in Appendix S calculates this required supply for the 400 Service Level; Tables 5 & 6 show the remaining supply from the 400 Service Level distributed to the 188 and 337 service levels, respectively.
Table 8.5 summarizes the Equalizing Storage requirements for each service level. As seen in the table, equalizing storage requirements in the 337 Service Level change with the varying supply and demand scenarios. The 400 Service Level requires no equalizing storage as its supplies are equal to or greater than its peak hour demand. Equalizing storage in the 188 Service Level remains constant as there is no change in supply or demand.
Table 8.5 Required Equalizing Storage (MG)
Service Level 2015 2019 2029
337 Service Level 0.74 1.12 1.36
400 Service Level 0.00 0.00 0.00
188 Service Level 0.01 0.01 0.01
Notes:
1. All values are rounded to the nearest 0.01 MG.
CITY OF LACEY SYSTEM ANALYSIS
CAROLLO ENGINEERS 8-10 February 2013 pw://Carollo/Documents/Client/WA/Lacey/8142A01/Deliverables/Chapters/Ch08.docx
8.3.5.3 Standby Storage
Standby Storage is the volume of storage required to supply reasonable system demands during a system emergency, such as disruption of the water supply. Disruptions could be caused by transmission pipeline or equipment failure, power outage, valve failure, or other system interruptions. The computation of emergency/standby storage requirements includes consideration of reasonable system disruptions that can be expected to occur within normal planning contingencies, and does not consider major system emergencies, such as earthquakes. These types of emergencies should be covered under emergency system operation planning.
For water systems with multiple sources of supply, the DOH Water System Design Manual recommends that Standby Storage be adequate to provide two days of ADD minus the firm supply capacity for one day. Additionally, it is advised that the Standby Storage not be less than 200 gallons per equivalent residential unit (ERU). The City has adopted a policy that Standby Storage be adequate to provide two days of ADD minus the reliable supply capacity as an acceptable level of service and will use this method to determine if and when a storage deficiency will occur. This method is more restrictive than using the firm capacity method, as it considers a source’s ability to operate on auxiliary power. However, this is less restrictive than the 200 gallons/ERU recommendation, which the City will consider when sizing future storage improvements.
The Standby Storage requirements for each service level were calculated following these three methods, as presented in Tables 5, 6, and 7 in Appendix S. Reliable and firm supply capacities for each service level and each planning year were developed in Table 4, as discussed in Section 8.3.4 above. Similar to the equalizing storage calculations, the standby storage calculations assume that the 400 Service Level only requires enough supply to meet its peak demands (in this case, twice the ADD), and the excess supply is available to the 188 and 337 Service Levels.
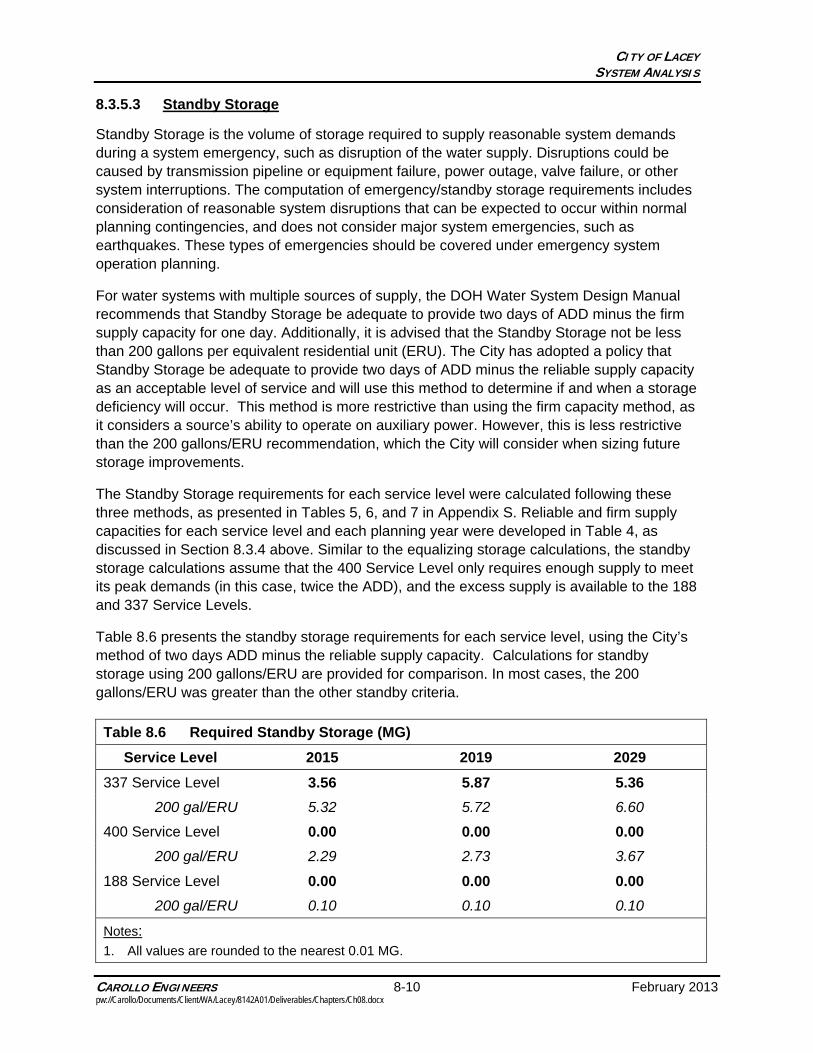
Table 8.6 presents the standby storage requirements for each service level, using the City’s method of two days ADD minus the reliable supply capacity. Calculations for standby storage using 200 gallons/ERU are provided for comparison. In most cases, the 200 gallons/ERU was greater than the other standby criteria.
Table 8.6 Required Standby Storage (MG)
Service Level 2015 2019 2029
337 Service Level 3.56 5.87 5.36
200 gal/ERU 5.32 5.72 6.60
400 Service Level 0.00 0.00 0.00
200 gal/ERU 2.29 2.73 3.67
188 Service Level 0.00 0.00 0.00
200 gal/ERU 0.10 0.10 0.10
Notes: 1. All values are rounded to the nearest 0.01 MG.

CITY OF LACEY SYSTEM ANALYSIS
CAROLLO ENGINEERS 8-11 February 2013 pw://Carollo/Documents/Client/WA/Lacey/8142A01/Deliverables/Chapters/Ch08.docx
8.3.5.4 Fire Suppression Storage
Fire Suppression Storage is the volume of storage required to deliver fire flows as prescribed by local fire protection authorities, while maintaining a minimum pressure of 20 psi throughout the rest of the system. Since a fire can occur at any time during the day, the fire storage must be in addition to the equalizing storage. WAC 246-290-230 (6) states:
If fire flow is to be provided, the distribution system shall also provide MDD plus the required fire flow at a pressure of at least 20 psi (140 kPA) at all points throughout the distribution system, and under the condition where the designed volume of fire suppression and equalizing storage has been depleted.
Fire flow demand is the quantity of water required for fire fighting as defined by applicable water system criteria and fire codes. Fighting fires often places the largest demands on a water system because a high volume of water must be supplied over a short time. Such demands require each system component to operate at its optimal condition. Consequently, the Washington State Insurance Service Office (ISO) recommends that water systems be designed to convey fire flows during a period of MDD with one major facility out of service.
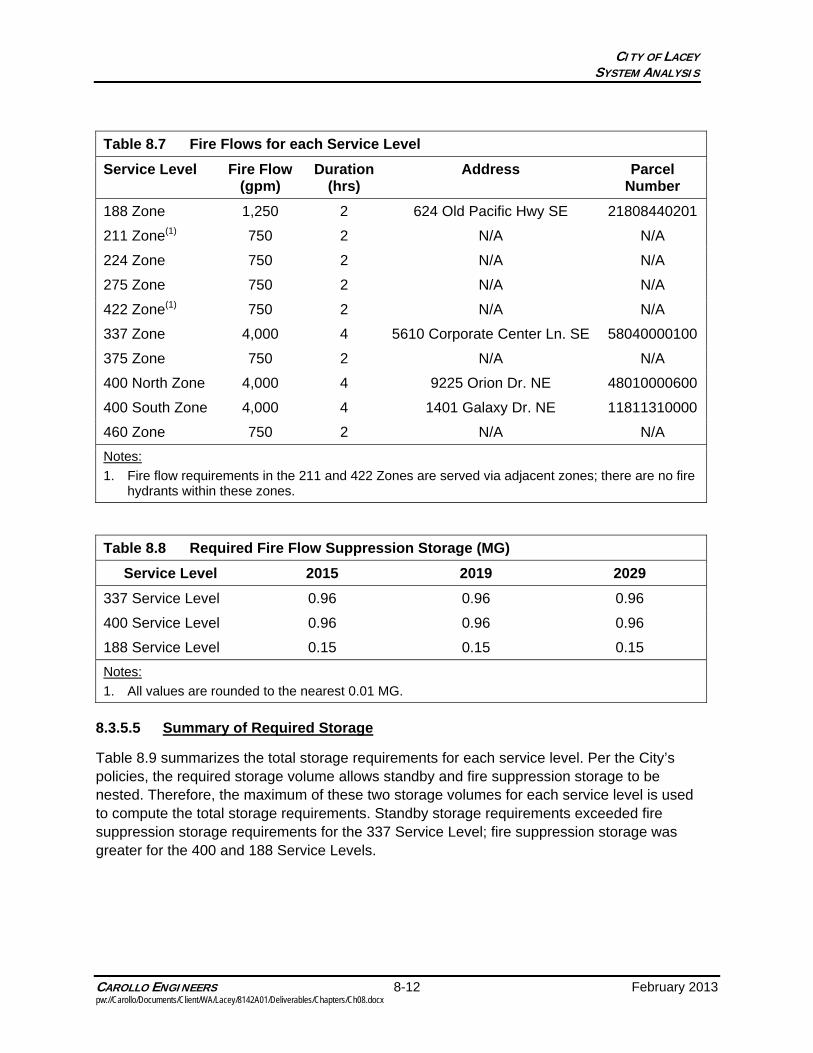
Fire flows required by existing structures vary within the water service area. The system-wide fire suppression requirements, including flow and duration, are presented in Table 2.3 in Chapter 2 – Policies and Criteria. The current maximum fire demand as provided by the ISO and the minimum City requirements for each service level is shown in Table 8.7. It is assumed that these maximum fire scenarios remain the same for each service level throughout the planning period.
The fire suppression storage volume is the product of the fire flow rate and required duration. These volumes were calculated for each service level for each planning year in Tables 5, 6, and 7 in Appendix S, and are summarized in Table 8.8.
CITY OF LACEY SYSTEM ANALYSIS
CAROLLO ENGINEERS 8-12 February 2013 pw://Carollo/Documents/Client/WA/Lacey/8142A01/Deliverables/Chapters/Ch08.docx
Table 8.7 Fire Flows for each Service Level
Service Level Fire Flow (gpm)
Duration (hrs)
Address Parcel Number
188 Zone 1,250 2 624 Old Pacific Hwy SE 21808440201
211 Zone(1) 750 2 N/A N/A
224 Zone 750 2 N/A N/A
275 Zone 750 2 N/A N/A
422 Zone(1) 750 2 N/A N/A
337 Zone 4,000 4 5610 Corporate Center Ln. SE 58040000100
375 Zone 750 2 N/A N/A
400 North Zone 4,000 4 9225 Orion Dr. NE 48010000600
400 South Zone 4,000 4 1401 Galaxy Dr. NE 11811310000
460 Zone 750 2 N/A N/A
Notes:
1. Fire flow requirements in the 211 and 422 Zones are served via adjacent zones; there are no fire hydrants within these zones.
Table 8.8 Required Fire Flow Suppression Storage (MG)
Service Level 2015 2019 2029
337 Service Level 0.96 0.96 0.96
400 Service Level 0.96 0.96 0.96
188 Service Level 0.15 0.15 0.15
Notes:
1. All values are rounded to the nearest 0.01 MG.
8.3.5.5 Summary of Required Storage
Table 8.9 summarizes the total storage requirements for each service level. Per the City’s policies, the required storage volume allows standby and fire suppression storage to be nested. Therefore, the maximum of these two storage volumes for each service level is used to compute the total storage requirements. Standby storage requirements exceeded fire suppression storage requirements for the 337 Service Level; fire suppression storage was greater for the 400 and 188 Service Levels.

CITY OF LACEY SYSTEM ANALYSIS
CAROLLO ENGINEERS 8-13 February 2013 pw://Carollo/Documents/Client/WA/Lacey/8142A01/Deliverables/Chapters/Ch08.docx
Table 8.9 Total Required Storage
Service Level 2015 2019 2029
337 Service Level
Operational Storage (MG) 0.24 0.24 0.24
Equalizing Storage (MG) 0.74 1.12 1.36
Max of Standby/Fire (MG) 3.56 5.87 5.36
Total Storage Required (MG) 4.54 7.23 6.96
400 Service Level
Operational Storage (MG) 0.12 0.12 0.12
Equalizing Storage (MG) 0.00 0.00 0.00
Max of Standby/Fire (MG) 0.96 0.96 0.96
Total Storage Required (MG) 1.08 1.08 1.08
188 Service Level
Operational Storage (MG) 0.01 0.01 0.01
Equalizing Storage (MG) 0.01 0.01 0.01
Max of Standby/Fire (MG) 0.15 0.15 0.15
Total Storage Required (MG) 0.17 0.17 0.17
Notes: 1. All values are rounded to the nearest 0.01 MG.
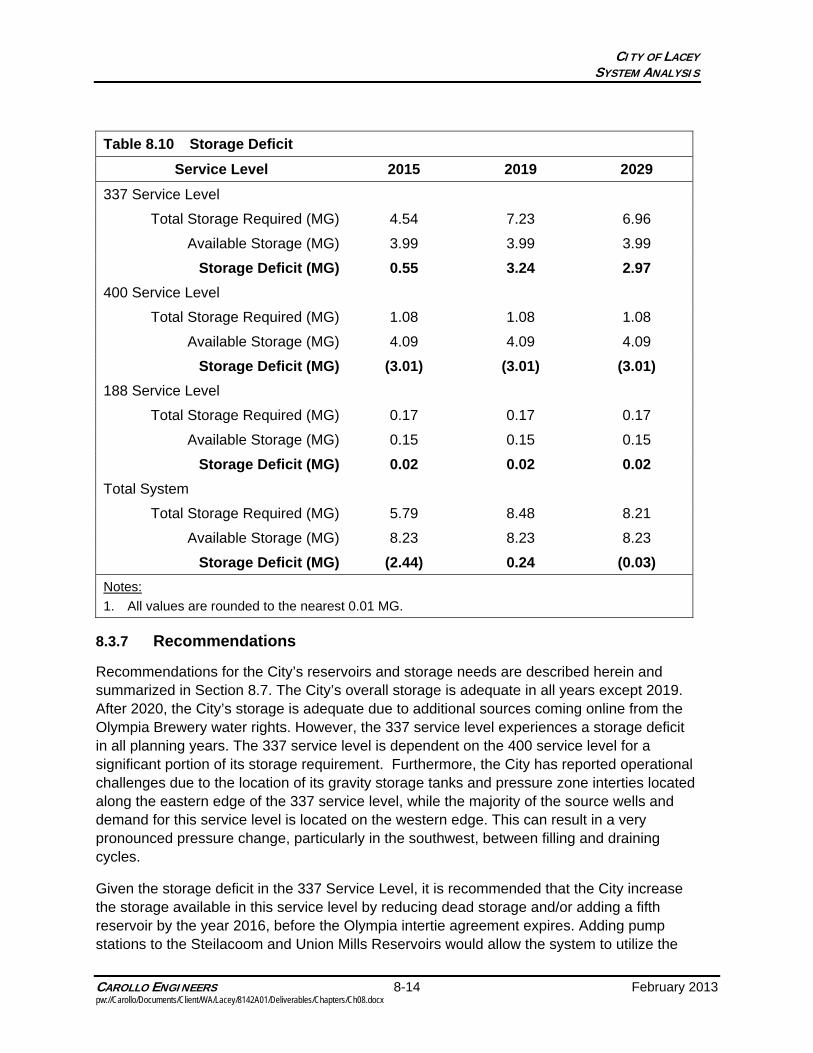
8.3.6 Storage Requirements Compared to Available Storage
A comparison of storage requirements to available storage is summarized in Table 8.10. The table shows that the 400 Service Level has excess storage, while the 188 and 337 Service Levels are deficient in all planning years. Generally, the 400 Service Level is able to meet its service level peak demands and provide supply and storage for the lower service levels. For this analysis, the excess storage in the 400 Service Level is assumed to first meet the remaining storage needs in the 188 Service Level, with the remaining supply available to the 337 Service Level. Using this assumption, the total system storage is adequate in all years except 2019 where there is a storage deficit of 0.24 MG.
CITY OF LACEY SYSTEM ANALYSIS
CAROLLO ENGINEERS 8-14 February 2013 pw://Carollo/Documents/Client/WA/Lacey/8142A01/Deliverables/Chapters/Ch08.docx
Table 8.10 Storage Deficit
Service Level 2015 2019 2029
337 Service Level
Total Storage Required (MG) 4.54 7.23 6.96
Available Storage (MG) 3.99 3.99 3.99
Storage Deficit (MG) 0.55 3.24 2.97
400 Service Level
Total Storage Required (MG) 1.08 1.08 1.08
Available Storage (MG) 4.09 4.09 4.09
Storage Deficit (MG) (3.01) (3.01) (3.01)
188 Service Level
Total Storage Required (MG) 0.17 0.17 0.17
Available Storage (MG) 0.15 0.15 0.15
Storage Deficit (MG) 0.02 0.02 0.02
Total System
Total Storage Required (MG) 5.79 8.48 8.21
Available Storage (MG) 8.23 8.23 8.23
Storage Deficit (MG) (2.44) 0.24 (0.03)
Notes:
1. All values are rounded to the nearest 0.01 MG.
8.3.7 Recommendations
Recommendations for the City’s reservoirs and storage needs are described herein and summarized in Section 8.7. The City’s overall storage is adequate in all years except 2019. After 2020, the City’s storage is adequate due to additional sources coming online from the Olympia Brewery water rights. However, the 337 service level experiences a storage deficit in all planning years. The 337 service level is dependent on the 400 service level for a significant portion of its storage requirement. Furthermore, the City has reported operational challenges due to the location of its gravity storage tanks and pressure zone interties located along the eastern edge of the 337 service level, while the majority of the source wells and demand for this service level is located on the western edge. This can result in a very pronounced pressure change, particularly in the southwest, between filling and draining cycles.
Given the storage deficit in the 337 Service Level, it is recommended that the City increase the storage available in this service level by reducing dead storage and/or adding a fifth reservoir by the year 2016, before the Olympia intertie agreement expires. Adding pump stations to the Steilacoom and Union Mills Reservoirs would allow the system to utilize the
CITY OF LACEY SYSTEM ANALYSIS
CAROLLO ENGINEERS 8-15 February 2013 pw://Carollo/Documents/Client/WA/Lacey/8142A01/Deliverables/Chapters/Ch08.docx
large amounts of dead storage in these standpipes, but may not provide an operational benefit. The additional storage would primarily be used for meeting standby (or emergency) supply needs, thus the pump stations would not need to run continuously. A pump station might also improve turn-over of water in these reservoirs.
Installing a new reservoir is another option for meeting the future storage deficit in this service level. A reservoir would have lower operational and maintenance costs than pump stations and would have the operational benefit of additional gravity storage for equalization in the 337 Zone. The City has previously purchased property in the west side of the 337 Zone with the plan of installing a reservoir to help meet the pressure requirements in that area. The 0.76-acre property is located north of Intelco Loop, a relatively high point in the area at an elevation of approximately 228 feet. To serve the highest elevations in the 337 Zone with 30 psi, the reservoir would need to be approximately 100 feet tall.
It is recommended that the City evaluate alternatives for serving the 337 Service Level with additional storage, including new pump stations, a reservoir, or a combination of both. For the purpose of this study, a new 3.2-MG reservoir located on the City’s property is assumed for developing a capital improvements plan. 3.2-MG of additional storage would allow the City to meet DOH’s recommended standby storage volume of 200 gallons/ERU through the planning period and would nearly eliminate the 337 Zones dependence on storage located in the 400 Zone. A feasibility study and predesign will need to be completed to determine the most cost effective combination of new gravity storage verses pumping of dead storage, and whether a stand pipe, elevated storage, or booster pumps best meets the City’s operational practices.
The Steilacoom, Union Mills, and Nisqually Reservoirs each have only one inlet/outlet, which can lead to poor mixing within a reservoir. While the City has not observed any water quality issues attributable to poor mixing in these reservoirs, it is recommended that the City continue to monitor the water quality in its reservoirs. Union Mills, Nisqually, and Judd Hill Reservoirs do not have overflow ponds for disposing of overflow or for draining the reservoirs. Developing overflow ponds for these reservoirs is recommended.
City staff have identified the need for a project to relocate electrical and communication equipment and install a new altitude valve vault at the Union Mills Reservoir. The Union Mills Reservoir altitude valve cannot be accessed for maintenance, refurbishment or replacement. Failure of this valve could expose the City to a great deal of liability and would severely impact operation of the entire water system, possibly requiring implementation of the water shortage response plan. The existing electrical and communications equipment is housed on top of the valve vault.
8.4 PUMP STATION ANALYSIS
The pump station analysis includes reviewing the current capacity of the City’s booster pump stations and providing recommendations as required. Individual pump station analyses are required for pump stations that provide the sole supply to a boosted pressure zone. Capacity analyses for more complicated systems are performed as part of the system analysis using the hydraulic model. The following sections describe the policies and criteria established by
CITY OF LACEY SYSTEM ANALYSIS
CAROLLO ENGINEERS 8-16 February 2013 pw://Carollo/Documents/Client/WA/Lacey/8142A01/Deliverables/Chapters/Ch08.docx
the City regarding pump stations, capacity analysis, and recommendations for the City’s pump stations.
8.4.1 Policies and Criteria
In Chapter 2, Table 2.2 the City established the following policies pertaining to pumping capacity:
“A minimum of two pumps or a complete spare pump will be provided for each distribution system pump station to provide flexibility and system redundancy. Where multiple pumps are provided, the pumps will be sized so that the station can meet MDD flow conditions with the largest pump out-of-service. If fire flow for an area is not provided by gravity from a reservoir, booster pumps (along with any supply available) will be sized to provide peak hour demand (PHD) and fire demand for the service area should the largest pump be out-of-service. Since power continuity is a concern at fire flow booster pump stations, auxiliary power, such as an installed or portable generator, of sufficient capacity to power the station should be provided.”
8.4.2 Capacity Evaluation
Of the City’s six booster pump stations, only two pump stations, the 460 Zone Booster Station and Mt. Aire Booster Station, were evaluated for capacity to meet current and future demands. All other pump stations operate in zones with multiple sources of supply, and were evaluated as part of the system analysis (Section 8.5) due to the complex nature of demands and pumping requirements. The Skyridge Booster Pump Station was not evaluated for capacity, as demands specific to this zone were not evaluated; additional information is provided below.
8.4.2.1 460 Zone Booster Station
The 460 Zone Booster Station was installed in 2002 to increase pressure to the 460 Zone. Fire flows to this area are mainly provided by the McAllister Reservoir via a check valve to the zone. The booster pump station has two 7.5-horsepower (HP) pumps providing 250 gpm each. To evaluate the pump stations’ required capacity, the current and future demand for the 460 Zone was estimated following the same method outlined in Chapter 3. Table 8 in Appendix S presents the estimated demands for the 460 Zone.
The 460 Zone consists entirely of single-family residential parcels, equating directly to ERUs. Using this number of parcels, an ERU demand of 210 gpd/ERU (to account for the higher consumption rates in this neighborhood), and adding leakage, the ADD was calculated to be 0.04 mgd. Maximum day demand (MDD) and peak hour demand (PHD) were calculated using the established MDD and PHD peaking factors (2.2 and 1.6, respectively). Though a few additional parcels are anticipated to develop in the 20-year planning period, these additional demands did not impact the future demand significantly enough to reflect a change in the peak future demands.
Table 8.11 presents the estimated demands for this area for the year 2029. The table also provides the fire flow requirement for the zone (750 gpm for low-density residential areas), though this is not added to the required demands. Using the pump station’s firm capacity, the

CITY OF LACEY SYSTEM ANALYSIS
CAROLLO ENGINEERS 8-17 February 2013 pw://Carollo/Documents/Client/WA/Lacey/8142A01/Deliverables/Chapters/Ch08.docx
pump station has excess capacity of 153 gpm. Because this pressure zone is also served by the McAllister Reservoir, the capacity analysis for fire flows in this area was completed as part of the system analysis in Section 8.5.
Table 8.11 460 Zone Booster Station Capacity Analysis
MDD (gpm)
PHD (gpm)
Fireflow (gpm)
Required Capacity(1)
(gpm)
Pumping Firm Capacity
(gpm)
Capacity Deficit (gpm)
62 97 750 97 250 (153)
Notes:
1. Required capacity does not include fire flow, which is provided by the McAllister Reservoir.
8.4.2.2 Mt. Aire Booster Station
The Mt. Aire Booster Station, which currently boosts water purchased from Olympia, was also evaluated for boosting the supply from the future Olympia Brewery water rights. By the year 2019, the City anticipates having a peak capacity of 3.13 mgd (2,172 gpm) from the Olympia Brewery. The pump station has two 750-gpm pumps providing a total capacity of 2.16 mgd, and a firm capacity of 1.08 mgd. This pump station will need to be replaced or expanded to accommodate the future supply coming from Olympia. The City has reviewed the option of installing a new pump station in a new location, further west in the City. For the purpose of this report, a new 3.2-mgd booster pump station is assumed to be constructed in this area.
8.4.2.3 Skyridge Booster Station
The Skyridge Booster Station boosts water from the 337 Zone to the 422 Zone to increase the available service pressure in this area. The pump station has two 5-HP pumps, each providing a flow of approximately 110 gpm. The capacity of this pump station was not evaluated, as demands specific to this area were not determined. However, this area serves a very small zone with limited growth potential. Fire service to this area is provided by hydrants in the adjacent 337 Zone.
8.4.3 Recommendations
Recommendations for the City’s booster stations and pumping needs are described herein and summarized in Section 8.7. Recommendations regarding capacity requirements in the 460 Zone are discussed in the system analysis below. Installing a new 3.2-mgd pump station to accommodate the future Olympia Brewery Rights is anticipated.
To meet the City’s criteria of pumping redundancy, it is recommended that the Judd Hill Booster Station either be equipped with a back-up pump or that a complete spare be kept on hand.
Operations staff have requested that pumps within the Westside Booster Pump Station be replaced with variable frequency drives (VFDs) to improve pumping operations and

CITY OF LACEY SYSTEM ANALYSIS
CAROLLO ENGINEERS 8-18 February 2013 pw://Carollo/Documents/Client/WA/Lacey/8142A01/Deliverables/Chapters/Ch08.docx
efficiency. This item will be included in the Capital Improvements Plan, and will be identified as a system maintenance improvement, rather than being growth-related.
Both the Westside Booster Pump Station and Judd Hill Booster Pump Station contribute to meeting needed fire flows within the City. Though both pump stations are able to connect to a back-up power supply, in the event of a system-wide power outage it is likely that the portable generators currently owned by the City would instead be used to power wells. Of these two pump stations, Westside is of greater priority, due to its greater capacity and ability to share a generator with Wells S01, S02 and S03. Hence, it is recommended that an appropriate permanent or portable generator be purchased to meet the combined power needs of these facilities.
8.5 PRESSURE REDUCING VALVE ANALYSIS
PRV stations were evaluated for their ability to meet MDD plus fire flows at the end of the planning period (2029), as summarized in Table 8.12. All PRV capacities were calculated based on an assumed maximum flow velocity of 20 feet per second (fps). The evaluation only included zones that do not have reservoirs. In some cases, these areas are also served by individual supply wells; the well capacities were not included in this evaluation, hence the evaluation was conservative. All PRV stations had sufficient capacities through the planning period.

CITY OF LACEYSYSTEM ANALYSIS
CAROLLO ENGINEERS 8-19 February 2013 pw://Carollo/Documents/Client/WA/Lacey/8142A01/Deliverables/Chapters/Ch08.docx
Tab
le 8
.12
Pre
ssu
re R
edu
cin
g V
alve
Cap
acit
y E
valu
atio
n
PR
V
(Zo
ne
Ser
ved
)
Dia
(i
n)
Ca
pa
cit
y (g
pm
)(1)
2029
Req
uir
ed C
apac
ity
(gp
m)
Cap
acit
y S
urp
lus
(gp
m)
MD
D
Fir
e F
low
T
ota
l
Woo
dlan
d 2
196
(224
) 6
1763
1958
49
75
0 79
9 1,
159
48th
Ave
2
196
(301
) 6
1763
1958
98
75
0 84
8 1,
110
Nis
qual
ly(2
) 2
196
(211
/188
) 6
1763
1958
12
5 1,
500
1,62
5 33
3
50th
Ave
2
196
(375
) 6
1763
1958
10
2 75
0 85
2 1,
106
Not
es:
1.
Cap
acity
bas
ed o
n m
axim
um v
eloc
ity o
f 20
fps,
bas
ed o
n C
la-V
al M
odel
90-
01 P
RV
.
2.
Req
uire
d flo
w r
ate
does
not
take
into
acc
ount
the
Nis
qual
ly W
ell.

CITY OF LACEY SYSTEM ANALYSIS
CAROLLO ENGINEERS 8-20 February 2013 pw://Carollo/Documents/Client/WA/Lacey/8142A01/Deliverables/Chapters/Ch08.docx
The multiple PRV stations transferring flows from the 400 Zone to the 337 Zone provide a high level redundancy. However, they also create operational complexity; it can be difficult to balance supplies between the two zones. It is recommended that the City periodically review PRV settings to confirm capacity and storage needs are being met effectively in both zones.
8.5.1 Recommendations
Recommendations for the City’s PRV stations are described herein and summarized in Section 8.7. No capacity-related improvements were identified. However, given the complexity of the City’s system, significant benefits would be realized by allowing the existing PRVs to be controlled and monitored via the City’s SCADA system. The water system PRVs are currently hydraulically operated and pilot-controlled. Improvements would include adding electronic and telemetry controls to existing PRV valves. These changes would enhance the operators’ ability to manage and operate the water system. These improvements should be focused on those PRV stations that regulate the movement of water between the 400 and 337 pressure zones. During high demand periods the conveyance of water between these zones could be improved, potentially delaying the need for other capital projects. This project would be conducted over multiple years; a budget for the first year of the implementation has been included in the CIP.
8.6 DISTRIBUTION SYSTEM ANALYSIS
The distribution system analysis was conducted with the City’s H2ONet hydraulic model. In 2008, Gray and Osborne completed a project to remove the Hawks Prairie Booster Station and construct a new (400 Zone) booster station that would raise the previous 380 Zone to an expanded 400 Zone. IDModeling performed the hydraulic modeling task to update and calibrate the hydraulic model and to include the selected Hawks Prairie configuration. All analyses made as part of this Comprehensive Plan are based on the previous modeling efforts with the addition of the most recent pipeline improvements and operational set-points.
Prior to running the simulations to identify system deficiencies, the following updates were made to the model:
It was observed that certain model wells were supplying too much or too little water relative to their reliable capacity, as defined in Table 8.1. As a result, the model was updated with flow control valves at each well site. These flow controls valves were assigned settings so that the rate of supply from each well matched its reliable capacity.
At the City’s direction, two major water mains were added to the model, to be included in all future year analyses:
16-inch main on Martin Way from Neil Street to Choker Street, and
12-inch main on Mullen Road from Stikes Drive to Ruddell Road.
8.6.1 Policies and Criteria
Policies relevant to the distribution system analysis are summarized in Tables 2.2, 2.3 and 2.5 of Chapter 2. Key criteria evaluated as part of the system analysis include the following:

CITY OF LACEY SYSTEM ANALYSIS
CAROLLO ENGINEERS 8-21 February 2013 pw://Carollo/Documents/Client/WA/Lacey/8142A01/Deliverables/Chapters/Ch08.docx
Maintaining a system pressure of 20 psi when fire fighting storage and equalizing storage are depleted, during fire flows of:
750 gpm for all single-family residential areas of the City.
1,500 gpm for all multifamily residential and all other non-residential land use areas, except parks and open spaces within the City.
Maximum peak hour velocity of 8 feet per second (fps).
Minimum service pressure of 30 psi during peak hour demands.
8.6.2 Summary of Modeling Scenarios
The system analysis was conducted for the four supply scenarios described above in Section 8.2. Two separate model runs were conducted for each of the four scenarios, consisting of:
Fire Flow Evaluation – Evaluation of ability to meet minimum system pressures of 20 psi while delivering required fire flows, as described above in the policy and criteria, at MDD.
Peak Hour Evaluation – Evaluation of the ability to meet minimum system pressures of 30 psi and not exceed the 8 fps maximum velocity while delivering projected PHD.
The fire flow and peak hour evaluations were conducted as static simulations within the hydraulic model. In addition, an extended period simulation (EPS) of system operations under ADD conditions for the short-term scenario (2015) were conducted to evaluate potential problems occurring during non-peak periods. However, the City’s large number of sources and their distribution throughout the system provide for a wide range of operating conditions and countless potential modeling scenarios. These scenarios focus primarily on the City’s ability to meet Fire Flow and Peak Hour requirements. City staff have identified a variety of potential concerns and observed operational complications shown in Table 8.28, which likely occur during supply and demand scenarios outside the scope of this plan and are not specifically analyzed here.
8.6.3 Model Settings
A number of settings were adjusted in the hydraulic model for the purpose of the current system analysis, as described herein.
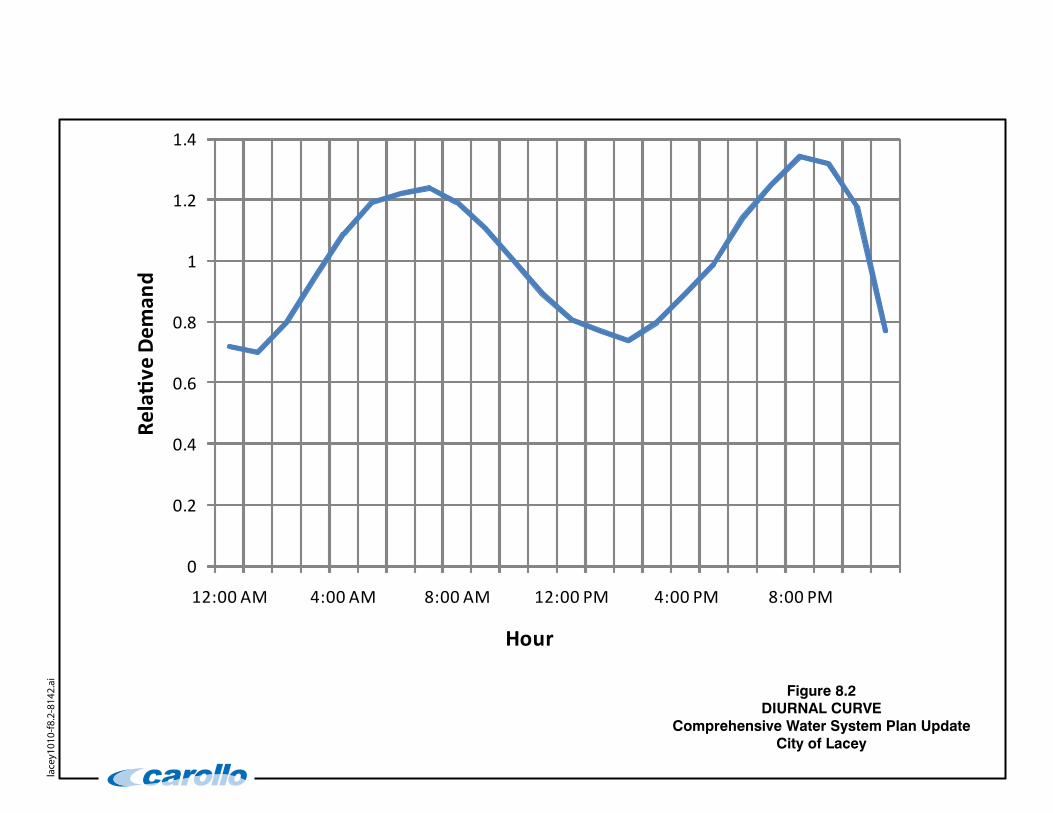
Demands. The City’s model has two sets of demand distributions; one representing summer and one representing winter. The summer demand set was used for all simulations, including the EPS evaluation. Similarly, the City’s model includes separate diurnal curves representing summer and winter conditions. The summer diurnal curve was used and is shown in Figure 8.2.
0
0.2
0.4
0.6
0.8
1
1.2
1.4
12:00 AM 4:00 AM 8:00 AM 12:00 PM 4:00 PM 8:00 PM
Relati
ve D
eman
d
Hour
lacey101
0-f8.2-814
2.ai
Figure 8.2DIURNAL CURVE
Comprehensive Water System Plan UpdateCity of Lacey
CITY OF LACEY SYSTEM ANALYSIS
CAROLLO ENGINEERS 8-23 February 2013 pw://Carollo/Documents/Client/WA/Lacey/8142A01/Deliverables/Chapters/Ch08.docx
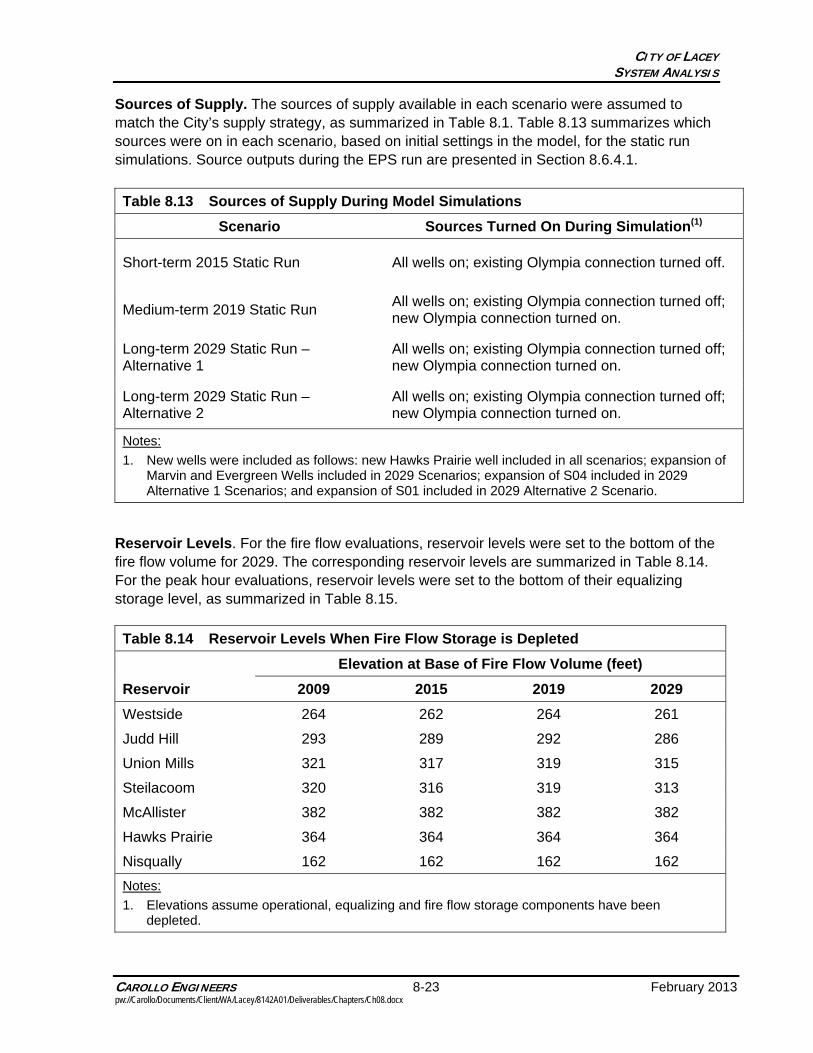
Sources of Supply. The sources of supply available in each scenario were assumed to match the City’s supply strategy, as summarized in Table 8.1. Table 8.13 summarizes which sources were on in each scenario, based on initial settings in the model, for the static run simulations. Source outputs during the EPS run are presented in Section 8.6.4.1.
Table 8.13 Sources of Supply During Model Simulations
Scenario Sources Turned On During Simulation(1)
Short-term 2015 Static Run All wells on; existing Olympia connection turned off.
Medium-term 2019 Static Run All wells on; existing Olympia connection turned off; new Olympia connection turned on.
Long-term 2029 Static Run – Alternative 1
All wells on; existing Olympia connection turned off; new Olympia connection turned on.
Long-term 2029 Static Run – Alternative 2
All wells on; existing Olympia connection turned off; new Olympia connection turned on.
Notes:
1. New wells were included as follows: new Hawks Prairie well included in all scenarios; expansion of Marvin and Evergreen Wells included in 2029 Scenarios; expansion of S04 included in 2029 Alternative 1 Scenarios; and expansion of S01 included in 2029 Alternative 2 Scenario.
Reservoir Levels. For the fire flow evaluations, reservoir levels were set to the bottom of the fire flow volume for 2029. The corresponding reservoir levels are summarized in Table 8.14. For the peak hour evaluations, reservoir levels were set to the bottom of their equalizing storage level, as summarized in Table 8.15.
Table 8.14 Reservoir Levels When Fire Flow Storage is Depleted
Reservoir
Elevation at Base of Fire Flow Volume (feet)
2009 2015 2019 2029
Westside 264 262 264 261
Judd Hill 293 289 292 286
Union Mills 321 317 319 315
Steilacoom 320 316 319 313
McAllister 382 382 382 382
Hawks Prairie 364 364 364 364
Nisqually 162 162 162 162
Notes:
1. Elevations assume operational, equalizing and fire flow storage components have been depleted.
CITY OF LACEY SYSTEM ANALYSIS
CAROLLO ENGINEERS 8-24 February 2013 pw://Carollo/Documents/Client/WA/Lacey/8142A01/Deliverables/Chapters/Ch08.docx
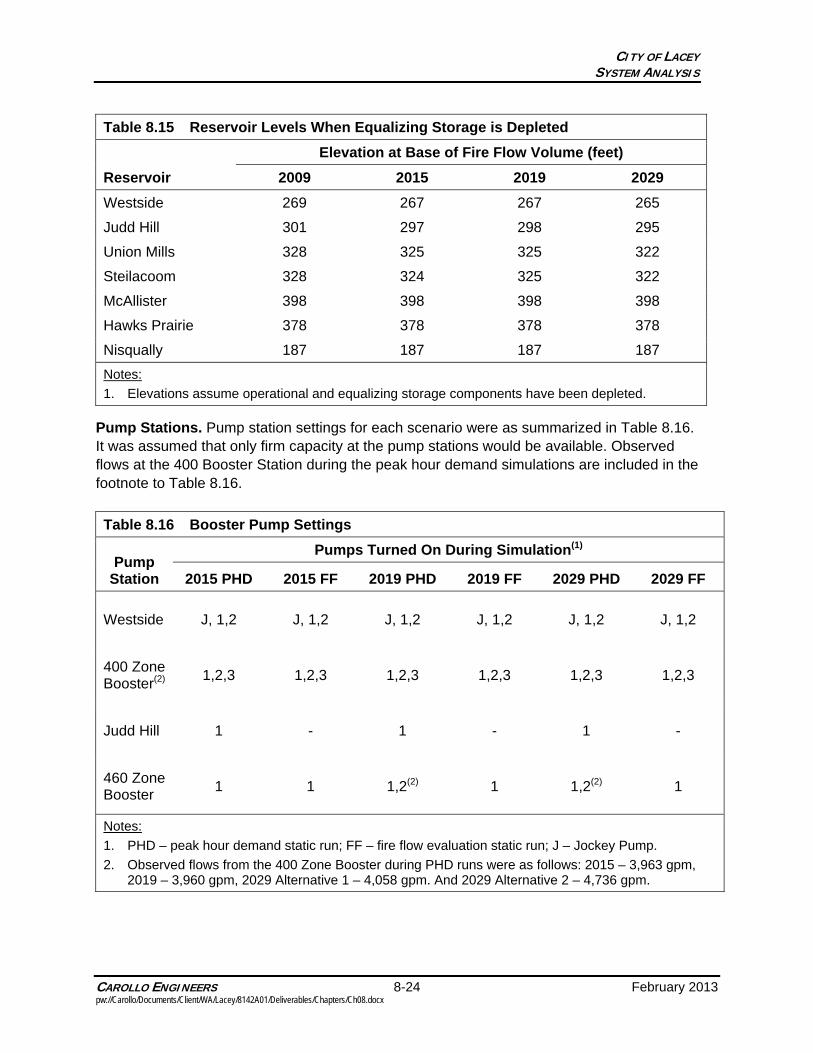
Table 8.15 Reservoir Levels When Equalizing Storage is Depleted
Reservoir
Elevation at Base of Fire Flow Volume (feet)
2009 2015 2019 2029
Westside 269 267 267 265
Judd Hill 301 297 298 295
Union Mills 328 325 325 322
Steilacoom 328 324 325 322
McAllister 398 398 398 398
Hawks Prairie 378 378 378 378
Nisqually 187 187 187 187
Notes:
1. Elevations assume operational and equalizing storage components have been depleted.
Pump Stations. Pump station settings for each scenario were as summarized in Table 8.16. It was assumed that only firm capacity at the pump stations would be available. Observed flows at the 400 Booster Station during the peak hour demand simulations are included in the footnote to Table 8.16.
Table 8.16 Booster Pump Settings
Pump Station
Pumps Turned On During Simulation(1)
2015 PHD 2015 FF 2019 PHD 2019 FF 2029 PHD 2029 FF
Westside J, 1,2 J, 1,2 J, 1,2 J, 1,2 J, 1,2 J, 1,2
400 Zone Booster(2)
1,2,3 1,2,3 1,2,3 1,2,3 1,2,3 1,2,3
Judd Hill 1 - 1 - 1 -
460 Zone Booster
1 1 1,2(2) 1 1,2(2) 1
Notes:
1. PHD – peak hour demand static run; FF – fire flow evaluation static run; J – Jockey Pump.
2. Observed flows from the 400 Zone Booster during PHD runs were as follows: 2015 – 3,963 gpm, 2019 – 3,960 gpm, 2029 Alternative 1 – 4,058 gpm. And 2029 Alternative 2 – 4,736 gpm.

CITY OF LACEY SYSTEM ANALYSIS
CAROLLO ENGINEERS 8-25 February 2013 pw://Carollo/Documents/Client/WA/Lacey/8142A01/Deliverables/Chapters/Ch08.docx
PRVs. All PRV and pressure-sustaining valve (PSV) settings in the updated model provided by the City were maintained. These settings are summarized in Table 8.17.
Table 8.17 PRV Station Settings1
PRV Station2 Small PRV Setting, psi
Large PRV Setting, psi
PSV Setting, psi
1 – Woodland Creek 45 40 N/A
2 – 50th Avenue 35 30 N/A
4 – Peregrine 48 43 73
5 – Marvin Rd 65 60 100
6 – Steilacoom N/A 51 71
7 – Britton Pkwy 52 47 75
8 – Nisqually 19 17 45
9 – Galaxy Dr 57 52 77
12 – Timber Lp 58 N/A N/A
15 – Mt. Aire 58 55 84
16 – Mugho N/A N/A 80
17 – Evergreen Heights 43 N/A N/A
18 – 48th Ave 60 55 N/A
Notes:
1. From the 2009_SUMMER Valve Data Set, provided by the City along with the hydraulic model. 2. PRV numbers are from the City’s 2009 Facilities Map.
Fire Flow Requirements. Fire flows were allocated based on a land use shapefile provided by the City. Fire flow was assigned by using a GIS routine to identify the parcel with the highest fire flow requirement within 300 feet of each fire flow node. In addition, specific fire flow requirements were assigned to the largest needed fire flow in each pressure zone. Table 8.18, below, presents a summary of the allocated fire flows. Fire flow requirements were set to zero along some small diameter pipelines known to have no connection to fire hydrants, including several dead-end lines. Fire flow requirements at each node are shown in Figure 8.3.

CITY OF LACEY SYSTEM ANALYSIS
CAROLLO ENGINEERS 8-26 February 2013 pw://Carollo/Documents/Client/WA/Lacey/8142A01/Deliverables/Chapters/Ch08.docx
Table 8.18 Fire Flow Allocation
Land Use Type Required Fire Flow (gpm)
Low-Density Residential1 750
Medium- and High-Density Residential2 1,500
Commercial 1,500
Industrial 1,500
Large Fire Flow3 1 624 Old Pacific Hwy SE
1,250
Large Fire Flow3 2 1401 Galaxy Drive NE
4,000
Large Fire Flow3 3 9225 Orion Drive NE
4,000
Large Fire Flow3 4 5610 Corporate Center Ln SE
4,000
Notes:
1. Low-Density Residential parcels are defined here as those with 1 or 2 dwelling units (as recorded in the City’s land use shapefile).
2. Medium- and High-Density Residential parcels are defined here as those with 3 or more dwelling units (as recorded in the City’s land use shapefile).
3. These Large Fire Flow rates and their locations were provided by the City.
8.6.4 Modeling Results
8.6.4.1 Short-term Scenario (2015)
Static Runs
Two static model runs were conducted for the short-term (2015) scenario. These consisted of a fire flow evaluation and a peak hour evaluation. The results for the two model runs are summarized in Figure 8.4. The model run identified a number of deficiencies, as labeled in Figure 8.4 and summarized in Table 8.19 with comments. Improvements to address these deficiencies are discussed in Section 8.6.5. Figure 8.4 also shows a number of dead-end lines that are deficient in meeting fire flow requirements under this scenario. These deficiencies are not listed in Table 8.19 and should be addressed through the Annual Water Line Improvement Program recommended in Section 8.7
.

lacey101
0-f8.3-814
2.ai
Figure 8.3FIRE FLOW REQUIREMENTS
Comprehensive Water System Plan UpdateCity of Lacey
275 ZONE
375 ZONE
400 ZONE
188 ZONE211 ZONE
460 ZONE
337 ZONE
422 ZONE
224 ZONE

lacey101
0-f8.4-814
2.ai
Figure 8.42015 STATIC RUN SYSTEM DEFICIENCIESComprehensive Water System Plan Update
City of Lacey
Area 9
Area 7
Area 8
Area 6
Area 5
Area 4
Area 1
Area 2
Area 3
275 ZONE
375 ZONE
400 ZONE
188 ZONE211 ZONE
460 ZONE
337 ZONE
422 ZONE
224 ZONE

CITY OF LACEY SYSTEM ANALYSIS
CAROLLO ENGINEERS 8-29 February 2013 pw://Carollo/Documents/Client/WA/Lacey/8142A01/Deliverables/Chapters/Ch08.docx
Table 8.19 2015 Pipeline Deficiencies
Area Zone Deficiency Description
Area 1 337 Velocity > 5 fps Line running south along College Street from 31st Street to 37th Street, and line running west from Well S01.
Area 2 337 AFF < 750 gpm Deficient nodes are along 2- to 4-inch lines
Area 3 400 Velocity > 5 fps Line along 19th Street from Marvin Road to Carnbee Court
Area 4 422 PHP < 30 psi 2-inch line booster by Skyridge PS (PS not included in model)
Area 5 337 AFF < 750 gpm Deficient nodes mainly dead-ends on 6-inch lines.
Area 6 337 PHP < 30 psi Single node on 12-inch line with localized high elevation
Area 7 375 AFF < 750 gpm Water travels from PRV18 on 6-inch line east along 48th, then north along Hilton, east along 50th, then north to 51st, where it splits into two 8-inch lines in this deficient area
Area 8 400 Velocity > 5 fps Line running east from the 400 Zone Booster Pump Station along Willamette Drive.
Area 9 337 AFF < 1,500 gpm Deficient node along 6-inch line
Notes:
1. Areas correspond to labels in Figure 8.4. AFF – available fire flow; PHP – peak hour pressure; Velocity refers to velocity under peak hour conditions.
Extended Period Simulation
The short-term scenario was also evaluated using a 72-hour EPS model run. Output from the EPS run include source flow rates, pump station flow rates, reservoir levels, PRV flows, and system pressures. All model outputs are dependent on the specific demand, supply, and operational settings assumed in the model; hence, problems seen in the actual system may not be observed under the specific conditions modeled in this scenario.
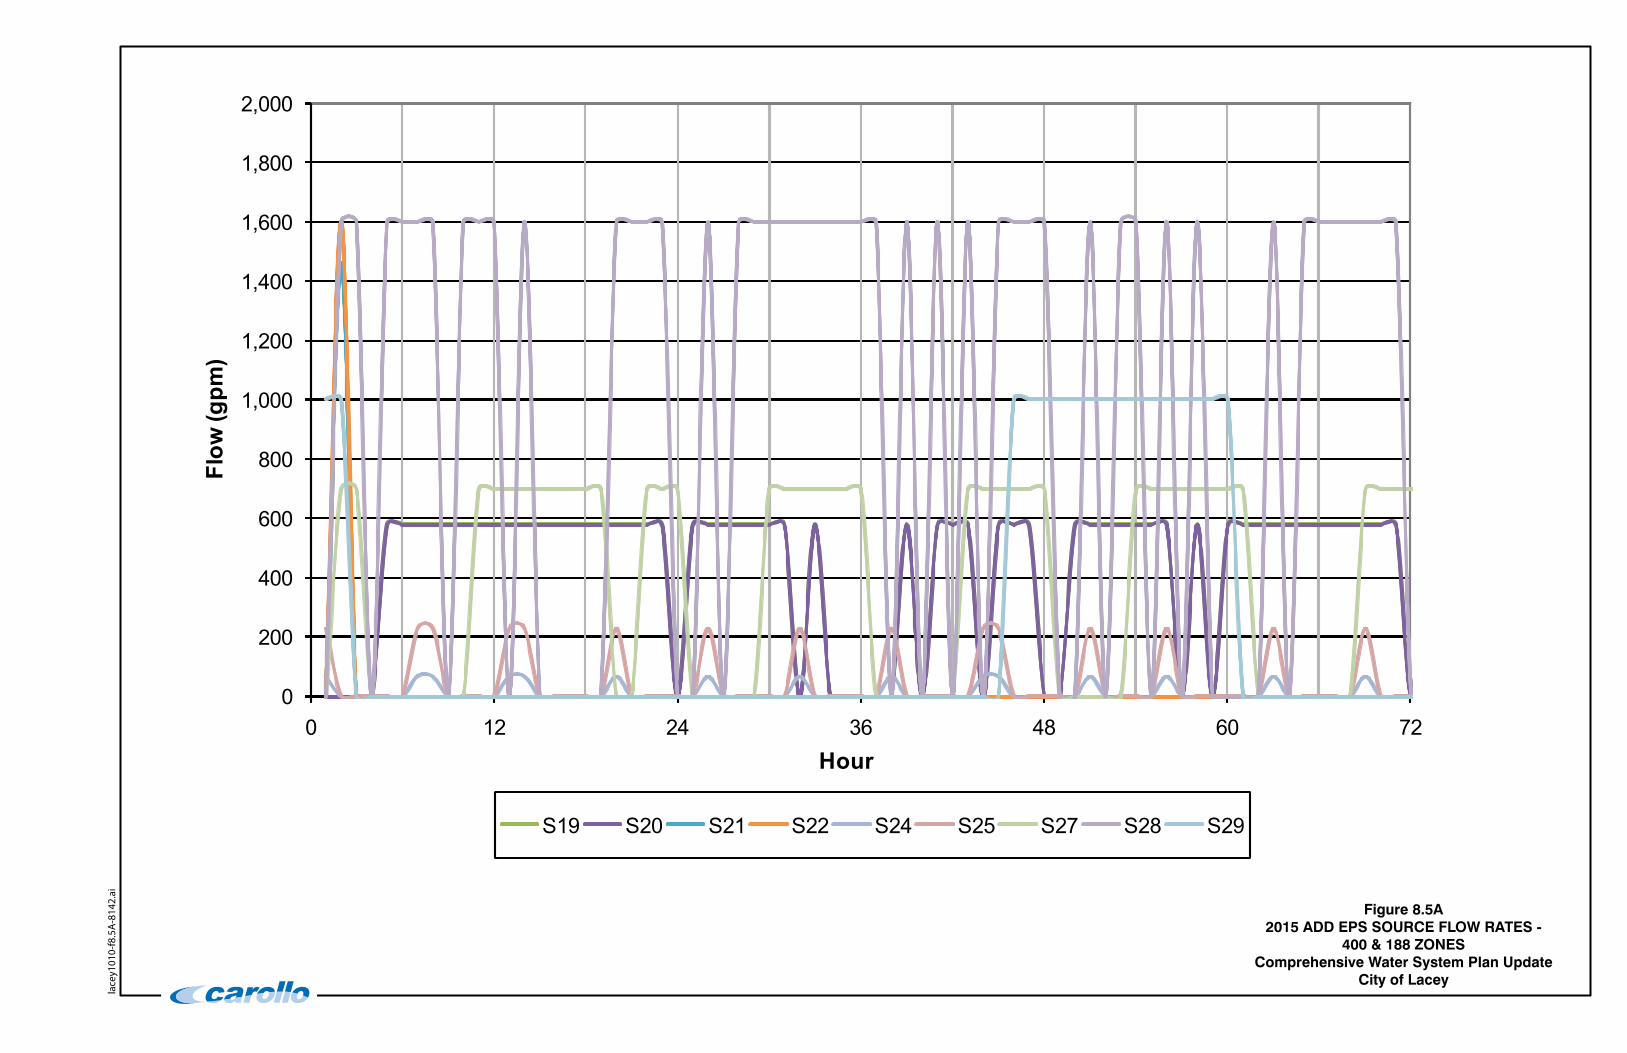
The flow rates observed in the EPS run for each of the sources are shown in Figures 8.5A and 8.5B. Flow rates for sources in the 400 and 188 Zones are shown in Figure 8.5A; flow rates for sources in the 337 Zone are shown in Figure 8.5B. S15 and S16 (the Beachcrest Wells) are located in the 375 Zone; no flows were observed from these wells during the EPS run, hence they are not shown in either figure. As shown in Figure 8.5A, S21 and S22 (Madrona Wells 1 and 2) were only active during Hour 2 of the simulation; as the model had not yet reached a steady state at that point, these wells would appropriately be considered to be inactive under the modeled conditions. Similarly, as shown in Figure 8.5B, S01 and S04 were only active during the initial few hours of the simulation and would also appropriately be considered to be inactive under the modeled conditions.
CITY OF LACEY SYSTEM ANALYSIS
CAROLLO ENGINEERS 8-30 February 2013 pw://Carollo/Documents/Client/WA/Lacey/8142A01/Deliverables/Chapters/Ch08.docx
The booster pump station flow rates observed in the EPS run are shown in Figure 8.6. Both the Westside and Judd Hill Booster Pump Stations are located within the 337 Zone and boost flows from their respective reservoirs. These pump stations operate intermittently on the same cycles (six intervals over the 72-hour simulation), though the Westside Booster Pump Station comes on earlier and stays on longer. The 460 Zone Booster Pump Station has two individual pumps. EPS results show that one pump is on at all times, with the second pump coming on for six intervals over the 72-hour simulation. The 400 Zone Booster Pump Station also turned on approximately six times through the simulation, though simulated operation was less stable, with the pumps sometimes turning on and off more than once within a given interval. Flows were highly variable, consistent with the use of variable frequency drives (VFDs) at this facility.
The reservoir levels observed in the EPS run are shown in Figure 8.7. Table 8.20 shows the approximate drawdown, approximate number of drawdown cycles over 72-hour simulation, and approximate turnover per drawdown cycle for each reservoir. The four reservoirs in the 337 Zone were found to all cycle on the same period. Turnover for these reservoirs was generally good, except for the Steilacoom Reservoir. Both Steilacoom and Union Mills Reservoirs “float” on the 337 Zone, setting the hydraulic gradeline (HGL) for the zone. However, the Union Mills Reservoir tends to have much greater drawdown than the Steilacoom Reservoir.
There are three remaining reservoirs outside the 337 Zone. The McAllister Reservoir sets the HGL for the 400 Zone and had poor turnover. Though the reservoir went through a large number of cycles, the drawdown in each cycle was very low, so overall turnover in the tank is likely poor. Turnover in the Hawks Prairie Reservoir was also somewhat poor; though the reservoir had a significant drawdown of around 8 percent; it cycled very infrequently due to the use of VFDs. Turnover in the Nisqually Reservoir was very good, with turnover of around 9 percent several times a day.
0
200
400
600
800
1,000
1,200
1,400
1,600
1,800
2,000
0 12 24 36 48 60 72
Flow
(gpm
)
Hour
S19 S20 S21 S22 S24 S25 S27 S28 S29
lacey101
0-f8.5A-814
2.ai
Figure 8.5A2015 ADD EPS SOURCE FLOW RATES -
400 & 188 ZONES Comprehensive Water System Plan Update
City of Lacey

0
200
400
600
800
1,000
1,200
1,400
1,600
1,800
2,000
0 12 24 36 48 60 72
Flow
(gpm
)
Hour
S01 S02 S03 S04 S06 S07 S09 S10
lacey101
0-f8.5B-81
42.ai
Figure 8.5B2015 ADD EPS SOURCE FLOW RATES -
337 ZONE Comprehensive Water System Plan Update
City of Lacey

0
200
400
600
800
1,000
1,200
1,400
1,600
1,800
0 12 24 36 48 60 72
Flow
(gpm
)
Hour
Hawks Prairie PS Westside PS Judd Hill PS McAllister PS
lacey101
0-f8.6-814
2.ai
Figure 8.62015 ADD EPS -
BOOSTER PUMP STATION FLOW RATESComprehensive Water System Plan Update
City of Lacey

0
20
40
60
80
100
120
0 12 24 36 48 60 72
Leve
l (ft)
Hour
Nisqually Reservoir McAllister Reservoir Steilacoom Reservoir Hawks Prairie Reservoir
Union Mills Reservoir Judd Hill Reservoir Westside Reservoir Hawks Prairie Clearwell
lacey101
0-f8.7-814
2.ai
Figure 8.72015 ADD EPS - RESERVOIR LEVELS
Comprehensive Water System Plan UpdateCity of Lacey

CITY OF LACEY SYSTEM ANALYSIS
CAROLLO ENGINEERS 8-35 February 2013 pw://Carollo/Documents/Client/WA/Lacey/8142A01/Deliverables/Chapters/Ch08.docx
Table 8.20 Reservoir Drawdown – 2015 ADD EPS
Reservoir Approximate Drawdown
Approximate Number of Drawdown Cycles(1)
Approximate Turnover Per Cycle
Steilacoom 3 ft 6 4%
Union Mills 5 to 9 ft 6 11%
Judd Hill 10 ft 6 13%
Westside 4.5 ft 6 11%
McAllister 2 to 3 ft 11(2) 2%
Nisqually 2.5 ft 11 9%
Hawks Prairie 5 to 8.5 ft 1 to 4(2) 8%
Notes:
1. Over the 72-hour EPS run.
2. Drawdown cycles are not clearly defined; number of cycles is very approximate.
PRV flows observed in the EPS run are shown in Figure 8.8. Flows for the Peregrine and Steilacoom PRVs are not shown as both PRVs were predicted to remain closed throughout the 72-hour simulation. Several of the PRVs are open all, or almost all, of the time, including the Mt Aire, 48th Avenue, 50th Avenue, Nisqually, Galaxy, and Woodland PRVs. Three of the PRVs were observed to be open periodically, including the McAllister, Britton, and Mugho PRVs. These results indicate there are numerous PRVs that either continuously or intermittently convey supply from the 400 Zone to the 337 Zone.
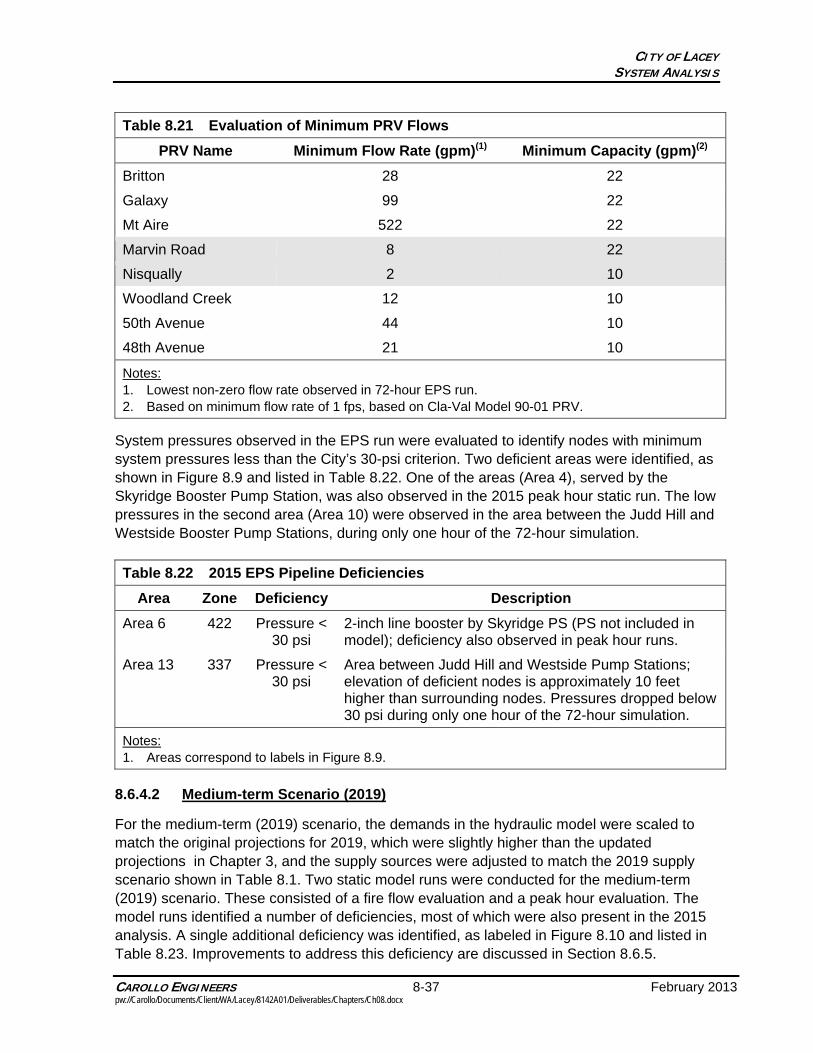
PRV stations were evaluated to determine whether the smaller PRVs in each station were oversized. Oversized PRVs can lead to difficulty in balancing flow from PRV stations operating in parallel; this is particularly relevant for the numerous PRV stations operating in parallel between the 400 and 337 Zones. For this evaluation, flows were assumed to be those observed in the EPS model. The assumed minimum (non-zero) flows are summarized in Table 8.21, along with the calculated minimum capacities for the relevant PRV stations. Minimum capacities were based on a minimum flow rate of 1 fps. Two of the PRV stations were found to have projected minimum flows less than the minimum capacity of the smallest PRV at their respective stations: the Nisqually PRV and the Marvin Road PRV. Flows through the Nisqually PRV are not of concern, as this PRV station does not operate in parallel with other PRV stations. Flows through the Marvin Road PRV station are also not considered to be a concern; average non-zero flows over the 72-hour simulation were 423 gpm (much greater than the minimum valve capacity) and flows less than the minimum capacity occurred during only two hours of the 72-hour simulation.

lacey101
0-f8.8-814
2.ai
Figure 8.82015 ADD EPS - PRV FLOWS
Comprehensive Water System Plan UpdateCity of Lacey
0
200
400
600
800
1,000
0 12 24 36 48 60 72
Flow
(gpm
)
Hour
Mt Aire PRV 50th Ave PRV Nisqually PRVGalaxy PRV Marvin PRV Britton PRVWoodland Creek PRV 48th Ave PRV Mugho PRV
CITY OF LACEY SYSTEM ANALYSIS
CAROLLO ENGINEERS 8-37 February 2013 pw://Carollo/Documents/Client/WA/Lacey/8142A01/Deliverables/Chapters/Ch08.docx
Table 8.21 Evaluation of Minimum PRV Flows
PRV Name Minimum Flow Rate (gpm)(1) Minimum Capacity (gpm)(2)
Britton 28 22
Galaxy 99 22
Mt Aire 522 22
Marvin Road 8 22
Nisqually 2 10
Woodland Creek 12 10
50th Avenue 44 10
48th Avenue 21 10
Notes: 1. Lowest non-zero flow rate observed in 72-hour EPS run. 2. Based on minimum flow rate of 1 fps, based on Cla-Val Model 90-01 PRV.
System pressures observed in the EPS run were evaluated to identify nodes with minimum system pressures less than the City’s 30-psi criterion. Two deficient areas were identified, as shown in Figure 8.9 and listed in Table 8.22. One of the areas (Area 4), served by the Skyridge Booster Pump Station, was also observed in the 2015 peak hour static run. The low pressures in the second area (Area 10) were observed in the area between the Judd Hill and Westside Booster Pump Stations, during only one hour of the 72-hour simulation.
Table 8.22 2015 EPS Pipeline Deficiencies
Area Zone Deficiency Description
Area 6 422 Pressure < 30 psi
2-inch line booster by Skyridge PS (PS not included in model); deficiency also observed in peak hour runs.
Area 13 337 Pressure < 30 psi
Area between Judd Hill and Westside Pump Stations; elevation of deficient nodes is approximately 10 feet higher than surrounding nodes. Pressures dropped below 30 psi during only one hour of the 72-hour simulation.
Notes: 1. Areas correspond to labels in Figure 8.9.
8.6.4.2 Medium-term Scenario (2019)
For the medium-term (2019) scenario, the demands in the hydraulic model were scaled to match the original projections for 2019, which were slightly higher than the updated projections in Chapter 3, and the supply sources were adjusted to match the 2019 supply scenario shown in Table 8.1. Two static model runs were conducted for the medium-term (2019) scenario. These consisted of a fire flow evaluation and a peak hour evaluation. The model runs identified a number of deficiencies, most of which were also present in the 2015 analysis. A single additional deficiency was identified, as labeled in Figure 8.10 and listed in Table 8.23. Improvements to address this deficiency are discussed in Section 8.6.5.

Figure 8.92015 ADD EPS SYSTEM DEFICIENCIES
Comprehensive Water System Plan UpdateCity of Lacey
Area 4
Area 10
lacey101
0-f8.9-814
2.ai
275 ZONE
375 ZONE
400 ZONE
188 ZONE211 ZONE
460 ZONE
337 ZONE
422 ZONE
224 ZONE

Figure 8.102019 STATIC RUN SYSTEM DEFICIENCIESComprehensive Water System Plan Update
City of Lacey
Area 11
lacey101
0-f8.10-81
42.ai
275 ZONE
375 ZONE
400 ZONE
188 ZONE211 ZONE
460 ZONE
337 ZONE
422 ZONE
224 ZONE
CITY OF LACEY SYSTEM ANALYSIS
CAROLLO ENGINEERS 8-40 February 2013 pw://Carollo/Documents/Client/WA/Lacey/8142A01/Deliverables/Chapters/Ch08.docx
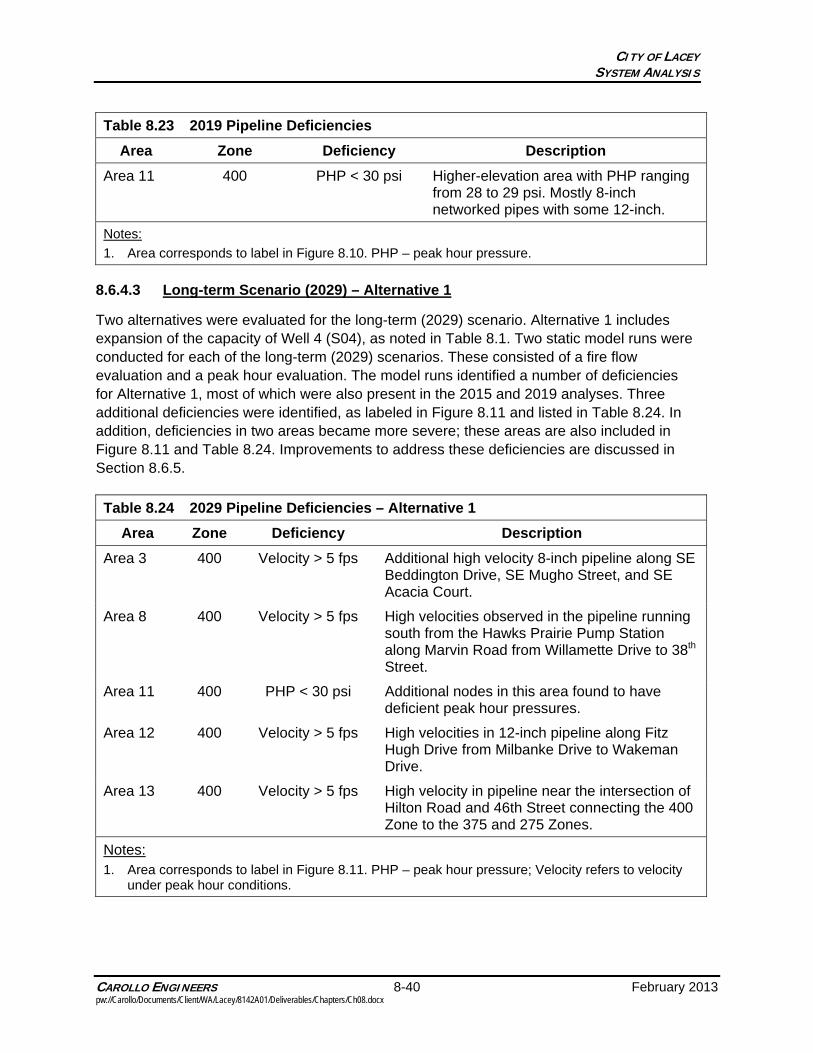
Table 8.23 2019 Pipeline Deficiencies
Area Zone Deficiency Description
Area 11 400 PHP < 30 psi Higher-elevation area with PHP ranging from 28 to 29 psi. Mostly 8-inch networked pipes with some 12-inch.
Notes:
1. Area corresponds to label in Figure 8.10. PHP – peak hour pressure.
8.6.4.3 Long-term Scenario (2029) – Alternative 1
Two alternatives were evaluated for the long-term (2029) scenario. Alternative 1 includes expansion of the capacity of Well 4 (S04), as noted in Table 8.1. Two static model runs were conducted for each of the long-term (2029) scenarios. These consisted of a fire flow evaluation and a peak hour evaluation. The model runs identified a number of deficiencies for Alternative 1, most of which were also present in the 2015 and 2019 analyses. Three additional deficiencies were identified, as labeled in Figure 8.11 and listed in Table 8.24. In addition, deficiencies in two areas became more severe; these areas are also included in Figure 8.11 and Table 8.24. Improvements to address these deficiencies are discussed in Section 8.6.5.
Table 8.24 2029 Pipeline Deficiencies – Alternative 1
Area Zone Deficiency Description
Area 3 400 Velocity > 5 fps Additional high velocity 8-inch pipeline along SE Beddington Drive, SE Mugho Street, and SE Acacia Court.
Area 8 400 Velocity > 5 fps High velocities observed in the pipeline running south from the Hawks Prairie Pump Station along Marvin Road from Willamette Drive to 38th Street.
Area 11 400 PHP < 30 psi Additional nodes in this area found to have deficient peak hour pressures.
Area 12 400 Velocity > 5 fps High velocities in 12-inch pipeline along Fitz Hugh Drive from Milbanke Drive to Wakeman Drive.
Area 13 400 Velocity > 5 fps High velocity in pipeline near the intersection of Hilton Road and 46th Street connecting the 400 Zone to the 375 and 275 Zones.
Notes: 1. Area corresponds to label in Figure 8.11. PHP – peak hour pressure; Velocity refers to velocity
under peak hour conditions.

Area 12
lacey101
0-f8.11-81
42.ai
Area 3
Area 11
Area 13Area 8
Figure 8.112029 STATIC RUN SYSTEM DEFICIENCIES
ALTERNATIVE 1 (WELL S04 IMPROVEMENTS)Comprehensive Water System Plan Update
City of Lacey
275 ZONE
375 ZONE
400 ZONE
188 ZONE211 ZONE
460 ZONE
337 ZONE
422 ZONE
224 ZONE

CITY OF LACEY SYSTEM ANALYSIS
CAROLLO ENGINEERS 8-42 February 2013 pw://Carollo/Documents/Client/WA/Lacey/8142A01/Deliverables/Chapters/Ch08.docx
8.6.4.4 Long-term Scenario (2029) – Alternative 2
Alternative 2 of the long-term scenario includes expansion of the capacity of Well 1 (S01), as noted in Table 8.1. Two static model runs were conducted for each of the long-term (2029) scenarios. These consisted of a fire flow evaluation and a peak hour evaluation. The model runs identified a number of deficiencies for Alternative 2, most of which were also present in the 2015 and 2019 analyses. Two additional deficiencies were identified (one of which was also identified in Alternative 1), as labeled in Figure 8.12 and listed in Table 8.25. In addition, deficiencies in three areas became more severe; increasing severity of deficiencies was observed in only one of these three areas in Alternative 1. These areas are also included in Figure 8.12 and Table 8.25. Improvements to address these deficiencies are discussed in Section 8.6.5.
Table 8.25 2029 Pipeline Deficiencies – Alternative 2
Area Zone Deficiency Description
Area 1 337 Velocity > 5 fps Additional high velocity pipeline extending northeast through the Komachin Middle School.
Area 2 337 AFF < 750 gpm Additional deficient nodes in this area, along 2- to 4-inch lines.
Area 3 400 Velocity > 5 fps Additional high velocity 8-inch pipeline along SE Beddington Drive, SE Mugho Street, and SE Acacia Court.
Area 12 337 Velocity > 5 fps High velocities in 12-inch pipeline along Fitz Hugh Drive from Queens Court to Milbanke Drive.
Area 14 337 PHP < 30 psi High elevation area with peak hour pressures ranging from 27 to 29 psi.
Notes:
1. Area corresponds to label in Figure 8.12. AFF – available fire flow; PHP – peak hour pressure; Velocity refers to velocity under peak hour conditions.
8.6.5 Evaluation of Improvements
Improvements to address the above-identified peak hour pressure and fire flow deficiencies were evaluated. Improvements to address pipelines with high peak velocities were addressed only for those pipelines exceeding the City’s criterion of 8 fps. The evaluations of potential improvements for each deficiency are summarized in Table 8.26. As noted above, the system analysis identified a number of dead-end lines that are deficient in meeting fire flow requirements. These deficiencies are not listed in Table 8.26 and are intended to be addressed through the Annual Water Line Improvement Program recommended in Section 8.7.

Area 12
lacey101
0-f8.12-81
42.ai
Area 3Area 1
Figure 8.122029 STATIC RUN SYSTEM DEFICIENCIES -
ALTERNATIVE 2 (WELL S01 IMPROVEMENTS) Comprehensive Water System Plan Update
City of Lacey
Area 14
Area 2
275 ZONE
375 ZONE
400 ZONE
188 ZONE211 ZONE
460 ZONE
337 ZONE
422 ZONE
224 ZONE
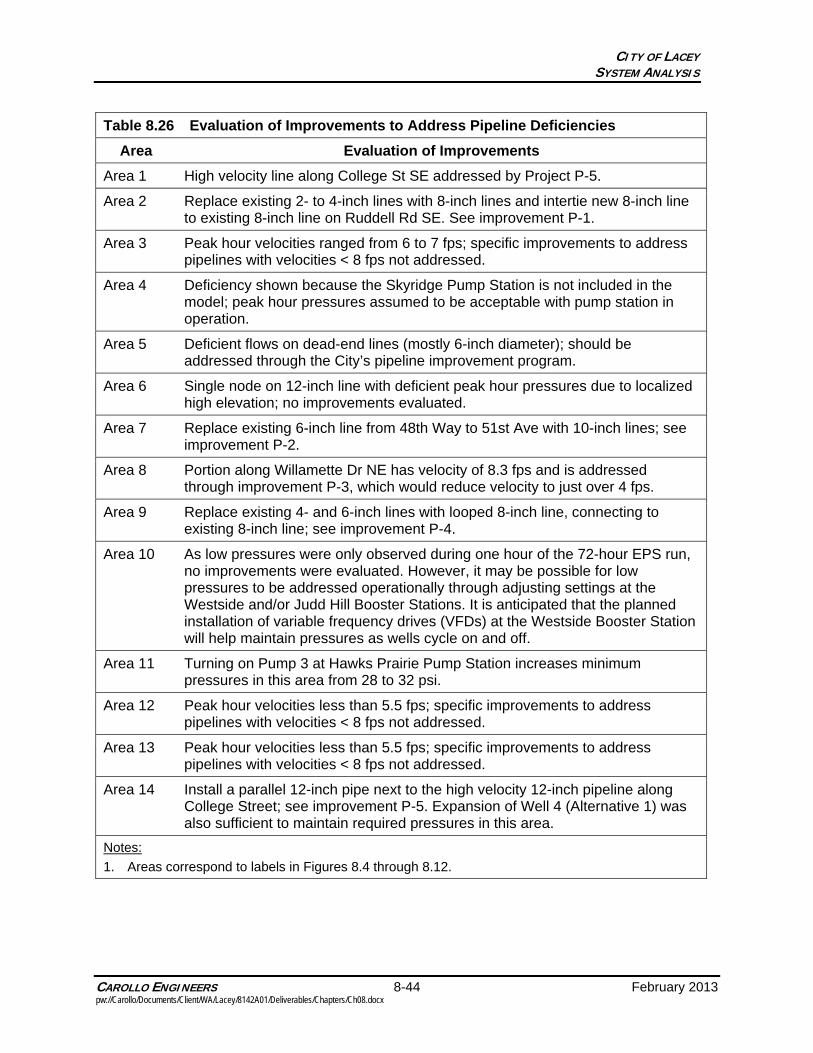
CITY OF LACEY SYSTEM ANALYSIS
CAROLLO ENGINEERS 8-44 February 2013 pw://Carollo/Documents/Client/WA/Lacey/8142A01/Deliverables/Chapters/Ch08.docx
Table 8.26 Evaluation of Improvements to Address Pipeline Deficiencies
Area Evaluation of Improvements
Area 1 High velocity line along College St SE addressed by Project P-5.
Area 2 Replace existing 2- to 4-inch lines with 8-inch lines and intertie new 8-inch line to existing 8-inch line on Ruddell Rd SE. See improvement P-1.
Area 3 Peak hour velocities ranged from 6 to 7 fps; specific improvements to address pipelines with velocities < 8 fps not addressed.
Area 4 Deficiency shown because the Skyridge Pump Station is not included in the model; peak hour pressures assumed to be acceptable with pump station in operation.
Area 5 Deficient flows on dead-end lines (mostly 6-inch diameter); should be addressed through the City’s pipeline improvement program.
Area 6 Single node on 12-inch line with deficient peak hour pressures due to localized high elevation; no improvements evaluated.
Area 7 Replace existing 6-inch line from 48th Way to 51st Ave with 10-inch lines; see improvement P-2.
Area 8 Portion along Willamette Dr NE has velocity of 8.3 fps and is addressed through improvement P-3, which would reduce velocity to just over 4 fps.
Area 9 Replace existing 4- and 6-inch lines with looped 8-inch line, connecting to existing 8-inch line; see improvement P-4.
Area 10 As low pressures were only observed during one hour of the 72-hour EPS run, no improvements were evaluated. However, it may be possible for low pressures to be addressed operationally through adjusting settings at the Westside and/or Judd Hill Booster Stations. It is anticipated that the planned installation of variable frequency drives (VFDs) at the Westside Booster Station will help maintain pressures as wells cycle on and off.
Area 11 Turning on Pump 3 at Hawks Prairie Pump Station increases minimum pressures in this area from 28 to 32 psi.
Area 12 Peak hour velocities less than 5.5 fps; specific improvements to address pipelines with velocities < 8 fps not addressed.
Area 13 Peak hour velocities less than 5.5 fps; specific improvements to address pipelines with velocities < 8 fps not addressed.
Area 14 Install a parallel 12-inch pipe next to the high velocity 12-inch pipeline along College Street; see improvement P-5. Expansion of Well 4 (Alternative 1) was also sufficient to maintain required pressures in this area.
Notes:
1. Areas correspond to labels in Figures 8.4 through 8.12.

CITY OF LACEY SYSTEM ANALYSIS
CAROLLO ENGINEERS 8-45 February 2013 pw://Carollo/Documents/Client/WA/Lacey/8142A01/Deliverables/Chapters/Ch08.docx
The resulting pipeline improvements are summarized in Table 8.27, including the length and diameter of each improvement. The locations of identified pipeline improvements are shown in Figure 8.13. The resulting deficiencies with the recommended improvements are shown for the 2029 (Alternative 2) Scenario in Figure 8.14. The purpose of Figure 8.14 is to illustrate that the recommended improvements were successful in mitigating the identified deficiencies. As specific improvements were not evaluated to address either high-velocity pipelines with velocities less than 8 fps, or deficient fire flows on dead-end lines, these deficiencies are shown to remain after implementation of the recommended improvements.
Table 8.27 Recommended Pipeline Improvements
Improve-ment
Length (ft)
Diameter (in)
Description
P-1 9,430 8 East from Sarazan St SE to Armour St SE south of Yelm Hwy;
Around the Armour Loop SE; South end of Armour St SE to where it ends at 65th Ave
SE; Along 65th Ave from Ruddel Rd SE extending west to
Cotton Dr SE; Connect to pipe in Ruddel Rd SE; North along Cotton Dr SE to Oakmont Pl SE; West along Oakmont Pl SE.
P-2 2,211 10 East along 48th Ave NE from Dolores Dr to Hilton Rd NE; continuing north along Hilton Rd NW to 50th Ave NE; 430 feet east along 50th Ave NE, then north to connect to 51st Ave NE.
P-3 410 16 Parallel line east along Willamette Dr. NE from where the Hawks Prairie facilities connect to the 16-inch line to Edgewater Rd NE.
P-4 2,865 8 East along 20th Avenue SE starting from Carpenter Road SE, looping to connect to existing 8-inch line.
P-5 1,288 12 Parallel line along College St SE from 32nd Ln SE to 37th Ave SE.
Notes:
1. Projects correspond to pipelines shown in Figure 8.13.

lacey101
0-f8.13-81
42.ai
P-5
Figure 8.13RECOMMENDED PIPELINE IMPROVEMENTS Comprehensive Water System Plan Update
City of Lacey
P-1
P-4
P- 2P- 3
275 ZONE
375 ZONE
400 ZONE
188 ZONE211 ZONE
460 ZONE
337 ZONE
422 ZONE
224 ZONE

lacey101
0-f8.14-81
42.ai Figure 8.14
2029 STATIC RUN SYSTEM DEFICIENCIESALTERNATIVE 2 (WELL S01 IMPROVEMENTS)
WITH IMPROVEMENTS Comprehensive Water System Plan Update
City of Lacey
275 ZONE
375 ZONE
400 ZONE
188 ZONE211 ZONE
460 ZONE
337 ZONE
422 ZONE
224 ZONE

CITY OF LACEY SYSTEM ANALYSIS
CAROLLO ENGINEERS 8-48 February 2013 pw://Carollo/Documents/Client/WA/Lacey/8142A01/Deliverables/Chapters/Ch08.docx
8.6.6 Challenges Identified by City
The City identified a number of challenges with the water system anticipated to be observed in the model. The previously-identified issues and modeling results are summarized in Table 8.28.
Table 8.28 City-Identified System Challenges
Area Description
The Westside Reservoir is currently underutilized. City staff want to decrease time required to refill reservoir and address low pressures in the vicinity of the reservoir when the booster pump is not on.
System pressures within the ADD EPS run all met the City’s criterion of 30 psi, with the exception of two areas: one in the Skyridge Booster Zone and the second in the area between the Judd Hill and Westside Reservoirs. As low pressures were only observed during one hour of the 72-hour simulation, specific improvements to address this deficiency were not evaluated. Slow Westside Reservoir fill times observed by the City were not observed in the model, and may be more associated with MDD conditions or other specific operating scenarios not evaluated here.
Certain combinations of wells cannot be operated simultaneously at full capacity (e.g., the three Madrona wells).
Well flows in the model concurred with the planned supply scenario for each year; restrictions on allowing wells to operate at stated reliable capacities were not observed. The third Madrona Well was assumed to be operating at a reliable capacity of 2.1 mgd, rather than the pump capacity of 2.3 mgd. As the model runs are being conducted under future demand scenarios, this problem may not appear due to greater demands in the vicinity of the wells.
Low system pressures exist in the southwest when Wells 4, 9, and 10 are not running.
Low system pressures were observed in this area under the 2029 Peak Hour Run (see Section 8.6.4.3). The EPS run did not result in pressures below the City’s 30 psi criterion in this specific area.
General operating storage is very small (except when all sources are on).
Reservoirs were observed to cycle frequently (6 to 12 times in the 72-hour EPS run), indicating operating storage is low or consumed rapidly based on pump station capacities and settings. A study to optimize the City’s distribution system operations has been included as a recommendation in Section 8.7.
Excessive pressures in vicinity of Well 4 (S04) may exist under Alternative 1 with expansion of this source.
Pressures in the vicinity of Well 4 were evaluated in a separate 2029 MDD model run. Pressures were in the normal operating range both with and without planned improvements.
Based on challenges noted above, City staff intend to conduct additional modeling and transient analysis to resolve: (1) simultaneous pumping of all three Madrona wells and (2)
CITY OF LACEY SYSTEM ANALYSIS
CAROLLO ENGINEERS 8-49 February 2013 pw://Carollo/Documents/Client/WA/Lacey/8142A01/Deliverables/Chapters/Ch08.docx
simultaneous pumping of S04, S09, and S10 during peak month demands. This additional modeling effort should include supply and demand scenarios that specifically mimic the conditions under which these challenges have been observed. The design and construction costs associated with required improvements that may be identified through these efforts are not yet known.
8.6.7 Annual Pipeline Replacement Program
The City prepares an annual program for replacing water system piping. The program identifies pipes, hydrants, and valves required for abandonment or replacement given their current condition and liability to the system. These pipes have been identified by City operations staff with knowledge of system condition.
It is recommended that the City continue to update this pipeline replacement program on an annual basis, updating its GIS data as the pipes are replaced. To ease development of this program, it is recommended that the City add and maintain pipe material, diameter, and year installed for each pipe in the system in the City’s GIS data. Creating maps of specific types of material and/or age will aid in identifying potential areas of leakage or breakage.
There is one project already included in the City’s pipeline replacement program that coincides with required improvements identified in the system analysis, as noted above in Table 8.27.
It is recommended that the City implement a new Annual Pipeline Improvement Program to address undersized pipelines, including dead-end pipelines with insufficient fire flows. This recommendation is included in Section 8.7 and in the CIP in Chapter 10.
8.7 SUMMARY OF RECOMMENDATIONS
Recommended improvements are summarized below, including reservoir, pump station, and pipeline improvements.
8.7.1 Reservoir Improvements
Install a new 3.2-MG Reservoir in the 337 Zone or equivalent storage project by 2015.
Union Mills Reservoir: Construct an overflow pond and construct a new altitude valve vault with associated electronic/communications equipment.
Judd Hill Reservoir: Construct an overflow pond.
Nisqually Reservoir: Construct an overflow pond.
8.7.2 Pump Station Improvements
New 3.2-mgd pump station along Olympia transmission main.
Judd Hill Booster Station: Purchase a spare pump and motor that could be quickly installed in the event of a failure.
Westside Booster Station: Install a VFD pump. Provide on-site or portable generator for emergency power, concurrent with Wells S01, S02, and S03.

CITY OF LACEY SYSTEM ANALYSIS
CAROLLO ENGINEERS 8-50 February 2013 pw://Carollo/Documents/Client/WA/Lacey/8142A01/Deliverables/Chapters/Ch08.docx
In-house transient analyses to resolve ongoing operational issues with the three Madrona wells and S04, S09 and S10; budgets for these analyses or resulting improvements have not been included in the CIP.
8.7.3 PRV Improvements
PRV improvement project to add electronic and telemetry controls to existing PRV stations to improve system operations.
Regular evaluation of PRV settings to confirm adequacy.
8.7.4 Pipeline Improvements
The pipeline improvements recommended for meeting the system deficiencies are as follows (details are provided above in Table 8.27):
P-1: 9,430 feet of 8-inch pipe in six segments along Sarazan St, Armour Loop SE, Armour St, Ruddel Rd, Cotton Dr, and Oakmont Pl.
P-2: 2,211 feet of 12-inch pipe along 48th Ave NE, Hilton Rd NE, and 50th Ave NE.
P-3: 410 feet of 16-inch pipe along Willamette Dr NE.
P-4: 1,037 feet of 12-inch pipe along 20th Ave SE.
P-5: 1,288 feet of 12-inch parallel line along College St.
Additional projects are as follows:
Implementation of a new Annual Pipeline Improvement Program to address undersized pipelines, reduce dead-ends, and improve transmission throughout the system.
Relocation of Carpenter Road Waterline Main as part of the Carpenter Road Widening Project.