Embed Size (px)
Citation preview

V-1
Chapter V. Behavioral Barriers
Fish can be guided by various stimuli in an effort to protect them from waterdiversion intakes and guide them through fish facilities. Some of these stimuli arenatural such as ambient light, flow velocity, depth, channel shapes andtemperature. Others, such as turbulence, bubbles, electrical charge, and sound arecaused by artificial means. In this chapter, some of the more successful methodswill be presented. Instream and return flow barriers to exclude upstreammigrating fish are covered in chapter VIII.
A. Louver Design
Louvers consist of an array of vertical slats that are placed on a diagonal across aflow field to cause turbulence and, thus, fish avoidance (figure 23). Most often,louvers are applied in canals (open channels); although, they can be applied indiversion pools and in rivers if consistent sweeping hydraulics to the bypass canbe maintained for all operating conditions. Louver systems are typically designedin a configuration similar to flat plate screens, with a linear louver line placementthat leads to a bypass entrances (figure 94). Advantages of louver systems overflat plate screens are the following:
< The reduced overall structure size and, thus, reduced costs,
< Reduced potential for debris fouling and maintenance (with mostdebris types) when provided with an upstream trashrack
Disadvantages of louvers over flat plate screens include the following:
< Reduced fish exclusion performance (exclusion performance variesdepending on fish species, size, life stage, and swimming strength)
< Increased debris fouling and maintenance (with certain debris typessuch as long stringy debris; e.g., Egria)
< Acceptance issues by the fishery resource agencies
“No human being, however great, or powerful, was ever so freeas a fish.”
John Ruskin 1819-1900, British Critic, Social Theorist

Fish Protection at Water Diversions
V-2
Parameters to consider when developing an effective louver barrier include louverslat spacing, velocities through the louver, the ratio of the channel velocityapproaching the louver, Vc, and velocities entering the bypass, Vb. Studies haveshown that, to achieve effective fish exclusion, the fish must efficiently movealong the louver and into the bypass. If fish holdup, for example because ofavoidance of the bypass, it is more likely that the fish will eventually pass throughthe louver line (Bates et al., 1960).
As with fish screen structures, a trashrack will usually be provided to protect thelouvers and fish bypass from large debris.
Spacing between louver slats is typically larger than the body width of many fishto be excluded. In such cases, louvers do not physically exclude fish from theintakes, but instead, create hydraulic conditions that cause fish avoidance and leadto fish guidance along the louver face. The flow passing the slat array generatesturbulence that fish tend to avoid. Louver systems rely on the fact that fish sensepressure fluctuations that guide them around obstacles. Fish tend to move withthe passing flow along this turbulence line, maintaining a distance from the louverface, and are guided to bypass entrances (figure 23).
Louvers are, therefore, behavioral devices. The success of these systems dependon fish response to the hydraulic conditions. Louver performance can vary frompoor to good in response to changes in hydraulic conditions and variations in fishbehavior depending on fish species and size. Exclusion effectiveness varies as afunction of flow conditions, fish species, fish life stage, and fish swimmingstrength.
Figure 94.—Louver and bypass entrance design – Tracy Fish Collection Facility.

Chapter V. Behavioral Barriers
V-3
As a result of field and laboratory evaluations and development of facilities by theBureau of Reclamation (Reclamation) and the State of California in the 1950s and1960s, louver systems became a viable alternative for fish exclusion at the time(Bates and Vinsonhaler, 1956; Lancaster and Rhone, 1955; Rhone and Bates,1960; Skinner, 1974). Louver systems were developed to exclude fish from thelarge Federal and State pumped diversions (Delta-Mendota Canal and CaliforniaAqueduct) positioned on the south side of the Sacramento and San Joaquin Delta. At this site, water is diverted from a water body that is highly productive andincludes a broad range of fish species, fish life stages, and substantial aquaticplant growths that produce large and diverse debris loads. The louver systemswere developed for these sites because of fish and debris handling difficultiesencountered with screen systems and because of the lower cost. Extensive studieswere conducted considering hydraulics, configuration alternatives, and fishresponses.
Application of louver systems expanded from the south Delta work to a scatteringof irrigation and power diversions ranging in flow capacity from 100 cubic feetper second (ft3/s) to 12,000 ft3/s (Electric Power Research Institute [EPRI], 1986;EPRI, 1994). Currently, application of louvers is accepted and encouraged byfishery resource agencies at hydropower sites in the Northeastern United Statesand the Maritime Provinces of Canada. However, because of the documentedinconsistencies in fish exclusion performance, and because 100 percent exclusionefficiencies are generally not achievable, State and Federal fishery resourceagencies on the west coast of the United States discourage louver application. Louvers do offer a viable exclusion option at sites where 100 percent exclusionefficiencies are not necessary and where site-specific debris characteristics areappropriate (Office of Technology Assessment, 1995).
The fish exclusion effectiveness of louver systems is a function of the fishery, thestructural features of the louver, water quality, debris loading, and flow conditionspassing across and through the louver. Evaluations of the influences of variousparameters on fish exclusion effectiveness have largely been conducted on a site-specific basis. Consequently, in studies conducted to date, the evaluations reflectthe site-specific species, life stages, sizes, and conditions. The louverstructures evaluated are often existing structures where configuration parametersare fixed and not varied with the evaluation. Water quality and debris loadingare, likewise, usually dictated by site characteristics and not varied and often flowand hydraulic conditions are not varied but dictated by site operations. As aresult, individual studies that generate a comprehensive design-guide databasethat is broadly applicable, do not exist. The combined findings from these studiesdo, however, give insight into parameter influences on louver performance. Asummary of fish exclusion performance as obtained from a broad range of studiesis presented in table 6. Exclusion efficiencies are the percentage of fish exposedto the water diversion that are excluded by the louvers. Therefore, the higherthe percentage the more effective the fish barrier.

Fish Protection at Water Diversions
V-4
Table 6.—Summary of existing louver evaluations
Species Size/life stage Site
Exclusionefficiency
(%) Site features
Golden shiner 79 mm averagefork length
AldenLaboratory 1
29 34 22
* Louver line at 45 degrees to flow* 50 mm clear slat spacing* slats oriented normal to louver line* 1.0, 2.0, and 2.5 ft/s corresponding
channel velocities* 6-inch-wide bypass* Approx. 1.2 bypass ratio
Smallmouth bass 72 mm averagefork length
AldenLaboratory 1
43 47 13
Same as above
Lake sturgeon 153 mm averagefork length
AldenLaboratory 1
28 0 2
Same as above
American eel 558 mm length AldenLaboratory 1
346145
Same as above
Striped bass 20 mm length40 mm length60 mm length
Tracy FishCollectionFacility 2
608590
* Louver line set at 15 degrees to theflow
* 25 mm clear slat spacing* Slats oriented normal to approach
channel* 3.0 to 5.0 ft/s channel velocity* 6-inch wide bypass * 1.4 bypass ratio
Striped bass 21 mm averagelength
TracyResearchFacility 3
93 * Louver line set at 16 degrees to theflow
* 50 mm clear slat spacing* Slats oriented normal to approach
channel* 2.2 to 3.3 ft/s channel velocity* 4-inch wide bypass* Bypass ratio not defined
Striped bass 20 mm30 mm40 mm60 mm90 mm
Skinner FishFacility 4
5070727682
* “V” configured louver without centerwall
* Louver faces set at 15 degrees tothe flow
* 25 mm clear slat spacing* Slats oriented normal to approach
channel* 1.5 to 3.5 ft/s channel velocities* 12.0-inch wide bypass* 1.2 to 1.6 bypass ratios
Striped bass 20 mm30 mm40 mm60 mm90 mm
Skinner FishFacility 4
7882848590
Same as above but with:
* “V” configured louver with center wall

Chapter V. Behavioral Barriers
Table 6.—Summary of existing louver evaluations
Species Size/life stage Site
Exclusionefficiency
(%) Site features
V-5
Chinook salmon 35 mm fork length40 mm fork length50 mm fork length60 mm fork length
TehamaColusa Canalheadworks 5
35759798
* Louver lines set at 15 degrees to thecanal centerline
* “V” configured louvers with centerwall
* A section width expansion wasincluded immediately upstream fromthe louvers that generated less thanoptimum flow alignment anddistribution approaching the louverlines
* 25 mm clear slat spacing* Slats oriented normal to approach
channel* Evaluated operating conditions could
not be located (probable channelvelocities 3 to 5 ft/s)
Chinook salmon 85 to 150 mm(fall)140 to 295 mm(spring)
T.W. SullivanHydroelectricPlant 6
9490
* Forebay louver system in front ofhydro intakes
* Portions of louver line set at 17degrees to and portions set parallelto approach channel
* 25 and 38 mm clear slat spacing* Slats oriented normal to louver line* Channel velocities are variable
depending on forebay elevation andposition on louver line
* The bypass is a terminal turbineintake
Steelhead 159 to 290 mm T.W. SullivanHydroelectricPlant 6
82 Same as above
Chinook salmon 71 mm averagelengthsmolt
Tracyresearchfacility 3
94 (90 mm)97 (25 mm)
* Louver line set at 16 degrees to flow* 90 and 25 mm clear slat spacing* Slats oriented normal to approach
channel* 1.9 to 2.5 ft/s (90 mm) and 2.4 to
4.5 ft/s (25 mm) channel velocity* 6.0-inch- and 4.0-inch-wide bypass* Bypass ratio not defined

Fish Protection at Water Diversions
Table 6.—Summary of existing louver evaluations
Species Size/life stage Site
Exclusionefficiency
(%) Site features
V-6
Atlantic salmon Out-migratingsmolt(length notdefined)
HolyokeCanal 7
92 (3-inchspacing)80 (12-inchspacing)
* Power canal* Floating, partial depth louver line
(extended to a depth of 8 ft)* Louver line set at 15 degrees to the
flow* 3-inch and 12-inch clear slat spacing* Slats oriented normal to approach
channel* Approaching channel velocities were
variable with discharge and position(approx. 1.0 to 3.0 ft/s max.)
* Large diameter bypasses rangingfrom 6 to 15 ft
American shad andblueback herring
Out-migratingjuveniles(length notdefined)
HolyokeCanal 7
28indicationswere thatmany fishpassedunder thelouver
83 maxvelocity
60 halfvelocity
Same as above
Full-depth louver with 2.375-inch slatspacing
White catfish 20 mm30 mm40 mm60 mm90 mm
Skinner FishFacility 4
717253060
* “V” configured louver without centerwall
* Louver faces set at 15 degrees tothe flow
* 25 mm clear slat spacing* Slats oriented normal to approach
channel* 1.5 to 3.5 ft/s channel velocities* 12.0-inch-wide bypass* 1.2 to 1.6 bypass ratios
White catfish 20 mm30 mm40 mm60 mm90 mm
Skinner FishFacility 4
1330445877
Same as above but with “V”configured louver with center wall
1 Alden Research Laboratory, 2000.2 Heubach and Skinner, 1978.3 Bates and Vinsonhaler, 1956.4 Skinner, 1974.5 Vogal et al., 1990.6 Cramer, 1997.7 Stira and Robinson, 1997.

Chapter V. Behavioral Barriers
V-7
Effectiveness of fish exclusion – Fish exclusion effectiveness varies with fishbehavior and responses to the louver, swimming strength, and fish size. As aresult, exclusion effectiveness tends to vary as a function of fish species, fish lifestage, fish size, and fish condition. Louvers tend to be most effective in excludinglarger, more aggressive, stronger swimming fish and are poorer performers withsmaller, weaker swimming, more passive fish. Again, the influence of velocity,water quality (as it influences fish condition), and louver system configurationmust be considered with each evaluation. Effective fish exclusion is not ensuredwith louvers. Care must be taken in the design process, and the characteristics ofthe fishery and the refined details of the design must be considered.
With respect to fish species, results shown in table 6 indicate that species such asgolden shiner, lake sturgeon, American shad, blueback herring, and white catfishdisplay reduced exclusion efficiencies when comparable louver configurationsand operations are considered. Conversely, species including smallmouth bass,American eel (larger size), striped bass, Chinook salmon, steelhead, and Atlanticsalmon display good exclusion efficiencies for similar conditions.
Note also that behavioral characteristics including preferred habitat and fishdistribution can affect performance, as is displayed in the Holyoke Canal studieswhere Atlantic salmon positioned high in the water column were effectivelyexcluded by the surface based floating louver line while American shad andblueback herring tended to pass under the louver and were not excluded. Also ofnote from the Skinner Fish Facility studies, the addition of a center wall in the“V” configured louver system attracted and guided fish more effectively to thebypass, thus improving fish exclusion efficiencies.
Bypass system – Bypass systems for louvers are similar to, and should bedesigned in full compliance with, fish screen bypass criteria as summarized inchapter IV.A.9 of this document. In that louvers are behavioral devices, it iscritical that fish efficiently enter the bypass and do not delay or hold. Louvereffectiveness depends, in part, on maintaining good sweeping flow across thelouver face. If fish hold position, for example in response to avoidance of abypass entrance, passage through the louver becomes an option in lieu of enteringthe bypass entrance. Again, the louver is not an absolute barrier for the smallerfish in the system.
Studies conducted at the Tracy and Skinner Facilities (Bates et al., 1960; Skinner,1974) have shown the bypass velocity ratio (the ratio of bypass velocity, Vb, tochannel velocity, Vc, upstream from the louver system, or Vb/Vc) is a parameterthat should be considered. Bates et al. (1960) recommend that the Tracy Facilitybe operated with a bypass ratio of 1.4. Later studies at the Skinner Facility,however, were contradictory to the 1.4 ratio. Skinner (1974) concludes:

Fish Protection at Water Diversions
V-8
Authorities generally agree that bypass design is critical for fishscreens. This appears to be particularly true for louvers. Conventionallouver design usually results in an incremental increase in approachwater velocity (channel velocity) which distorts the relationshipbetween bypass ratio and the approach velocity (channel velocity). Atthis point I am convinced that approach velocity (channel velocity),bypass design, and bypass acceleration ratio are so interrelated that thetrue effects of bypass ratio and approach velocity (channel velocity)are confounded.
Care should be taken in bypass design. Operation with bypass velocity ratiosranging from 1.1 to 1.5 appears to be appropriate.
Channel Velocity – Channel velocity, coupled with the angle of louver lineplacement across the flow, yields louver approach and through-louver velocitymagnitudes that influence turbulence level, fish guidance, and fish entrainmentcharacteristics for the louver surface (similar to screens, see chapter IV.A.5). Higher design velocities approaching the louver (with a specific louverconfiguration) will permit smaller louver structures. Higher approach velocitiesmay, however, yield an increased potential to entrain or pass fish through thelouver, thus yielding reduced exclusion efficiencies. Conversely, low velocitiesmay not supply sufficient fish guidance along the louver, which may also yieldreduced exclusion efficiencies. The influence of velocity depends, in part, on thefishery and swimming strength.
As presented in table 6, the Alden Laboratory studies demonstrate that for goldenshiner, smallmouth bass, and American eel, best exclusion is obtained with achannel velocity of 2.0 ft/s; reduced exclusion is experienced with higher andlower velocities. In the same study, however, Lake sturgeon showed bestexclusion with the low-end velocities. Also shown in table 6, the Holyoke Canalstudies with a full depth louver showed best American shad and blueback herringexclusion with maximum local velocities of up to 2.5 ft/s (velocities of 0.8 ft/soccurred over portions of the louver). Reduced exclusion resulted whenmaximum velocities were reduced to 1.8 ft/s (with velocities of 0.6 ft/s overportions of the louver).
Skinner’s (1974) studies show findings implying that reduced velocitiesapproaching the louver are more effective with smaller, weaker swimming fish. In his cited evaluation that presents exclusion efficiency for juvenile striped bass,Skinner shows that for fish shorter than approximately 30 mm, better exclusion isobtained with a louver operated with a channel velocity of 1.0 ft/s. The resultsimply that for striped bass longer than approximately 35 mm, best exclusion isobtained with channel velocities of 2.75 ft/s. Again from table 6, comparison ofthe Tracy and Skinner findings for longer (greater than 40 mm) striped bassindicates that better exclusion is obtained with channel velocities of 3.0 to 5.0 ft/s.

Chapter V. Behavioral Barriers
V-9
No clear-cut criterion can be established from table 6. However, indications arethat if the design is focused on small and weak swimming fish, a design channelvelocity of 1.0 to 2.0 ft/s may be appropriate. Likewise, if the design is focusedon larger and strong swimming fish, design channel velocities of 2.75 to 4.5 ft/swould be appropriate.
Support structure including louver panel seats, seals, and supports – Louversare typically supported by a steel frame placed on a concrete foundation(figure 120). Louver panels are usually set in an end to end arrangement (like flatplate screen panels). The louver panels are typically supported by guidespositioned behind the louvers, that allow panel removal while maintaining anuninterrupted louver face (figures 97 and 98). Openings between the louver barsare large and the louver does not supply an absolute barrier to fish passage;therefore, seals are not required between louver panels or between the louverpanels and the support structure or bypass. Likewise, panel seats do not have tobe exactly true. Offsets or changes in alignment along the louver face will modifythe fish guidance and entrainment characteristics of the louver for small fish(striped bass under 20 mm long) (Skinner, 1974). Skinner notes that for fishlonger than 30 mm, “louver alignment and gaps are probably not critical withinthe range of misalignment tested.”
Partial depth, floating louver lines have been successfully applied (Stira andRobinson, 1997) at a site with a deep flow section (20 ft deep) and with fish thatconcentrate near the surface. The floating array minimizes required structure,although access for maintenance and cleaning is not convenient.
Head losses – Head losses across louvers are a function of the louverconfiguration, the flow rate/velocity, and debris fouling. Louvers are designed tooperate with channel velocities that are 2 to 3 times greater than allowed for fixedbarrier screens. Therefore, head losses across clean louvers can be up to 10 timesgreater than losses across clean screens because of the higher channel velocities. Louver bars and the line configuration to the flow generate fish-avoidanceturbulence, but also generate flow concentrations that lead to increased head loss. Lancaster and Rhone (1955) note that with louver lines placed at 30 degrees andflatter to the flow, head loss characteristics are independent of louver line anglebut depend on slat configuration and orientation of the slats to the flow. Turningvanes were used to reduce total louver line losses by 30 to 40 percent. Findingsfrom the Tracy studies (Lancaster and Rhone, 1955; Rhone and Bates, 1960)indicate that, for louver lines placed at 30 degrees or flatter to the flow, with slatsoriented at 70 to 90 degrees to the flow, and with turning vanes, head losses willequal 2 to 4 times the channel velocity head. Thus, for a channel velocity of3 ft/s, the loss across a clean louver would range from 0.28 to 0.56 ft, varyingwith specifics of the design.

Fish Protection at Water Diversions
V-10
Head losses of 0.3 to 0.5 ft are commonly observed across clean louvers withuniform channel velocity distributions (using turning vanes or optimized channelconfigurations, as discussed below under “flow distribution control”). Forlouvers with non-uniform channel velocity distributions (usually channelvelocities are small at the lead end of the louver line and large at the tail end),head losses of 1 ft or greater have been observed at the tail end of the louver line,with clean louvers. Debris fouling will further increase losses. Since automatedcleaners are typically not included with louver facilities, conservative headdifferentials should be applied in the design.
Debris cleaning – Debris fouling and cleaning issues associated with louvers arestrongly influenced by debris type. Louvers, by their nature, are composed oflarge vertical slat elements with intermittent cross-ties or bracing. Louvers,likewise, include fairly large openings that pass smaller debris and sediment. Larger debris, however, will tend to either intertwine in the slat structure (for longfiber debris such as many aquatic plants) or embed between slats (for woodytwigs or the like). Large debris fouling has been a major problem at Reclamationsites, including the Tracy Fish Collection Facility, California (fouling withaquatic plants) (figure 95) and the T and Y Canal, Montana (fouling with woodymaterials). At both of these sites, cleaning is difficult. At the Tracy facility,louvers are physically lifted from the structure and spray cleaned once or twice aday during high debris time periods (figure 96). At the T and Y Canal, woodydebris has to be manually removed from the louver.
Because louvers have a large percentage of open area and tend to pass smallerdebris, they become severely plugged at a slower rate than screens. Louvers tendto continue to pass flow with significant debris accumulation while fine screensmay become plugged. As a result, louvers usually require less frequent cleaningthan fine screens.
Even though debris fouling may not result in immediate or significant flowblockage, it modifies the fish exclusion characteristics of the device. Experiencewith the Tracy Fish Collection Facility secondary dewatering facility indicatesthat debris fouling will lead to significant reductions in fish exclusion capability. As a result, even though flow rates are sustained, more frequent cleaning might beappropriate to sustain best levels of fish exclusion.
Prevalent debris type and probable cleaning requirements should be carefullyconsidered if a louver facility is pursued.

Chapter V. Behavioral Barriers
V-11
Figure 95.—Fouling of Tracy Fish Collection louvers by Egria.
Figure 96.—Spray bar used to clean louvers at Tracy Fish CollectionLouvers (downstream spray bar not operating).

Fish Protection at Water Diversions
V-12
Cold weather operation – Little experience is available with the operation oflouver systems in cold weather. It appears, however, that louvers should be lesssensitive to icing and ice blockage than fish screens because of the larger slatopening sizes. It is likely that, with heavy ice production and frazil icedevelopment, ice fouling would occur and would require shutdown of thediversion or louver panel removal.
Sedimentation – Louvers have relatively good characteristics with respect tosediment passage. Openings in the louvers are large (typically 1 inch or greater). Concentrated velocity zones are generated between each louver slat, whichgenerates aggressive local sluicing. Louvers have been successfully operated atsites that include significant sediment passage including at Reclamation’s TracyFish Collection Facility and Reclamation’s Tehama Colusa Canal headworks. (The louvers have since been removed at Tehama Colusa and replaced with drumscreens.)
Design guidelines – A scattering of studies have been conducted that evaluate theinfluence of slat depth, slat thickness, slat spacing, slat orientation, angle oflouver line placement to the flow, and flow velocities and velocity distributioncontrol on both the hydraulic and fish handling performance of the louver system. As with the fish exclusion studies summarized in table 6, a limitation of most ofthese studies is that they tend to focus on site-specific applications consideringspecific fish species and site configurations. Broader, generic studies have notbeen conducted. The combined findings do supply some insight and designguidance.
Slat dimensions – Louver slat thickness and depth (figures 97 and 98) aretypically based on structural and rigidity considerations. Within the structurallyacceptable limits, indications are that louver slat dimensions have little effect onfish guidance and hydraulic performance. In the Tracy Facility developmentalstudies (Bates and Vinsonhaler, 1956), 2.5-inch-deep steel slats were evaluatedwith slat thickness ranging from 0.125 to 0.5 inch and with clear spacings of 1.0to 3.5 inches. A 0.1875-inch slat thickness was selected for the permanent facilitydesign. Schuler and Larson (1975) evaluated steel louvers with 2.0-inch slatdepths and 0.125-inch slat thicknesses, considering alternatives in slat and louverline orientation that showed that coastal salt water fishes could be effectivelyguided by louver systems. The Alden Laboratory (2000) studies evaluated plasticslats that were 4 inches deep and 0.5 inch thick. The plastic slats were appliedonly in a laboratory setting. The Holyoke Canal evaluation used 2.5-inch-deep by0.375-inch-thick polypropylene floating slats with 2, 3, and 12-inch clearspacings. Louvers were evaluated extending 4 and 8 ft down from the watersurface. The floating configuration minimizes differential loading on the slats. The final selected design used a 2.0-inch clear spacing between slats.

Chapter V. Behavioral Barriers
V-13
a. Louver in louver guides.
Figure 98.—Tracy louver panel.
b. Looking at downstream side of removed louver.
Figure 97.—Detailed louver layout.

Fish Protection at Water Diversions
V-14
Clearly, slat material and strength characteristics, structure size and configuration,and potential hydraulic and debris loading should be considered in sizingmembers. Typically, however, it appears that, for steel slats with a 1- to 3-inchclear spacing, precedence indicates a 2.5-inch slat depth with approximately a 0.2-inch material width is appropriate.
Slat spacing – Evaluated and applied slat spacings to (figures 94 and 97) rangefrom 1.0 to 12.0 inches. Appropriate spacings appear, in part, to depend on thesize of the fish to be excluded. Study findings (Bates and Vinsonhaler, 1956;Stira and Robinson, 1997) indicate that clear slat spacings of 1.0 to 3.0 inchessupply comparable fish exclusion performance in many cases. However,permanent installations typically use a conservative free spacings of 1.0 to2.0 inches.
Slat orientation – Slat orientations ranging from parallel to the channel flow tonormal to the channel flow have been evaluated. Head loss is reduced withreduced angles of attack (angle of placement with the flow); however, fishexclusion and guidance characteristics are also reduced as slat orientationapproaches parallel alignment with the flow. Bates and Vinsonhaler (1956)evaluated slats placed at 90 (normal to), 70, and 0 (parallel to) degrees to theflow. They note that the parallel slat orientation did not divert fish but that the70 and 90 degree orientations were effective. Schuler and Larson (1975)evaluated slats oriented at 90, 70, 60, and 52 degrees to the flow. These slatorientations correspond to slat placement either normal to the approach channelor normal to the louver line with louver lines placed at 20, 30, and 38 degreesacross the channel. They observe that best fish guidance characteristics wereobtained with the louver line placed at a 20 degree angle to the channel and withthe louver slats oriented normal to the louver line (oriented at 70 degrees toapproach channel and channel flow).
Permanent installations have generally been developed either with slats placednormal to channel flow or with slats placed normal to the louver line. The louverlines are most commonly oriented at angles ranging from 0 parallel to) to17 degrees to the approach channel and channel flow. This places the slats atangles ranging from 90 degrees to 73 degrees to the approach flow. Figure 98aillustrates the Tracy Louvers as they are installed at the Tracy Pumping Plant. The slats are placed normal to the channel flow. The louver is shown in a raisedposition for cleaning in figure 98b. The turning vanes are easily seen on thebackside of the lower frame.
Angle of louver line placement – Louvers are placed at an angle across the flowto generate a sweeping flow that provides fish guidance across the louver face andto the bypass entrances (figure 23). The objectives are similar to guidanceobjectives pursued with an angled screen placement (chapter IV.A.5). Generatingeffective fish guidance and maintaining fish passage across the louver face is

Chapter V. Behavioral Barriers
V-15
likely more critical for achieving effective fish exclusion performance withlouvers than with screens in that louvers depend on fish avoidance. Indicationsare that if fish hold position in front of the louver, the louvers tend to loseeffectiveness (field observations indicate that in zones where fish do not sweepacross the louver face there is an increased tendency for the fish to pass throughthe louver).
Louvers have been evaluated placed at angles ranging from parallel to the flow to45 degrees to the flow. Typically, and particularly for permanent facilities,louvers are placed at flat angles to the flow. The Alden Research Laboratory(2000) evaluations indicate that steeper angles of placement produce substantiallyreduced fish exclusion. Note, in table 6, that except for the large American eelsevaluated (558-mm mean length), observed exclusion efficiencies were less than50 percent with the 45 degree placement. These efficiencies are lower than nearlyall other efficiencies observed (table 6) even with very small fish. Based onReclamation laboratory and permanent facility observations, it is recommendedthat designs be developed based on louver line placements ranging from parallelto the flow to 17 degrees to the flow.
Flow distribution control/turning vanes - Localized high velocities throughlouvers should be avoided. These local high velocities will likely increaseentrainment and passage of fish through the louver and reduce fish exclusionefficiency. As with screens, velocities approaching the louver structure are afunction of local hydraulics and differentials (chapter IV.A.5). Local variations indifferential are influenced by approach and exit flow concentrations, structure andchannel geometries, and head losses in the system.
A common flow distribution along the louver line includes low channel velocitiesat the lead end of the louver line and high channel velocities at the tail end of theline. These high velocities, therefore, occur at and near the bypass entrances,which are critical locations in that fish concentrations are high and a potentialexists for fish to hold as a result of avoidance responses to the bypass entrance. This is demonstrated in the Alden Research Laboratory (2000) study where adifferential of 1.2 cm was documented at the lead end of the louver and adifferential of 34.4 cm was documented at the tail end of the louver, with thelouver operating with a channel velocity of 2.5 ft/s. This is a relatively lowchannel velocity and, yet, severe differential gradients were generated as fishmove downstream along the louver line. This differential distribution yields afivefold increase in through louver velocity magnitudes over the louver linelength.
Unlike with screens, flow resistance or baffling behind louvers is typically notused to modify flow distributions. This may be because debris and sediment canpass the louvers and accumulate on baffling behind the louvers. An exceptionwould be use of treatments such as partial stop logging (chapter IV.A.6) that

Fish Protection at Water Diversions
V-16
would still allow sediment and debris passage while generating flow ratecontrolling back pressure.
Preferred techniques for controlling approach velocity distributions includeoptimizing approach and exit channel configurations and using turning vanesplaced behind the louvers (chapter IV.A.6). Lancaster and Rhone (1955)developed a turning vane system for the Tracy Facility that incorporates theturning vanes in the louver support panels (figure 97). This has proven to be aneffective approach velocity distribution control technique that allowssimplification of approach and exit channel geometries while maintaining goodapproach velocity distributions. Rhone and Bates (1960) noted that, for thisdesign:
Tests showed that, if the flow emerging from the louvers was turnedby vanes to flow downstream, backwater effects were minimized andgood approach flow resulted. Improved flow/outflow conditionsmight also have been achieved by re-alinement of the stream channeldownstream from the louvers but this would have been very expensiveand impractical in this case.
B. Electrical Fields Electrical fields have not proven to be very successful in guiding fish and havehad limited success as fish barriers. Electrical fields are used to cause anavoidance response by fish. The effectiveness of the electrical fields depends onsite specific physical parameters such as: flow velocities, conductivity, and watertemperature (EPRI, 1986). Issues such as fish fatigue near an electrical field andbalancing the power of the electrical field depending on fish size have not yetbeen resolved.
Several commercial products are available and have performed with variousdegrees of success. A system was evaluated by Bengeyfield (1989) at PuntledgeDiversion Dam. The system was deployed to divert outmigrating coho salmonsmolts from a hydro power intake and toward a bypass structure. The strength ofthe electrical field increased in the downstream direction as the barrier was placedat an angle to the intake. The effectiveness of diverting fish from the intakeranged from 2–22 percent. Factors such as unstable flow patterns, incompleteelectrical fields, ineffective bypass structures, and combinations of all thesecaused the barrier to fail.
Wilkins Slough Pumping Plant personnel and Reclamation staff worked withvarious behavioral suppliers in testing experimental acoustical and electrical fishfields for over 4 years to try to evaluate and develop a more cost-effective barrierthan the positive barrier screens. Although there was considerable and valuable

Chapter V. Behavioral Barriers
V-17
data gathered, these experimental devices did not prove as effective as positivebarrier screens and, in most cases, are not acceptable as proven fish barriers byfishery resource agencies.
More recently, the U.S. Army Corps of Engineers (Corps) has been working todeploy an electrical fish barrier in the Chicago Sanitary and Ship Canal (Hansen,2004). Because the waterway is possibly the only direct connection between theGreat Lakes and the Mississippi River and invasive, very aggressive carp specieshave been found in the Mississippi River, the Corps is looking for a creative wayto keep the fish from swimming upstream through the ship channel to the GreatLake watersheds. The challenge is to develop a barrier where barge traffic cancontinue to use the channel but fish will be repelled from moving through thechannel to the lakes. The barrier selected will emit an electrical field intenseenough to reach the surface and repel fish even as barge traffic passes through thebarrier. Much of this effort is directed by the National Invasive Species Act of1996.
C. Strobes and Lighting
Strobes and lighting systems use light to either attract or repel fish. These can beused either to drive fish away from water diversions and intakes, thus excludingfish from the diversion, or to attract or guide fish to a desired location or elicitsome desired response. Many devices generating wide ranges of lightingintensity, wave band frequency, and lighting durations have been applied. Theseare purely behavioral devices that depend on fish behavioral responses to achievecontrol. Lighting systems offer a low capital and operation and maintenance(O&M) cost option for fish control. They can be applied at difficult sites that areeither very large, pass large flows that would be difficult or expensive to screen,or that are inaccessible (such as a deep intake in a reservoir). Lighting systemsmight also be considered for application at sites where cost would otherwise notallow installation of fish exclusion devices. The primary drawback of lightingsystems is their inconsistency in excluding or guiding fish. They have proveneffective at some sites with specific fish species and life stages and ineffective atother sites. The performance of lighting systems, particularly when applied atshallower depths, is also strongly influenced by the daylight or ambient sunlighting which will dominate over any artificial lighting effects. Consequently,lighting systems, when applied at shallower sites, are typically effective only atnight. Lighting systems are generally seen by fishery resource agencies asdevelopmental and unproven technology, which is a valid perspective. Lightingand strobe systems are commercially available and are actively promoted.
Lighting systems may be found more useful for improving the performance ofconventional fish exclusion devices, for example, by using lighting to attract fishto the fish bypass entrances and away from the diversion intakes and screen

Fish Protection at Water Diversions
V-18
structures. Lighting of bypass entrances may also encourage fish entrance intobypasses, thus expediting fish passage.
Optional devices – Lighting devices that have been used include strobe lights torepel fish from intakes or to guide fish toward desired locations by using anavoidance response; mercury vapor lights that attract fish to bypass entrances orsafe locations and away from intakes; and incandescent, fluorescent, overheadsodium vapor, and drop lights that have been investigated both as attractants anddeterrents (EPRI, 1994; EPRI, 1999).
Underwater strobe or flashing lights have been shown to be more effective thancontinuous lighting in repelling fish. Response has, however, been shown todepend on fish species, fish life stage, and as addressed above, on the influence ofambient lighting. Studies have also shown that flashing rate (number of flashesper minute) and flash intensity influence the fish response to the particular lightsource.
Mercury vapor lights are used primarily to attract fish, although in someapplications, they will cause avoidance (a function of species and life stage). Mercury vapor lights have been effectively applied to attract out-migratingsalmonid smolt to bypass entrances. As with other lighting options, mercuryvapor lights can be used to supplement and improve the performance ofconventional screening devices.
Underwater incandescent lights have been examined as fish attractants anddeterrents, and underwater fluorescent and drop lights have been tested as fishdeterrents. Overhead sodium lights have been assessed as attractants. Attemptshave also been made to use existing facility lighting to improve fish passagecharacteristics. Mixed success has been achieved in these studies. Lighting doesshow potential for supplemental improvement of conventional fish facilityperformance.
Experience with alternative systems is summarized in table 7. The table providesa partial listing of field experience cited in EPRI, 1999. This table is included todisplay the extent of application efforts conducted and the mixed results achieved. More detail can be found in EPRI, 1999.
Laboratory/caged evaluations – In many cases, laboratory and cagedevaluations of fish response are initially conducted to determine if the fish speciesand life stages of interest show response to the light or strobe stimuli beingconsidered. Often, fish show response in these caged studies but then show littleor no response in field applications. Field applications indicate that some fishspecies and life stages will respond to strobes; however, field results are ofteninconsistent and difficult to interpret because of confounding parameterinfluences. These inconsistencies may be due to the light intensities that the fish

Chapter V. Behavioral Barriers
V-19
Table 7.—Summary of field application experience with lighting and strobe systems (summarized from EPRI, 1999)
Site Fish species Lighting device Effectiveness
Mattaceeunk (WeldonDam)
Atlantic salmon Strobe (200 fl/min) Effective on upstream unitsbut not downstream
Rolfe Canal Atlantic salmon Strobe (300 fl/min) Ineffective
McNary Dam Pacific salmon smolt Strobe (150, 200fl/min)
Effective in repelling fromjuvenile bypass screen
Rocky Reach Dam Pacific salmon Strobe Ineffective at improvingsubmerged traveling screenperformance
Puntledge Coho salmon Strobe (60 fl/min) Ineffective when coupled withhanging chains
Burbank No.3 Pacific salmon Strobe (300 fl/min) Inconclusive
Hiram H. ChittendenLocks
Sockeye salmon Strobe Effectively repelled away fromrock filled culvert
Four Mile Dam Bullhead, shiner Strobe (300 fl/min) Reduced entrainment
York Haven American shad Strobe (300 fl/min) Effective in driving fish throughsluice
Hadley Falls American shad Strobe (300 fl/min) Ineffective in excluding fromcanal
Mattaceunk (WeldonDam)
Atlantic salmon Mercury light Increased bypass use withback-light inlets
Turners Falls Atlantic salmon Mercury light Overhead light attracted fish tosluiceway
Wapatox Pacific salmon, steelhead Mercury light Improved bypass rates withcorrect light intensity
Wanapum Pacific salmonsteelhead
Mercury light Inconclusive
Poutes Project Atlantic salmon Mercury light 3 to 5 fold increase in bypassuse
York Haven American shad Mercury light No effect
Hadley Falls American shadblueback herring
Mercury light No effect
Annapolis Tidal Station American shadblueback herring
Mercury light Slight attraction
Richard B. Russell Blueback herring Sodium lights Attracted fish away from pumpstorage
Mattaceeunk Atlantic salmon Incandescent Increased collection
Rolfe Canal Atlantic salmon Incandescent Ineffective
Rocky Reach Dam Pacific salmon Incandescent Back-lighting trashrack did notimprove collection

Fish Protection at Water Diversions
V-20
are exposed to in the caged studies are greater than what the fish are exposed to inthe field, where a broad expanse of open water (with turbidity) dissipates thelighting. Structure configurations, environmental conditions, and operationalinfluences also may affect the lighting field and fish responses. A considerationin the laboratory/caged studies would also be reflection of light off of hardsurfaces within the cage and the effect of these reflections on the fish exposure. When trying to identify the potential for strobe and light application through theuse of cage and laboratory studies, care must be taken to generate light intensitiesand a light field that is representative of what will occur in the field application.
Example installation: Wapatox Canal, Washington – Supplemental mercuryvapor lighting was added to the bypass entrances on an aging drum screenstructure in an attempt to improve the screen structure’s fish guidance and bypasscapabilities (primarily for Chinook salmon and kokanee). The Wapatox Canaldelivers flows ranging from 300 to 500 ft3/s for irrigation and hydropowerproduction. The canal had an aging drum screen (the screen has since beenreplaced) that included six 6.6-ft-diameter drums placed normal to the channelflow. The fish bypass entrances located on each abutment of the structure wererelatively small. The combined effect of the normal screen placement (with noangled configuration that would supply fish guidance to the bypass entrances) andthe small bypass entrances lead to poor fish guidance to the bypasses and, thus,delayed fish passage.
As a research effort EPRI (1999) and Pacific Power and Light (the facility owner)installed a 1,000-watt underwater mercury light on the left side of the canal,illuminating the zone around the left bypass entrance. In addition, a mercuryvapor light was located inside the left bypass entrance to illuminate the bypassslot entrance. A paired testing program was used to evaluate performance withand without the lights on. Resulting rates of fish passage and fish impingement ofthe drum screens were monitored.
As testing progressed, it was found that light intensity was a consideration. Withhigh intensity lighting, fish would approach the lighted zone but would not enterthe intake. Immediately after the lights were turned out, however, theaccumulated fish would pass through the bypass. The next phase of testing wasconducted with reduced lighting intensity. When this was done, a substantialincrease in fish passage resulted. With the reduced light intensity, nearly twice asmany fish were passed through the bypass when the lights were on than when thelights were off.
Support structure – Strobe and lighting systems require minimal supportstructure. Most commonly, lights are attached directly to the intake structure orassociated wing walls. Deployment may require a large framework to support thelights, and to provide a sufficient array of lights. On occasion they are also

Chapter V. Behavioral Barriers
V-21
deployed from bridge piers, safety cables, debris booms, and from buoy lines. Protection of lights from debris loading is a concern and should be considered.
Head loss – Lighting systems have no effect on the head loss characteristics ofintakes.
Debris cleaning – Debris and debris cleaning is typically not an issue withlighting systems. Routine maintenance demands associated with debris anddebris removal should be minimal. A significant concern is protection of lightsand cables from damage from debris during flood events. Lights requireunobstructed access to the approach water body. Submerged placement of lightsmay protect them from floating debris. Removal of lights and cables duringsevere flood events (when exclusion may not be a high priority) may be an option.
Cold weather operation – With submerged placement, light exclusion systemsshould be functional with minimal maintenance requirements during icingconditions. Again, ice loading and potential surface and float ice damage shouldbe considered in developing the system design.
D. Sound
Sound systems are used to elicit a response to either drive fish away fromdiversions and intakes, thus excluding the fish from the diversion, or to guide ordirect the fish to a desired location. Many devices generating wide ranges ofsound magnitude and sound frequency have been used. As with light systems,sound systems offer a low capital and O&M cost fish control option. Soundsystems can be applied at difficult sites that are either very large, that pass largeflows that would be difficult or expensive to screen, or that are inaccessible (suchas a deep intake in a reservoir). Sound systems might also be considered forapplication at sites where cost would otherwise not allow installation of fishexclusion devices. The primary drawback of sound systems is their inconsistencyin generating fish exclusion and guidance. They have proven effective at somesites with specific fish species and life stages and ineffective at other sites. Soundsystems are generally seen by fishery resource agencies as developmental andunproven technology. Sound systems are commercially available.
Optional devices – Devices that have been used include low-frequencymechanical sound generators (hammers, poppers, fish drones) and sonictransducer systems that generate a wide range of frequencies (EPRI, 1994; EPRI,1999). Mechanical devices that have been used include the hammer (orfishpulser), which is an impact device that uses a spring-driven mass to excite theresonant modes of a submerged structure. It produces a high-energy, low-frequency sound with a duration of approximately 200 milliseconds that isrepetitively generated. Poppers are pneumatic devices that produce low-

Fish Protection at Water Diversions
V-22
frequency (20 to 100 Hz,) high-amplitude sound through the valve controlledrelease of air from a pressurized chamber. Poppers produce an acoustic signalthat has a rapid peak (2 milliseconds in duration) followed by a low ringing thatlasts for about 150 milliseconds. The fishdrone is a device that uses sonicvibrations to excite metallic structures. Frequencies ranging from 20 to 1,000 Hzcan be generated either continuously or intermittently, producing regular orirregular pulses. These mechanical sound systems have not been consistentlyeffective in repelling fish species. Their application and evaluation were activelypursued in the 1980s. Currently, little activity and interest exists with mechanicalsound systems.
Transducer systems use speaker-like systems or oscillating pistons to generatesound with frequencies ranging from less than 100 Hz to 190 kHz. Lowerfrequency transducer based systems (100 Hz to 20 kHz) have generated avoidanceresponses from many species in cage studies but little response and exclusioneffectiveness in field trials. In EPRI (1999), it was observed that “the use of lowfrequency transducer based sound systems does not appear to be a viablealternative for protecting fish at water intakes.” High-frequency, transducer-basedsystems have been highly effective in generating avoidance and exclusion forclupeid species (shad and herring) and alewife at intakes. High frequencysystems have shown mixed and partial success with salmonid species (salmon andtrout) guidance and exclusion.
Infrasound generators that generate sound or flow fluctuations with frequenciesless than 100 Hz (typically 10 to 60 Hz) using either an oscillating piston or arotating valve with openings in it have recently shown potential. These systemsinclude substantial water displacement, which generates more particle motionthan acoustic pressure fluctuations. Studies have indicated that they may generateeffective fish response in the near field; however, substantial uncertainty stillexists with infra sound system performance. The extent of the zone of influencedoes not appear to be well documented.
Experience with alternative systems is summarized in table 8. This table providesa partial listing of experience cited in EPRI (1999). This table is included todisplay the extent of efforts conducted and the mixed results achieved. If moredetail is desired, reference EPRI, 1999.
Laboratory/caged evaluations – In many cases, laboratory and cagedevaluations of fish response are initially conducted to determine if the fish speciesand life stages of interest show response to the sound stimuli. Often, fish willshow response in these studies similar to the response to lighting systems, butthen will not show response and exclusion in field applications. This may bebecause the sound magnitudes that the fish are exposed to are greater in thelaboratory/caged evaluations than in the field where a broad expanse of openwater with sound dissipation at soft boundaries could reduce sound intensities.

Chapter V. Behavioral Barriers
V-23
Table 8.—Summary of field application experience with sound systems (summarized from EPRI 1999)
Site Fish species Sound device Effectiveness
Hiram M ChittendenLocks
Sub-yearling and yearlingPacific salmon andsteelhead trout
Transducer (300/400 Hz) Ineffective
Bonneville Dam turbineintakes
Pacific salmon smolt Transducer (300/400 Hz) Ineffective
Georgiana Slough Chinook salmon smolt Transducer (300/400 Hz) Less than 60% effective
Wilkins Slough Chinook salmon Transducer (300/400 Hz) Inconclusive
Reclamation District1004
Chinook salmon Transducer (300/400 Hz) 56 to 60% effective
Berrien Springs Chinook salmonsteelhead trout
Transducer (mixed frequencybetween 100 and 1000 Hz)
Unquantified reduction
Buchanan Chinook salmonsteelhead trout
Transducer (mixed frequencybetween 100 and 1000 Hz)
81% guidance chinooksalmon94% guidance steelhead
Puntledge coho salmon Popper No effect
McNary Dam Pacific salmon Infrasound/piston (#20 Hz) Inconclusive
Sandvikselven River(Norway)
Atlantic Salmon Infrasound/piston (10 and150 Hz)
10 Hz - potentially effective150 Hz no effect
Roza Diversion Dam Chinook salmon Infrasound/piston (rotatingvalve 10-50 Hz)
No response
Hiram M. ChittendenLocks
Pacific salmon -subyearling chinook
Infrasound/piston (10 Hz)and rotating valve (10-30 Hz)
Piston - mild avoidancevalve - ineffective
Rolfe Canal Atlantic salmon Infrasound (air-drivenpneumatic oscillators)
Mild avoidance
York Haven American shad Transducer (120-125 kHz) Repelled juveniles frompowerhouse guiding them toa sluice
Vernon American shad Transducer (125 kHz) Repelled juveniles frompowerhouse
Hadley Falls American shad Transducer (161.9 kHz) Generate strong avoidanceand guidance
Hadley Falls American shad Hammers Inconclusive
Lennox Yellow perch,pumpkinseed,black crappie,rock bass
Fish drone (27, 64, 99, and153 Hz)
Hammer
Little effect at 27, 64, and99 Hz, noticeable responseat 153 Hz.hammer - no effect

Fish Protection at Water Diversions
V-24
Many field installations include multiple sound generators that are used togenerate a continuous, complex, overlapping sound field. A concern in thelaboratory/caged studies would also be reflection of sound off hard surfaceswithin the cage and the effect of these reflections on the sound field. When tryingto identify the potential for sound application through the use of cage andlaboratory studies, care must be taken to generate sound intensities and a soundfield that is representative of what will occur in the field.
Example installation: Georgiana Slough, Sacramento River, California – Aprototype sonic barrier was installed and evaluated over several years in the early1990s at the confluence of Georgiana Slough and the Sacramento River(figure 24). This effort was supported by State and Federal water and fisheriesagencies including Reclamation (San Luis & Delta-Mendota WaterAuthority, et al., 1996; Hanson, et al., 1997). Georgiana Slough is a channelwithin the Sacramento-San Joaquin Delta. Pumping at State and Federalpumping plants located on the south side of the delta draws Sacramento Riverwater into the slough and consequently into and through the delta. A particularconcern is that out-migrating juvenile salmon smolt might be attracted into theslough and the delta and, thus, diverted from a direct out-migrating path downthe Sacramento River to the ocean. The objective for use of the sonic barrierwas to divert out-migrating Chinook salmon smolt in the river to the oppositebank, away from the slough entrance. It was recognized that the facility likelywould not be 100 percent effective. The testing was conducted to evaluateexclusion efficiencies that could be achieved and to address and evaluate otherperformance concerns, including the possible delays with both upstream anddownstream fish movement in the river caused by the sound generators.
Both the river and the slough are low gradient channels (slow moving water). The site experiences tidal influences that cause variations in flow velocities andmay, on occasion, cause flow reversals. Maximum flood events typically occur inthe winter and spring with storm events that may be influenced by snow meltrunoff. Debris loading may be substantial and may include trees and other largecomponents. In addition, both recreational and commercial navigation occurs atthe site. The range of river flows during testing was from 1,600 ft3/s to15,000 ft3/s.
The sound system deployed at the mouth of Georgiana Slough consisted of a 800 ft-long linear array of acoustic transducers suspended from buoys that wereplaced approximately 1,000 ft upstream from the slough entrance. The acousticbarrier angled out from the slough-side shore with the objective of deflecting theout-migrating fish to the far side of the river, away from the slough entrance(figure 24). The transducers generated sound with a 300–400 Hz frequency. Observed fish guidance/exclusion efficiencies were influenced by flow andhydraulic conditions, with efficiencies ranging from 50 to 80 percent for typicaloperating conditions. Observed efficiencies, however, dropped to 8 to 15 percent

Chapter V. Behavioral Barriers
V-25
(quite inefficient) during flood events. On occasion, damage occurred to thesound barrier facility during flood events. Generally, however, O&M costs werelow.
Support structure – Transducers and sound generators require minimal supportstructure. Most commonly, they are attached directly to the intake structure orassociated wing walls. On occasion, they are deployed from bridge piers, safetycables, debris booms, and buoy lines. Protection of sound generators from debrisloading is a concern and should be considered.
Head loss – Sound generators have no effect on the head loss characteristics ofintakes.
Debris cleaning – Debris and debris cleaning is typically not an issue with soundexclusion systems. Routine maintenance demands associated with debris anddebris removal should be minimal. A significant concern is protection oftransducers and sound generators from large debris, primarily during flood events. Sound generators require unobstructed access to the channel water body. Submerged placement of transducers may protect them from floating debris. Removal of transducers during severe flood events (when sound exclusioneffectiveness may be reduced) may be another option.
Power availability and need for backup power – Power is necessary to drivethe sound system. Backup power may be needed if continuous fish exclusion isrequired. Power requirements, which vary with specific device, may be up to 500watts per transducer.
Cold weather operation – With submerged placement, sound exclusion systemsshould be functional with minimal maintenance requirements during icingconditions. Again, ice loading and potential surface/float ice damage should beconsidered in development of the system design.


VI-1
Chapter VI. Fish Manual Case Studies
A. Design Examples
The following case studies cover design requirements and layout for severaltypes of fish exclusion structures at water diversions but do not include thefollowing important consideration in any final design for a fish exclusionstructure:
< Site availability and access considerations
< Geotechnical considerations
< Actual design of structures, mechanical equipment, and electricalequipment
< Construction considerations such as constructing cofferdams anddewatering
< Coordination with fishery and other agencies
< Post construction evaluation and testing
“By far the best proof is experience.”
Sir Francis Bacon
“In theory there is no difference between theory and practice. In practice there is.”
Yogi Berra, American Baseball Player

Fish Protection at Water Diversions
VI-2
1. Example 1 – Flat Plate Screen in Canal – “V” Configuration(Based on concept study for Intake Canal)
The diversion dam and canal are existing facilities without provision for fishexclusion. The canal diverts a maximum of 850 cubic feet per second (ft3/s) fromthe river (figure 99). The diversion dam consists of an overflow weir, asluiceway, and the canal headworks. The diversion season is from mid-Marchthrough mid-October.
It is desired to use a positive barrier fish screen to prevent fish from beingentrained in the canal, but if entrained, safely diverted from the canal back to theriver.
a. FisherySalmon
Size – fry, fingerlings, adults
Move downstream – early spring
Move upstream to spawn – early spring
Swimming – It is anticipated that fry will be present throughout the watercolumn.
and
Bull troutSize – fry, fingerlings, adults
Move downstream – late spring
Spawning – late summer to early fall and emerge in spring
Swimming – The fry generally drift with the current and have little strengthand endurance to swim against the current. Fry occur throughout the watercolumn.
b. River design data< The river flow is significantly affected by snow melt and reservoir
releases. The peak river flows occur from May through July.
< The canal can divert 850 ft3/s when the river flow is as low as5,000 ft3/s.

Chapter VI. Fish Manual Case Studies
VI-3
Figu
re 9
9.—
Site
pla
n –
Exam
ple
1.

Fish Protection at Water Diversions
VI-4
< River water surface elevations at headworks intake (based on 850 ft3/sin canal):
− Water surface is adequate to provide 10 ft water depth in thecanal at the fish screens
− Water surface at fish bypass outlet structure:
‘ Low flow (5,000 ft3/s) – 3.0 ft less than water level incanal.
‘ High flow (38,000 ft3/s) – 1.5 ft less than water level in canal.
c. Design dataThe canal data and section properties are:
Bottom width = 50 ftSide slopes = 2 (horizontal): 1 (vertical)Maximum flow = 850 ft3/sDepth at 850 ft3/s = 10 ftBank height = 13 ftLining – noneWater surface is controlled by a downstream check structure and does notvary significantly with flow.Velocity in canal = 1.21 feet per second (ft/s)Operating season – Mid-March through mid-October
Construction – The fish exclusion facilities can be constructed during the non-operating period from mid-October through mid-March (5 months). A canalbypass is not feasible because of right-of-way restrictions. Construction mayhave to occur over two separate periods.
Debris – Trashracks are located at the existing headworks, and only smallamounts of debris enter the canal through the diversion dam gates.
Sediment – Deposition is expected to be minor and can be removed in the off-season.
d. Fish screen structure design criteria < Fish species – Salmon, bull trout.
< Fish size – The screens should be able to safely exclude fish as smallas fry (25–60 mm).
< The design flow through the fish screens is 850 ft3/s. The operatorscan divert 850 ft3/s when the river flow is as low as 5,000 ft3/s.

Chapter VI. Fish Manual Case Studies
VI-5
< The fish screens must also be able to operate satisfactorily whenfish are migrating downstream and the river flow is as high as38,000 ft3/s (90 percent of the maximum river flow).
< Maximum fish screen approach velocity is 0.4 ft/s (based on NationalOcean and Atmospheric Administration Department of Fisheries[NOAA Fisheries] – Northwest criteria for salmon fry).
< Uniform approach velocity required along fish screens.
< Channel velocity is 2 ft/s or greater; sweeping velocity is 2 times thescreen approach velocity or greater. The ratio of sweeping velocity toapproach velocity should be between 5 and 10 to facilitate cleaning thefish screens.
< The invert of the screen structure will be located 0.5 ft above the canalinvert to prevent sediment deposits from interfering with the operationof the fish screens and cleaning devices. Water depth on fish screensis 9.5 ft.
< Exposure time – The maximum exposure time of fish to the screenstructure is 60 seconds.
< Bypass to river:
− Entrance width is 2 ft or greater− Entrance velocity is channel velocity or greater− Minimum pipe diameter is 24 inches− Bypass pipe velocity is 3 to 10 ft/s− Minimum pipe bend radius is at least 5 times the bypass pipe
diameter
< Fish screens
− Maximum opening (NOAA Fisheries – Northwest Region)
I. Perforations – Rectangles and circles maximum openings –3/32 inch in narrowest dimension.
ii. Slots – 1.75 mm (0.0689 inches)iii. Minimum open area percentage is 27 percent (table 4)
− Maximum design cleaning cycle time is 5 minutes
< Assumed head loss across fish screen and baffle is 0.5 ft

Fish Protection at Water Diversions
VI-6
< With the fish screens located downstream from the headworks, whichhas trashracks, an additional trashrack will not be required.
e. Location of fish screen structureTwo locations are considered for the fish screen structure: (1) placing the fishscreen upstream from the headworks to prevent fish from entering the canal (in-river structure), or (2) placing the fish screen in the upstream end of the canal andbypassing the fish back to the river (in-canal structure). For this facility, it isdesirable to locate the fish screens in the canal as close to the headworks aspossible (figure 99). Placing the fish screens upstream from the headworks wouldcreate the following concerns:
< The screens would be adjacent to the sluiceway, which is notcontinuously operated. Thus, there would not always be a goodsweeping flow past the fish screens.
< Ice conditions would require removing the fish screens. If fish screensremain in the canal, there will be no flow in the winter and the canalcan be unwatered to prevent damage to the fish screens and to allowmaintenance.
< Constructing the fish screens upstream from the headworks wouldrequire a cofferdam in the river. This would increase the constructioncost and possibly have environmental impacts.
It is desirable for the fish screen structure to be located as close to the upstreamend of the canal as possible to minimize the time fish are out of their naturalenvironment and minimize potential predation. For this example, the fish screenstructure should start a suitable distance downstream from the canal curve, whichbegins immediately downstream from the headworks. To attain the uniform flowcondition, it is desirable to locate the fish screens approximately 40 times thecanal depth downstream from the headworks or any bends. This distance isrequired to ensure uniform channel flow at the fish screens (figure 99).
The downstream distance from the curve is:
Distance = 40 * 10 = 400 ft.
The distance from the canal bend is limited by the existing roadway bridge(approximately 250 ft from the bend), so the distance downstream cannot be fullymet to provide uniform approach flow at the screen structure. It is anticipatedthat the adjustable baffles will adequately adjust the flow to provide uniformapproach flow at the screens; however, laboratory model studies may be required.

Chapter VI. Fish Manual Case Studies
VI-7
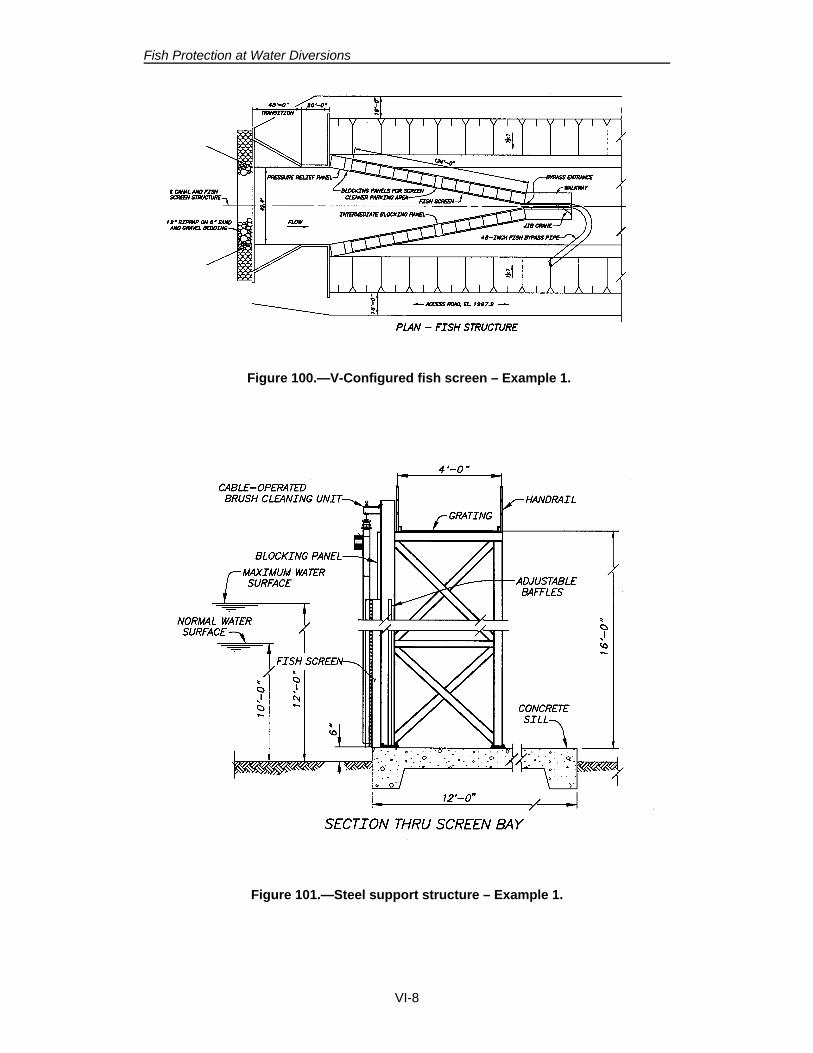
f. Design of Fish screen structure (figures 99 and 100)The fish screen facility will consist of the following:
< Fish screen structure
< Transition from upstream canal to fish screen structure
< Fish screens
< Baffles behind the fish screens
< Brush cleaner system for cleaning the fish screens
< Fish bypass to the river including: the bypass entrance, the bypasspipe, and the outlet structure
< Area for trapping fish within the bypass entrance channel
< Canal check structure (not shown) to provide a more constant watersurface for the fish screens and adequate head for the fish bypass
g. Fish screen structure (figure 101)The fish screen structure will consist of a steel guide/support frame placed on aconcrete slab. The fish screen surface will be vertical and flush with thestructural members and abutments to allow unimpeded fish movement parallel tothe screen and to maintain an easily cleanable screen surface. In addition todesigning for dead loads and live deck loads, the structure will be designed towithstand a 4-ft differential head on the fish screen. The concrete foundation willinclude upstream and downstream cutoffs to prevent undermining by scour and toreduce problems caused by under seepage.
The required area of fish screens is the design flow divided by the maximumallowable approach velocity:
A = (850 ft3/s/0.4 ft/s) = 2,125 square foot (ft2)
The required area does not include structural support members. Structuralsupport members normally occupy 5 to 10 percent of the fish screen area. Forthis example, we will use 5 percent. Thus, the required gross area will be:
Ag = 1.05 * 2,125 = 2,232 ft2
Fish Protection at Water Diversions
VI-8
Figure 100.—V-Configured fish screen – Example 1.
Figure 101.—Steel support structure – Example 1.

Chapter VI. Fish Manual Case Studies
VI-9
The length of the fish screens is obtained by dividing the required area by thedepth. The invert of the fish screens is 0.5 ft above the canal invert; therefore, thedepth on the fish screens is 10 ft –0.5 ft = 9.5 ft. The required length of the fishscreens is the area divided by the depth:
L = (2,232/9.5) = 235 ft (Use 240 ft to accommodate 10-ft square screen panels).
The exposure time for the fish will determine the layout of the screen and thenumber of bypasses required. The maximum exposure time is 60 seconds. Themaximum distance to a bypass, or between bypasses, is:
L = 240 ft/(2 ft/s) = 120 ft
There are two potential configurations for the fish screen structure:
< “V” configuration with a terminal bypass
< Straight line configuration with an intermediate bypass located at themiddle of the structure and a terminal bypass
The required bypass flow is based on the bypass entrance velocity, width, andflow depth. The bypass flow velocity, at the bypass entrance, will be equal to thesweeping velocity of 2.0 ft/s. The bypass flow per bypass would therefore be:
Flow = 2.0 ft/s * 2 ft width * 10 ft depth = 40 ft3/s/bypass
The 240-ft fish screen length is too long for a straight-line fish screen structurewithout an intermediate bypass.
Of the two options available, the “V” configuration is preferable because of thefollowing:
< The “V” configuration requires only one bypass with a flow of 40 ft3/s.
< The straight-line configuration requires two bypasses with a total flowof 80 ft3/s (40 ft3/s for each bypass). If two bypasses were used, asecondary screened return flow facility might be required. The returnflow facility would return flow from the bypasses to the canal andallow a reduced bypass flow with fish. The return flow structurewould contain traveling water screens and pumps.
< The straight reach of the canal where the facility is to be located is notlong enough to contain a straight-line structure and have enoughupstream straight reach for acceptable flow conditions.

Fish Protection at Water Diversions
VI-10
A “V” configuration does, however, make access to the channel area in front ofthe screens more difficult, and design and operation of the screen cleaners morecomplex. The screen cleaners on a “V” configuration facility must be designedor coordinated to prevent hitting each other at the apex of the “V.”
The desired channel velocity determines the channel width at the upstream end ofthe fish screens. It is desirable to have a minimum channel velocity of 2.0 ft/s toboth keep the fish moving and the trash moving without either impinging on thefish screens.
The fish screen structure will be located in a trapezoidal canal section with atransition from 2:1 canal side slopes to vertical concrete walls at the upstream endof the screens. The channel bottom width at the upstream end of the fish screenstructure is determined by the area needed for a velocity of 2.0 ft/s. In calculatingthe required area, the bypass flow of 40 ft3/s is added to the screen flow of850 ft3/s for a total flow of 890 ft3/s. The required area to produce a 2.0 ft/svelocity is the flow divided by the velocity (890 ft3/s/2.0 ft/s) = 445 ft2. Sincethe depth is 10 ft, upstream bottom width is calculated to be 44.5 ft.
Checking exposure time – The screen angle to flow is 10 degrees, and thesweeping velocity is 1.97 ft/s. Therefore, the exposure time is120 ft/1.97 ft/s = 61 seconds, which is acceptable.
The grating and walkway deck of the fish screen support structure are set justabove the canal bank elevation, which is 3 ft above the normal water surface. Thedeck must be wide enough for access by maintenance personnel and is 4 ft wide(figure 101). The deck will have handrails for the safety of the operators.
h. Upstream transitionsAt the upstream end of the fish screen structure there is a converging transitionfrom the canal section (trapezoidal channel) to the fish screen structure, which is arectangular section. The transition must be sized and shaped to provide a uniformtransition of flow without eddies. To accomplish this, the transition wall angleshould be 25 degrees unless the regulating agencies want a flatter angle. Thelength of the upstream transition is:
Transition length = (2 * 10)/tan 25 = 42.9 ft (use 40 ft)
Fish screens – The fish screens may be either woven wire, perforated plate, orprofile bar (wedge wire) flat plate screens. Profile bar was selected for the fishscreens because it is commonly available, has a high percentage open area, and isnormally easy to keep clean (table 4 and chapter IV.A.10a). Perforated plate hasa open area of approximately 30 percent. The profile bar has a open area between

Chapter VI. Fish Manual Case Studies
VI-11
40 and 50 percent, which is greater than the 27 percent open area required. Thehigh slot velocities of the perforated plate also may increase the difficulty ofhandling trash and reduce the fish exclusion capability.
The screens must be durable and have a smooth finish. The profile bar will havea clear opening of 1.75 mm (table 4). The fish screens will be stainless steel toincrease longevity and minimize maintenance requirements. The support panelswill be coated steel for economy. Each screen will be square and measure10 ft by10 ft. The screens are made square so that they can be rotated and have theprofile bar slots oriented either vertically or horizontally. Experience indicatesthat a vertically oriented slot type screen is often easier to keep clean; however,this depends on the type of debris. Because of the 6-inch offset at the invert, thetop of the fish screens will be 0.5 ft above the minimum required height (thedesign water depth in the canal). To prevent overtopping, 2-ft-high solid panelswill be located above the fish screens.
The screens can be either bolted to the upstream flange of the steel supportstructure or placed in guides. Placing the screens in guides facilitates removaland replacement, but also increases the construction cost. For this facility, thefish screens will be bolted to the steel support structure (figure 101). A metal sillplate can be embedded in the concrete fitting for seating the screen bottoms. Screen removal will be accomplished by placing a mobile crane on the canal bank(50- ft reach); therefore, an overhead monorail on the fish screen structure is notnecessary. This is feasible because the canal is unwatered in the winter. Unwatering in the winter also allows the screens to be cleaned in place.
Baffles – Fish screen baffling is normally required to create a uniform approachvelocity along the fish screens. The baffles are located immediately behind thefish screens and should be adjustable to allow setting them to accommodate thespecific site conditions. A vertical slat baffle has been commonly used. Theslats, which are normally 8 to 10 inches wide, can be individually rotated andpositioned for adjustable flow control. Baffling could also be two pieces ofperforated plate. The downstream perforated plate would be fixed and theupstream perforated plate would be adjustable, similar to figure 41. Raising orlowering the upstream plate to adjust hole openings can control the flow throughthat section of the fish screens. The perforated plate option will be used becausethe construction cost is less and it is easier to adjust. It is anticipated that once thebaffles are properly adjusted, they will perform well for the remaining life of thestructure.
Fish screen cleaning – The fish screens must be kept clean to provide acceptableperformance. To ensure clean screens for large screen structures, an automatedcleaning system is often required by fishery resource agencies to adequately cleanthe screens. Two sources of screen cleaning systems are commonly available:

Fish Protection at Water Diversions
VI-12
(1) cable operated brush system (individually designed) and (2) commerciallyavailable systems. For this fish screen structure, the cable type system is selected(figure 65). It is normally necessary to clean the fish screens at least once every 5 minutes. One cleaning system will be installed on each side of the V configuration. Thecleaning systems will have variable speed adjustable drives that move the brusharms between 0.25 ft/s and 1.0 ft/s. Thus, using two brush arms, the cleaningtime cycle can range from 1 to 4 minutes, which is satisfactory. Each cleanerwill require a 4-ft-long runout parking area at the upstream end, a 4-ft-longintermediate blank panel for parking and turnaround similar to figure 65, and a 1-ft-long turnaround area at the downstream end. At the parking and turnaroundareas, a metal ramp will push the brush away from the blank panels to allowdebris removal by the sweeping flow. The cleaning system will have four modesof controls:
< Operate at predetermined time intervals< Operate continuously< Operate at a predetermined head differential< Operate locally
Operators may select the option that best suits their conditions.
Some operators have found that including an air nozzle system with the screencleaner is helpful for removing sediment at the base of the structure and looseningimpinged trash from the fish screens. The air nozzle system is not included in thissystem. It is anticipated that sediment deposition can be removed when the canalis unwatered during the non-irrigation season.
Facilities for emergency operation due to potential screen plugging – Thefacilities are not designed to hold back the full depth of water in the canal or river. Intermediate alarms should be actuated to allow maintenance personnel to correctthe situation before the emergency measures are necessary. In case the screensplug, either a flow bypass mechanism to relieve the water pressure should beprovided or the canal headworks gates should close. The emergency flow bypassand headworks closure are best operated automatically. The emergency flowbypass can be items such as automated bypass gates (slide or radial), panel(s)which rise automatically, or a relief (blowout, shear pin, or spring-loaded)panel(s). The emergency flow bypass should be sized to pass an adequate amountof flow to prevent overloading the structure. If the headworks gates areautomated to close during a screen blockage, the gates must be operated in amanner that does not cause the canal to draw down too quickly and cause bank orlining failure.
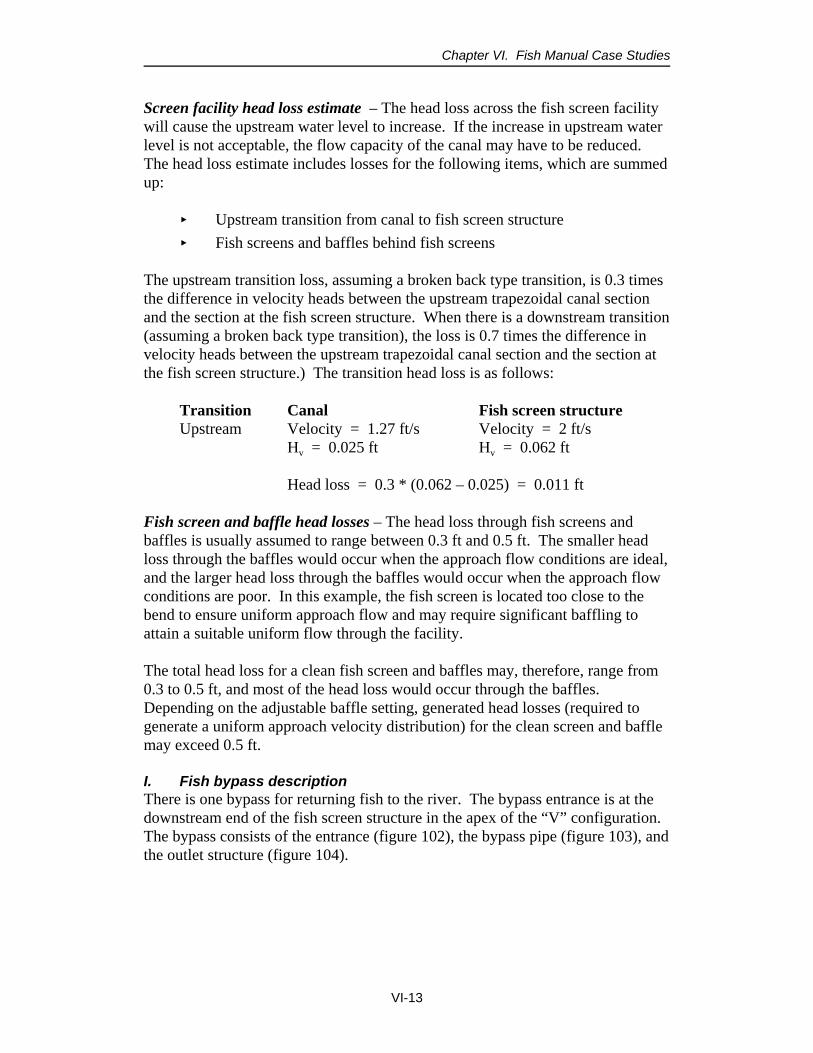
Chapter VI. Fish Manual Case Studies
VI-13
Screen facility head loss estimate – The head loss across the fish screen facilitywill cause the upstream water level to increase. If the increase in upstream waterlevel is not acceptable, the flow capacity of the canal may have to be reduced. The head loss estimate includes losses for the following items, which are summedup:
< Upstream transition from canal to fish screen structure < Fish screens and baffles behind fish screens
The upstream transition loss, assuming a broken back type transition, is 0.3 timesthe difference in velocity heads between the upstream trapezoidal canal sectionand the section at the fish screen structure. When there is a downstream transition(assuming a broken back type transition), the loss is 0.7 times the difference invelocity heads between the upstream trapezoidal canal section and the section atthe fish screen structure.) The transition head loss is as follows:
Transition Canal Fish screen structureUpstream Velocity = 1.27 ft/s Velocity = 2 ft/s
Hv = 0.025 ft Hv = 0.062 ft
Head loss = 0.3 * (0.062 – 0.025) = 0.011 ft
Fish screen and baffle head losses – The head loss through fish screens andbaffles is usually assumed to range between 0.3 ft and 0.5 ft. The smaller headloss through the baffles would occur when the approach flow conditions are ideal,and the larger head loss through the baffles would occur when the approach flowconditions are poor. In this example, the fish screen is located too close to thebend to ensure uniform approach flow and may require significant baffling toattain a suitable uniform flow through the facility.
The total head loss for a clean fish screen and baffles may, therefore, range from0.3 to 0.5 ft, and most of the head loss would occur through the baffles. Depending on the adjustable baffle setting, generated head losses (required togenerate a uniform approach velocity distribution) for the clean screen and bafflemay exceed 0.5 ft.
I. Fish bypass descriptionThere is one bypass for returning fish to the river. The bypass entrance is at thedownstream end of the fish screen structure in the apex of the “V” configuration. The bypass consists of the entrance (figure 102), the bypass pipe (figure 103), andthe outlet structure (figure 104).

Fish Protection at Water Diversions
VI-14
Figure 102.—Bypass entrance – Example – 1.
Figure 103.—Profile of bypass pipe – Example 1.

Chapter VI. Fish Manual Case Studies
VI-15
Entrance – The entrance (figures 100 and 102) is 2.0 ft wide, which is adequateto pass trash and fish, and meets criteria. The channel upstream from the gateshould be open topped to allow light in and not elicit an avoidance response fromthe fish. As previously estimated, the minimum bypass flow is 40 ft3/s. Optionsfor controlling the flow through the bypass are: (1) using an adjustable weir withan upstream ramp or (2) using a slanted type gate. A slanted slide gate at theentrance will be used to control the flow in the bypass channel and isolate thefacility from the river. The slanted gate can be used to control the flow if it is notrequired to close more than half way to accomplish this. An alternative to theslanted gate would be an adjustable weir with ramp (similar to figures 52, 54,and 108). For this example, the slanted gate is selected because there is minimalhead loss available to drive the bypass flow. A drop well is sometimes requiredjust downstream from the gate or weir to accommodate excess available head. However, in this example, a drop well is not required.
The bypass channel is also designed to allow for use of a fish trap to evaluate theeffectiveness of the fish passage and any possible injury to the fish. Theopportunity for evaluation is accomplished by providing guides in the sidewallsso that a removable net and trap box can be inserted. Also, a jib crane will beprovided to allow insertion and removal of the net and trapping equipment.
Bypass return flow channel – The difference in water level between the bypassentrance and the river is 3 ft during low river flow (5,000 ft3/s) and 1.5 ft duringhigh river flow (38,000 ft3/s). A canal check structure is required to ensureadequate head for the bypass flow during high river flows. Buried pipe will beused for the bypass flow to the river (figure 103). The flow must have a velocitybetween 3 and 10 ft/s, and the bypass pipe must be smooth, with no protrusionsthat might injure fish. To meet velocity criteria, the pipe diameter may bebetween 2.26 ft (10 ft/s) and 4.12 ft (3 ft/s). For economy and to keep fishmoving, it is desirable to make the diameter as small as possible while not
Figure 104.—Bypass outlet structure – Example 1.

Fish Protection at Water Diversions
VI-16
exceeding head loss requirements. Head loss through the bypass system must beestimated and must not exceed available head. The pipe diameter from the bypassentrance to the river is 48 inches. With a flow of 40 ft3/s, the velocity is 3.2 ft/s(within criteria of 3 to 10 ft/s). Reinforced concrete, steel, and high densitypolyethylene (HDPE) pipes were considered for the bypass. The joints in thereinforced concrete pipe would be mortar filled to make them smooth, and thejoints in the HDPE would be butt welded.
Outlet structure location and design – The outlet structure is a concretetransition (figure 104). The following items must be considered in locating theoutlet structure: river flow depths, possibility of future river changes such asdegradation and changes in alignment, sedimentation, and locating an area of theriver with good sweeping velocity.
Head loss through the bypass system – The head loss consists of the sum of theentrance loss, pipe friction and bend losses, and exit loss. The gate is assumed tobe fully open for estimating the minimum head loss. The entrance is a smoothtransition to the pipe, and the head loss can be estimated by multiplying anentrance coefficient by the difference in velocity heads. For this entrance, acoefficient equal to 0.2 is assumed. The entrance head loss is therefore:
Entrance head loss = 0.2 * (3.22/64.4 – 2.02/64.4) = 0.019 ft
For this example, the pipe friction loss will be estimated using the Darcy-Weisbach Equation, and the friction factor is estimated using the Colebrook-White Equation. The Darcy-Weisbach equation is:
H = f * (L/D) * (V2/(2g))Where:
H = total friction loss (ft)L = length of conduit (ft) = 120 ft.V = flow velocity (ft/s) = 3.2 ft/sD = diameter of conduit = 4 ft.f = friction factorg = acceleration of gravity
The Colebrook-White equation is:
1/f 0.5 = – C3 * log((e/C5D)+(C4/úf0.5))
Where: C3 = 2C4 = 2.51C5 = 3.7The roughness, e = 0.0002 for smooth pipe and 0.001 for rough pipe

Chapter VI. Fish Manual Case Studies
VI-17
ú is the Reynolds number = 4*(A/Wp)*V/v, where A is the pipe area = 12.57 ft2
Wp is the wetted perimeterD is the pipe diameter = 4 ftV is the flow velocity = 3.2 ft/sv is the kinematic viscosity = 0.0000141
Solving the equation, f = 0.01527Friction loss/ft = f * (V2/2g)/D = 0.0006The friction loss is therefore pipe length * head loss/ft:
H = 120 * .00060 = 0.072 ft
The bend loss1 is estimated: 0.0035* (3.2)2/2g*bend angle = 0.0035*0.159*140 = 0.078 ft.
The exit loss is estimated to be one velocity head: 1.0 * (3.2)2/2g = 0.16 ft.The entrance loss is estimate to be 0.5 * velocity head = 0.080 ft.The total head loss in the bypass system is then 0.072 + 0.078 + 0.16 + 0.080 =
0.390 ft.
The head loss is less than the available head and the gate will have to be used tocontrol the flow.
1 Bureau of Reclamation (Reclamation), Design Standard No. 3, 1967.
j. Operation and maintenance For an overall scope of operation and maintenance (O&M) requirements, seeChapter VII, Post Construction Evaluation and O&M Plans.
Often, an evaluation of the fish being bypassed is required. Nets and collectiondevices can be placed in the bypass to collect fish to determine numbers, physicalcondition, species, and sizes.
The fish facilities are designed to be as flexible as possible to maximizesuccessful fish passage. Items that are adjusted in this facility are the baffles foruniform flow velocity, the gate in the bypass entrance to set the desired bypassflow, and the operation of the fish screen-cleaners. In addition, water-levelmeasuring equipment is located upstream and downstream from the fish screens,and a flow meter can be placed in the bypass channel or pipe, if desired.
Cleaning criteria requires that the screens should be kept clean enough to preventthe head loss, across the fish screens only, from exceeding 0.1 ft. Therefore, thefish screens should be kept as clean as possible at all times. With the baffleslocated immediately behind the fish screens, it will be feasible to measure only a

Fish Protection at Water Diversions
VI-18
combined head loss of the fish screens plus baffles. Normally, the head lossthrough clean fish screens is relatively minor, while the head loss through thebaffles is relatively large. An alarm system is installed that will sound if thedifferential head across the fish screens and baffles reaches a predetermined level(usually set between 6 and 12 inches). The screens may have to be thoroughlycleaned with a high-pressure water system once or twice a year. This cleaningcan be accomplished with the screens in place with the canal unwatered. Abackup power generator is included with the facilities that will power the screencleaning system, area lights, sensors, and alarm systems. During normal operation, the bypass entrance gate is set to obtain the desiredflow.
2. Example 2 – Flat Plate Screen in River (Based on Glenn ColusaIrrigation District)
The Water District diverts (pumps) up to 3,000 ft3/s from the river. The diversionsite is located on an oxbow of the river (figures 5 and 6). Originally, the pumpingplant was unscreened. There have been two previous efforts to screen fish fromthe diversion. The first effort consisted of installing drum screens. The drumscreens were 17 ft in diameter and could operate successfully for a river depthrange of 11.1 to14.5 ft on the screens (0.65 to 0.85 times the screen diameter). There were two problems with the drum screen installation: (1) failed seals and(2) limited operating range because of fluctuating water levels. It was decided toretrofit the structure with flat plate fish screens with a horizontal brush cleaningsystem. The flat plate screens were installed at a 5-degree angle to vertical.
The flat plate screens provided better sealing capability and could operate at amuch greater range of river depths. The flat plate fish screens were designed foran approach velocity of 0.5 ft/s when the river water surface elevation was low. After the flat plate screens were installed, the downstream river channel wasstraightened by a flood flow and the water level at the fish screens dropped 3 ftlower than anticipated in the design. Also, subsequent criteria for screening fishat this specific site required a maximum approach velocity of 0.33 ft/s. It wasthen decided to replace or modify the fish screen structure.
Planning of the fish screen structure involved the following organizations:
< California State AgenciesDepartment of Water ResourcesDepartment of Fish and Game

Chapter VI. Fish Manual Case Studies
VI-19
< Federal AgenciesNOAA FisheriesReclamationU.S. Army Corps of Engineers (Corps)U.S. Fish and Wildlife Service (Service)
< Glenn Colusa Irrigation District
The technical support and final design groups consisted of:
< Reclamation< Corps and consultants< Glenn Colusa Irrigation District and consultants
a. FisherySpecies – salmon and steelhead
Size – fry through adults
Move downstream – throughout the year
Swimming – The fry generally drift with the current and have little strength andendurance to swim against the current. Fry occur throughout the water column.
b. River design data
< River flows and water surface elevations at the fish screen structureare given in table 9.
< Rivers are dynamic in nature and, in this case, can either meander overtime or become braided, depending on slope, velocity, and sedimentconditions of the channel. The potential for river relocation will likelyaffect the water surface elevation at the fish screens. The river watersurface elevation for various flows is currently near it’s lowest, andfuture river changes may raise the river water surface elevation.
< Sediment – Sediment deposits at the upstream end of the oxbow and isperiodically dredged.
< Debris – Large debris, which is carried by the river, especially duringhigh flood flows. However, the existing fish screens had been exposedto high river flows with little or no damage. A log boom would offerlittle protection against large debris in this case because it issubmerged in the river flow. Therefore, a log boom was not included.

Fish Protection at Water Diversions
VI-20
< Boating safety – A float boom should be placed across the oxbowchannel upstream from the fish screens to prevent boaters fromentering the oxbow channel where the fish screen and adjustableoverflow weir are located.
Table 9 – Flows and water surface elevations at fish screen structure
Flood frequencyRiver flow
(ft3/s)
Water surface elevationat fish screen structure
(ft)
Low irrigation design watersurface
7,000 137.0
Normal high irrigation watersurface
20,000 141.5
2-year 91,000 152.8
100,000 154.0
5-year 119,000 154.5
10-year 162,000 156.4
50-year 258,000 160.0
100-year 343,000 161.0
c. Design Data and fish screen structure design criteriaThe data and criteria listed below where agreed to by the Technical AdvisoryGroup, which consisted of State and Federal agencies, the irrigation district, andthe designers.
Fish screens – Design flow for fish screens is 3,000 ft3/s at a river flow of7,000 ft3/s and an associated water surface at El. 137.0. Historic diversion recordswere reviewed, and it was found that in only 1 in 20 years is the pump demand of3,000 ft3/s required when the river flow was less than 7,000 ft3/s. Maintaining thiswater level requires a grade control structure (gradient facility) in the main riverchannel and an adjustable flow control structure (overflow weir) in the oxbowchannel figures 5 and 6. Additional pumping criteria are set for river flows lessthan 7,000 ft3/s and for river flows during times of the year when downstream fishmigration is most likely. The water district and the environmental and fisheryresource agencies agreed to these criteria.
Fish screens are based on fry sized salmon criteria from NOAA Fisheries,Southwest Region (attachment A.3) and the State of California Department ofFish and Game (attachment A.6).

Chapter VI. Fish Manual Case Studies
VI-21
The screen approach velocity is 0.33 ft/s for the fish screen design flow at thewater surface elevation for the minimum river design flow. Higher riverelevations will produce lower approach velocities because of the greater screenarea.
The minimum required screen open area is 27 percent. The maximum screenopenings are 3/32 inch for square or round openings and 1.75 mm wide for slottedopenings.
The sweeping velocity should be equal to or greater than the channel velocity. The approach velocity should be uniformly distributed along the fish screens. Baffling will be required to attain a uniform screen approach velocity.
Bypass system – The bypass system will consist of the open channel bypass at theend of the fish screens and intermediate (intermediate) bypasses (with bypasspipes which extend downstream past the fish screens). Fish migrating upstreamshould be able to swim up the oxbow and past the fish screens. Intermediatebypasses must be located to limit the exposure time to 60 seconds (this wassubsequently revised with a variance from the fish agencies). The minimumoxbow bypass flow should be 500 ft3/s at 7,000 ft3/s river flow, and the minimumpipe diameter is 24 inches.
The intermediate bypass entrance, figure 108, should:
< Have a minimum width of 2.0 ft.
< Extend from structure invert to top of water surface.
< Provide artificial lighting (shadows may frighten fish).
< Provide a flow control device in the bypass entrance channel with aminimum head drop of 0.8 ft
Trashracks will be required at the intermediate bypass entrances to keep trashfrom plugging the bypass system.
The pipe walls should be smooth. The minimum bend radius should be at least 5times the pipe diameter. The bypass pipe velocity should be between 3 and10 ft/s, and changes in velocity should be gradual.
Fish screen structure – The deck width is 13 ft and 8 inches clear to allow thedistrict crane to operate from the deck. The design loading is HS20 (highwaytruck load) (figure 107).

Fish Protection at Water Diversions
VI-22
The extended fish screen structure deck El. is 154.8, to match the existing deck. The deck will be overtopped during high river flood flows. The existing fishstructure deck is overtopped when the river flow exceeds approximately120,000 ft3/s, and this will continue to be acceptable criteria.
The barrier panels can be placed above the fish screens to prevent them frombeing overtopped by flows of less than 120,000 ft3/s.
The top of the concrete base slab must be at least 0.5 ft above the channel invert.
The invert is at El. 126.5 for the extended fish screen structure. The existing fishscreen structure invert is at El. 127.0. The depth of water at minimum river flowon the existing fish screen structure will be 10.0 ft. The existing structure must beable to continue operation while the modifications are made for the extendedstructure.
The location, amount, and type of sediment deposition should be considered.
Electrical power is available at the site.
d. Location of fish screen structureA concept study (Glickman et al., 1996) that included physical model studies wasconducted to determine the most suitable location for the fish screen structure. Two sites were considered, one at the upstream end of the oxbow and the other atthe existing site in front of the pumping plant (Mefford et al., 1998). The screenstructure at the upstream end was laid out in a “V” configuration with fourseparate bays. The fish screens at the pumping plant were in a straight-lineconfiguration. Each site was evaluated with a physical model, and modelingindicated that each site would perform satisfactorily (Mefford, 1997). Also,evaluation of the existing sediment deposition characteristics and mathematicalmodeling of the potential future sediment deposition at both sites were includedas part of the concept study as an input in making the final decision. The straight-line configuration in front of the pumping plant was selected. Reasons forselecting this site and configurations were:
(1) The upstream end of the oxbow is used as a settling basin forsediment. Dredging operations are required in the upstream end of theoxbow every 1 to 3 years. Dredge volumes have been as high as60,000 yd3. Sediment will continue to collect when the new facilitiesare constructed, and dredging would be very difficult if the structure islocated at the upstream site.
(2) Sediment deposition is not a problem at the existing downstream fishscreen site.

Chapter VI. Fish Manual Case Studies
VI-23
(3) The straight-line configuration may allow fish to stay in the river(oxbow bypass open channel) without being guided into a pipe bypasssystem.
(4) Trash will be kept in the river and not have to be removed and truckedaway.
(5) Construction at the existing site will allow use of the existing fishscreen structure as part of the facilities. The existing fish screenstructure does, however, require some modifications.
e. Design of fish screen structureThe design of the fish screen structure includes the following:
< Modifying and extending the existing fish screens structure
< Upstream and downstream access/guide walls to the fish screenstructure
< A gradient facility in the main river channel and an adjustableoverflow weir in the oxbow channel downstream from the screenstructure to maintain a minimum river water level at low flows –details of these modifications are not covered in this example
< A float boom at the entrance to the oxbow channel to protect boatersby keeping them out of the channel
f. Fish Screen structureThe fish screen structure consists of the existing structure and a new structure thatbutts up against the existing structure and extends upstream (figures 105 and106). Included in the fish screen structure are the screens and brush cleaningsystem, three intermediate bypasses, baffles, an operating deck, a dredge bay, andguides for flow barriers. A terminal bypass is at the downstream end of the fishscreen structure. The opposite bank of the oxbow channel across from the fishscreen structure was modified to attain suitable sweeping flow conditions. Thedesired sweeping velocity range is 2 to 4 ft/s.
The fish screens in the new structure are installed at a 5-degree angle to thevertical to match the existing fish screens. Barrier panels are installed from thetop of the fish screens to the deck. The baffles will be used to attain a uniformapproach velocity through the screens. The baffles extend from the invert to
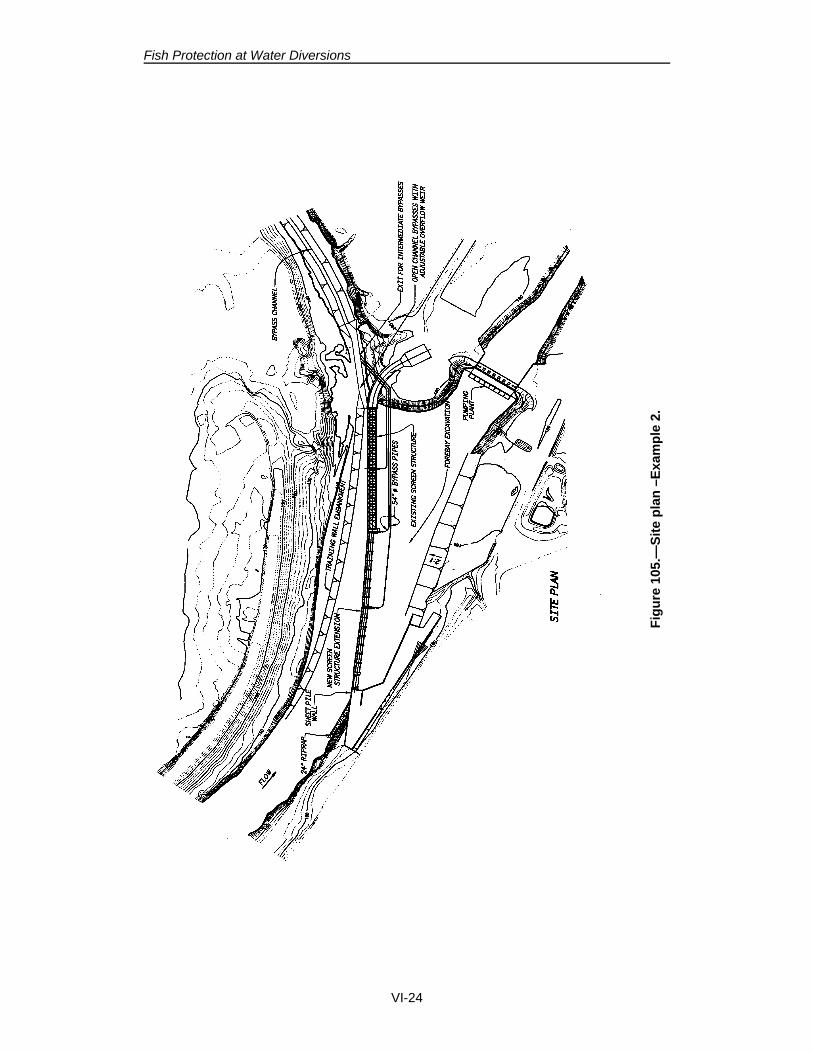
Fish Protection at Water Diversions
VI-24
Figu
re 1
05.—
Site
pla
n –E
xam
ple
2.

Chapter VI. Fish Manual Case Studies
VI-25
Figu
re 1
06.—
New
scr
een
stru
ctur
e —
Exa
mpl
e 2.

Fish Protection at Water Diversions
VI-26
El. 143.0. The dredge bay has a removable deck and allows the dredge to passbetween the pumping plant forebay and the river. The flow barriers can beinstalled if a screen is removed for maintenance.
The length of the total fish screen structure is based on the river at a flow of7,000 ft3/s and the maximum design pumping flow. The existing fish screenstructure is 478 ft long, including existing bypasses, or 470 ft not including thebypasses. The capacity of the existing structure at an approach velocity of0.33 ft/s and a depth of 10 ft (El. 137 – El. 127) is the gross screen area multipliedby the reduction for structural members and the approach velocity:
Allowable flow through existing fish screens = 470 ft (length of fishscreen) * 10 ft (depth) * 0.9 (correction for structural members) *0.33 ft/s (approach velocity) = 1,395 ft3/s
The required flow through the extended fish screen structure is:
Required flow through fish extension screens = 3,000 ft3/s –1,395 ft3/s = 1,605 ft3/s.
The required length of the extension is therefore:
Gross length of extension screens = 1,605 ft3/s/(0.33 ft/s* 10.5 ft *0.90) = 515 ft.
The total length of fish screens would, therefore, be 985 ft (470 + 515 ft.). Thefish screen structure length would also need to be increased to include openingsfor intermediate bypasses.
g. Modifications to Existing structureThe existing structure will be modified by constructing the following:
< New screen sweeps< Baffles< Barrier panels< One intermediate bypass
h. Modifications to the oxbow channelThe oxbow channel was modified across from the fish screen structure. Also, theadjustable overflow weir (check structure) located just downstream from the fishscreen structure and the remaining channel back to the main river channel(figure 5) were modified.
The oxbow channel was narrowed across from the fish screen structure tomaintain a minimum velocity of 2.0 ft/s in the channel. The hydraulic model

Chapter VI. Fish Manual Case Studies
VI-27
study was also used to assist in this part of the design (Mefford et al., 1997). Thedownstream reach of the oxbow channel returning to the river was modified tomaintain a minimum 2.0 ft/s velocity.
The adjustable overflow weir, just downstream from the fish screens, controlsflow in the open channel bypass. The adjustable overflow weir has precastconcrete planks and is ramped upstream and downstream. Planks can be insertedor removed to set the crest elevation of the ramped weir, thus setting the flowdesired for the river flow and elevation. The drop over the adjustable overflowweir is approximately 2.0 ft for a river flow of 7,000 ft3/s. The drop across theadjustable overflow weir decreases as the river flow increases.
The facilities will be evaluated and tested after construction to determine the mosteffective bypass configuration.
I. Fish screens and bafflesFish screens – According to agency criteria, alternatives for the fish screensincluded profile bar and perforated plate. The profile bar criteria require amaximum slot opening of 1.75 mm (measured at the narrowest point) and theperforated plate criteria require a maximum 3/32-inch opening. It was decided touse the stainless steel profile bar option for the following reasons:
< Easier cleaning, as demonstrated by the existing fish screens< Larger percent open area< Structurally stronger because no upstream trashracks are provided
The fish screens are constructed of stainless steel profile bar in 12.5 ft by 12.5 ftsquare panels. The fish screens will extend along the length of the fish screenstructure (except at intermediate bypass entrances). Steel barrier panels areinstalled above fish screens to the deck. The screens and barrier panels areinstalled in vertical guides for easy placement and removal (figures 64 and 107). The screens are constructed in square panels, which allows aligning the slotopenings either horizontally or vertically. In most cases, screens are usuallyeasier to clean with the wires aligned vertically, but because of the cleaningexperience with the existing profile bar screens, a horizontal alignment waspreferred by the district.
Baffles – According to the model study, baffling is required along the entirelength of the fish screens to provide a uniform screen approach velocity. Thebaffles will be placed in guides behind the fish screens (figure 107). Two typesof adjustable baffling can be used on facilities of this size:
< Vertical slats (vanes): Each slat can be rotated from fully open(normal to the plane of the screen) to approximately closed (parallel tothe face of the fish screen to provide adjustable flow control.

Fish Protection at Water Diversions
VI-28
< Perforated plate adjustable baffle: The upstream perforated platesection can be raised to adjust the net open area. The back supportframe can have either matching diameter holes or slotted openings.
The vertical slat baffles were chosen at this site. Use of the vertical slat baffle canminimize head loss, depending on the required baffle setting.
j. Fish screen cleaningCleaning the screens is accomplished by two means: (1) horizontal cableoperated sweeps (brush cleaners) and (2) periodically raising each fish screen andpower washing with a high-pressure water spray. The sweeps keep the screensclean during operation. The sweeps must be able to clean the full length of thefish screens every 5 minutes. Power washing with the high-pressure spray maybe used periodically, usually at the end and beginning of the irrigation season, toclean debris attached to the screens which was not cleaned off by the sweeps(especially for the back side).
Figure 107.—Cross section of screen bay – Example 2.

Chapter VI. Fish Manual Case Studies
VI-29
Two cable operated systems were selected for cleaning the existing fish screenstructure and two cleaning systems were selected for the extended fish screenstructure. Each screen cleaning system has a variable-speed, motor-operateddrive/cable pulley system that moves two carriages with brush arms back andforth along the structural track/guide system in front of the fish screens, as shownin figure 64. The variable speed drives provide a sweep-travel velocity rangebetween 0.5 and 1.5 ft/s. The sweep operation is computer controlled withseveral options for flexibility:
< Clean continuously
< Clean intermittently at some preset time interval
< Clean when the differential head across the fish screen reaches somepredetermined level.
< Local control
Water level sensors measure the differential water levels upstream anddownstream from the fish screens and baffles and the differential head iscalculated. If the differential head exceeds 6-inches, the sweeps startupautomatically; and if the differential head exceeds 12-inches, an alarm sounds forthe operators. Operators will be able to set the operation of the sweeps based onlocal river conditions.
k. Fish bypasses (intermediate)The design criteria stated that the maximum exposure time is 60 seconds. With ascreen length of at least 985 ft and a channel velocity of 2.0 ft/s, the exposuretime is estimated to be approximately 493 seconds for fish traveling from theupstream end of the fish screens to the open channel bypass at the downstreamend of the fish screens. To meet the criteria, eight intermediate bypasses wouldbe required; the bypasses would be approximately equally spaced.
The minimum total bypass flow is 500 ft3/s. The bypass flow will be acombination of open channel flow and the flow from the intermediate bypasses. Flow for an intermediate bypass is based on the flow entering the bypass at aminimum velocity of 2.0 ft/s, a 10.5-ft depth, and a minimum bypass entrancewidth of 2.0 ft.
Minimum flow for the intermediate bypass = 10.5-ft depth x 2.0-ft width x2.0 ft/s velocity = 42 ft3/s
Each intermediate bypass flow was rounded up to 50 ft3/s to ensure the 2 ft/sapproach velocity at higher river flows.

Fish Protection at Water Diversions
VI-30
If eight intermediate bypasses are constructed and used, the total flow from theintermediate bypasses will be 400 ft3/s and only 100 ft3/s would be available inthe open channel bypass at the downstream end of the screens.
The large intermediate bypass flows were thought to be less desirable for fishpassage in this circumstance, since the most beneficial bypass for fish wasthought to be the open channel at the downstream end of the fish screens. Thisdownstream bypass is the preferred bypass option because it does not take fishout of their natural element in the river channel. Because more flow would beavailable for the open channel bypass, it makes the bypass system more effective. A decision was made to construct three intermediate bypasses and onedownstream bypass. A physical hydraulic model was used to help configure thescreen/bypass layout. The bypasses are approximately equally spaced.
The intermediate bypass locations are shown in figures 105 and 106. Theintermediate bypass pipes terminate just downstream from the adjustableoverflow weir, which is just downstream from the fish screen structure. Eachintermediate bypass consists of (1) an upstream bulkhead to allow isolating thebay, (2) a trashrack at the entrance, (3) a curved entrance, (4) artificial light in theentrance, (5) an adjustable weir gate, (6) a transition and conveyance pipe, and(7) an exit structure (common to all intermediate bypasses). A section throughthe entrance is shown in figure 108. The adjustable overflow weir in the oxbowprovides the differential head needed to drive the flow through the intermediatebypasses in addition to providing a minimum water level for the fish screens.
The bypass entrance trashrack prevents large trash from entering and plugging thebypass. The center-to-center spacing of the trash bars is 9 inches to allow passageof fish but not trash.
The bypass entrance and adjustable weir configurations and hydraulics weredetermined by physical modeling (Campbell, 1998). A curved entrance(figure 109) is used to minimize the velocity gradient between the open channeland the bypass entrance and to also minimize the fright response of fish. Theentrance top is open as much as possible and the entrance also includes artificiallighting to prevent shadows from frightening the fish and impeding theirmovement. The weir gate located within the bypass entrance channel isadjustable to control the bypass flow and also to act as a barrier to fish trying tomove back upstream (figure 108). To prevent fry from moving back upstreamover the weir gate, the minimum required drop over the weir gate is 0.8 ft.

Chapter VI. Fish Manual Case Studies
VI-31
Figure 108.—Bypass entrance – Example 2.
Figure 109.—Bypass Bellmouth entrance – Example 2.

Fish Protection at Water Diversions
VI-32
The bypass pipe must have smooth walls and smooth joints to prevent injury tothe fish. Pipe material alternatives considered were mortal lined steel pipe andHDPE. Because the existing screen structure needed to remain operating whilebuilding the extended structure, some of the bypass piping needed to be installedin the wet. Therefore, steel pipe was used because it was easier to placeunderwater.
The intermediate bypass exit structure (figure 105) is located downstream fromanticipated turbulence caused by the adjustable overflow weir. It is also locatedin an area of flowing water so fish going through the intermediate bypasses willcontinue moving downstream after exiting and will be in an area where predatorswill not hold.
The intermediate bypass pipes are sized to meet velocity requirements (3.0 ft/s to10 ft/s) and to operate under available head. The available head is 2.0 ft. Thebypass pipe diameter selected was 54-inches, and the velocity for 50 ft3/s is3.14 ft/s. The farthest upstream intermediate bypass has the longest pipe, whichis 1,100 ft long. Head loss was estimated for this upstream bypass from theentrance to the exit. (See table 10).
Table 10.—Head loss in the intermediate bypass
Feature Head loss (ft)
Trashrack and bypass entrance – The trashracks will be kept cleanand head loss through the trashracks held to less than 0.01 ft. due tothe 9-inch bar spacing and 1.2 ft/s velocity at the trashracks. Thehead loss estimate for the entrance is 0.5* v2/2g; for an entrancevelocity of 2 ft/s, the head loss estimate is 0.03 ft. Use 0.1 ft.
0.1
Adjustable weir (the required drop is 0.8 ft) 0.8
Pipe transition head loss = 0.2 * (8.02 – 3.142 )/64.4 0.168
Bypass pipe (friction loss for longest pipe using Darcy Weisbach eq.)(See Example #1)
0.56
Pipe Bend Loss = 0.0035*90*(3.142/64.4) 0.048
Exit loss = one * (pipe velocity head – channel velocity head) 1.0 * 3.142/64.4
0.153
Total 1.829

Chapter VI. Fish Manual Case Studies
VI-33
l. Evaluation and O&M after constructionFor an overall perspective of evaluation and operation requirements, seeChapter VII, Post Construction Evaluation and O&M Plans.
The fish facility is designed to be as flexible as possible to ensure reliablediversion flow and maximize successful fish screening. Items that are adjusted inthis facility are the baffles for uniform flow velocity, the weirs in the intermediatebypass entrance channels to set the desired bypass flows, the operation of the fishscreen cleaning sweeps, and the adjustable overflow weir in the oxbow channel toset the bypass channel flow. In addition, water level measuring equipment islocated upstream and downstream from the fish screens and baffles and theadjustable overflow weir in the downstream oxbow channel.
At initial startup, velocity measurements are made along the fish screen structureand the baffles are adjusted to obtain a uniform approach velocity along the fishscreens.
During normal operation, the adjustable overflow weir in the oxbow channel isset to provide the desired water level and bypass flow in the channel and theadjustable weir in each intermediate bypass is set to obtain the desiredintermediate bypass flows. The screen cleaners should be set to operate acleaning cycle at a predetermined cleaning time interval unless the amount ofdebris in the river is high, then the cleaners should be set to operate continuously.
Successful fish passage should be evaluated, specifically looking at the following:
< Fish survivability in the open channel bypass< Fish survivability in the intermediate bypasses< The best operating combination of open channel and intermediate
bypasses
Backup power is not necessary because the diversion pumping plant will also shutdown with interrupted power.
3. Example 3 – Drum Screen in Canal – Small Screen Facility(Based on Lemhi River Site L-6 by Reclamation’s PacificNorthwest Region)
This example presents improvements to a diversion on the Lemhi River in Idaho(Pacific Northwest, 1993). The improvements are part of a project that willimprove several diversion facilities. The improvements are required to preventstranding fish in canals, provide upstream fish passage, and increase river flows. A smaller than desired population of spring and summer Chinook salmon andsteelhead exists. The gravel berm diversion dams, when in place, prevent
Fish Protection at Water Diversions
VI-34
upstream fish migration. The diversion for this example is referred to as Site L-6on the Lemhi River. Site L-6 is an existing diversion with a maximum diversioncapacity of 50 ft3/s. The water is diverted for irrigation of pasture and hay crops. At certain times of year, excess water is diverted in an attempt to buildup thegroundwater table. The groundwater then helps maintain river flows late in theseason.
The diversion into the existing canal is started each spring by constructing atemporary gravel berm in the river to provide adequate head for the canal flow. Because of the lack of an adequate headworks, the diversion flow often exceedsdemand. The canal contains an existing fish screen, which does not meet currentfish protection criteria. The existing fish screen design was based on a screenapproach velocity that is too high. The existing screen contains a small 6-inchbypass pipe.
Modifications to the canal and diversion will include the following (figure 110):
< Constructing a permanent adjustable crest overflow weir across theriver. This will allow upstream fish passage when diversions are notrequired.
< Constructing a fish ladder for upstream passage.
< Constructing new canal headworks. The headworks structure willallow limiting diversion flows to those required for irrigation andbypass. The headworks will be a constant head orifice type structure,which will control and measure the flow into the canal. It will alsohave trashracks.
< Constructing a fish screen facility in the canal, that meets current fishprotection criteria.
< Improving the intake canal upstream from the fish screen structure.
a. FisherySpecies – spring Chinook salmon and steelhead
Size – fry through adults
Downstream migration – Juvenile rearing occurs throughout the year. Themigration to the ocean occurs from April though June
Upstream migration – Mid-May to mid-September. The peak migrationnormally occurs from mid-June to late August.

Chapter VI. Fish Manual Case Studies
VI-35
Figu
re 1
10.—
Site
pla
n –
Exam
ple
3.
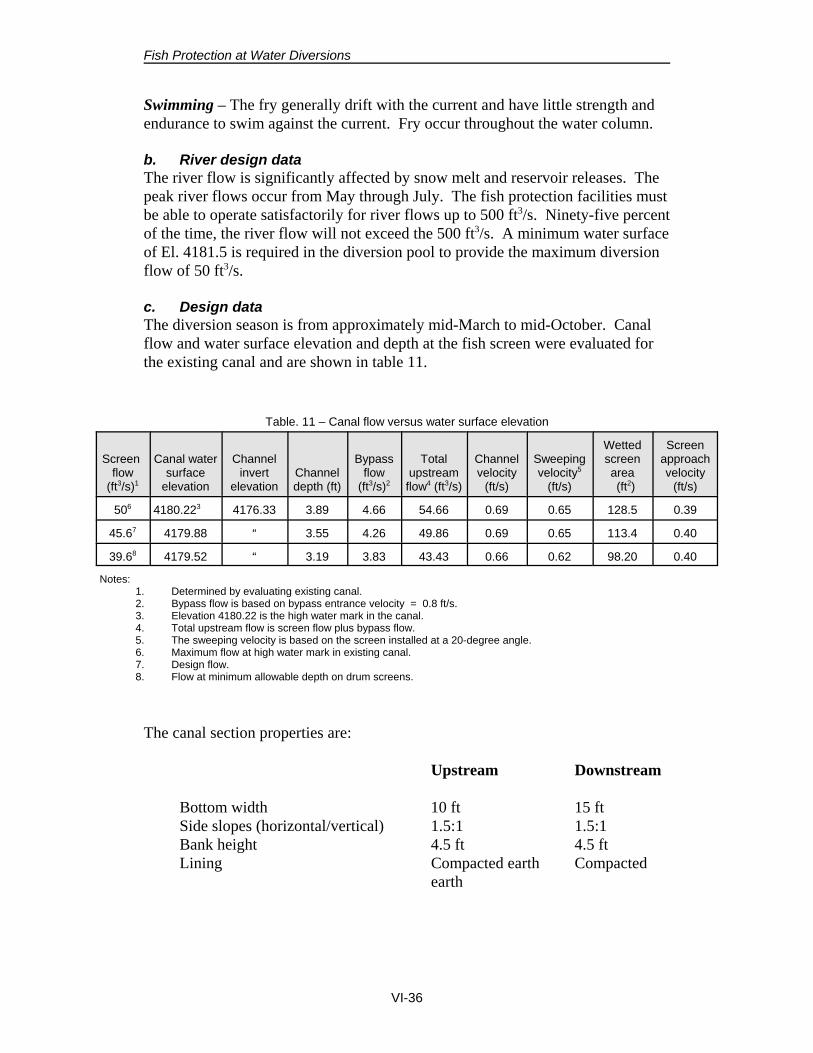
Fish Protection at Water Diversions
VI-36
Swimming – The fry generally drift with the current and have little strength andendurance to swim against the current. Fry occur throughout the water column.
b. River design dataThe river flow is significantly affected by snow melt and reservoir releases. Thepeak river flows occur from May through July. The fish protection facilities mustbe able to operate satisfactorily for river flows up to 500 ft3/s. Ninety-five percentof the time, the river flow will not exceed the 500 ft3/s. A minimum water surfaceof El. 4181.5 is required in the diversion pool to provide the maximum diversionflow of 50 ft3/s.
c. Design dataThe diversion season is from approximately mid-March to mid-October. Canalflow and water surface elevation and depth at the fish screen were evaluated forthe existing canal and are shown in table 11.
Table. 11 – Canal flow versus water surface elevation
Screen flow
(ft3/s)1
Canal watersurface
elevation
Channelinvert
elevationChanneldepth (ft)
Bypassflow
(ft3/s)2
Totalupstreamflow4 (ft3/s)
Channelvelocity
(ft/s)
Sweepingvelocity5
(ft/s)
Wettedscreenarea (ft2)
Screenapproachvelocity
(ft/s)
506 4180.223 4176.33 3.89 4.66 54.66 0.69 0.65 128.5 0.39
45.67 4179.88 “ 3.55 4.26 49.86 0.69 0.65 113.4 0.40
39.68 4179.52 “ 3.19 3.83 43.43 0.66 0.62 98.20 0.40
Notes: 1. Determined by evaluating existing canal. 2. Bypass flow is based on bypass entrance velocity = 0.8 ft/s.3. Elevation 4180.22 is the high water mark in the canal.4. Total upstream flow is screen flow plus bypass flow.5. The sweeping velocity is based on the screen installed at a 20-degree angle.6. Maximum flow at high water mark in existing canal.7. Design flow.8. Flow at minimum allowable depth on drum screens.
The canal section properties are:
Upstream Downstream
Bottom width 10 ft 15 ftSide slopes (horizontal/vertical) 1.5:1 1.5:1Bank height 4.5 ft 4.5 ftLining Compacted earth Compacted
earth

Chapter VI. Fish Manual Case Studies
VI-37
River water surface profiles have been evaluated for a range of flows to ensurethat the fish screen facilities will operate for a range of river flows up to 500 ft3/s.
Debris – Trashracks will be located on the new headworks, and only minoramounts of small debris will enter the canal.
Sediment – Sediment deposition is expected to be minor, and deposits can beremoved during the non-irrigation season.
Access – Access to the screen structure will be along the canal O&M road.
Electrical power – Electrical power is locally available.
d. Fish screen structure design criteriaThe criteria listed below were agreed to by the Technical Advisory Group, whichconsisted of State and Federal agencies, the irrigation district, and the designers.
Irrigation district requirements:
< Base the screen design flow on existing canal capacity. It should be45.6 ft3/s (table11).
< Design the fish screen facility so that it is easy to operate and maintain.
< Don’t allow construction to interfere with canal operations. Construction in the canal can occur from mid-October through mid-March (5 months), which is the non-operating period.
< Locate the screens in the canal so that they will provide good accessfor O&M.
< Use drum screens because of the anticipated ease of O&M. The drumscreens will be 3 ft 6 inches in diameter and 12 ft long. These arestandard dimension screens that are available in the area. The drumscreens are self-cleaning, and, because of the small screen size,maintenance on the seals is not anticipated to be difficult.
e. NOAA Fisheries and State criteriaFishery – The screens should be able to protect salmon and steelhead juveniles assmall as fry (25 to 60 mm). At times during the irrigation season, the irrigationflows in several of the diversions on the river will be reduced and the flow in theriver will be increased (flushing flow) to help both upstream and downstream fishmigrations. If downstream river flows are too low to allow downstream fishmigration, the fish can be held in the canal for later release or captured in thebypass and trucked downstream.

Fish Protection at Water Diversions
VI-38
Screen structure – The screen structure should be placed in the canal as close tothe headworks as possible. This is to minimize the time fish are out of theirnatural environment and minimize potential predation. Orient the screen structureso that the sweeping velocity is greater than the screen approach velocity and fishare guided to the bypass entrance. Size screens for a maximum screen approachvelocity of 0.4 ft/s.
A uniform screen flow distribution must be provided. All structure surfacesexposed to fish shall be flush with the drum screens (piers and end walls). Themaximum exposure time shall not exceed 60 seconds. The flow depth on thedrum screens shall be maintained between 0.65 and 0.85 of the screen diameter. Provide a 6-inch lowered slab upstream from the fish screens if sedimentaccumulation is expected to be a problem. A downstream check structure will berequired to maintain the water level. The gates should be at least two drum screendiameters downstream from the screens.
Fish screens – The material for the drum screens shall be stainless steel wovenwire. The maximum opening shall be 3/32 inch. The minimum wire diametershall be 0.080 inch (14 gage) for rotary drum screens. Screen material shallprovide a minimum of 27 percent open area.
Bypass to river – The bypass will operate satisfactorily up to a 500 ft3/s river flowand at the minimum allowable channel depth (0.65 x screen height).
The bypass entrance shall meet the following requirements:
< The bypass entrance shall have independent flow control.
< The minimum bypass flow shall be 0.8 ft3/s.
< The velocity at the entrance to the bypass shall be equal to or greaterthan 1.1 times the upstream channel velocity or greater if possible.
< The entrance shall have ambient lighting.
< The invert of the entrance shall be at the same elevation as theupstream channel.
< Construction in the river can occur from late August to the beginningof March.
The bypass conduit shall meet the following requirements:
< The pipe shall be smooth.

Chapter VI. Fish Manual Case Studies
VI-39
< A 10-inch minimum pipe diameter is acceptable for a small diversion(attachment A.1.K).
< Bends shall be avoided, if possible.
< The pipe velocity shall be between a minimum 2.0 ft/s to a maximum10.0 ft/s.
Monitoring shall meet the following requirements:
< The Positive Integrated Transponder (PIT) tag detectors shall monitorjuvenile fish passage.
< A more extensive juvenile monitoring facility will be constructed atanother diversion site. The monitoring facility will provide for PIT taginstallation and detection, and juvenile sorting and counting.
< An adult monitoring facility will be constructed at a fish ladder atanother location. The fish ladder will include a viewing window,which will allow video monitoring.
f. Location of fish screen structureThe fish screens will be located in the canal downstream from the headworks andcurves (figure 110).
The existing canal will be realigned to provide as straight an approach channel aspossible at this site. For uniform approach flow conditions, it is desirable tolocate the fish screens approximately 40 times the canal water depth downstreamfrom the headworks or any bends.
Desired distance from curve to fish screens = 40 * 3.55 = 142 ft.
The upstream channel is 94 ft long and is straight except for a small curve(figure 110). Non-uniform approach flow should be anticipated at the fishscreens. It is anticipated that slide gates just downstream from the screens can beadjusted to provide a uniform flow through the fish screens. A physical modelstudy was not considered necessary.
g. Design of fish screen structure The fish screen facility (figures 111 and 112) will consist of the following:
< Fish screen structure and associated guide walls
< Transitions from the upstream canal and downstream trapezoidal canalsection to the rectangular fish screen structure channel
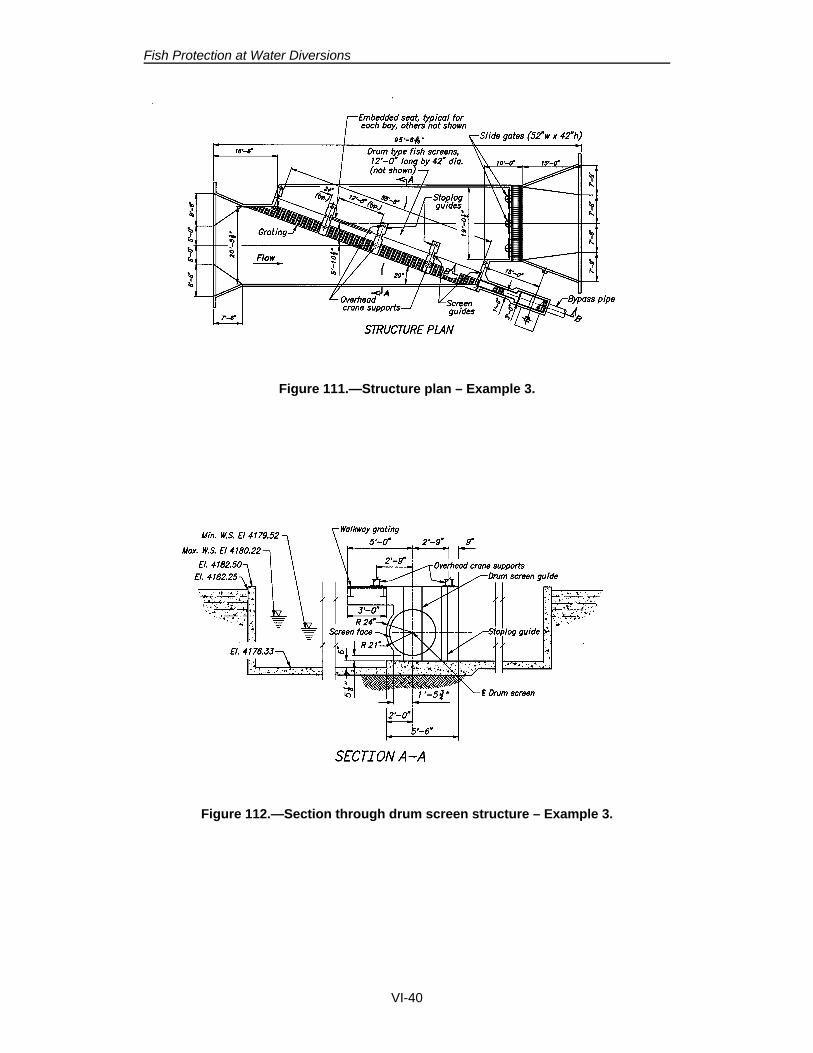
Fish Protection at Water Diversions
VI-40
Figure 111.—Structure plan – Example 3.
Figure 112.—Section through drum screen structure – Example 3.

Chapter VI. Fish Manual Case Studies
VI-41
< Fish screens – drum screens
< Overhead monorail to remove and replace the drum screens, etc.
< Grooves for installing adjustable stoplogs or baffles behind the fishscreens
< Fish bypass to the river including: the bypass entrance, the bypasspipe, and the outlet structure
< Three downstream slide gates for controlling the water level at the fishscreens
Fish Screen Structure – The fish screen structure (figures 111, 112, and 113) willconsist of the following:
< Foundation slab< Drum screens< Intermediate piers< Guide walls< Metal grating walkway< Monorail
Figure 113.—Section through bypass entrance – Example 3.

Fish Protection at Water Diversions
VI-42
The concrete slab under the fish screens is elevated 0.5 ft above the invert of theapproach channel to allow for sediment deposits.
The required net area of fish screens is the design flow divided by the maximumallowable approach velocity:
Net area = (45.6/0.4) = 114 ft2
The required area does not include structural support members. Structuralsupport members normally occupy 5 to 10 percent of the fish screen area. Forthis example, we will use 10 percent. Thus, the required gross area will be:
Ag = 126.7 ft2
The minimum length of the fish screens is obtained by dividing the required areaby the submerged screen depth. The depth on the fish screens at the design waterlevel is 0.75 * 3.5 = 2.625 ft. The required length of the fish screens is:
L = 126.7/2.625 = 48.3 ft
Four 12-ft-long drum screens were selected. During low flows, two of the screenscan be shutdown by placing stoplogs behind them.
An upstream channel width of 20.45 ft results in the hydraulic properties shownin table 11.
Vs/Va = 0.65/0.4 = 1.65, which is satisfactory because any impinged debris willbe carried over the drum screens and washed downstream.
With a sweeping velocity = 0.65 ft/s and a 55.72 ft length, the exposure time is:
Exposure time = 55.7/(0.65) = 86 seconds.
This is greater than the 60 seconds allowed by the criteria, and a variance will besought from the fishery resource agencies.
The walkway deck (steel grating) was set 3 inches above the canal bank elevation. The deck must be wide enough for access by maintenance personnel and istypically 3 to 4 ft wide. A deck width of 3 ft was selected (figure 112).
The deck is designed for dead loads and live loads.
Upstream and downstream transitions – At the upstream and downstream endsof the fish screen structure, there are transitions from the canal (trapezoidalchannel) to the rectangular fish screen structure channel. The transitions must be

Chapter VI. Fish Manual Case Studies
VI-43
sized and shaped to provide a non-turbulent transition of flow, without eddies. Toaccomplish this, the transition wall angle, at the flow line, should be 25 degrees orless. The upstream transition is 7.5 ft long, and the downstream transition is 15 ftlong and the water surface angles are 0 and 22 degrees, respectively, thus meetingcriteria. Cutoffs are provided to prevent undermining by scour and reduceseepage and piping of foundation materials. Riprap should be provided upstreamand downstream from the structure, as required, for scour protection.
Fish screens – The screen material will be woven wire with a maximum 3/32-inch opening. The screens will be fabricated from 6 mesh (6 wires/inch) –14-gage (0.08") wires with 27.2 percent open area. For durability, stainless steelwire will be used. The fish screen frames can be structural steel. Anodes may berequired for corrosion protection. Electric drive motors will be provided tocontinuously rotate the drums. Shear pins will be provided to protect the drivesystem. Seals will be provided on the bottom and sides of the fish screens. Lifting lugs will be welded to the frames.
Flow control – Three slide gates are provided in the canal downstream from thefish screens to control the water surface elevation at the fish screens at.65 – .85 percent of drum screen diameter. The slide gates can also be adjusted toaffect the flow distribution through the fish screens.
If necessary, baffles can be installed in the guides that are provided immediatelydownstream from the fish screens to obtain a uniform flow distribution along thescreens. The baffles will consist of stop logs similar to those shown in figure 11. The stop logs can be located off the bottom and spaced apart from each other toachieve the desired effect while allowing debris passage.
h. Fish bypassThe bypass consists of the entrance, the return flow channel, and the outletstructure.
Entrance – The bypass entrance is at the downstream end of the fish screens(figure 111). The entrance is initially 1.5 ft wide, which is adequate to pass trashand fish. At the downstream end, it widens to 3.0 ft for the over/under gate. Thebypass entrance velocity is 0.8 ft/s (greater than 1.1 x the upstream channelvelocity) and the bypass flow will range from 3.8 to 4.6 ft3/s, depending on thechannel depth (table 11). An over/under gate, installed in the downstream guides,will be used to control the bypass flow. The gate can be set to pass flow over thetop and flow and sediment underneath. The gate also acts as a drop structure forexcess head. The bypass channel is designed to allow a fish trap to be installedand allow PIT tags to be detected (figure 113). This is accomplished byembedding guides in the sidewalls so that a removable net and trap box (or otherequipment) can be inserted and removed.

Fish Protection at Water Diversions
VI-44
Bypass return flow channel – The bypass must be able to operate during the mostlimiting conditions, which occur during the high river flow (500 ft3/s) and adiversion flow (screen flow) of 45.6 ft3/s . Buried pipe will be used for the bypassto the river (figure 114). For economy and to keep fish moving, it is desirable tomake the diameter as small as possible. Head loss through the bypass systemmust be estimated and must not exceed available head. The selected pipediameter from the bypass entrance to the river is 12-inches. With a flow of 3.8 to4.6 ft3/s, the velocity will be 4.8 to 5.8 ft/s (which is within criteria). Polyvinylchloride (PVC) pipe is used for the bypass. The joints in the PVC pipe will haverubber gaskets.
Bypass outlet structure – The outlet structure is a concrete transition(figure 115). The following items must be considered in locating the outletstructure: the river flow velocity and depths, the possibility of future riverchanges such as degradation and changes in alignment, and sedimentation. Theoutlet structure is in a straight reach of the river that has a good river velocity. Also, the site is not subject to significant scour or sediment deposits. Riprap on asand and gravel bedding is placed about the structure to protect against scour.
I. Screen facility head loss estimateHead loss through the fish screen facility must be considered when designing thediversion dam and canal section.
For this example, the total head loss estimate will be assumed to be 0.3 ft. Thiswill account for baffling and minor screen plugging by debris.
Figure 114.—Fish bypass pipe profile – Example 3.
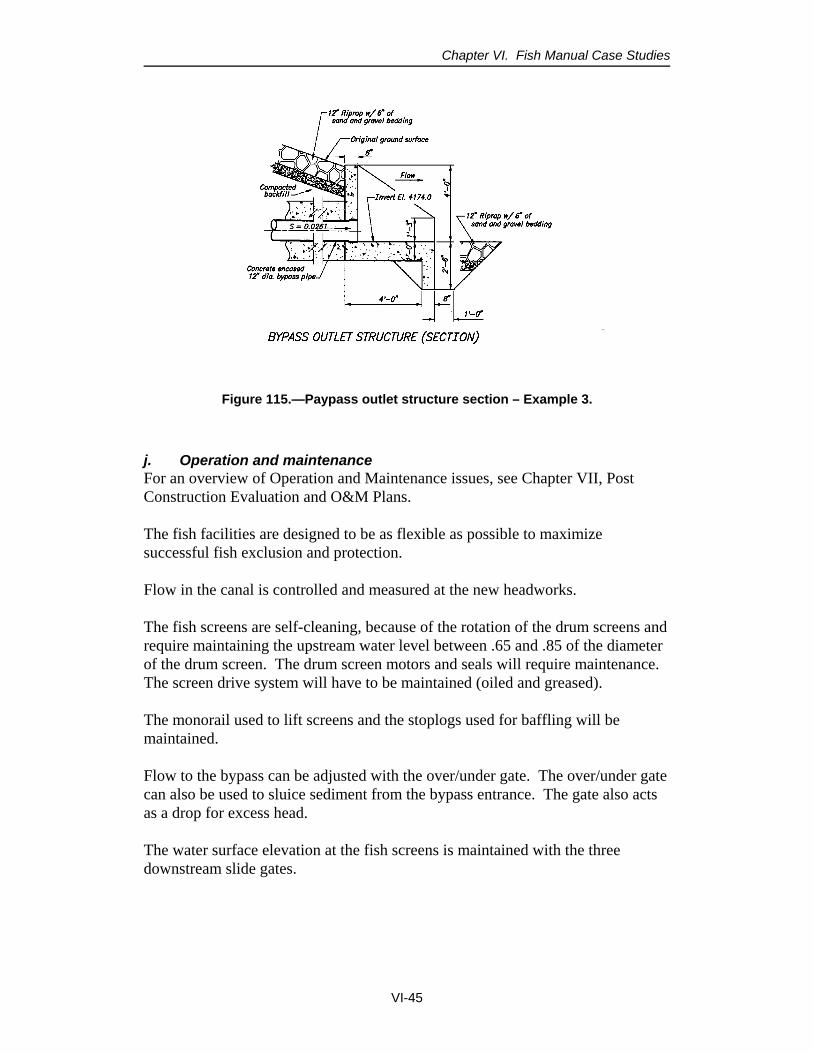
Chapter VI. Fish Manual Case Studies
VI-45
j. Operation and maintenanceFor an overview of Operation and Maintenance issues, see Chapter VII, PostConstruction Evaluation and O&M Plans.
The fish facilities are designed to be as flexible as possible to maximizesuccessful fish exclusion and protection.
Flow in the canal is controlled and measured at the new headworks.
The fish screens are self-cleaning, because of the rotation of the drum screens andrequire maintaining the upstream water level between .65 and .85 of the diameterof the drum screen. The drum screen motors and seals will require maintenance. The screen drive system will have to be maintained (oiled and greased).
The monorail used to lift screens and the stoplogs used for baffling will bemaintained.
Flow to the bypass can be adjusted with the over/under gate. The over/under gatecan also be used to sluice sediment from the bypass entrance. The gate also actsas a drop for excess head.
The water surface elevation at the fish screens is maintained with the threedownstream slide gates.
Figure 115.—Paypass outlet structure section – Example 3.

Fish Protection at Water Diversions
VI-46
At initial startup, velocity measurements should be made along the fish screens. Baffles can be installed to obtain a uniform flow distribution along the fishscreens.
Sediment deposits can be removed during the non-irrigation season when thecanal is unwatered.
PIT tags can be detected in the bypass entrance
4. Example 4 – Louver in Canal (Based on T&Y Canal andDiversion)
The diversion dam and canal are existing facilities. The T&Y Canal and 12 Mile Diversion Dam are located on the Tongue River, Montana, approximately20 miles upstream from the confluence of the Tongue River with theYellowstone River. A 10 ft-high concrete capped timber crib dam diverts up toa maximum discharge of 237 ft3/s from the river into the canal. The dam anddiversion include an overflow ogee weir and the canal headworks. A sedimentsluice structure was included to bypass sediments that will accumulate at theentrance to the headworks, which include vertical slide gates. The headworks arepositioned such that floating debris is largely sluiced over the dam ogee spillway. The dam and diversion are owned and operated by the T&Y Irrigation District. Liston et al., 1995, and Mefford et al., 1997, document, in detail, the fishexclusion and concept selection and design process.
The irrigation district has limited financial and labor assets. The districtrecognized that fish entrainment occurred at the diversion and, as a consequence,desired to add a fish exclusion structure to the diversion that would reduceimpacts on the Tongue River fishery. The diversion season extends from April toOctober.
a. FisheryThe fishery issues at the T&Y Diversion include both the impact of the diversionon the migration and habitat range of native fish in the Tongue River and the lossof fish to entrainment to the diversion canal. The dam is a barrier to upstreampassage of migratory Yellowstone River fish. These include the endangeredpallid sturgeon. The addition of a fishway that would allow upstream passage atthe dam might be considered at a later date.
As established in fishery surveys conducted by the Montana Department of Fish,Wildlife, and Parks and by the Montana Department of Natural resources andConservation (Backes, 1993; Clancy, 1980; and Elser, et al, 1977), approximately16 species of fish are present in the river reach above the diversion. These are thespecies that could be entrained in the diversion canal. None of these species is

Chapter VI. Fish Manual Case Studies
VI-47
listed as threatened or endangered. Present are sport fish species including rockbass, smallmouth bass, white crappie, channel catfish, and sauger. Supplementalstocking of juvenile (possibly 2.0-inch long) smallmouth bass and channel catfishhas been explored. Seasonal variations in fish species and fish sizes present at thediversion are not well documented. If, in the future, fish passage was added to thedam, the species of concern would be expanded. Adding passage would likelyincrease the need to exclude smaller juvenile fish from the canal because fishmigrations would occur during spawning.
In coordination with the Montana Department of Fish, Wildlife & Parks and withrecognition of the lack of endangered species, it was concluded that totalexclusion of all fish from the T&Y Canal was not required. It was decided that areasonable design should exclude a relatively high percentage (preferably a70 percent exclusion efficiency or higher) of fish that are 2 inches long or longer. It was also recognized that, if fish passage were added to the dam, high(approaching 100 percent) exclusion would be required for all fish 1 inch long orlonger. Since additional passage is possible, concepts that allow future retrofitmodifications to improve fish exclusion efficiencies should be considered.
No salmonid species were identified either above or below the diversion dam. Salmonids are the species for which most design criteria are available. Onlylimited criteria are available for non-salmonids that are the target species for thisdesign application. Existing non-salmonid data would have to be reviewed toselect criteria that would be applicable for this design.
b. Selection of preferred exclusion conceptThe primary screen options considered in the selection process were linear flatplate, drum, inclined screens, and louvers.
Linear flat plate, drum, and inclined screens meet the stated fish exclusionobjectives. However, their performance is sensitive to debris, sediment, and icefouling which could be a major factor at this site. Consequently, the maintenancedemands and the capital cost of a screen that complies with fishery resourceagency criteria would be greater than preferred. These screen concepts exceedproposed fish exclusion performance objectives for this site at this time.
Although not a positive barrier, louvers meet the current stated fish protectionobjectives except for a limited potential that debris and ice fouling will generatemoderate maintenance demands (maintenance demands will likely be less thanthat required for screen concepts). Where threatened and endangered species arepresent, louvers are not considered an acceptable means of fish protection byfishery resource agencies. However, the lower capital costs are in line with thedistrict’s capabilities.

Fish Protection at Water Diversions
VI-48
The flat plate screen and louver concepts were selected and conceptual designswere developed for the T&Y site. Cost estimates indicated that the louverstructure could be constructed for approximately $240,000 (1997 costs). Comparable cost estimates for the linear flat plate screen were approximately$340,000.
Noting that the louver concept is less affected by debris, sediment, and ice foulingand has reduced operations and maintenance demands as compared to thealternative flat plate screen concept and that a louver structure can be constructedfor a substantially reduced capital cost, the louver concept was selected fordevelopment. It was anticipated that a louver facility design could be developedthat would meet the stated fish exclusion objectives (70 percent exclusionefficiency or greater for fish that are 2 inches long or longer). A linear flat platescreen could be used as a retrofit (in place of the louvers) as a future upgrade, ifupstream fish passage is proposed at some future date for the dam.
c. River design data (diversion flows and associated water surfaceelevation data)
Data establishing the hydraulic characteristics of the site were collected anddeveloped through analysis and on site documentation. Hydraulic characteristicsof the site include:
< The Tongue River flow is significantly affected by snow melt, stormevents, and reservoir releases. The peak river flows occur in thespring (up to 1600 ft3/s) while river flows in the late summer and fallare typically low (fall minimum flow can be as low as 190 ft3/s).
< Pool water surface elevations just upstream from the dam are:
2448.4 with 200 ft3/s over the dam weir2448.75 with 600 ft3/s over the dam weir2449.0 with 1,000 ft3/s over the dam weir
< Diversion discharges range from 100 ft3/s to the design discharge of237 ft3/s.
< Water surface elevations in the first reach of canal (based on checkingthe existing canal):
2447.0 with canal flow of 250 ft3/s2446.8 with canal flow of 235 ft3/s2446.0 with canal flow of 150 ft3/s2445.4 with canal flow of 100 ft3/s
Chapter VI. Fish Manual Case Studies
VI-49
< Tailwater elevations below the dam vary between 2443.0 and 2439.0during most diversion periods.
The maximum allowable diversion is 237 ft3/s. The bypass operation will reducedelivered discharge accordingly. Thus, the fish facility operation will reducedeliverable discharge by up to 8.0 ft3/s.
d. Design of fish louver facilities/structureThe new fish louver facility consists of:
< Modification to the existing headworks
< A transition from the headworks section to the louver section
< Lined louver approach and exit channels that ensure consistentvelocity fields on both sides of the louvers, thus helping to maintain aconstant differential across the louver
< A diagonally placed louver with support structure
< Turning (straightening) vanes placed behind the louvers that preventexit velocity concentrations that could yield variations in differentialacross the louvers (figure 122)
< Open chute fish bypass to the river, including embedded guides thatallow placement of stoplogs for bypass flow rate control
e. Fish louver structure design criteria < The fish species present are rock bass, smallmouth bass, white crappie,
green sunfish, channel catfish, sauger, suckers, carp, shorted redhorse,and forage species.
< The louvers should exclude fish longer than 2.0 inches.
< The design flow through the louvers is 237 ft3/s; this flow may bediverted with an upstream river flow as small as 427 ft3/s (190 ft3/s isthe fall minimum streamflow below the diversion dam).
< During low river flow periods, the facility is operated without bypassflow (which maximizes the diversion). Periodically, in such waterperiods, fish have to be removed by netting from the zone ahead ofthe louvers and returned to the river.
< The diversion and louvers must operate effectively with river flows upto 1,600 ft3/s, which is the spring maximum flow.

Fish Protection at Water Diversions
VI-50
< The differential water level between the canal and the river,immediately downstream from the dam, varies as a function of riverflow and diversion discharge. With minimum streamflows below thedam, differentials will range from 6.4 to 7.8 ft, while with highstreamflows, differentials will range from 2.4 to 3.8 ft.
< Maximum louver approach velocity criteria are poorly defined for thefish species present at the T&Y diversion dam. Interpretation of table6, chapter V.A. of this report indicates that a maximum louverapproach velocity of 1.3 ft/s for bass and 0.9 ft/s for catfish may beappropriate. Lower approach velocities would be appropriate for otherweaker swimming species. Use 1.0 ft/s.
< Uniform approach velocities are required across the louver face.
< Sweeping velocity criteria are poorly defined for the fish speciespresent at the T&Y diversion. Interpretation of table 6 in chapterV.A. of this report indicates that sweeping velocities of up to 5.0 ft/sare appropriate for bass and 3.0 ft/s are appropriate for catfish. AtReclamation’s Tracy Fish Collection Facility, which also excludesmany non-salmonid species, 3.0 ft/s is the operating criterionmaximum.
< The invert of the louvers was positioned 1.0 ft above the canal invertto improve sediment sluicing and to generate a sill that would functionto guide bottom oriented fish directly to the bypass. Water depth onthe louvers ranges from 1.4 to 2.8 ft, varying with diversion discharge.
< Fish should be exposed to the louvers for no more than 60 seconds.
< The criteria for the bypass to river are:
− Entrance width – 2.0 ft
− Entrance velocity – Sweeping velocity or greater (up to 1.4 timessweeping velocity)
− Constructed as an open chute to allow easy access formaintenance
− Bypass channel (chute) velocities – 3 to 10 ft/s

Chapter VI. Fish Manual Case Studies
VI-51
< The criteria for the louvers are:
− Clear spacing between louver slats – 1.0 inch, figure 122 (basedon experience summarized in table 6, chapter V.A.)
− Slat size 2.5 inch by 3/16 inch, based on previous experience
− Slat orientation to flow – slats placed normal to approachchannel flow
− The louver line should be oriented at angles ranging fromparallel to 17 degrees to the channel flow (chapter V.A.). Thelouver face was placed at a converging angel of 15 degrees to theflow.
− Turning vanes were used behind the louvers to generate uniformapproach velocity distributions (chapter V.A.) and improvehydraulics through and past the louvers.
Although debris fouling will affect fish exclusion effectiveness, the woodymaterial does not greatly reduce louver open area and does not greatly increasehead loss. As a result, there is little need for emergency shutdown or louverbypass facilities. If flow is diverted from a highly biologically productive waterbody, fouling with aquatic plants could produce excessive head loss that couldrequire emergency shutdown or louver bypass operation. A trashrack will beincluded to prevent large debris from entering the headworks.
f. Location of louver structureThere are a number of reasons why the in-canal placement was selected. Thegravity diversion is made from an existing diversion dam and pool; therefore, in-river placement of exclusion facilities was not an option. Heavy sedimentdeposition within the diversion pool yields shallow depths within the pool thatwould require an extended fish exclusion facility if placed in the diversion pool. This would also require an extended flow guidance structure to generate sweepingflows across the fish exclusion facility. This structure would be costly. Inaddition, placement of the facility within the diversion pool would expose thefacility to severe sediment, debris, ice, and water loading. As a consequence,placement in the diversion pool was also eliminated as an option.
The canal, land surrounding the canal for several hundred feet below theheadworks, and access to the site are owned or controlled by the T&Y IrrigationCompany. As a result, property did not have to be acquired for fish facilityconstruction, fish bypass construction, construction staging, or access.

Fish Protection at Water Diversions
VI-52
The alignment of the existing canal with respect to the headworks was well suitedto generate uniform, well directed approach flow for the angled louver facility. Ashort distance downstream from the headworks, the canal turns approximately 6degrees away from the river. By using this 6 degrees with a 5-degreeconvergence of the louver into the flow, the required louver length could beplaced on a diagonal across the canal (figure 121).
An additional advantage of placing the louver structure immediately downstreamfrom the headworks is that this placement reduces the potential for predation. The placement also minimizes the required length of the fish bypass chutebecause the canal is close to the river.
g. Design and construction of headworks and canal reachDesign – The canal headworks and initial reaches of the canal were in disrepair. As a consequence, rebuilding the headworks and canal reach with specificconsideration of installation of the in-canal louver facility was necessary(figures 116 and 117). The developed headworks include three 3-ft-high by 5-ft-wide, manually operated slide gates. These gates can supply the maximumdiversion discharge of 237 ft3/s with approximately 0.5 ft of head differentialbetween the diversion pool and the canal. The headworks gates were alsopositioned across the full width of the canal to generate uniform channel flowconditions leading to the louver.
Figure 116.—Overview of T&Y Diversion with fish louver structure –Example 4 (T&Y Irrigation District).

Chapter VI. Fish Manual Case Studies
VI-53
Approximately 150 ft of canal immediately downstream from the headworks waslined with a concrete invert and vertical concrete walls (figures 116 and 118). This section of canal was configured to accept the louver fish exclusion structure. The canal data and section properties follow:
< Bottom width = 20 ft (downstream from the headworks to the louverstructure) 24 ft (downstream from the louver structure)
< Side slopes = vertical
< Maximum flow = 237 ft3/s
< Depth at 237 ft3/s (at louvers) = 3.8 ft
< Bank height = 7.0 ft
< Lining = reinforced concrete from the headworks past the louver
< Bottom slope = horizontal through louver structure
Figure 117.—Layout of T&Y Diversion Project – fish louver structure – Example 4(T&Y Irrigation District).

Fish Protection at Water Diversions
VI-54
< Velocity in canal at maximum diversion (at louvers) = 2.6 ft/s
< Operating season = April to October
The water surface is controlled by a downstream check structure and varies aspreviously noted.
Construction – The existing headworks structure was replaced with a newheadworks, flume, and fish exclusion facilities. The construction work wasaccomplished during non-operating periods from October to April. Therefore, acanal bypass to deliver diversion during construction was not required.
The concrete foundation for the replacement headworks includes upstream anddownstream cutoffs to prevent undermining of the headworks by scour and toreduce problems caused by seepage. In that a continuous wall and invert liningwas used in the reach of canal that includes the louver, cutoffs were not requiredin the foundation of the louver.
A sheetpile wall was placed across the intake channel to provide for dewateringthe headgate structure during construction. The sheetpile was initially installed toan elevation of 2454.0 (figures 117 and 118). When construction was completed,a 35-ft notch was cut to elevation 2446 in front of headworks entrance. Because
Figure 118.—T&Y Diversion Dam trashrack structure – Example 4 (T&Y IrrigationDistrict).

Chapter VI. Fish Manual Case Studies
VI-55
the sheetpile is 2 ft above the headgate invert, it will serve as a weir across theintake channel. This should reduce sediment entrainment at the headworks. A24-inch low-level sluice has been placed adjacent to the headgate structure infront of the trashracks (figures 117 and 121).
Louver support structure – The louver support structure consists of a steelsupport frame placed on the concrete slab canal invert lining (figures 119, 120,121, and 123). The louver face is vertical and retained by bolting louver panels tothe support frame. The louver panels form a continuous louver face that is notbroken by structural members that could collect debris, injure fish, or disrupt fishguidance along the louver. A foot bridge is included with the support structure toallow access to the full length of the louver face for maintenance and inspection. The invert of the louvers was positioned 1.0 ft above the canal invert to improvesediment sluicing and to generate a sill that would function to guide bottomoriented fish directly to the bypass (figures 117 and 121).
Louvers – As summarized in the presentation on criteria, the 90-ft-long louverline was installed in a section in which the maximum occurring sweeping velocitywould be 2.6 ft/s. Based on the maximum diversion discharge and thecorresponding active louver face area, the maximum approach velocity to thelouver is approximately 1.0 ft/s. This velocity complies with the experienced-based criteria.
This sweeping velocity yields a 35 second exposure time for fish passing alongthe 90-ft-long louver face.
Again, relying on experience-based criteria, the 2.5-inch by 3/16-inch louver slatswere set with a 1.0-inch clear spacing between slats. The slats were orientednormal to the approach flow (figure 122).
To minimize costs, the louvers were fabricated from coated steel. Each louverpanel is 5 ft high by 10 ft long (figures 120 and 122). This positions the top of thelouvers approximately 2 ft 2 inches above the maximum water surface elevationand at the same elevation as the walkway deck. This height allows the louvers tobe manually raked to the walkway.
The louvers could have been either bolted to the support frame or placed inguides. Placing the louvers in guides facilitates removal and replacement;however, it also increases facility cost. For this facility, the louver panels werebolted to the support structure (figure 120). Removal of panels would beaccomplished using a mobile crane. The louver structure is unwatered from mid-fall to mid-spring. Unwatering allows convenient access for maintenance,including debris and sediment removal.

Fish Protection at Water Diversions
VI-56
Figure 119.—View looking upstream at the T&Y louver placed at an angle to thecanal flow – Example 4 (T&Y Irrigation District).
a. Flow is from left to right through thelouver.
b. View through support structure onbackside of louvers.
Figure 120.—Louver structure setting on 1-foot curb – Example 4 (T&Y IrrigationDistrict).

Chapter VI. Fish Manual Case Studies
VI-57
Figure 121.—Schematic layout of T&Y Diversion Project – Example 4 (T&YIrrigation District).
Figure 122.—Louver structure detail – partial plan – Example 4(T&Y Irrigation District).

Fish Protection at Water Diversions
VI-58
Turning vanes – Turning vanes were placed directly behind the louver array toturn the flow that has passed through the louvers and direct it down the canal(figure 122). This treatment maintains a uniform velocity field on the back sideof the louvers. The turning vanes assist in generating uniform approachvelocities across the louvers without the need for refined analysis anddevelopment of hydraulic flow distributions in the approach and exit channels(figure 97) (chapters IV.A.6. and V.A.).
Louver facility head loss estimate – Assumed louver head losses range from 2 to4 times the channel velocity head (chapter IV.A.5. and 8.) which yields estimatedlosses of 0.3 to 0.6 ft of water at the maximum diversion. These head lossesresult from the effect of both the louvers and the turning vanes.
h. Fish bypass channelA 2-ft-wide bypass channel is placed at the downstream end of the louverstructure. The open chute bypass allows natural light and allows convenientaccess for cleaning. The 2-ft-wide channel will produce excessive bypass flow aswell as excessive exit velocities if not restricted. Control is achieved using stoplogs placed in a guide placed immediately downstream from the fish bypassentrance (figure 124). Stoplogs have to be adjusted with changing diversionflows and flow depth to supply adequate control and allow continued bypass flow
Figure 123.—Louver and walkway. Note river on the left and canal downstreambeyond the louver – Example 4 (T&Y Irrigation District).

Chapter VI. Fish Manual Case Studies
VI-59
for various river conditions. The bypass channel produces exit flow velocities inthe range of 3 to 10 ft/s. The bypass flow, normally less than 8.0 ft3/s, returns tothe river in a distance of approximately 30 ft.
Debris and cleaning – Debris loading varies seasonally and includes heavyloading of floating debris during the high-river-flow events (the headworks designtends to exclude most floating debris), loading with water logged woodymaterials, and limited loading with aquatic plants and leaves (in the fall). Atrashrack is included upstream from the gate structure when the replacementheadworks structure was built (figures 116, 117, and 118). The trashrackcombined with sluicing action generated by the overflow weir effectively sluicesmost floating debris away from the headworks and over the ogee weir. Thissluicing is optimized by the close placement of the headworks to the weir and thetangential orientation of the trashrack to the weir approach flow. The primarydebris management problem at the site is associated with the smaller, water-logged, woody materials that are embedded in the deposited sediment upstreamfrom the dam. In the mid to late summer, streamflows decrease and, thus, thesluicing action generated by the overflow weir is reduced. However, irrigationdiversion demands during this time are high. Headcutting occurs in the sedimentin the diversion pool, and as a result, sediment and water logged materials aretransported into the canal. The water-logged materials may become wedgedbetween the louver slats and making cleaning difficult. Manual removal (raking)of this debris has been required.
Facilities for Emergency operation due to potential louver plugging – Althoughwoody debris accumulation on the louver has proven to be a problem that mayadversely influence fish exclusion performance, the louver maintains diversioncapacity even when fouled with woody debris. Consequently, emergencyoperations have not been required at the site.
Figure 124.—Section through bypass outlet – Example 4.

Fish Protection at Water Diversions
VI-60
Sediment management – Heavy bedload sediment is transported in the river,particularly during high flow events (primarily in the spring). As a result,sediment deposition in the diversion pool is near the elevation of the overflowweir crest. A sediment sluice was included with the replacement headworks(figures 117 and 121). Operating this sluice during high river flow events willhelp reduce sediment deposition at the headworks. Because of limited river flow,the sluice cannot be routinely used during late summer. Consequently, sedimentwill be diverted into the canal as sediment head cutting occurs in the diversionpool. The louver structure was constructed with the louvers placed on a 1.0 fthigh concrete sill (figure 120). This sill elevates the bottom of the louver abovethe floor of the approach channel and functions to direct bedload sediment alongthe louver and to the fish bypass, which also functions as a sediment sluice. Louvers can also effectively pass suspended sediment and are less sensitive tosediment influences than positive barrier screens.
Ice loading – Icing can occur in both the spring and fall, particularly near the startand end of the irrigation season. Although severe icing conditions are typicallynot anticipated, icing might be sufficient to yield fouling of fine mesh screens. Snow and ice will accumulate in the canal during the winter. Because of potentialice damage, winter screen removal is likely.
I. Post construction adjustments and testing Post construction evaluations of the louver facility performance were conducted. Operation of the facility has proven generally effective. Debris is manuallyremoved from the louvers. Evaluation of fish exclusion performance by theMontana Department of Fish, Wildlife and Parks has shown approximately90 percent effectiveness in keeping fish out of the canal.
Options available for modification of hydraulic operation of the T&Y louverstructure were limited to adjustment of louver approach flow distribution betweenthe three slide gates of the headworks and placement of stop logs in the bypassstructure to modify bypass flow rates and bypass velocities. The turning vanes(positioned behind the louvers) are not adjustable, and experience has shown thatadjustment of the turning vanes will not be required. Figure 119 shows a viewlooking upstream at the louver structure and walkway.
5. Example 5 – Cylindrical Screening Facility (Based on ColumbiaRiver Pumping Plant, Oregon)
This example presents a cylindrical screening facility located in a river/diversionpool with an on shore pumping plant. The screening and pumping plant facilitiesare a key feature in a project to restore salmon runs and enhance steelhead fishingin the Umatilla River (Reclamation, 1994). The Columbia River Pumping Plant,part of the Umatilla Basin Project, delivers water from Lake Wallula to the

Chapter VI. Fish Manual Case Studies
VI-61
Columbia-Cold Springs Canal, which then transports the water to Cold SpringsReservoir. The pumping plant will pump approximately 40,800 acre ft of waterannually (240 ft3/s plant design capacity) from the Columbia River. This waterwill replace water previously diverted by two irrigation districts from theUmatilla River. These previous diversions from the Umatilla River will beeliminated to meet target flows for fish passage.
a. FisherySpecies – Salmon and steelhead
Size – Fry, fingerlings, and larger
Move downstream – Critical time for screening is from late April throughmid-July
Swimming – The fry generally drift with the current and have little strengthand endurance to swim against the current. Fry occur throughout the watercolumn.
b. Reservoir/river design dataThe water surface of Lake Wallula is controlled by McNary Dam and theupstream dams in the Columbia River system. The fish exclusion facilities forthis pumping plant must be able to operate satisfactorily at the following watersurface elevations and conditions of Lake Wallula:
< Maximum water surface: El. 341.0 (all elevations in ft mean sea level)< Normal reservoir operating range: El. 337.0 to El. 340.0< Minimum water surface: El. 335.0 < Daily fluctuations could be as large as 2 ft< Severe wind and boat wave action can be expected (up to 6 ft high)
c. Design dataConstruction – No in-river work including operation of equipment can beperformed in the active flowing stream between April 1 and November 30, unlessotherwise coordinated with the Division of State Lands and Oregon Departmentof Fish and Wildlife.
Sediment – Sediment deposition is expected to be minor.
Debris – During the months of April and May, tumbleweeds are blown into theriver, become saturated, and sink and move along the lake bottom. Thetumbleweeds are not expected to be a problem with blocking the screens. In Juneand July, increasing amounts of Eurasian water millfoil (yew plant) have beenfound in small clumps floating down the river toward McNary Dam.

Fish Protection at Water Diversions
VI-62
Pumping plant design capacity – The pumping capacity for the Columbia RiverPumping Plant was based on an operations study conducted in Reclamation’sPacific Northwest Region. The studies determined that the canal needs to be ableto deliver an average of 220 ft3/s in any given month. The design pumping plantcapacity was then increased to 240 ft3/s to account for allowances of minorseepage losses and for operational flexibility to permit down time for poweroutages, routine maintenance, and emergency repairs.
Site layout – The visual and audio impacts on the surrounding area need to beconsidered in the site design, both on river and off river. Extensive landscaping isrequired to help reduce the impact of the plant on the surrounding area. Electricalpower is available in the general area and can be extended to the fish screenfacilities. The electrical equipment for the switchyard will be provided byUmatilla Electric. A short access road to the site will be required off an existinghighway. Five different geologic reports on sites close to or at the pumping plantsite were provided for use in preparing the designs and specifications for theColumbia River Pumping Plant.
d. Fish screen structure design criteria The criteria were agreed to by a group consisting of State and Federal agencies,the water districts, and the designers. Design criteria for the fish screen structureare based on juvenile fish screening criteria of the NOAA Fisheries northwestdivision. Note that the plant was designed in 1991 and 1992; at that time, NOAAFisheries screen criteria for juvenile salmonids were slightly different from theircurrent criteria. (See the current criteria in attachment A.)
Fishery< Fish species – The fish species are salmon and steelhead.
< Fish size – The screens should be able to safely exclude fish as smallas fry (25–60 mm).
Screen structure< Positive barrier screens are required.
< The preferred screen location is in the river.
< Generally, the screen face should be parallel to the river flow.
< The screened intakes should be offshore to minimize fish contact withthe facility.

Chapter VI. Fish Manual Case Studies
VI-63
< The screened intakes should be in areas with sufficient sweepingvelocity to minimize sediment accumulation in or around the screenand to facilitate debris removal and fish movement away from thescreen face.
< The screens should be sized for a screen approach velocity not toexceed 0.40 ft/s.
< The screen approach velocity should be uniform across screens.
Fish screens< The screen material should be corrosion resistant and sufficiently
durable to maintain a smooth uniform surface with long term use.
< For profile bar (wedge or “Vee” wire) screen, the narrowest dimensionin the screen openings (slot opening) should not exceed 0.125 inch inthe narrow direction (old criteria).
< Screen material to provide a minimum of 27 percent open area.
< Fish screens should be cleaned as frequently as necessary to preventaccumulation of debris. The cleaning system and protocol must beeffective, reliable, and satisfactory to NOAA Fisheries. Provencleaning technologies are preferred.
e. Location of Fish screens and pumping plantAn in-river location of the fish screen structure with fixed cylindrical screens andan off-site pumping plant were chosen (Reclamation, 1995). Some of the reasonsfor this selection were:
< This screen allows the fish to stay in the river.
< With this in-river structure, fish bypasses would not be required.
< Sediment deposition is not a problem.
< Trash will remain in the river and will not have to be removed andtrucked away.
< Since the screens are always submerged, icing and visual impacts arereduced.
< Air burst cleaning systems are a proven technology for cleaningcylindrical screens.

Fish Protection at Water Diversions
VI-64
< It was determined that the screen and intake piping could be installedin the wet, on piles, thus reducing the cofferdam and dewateringrequirements.
< An off site pumping plant reduces concerns with visual and soundissues.
< With the intake conduit extending to the pumping plant sump,entrapped air can be vented before the flows reach the pumps.
f. Design of Fish screen structures (figure 80)The fish screen facility will consist of:
< Intake screens (cylindrical tee screens)< Concrete piles< Intake pipes< Intake conduit (concrete box culvert)< Air burst cleaning equipment< Pumping plant, discharge piping and valves, flowmeter, and spherical
air chamber
Fish screen intake – Cylindrical fixed screens were chosen to allow mounting thescreened intake offshore, in the river, and below the water surface. This type ofscreen is a positive barrier screen. The screens prevent entrainment of fish andaquatic organisms in three ways. First, the 0.125 inch wide screen slots preventthe entry of small fish. Second, the surface area and net-through-the-screenopenings are designed so the screen approach velocity does not exceed 0.40 ft/s. And finally, the cylindrical design creates a small cross-sectional target, thus,reducing the time (or the likelihood) that fish may be exposed to the cylindricalscreens.
The cylindrical screen manufacturers recommend that the through-slot velocity benot greater than 0.5 ft/s. For this case, the through-slot velocity requirement willgovern the sizing of the screens because it will give a smaller screen approachvelocity than the maximum allowed by the fish resource agency’s criteria.
Vapproach = Vthrough slot x Screen percent open area
Assuming: Vthrough slot = 0.5 ft/s and the maximum screen slotopenings = 0.125 inch.

Chapter VI. Fish Manual Case Studies
VI-65
From the screen manufacturers products data sheets: The screen percent openarea is approximately 64 percent for 0.125" slot openings and their standard(wedge or “Vee”) wire. Therefore, the maximum screen approach velocity usedfor sizing the screen is:
Vapproach = 0.5 ft/s x 0.64 = 0.32 ft/s (this is less than the fish resourceagencies allowed maximum approach velocity of 0.40 ft/s)
The required screen area (Arequired) is equal to the flow (Q) divided by the screenapproach velocity (Vapproach). So the required screen area is:
Arequired = Q/Vapproach = (240 ft3/s)/(0.32 ft/s) = 750 ft2
The manufacturers of fixed cylindrical screens recommend that the bottom of thescreen be at least half a screen diameter above the lake or river bottom and thatthe top of the screen be at least half a screen diameter below the minimum watersurface. (They also recommend checking navigational requirements.) At thissite, the centerline of the cylindrical screens was set at El. 328.17 to be abovesediment deposition and the potential for bottom submerged tumbleweeds, and tobe as high as possible to limit excavation requirements to the pumping plant. This placed the centerline of the screens approximately 18 ft above the lake/riverbottom (silt) and 6.83 ft below the minimum water surface.
Eight 60-inch diameter cylindrical tee screens, each sized for 30 ft3/s flow, werechosen after looking at the screen manufacturers’ product data sizing charts andsheets (recommended screen size based on percent open area and flow in gallonsper minute). This size of screen provided at least 52 inches of submergenceabove the top of the screen at the minimum water surface. Larger diametercylindrical tee screens were available in the catalogs (up to 84 inch), but were notselected since they are fabricated in a less streamlined assembly. Each screencontains a 42-inch diameter flanged outlet connection, a 6-inch diameter flangedconnection for the air supply piping for the air burst cleaning system, and an airburst distribution pipe within the screen (figure 31). (Note that the constructionspecifications need to clearly indicate the installed position of the screens so thatthe screen manufacturer can properly position the internal air distribution pipingand nozzles within the screens.) The screens will be fabricated from 304 stainlesssteel and will use profile bar (wedge wire or “Vee” wire) with 0.125 inch slotopenings. (See figure 51.) The screens were specified to withstand a differential hydrostatic collapse load of 18 ft of head without damage to the screen.
The configuration and spacing of the screens and intake piping are designed tobalance the flow of the intake water and to allow silt and debris to flow awayfrom the screens during the air burst cleaning operation. Each cylindrical screenis bolted to a 42-inch-diameter pipe. These pipes tee into 54-inch-diameterheader pipes, which tee into two 72-inch-diameter steel intake pipes. These larger

Fish Protection at Water Diversions
VI-66
pipes will convey the intake flows to a single, rectangularly shaped concrete boxculvert (10-ft-wide by 7-ft-high conduit). (See figure 80.) The screens areinstalled so that their centerlines are parallel with the river flow. The twobranches of screens are offset from each other so the centerlines of the installedscreens are not directly in line with the centerlines of the other branch of screens. This reduces the potential for fish to be exposed to the full line of screens. Thebox culvert conveys the flow to the pumping plant sumps and allows venting ofentrapped air before the flows reach the pump bowls. The differential pressurethat drives the flows through the screens is caused by the difference between thelake elevation and the sump elevation of the pumps. The minimum operatingwater surface at the pumping plant sumps is El. 333.0.
The submerged cylindrical tee screens and the intake steel piping will besupported on concrete piles, thus, allowing installation in the wet without acofferdam. (See figures 31 and 80.) Saturated alluvium overlaying basalticbedrock will be encountered during drilling operations of the offshore piles. Braces on the intake support structures will be installed underwater and mayrequire some excavation. The intake steel pipes will be designed to span thedistances between the piles and the box culvert. The intake pipes and the air-burst supply piping will be assembled underwater. Insulating gaskets, sleeves,and washers are installed between the mating flanges and bolt surfaces of both the 42-inch flanges and the 6-inch air burst flanges to prevent galvanic corrosioncaused by contact of dissimilar metals.
Pumping plant – A cofferdam and dewatering system will be required to allowconstruction in the dry of the intake concrete box culvert and the pumping plant. The groundwater table in the pumping plant area closely reflects the level of LakeWallula. The concrete box culvert was chosen to reduce costs over extending theintake steel pipes all the way to the pumping plant (recommended proposal duringthe value engineering study). The pumping plant is an outdoor plant. The spacerequirements of the pumps controlled the layout of the pumping plant. The depthof the plant was set by the submergence requirements of the pumps. The pumpsare situated to equalize the size of the sumps to the maximum extent possible. Most of the pumping plant and the discharge valves are located below the serviceyard elevation to reduce the overall visual impact of the plant. Berms wereprovided around the plant to visually screen the pumping plant and tosimultaneously screen pumping plant sounds from adjacent properties. An airchamber was required to prevent water column separation in the discharge line. Stoplog guides were also included at the pumping plant entrance to allowisolation of the pumping plant from the river, if required.
Screen cleaning system – The screens are cleaned by bursting air to flush debrisand organisms from the screens without removing this material from the water. (See figure 82.) A separate 6-inch air supply line will connect to each screen to

Chapter VI. Fish Manual Case Studies
VI-67
allow cleaning one screen at a time. This also reduces the size of the air burstcleaning equipment required. The air burst cleaning equipment will be at thepumping plant and consists of:
< one air compressor< one horizontally mounted air receiver tank< one set of actuator air supply controls< eight butterfly valves and actuators
The size of the air receiver tank (Vr) and the pressure (Pr) required for the airburst system were based on the following equation:
Vr x Pr = 3 x [Ps x (Vs + Vp)]
Where Vr = receiver tank size in ft3
Pr = receiver tank pressure in lb/ft2
Ps = pressure above screen centerlineVs = volume each screenVp = volume air supply line
Max. water surface = El. 341 ft Centerline fish screen = El. 328.17 ft
Volume each screen, Vs = 334 ft3 (cross sectional area of screen timesscreen length)
Volume air supply line, Vp = 50 ft3 (cross sectional area of pipe times pipelength)
Pressure above screen centerline, Ps = [(341 – 328.17) x 0.434 psi/ft] +14.7 psi = 20.3 psi
Therefore, Vr x Pr = 3 x [Ps x (Vs + Vp)] = 3 x [(20.3) x (334 + 50)] = 23,386If try Pr = 150 psi, then Vr = 23,386/150 = 156 ft3 = 1167 gallons
Based on these calculations, an air burst pressure of 150 pounds per square inchand a receiver tank size of 1,200 gallons were selected. The size of the aircompressor was then chosen (72 cfm minimum displacement at 150 psi dischargepressure) based on the operating pressure, air receiver tank size, and the desiredcleaning cycle time of the screens.
The time required to charge up the air receiver tank can then be determined. Firstfind the required inlet volume (V1) by using the following equations.
V1 x P1 = Vr x Pr or V1 = (Vr x Pr)/P1

Fish Protection at Water Diversions
VI-68
Then divide this calculated inlet volume by the air compressor displacementcapacity to get the time (T) required to pressurize the air receiver tank to thedesired pressure.
So, given that the receiver tank capacity is: Vr = 1200 gallon (160.4 ft3), thereceiver tank is to be pressurized up to Pr = 150 psi, the inlet air pressure isP1 = 14.7 psi, and the compressor displacement capacity is 72 ft3/minute (cfm). Therefore, the inlet volume required is:
V1 = (160.4 x 150)/14.7 = 1636.7 ft3,
and the time to charge up the receiver tank is:
T = 1636.7/72 = 22.7 minutes.
So, it will take approximately 23 minutes to pressurize the air receiver tank toclean one screen and approximately 200 minutes to clean all eight screens.
The air burst cleaning system can be manually or semi-automatically operated. Full automation was not desirable at this site, mainly because of boating in thearea.
Differential water level controls are provided to monitor the differential waterlevel across the screens. One sensing element will continuously measure thewater surface elevation of Lake Wallula and the other sensing element willcontinuously measure the water level in the pump sump. When the difference inthese water levels meets or exceeds a preset point, an alarm will be initiated toindicate that the screens have reached an unsatisfactory level of plugging. Thissystem is designed to allow for future remote monitoring. Additional monitoringof the water surface in the pumping plant intake sump will be provided and willinitiate a low water alarm and shutdown of the pumps if the water level in thesump goes below the minimum sump water level.