Embed Size (px)
Citation preview

_____________________________________________________________________________________________________ *Corresponding author: E-mail: [email protected];
International Journal of Biochemistry Research & Review 29(8): 42-54, 2020; Article no.IJBCRR.58683 ISSN: 2231-086X, NLM ID: 101654445
Characterisation and Hypolipidaemic Activity of Phenylquinoline, and Narceine Isolated from
Ficus polita Leaf
A. Nasir1*, M. S. Sule2, A. J. Alhassan2, M. K. Atiku2, Y. Y. Muhammad2, A. Idi2, I. U. Muhammad3, A. I. Yaradua1, K. I. Matazu1 and M. B. Isah1
1Department of Biochemistry, Faculty of Natural and Applied Sciences, Umaru Musa Yar’adua
University, P.M.B. 2218, Katsina, Nigeria. 2Department of Biochemistry, Faculty of Basic Medical Sciences, Bayero University, P.M.B. 3011,
Kano, Nigeria. 3Department of Medical Biochemistry, College of Medical Sciences, Yobe State University Damaturu,
Yobe, Nigeria.
Authors’ contributions
This work was carried out in collaboration among all authors. Authors AN, MSS and AJA designed the study, performed the statistical analysis, wrote the protocol and wrote the first draft of the manuscript.
Authors MKA, YYM, AI, IUM, AIY, KIM and MBI managed the analyses of the study and literature searches. All authors read and approved the final manuscript.
Article Information
DOI: 10.9734/IJBCRR/2020/v29i830211
Editor(s): (1) Dr. Mudasir Hafiz Khan, Sher-e-Kashmir University of Agricultural Sciences and Technology, India.
Reviewers: (1) Rahul Kumar, IIT Delhi, India.
(2) C. Isac Sobanaraj, The Maharaja Sayajirao University of Baroda, India. Complete Peer review History: http://www.sdiarticle4.com/review-history/58683
Received 10 May 2020 Accepted 15 July 2020
Published 04 August 2020
ABSTRACT Aim: To evaluate hypolipidaemic potentials of column chromatography fractions (F1 to F6) of the chloroform leaf extract of Ficus polita and to detect the bioactive compounds present in the most active fraction using spectroscopic techniques. Study Design: Fourty-five (45) wistar rats were grouped into nine groups of five rats each: normal control, hyperlipidaemic control, hyperlipidaemic administered with standard drug control/ atorvastatin (10 mg/kg body weight), and hyperlipidaemic administered groups administered with 50 mg/kg body weight of column chromatography fractions (F1, F2, F3, F4, F5, and F6) for a period of two weeks.
Original Research Article

Nasir et al.; IJBCRR, 29(8): 42-54, 2020; Article no.IJBCRR.58683
43
Place and Duration of Study: Department of Biochemistry Laboratory, Faculty of Basic Medical Sciences, Bayero University Kano, Nigeria, from May 2018 to April 2019. Methodology: Chloroform leaf extract of F. polita was fractionated by using column chromatography, and the resulting fractions were pooled, based on their retention factor (Rf), into six (6) fractions by using analytical thin layer chromatography. The resulting six (6) fractions were screened for hypolipidaemic activity. Serum total cholesterol (TC), triglycerides (TG), high density lipoprotein-cholesterol (HDL), and low density lipoprotein cholesterol (LDL) were determined. The rats treated with the best fraction in terms hypolipidaemic activity (fraction 3) were screened for serum HMG Co A reductase, lactate dehydrogenase (LDH), creatine kinase (CK) activities, as well as troponin I level. Oxidative stress markers such as malondialdehyde (MDA), reduced glutathione (GSH), superoxide dismutase (SOD), and catalase (CAT) were determined in the heart tissue homogenate of the rats treated with fraction 3. Results: Fraction 3 treated hyperlipidaemic group showed significant (p<0.05) decrease in the levels of serum TC, TG, and LDL, but significant (p<0.05) increase in the level of serum HDL. Fraction 3 (F3) treated hyperlipidaemic groups showed significant (p<0.05) decrease in the activity of serum LDH and the level of troponin I, but significant (p<0.05) increase in the activity of serum HMG Co A reductase. After high fat diet administration, the level of heart tissue antioxidant markers such as GSH, SOD and catalase were decreased whereas the level of heart tissue MDA was elevated. The level of these antioxidant markers were brought to normalcy by fraction 3 (F3). Histological studies of the heart corroborated the biochemical findings, and treatment with fraction 3 (F3) was found to be effective in restoring dietary-induced myocardiac toxicity in rats. FTIR and GCMS analyses were carried out for the detection of bioactive compound(s) in fraction 3 (F3), and the result revealed the presence of "8-methoxy-4-phenylquinoline, and narceine. Conclusion: The study concludes that; the hypolipidaemic property of the leaf of F. polita is mediated by the bioactive compounds "8-methoxy-4-phenylquinoline, and narceine." via their antioxidant properties.
Keywords: Hypolipidaemic; Ficus polita; leaf; hyperlipidaemia.
1. INTRODUCTION Hyperlipidaemia is a heterogeneous group of disorders characterised by high level of lipids in the bloodstream. The lipids include cholesterol, cholesterol esters, triglycerides, and phospholipids. Lipids are transported in the blood as large 'lipoproteins'. Otherwise, the disease refers to elevated levels of lipids and cholesterol in the blood, or manifestations of different disorders of lipoprotein metabolism (dyslipidemia) [1]. An elevation of plasma lipids may primarily be due to genetic defect or secondarily to diet, drugs or diseases [2]. Plants had been used for medicinal objectives long before recorded history [3]. Despite enormous development in the field of conventional medicines during the 20th century, plants still remain one of the main sources of drugs in both modern and traditional system of medicine [4]. Ficus polita, also called Fig tree, is one of the Ficus species belonging to the family Moraceae. Ficus polita trees are always distinguished by their characteristic root growing from the
branches and a common homestead tree in Nigeria grown to provide shade around houses [5]. Locally, it is called durumi in Hausa. Traditionally the fruit and young leaf are chewed for dyspepsia. The bark and roots infusions are used in treatment of infectious diseases, diarrhoea, abdominal pain, like many of the species of Moraceae family [6]. The increase in prevalence of hyperlipidaemia is on frightening rate worldwide. Numerous findings have revealed strong relationship between hyperlipidaemia, cardiovascular diseases (CVD), atherosclerosis [2], and other metabolic syndromes including obesity, type 2 diabetes mellitus to mention a few [7]. Moreover, hyperlipidemia has been rated as one of the leading risk factors contributive to the prevalence and severity of coronary heart disease. Coronary heart disease, arthrosclerosis, stroke, and hyperlipidemia are the primary causes of death worldwide [4]. Several of the genus Ficus have long been used in both ethnobotanical and pharmacological

Nasir et al.; IJBCRR, 29(8): 42-54, 2020; Article no.IJBCRR.58683
44
studies as antioxidants, antidiabetic, anticancer, anti-inflammatory, and antimicrobial drugs [8]. Many of these biologically active lead compounds, from herbal drugs, are yet to be formulated as modern medicines, even though they have been acclaimed for their therapeutic properties in traditional medicine [9]. Furthermore, there are little studies on purification, isolation, and identification of bioactive phytochemicals responsible for hypolipidaemic activity from Ficus polita plant. This study may, therefore, provide an insight into the scientific basis regarding the use of this plant in the management of hyperlipidaemia. The research work was aimed at evaluating the hypolipidaemic properties of column chromatography fractions of the chloroform leaf extract of F. polita on Wistar Rats.
2. MATERIALS AND METHODS
2.1 Materials 2.1.1 Chemicals and reagents All chemicals and reagents, used in the research, are of analytical grade. 2.1.2 Study animals Wistar albino rats of both sexes, weighing 100-150 g, were obtained from Department of Physiology, Bayero University Kano, Nigeria. They were kept, at room temperature, in wire-mesh cages, to acclimatise for 1 week. They were fed with animal feeds (Vitalised Feeds, Jos, Nigeria), and tap water ad libitum.
2.2 METHODS 2.2.1 Preparation and extraction of the plant
material
The leaves of F. polita were obtained from Kofar Marusa New Lay-out, Katsina, Nigeria. The plant was identified and voucher specimen (BUKHAN 0104) was deposited at the Herbarium Unit of the Department of Plant Biology, Bayero University Kano, Nigeria. The leaves were air dried under shade for two weeks and ground into powder using a mortar and pestle. The dry powder (500 g) of the F. polita leaf was extracted with 1.5 litres of chloroform using Soxhlet apparatus. The extraction continued for 8 hours at the temperature of 60 - 70°C, and the filtrate was
concentrated to dryness and stored in a glass container until required for use. 2.2.2 Fractionation of the chloroform leaf
extract of F. polita using column chromatography
The chloroform leaf extract of F. polita was subjected to column chromatography to further separate the extract into its component fractions. 2.2.2.1 Packing of column Silica gel of mesh size 60 G was used as the stationary phase while varying solvents combinations were used as eluent. Wet packing method as describe by Jerry et al. [10] was used in preparing the silica column. Silica gel (200 g) was mixed with 500ml of N-hexane to form a slurry, which was carefully and instantly poured into the column. The tap, at the base of the column, was left open during packing to allow free flow of the solvent into a beaker. At the end of the packing, the tap was closed and left for 24 hours, after which a clear solvent on top of the silica gel was allowed to drain down to the silica gel meniscus. A thin layer of cotton was placed on top of the column to prevent it from being disturbed when fresh solvent was being added. The flow rate of the column was monitored. 2.2.2.2 Loading of the sample Ten gram (10 g) of the dried chloroform leaf extract was thoroughly mixed with twenty gram (20 g) of silica gel and then gently layered on top of the column. Elution of the column was done with various solvent combination of increasing polarity. The following solvents systems were used in the elution process; chloroform: methanol 100:0. 90:10. 80:20. 70:30. 60:40. 50:50, 40:60, 30:70. 20:80. 10:90, 0:100. For each solvent combination, the elution was done until each solvent ratio becomes clear. The eluted fractions were collected in aliquots volume of 50 ml. 2.2.2.3 Pooling of the fractions using analytical
TLC Pooling of the column chromatography fractions was done using analytical thin layer chromatography (TLC). Each fraction was spotted in a precoated aluminium silica gel plate and developed in a chromatographic tank in the appropriate solvent systems. With the aid of a capillary tube, a spot of the sample was applied on the plate at 1.0 cm distance from the base of
Nasir et al.; IJBCRR, 29(8): 42-54, 2020; Article no.IJBCRR.58683
45
the plate. The plate was allowed to dry at room temperature and lowered in a chromatographic tank containing the solvent system saturated with the solvent vapour. The solvent was allowed to ascend the plate until the solvent front reaches about ¼ of length of the plate. The plate was removed and allowed to dry at room temperature. It was then sprayed with a freshly prepared 0.5 ml p-anaisaldehyde in 50 ml glacial acetic acid and 1 ml 97% sulphuric acid and heated at 105°C for 10 seconds to visualise bands. The colour reaction was noted and the relative retention factor (Rf) was calculated according to Stahl [11] method.
Rf = Distance travelled by compound from origin Distance travelled by solvent from origin
2.2.3 Induction of hyperlipidaemia
A modified method of Vesselinvitch et al. [12] was used to induce hyperlipidaemia in rats. Fully grown rats were exposed to high fat diet formulation for a period of six weeks. The diet was formulated by adding 5% egg yolk and 20% palm oil to 75% Pelletised Super Starter Feed. Body weight gain of the rats was weekly recorded. Segregation into obesity prone (OP) and obesity resistant (OR) groups was performed based on the weight gain by the rats in the six weeks. Rats with the highest body weight gain (Upper one-third, weight gained > 66.67%) and the lowest body weight (lower one-third, weight gained < 33.33%) were assigned the OP and OR groups respectively. 2.2.4 Screening of the fractions for
hypolipidemic activities Fourty-five (45) rats were grouped into nine (9) groups of five (5) rats each. Fractions were administered to the animals for a period of two weeks.
Group I: Normal control
Group II: hyperlipidaemic control
Group III: standard drug (Atorvastatin: 10 mg/kg body weight)
Group IV: hyperlipidaemic, administered with 50 mg/kg body weight of fraction 1 (FI)
Group V: hyperlipidaemic, administered with 50 mg/kg body weight of fraction 2 (F2)
Group VI: hyperlipidaemic, administered with 50 mg/kg body weight of fraction 3 (F3)
Group VII: hyperlipidaemic, administered with 50 mg/kg body weight of fraction 4 (F4) Group VIII: hyperlipidaemic, administered with 50 mg/kg body weight of fraction 5 (F5) Group IX: hyperlipidaemic, administered with 50 mg/kg body weight of fraction 6 (F6). At the end of the experimental period (two weeks), animals were euthanized. The blood of each rat was collected into a labelled centrifuge tube after which it was centrifuged and the serum obtained was used for analysis of lipid profile, creatine kinase, lactate dehydrogenase, troponin I, and HMG CoA reductase activity. Heart tissue, for each rat, was obtained for analysis of antioxidant enzymes, as well as for histopathological studies. 2.2.5 Statistical analysis Results were expressed as mean ± standard error of mean. Statistical differences between groups were analysed by one-way analysis of variance (ANOVA) followed by Tukey's comparison test using GraphPad Instat3 Software version 3.05. Differences of p<0.05 were considered to be significant. 2.2.6 Characterisation of the most active
fraction (F3) 2.2.6.1 Infrared spectroscopy Principle: FTIR relies on the fact that most molecules absorb light in the infrared region of the electromagnetic spectrum [13]. This absorption corresponds specifically to the bonds present in the molecule. The frequency ranges are measured as wavenumbers typically over the range 4000 - 600 cm-1. The background emission spectrum of the IR source is first recorded, followed by the emission spectrum of the IR source with the sample in place. The ratio of the sample spectrum to the background spectrum is directly related to the sample's absorption spectrum. The resultant absorption spectrum from the bond natural vibration frequencies indicates the presence of various chemical bonds and functional groups present in the sample [14]. FTIR is particularly useful for identification of organic molecular groups and compounds due to the range of functional groups, side chains and cross-links involved, and all of which will have characteristic vibrational frequencies in the infrared range [15].

Nasir et al.; IJBCRR, 29(8): 42-54, 2020; Article no.IJBCRR.58683
46
2.2.6.2 Mass spectroscopy
Principle: The concept of mass spectroscopy is relatively simple: A compound is ionised, and the ions are separated on the basis of their mass/charge ratio. The number of ions representing each mass/charge ratio is recorded as a spectrum [16]. It is routine to couple mass spectrometer with chromatographic instrument such as gas chromatography or liquid chromatography.
Sample preparation and analysis techniques for GCMS: In order for a compound to be analysed by GC/MS (gas chromatography mass spectroscopy), it must be sufficiently volatile and thermally stable. In addition, functionalised compounds may require chemical modification (derivatisation) prior to analysis, to eliminate undesirable adsorption effects that will otherwise affect the quality of the data obtained. Samples are usually analysed as organic solutions. The sample solution is injected into a GC inlet where it is vapourised and swept onto a chromatographic column by the carrier gas (usually helium). The sample flows through the column and the compounds, comprising the mixture of interest, are separated by virtue of their relative interaction with the coating of the column (stationary phase) and the carrier gas (mobile phase). The latter part of the column passes through a heated transfer line and ends at the entrance to ion source where compounds eluting from the column are converted to ions [17]. Two potential methods exist for ion production. The most frequently used method is electron ionisation (EI) and the occasionally used alternative is chemical ionisation (CI). For EI, a beam of electrons ionise the sample molecules resulting in a loss of one electron. A molecule with one electron missing is called (lie molecular ion and is represented by M
+ (a radical cation).
When the resulting peak from this ion is seen in a mass spectrum, it gives the molecular weight of the compound. Due to the large amount of energy imparted to the molecular ion, it usually fragments, producing further smaller ions with characteristic relative abundances that provide a 'fingerprint' for that molecular structure. This information may then be used to identify compound(s) of interest and help elucidate the structure of unknown component(s) of mixtures. CI begins with the ionisation of methane (or another suitable gas), creating a radical which, in
turn, will ionise the sample molecule to produce [M+H]
+ molecular ions. CI is a less energetic way
of ionising a molecule. Thus, less fragmentation occurs with CI than with EI. Hence, CI yields less information about the detailed structure of the molecule, but does yield the molecular ion: sometimes the molecular ion cannot be detected using EI, hence the two methods complement one another. Once ionised, a small positive is used to repel the ions out of the ionisation chamber [18]. The ionised ions were channeled to a mass analyser (filter), which separates the positively charged ions according to various mass related properties. After the ions are separated, they enter a detector and the output from which is amplified to boost signal. The detector sends information to a computer that records all of the data produced, and converts the electrical impulses into visual displays and hard copy displays. 3. RESULTS 3.1 Lipid Profile Parameters and Weight
of Hyperlipidaemic Rats There was significant (P<0.05) increase in the levels of serum TC, TG and LDL, but significant (P<0.05) decrease in the level of serum HDL, in HC rats compared to NC rats (Table 1). Administration of F1, F2, F3, F4, and F5 leads to significant (P<0.05) decrease in the levels of serum TC, TG, and LDL (Table 1). Administration of F6 leads to significant (P<0.05) decrease in the levels of serum TC and TG (Table 1). Administration of F1, F2, F3, and F5 leads to significant (P<0.05) increase in the level of serum HDL (Table 1). Of all the fractions, the most increase in HDL and the most decrease in TC, TG and LDL levels was found in the F3 administered rats (Table 1).
After six weeks of dietary induction, cumulative changes in body weight of hyperlipidaemic control rats was 89.00 ± 7.97 (Mean ± SD) (Table 2).
The weight gains of F1, F2, F3, F4, F5, and F6 administered rats, after both 1 week and 2 weeks of administration, were less than that of HC rats (Table 3). Of all the fractions, F3 showed the least weight gain after both 1 week and 2 weeks of administration (Table 3).

Nasir et al.; IJBCRR, 29(8): 42-54, 2020; Article no.IJBCRR.58683
47
Table 1. Lipid profile of hyperlipidaemic rats administered with column chromatography fractions for two weeks
Treatment (mg/kg) TC (mmol/L) TG (mmol/L) HDL (mmol/L) LDL (mmol/L) NC 3.26 ± 0.02* 0.87 ± 0.07* 2.40 ± 0.12* 0.47 ± 0.15* HC 6.11 ± 0.02 2.53 ± 0.08 1.29 ± 0.02 3.67 ± 0.07 STD-C F1 F2 F3 F4 F5 F6
3.52 ± 0.03* 4.20 ± 0.03* 4.65 ± 0.05* 3.87 ± 0.03* 5.30 ± 0.03* 5.05 ± 0.02* 5.79 ± 0.07*
1.21 ± 0.04* 1.63 ± 0.05* 1.64 ± 0.04* 1.21 ± 0.04* 1.93 ± 0.03* 1.86 ± 0.02* 2.00 ± 0.03*
2.24 ± 0.07* 1.91 ± 0.02* 1.79 ± 0.03* 2.21 ± 0.08* 1.55 ± 0.02 1.71 ± 0.03* 1.41 ± 0.03
0.72 ± 0.12* 1.54 ± 0.07* 2.12 ± 0.07* 1.12 ± 0.10* 2.88 ± 0.01* 2.50 ± 0.03* 3.47 ± 0.09
Key: TC= Total cholesterol, TG= Triglyceride, HDL-C= High density lipoprotein cholesterol, LDL-C= Low density lipoprotein cholesterol, NC= Normal control, HC= Hyperlipidaemic control, STD-C= Standard drug control, F1 =
fraction 1, F2 = fraction 2, F3 = fraction 3, F4 = fraction 4, F5 = fraction 5, F6 = fraction 6. Data are mean ± SEM, n = 5. Comparisons are HC vs NC, STD-C, and treatment groups, * = significant different (P<0.05)
Table 2. Cumulative changes in body weight of normal and hyperlipidemic rats after six
weeks of dietary induction
Normal control (NC)
Hyperlipidaemic control (HC)
After week 1 8.00 ± 0.57 15.67 ± 2.47 After week 2 16.34 ± 1.50 31.33 ± 3.80 After week 3 24.34 ± 1.94 44.33 ± 3.99 After week 4 32.00 ± 2.38 59.00 ± 4.25 After week 5 40.67 ± 3.46 75.00 ± 5.67 After week 6 49.67 ± 3.46 89.00 ± 7.97
Key: NC= Normal control, HC= Hyperlipidaemic control. Results are presented as Mean ± Standard
deviation, n = 5
3.2 HMG Co A Reductase and Markers of Cardiac Injury
There was significant (P<0.05) increase in the activities of serum LDH, CK and the level of troponin I, but significant (P<0.05) decrease in the activity of serum HMG Co A reductase, in HC rats compared to NC rats (Table 4). Administration of F3 leads to significant (P<0.05) decrease in the activity of serum LDH and the level of troponin I, but significant (P<0.05) increase in the activity of serum HMG Co A reductase (Table 4).
3.3 Markers of Oxidative Stress There was significant (P<0.05) decrease in heart tissue GSH, SOD, CAT, but significant (P<0.05) increase in heart tissue MDA, in HC rats compared to NC rats (Table 5). Administration of F3 leads to significant (P<0.05) increase in the GSH, SOD, CAT, but significant (P<0.05) decrease in the MDA (Table 5).
Table 3. Changes in body weight of dietary induced rats after one and two weeks of
administration of column chromatography fractions
Groups
Weight gain after one week
Weight gain after two weeks
NC 8.67 ± 0.42 7.66 ± 1.94 HC 16.00 ± 0.99 17.67 ± 0.10 STD-C 8.66 ± 0.52 8.00 ± 2.00 F1 13.67 ± 0.79 10.33 ± 1.14 F2 14.34 ± 0.16 13.66 ± 2.71 F3 9.34 ± 1.51 8.66 ± 0.78 F4 13.33 ± 0.60 15.34 ± 1.12 F5 12.67 ± 1.48 13.67 ± 2.59 F6 15.67 ± 2.35 16.00 ± 0.48
Key: NC= Normal control, HC= Hyperlipidaemic control, STD-C= Standard drug control, F1 = fraction
1, F2 = fraction 2, F3 = fraction 3, F4 = fraction 4, F5 = fraction 5, F6 = fraction 6. Results are presented as
Mean ± Standard deviation, n = 5
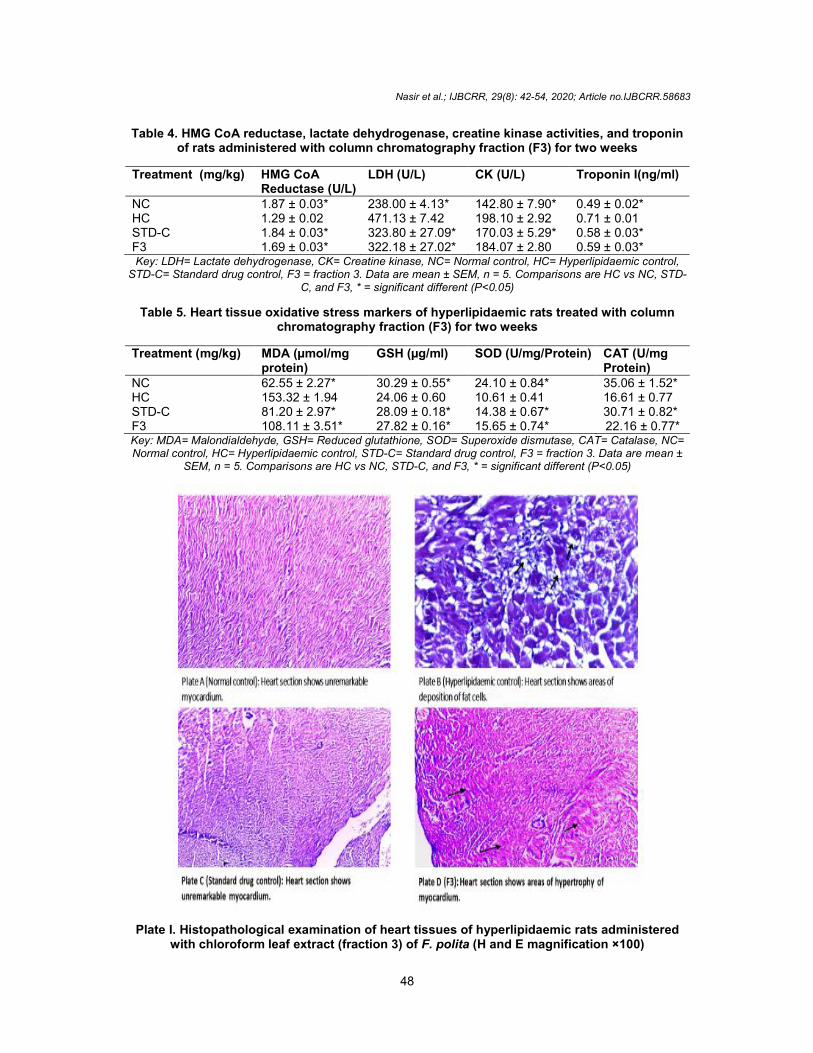
3.4 Histopathological Examination of Heart Tissues of Hyperlipidaemic Rats Administered with Fraction 3
Histopathological examination of heart tissues of hyperlipidaemic rats administered with fraction 3 were shown in plate I (A-D). Plate I A showed photomicrograph of normal control rat with normal myocardium architecture, showing unremarkable myocardium lesions. Plate I B showed heart tissue section of hyperlipidaemic control rat showing areas of deposition of fat cells. Plate I C showed heart tissue section administered with standard drug showing myocardium with unremarkable lesions. Plate I D showed section of heart tissue administered with fraction 3 showing areas of hypertrophy of myocardium.
Nasir et al.; IJBCRR, 29(8): 42-54, 2020; Article no.IJBCRR.58683
48
Table 4. HMG CoA reductase, lactate dehydrogenase, creatine kinase activities, and troponin of rats administered with column chromatography fraction (F3) for two weeks
Treatment (mg/kg) HMG CoA Reductase (U/L)
LDH (U/L) CK (U/L) Troponin I(ng/ml)
NC 1.87 ± 0.03* 238.00 ± 4.13* 142.80 ± 7.90* 0.49 ± 0.02* HC 1.29 ± 0.02 471.13 ± 7.42 198.10 ± 2.92 0.71 ± 0.01 STD-C 1.84 ± 0.03* 323.80 ± 27.09* 170.03 ± 5.29* 0.58 ± 0.03* F3 1.69 ± 0.03* 322.18 ± 27.02* 184.07 ± 2.80 0.59 ± 0.03* Key: LDH= Lactate dehydrogenase, CK= Creatine kinase, NC= Normal control, HC= Hyperlipidaemic control,
STD-C= Standard drug control, F3 = fraction 3. Data are mean ± SEM, n = 5. Comparisons are HC vs NC, STD-C, and F3, * = significant different (P<0.05)
Table 5. Heart tissue oxidative stress markers of hyperlipidaemic rats treated with column chromatography fraction (F3) for two weeks
Treatment (mg/kg) MDA (µmol/mg protein)
GSH (µg/ml)
SOD (U/mg/Protein) CAT (U/mg Protein)
NC 62.55 ± 2.27* 30.29 ± 0.55* 24.10 ± 0.84* 35.06 ± 1.52* HC 153.32 ± 1.94 24.06 ± 0.60 10.61 ± 0.41 16.61 ± 0.77 STD-C 81.20 ± 2.97* 28.09 ± 0.18* 14.38 ± 0.67* 30.71 ± 0.82* F3 108.11 ± 3.51* 27.82 ± 0.16* 15.65 ± 0.74* 22.16 ± 0.77* Key: MDA= Malondialdehyde, GSH= Reduced glutathione, SOD= Superoxide dismutase, CAT= Catalase, NC= Normal control, HC= Hyperlipidaemic control, STD-C= Standard drug control, F3 = fraction 3. Data are mean ±
SEM, n = 5. Comparisons are HC vs NC, STD-C, and F3, * = significant different (P<0.05)
Plate I. Histopathological examination of heart tissues of hyperlipidaemic rats administered with chloroform leaf extract (fraction 3) of F. polita (H and E magnification ×100)

3.5 Characterisation of the Compound (Fraction3) Using Fourier Transform Infrared (FTIR) and Chromatography - Spectroscopy (GCMS) Techniques
The FTIR spectra of the most potent fraction (fraction 3) is presented, as absorbance against wavenumber (cm
-1), in Fig. 1.
The mass spectrum of the most potent fraction is shown in Fig. 2. GC-MS analysis of fraction F3 reveals the presence of various compounds. The
Fig. 1. FTIR spectra of the most potent fraction (fraction 3
Fig. 2. Mass spectra of the most potent fraction (fraction 3)
Nasir et al.; IJBCRR, 29(8): 42-54, 2020; Article no.
49
Characterisation of the Bioactive Using Fourier
(FTIR) and Gas Mass
Spectroscopy (GCMS) Techniques
The FTIR spectra of the most potent fraction (fraction 3) is presented, as absorbance against
The mass spectrum of the most potent fraction is MS analysis of fraction F3
reveals the presence of various compounds. The
most notable probable bioactive compounds 8Methoxy-4-phenylquinoline-2-hydrazine and Narceine.
4. DISCUSSION Hyperlipidaemia develops with a change in the serum lipids profile. Hence, lipids profile such as total cholesterol, tryglycerides, low density lipoprotein cholesterol, and high density lipoprotein cholesterol crucial risk factors in many degenerative diseases [19].
spectra of the most potent fraction (fraction 3)
spectra of the most potent fraction (fraction 3)
; Article no.IJBCRR.58683
most notable probable bioactive compounds 8-hydrazine and
Hyperlipidaemia develops with a change in the serum lipids profile. Hence, lipids profile such as total cholesterol, tryglycerides, low density lipoprotein cholesterol, and
density lipoprotein cholesterol are al risk factors in many degenerative

Nasir et al.; IJBCRR, 29(8): 42-54, 2020; Article no.IJBCRR.58683
50
Table 6. GC-MS analysis of the most potent fraction
Peak R. Time
MW M. Formula Name Structure Reported Uses
1 7.796 265 C16
H15
N3O 8-Methoxy-4-
phenylquinoline-2-hydrazine
2 8.569 445 C23
H27
NO8 Narceine
Oxidants play a crucial role in the formation and development of chronic diseases such as rheumatoid arthritis, cancer, cardiovascular and autoimmune disorders, or even aging [20].
Increase in triglycerides could lead to increased secretion of VLDL. Increase in TG level induces imbalance in lipid metabolism which leads to hyperlipidemia [21]. The elevated levels of low-density lipoprotein and very low density lipoproteins accompanied with cholesterol and triglycerides are some of the primary risk factors for atherosclerosis [22]. An increased rate of low density-lipoprotein cholesterol oxidation could enhance the risk of premature atherosclerosis [4]. There was a significant increase in the levels of TC, TAG, and LDL-C, but a decrease in HDL-C levels in the hyperlipidaemic control group compared to normal control group. This effect is of critical value since serum lipids profile is a crucial risk factor to many disease, like cardiovascular diseases (i.e., hypertension) [23].
The hypocholesterolemic activity of the chloroform leaf extract (fractions) of F. polita could be due to a number of mechanisms; inhibition of HMG-CoA reductase, stimulation of Cholesterol-7-alpha-hydroxylase, or inhibition of cholesterol absorption from intestine due to formation of complexes with some phytochemicals [24]. A decrease in triacylglycerol level may be due to reduced lipogenesis, increased lipolytic activity by inhibition of hormone-sensitive lipase or the lipogenic enzymes [25], or activation of lipoprotein lipase [26].
HDL-cholesterol deploys its cardio protective effects at many levels: by prevention of low density lipoprotein cholesterol oxidation, thrombosis, macrophage apoptosis and vascular wall inflammation, and by preservation of endothelial vasomotor, proliferative and survival function, by increasing the number of endothelial progenitor cells [4]. HDL-C carries cholesterol and cholesterol esters from peripheral tissues to the liver, where cholesterol is metabolised into bile acids. This pathway plays a very vital role in decreasing cholesterol levels in the blood and peripheral tissues, and in inhibiting atherosclerotic plaque formation in the aorta [27,28]. In addition, HDL-C has various anti-inflammatory effects [29].
Moreover, another possible mechanism of action of this extract, on lipid metabolism, might be through its antioxidant properties, that is by preventing the oxidation of LDL-C and the expression of cellular adhesion molecules and monocyte recruitment [30].
There was significant decrease in the activity of serum HMG Co A reductase in hyperlipidaemic control group compared to normal control group. The repressed activity of HMG Co A reductase in the hyperlipidaemic control group could be due to elevated level of serum total cholesterol in the group.
Administration of the chloroform leaf extract (fraction 3) leads to significant increase in the activity of serum HMG Co A reductase. Myocardium is rich in enzymes that are required for its metabolic activity. These cardiac markers are measured to evaluate the function of heart.
N
O
NH
NH2
O
O
O
OHO
O
O
N
O
Nasir et al.; IJBCRR, 29(8): 42-54, 2020; Article no.IJBCRR.58683
51
These important enzymes such as serum LDH, CK, CK- MB and proteins such as troponins, myoglobins are considered as standard diagnostic markers of myocardial injury [31]. From the results obtained, the high fat diet administration increased the levels of cardiac markers in the serum. It might be shown that the high fat diet administration induced cardiac myocytes damage [32]. There was significant increase in the activities of serum LDH, CK and the level of troponin in hyperlipidaemic control group compared to normal control group. Administration of the chloroform leaf extract (fraction 3) leads to significant decrease in the activity of serum LDH and the level of troponin. This indicated the ability of the chloroform leaf extract (fraction 3) of F. polita to reduce leakages of these markers from cardiomyocytes. Shortage of antioxidant defence system leads to raise in the levels of free radicals. Raised level of free radicals may lead to disruption in cellular functions, oxidative damage to membranes, and enhanced susceptibility to lipid peroxidation [33]. Oxidative damage may result when the critical balance between free radical generation and antioxidant defences is unfavorable [34]. In the present study, the indicators for evaluation of ROS are MDA and endogenous enzymes such as glutathione (GSH), superoxide dismutase (SOD), and catalase (CAT). Malondialdehyde (MDA) is one of the main products of lipid peroxidation that has been widely studied and measured as an index of lipid peroxidation, and as a marker of oxidative stress [35]. In the present study, MDA level was elevated in the heart of hyperlipidaemic control rats, compared to the normal control group. However, there was depressed level of GSH, SOD and catalase in the heart of hyperlipidaemic control group, compared to the normal control group. The increase in MDA formation in the heart of hyperlipidaemic induced rats, could be due to raised level of oxygen free radicals. This is due to the fact that oxygen free radicals exert their cytotoxic effect by peroxidation of membrane phospholipids, and this leads to change in permeability and loss of membrane integrity [36].
The decreased levels of GSH, SOD and CAT observed in hyperlipidaemic control rats could be explained by the accumulation of superoxide
anion and hydrogen peroxide, which would have been effectively scavenged by these enzymes [34]. This result demonstrates that the complications observed may be due to depression of the antioxidant defence system in the rats. These oxidative damages could be retarded by endogenous defence systems (antioxidant) such as reduced glutathione (GSH), superoxide dismutase (SOD) and catalase (CAT) which work in synergy to detoxify free radicals [37]. Hence, administration of the chloroform leaf extract (fraction 3) F. polita significantly decreased the heart tissue level of MDA and increased the heart tissue levels of GSH, SOD, and catalase when compared to the hyperlipidaemic control group. This also suggests that chloroform leaf extract (fraction 3) of F. polita might have carried out its hypolipidaemic effect by enhancing the depressed antioxidant defence system in the rats. The decrease in MDA levels could be attributed to the antioxidant activity of the plant extract. The increased level of GSH and increased activities of SOD and CAT suggest a compensatory response to oxidative stress as it decreases the endogenous hydrogen peroxide produced, thus, diminishing toxic effects due to this radical or other free radicals derived from secondary reactions [38]. Thus, chloroform leaf extract of F. polita (fraction 3) might have an efficient protective mechanism in response to reactive oxygen species (ROS). In the IR spectrum of the most active fraction (fraction 3), the absorption bands at high wavenumber (3600 – 1700 cm
-1) were as a result
of localized hydrogen stretching vibrations [39]. The peaks at 1449, 1467, and 1521 cm
-1 were
assigned to skeletal vibrational stretching of an aromatic ring [40]. This is in accordance with the findings of Kumar et al. [41] who reported that the peaks 1458 and 1577 cm
-1 were assigned to
skeletal vibrational stretching of an aromatic ring. The peaks at 1099, 1115, and 1145 cm-1 showed that the compounds possess –C-O stretching, and the peak at 1248 showed –C-N stretching. Moreover, the absorbance at wavenumber 3376 cm-1 showed that the compounds possess –N-H stretching [40]. The vibration at 1376 cm
-1 was
due to C=C / C=N stretching in the quinoline fragment. This is in accordance with the findings of Kumar [42] who reported that vibrations at 1383 and 1328 cm-1 were due to C=C / C=N stretching in a quinoline fragment. Peaks 849, 793, and 825 cm
-1 were due to the quinoline
group. This was supported by the findings of

Nasir et al.; IJBCRR, 29(8): 42-54, 2020; Article no.IJBCRR.58683
52
Kumar [42] who reported that peaks at 750, 787, and 824 cm
-1 were due to quinoline group.
The use of mass spectra is convincing evidence for identification of molecules. In case of unknown compound, the molecular ion, fragmentation pattern and evidence from other forms of spectrometry can lead to identification of new compound(s). The observed mass spectrum of fraction 3 gives reveals two major biological compounds; 8-Methoxy-4-phenylquinoline-2-hydrazine and Narceine with molecular weight of 265 and 445 respectively.
5. CONCLUSION The research work concludes that chloroform leaf extract of F. polita possesses hypolipidaemic activity in addition to its capacity to rectify oxidative stress – induced organ dysfunction.
The hypolipidaemic property of the extract was also through its antioxidant property. The hypolipidaemic property of the extract could also be through inhibition of HMG-CoA reductase, stimulation of Cholesterol-7-alpha-hydroxylase, or inhibition of cholesterol absorption from intestine. Lastly, characterisation of the most active/potent fraction (fraction 3) of the chloroform leaf extract reveals two major biological compounds; 8-methoxy-4-phenylquinoline, and narceine.
ETHICAL APPROVAL In accordance with International standard or University standard, written ethical approval has been collected and preserved by the author(s).
ACKNOWLEDGEMENTS The correspondence author wishes to thank Tertiary Education Trust Fund (TETFund), via the Research and Linkages Office of Umaru Musa Yar’adua University Katsina, for the grant used for this research work.
COMPETING INTERESTS Authors have declared that no competing interests exist.
REFERENCES 1. Nwodo NJ, Nnadi CO, Ibezim A, Mbah CJ.
Plants with hypolipidaemic effects from Nigerian flora. Antioxidant – antidiabetic
agents and human health, Oluwafemi Oguntibeju, Intech Open; 2014. DOI: 10.5772/57181.
2. Montori VM, Brito JP, Ting HH. Patient-centered and practical application of new high cholesterol guidelines to prevent cardiovascular disease. Journal of America Medical Association. 2014;311: 465–466.
3. Ndarubu TA, Chiamaka OS, Alfa S, Mustapha A, Chinedu OE, Wenawo DL, Adenike AR, Bashir L, Eustace BB. Phytochemicals, hypoglycemic and hypolipidemic effects of methanol leaf extract of Hibiscus sabdariffa in alloxan induced diabetic rats. GSC Biological and Pharmaceutical Sciences. 2019;08(03): 070-078.
4. Aduwamai UH, Mahmud BA, Daniel D. Antioxidant and antihyperlipidemic activity of methanol extract of Borassus aethiopum fruit in triton x-100 induced hyperlipidemic rats. American Journal of Biochemistry. 2019;9(2):35-44.
5. Ajayi FT, Omotoso SO, Odejide JO. Evaluation of fodder plants (Ficus polita, Azadirachta indica and Vernonia amygdalina) for their phytochemical and antibacterial properties. Cogent Food & Agriculture. 2016;2:1211466.
6. Egharevba HO, Ibrahim JA, Okhale SE, Wudil MI, Kunle OF. Phytochemistry, Pharmacognostic and HPLC profiling of Methanolic Extract of Fruits of Ficus polita Vahl. International Journal of Basic and Applied Sciences. 2015;4(4):225-228.
7. Zhang X, Wu C, Wu H, Sheng L, Su Y, Zhang X. Antihyperlipidemic effects and potential mechanisms of action of the caffeoylquinic acid-rich Pandanus tectorius fruit extract in Hamsters fed a high fat-diet. PloS ONE. 2013;8(4):61922.
8. Shi Y, Mon AM, Fu Y, Zhang Y, Wang C, Yang X. et al. The genus Ficus (Moraeae) used in diet: Its plant diversity, distribution, traditional uses and ethnopharmacological importance. Journal of Ethnophar-macology. 2018;226:185-196.
9. Rahimi M. A review: Antidiabetic medicinal plants used for diabetes mellitus. Bulletin of Environment, Pharmacology and Life Sciences. 2015;4:163-180.
10. Jerry RM, Christina NH, Paul FS. Techniques in organic chemistry. 3rd ed. W.H. Freeman and Company; 2010. ISBN-13: 978-1-4292-1956-3 ISBN-10: 1-4292-1956-4.

Nasir et al.; IJBCRR, 29(8): 42-54, 2020; Article no.IJBCRR.58683
53
11. Stahl E. Thin layer chromatography. A laboratory hand book. New York. Springer; 1969.
12. Vesselinvitch D, Wisseler RW, Schiffner TT, Borenaztajn I. The effect of various diet on artherosgenesis in rhesus monkey. Artherosclerosis. 1980;35:187-207.
13. Perkins WD. Fourier transform-infrared spectroscopy, Part 1: Instrumentation. Journal of Chemical Education. 1986; 63(1):5-10.
14. Colthrup NB, Daly LH, Wiberley SE. Introduction to infrared and Raman spectroscopy, 3
rd ed. Academic Press,
New York; 1990. 15. Lin-Vien D, Colthrup NB, Fateley WG,
Grasselli JG. The Handbook of Infrared and Raman Characteristic Frequencies of Organic Molecules, Academic Press, New York. 1991;76-80.
16. Smith RM. Understanding Mass Spectra, a Basic Approach. 2nd ed. John Wiley and Sons, New York. 2004;43-49.
17. Silverstein RM, Webster FX, Kiemle DJ. Spectrometric Identification of Organic Compounds, 7
th ed., John Wiley and Sons,
New York; 2005. 18. Pretsch E, Buhlmann TP, Affolter C.
Structure determination of organic compounds. Table of Spectral Data. Springer-Verlag, Berlin. 2000;54.
19. Sodipo OA, Abdulrahman F, Sandabe U. Effects of the aqueous fruit extract of Solanum macrocarpum Linn. on hematological parameters of chronic triton-induced hyperlipidemic rats. Journal Phys Pharm Adv. 2012;2(2):122-132.
20. Sima G, Sima R, Maryam J, Hossein KH, Soheila N. A review on antioxidants and their health effects. Journal of Nutrition and Food Security. 2018;3(2):106-112.
21. Pragda SS, Kuppast IJ, Mankani KL, Ramesh L. Evaluation of antihyperlipi-demic activity of leaves of Portulacaoleracealinn against dexame-thasone induced hyperlipidemia in rats. International Journal of Pharmacy and Pharmaceutical Sciences. 2012;4(4):279-283.
22. Herrington W, Lacey B, Sherliker P, Armitage J, Lewington S. Epidemiology of atherosclerosis and the potential to reduce the global burden atherothrombotic disease. Circulation Research. 2016;118: 535-546.
23. Kolawole OT, Kolawole SO, Ayankunl AA, Olaniran IO. Methanol Leaf Extract of
Persea americana Protects Rats against Cholesterol-Induced Hyperlipidemia. British Journal of Medicine and Medical Research. 2012;2(2):235-242.
24. James DB, Elebo N, Sanusi AM, Odoemene L. Some biochemical effect of intraperitoneal administration of Phyllanthus amarus aquoeus extacts on normaglycemic albino rats. Asian Journal of Medical Sciences. 2010;2(1):7-10.
25. Pari L, Venkateswaran S. Protective role of Phaseolus vulgaris on changes in the fatty acid composition in experimental diabetes. Journal of Medicinal Food. 2004;7:204-209.
26. Roh C, Jung U. Screening of crude plant extracts with anti-obesity activity. Inter-national Journal of Molecular Sciences. 2012;13:1710-1719.
27. Kim H, Jeong D, Jung H, Yokozawa T, Choi J. Hypolipidemic effects of Sophora flavescens and its constituents in poloxamer 407-induced hyperlipidemic and cholesterol-fed rats. Biol. Pharm. Bull. 2008;31(1):73-78.
28. Imafidon KE. Tissue lipid profile of rats administered with aqueous extract of Hibiscus rosa-sinensis. Linn. Journal of Basic and Applied Sciences. 2010;6(1):1-3.
29. Biswajit D, Trinath M. Role of HDL-C in health and disease. Journal, Indian Academy of Clinical Medicine. 2012;13:(3).
30. Khera AV, Cuchel M, Delalera M. Cholesterol efflux capacity, high density lipoprotein function and atherosclerosis. N. Engl. J. Med. 2011;364: 127-135.
31. Nigam PK. Biochemical markers of myocardial injury. Indian J Clin Biochem. 2007;22(1):10–7.
32. Nayagam AAJ, Gunasekaran S, Rangarajan S, Muthaiah S. Myocardial potency of Caesalpinia bonducella Linn. on doxorubicin induced myocardial infarction in albino rats. Clinical Phytoscience. 2019; 5(43):1-7.
33. Baynes JW. Role of oxidative stress in development of complications in diabetes. Diabetes. 1991;40(4):405-12.
34. Elekofehinti OO, Kamdem JP, Kade IJ, Rocha JBT, Adanlawo IG. Hypoglycemic, antiperoxidative and antihyperlipidemic effects of saponins from Solanum anguivi Lam. fruits in alloxan-induced diabetic rats. South African Journal of Botany. 2013; 88:56–61.

Nasir et al.; IJBCRR, 29(8): 42-54, 2020; Article no.IJBCRR.58683
54
35. Janero DR. Malondialdehyde and thiobarbituric acid reactivity as diagnostic indices of lipid peroxidation and peroxidative tissue injury. Free Radical Biology and Medicine. 1990;9:515–540.
36. Esterbauer H. Estimation of peroxidative damage: A critical review. Pathology Biology Paris.1996;44:25–28 Available:http://www.ncbi.nlm.nih.gov/pubmed/8734296>(PMID: 8734296).
37. Edziri H, Ammar S, Souad L, Mahjoub MA, Mastori M, Aouni M, et al. In vitro evaluation of antimicrobial and antioxidant activities of some Tunisian vegetables. South African Journal of Botany. 2012; 78:252–256.
38. Sharma N, Garg V. Antidiabetic and antioxidant potential of ethanolic extract of Butea monosperma leaves in alloxan-induced diabetic mice. Indian Journal of Biochemistry and Biophysics. 2009;46:99–105.
39. Kumar R. Synthesis and characterization of a new aluminum complex bis (8-hydroxy quinoline) (1-10 phenanthroline) aluminum Al (Phen)q2. J. Nano- Electron. Phys. 2017;9:05048.
40. Silverstein RM, Bassler GC, Morrill TC. Spectrometric Identification of organic Compounds. 4th ed. New York: John Wiley and Sons. 1981;272: 6S55.
41. Kumar R, Bhargava P, Dvivedi A. Synthesis and characterization of a new cadmium complex, cadmium [(1,10-phenanthroline) (8-hydroxyquinoline)] Cd (Phen)q. Procedia Materials Science. 2015;10:37-43.
42. Kumar R, Bhargava P, Srivastava R, Tyagi P. Synthesis and electrolumine-scence properties of tris – [5-chloro-8-hydroxyquinoline] aluminium AI (5-CIq)3.
Journal of Semiconductors. 2015;36(6): 064001.
_________________________________________________________________________________ © 2020 Nasir et al.; This is an Open Access article distributed under the terms of the Creative Commons Attribution License (http://creativecommons.org/licenses/by/4.0), which permits unrestricted use, distribution, and reproduction in any medium, provided the original work is properly cited.
Peer-review history: The peer review history for this paper can be accessed here:
http://www.sdiarticle4.com/review-history/58683