Embed Size (px)
Citation preview
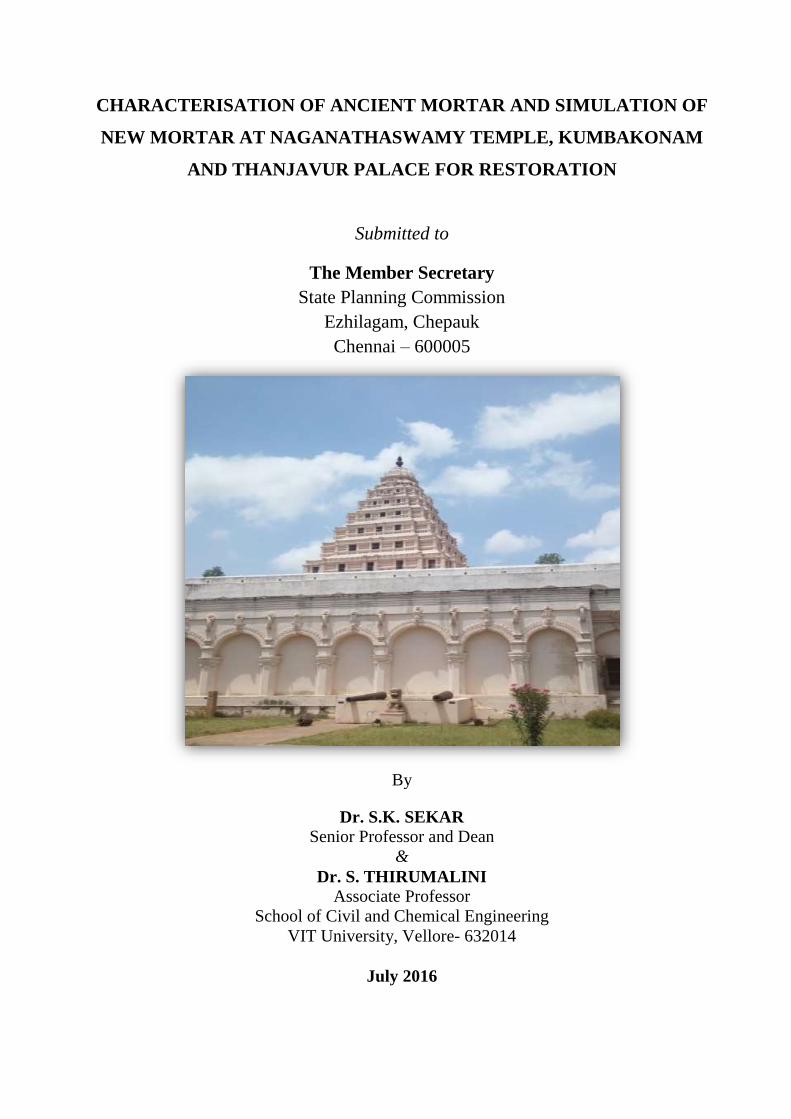
CHARACTERISATION OF ANCIENT MORTAR AND SIMULATION OF
NEW MORTAR AT NAGANATHASWAMY TEMPLE, KUMBAKONAM
AND THANJAVUR PALACE FOR RESTORATION
Submitted to
The Member Secretary
State Planning Commission
Ezhilagam, Chepauk
Chennai – 600005
By
Dr. S.K. SEKAR
Senior Professor and Dean
&
Dr. S. THIRUMALINI
Associate Professor
School of Civil and Chemical Engineering
VIT University, Vellore- 632014
July 2016
1
CONTENT
Chapter Description Page No.
1 Introduction 2
2 Methodology 13
3 Results and Discussions 29
4 Conclusions 72
2
Chapter 1
INTRODUCTION
1.1 GENERAL
India has a finite number of very rich, and assorted cultural heritage in the form of built
structures and architectural monuments. Any structure that is of historical, archaeological or
artistic interest and existing for more than 100 years is called as an ancient monument. They
include different types of structures such as temples, palaces, domes, forts, ports, aqueducts,
prayer halls, cemeteries, step-wells, rock-cut temples and excavation sites. They are the proof
of ancient habitation and represent indigenous traditional architecture of India. They not only
represents the cultural face and growth but also articulate the knowledge of our ancestors about
building design, construction materials, building technology, creative and decoration and
artistic capabilities of the craftsmen (Nene2012).
Out of 125 heritage sites declared by UNESCO, 29 are in India. Currently,
3650 ancient monuments and archaeological sites have been declared as remains of national
importance. In Tamil Nadu alone, there are 248 structures and 163 prehistoric archaeological
sites. They are distributed in different geographical locations and belong to different periods,
ranging from early historic period to the colonial period. They also contribute to the prosperity
and economic wealth of our country. Only a small number of monuments are under the
protection of the state and central archeological survey of India and the remaining left
unnoticed.
As a result of this, finite, non-renewable and irreversible resources of our country are
fast disappearing without any record for the posterity. The main factors which lead to the non-
existence were lack of fundamental knowledge, understanding of construction of monuments,
interest in our past, lack of public awareness, industrial revolution and rapidly transforming
lifestyle, etc.
3
1.2 REASONS FOR THEIR NON – EXISTENCE
Lack of fundamental knowledge
Understanding of construction of monuments
Interest in our past, lack of public awareness
Industrial revolution
Rapidly transforming life style
Finite, non-renewable and irreversible resources of our country is fast disappearing
without any record for the posterity
1.3 NEED FOR THE STUDY
The difficulty in understanding the old mortar could be attributed to the variety of raw
materials and organics used for their production and their application techniques.
Other parameters include the environmental conditions such as climate, humidity etc
which could influence their strength and durability.
It is the need of the hour to investigate the traditional construction material
characteristics and construction techniques for effective simulation, conservation,
protection and to safe guard our ancient monuments.
The present study could serve a great source of information regarding the type and
proportion of raw materials used (binder, aggregate and organic additives), their
application technology, as well as their resistance to ageing and environmental
conditions in the temples and also to prepare the compatibility mortar for conservation.
1.4 OBJECTIVES AND SCOPE OF THE STUDY
To identify the technology of production and characterize the raw materials of the
mortar used at Naganathaswamy Temple and Thanjavur Palace, Tamil Nadu.
To simulate the similar mortar by trial and error in the laboratory.
To find out the scientific reason beyond the durability over centuries and to evaluate its
compressive strength, water absorption, curing period carbonation and porosity for the
preparation of compatibility mortars for repair works.

4
To validate the results of controlled and ancient samples by advanced analytical
techniques like X- Ray Diffraction, Scanning Electron Microscope with energy
dispersive X- Ray spectroscopy, Thermal Gravimetric Analysis, Fourier Transform-
Infra Spectroscopy.
1.5 ABOUT THE NAGANATHASWAMY TEMPLEAND THANJAVUR PALACE
1.5.1 Naganathaswamy Temple
The temple (Fig. 1) is 1000 years old is located in Manambadi near Kumbakonam. It is said
that the temple was built in tenth century by RajendraChola.The State government has ensured
the protection of 1,000-year old Naganathaswamy temple near Kumbakonam.
Fig.1 Naganathaswamy Temple
5
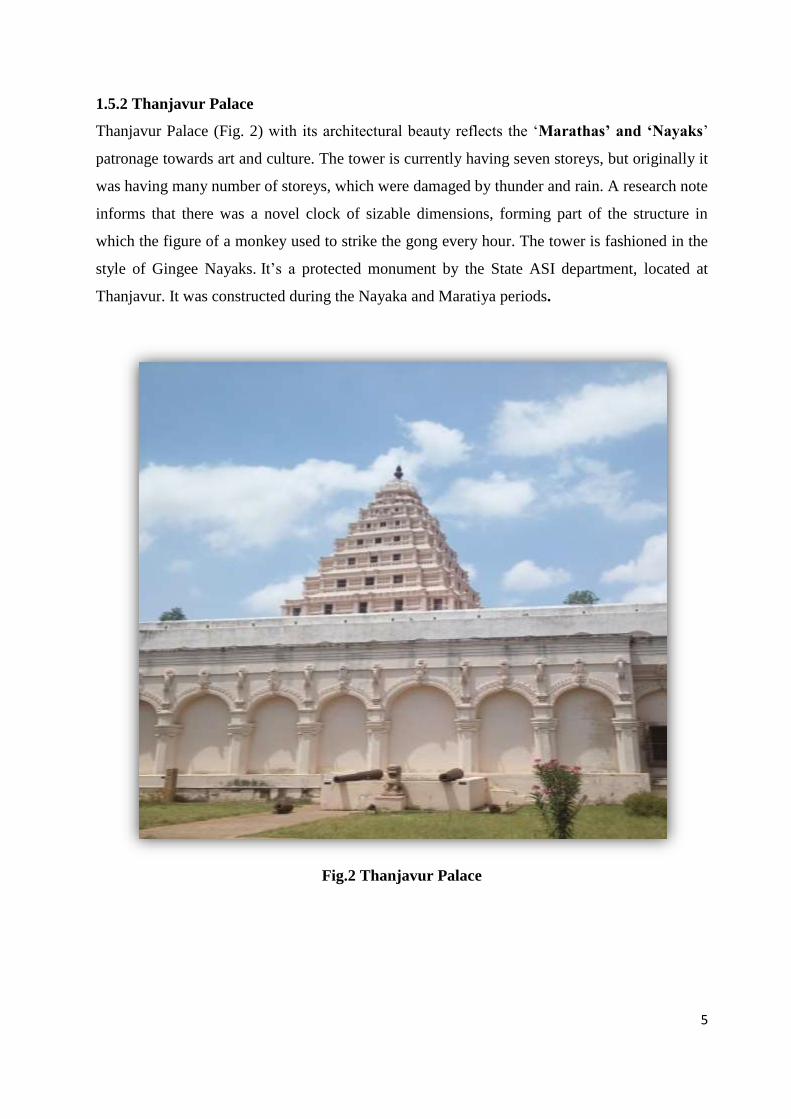
1.5.2 Thanjavur Palace
Thanjavur Palace (Fig. 2) with its architectural beauty reflects the ‘Marathas’ and ‘Nayaks’
patronage towards art and culture. The tower is currently having seven storeys, but originally it
was having many number of storeys, which were damaged by thunder and rain. A research note
informs that there was a novel clock of sizable dimensions, forming part of the structure in
which the figure of a monkey used to strike the gong every hour. The tower is fashioned in the
style of Gingee Nayaks. It’s a protected monument by the State ASI department, located at
Thanjavur. It was constructed during the Nayaka and Maratiya periods.
Fig.2 Thanjavur Palace

6
DESCRIPTION OF HERITAGE STRUCTURE
NAGANATHA SWAMY TEMPLE
INTRODUCTION
Naganatha swamy temple is a thousand years old temple built by Rajendra chola in Tanjavur
District. Rajendra Chola-I, was known as much for building temples as for extending his
empire to the banks of the Ganga in the north and to Srilanka and Maldives in the south. One
such small temple was the Naganathaswamy temple in Manambadi village near Kumbakonam
which has now virtually disappeared. The temple’s main deity is Lord Siva was initially known
as Sri Kailasamudaiyar temple.
The stone temple was built around 1016 CE, much before the king's masterpiece, the
Gangaikondaan temple, was raised. The temple is one of the 88 protected monuments in the
state under the control of the state department of archaeology. A sculpture in the
Naganathaswamy temple, where the Chola king along with his family is seen worshipping Lord
Nataraja, signifies the consecration of the temple during his period.
Epigraphist and historian Kudavayil M Balasubramaniam noted the temple has sculptures
depicting a story of an elephant and a spider that worships and protects a 'sivalinga' from leaves
falling on it. "A sculpture shows the Cauvery as a woman holding a lotus. The temple's flower
garden was called Rajendra Cholan.
The deities were called Sri Kailasamudiyar, while the village was called Ilachchikudi. The
sculptures depict dance dramas that used to be conducted during festivals in the Tamil month of
'Chithirai'. The State government's Archaeology Department declared it a protected monument
30 years ago. The stone structure below the vimana, with intricate sculptures, and the sanctum
sanctorum with a Siva lingam are intact. The temple has an entrance without a gopuram. The
prahara has flower plants.
7
According to Kudavayil Balasubramanian, epigraphist and historian, this temple was
constructed by Rajendra Chola (1012-1044 AD). During Chola rule, the village was called
‘Elaichikudi’, and ‘Veeranarayanapuram’. The temple’s name was ‘Sri Kailasam’.
The temple possesses more than ten inscriptions of the Chola period. Some of the sculptures on
the walls of the main structure are those of Nataraja, which is an outstanding one. Another
sculpture depicting Rajendra Chola worshipping the Lord with his wives is seen. Other
sculptures depict Ganapathi, Dakshinamurthy, Ligotpava, Vishnu, Brahma, Gangadharamurthy,
Durga and Arthanari. Among Chola sculptures, they are the unique ones.
A) THANJAVUR PALACE
INTRODUCTION
The Thanjavur Maratha Palace Complex, known locally as Aranmanai, is the official
residence of the Bhonsle family who ruled over the Tanjore region from 1674 to 1855.The
Thanjavur Maratha palace was originally constructed by the rulers of Thanjavur Nayak
kingdom. After the fall of the Thanjavur Nayak kingdom, it served as the official residence of
the Thanjavur Maratha. When most of the Thanjavur Maratha kingdom was annexed to the
British Empire in 1799, the Thanjavur Marathas continued to hold sway over the palace and the
surrounding fort. The Bhonsle family continued to hold on to the palace even after the last
king Shivaji II was deposed as per the Doctrine of Lapse.
The palace complex consists of the Sadar Mahal Palace, the queen's courtyard and the Durbar
Hall. The Raja Serfoji Memorial Hall and the Royal Palace Museum are situated in the Sadar
Mahal Palace. There is also a small bell tower. The Saraswathi Mahal Library is situated with
the Thanjavur palace complex.
The original name of Thanjavur Palace is Sivaganga Fort, which is rarely used these days. If
you observe carefully, there is even a small moat around it which provided security against
enemy access. Often mistakenly called the "Thanjavur Maratha Palace" was not built by
Maratha Kings, but by Thanjavur Nayaks. However, the Marathas made some enhancements to
suit their needs.
8
Thanjavur, formerly Tanjore, is a city in the south Indian state of Tamil Nadu. Thanjavur is an
important center of South Indian religion, art, and architecture. Most of the Great Living Chola
Temples, which are UNESCO World Heritage Monuments, are located in and around
Thanjavur. The foremost among these, the Brihadeeswara Temple, is located in the centre of
the city. Thanjavur is also home to Tanjore painting, a painting style unique to the region.
GEOGRAPHY AND HISTORICAL DEVELOPMENT OF THE LOCATION
The Thanjavur Maratha Palace is located in Thanjavur. Thanjavur is the headquarters of
the Thanjavur District. The city is an important agricultural centre located in the Cauvery
Delta and is known as the "Rice bowl of Tamil Nadu". Thanjavur is administered by
a municipal corporation covering an area of 36.33 km2 (14.03 sq mi) and had a population of
222,943 in 2011. Roadways are the major means of transportation, while the city also has rail
connectivity. The nearest airport is Tiruchirapalli International Airport, located 59.6 km
(37.0 mi) away from the city. The nearest seaport is Karaikal Port, which is 94 km (58 mi)
away from Thanjavur.
While the early history of Thanjavur remains unclear, the city first rose to prominence during
the reign of Medieval Cholas when it served as the capital of the empire. After the fall of
Cholas, the city was ruled by various dynasties likePandyas, Vijayanagar Empire, Madurai
Nayaks, Thanjavur Nayaks, Thanjavur Marathas and the British Empire. It has been a part of
independent India since 1947.
Thanjavur became the most important city in the Chola Empire and remained its capital till the
emergence of Gangaikonda Cholapuram in about 1025 During the first decade of the eleventh
century, When the Chola Empire began to decline in the 13th century, the Pandyas from the
south invaded and captured Thanjavur twice, first during 1218–19 and then during 1230.
During the second invasion, the Chola king Rajaraja III (1216–56) was set in exile and he
sought the help of the Hoysala king Vira Narasimha II (1220–35) to regain
Thanjavur. Thanjavur was eventually annexed along with the rest of the Chola kingdom by the
Pandya king Maravarman Kulasekara Pandyan I (1268–1308) in 1279 and the Chola kings
were forced to accept the suzerainty of the Pandyas. The Pandyas ruled Thanjavur from 1279 to
1311 when their kingdom was raided and annexed by the forces of Malik Kafur (1296–1306)
and Delhi Sultanate. The Sultanate extended its authority directly over the conquered regions
from 1311 to 1335 and then through the semi-independent Ma'bar Sultanate from 1335 to 1378.
9
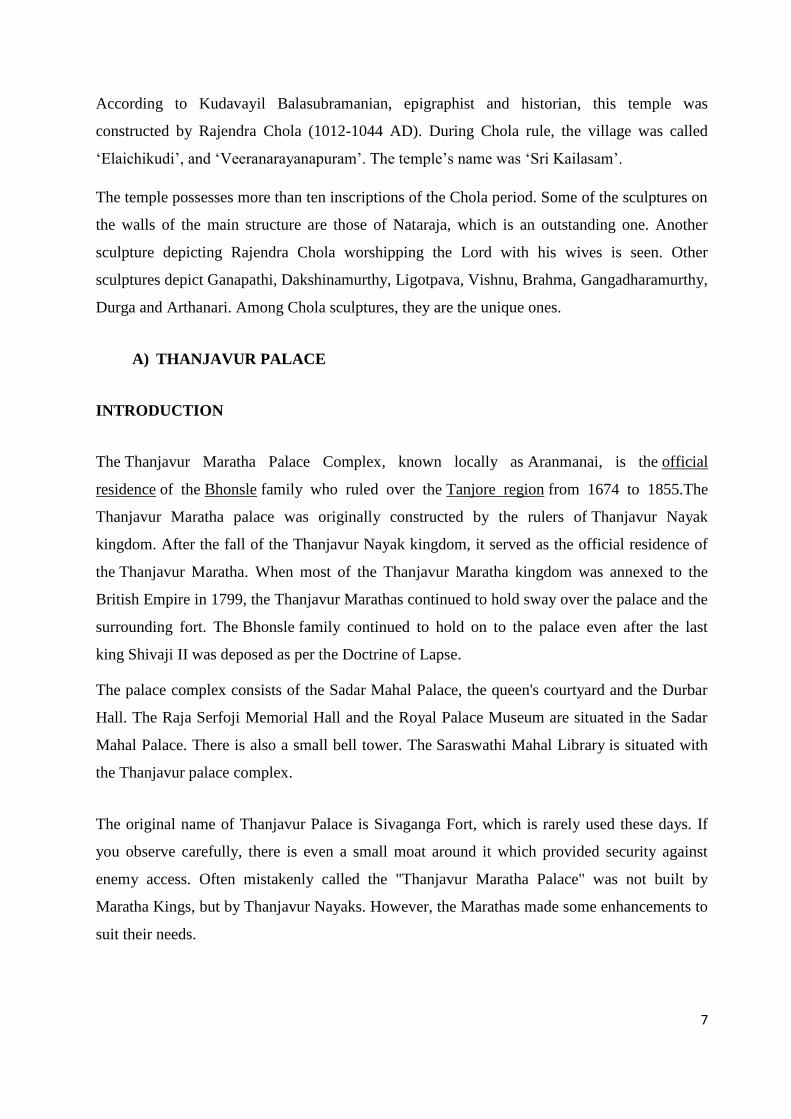
Starting from the 1350s, the Ma'bar Sultanate was steadily absorbed into the rising Vijayanagar
Empire.
Fig 2.1 Thanjavur Royal Palace courtyard
Thanjavur is an important pilgrim centre and a major tourist destination of Tamil Nadu. South
Zone Culture Centre in Thanjavur is one of the regional cultural centres established by the
Government of India to preserve and promote cultural heritage of India. There were 2,002,225
Indian and 81,435 foreign tourist arrivals in 2009 to Thanjavur. The Thanjavur Maratha
palace was the official residence of the Bhonsle family who ruled over the Thanjavur region
from 1674 to 1855. It was originally constructed by the rulers of Thanjavur Nayak
kingdom and after their fall, it served as the official residence of the Thanjavur
Marathas. When most of the Thanjavur Maratha kingdom was annexed by the British Empire
in 1799, the Thanjavur Marathas continued to hold sway over the palace and the surrounding
fort. The southern side of the third quadrangle of the palace has 190 ft (58 m) tower like
building, called the Goodagopuram.
The Saraswathi Mahal Library, established around 1700 and located in the premises of the
palace, contains over 30,000 Indian and European manuscripts written on palm leaf and
paper. Over eighty per cent of its manuscripts are in Sanskrit and many of them are on palm
leaves. The Tamil works include treatise on medicine, and commentaries on Sangam
10
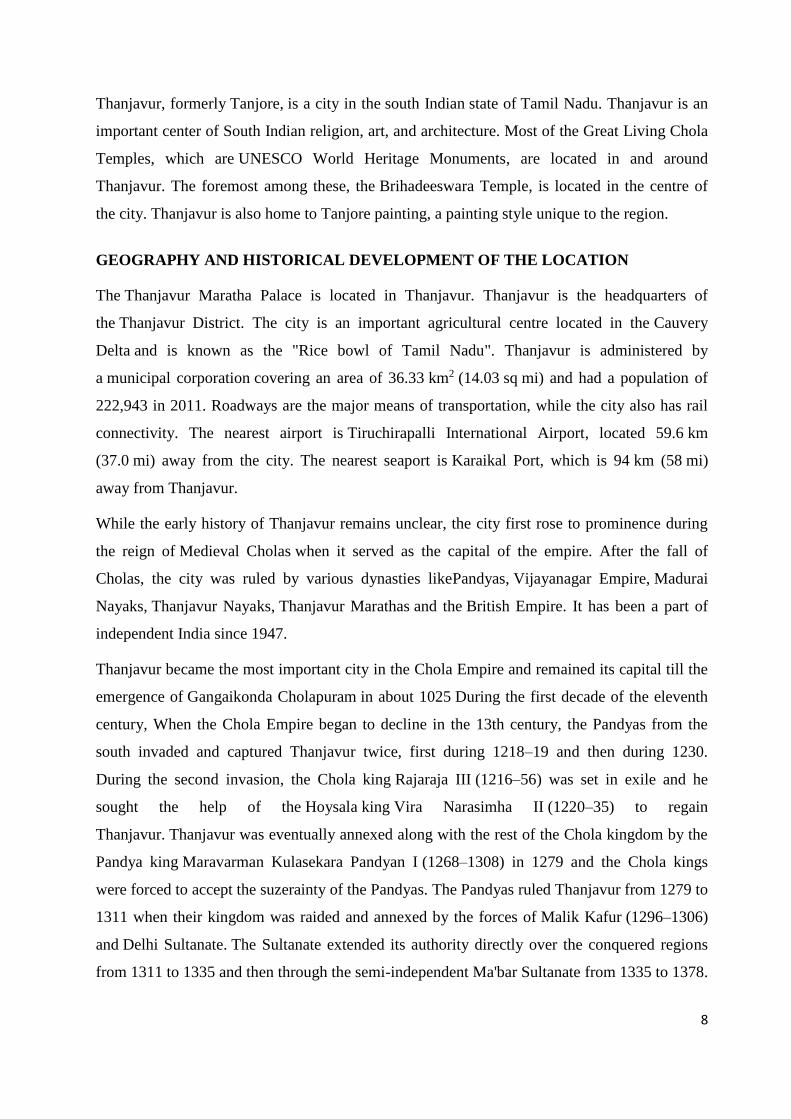
literature. The Rajaraja Chola art gallery is located inside the palace – it has a large collection
of stone and bronze images from the ninth to 12th centuries. Most of the idols present in the
gallery were collected from various temples in the Thanjavur district.
Fig. 2.2 Depicting a Thanjavur painting
Schwartz Church, a historic monument located in the palace garden, was built in 1779
by Serfoji II as a token of affection for Rev. C.V. Schwartz of the Danish Mission. There are
five museums in the city namely Archeological Museum, Tamil University Museum located
with the Tamil University premises, the Saraswathi Mahal Library Museum located inside the
Saraswathi Mahal, Nayak Durbar Hall Art Museum and Rajaraja Chola Museum. Raja Rajan
Manimandapam is one of the tourist attractions in Thanjavur, built during the Thanjavur Tamil
Conference in 1991. "Sangeetha Mahal" has a permanent handicrafts exhibition centre.
Thanjavur is the cradle for many of the arts and crafts in South India. Carnatic musicwas
codified in Thanjavur and the art flourished during the Nayak rule in the 16th century.
Brief History of the Palace
After the fall of Cholas in 1279 A.D, and a few centuries of Pandyan occupation, Sevappa
Nayak captured Thanjavur and became the King in 1532. The construction of Thanjavur Palace
began in 1534 and was completed in 1535, thanks to plenty of local prisoners of war who
provided manual labor. The Palace was officially called "Sivagangai Fort" and was held by the
Nayak family until April 1674, when the Maratha ruler Venkoji captured it. The Marathas
enhanced the original structure and expanded the palace complex. It was used by them until
1799 when British finally annexed the Thanjavur Maratha Kingdom.
11
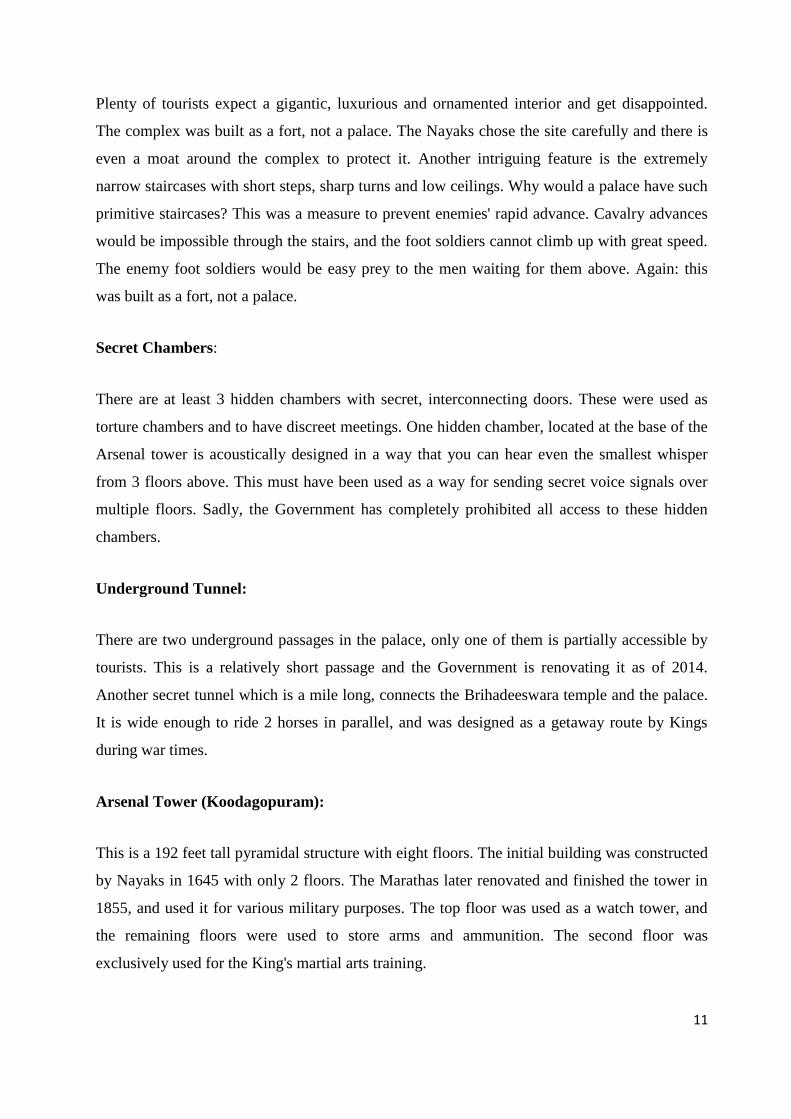
Plenty of tourists expect a gigantic, luxurious and ornamented interior and get disappointed.
The complex was built as a fort, not a palace. The Nayaks chose the site carefully and there is
even a moat around the complex to protect it. Another intriguing feature is the extremely
narrow staircases with short steps, sharp turns and low ceilings. Why would a palace have such
primitive staircases? This was a measure to prevent enemies' rapid advance. Cavalry advances
would be impossible through the stairs, and the foot soldiers cannot climb up with great speed.
The enemy foot soldiers would be easy prey to the men waiting for them above. Again: this
was built as a fort, not a palace.
Secret Chambers:
There are at least 3 hidden chambers with secret, interconnecting doors. These were used as
torture chambers and to have discreet meetings. One hidden chamber, located at the base of the
Arsenal tower is acoustically designed in a way that you can hear even the smallest whisper
from 3 floors above. This must have been used as a way for sending secret voice signals over
multiple floors. Sadly, the Government has completely prohibited all access to these hidden
chambers.
Underground Tunnel:
There are two underground passages in the palace, only one of them is partially accessible by
tourists. This is a relatively short passage and the Government is renovating it as of 2014.
Another secret tunnel which is a mile long, connects the Brihadeeswara temple and the palace.
It is wide enough to ride 2 horses in parallel, and was designed as a getaway route by Kings
during war times.
Arsenal Tower (Koodagopuram):
This is a 192 feet tall pyramidal structure with eight floors. The initial building was constructed
by Nayaks in 1645 with only 2 floors. The Marathas later renovated and finished the tower in
1855, and used it for various military purposes. The top floor was used as a watch tower, and
the remaining floors were used to store arms and ammunition. The second floor was
exclusively used for the King's martial arts training.

12
Fig. 3 The Arsenal Tower at Thanjavur Palace
Bell Tower (Maadamaaligai):
Fig. 4 The Bell Tower was once used as a clock tower (just hourly bells) by locals
13
Chapter 2
METHODOLOGY
2.0 GENERAL
The entire experimental works were carried out in two phases:
Part 1: Characterization of ancient mortar for both locations
Part 2: Simulation of repair mortar
PART 1: CHARACTERIZATION OF ANCIENT MORTAR FOR BOTH LOCATIONS
2.1 REVERSE ENGINEERING METHODOLOGY
The reverse engineering methodology was followed to characterize the ancient mortars as
given in following steps:
Step1: Characterization of historic mortars
Step 2: Selection of raw materials
Step 3: Preparation of mortars
Step 4: Experimental investigation
Step 5: Optimization – Standardization
Step 6: Pilot application of restoration mortars
2.2 CHARACTERIZATION OF HISTORIC MORTARS
Step 1 : Sampling
Step 2 : Chemical analysis
Step 3 : Acid loss analysis
Step 4 : Granulometry of sand
Step 5 : Mineralogical analysis
Step 6 : FT-IR
Step 7 : TGA with DTA
Step 8 : Texture analysis
Step 9 : Organic test
Step 10 : Interpretation of results
14
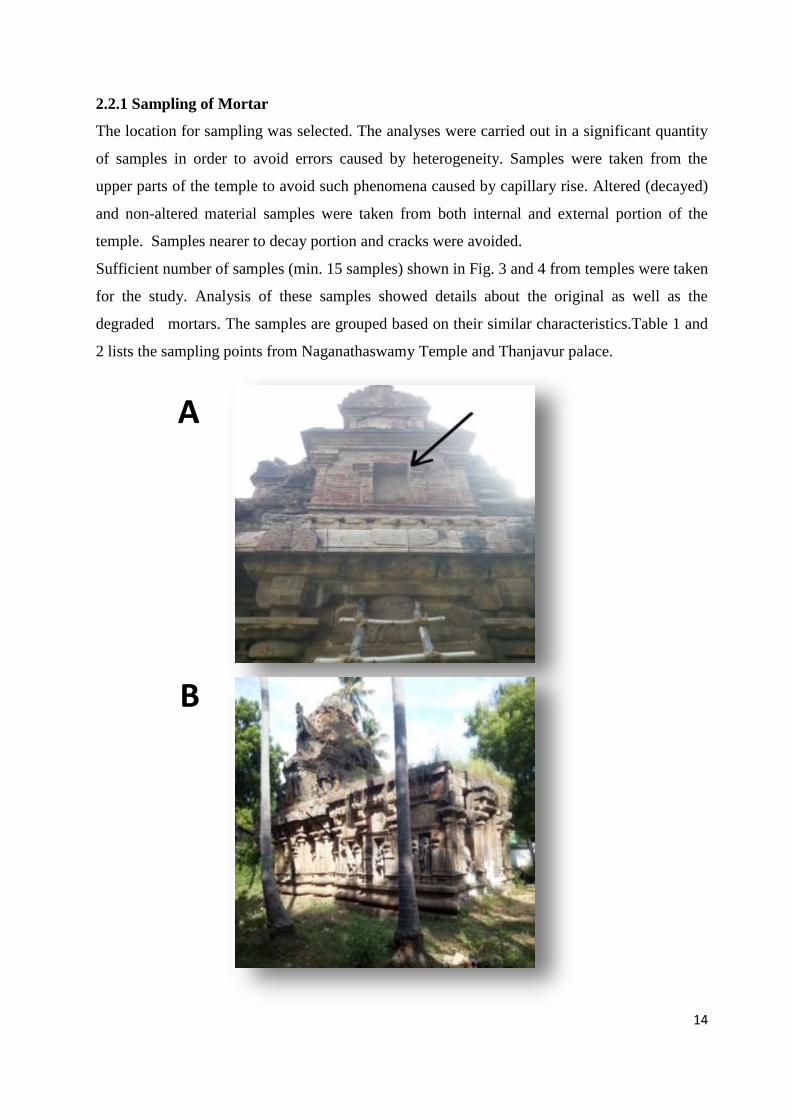
2.2.1 Sampling of Mortar
The location for sampling was selected. The analyses were carried out in a significant quantity
of samples in order to avoid errors caused by heterogeneity. Samples were taken from the
upper parts of the temple to avoid such phenomena caused by capillary rise. Altered (decayed)
and non-altered material samples were taken from both internal and external portion of the
temple. Samples nearer to decay portion and cracks were avoided.
Sufficient number of samples (min. 15 samples) shown in Fig. 3 and 4 from temples were taken
for the study. Analysis of these samples showed details about the original as well as the
degraded mortars. The samples are grouped based on their similar characteristics.Table 1 and
2 lists the sampling points from Naganathaswamy Temple and Thanjavur palace.
A
B

15
Fig 3 : A) Main Mandabam Top Dome B) East Entrance left side C) Person collecting
the sample D) Inner portion of the wall of the Naganathaswamy Temple
Table.1 Sample identification at Naganathaswamy Temple
S.No Sample Name Type of Mortar Location
1 N.S-1 Plastered Mortar East Entrance left side
2 N.S-2 Bedding Mortar Entrance wall
3 N.S-3 Bedding Mortar Compound wall East
4 N.S-4 Plastered Mortar Compound wall Out side
5 N.S-5 Bedding Mortar Main Mandabam
6 N.S-6 Plastered Mortar Near Vinayagar statue
7 N.S-7 Bedding Mortar Main Mandabam Back Side
8 N.S-8 Bedding Mortar Small Mandabam SW corner
9 N.S-9 Plastered Mortar West small Mandabam
10 N.S-10 Bedding Mortar Small Mandabam NW corner
11 N.S-11 Bedding Mortar Main Mandabam North facing
12 N.S-12 Bedding Mortar Vinayagar Temple inner Dome
13 N.S-13 Flooring Mortar Main Mandabam inner Flooring
14 N.S-14 Bedding Mortar Main Mandabam Beam
15 N.S-15 Plastered Mortar Main Mandabam Top Dome
C D
16
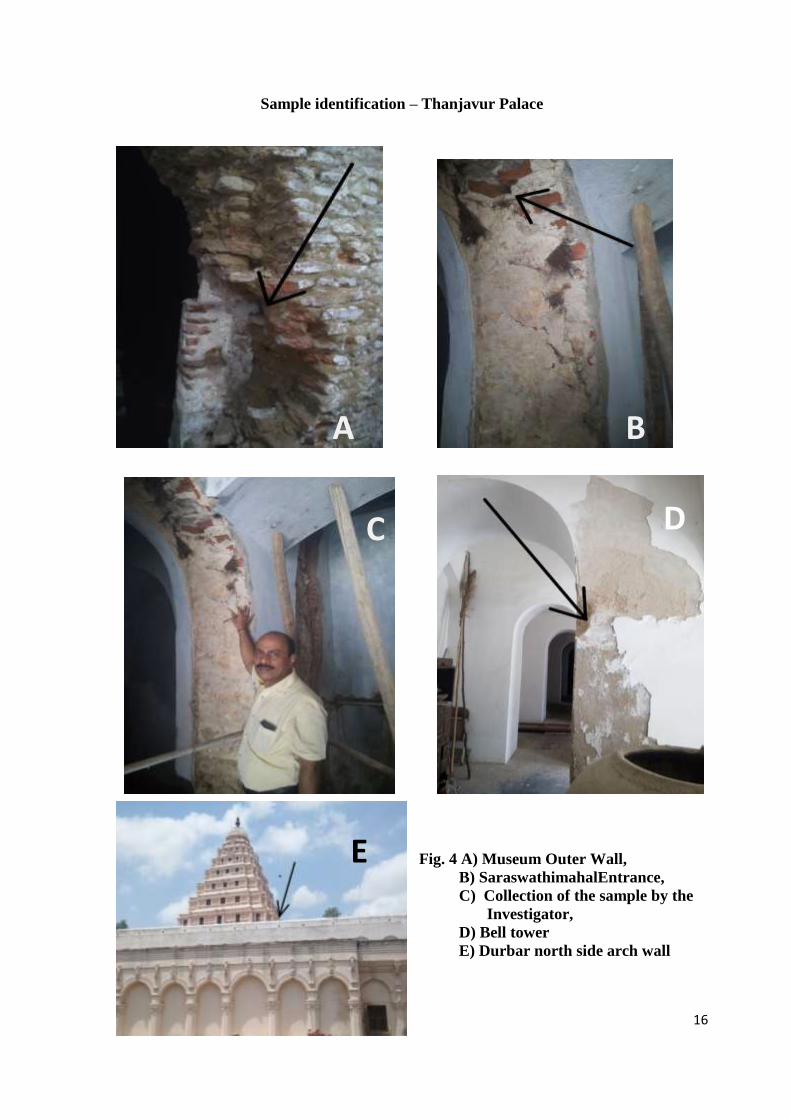
Sample identification – Thanjavur Palace
Fig. 4 A) Museum Outer Wall,
B) SaraswathimahalEntrance,
C) Collection of the sample by the
Investigator,
D) Bell tower
E) Durbar north side arch wall
A B
C D
E

17
Table 2 Sample identification at Thanjavur Palace
S.No Sample Name Type of Mortar Location
1 T.P-1 Mud Mortar Back to Amman Statue
2 T.P-2 Bedding Mortar Near Library
3 T.P-3 Plastered Mortar Durbar entrance
4 T.P-4 Bedding Mortar Arch/Durbar hall
5 T.P-5 Bedding Mortar Bell tower / First floor
6 T.P-6 Bedding Mortar Elephant tieng place
7 T.P-7 Plastered Mortar Arch/Ticket counter
8 T.P-8 Plastered Mortar Museum entrance
9 T.P-9 Plastered Mortar Side wall / JE office
10 T.P-10 Plastered Mortar Bell tower / Outer wall
11 T.P-11 Bedding Mortar Library entrance
12 T.P-12 Bedding Mortar North wall/ Durbar hall
13 T.P-13 Plastered Mortar Inner wall / JE office
14 T.P-14 Plastered Mortar First floor / Durbar hall
15 T.P-15 Plastered Mortar Inside arch / Ticket counter
18
2.2.2Acid loss Test
The dissolution of the mortar in hydrochloric acid yielded three fractions: Insoluble
fraction/soluble fraction from calcium content, clay minerals and volatile fraction.
2.2.3 Organic Test
The presence of fat, protein in both ancient and new mortars were tested using Lane &Eynon
method. The presence of carbohydrate was calculated by Kjeldhal method.
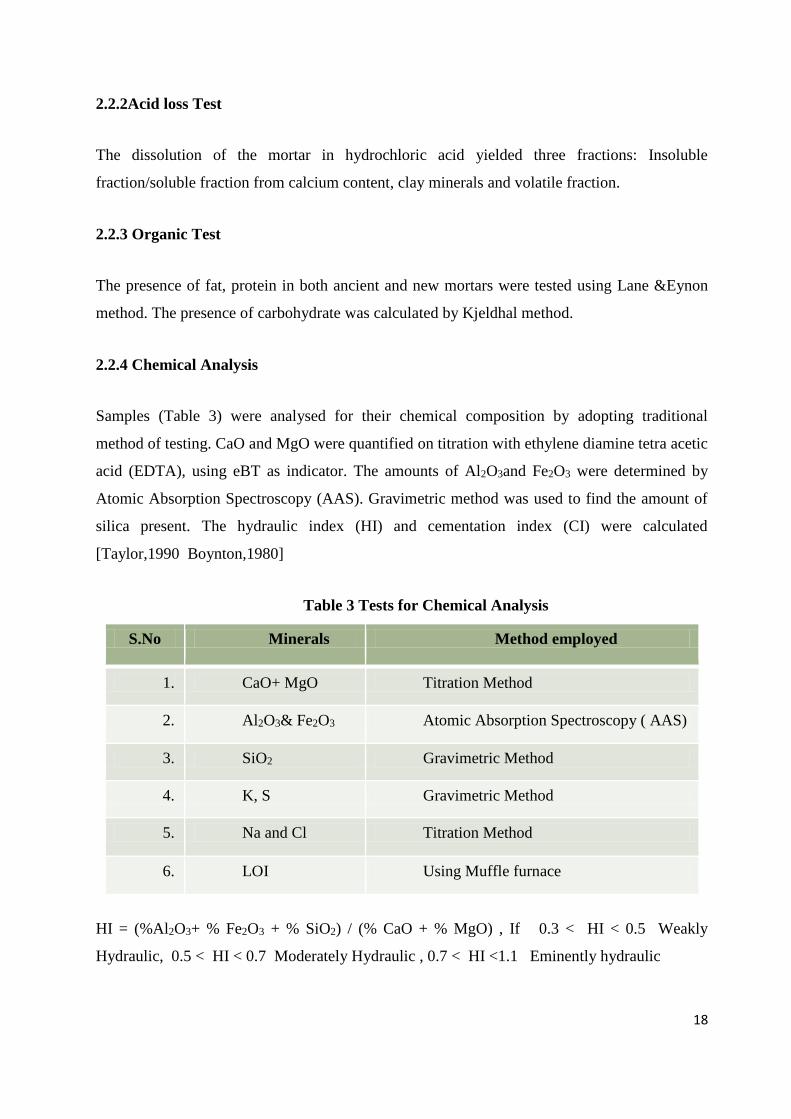
2.2.4 Chemical Analysis
Samples (Table 3) were analysed for their chemical composition by adopting traditional
method of testing. CaO and MgO were quantified on titration with ethylene diamine tetra acetic
acid (EDTA), using eBT as indicator. The amounts of Al2O3and Fe2O3 were determined by
Atomic Absorption Spectroscopy (AAS). Gravimetric method was used to find the amount of
silica present. The hydraulic index (HI) and cementation index (CI) were calculated
[Taylor,1990 Boynton,1980]
Table 3 Tests for Chemical Analysis
S.No Minerals Method employed
1. CaO+ MgO Titration Method
2. Al2O3& Fe2O3 Atomic Absorption Spectroscopy ( AAS)
3. SiO2 Gravimetric Method
4. K, S Gravimetric Method
5. Na and Cl Titration Method
6. LOI Using Muffle furnace
HI = (%Al2O3+ % Fe2O3 + % SiO2) / (% CaO + % MgO) , If 0.3 < HI < 0.5 Weakly
Hydraulic, 0.5 < HI < 0.7 Moderately Hydraulic , 0.7 < HI <1.1 Eminently hydraulic
19
CI = (1.1%Al2O3+ 0.7% Fe2O3 + 2.8 % SiO2) / (% CaO + % MgO)
If 0.3 < CI< 0.5 Weakly Hydraulic, 0.5 < CI < 0.7 Moderately Hydraulic
0.7 < CI<1.1 Eminently hydraulic ,Highly hydraulic Higher the index , more
hydraulic properties.
2.2.5 Binder -Aggregate Ratio
The raw material composition was found by dissolving the carbonated lime in 10 % of
hydrochloric acid, leaving out fine aggregates.
2.2.6 Electronic Particle Size Analyser
The particle size distribution was carried out and grading was done.
2.2.7 Organic Test
The herbs used in preparation of lime mortar was tested for the presence of carbohydrate,
protein and fat.
2.2.8 Analytical Techniques
The analyses of ancient mortars were done using following instrumental techniques.
XRD analysis of finely ground samples was done using Bruker Desktop-Diffracometer
working with the Cu Ka radiation and interpretation by Bruker DIFFRAC.SUITEEVA
Software.
Thermal Gravimetric Analysis (TGA) was performed to find the hydroscopic and structural
bound water content of lime mortar and it is also helpful to determine any possible thermal
decomposition of mineral phases. Here weight loss of sample was monitored as a function of
temperature. TGA could serve as best tool to characterize and evaluate historic mortars.
20
DTA reveals thermal transformation of various components heated under controlled conditions.
The phase transfers are exothermic or endothermic in nature. DTA was carried out on non-
fractioned mortar to find the dehydration, oxidation and decomposition
Infrared Spectroscopy (FT-IR analysis) provides supplementary information to XRD. It is
mainly carried out to identify the presence of organics in the mortars.
SEM (FEI Quanta FEG 200) was used to determine the surface morphology of the mortars,
specially cracks and pores of the samples. SEM images revealed the mineral morphology of
hydrated phases.
EDX was used to unveil the elemental composition of mortars.
PART- II SIMULATION OF REPAIR MORTAR
The objective of the work is to simulate the similar mortar by trial and error in the laboratory
and to evaluate its compatibility.
2.3 MATERIALS USED
2.3.1 Lime
Mortars were prepared using commercial natural hydraulic lime. Lime was purchased from
Pollachi, Coimbatore that is being used widely in the restoration works. Lime used in the study
is a uniform material manufactured by an industrial process. It was obtained by ignition of the
regionally available limestone. The lime was slaked in a traditional manner in huge vats. After
sieving to remove larger and unslaked particles, it was left to settle for one month before being
transferred to 25 Kg plastic bags. The lime has a particle size of 850 microns below to be used
in lime mortar.
21
2.3.1.1 Chemical characteristics of lime
There is a varied geological distribution in India. Hence several kinds of lime stones are
available. These lime stone are burnt to obtain building lime. Due to the variability of limestone
from place to place, the resulting lime is expected to vary in quality. Hence, chemical
characteristics were carried out as per IS: 6932 (Part V) - 1973. The hydraulic lime used for
investigation was subjected to preliminary chemical analysis by Atomic Absorption
Spectrometry (AAS) and gravimetric method. Oxides such as calcium oxide and magnesium
oxide, silica, alumina and ferric oxides were determined to identify the class of the lime and to
assess the hydraulicity of lime.
2.3.1.2 Physical characteristics of lime
Field tests on building lime
Lime is a reactive material and constantly undergoes chemical changes on exposure to the
atmosphere. Even during manufacture there are chances of variability in the quality. Therefore,
it is necessary to check the quality of lime at various stages. For quick and reliable results
simple field tests on lime such as visual examination, ball test, and hydrochloric acid test have
been done as per IS: 1624- 1986.
(a) VISUAL EXAMINATION
Lime was examined for color and state of aggregation namely lumpy, powdery, soft or hard.
Class C lime and class D lime mostly used for white washing are white in color. Lumpy form
may indicate quicklime or unburnt limestone. Lime free from coarse and gritty pieces larger
than about 2.30 mm may be categorized as Class ‘A ‘ lime.
(b) BALL TEST
Ball test was conducted as per IS: 1624 – 1986, where lime was sieved through 850
microns sieve. Then the lime was mixed with sufficient quantity of water to get a stiff paste and
22
a ball of 50 mm diameter was prepared and it was left undisturbed for a period of six hours.
Then the ball was gently immersed in a jar of water.
The codal guidelines for assessing the class of lime is as follows.
No signs of disintegration - Class A lime
Very little expansion and numerous cracks - Class B lime
Signs of disintegration within few minutes - Class C or Class D lime
(c) HYDROCHLORIC ACID TEST
The test was conducted as per IS: 1624 - 1986. Lime was examined to find out the presence of
inert material. Sufficient quantity of lime was placed into a 50 ml glass cylinder up to 5 ml
mark. Twenty five ml hydrochloric acid was added into the cylinder along the glass rod placed
inside so that the acid does not get smeared all over the sides of the cylinder. The contents were
stirred with a glass rod. The cylinder was left with the contents for 24 hours to observe the gel
formation.
SETTING TIME OF LIME
Initial and final setting times of lime have been determined according to IS: 6932 (Part 11) -
1973 by using Vicat apparatus. Initial setting time is defined as the time measured from mixing
binder with water to the time at which the needle fails to pierce the binder paste (5 ± 1) mm
from the base-plate. Initial setting time needle was replaced by an annular arrangement for the
determination of final setting time. The lime is considered as finally set when the needle
applied on the surface of test block fails to make an impression.
2.4 SAND
Sand is used as an aggregate in mortars, plasters and renders. The properties of sand used in the
mix have a major effect on its workability, final strength and durability.The quality of sand is
of primary importance in achieving a high-quality lime mortar. Sand provides the structural
23
strength, with the lime putty coating and cementing the particles together. In this investigation,
clean river sand free from organic and inorganic particles were used as aggregates in mortar
preparation.
2.4.1 Grain size distribution
Grain size distribution of sand have been determined as per IS: 2386 (Part 1) - 1963 on
mechanical sieve shaker with sieve series (square mesh) of size 2.36 mm, 1.18 mm, 0.6 mm,
0.3 mm, 0.15 mm and 0.075 mm, with sieving time of 10 minutes. Individual fractions were
weighed, and the results were plotted.
2.5PREPARATION OF MORTAR SPECIMENS
A mix proportion of 1:3 (1 part of hydraulic lime, 3 parts of sand) by weight was chosen which
has been considered as the most common mix proportion for restoration works (Moropoulou et
al., 2003). Hydraulic lime mortars were prepared as per Indian standards IS: 6932 Part VII –
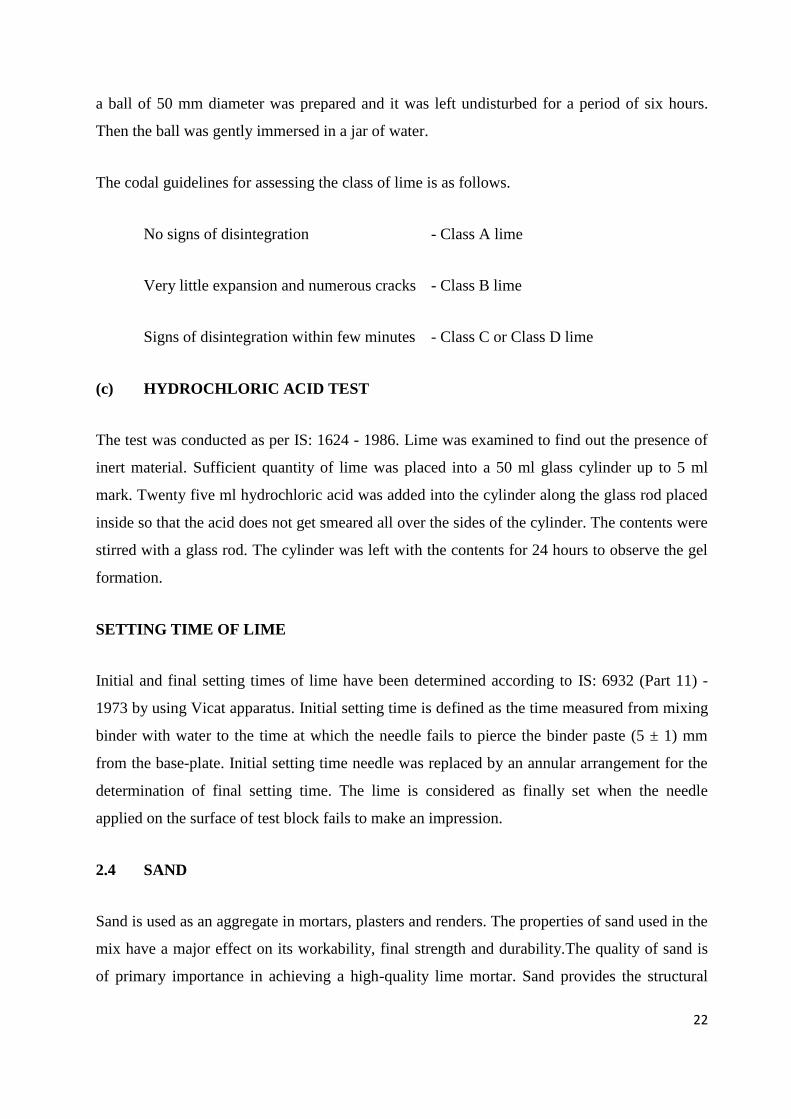
1973. Equal quantities of hydraulic lime and water were thoroughly mixed for five minutes
(lime putty). The hydraulic lime putty so prepared was mixed with sand and then ground for a
period of 8 minutes and then left aside for 24 hours. The (water + AN)/lime ratio was adjusted
to 0.65 at the time of casting. The prepared mortar mixtures were filled into non-corrosive
moulds of dimension 50x50x50 mm cube for compression tests and 40x40x160 mm prism for
flexure tests and gently pressed using the thumb. Steel moulds with zinc coating were used for
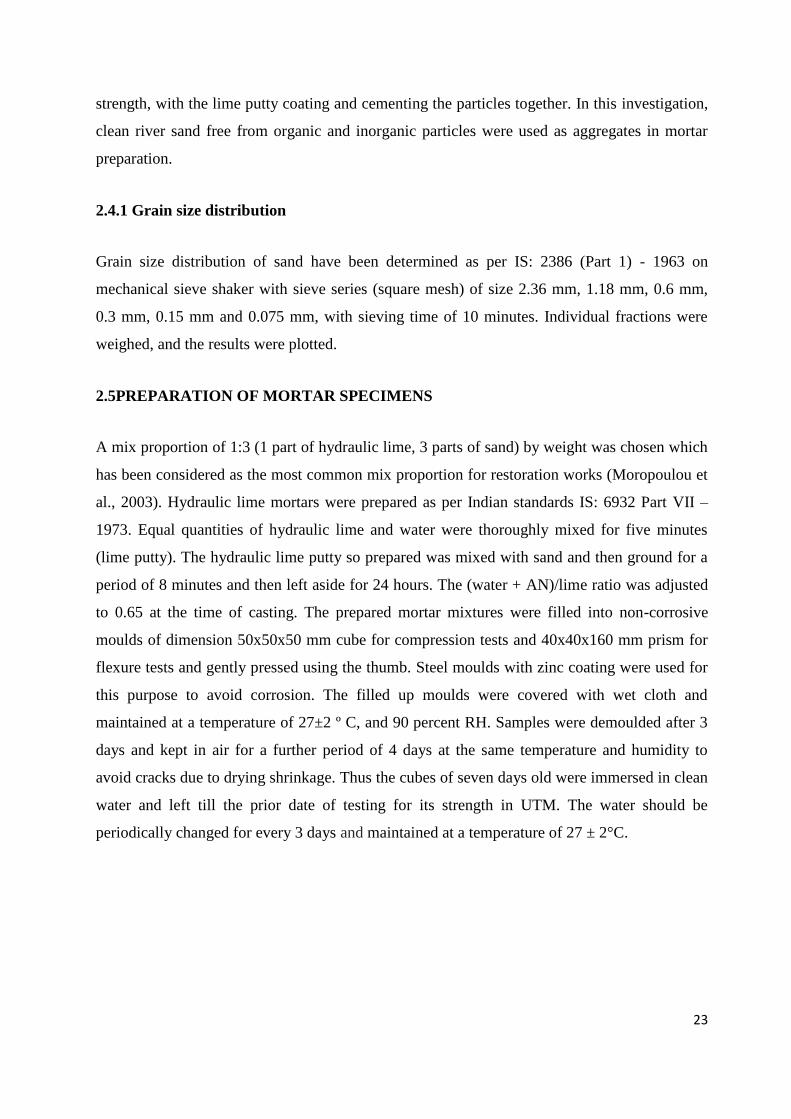
this purpose to avoid corrosion. The filled up moulds were covered with wet cloth and
maintained at a temperature of 27±2 º C, and 90 percent RH. Samples were demoulded after 3
days and kept in air for a further period of 4 days at the same temperature and humidity to
avoid cracks due to drying shrinkage. Thus the cubes of seven days old were immersed in clean
water and left till the prior date of testing for its strength in UTM. The water should be
periodically changed for every 3 days and maintained at a temperature of 27 ± 2°C.
24
Fig 5 Preparation of Mortar Mix
Fig 6 curing of casted specimens
2.6 CONSISTENCY TEST ON LIME MORTAR
The typical consistency of a Lime paste is the consistency, which will permit the Vicat plunger
to penetrate to a point 5 to 7 millimeter from the bottom of the mould. Lime and water of
weighted quantity is taken and made as paste, taking care that the time of mixing was not less
25
than three minutes nor more than five minutes and the gauging is completed before any sign of
setting occurs. The time should be noted immediately after the water is added to the lime. Then
the vicatmould is filled up with this paste in three layers, compacting each layer by keeping the
mould on a non-porous glass plate and the top surface is smoothened. This whole set up is then
placed under the plunger so that it touches gently on the surface of the paste and it is released at
once so that it penetrates into the paste. This operation was repeated for different trial mixes
and the consistency was found.
2.7 SETTING TIME ON LIME MORTAR
Initial and final setting times of lime were done as per IS: 6932 (Part 11) – 1973 [11] by using
Vicat apparatus. Initial setting time is the time taken for the needle, which fails to penetrate the
binder paste (5 ± 1) mm from the base-plate. The final setting time was founded out by
replacing the needle by an annular arrangement. The lime was identified as finally set when the
needle fails to make an impression on the surface.
2.8 COMPRESSIVE STRENGTH TEST
The compressive strength test was conducted as per IS: 6932 (Part VII) – 1973 [12]. Three
cubes are taken out from water after 28 days and wiped out so that its surface gets dried.
Keeping those cubes in the low capacity compression-testing machine tests the compressive
strength of these cubes. The casted face should be facing towards the person. The moulded side
should be in contact with the surface through which load is applied. There should not be any
packing between the cube and steel plates of the testing machine. The top steel platen is fixed
with ball bearing and shall be self-adjusting. The load should be stable and uniformly applied,
starting from zero increasing at the rate of 15 kg/min. The average strength of the six
specimens shall be taken as the compressive strength of the mortar and the result expressed in
N/mm2.
26
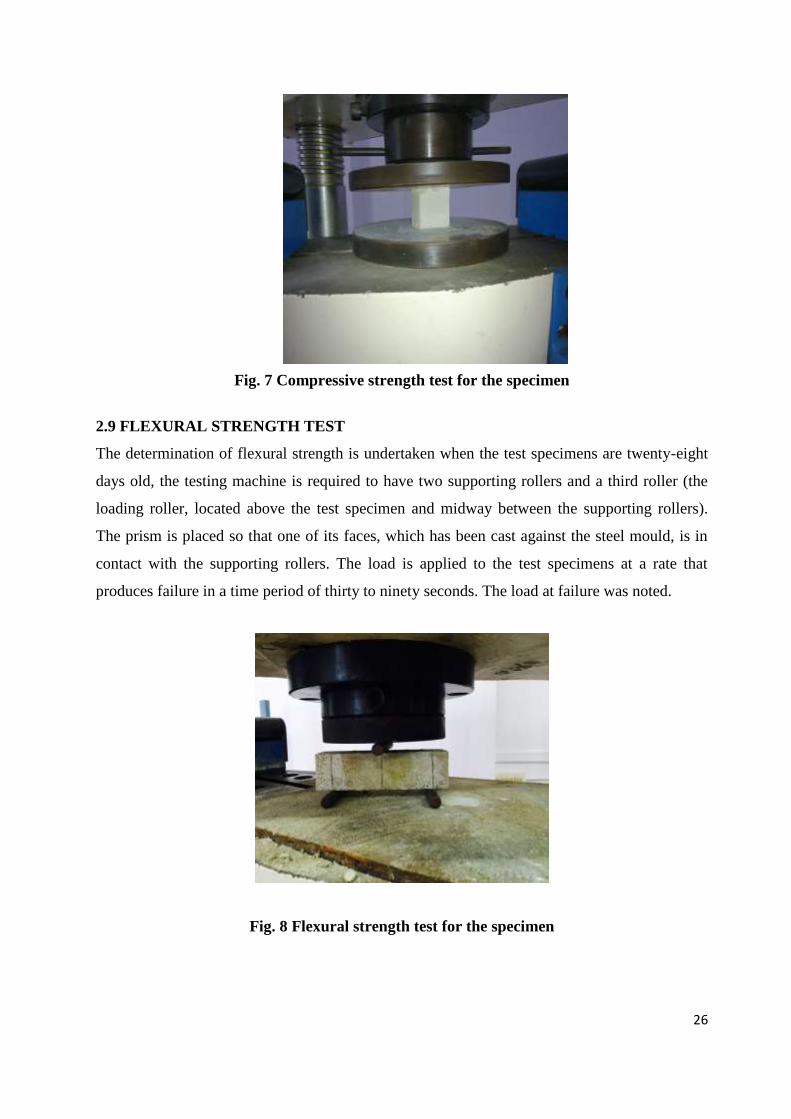
Fig. 7 Compressive strength test for the specimen
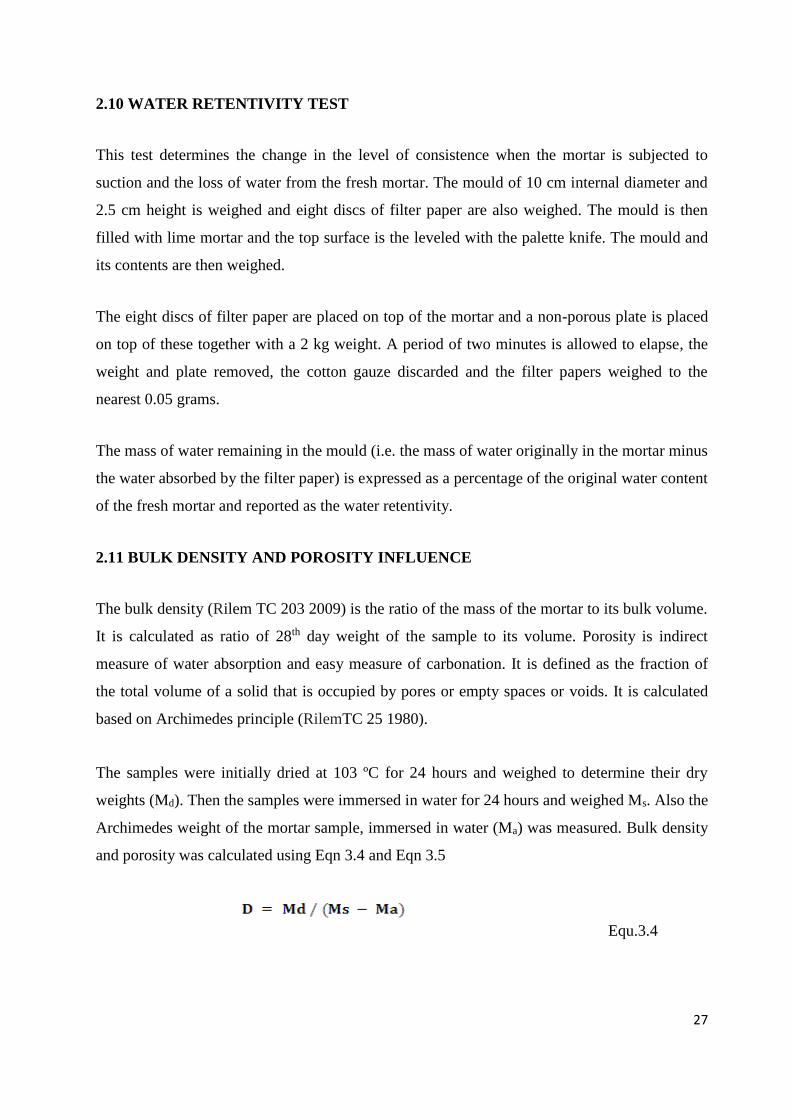
2.9 FLEXURAL STRENGTH TEST
The determination of flexural strength is undertaken when the test specimens are twenty-eight
days old, the testing machine is required to have two supporting rollers and a third roller (the
loading roller, located above the test specimen and midway between the supporting rollers).
The prism is placed so that one of its faces, which has been cast against the steel mould, is in
contact with the supporting rollers. The load is applied to the test specimens at a rate that
produces failure in a time period of thirty to ninety seconds. The load at failure was noted.
Fig. 8 Flexural strength test for the specimen
27
2.10 WATER RETENTIVITY TEST
This test determines the change in the level of consistence when the mortar is subjected to
suction and the loss of water from the fresh mortar. The mould of 10 cm internal diameter and
2.5 cm height is weighed and eight discs of filter paper are also weighed. The mould is then
filled with lime mortar and the top surface is the leveled with the palette knife. The mould and
its contents are then weighed.
The eight discs of filter paper are placed on top of the mortar and a non-porous plate is placed
on top of these together with a 2 kg weight. A period of two minutes is allowed to elapse, the
weight and plate removed, the cotton gauze discarded and the filter papers weighed to the
nearest 0.05 grams.
The mass of water remaining in the mould (i.e. the mass of water originally in the mortar minus
the water absorbed by the filter paper) is expressed as a percentage of the original water content
of the fresh mortar and reported as the water retentivity.
2.11 BULK DENSITY AND POROSITY INFLUENCE
The bulk density (Rilem TC 203 2009) is the ratio of the mass of the mortar to its bulk volume.
It is calculated as ratio of 28th day weight of the sample to its volume. Porosity is indirect
measure of water absorption and easy measure of carbonation. It is defined as the fraction of
the total volume of a solid that is occupied by pores or empty spaces or voids. It is calculated
based on Archimedes principle (RilemTC 25 1980).
The samples were initially dried at 103 ºC for 24 hours and weighed to determine their dry
weights (Md). Then the samples were immersed in water for 24 hours and weighed Ms. Also the
Archimedes weight of the mortar sample, immersed in water (Ma) was measured. Bulk density
and porosity was calculated using Eqn 3.4 and Eqn 3.5
Equ.3.4
28
Porosity of the mortar was calculated using Eqn. below
Equ.3.5
Where
D - Bulk Density (g/cm3)
Md- Dry mass (g)
Ms- Saturated mass (g)
Ma- Archimedes mass (g)
2.12 CAPILLARY ABSOPTION
Sasse and Snethlage [1997] observed that the water transport characteristics of the mortar and
substrate must be similar to avoid differential discolouration over time and strong weathering
along the contact zones. In addition to this, these properties exert an influence on deterioration
mechanisms such as salt crystallization and freeze-thaw, which are the result of the movement
of water into, through and out of stone [Russell et al, 2002]. Bromblet [2000] used these tests to
make comparisons between mortars and stones in order to assess compatibility following the
Sasse & Snethlage precepts. The presence of large pores confers resistance to freezing since
they provide space into which ice crystals can expand without causing damage [Balksten&
Magnusson, 2004]. It is found by using
Where, C – Capillary absorption
m90 – Weight of sample after 90 min (g)
m10 - Weight of sample after 10 min (g)

29
Chapter 3
RESULTS AND DISCUSSSIONS
3.1 SAMPLE PREPARATION
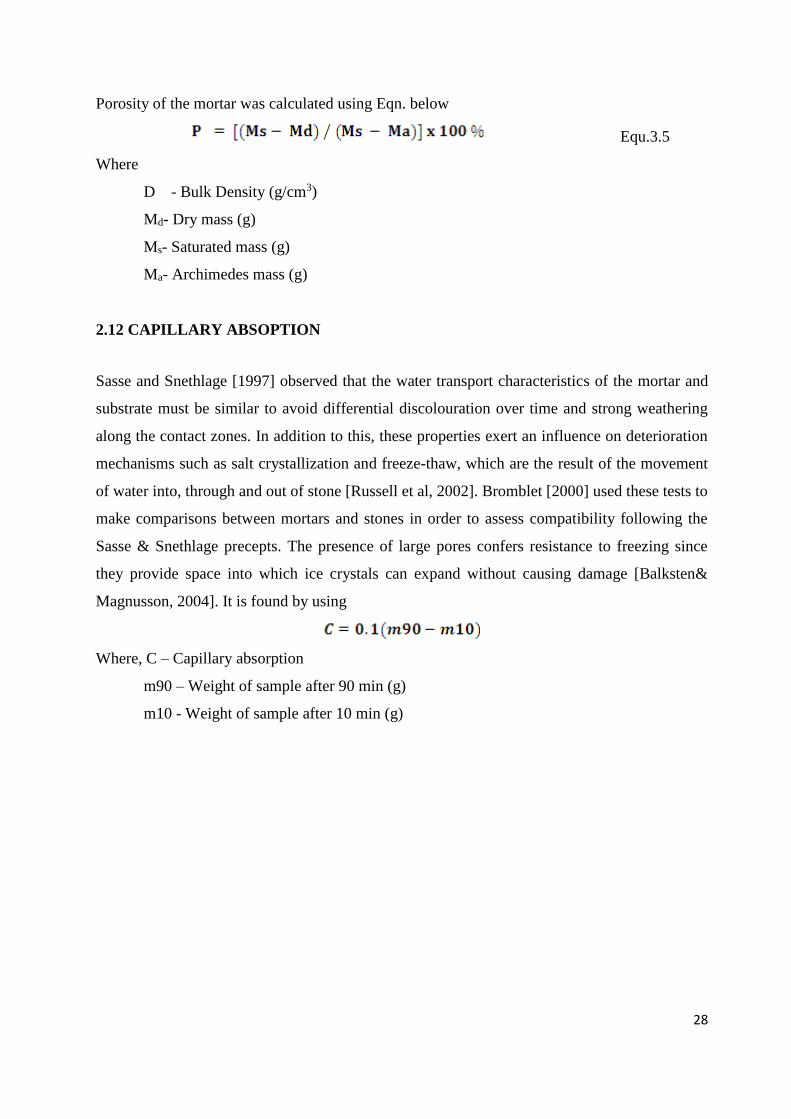
The collected samples (Fig. 9) are crushed with mild pressure in hand and sieved through 63µm
sieve. The lime particles passing thorough sieve will be binder rich content is collected. The
acid loss analysis was carried on this portion.
Fig.9 Altered and Unaltered lime mortar samples
30
Fig. 10 Rich binder less than 63µm
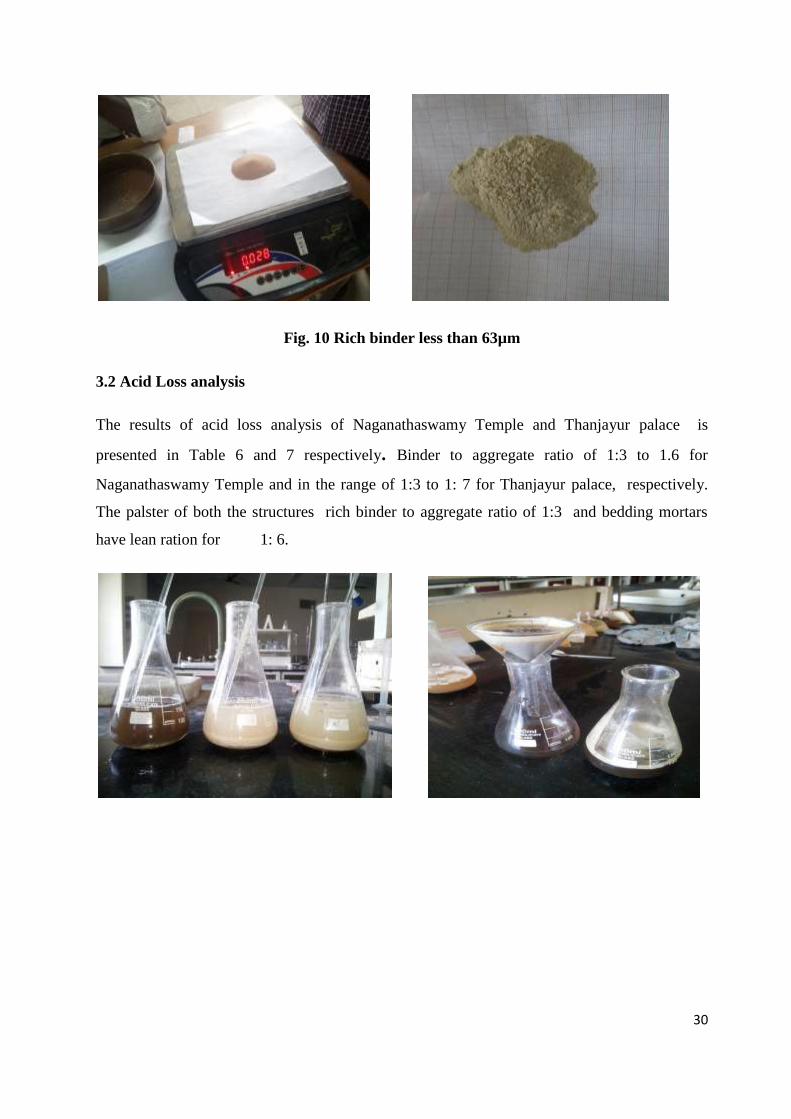
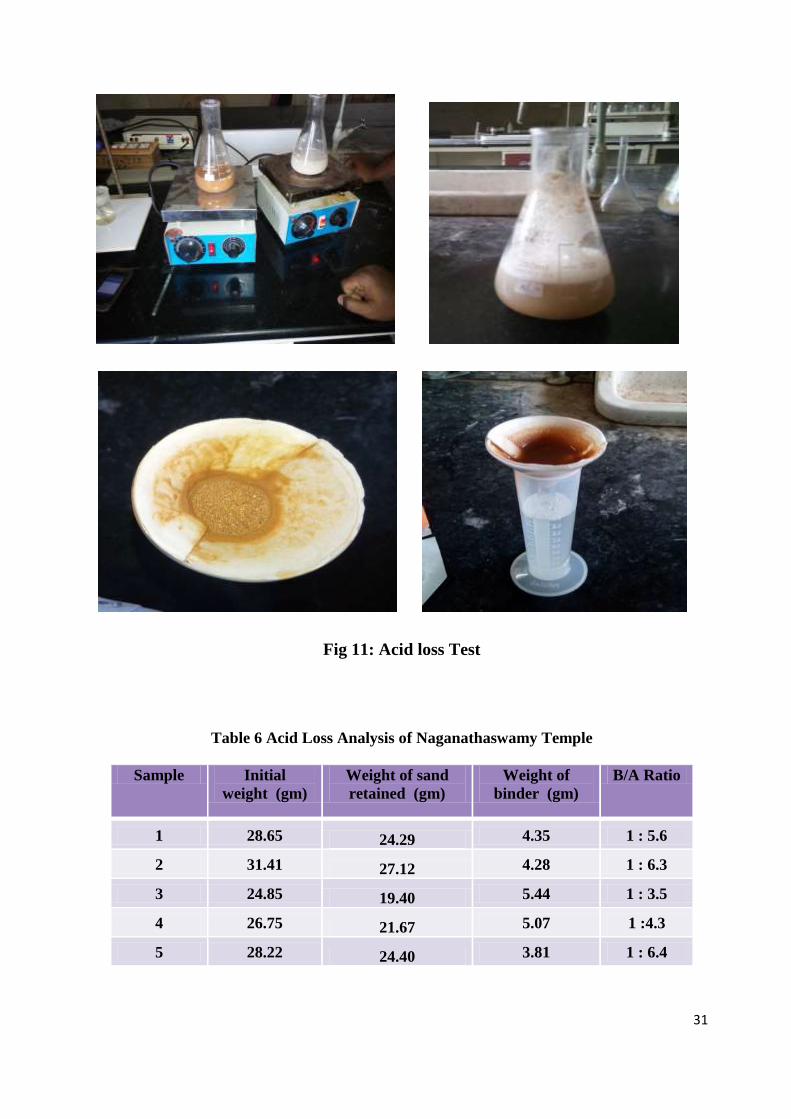
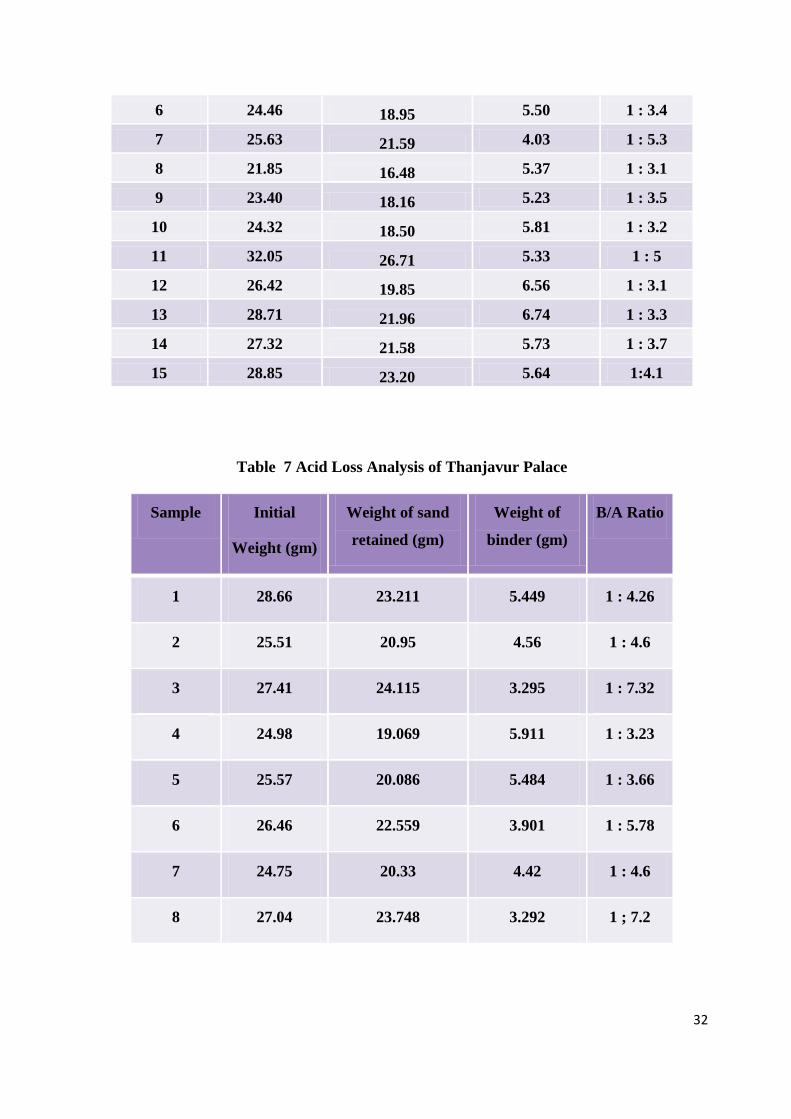
3.2 Acid Loss analysis
The results of acid loss analysis of Naganathaswamy Temple and Thanjayur palace is
presented in Table 6 and 7 respectively. Binder to aggregate ratio of 1:3 to 1.6 for
Naganathaswamy Temple and in the range of 1:3 to 1: 7 for Thanjayur palace, respectively.
The palster of both the structures rich binder to aggregate ratio of 1:3 and bedding mortars
have lean ration for 1: 6.
31
Fig 11: Acid loss Test
Table 6 Acid Loss Analysis of Naganathaswamy Temple
Sample Initial
weight (gm)
Weight of sand
retained (gm)
Weight of
binder (gm)
B/A Ratio
1 28.65 24.29 4.35 1 : 5.6
2 31.41 27.12 4.28 1 : 6.3
3 24.85 19.40 5.44 1 : 3.5
4 26.75 21.67 5.07 1 :4.3
5 28.22 24.40 3.81 1 : 6.4
32
6 24.46 18.95 5.50 1 : 3.4
7 25.63 21.59 4.03 1 : 5.3
8 21.85 16.48 5.37 1 : 3.1
9 23.40 18.16 5.23 1 : 3.5
10 24.32 18.50 5.81 1 : 3.2
11 32.05 26.71 5.33 1 : 5
12 26.42 19.85 6.56 1 : 3.1
13 28.71 21.96 6.74 1 : 3.3
14 27.32 21.58 5.73 1 : 3.7
15 28.85 23.20 5.64 1:4.1
Table 7 Acid Loss Analysis of Thanjavur Palace
Sample Initial
Weight (gm)
Weight of sand
retained (gm)
Weight of
binder (gm)
B/A Ratio
1 28.66 23.211 5.449 1 : 4.26
2 25.51 20.95 4.56 1 : 4.6
3 27.41 24.115 3.295 1 : 7.32
4 24.98 19.069 5.911 1 : 3.23
5 25.57 20.086 5.484 1 : 3.66
6 26.46 22.559 3.901 1 : 5.78
7 24.75 20.33 4.42 1 : 4.6
8 27.04 23.748 3.292 1 ; 7.2
33
9 22.82 18.38 4.44 1 : 4.14
10 19.54 16.73 2.81 1 : 5.9
11 26.55 21.587 4.963 1 : 4.35
12 24.68 20.835 3.845 1 : 5.42
13 26.45 22.252 4.198 1 : 5.3
14 26.51 22.991 3.519 1 : 6.5
15 23.46 19.525 3.935 1 : 4.96
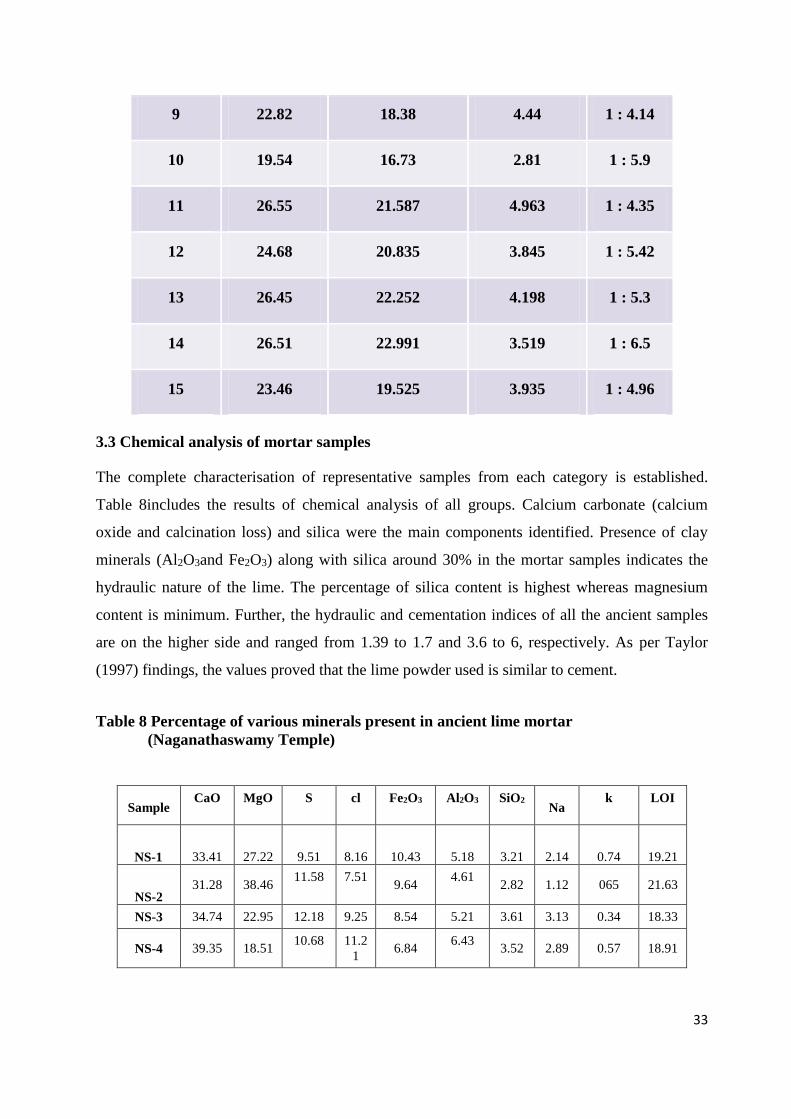
3.3 Chemical analysis of mortar samples
The complete characterisation of representative samples from each category is established.
Table 8includes the results of chemical analysis of all groups. Calcium carbonate (calcium
oxide and calcination loss) and silica were the main components identified. Presence of clay
minerals (Al2O3and Fe2O3) along with silica around 30% in the mortar samples indicates the
hydraulic nature of the lime. The percentage of silica content is highest whereas magnesium
content is minimum. Further, the hydraulic and cementation indices of all the ancient samples
are on the higher side and ranged from 1.39 to 1.7 and 3.6 to 6, respectively. As per Taylor
(1997) findings, the values proved that the lime powder used is similar to cement.
Table 8 Percentage of various minerals present in ancient lime mortar
(Naganathaswamy Temple)
Sample CaO
MgO
S cl Fe2O3
Al2O3
SiO2
Na
k
LOI
NS-1 33.41 27.22 9.51 8.16 10.43 5.18 3.21 2.14 0.74 19.21
NS-2 31.28 38.46
11.58 7.51 9.64
4.61 2.82 1.12 065 21.63
NS-3 34.74 22.95 12.18 9.25 8.54 5.21 3.61 3.13 0.34 18.33
NS-4 39.35 18.51 10.68 11.2
1 6.84
6.43 3.52 2.89 0.57 18.91
34
NS-5 28.35 23.64 13.51 8.34 11.15 9.83 2.16 1.89 1.08 22.04
NS-6 31.93 19.55 12.87 10.6
9 7.22
11.61 3.28 2.14 0.68 17.47
NS-7 26.27 29.31 9.24 9.37 8.31 7.11 5.92 3.53 0.94 19.07
NS-8 40.15 12.51 13.81 11.6
3 9.14
4.62 4.33 2.72 1.12 21.73
NS-9 33.43 16.65 14.29 10.2
7 12.51
6.46 4.08 1.83 0.52 20.69
NS-10 43.14 10.86 8.33 12.1
7 9.43
8.38 5.19 1.68 0.79 19.76
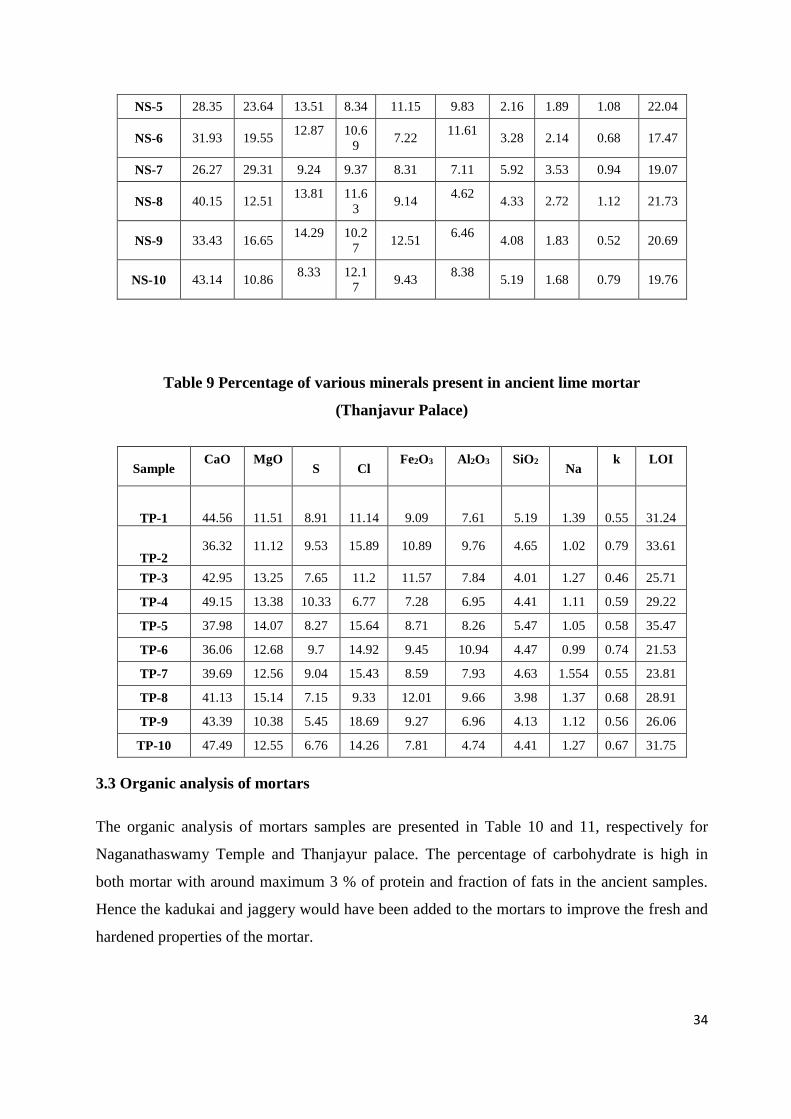
Table 9 Percentage of various minerals present in ancient lime mortar
(Thanjavur Palace)
Sample CaO
MgO
S Cl
Fe2O3
Al2O3
SiO2
Na
k
LOI
TP-1 44.56 11.51 8.91 11.14 9.09 7.61 5.19 1.39 0.55 31.24
TP-2 36.32 11.12 9.53 15.89 10.89 9.76 4.65 1.02 0.79 33.61
TP-3 42.95 13.25 7.65 11.2 11.57 7.84 4.01 1.27 0.46 25.71
TP-4 49.15 13.38 10.33 6.77 7.28 6.95 4.41 1.11 0.59 29.22
TP-5 37.98 14.07 8.27 15.64 8.71 8.26 5.47 1.05 0.58 35.47
TP-6 36.06 12.68 9.7 14.92 9.45 10.94 4.47 0.99 0.74 21.53
TP-7 39.69 12.56 9.04 15.43 8.59 7.93 4.63 1.554 0.55 23.81
TP-8 41.13 15.14 7.15 9.33 12.01 9.66 3.98 1.37 0.68 28.91
TP-9 43.39 10.38 5.45 18.69 9.27 6.96 4.13 1.12 0.56 26.06
TP-10 47.49 12.55 6.76 14.26 7.81 4.74 4.41 1.27 0.67 31.75
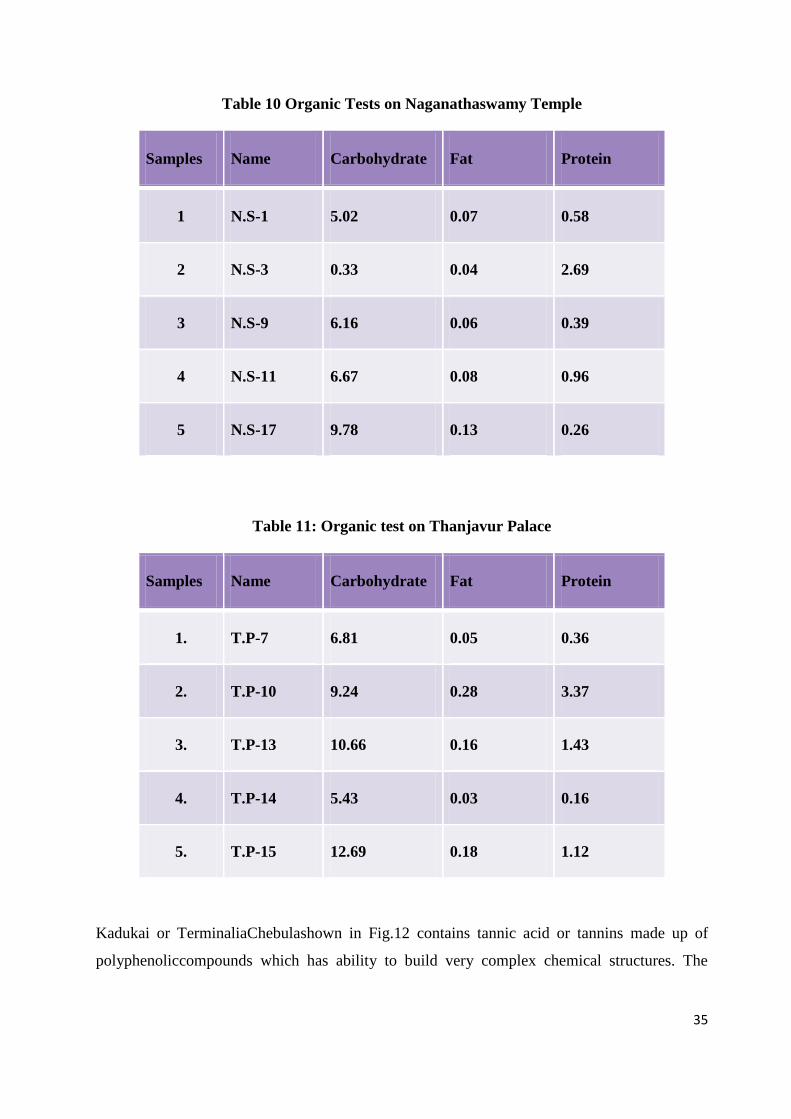
3.3 Organic analysis of mortars
The organic analysis of mortars samples are presented in Table 10 and 11, respectively for
Naganathaswamy Temple and Thanjayur palace. The percentage of carbohydrate is high in
both mortar with around maximum 3 % of protein and fraction of fats in the ancient samples.
Hence the kadukai and jaggery would have been added to the mortars to improve the fresh and
hardened properties of the mortar.
35
Table 10 Organic Tests on Naganathaswamy Temple
Samples Name Carbohydrate Fat Protein
1 N.S-1 5.02 0.07 0.58
2 N.S-3 0.33 0.04 2.69
3 N.S-9 6.16 0.06 0.39
4 N.S-11 6.67 0.08 0.96
5 N.S-17 9.78 0.13 0.26
Table 11: Organic test on Thanjavur Palace
Samples Name Carbohydrate Fat Protein
1. T.P-7 6.81 0.05 0.36
2. T.P-10 9.24 0.28 3.37
3. T.P-13 10.66 0.16 1.43
4. T.P-14 5.43 0.03 0.16
5. T.P-15 12.69 0.18 1.12
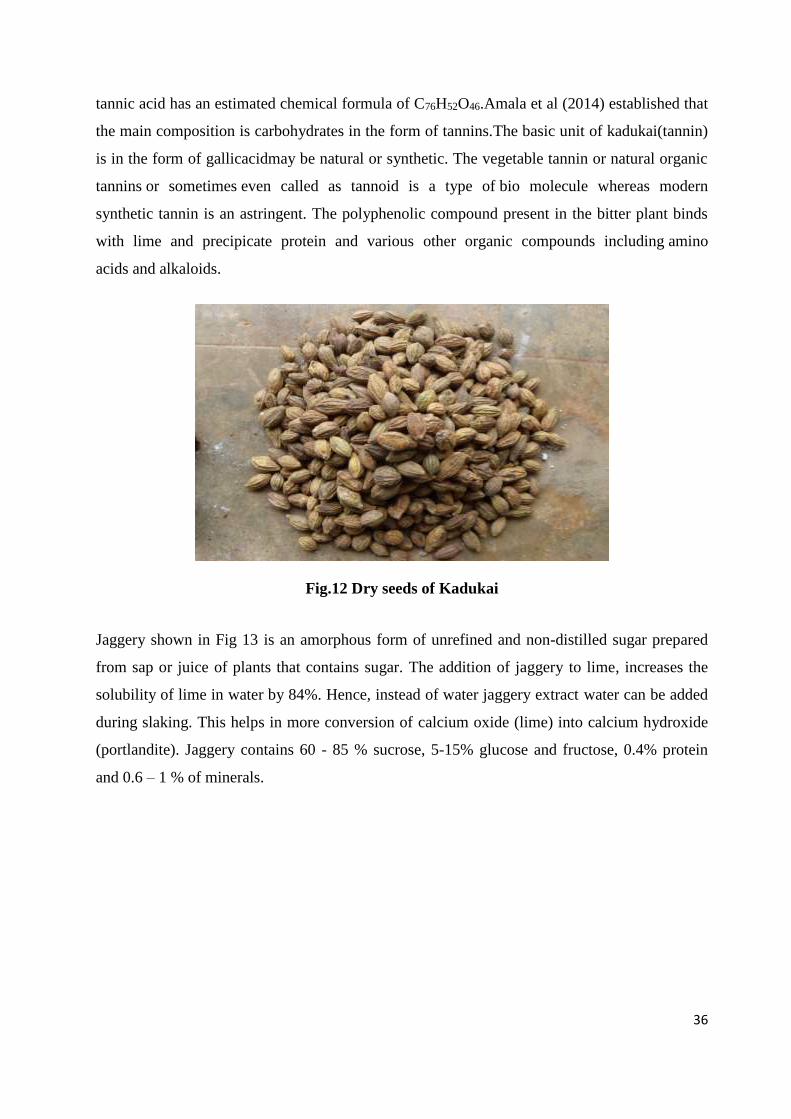
Kadukai or TerminaliaChebulashown in Fig.12 contains tannic acid or tannins made up of
polyphenoliccompounds which has ability to build very complex chemical structures. The
36
tannic acid has an estimated chemical formula of C76H52O46.Amala et al (2014) established that
the main composition is carbohydrates in the form of tannins.The basic unit of kadukai(tannin)
is in the form of gallicacidmay be natural or synthetic. The vegetable tannin or natural organic
tannins or sometimes even called as tannoid is a type of bio molecule whereas modern
synthetic tannin is an astringent. The polyphenolic compound present in the bitter plant binds
with lime and precipicate protein and various other organic compounds including amino
acids and alkaloids.
Fig.12 Dry seeds of Kadukai
Jaggery shown in Fig 13 is an amorphous form of unrefined and non-distilled sugar prepared
from sap or juice of plants that contains sugar. The addition of jaggery to lime, increases the
solubility of lime in water by 84%. Hence, instead of water jaggery extract water can be added
during slaking. This helps in more conversion of calcium oxide (lime) into calcium hydroxide
(portlandite). Jaggery contains 60 - 85 % sucrose, 5-15% glucose and fructose, 0.4% protein
and 0.6 – 1 % of minerals.

37
Fig.13 Jaggery from sugar cane
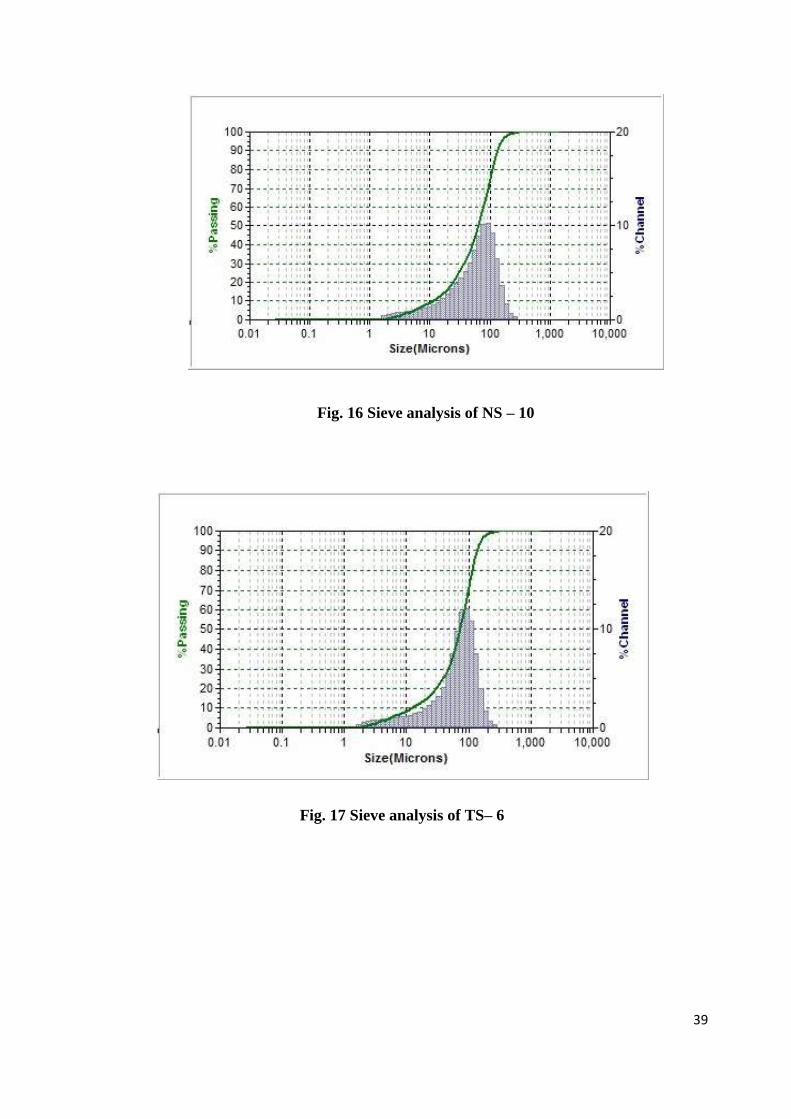
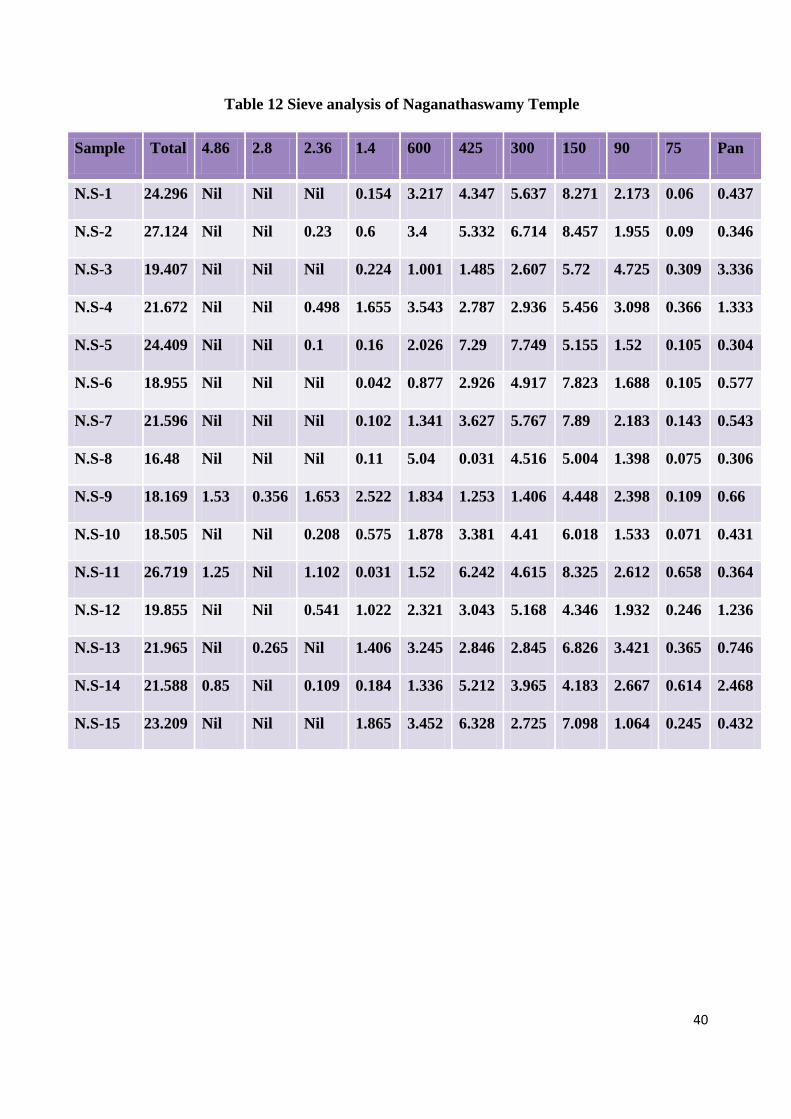
3.4 SIEVE ANALYSIS OF NAGANATHASWAMY TEMPLE
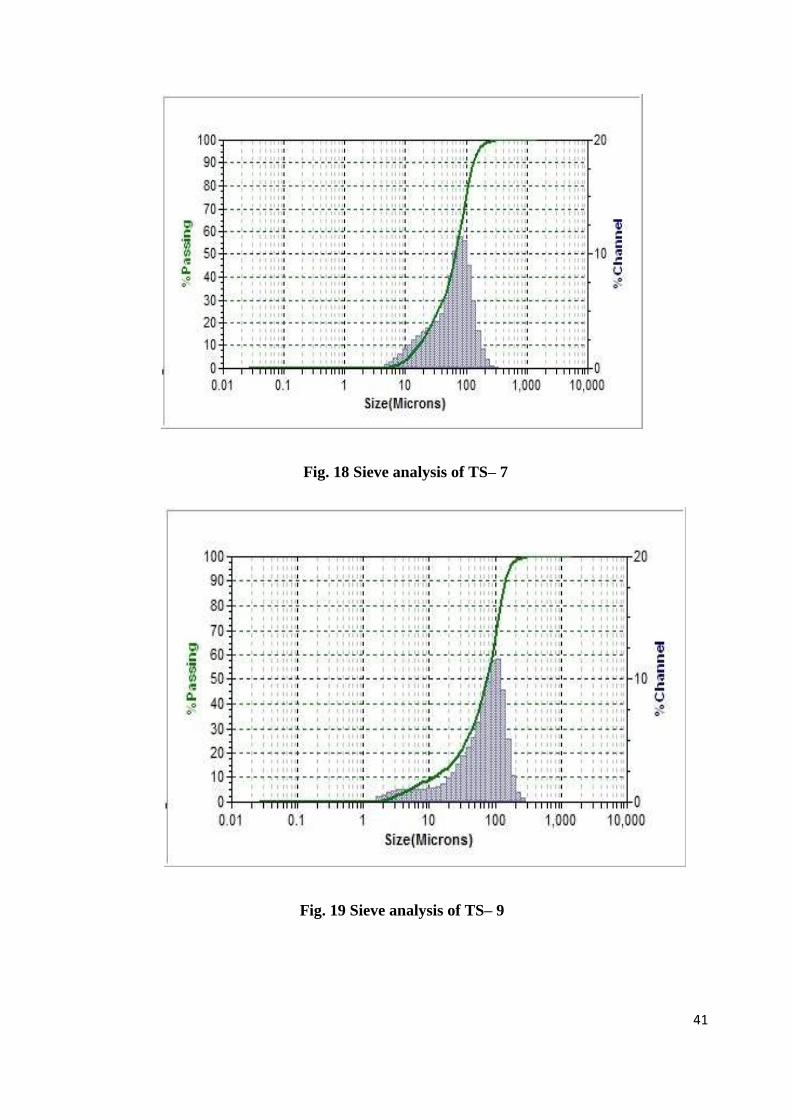
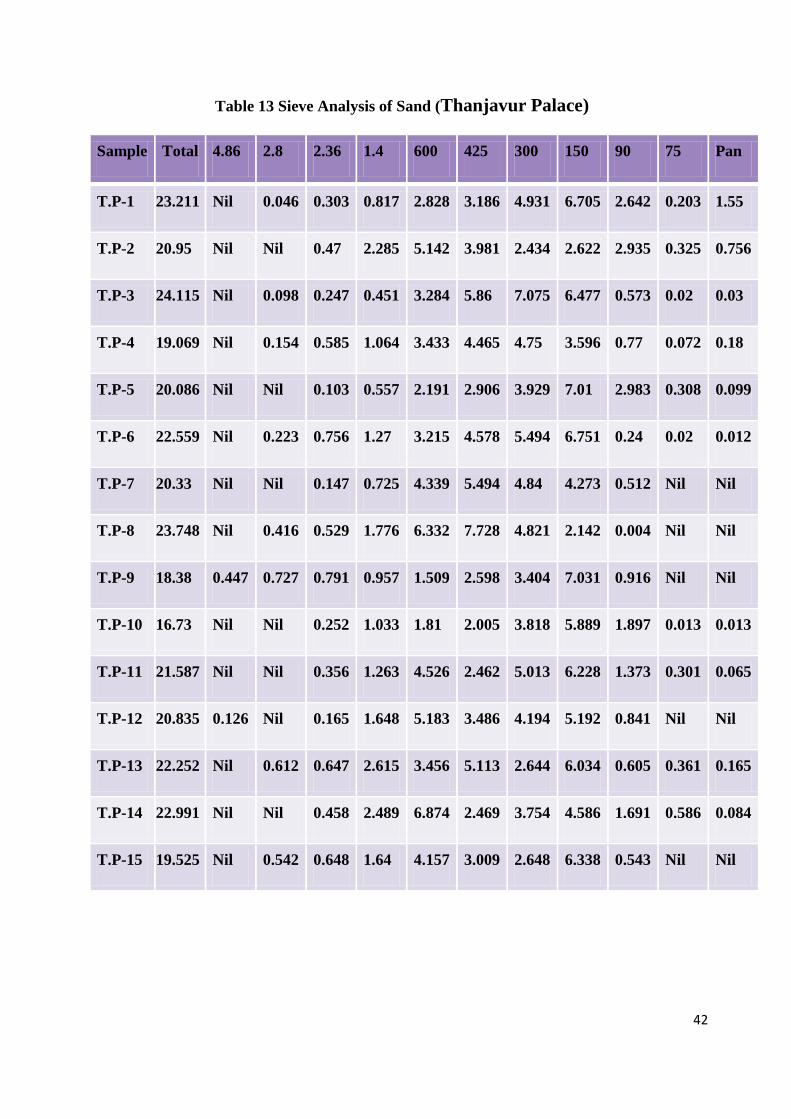
Sieve analysis (Table 12 and 13, Fig. 14 to 19) indicates the uniform graded particles unlike
well graded particles. Hence grinding was done to overcome the short comings of improper
slaking and to improve the pozzolanic activity of lime with clay minerals. Slaking was carried
out during manufacturing of lime. The process of adding and mixing of water to lime is called
slaking which may be wet or dry. In dry slaking less amount of water is added to lime that
cause conversion of partial amount of lime into portlandite. It is preferred when quality of
water is poor or insufficient for use. However, in wet slaking in excess of water when carried
for long duration lasting up to months, the complete transformation of calcium oxide into
portlandite is possible. Moreover, wet slaking will prevent carbonation, the portlandite crystals
formed changes its shape, become smaller and flatter. This allows the crystals to move easily
on other crystals thus aiding workability (Sangeethabais2007). During the process of slaking, a
lot of heat was generated which causes the lime to split. This process will not happen in case of
improper slaking as the parameters required for lime production were not standardized
resulting in large variations at each source point. Hence, grinding is necessary. Though slaked
lime was procured for production, minimum grinding was carried out to ensure the two things
to happen. By grinding,splitting of lime takes places and the silica grains become finer in order
of nanometers. Fine silica and clay minerals accelerate the reaction rate less than a day to form

38
CSH phases without changing the microstructure of lime matrix (Moropoulou et al
2004).Without grinding the mortars will take much time to reach the similar extent of reaction.
Similarly, micronized lime will result in change in shape of portlandite for good workability.
Fig.14 Sieve analysis of NS – 6
Fig.15 Sieve analysis of NS – 8
39
Fig. 16 Sieve analysis of NS – 10
Fig. 17 Sieve analysis of TS– 6
40
Table 12 Sieve analysis of Naganathaswamy Temple
Sample Total 4.86 2.8 2.36 1.4 600 425 300 150 90 75 Pan
N.S-1 24.296 Nil Nil Nil 0.154 3.217 4.347 5.637 8.271 2.173 0.06 0.437
N.S-2 27.124 Nil Nil 0.23 0.6 3.4 5.332 6.714 8.457 1.955 0.09 0.346
N.S-3 19.407 Nil Nil Nil 0.224 1.001 1.485 2.607 5.72 4.725 0.309 3.336
N.S-4 21.672 Nil Nil 0.498 1.655 3.543 2.787 2.936 5.456 3.098 0.366 1.333
N.S-5 24.409 Nil Nil 0.1 0.16 2.026 7.29 7.749 5.155 1.52 0.105 0.304
N.S-6 18.955 Nil Nil Nil 0.042 0.877 2.926 4.917 7.823 1.688 0.105 0.577
N.S-7 21.596 Nil Nil Nil 0.102 1.341 3.627 5.767 7.89 2.183 0.143 0.543
N.S-8 16.48 Nil Nil Nil 0.11 5.04 0.031 4.516 5.004 1.398 0.075 0.306
N.S-9 18.169 1.53 0.356 1.653 2.522 1.834 1.253 1.406 4.448 2.398 0.109 0.66
N.S-10 18.505 Nil Nil 0.208 0.575 1.878 3.381 4.41 6.018 1.533 0.071 0.431
N.S-11 26.719 1.25 Nil 1.102 0.031 1.52 6.242 4.615 8.325 2.612 0.658 0.364
N.S-12 19.855 Nil Nil 0.541 1.022 2.321 3.043 5.168 4.346 1.932 0.246 1.236
N.S-13 21.965 Nil 0.265 Nil 1.406 3.245 2.846 2.845 6.826 3.421 0.365 0.746
N.S-14 21.588 0.85 Nil 0.109 0.184 1.336 5.212 3.965 4.183 2.667 0.614 2.468
N.S-15 23.209 Nil Nil Nil 1.865 3.452 6.328 2.725 7.098 1.064 0.245 0.432
41
Fig. 18 Sieve analysis of TS– 7
Fig. 19 Sieve analysis of TS– 9
42
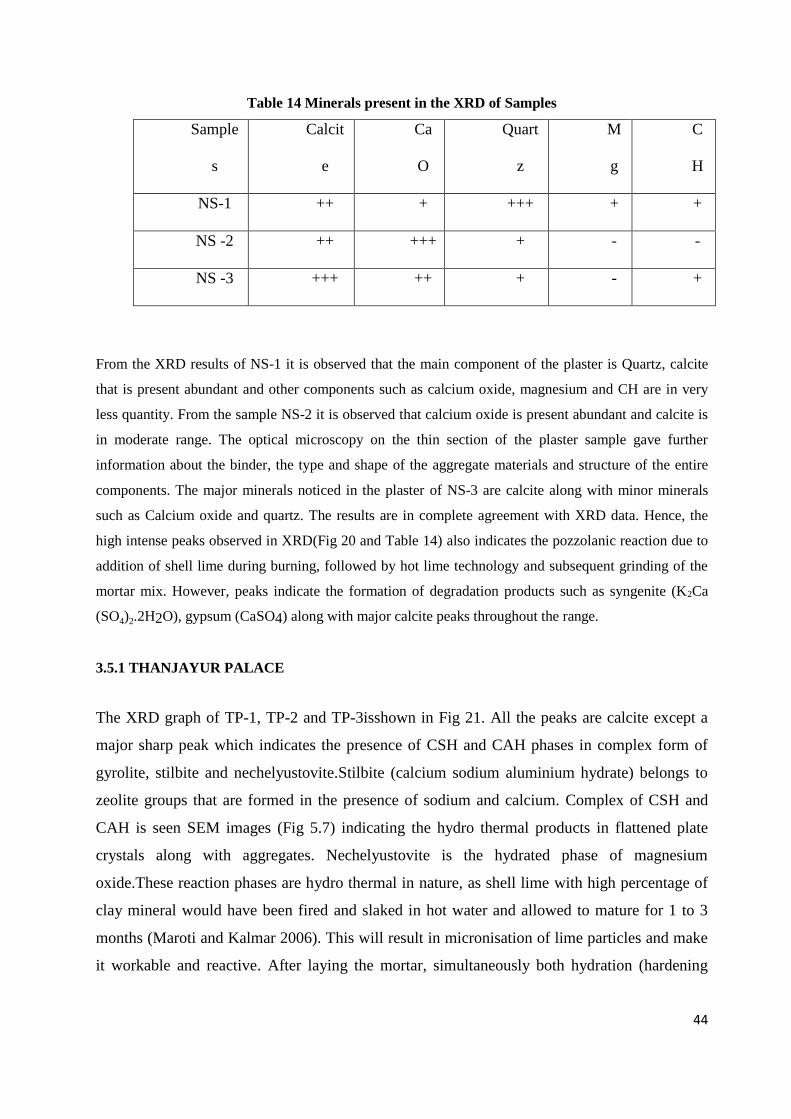
Table 13 Sieve Analysis of Sand (Thanjavur Palace)
Sample Total 4.86 2.8 2.36 1.4 600 425 300 150 90 75 Pan
T.P-1 23.211 Nil 0.046 0.303 0.817 2.828 3.186 4.931 6.705 2.642 0.203 1.55
T.P-2 20.95 Nil Nil 0.47 2.285 5.142 3.981 2.434 2.622 2.935 0.325 0.756
T.P-3 24.115 Nil 0.098 0.247 0.451 3.284 5.86 7.075 6.477 0.573 0.02 0.03
T.P-4 19.069 Nil 0.154 0.585 1.064 3.433 4.465 4.75 3.596 0.77 0.072 0.18
T.P-5 20.086 Nil Nil 0.103 0.557 2.191 2.906 3.929 7.01 2.983 0.308 0.099
T.P-6 22.559 Nil 0.223 0.756 1.27 3.215 4.578 5.494 6.751 0.24 0.02 0.012
T.P-7 20.33 Nil Nil 0.147 0.725 4.339 5.494 4.84 4.273 0.512 Nil Nil
T.P-8 23.748 Nil 0.416 0.529 1.776 6.332 7.728 4.821 2.142 0.004 Nil Nil
T.P-9 18.38 0.447 0.727 0.791 0.957 1.509 2.598 3.404 7.031 0.916 Nil Nil
T.P-10 16.73 Nil Nil 0.252 1.033 1.81 2.005 3.818 5.889 1.897 0.013 0.013
T.P-11 21.587 Nil Nil 0.356 1.263 4.526 2.462 5.013 6.228 1.373 0.301 0.065
T.P-12 20.835 0.126 Nil 0.165 1.648 5.183 3.486 4.194 5.192 0.841 Nil Nil
T.P-13 22.252 Nil 0.612 0.647 2.615 3.456 5.113 2.644 6.034 0.605 0.361 0.165
T.P-14 22.991 Nil Nil 0.458 2.489 6.874 2.469 3.754 4.586 1.691 0.586 0.084
T.P-15 19.525 Nil 0.542 0.648 1.64 4.157 3.009 2.648 6.338 0.543 Nil Nil

43
3.5 XRD of Ancient samples
3.5.1 Nagannathaswamy Temple
In the present research, the proportions of binder and aggregate were examined based on XRD
pattern.XRD analysis is very useful technique to identify the CaCO3 polymorphs (calcite,
aragonite and vaterite) for the investigation of the carbonation reaction of limeOur
interpretation is based on the assumption that the aggregate proportion corresponds to the
quartz and the binder to the calcite percentage. This assumption was derived from the earlier
petrographic study, which demonstrated a granitic origin of the aggregate and showed the
presence of calcite only as binder. As XRD can neither distinguish between carbonates in the
aggregate and in the lime paste coming from the binder nor amorphous phase like calcium
silica gel, the only detection noticed are crystalline phase resulting for carbonation and
hardening. In the present work semi quantification obtained through XRD gave an idea about
aggregate/binder proportions
Fig.20 XRD of Ancient Samples
44
Table 14 Minerals present in the XRD of Samples
Sample
s
Calcit
e
Ca
O
Quart
z
M
g
C
H
NS-1 ++ + +++ + +
NS -2 ++ +++ + - -
NS -3 +++ ++ + - +
From the XRD results of NS-1 it is observed that the main component of the plaster is Quartz, calcite
that is present abundant and other components such as calcium oxide, magnesium and CH are in very
less quantity. From the sample NS-2 it is observed that calcium oxide is present abundant and calcite is
in moderate range. The optical microscopy on the thin section of the plaster sample gave further
information about the binder, the type and shape of the aggregate materials and structure of the entire
components. The major minerals noticed in the plaster of NS-3 are calcite along with minor minerals
such as Calcium oxide and quartz. The results are in complete agreement with XRD data. Hence, the
high intense peaks observed in XRD(Fig 20 and Table 14) also indicates the pozzolanic reaction due to
addition of shell lime during burning, followed by hot lime technology and subsequent grinding of the
mortar mix. However, peaks indicate the formation of degradation products such as syngenite (K2Ca
(SO4)2.2H2O), gypsum (CaSO4) along with major calcite peaks throughout the range.
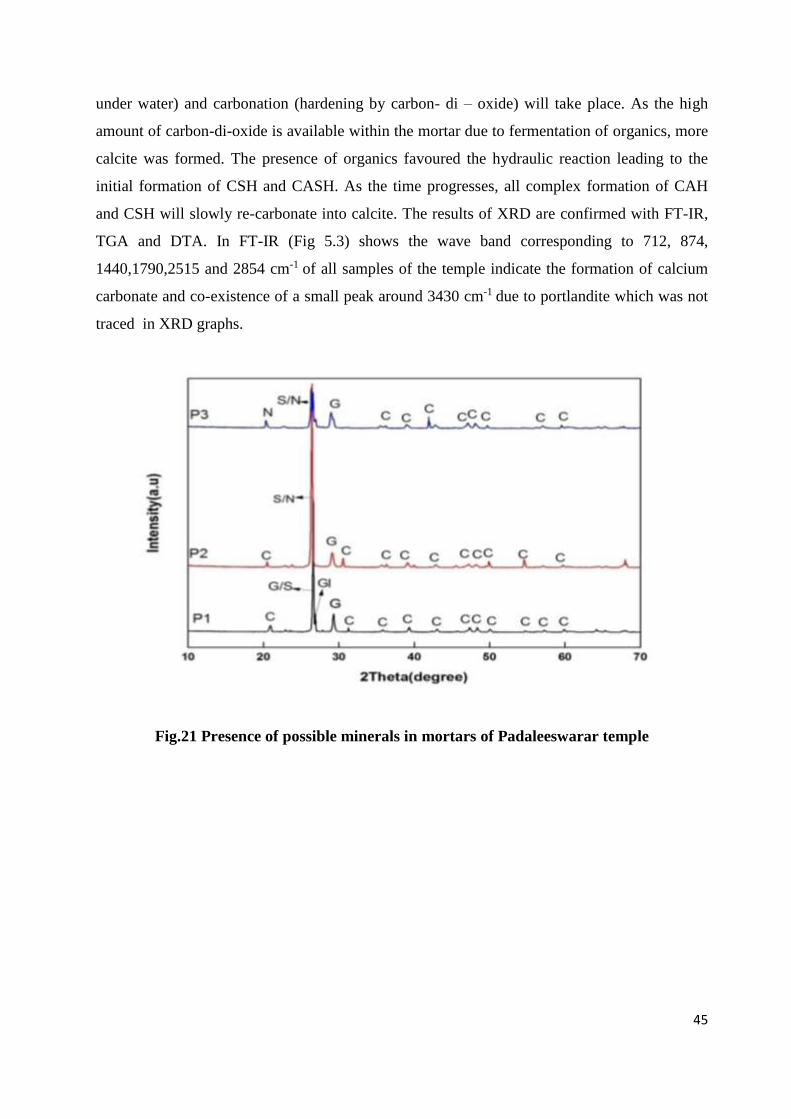
3.5.1 THANJAYUR PALACE
The XRD graph of TP-1, TP-2 and TP-3isshown in Fig 21. All the peaks are calcite except a
major sharp peak which indicates the presence of CSH and CAH phases in complex form of
gyrolite, stilbite and nechelyustovite.Stilbite (calcium sodium aluminium hydrate) belongs to
zeolite groups that are formed in the presence of sodium and calcium. Complex of CSH and
CAH is seen SEM images (Fig 5.7) indicating the hydro thermal products in flattened plate
crystals along with aggregates. Nechelyustovite is the hydrated phase of magnesium
oxide.These reaction phases are hydro thermal in nature, as shell lime with high percentage of
clay mineral would have been fired and slaked in hot water and allowed to mature for 1 to 3
months (Maroti and Kalmar 2006). This will result in micronisation of lime particles and make
it workable and reactive. After laying the mortar, simultaneously both hydration (hardening
45
under water) and carbonation (hardening by carbon- di – oxide) will take place. As the high
amount of carbon-di-oxide is available within the mortar due to fermentation of organics, more
calcite was formed. The presence of organics favoured the hydraulic reaction leading to the
initial formation of CSH and CASH. As the time progresses, all complex formation of CAH
and CSH will slowly re-carbonate into calcite. The results of XRD are confirmed with FT-IR,
TGA and DTA. In FT-IR (Fig 5.3) shows the wave band corresponding to 712, 874,
1440,1790,2515 and 2854 cm-1 of all samples of the temple indicate the formation of calcium
carbonate and co-existence of a small peak around 3430 cm-1 due to portlandite which was not
traced in XRD graphs.
Fig.21 Presence of possible minerals in mortars of Padaleeswarar temple
46
3.6 FT-IR of ancient samples
3.6.1 Nagannathaswamy Temple
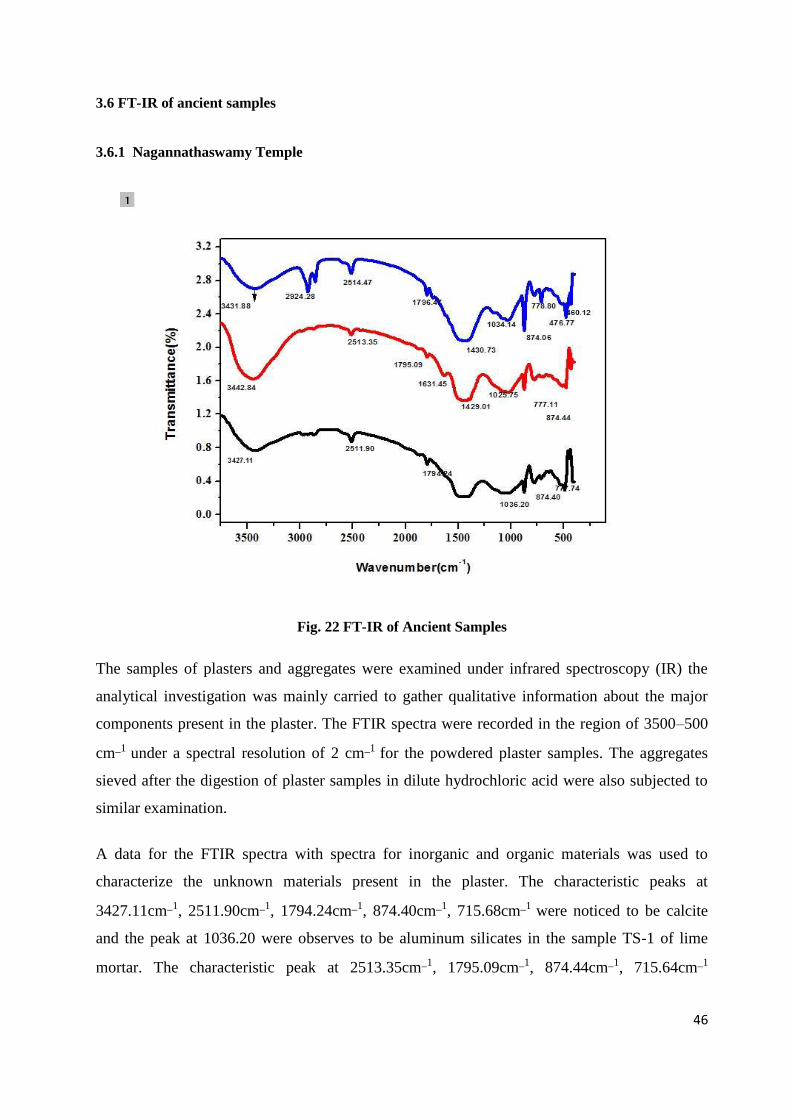
Fig. 22 FT-IR of Ancient Samples
The samples of plasters and aggregates were examined under infrared spectroscopy (IR) the
analytical investigation was mainly carried to gather qualitative information about the major
components present in the plaster. The FTIR spectra were recorded in the region of 3500–500
cm_1 under a spectral resolution of 2 cm_1 for the powdered plaster samples. The aggregates
sieved after the digestion of plaster samples in dilute hydrochloric acid were also subjected to
similar examination.
A data for the FTIR spectra with spectra for inorganic and organic materials was used to
characterize the unknown materials present in the plaster. The characteristic peaks at
3427.11cm_1, 2511.90cm_1, 1794.24cm_1, 874.40cm_1, 715.68cm_1 were noticed to be calcite
and the peak at 1036.20 were observes to be aluminum silicates in the sample TS-1 of lime
mortar. The characteristic peak at 2513.35cm_1, 1795.09cm_1, 874.44cm_1, 715.64cm_1
47
arecalcite and were as peak 1631.45 is under group of CSH, the peak 1025.75cm_1 and 477.57
cm_1 were observed as silica and peak at 3442.84cm_1 confirmed the presence of protein in the
sample NS-2. The peak at 2514.47cm_1, 1796.47cm_1, 874.06cm_1, 712.79cm_1 were observed
to be the presence of calcite and the peaks at 476.77 and 460.12cm_1 are the compounds of
silica groups, 778.80cm_1 were observed to be quartz and 2924.28cm_1 were CH-bond
stretching groups of organics in the sampleNS-3. In support to organic analysis the peaks
3427.11cm_1, and 3431.88cm_1 in FT-IR corresponds to organics. The peak 3442cm_1 is found
to be portlandite. Peak 1033cm_1 is possibility of CSH,The peak indicates the presence of
amides (proteins) whereas 2924.28cm_1and indicates carbohydrates or polysaccharides. In
confirmation with organic test and FT-IR of samples indicates the presence of the organic
matter. It has been observed from the investigation of many of the Indian plasters that the
binding calcite is finally crystallized and surrounds the aggregate grains and partly fills the void
between the grains. Further, presence of finally crystallized calcite shows the almost total
conversion of Calcium hydroxide into Calcium carbonate by atmospheric Carbon dioxide in all
the plaster works, which is also the main reason for good tensile strength of those plasters,
which have no external contamination.
Additives were found to have transformed into calcium oxalate, revealed through FTIR
spectrum. Further, organic fibers and seeds were admixed to improve tensile strength and
reduce cracking in most plasters. From the results shown in figure5.5mixed with vegetal fibers
and seeds (high CO2 content) had been added to the plaster of along with lime .The proteic
materials and lime together have enhanced the binding properties of the earthen plaster.
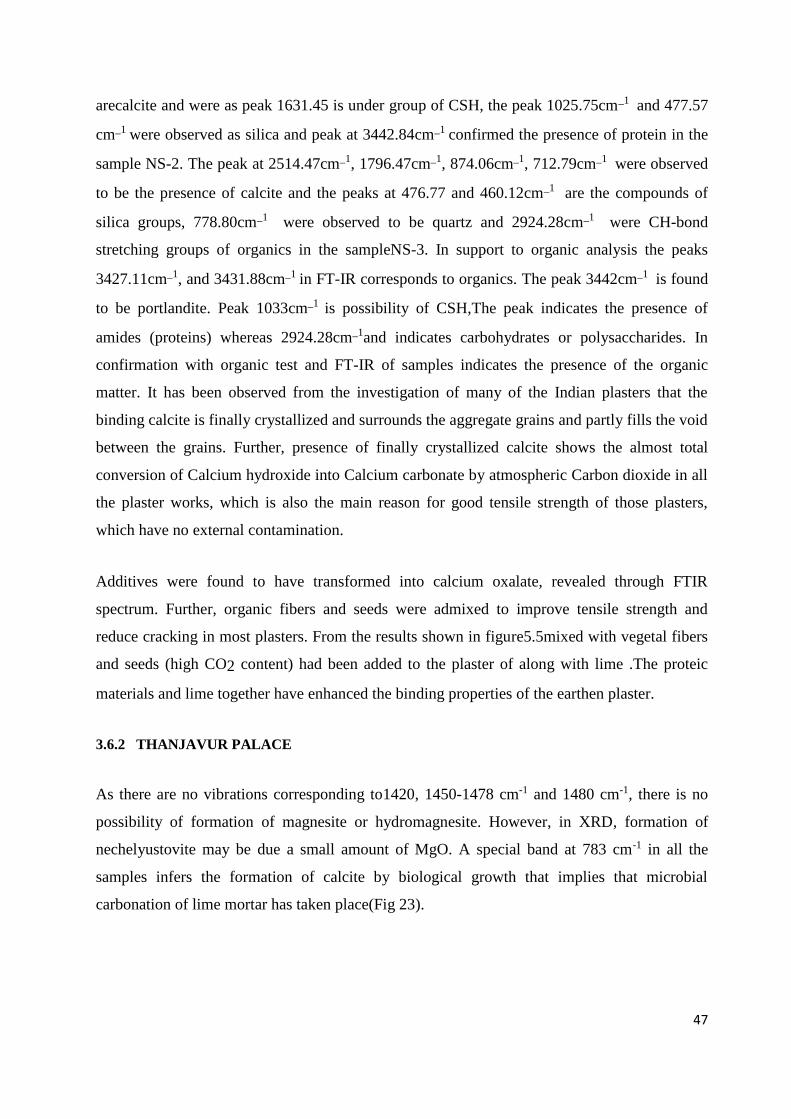
3.6.2 THANJAVUR PALACE
As there are no vibrations corresponding to1420, 1450-1478 cm-1 and 1480 cm-1, there is no
possibility of formation of magnesite or hydromagnesite. However, in XRD, formation of
nechelyustovite may be due a small amount of MgO. A special band at 783 cm-1 in all the
samples infers the formation of calcite by biological growth that implies that microbial
carbonation of lime mortar has taken place(Fig 23).
48
Fig.23 FT-IR analysis of historic mortar at Thanjayur palace
3.7 Thermo gravimetric Analysis Results
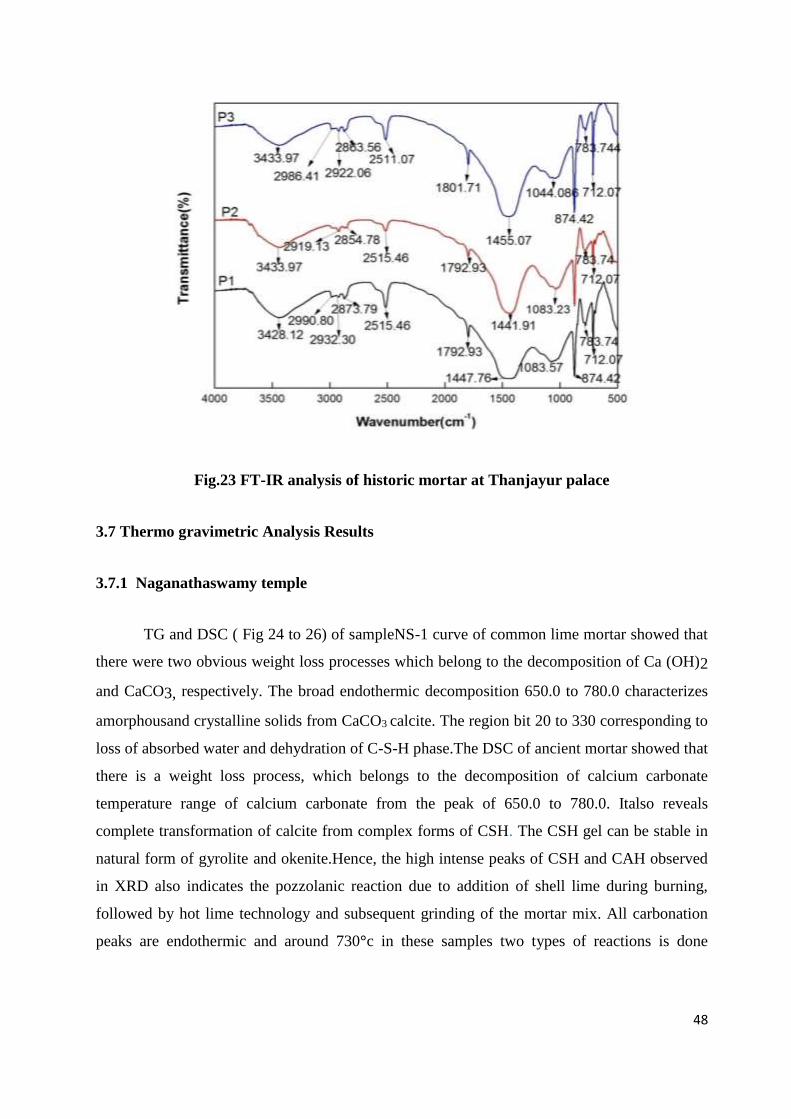
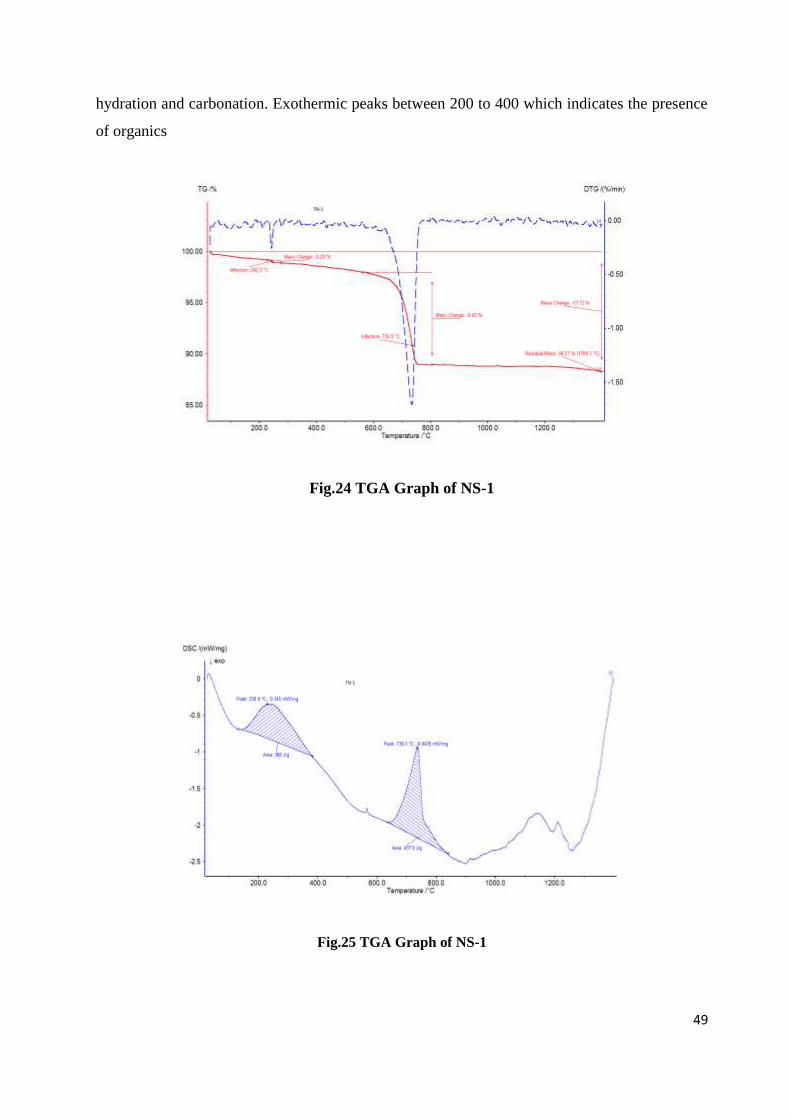
3.7.1 Naganathaswamy temple
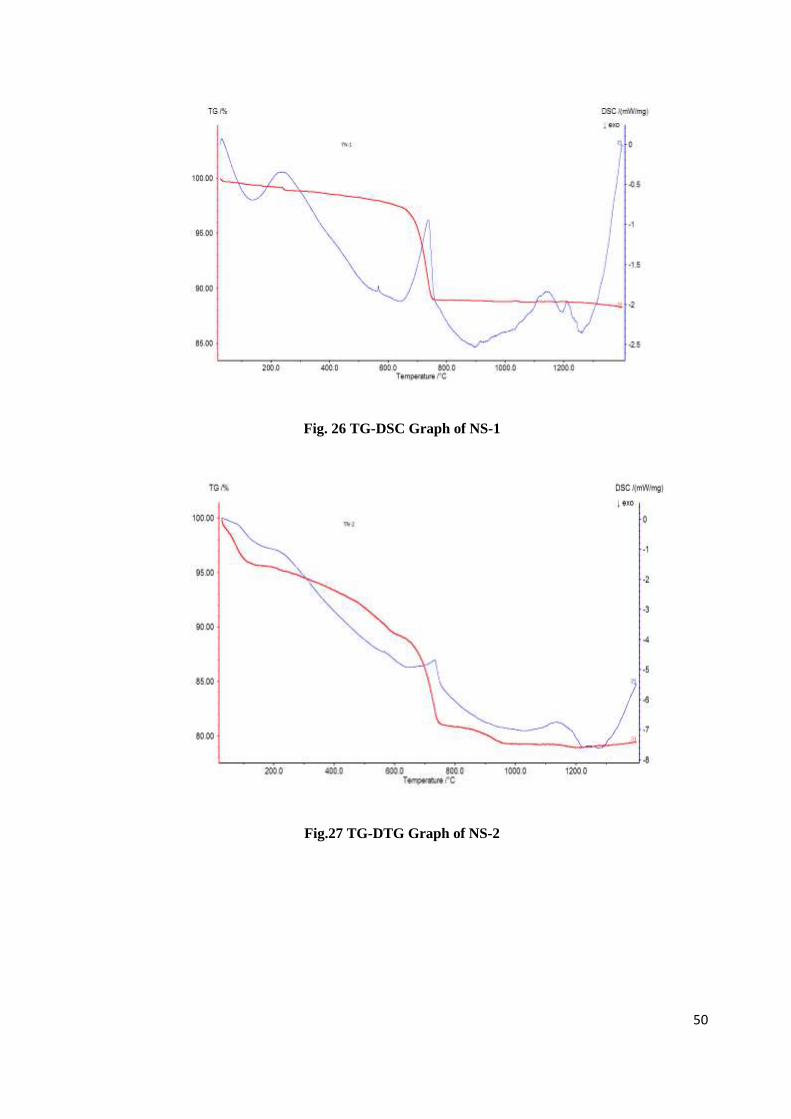
TG and DSC ( Fig 24 to 26) of sampleNS-1 curve of common lime mortar showed that
there were two obvious weight loss processes which belong to the decomposition of Ca (OH)2
and CaCO3, respectively. The broad endothermic decomposition 650.0 to 780.0 characterizes
amorphousand crystalline solids from CaCO3 calcite. The region bit 20 to 330 corresponding to
loss of absorbed water and dehydration of C-S-H phase.The DSC of ancient mortar showed that
there is a weight loss process, which belongs to the decomposition of calcium carbonate
temperature range of calcium carbonate from the peak of 650.0 to 780.0. Italso reveals
complete transformation of calcite from complex forms of CSH. The CSH gel can be stable in
natural form of gyrolite and okenite.Hence, the high intense peaks of CSH and CAH observed
in XRD also indicates the pozzolanic reaction due to addition of shell lime during burning,
followed by hot lime technology and subsequent grinding of the mortar mix. All carbonation
peaks are endothermic and around 730°c in these samples two types of reactions is done
49
hydration and carbonation. Exothermic peaks between 200 to 400 which indicates the presence
of organics
Fig.24 TGA Graph of NS-1
Fig.25 TGA Graph of NS-1
50
Fig. 26 TG-DSC Graph of NS-1
Fig.27 TG-DTG Graph of NS-2
51
Fig.28 TGA Graph of NS-2
Fig. 29 TG-DSC Graph of NS- 2
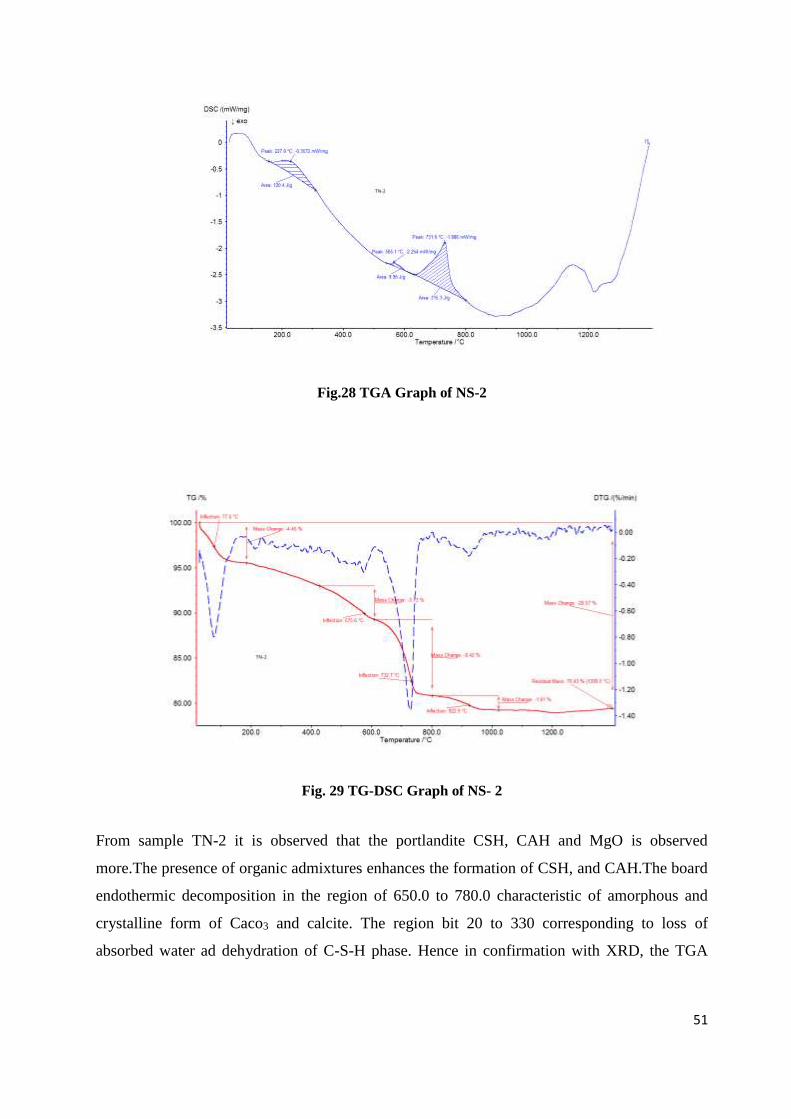
From sample TN-2 it is observed that the portlandite CSH, CAH and MgO is observed
more.The presence of organic admixtures enhances the formation of CSH, and CAH.The board
endothermic decomposition in the region of 650.0 to 780.0 characteristic of amorphous and
crystalline form of Caco3 and calcite. The region bit 20 to 330 corresponding to loss of
absorbed water ad dehydration of C-S-H phase. Hence in confirmation with XRD, the TGA
52
results indicates the shell lime rich in clay impurities along with limestone dehydroxylate
during burning process and acts as a pozzolan imparting early strength to the mortar. Also, the
dehydration of magnesia between 250 °C and 550 °C is seen in all the mortar samples that
substantially contribute to desirable plasticity. It is found that the co-existence of amorphous
and crystalline calcite enhances the hydration process as more amounts of free lime has been
available for reaction. As the age processes the complex forms of CAH and CSH phases re-
carbonate and forms CaCO3. Early decomposition of CaCO3 to CO2 between 600 °C and 770
°C and the major weight loss in this range shows that the hydraulic components (CSH like
gyrolite and okenite and CAH are completely transformed into CaCO3.
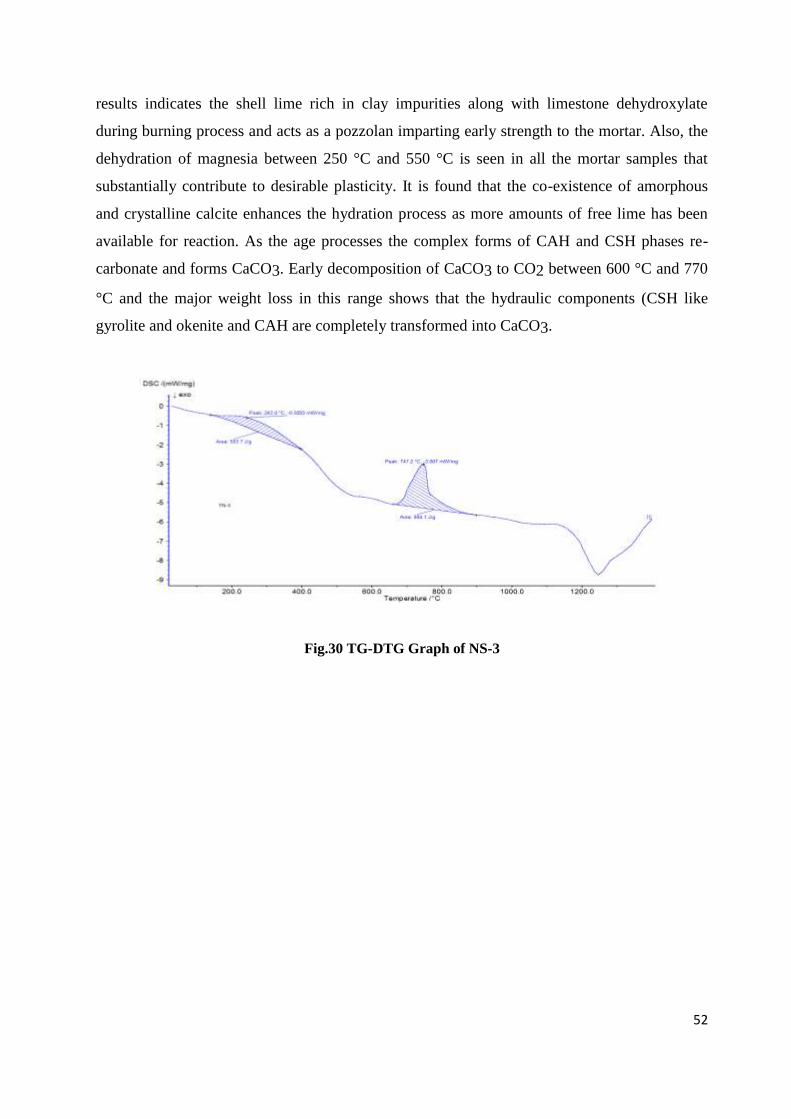
Fig.30 TG-DTG Graph of NS-3
53
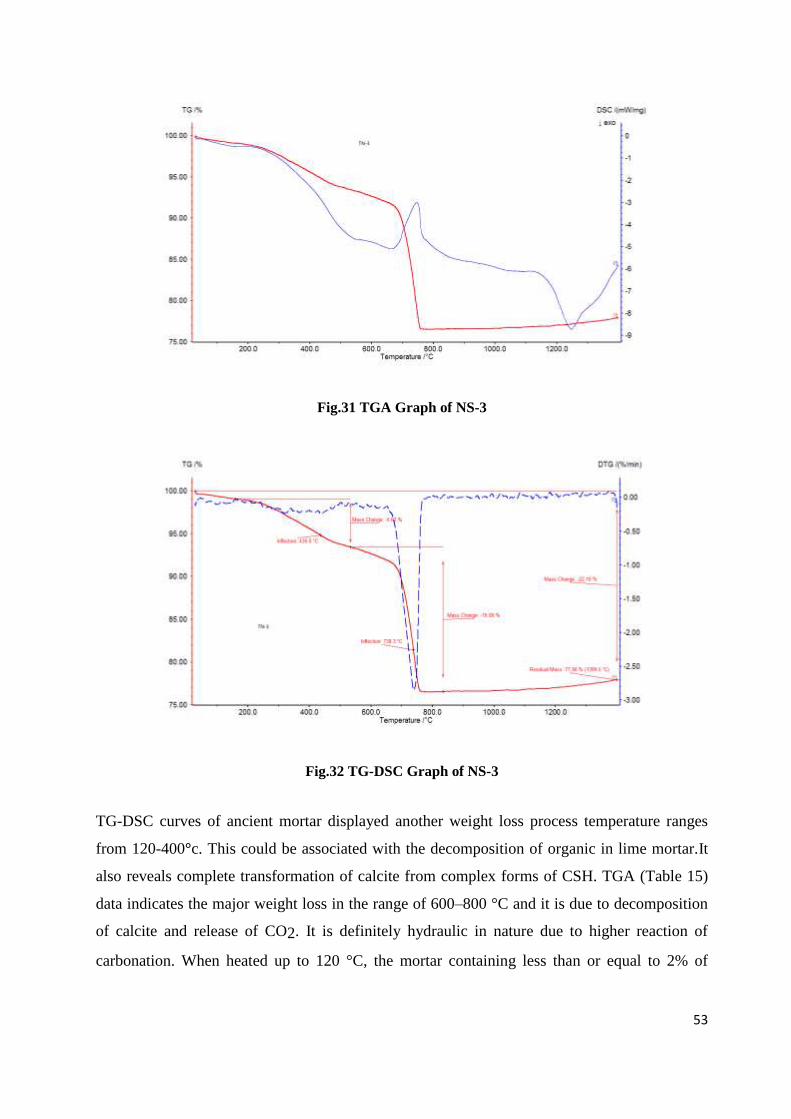
Fig.31 TGA Graph of NS-3
Fig.32 TG-DSC Graph of NS-3
TG-DSC curves of ancient mortar displayed another weight loss process temperature ranges
from 120-400°c. This could be associated with the decomposition of organic in lime mortar.It
also reveals complete transformation of calcite from complex forms of CSH. TGA (Table 15)
data indicates the major weight loss in the range of 600–800 °C and it is due to decomposition
of calcite and release of CO2. It is definitely hydraulic in nature due to higher reaction of
carbonation. When heated up to 120 °C, the mortar containing less than or equal to 2% of

54
absorbed water demonstrate the absence of hygroscopic character, indicating lesser amount of
portlandite.
Table 15: Results of Thermal Analysis (Naganathaswamytemple )
Sample
Weight loss over temperature range (%) Structurally
bound
water %
CO2 /
H2O Total
weight
Loss
(%)
Inference
< 120
° C
120 -
400°C
400 -
550°C
600-
800
° C
800-
1000°
C
NS -1 0.55 0.88 0.55 9.03 0.2 1.43 6.31 11.21 New
mortar
NS -2 3.48 5.54 2.8 8.42 1.61 9.04 0.93 20.24 Old
mortar
NS -3 0.78 3.72 2.29 16.89 - 4.5 3.75 23.68 Old
mortar
3.7.2 TGA at Thanjavur palace
TGA is in agreement with XRD. In the analysis of weight loss based on TGA results (Table
16), four ranges of temperature are considered. In the range of 0 to 120°C, the weight loss
percentage of TP-1, TP-2 and TP-3 samples are 0.125, 0.41 and 0.67, respectively. In this
range, weight loss is associated with hygroscopic water.As percentage is very less for both
exterior walls TP-1andTP-2 indicating that they are totally carbonated compared to inner wall
TP-3 whichhas more water content. In the temperature range 200oC – 650°C weight loss is
because of structural bound water which is due to dehydration of hydraulic compound.
Structural bound water of all the samples were in the range of 5 – 14 % that implies that natural
pozzolans have been added to the mortars. As observed by Moropoulou et al (1995) and
Moropoulou et al (2000) the percentage of CO2 due to decomposition in the range of 600oC -
800° C is in the range of 12-20.The value of CO2 / H2O which inversely expresses the level of
hydraulicity is less than 3, hence the mortars are hydraulic in nature. The hydraulic mortars
with high clay as pozzolanic materials were used as a binder and the high level of CO2 in
mortars as possible because of the addition of cocktail of herbs added to improve the properties
of mortar.
55
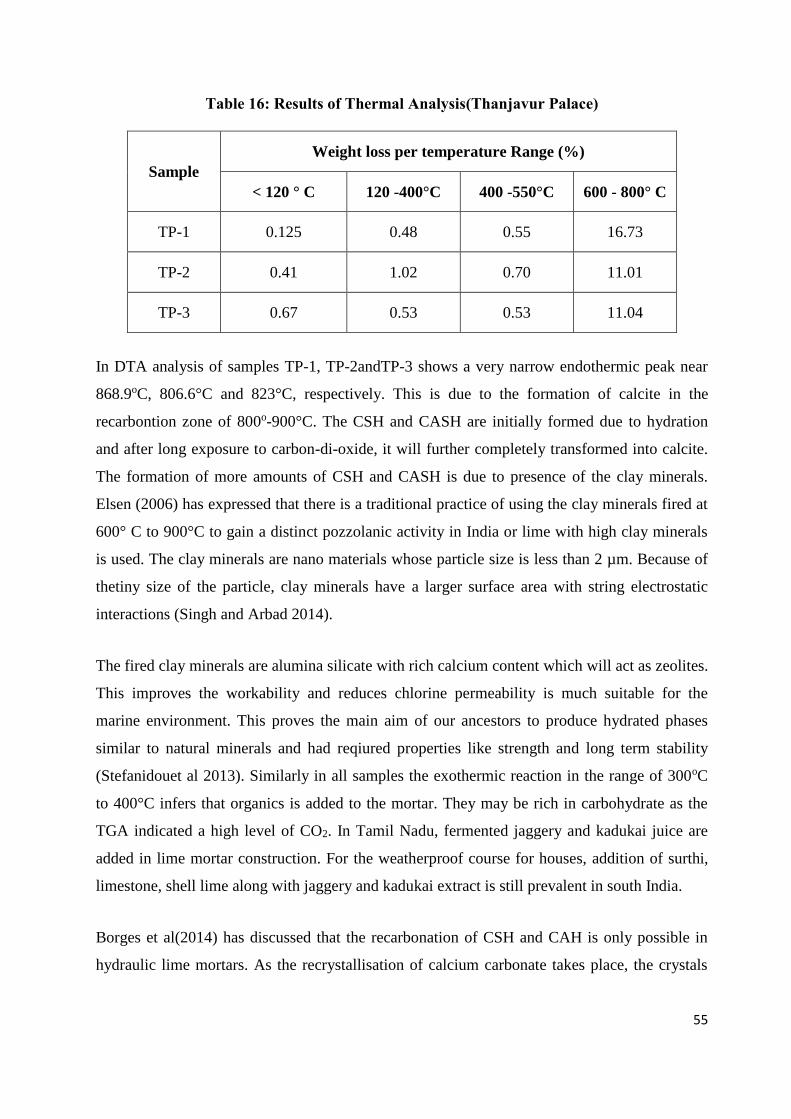
Table 16: Results of Thermal Analysis(Thanjavur Palace)
Sample
Weight loss per temperature Range (%)
< 120 ° C 120 -400°C 400 -550°C 600 - 800° C
TP-1 0.125 0.48 0.55 16.73
TP-2 0.41 1.02 0.70 11.01
TP-3 0.67 0.53 0.53 11.04
In DTA analysis of samples TP-1, TP-2andTP-3 shows a very narrow endothermic peak near
868.9oC, 806.6°C and 823°C, respectively. This is due to the formation of calcite in the
recarbontion zone of 800o-900°C. The CSH and CASH are initially formed due to hydration
and after long exposure to carbon-di-oxide, it will further completely transformed into calcite.
The formation of more amounts of CSH and CASH is due to presence of the clay minerals.
Elsen (2006) has expressed that there is a traditional practice of using the clay minerals fired at
600° C to 900°C to gain a distinct pozzolanic activity in India or lime with high clay minerals
is used. The clay minerals are nano materials whose particle size is less than 2 µm. Because of
thetiny size of the particle, clay minerals have a larger surface area with string electrostatic
interactions (Singh and Arbad 2014).
The fired clay minerals are alumina silicate with rich calcium content which will act as zeolites.
This improves the workability and reduces chlorine permeability is much suitable for the
marine environment. This proves the main aim of our ancestors to produce hydrated phases
similar to natural minerals and had reqiured properties like strength and long term stability
(Stefanidouet al 2013). Similarly in all samples the exothermic reaction in the range of 300oC
to 400°C infers that organics is added to the mortar. They may be rich in carbohydrate as the
TGA indicated a high level of CO2. In Tamil Nadu, fermented jaggery and kadukai juice are
added in lime mortar construction. For the weatherproof course for houses, addition of surthi,
limestone, shell lime along with jaggery and kadukai extract is still prevalent in south India.
Borges et al(2014) has discussed that the recarbonation of CSH and CAH is only possible in
hydraulic lime mortars. As the recrystallisation of calcium carbonate takes place, the crystals
56
formed will occupy the pores that will contribute to the compactness of the mortar matrix by
fulfilling the porous structure.
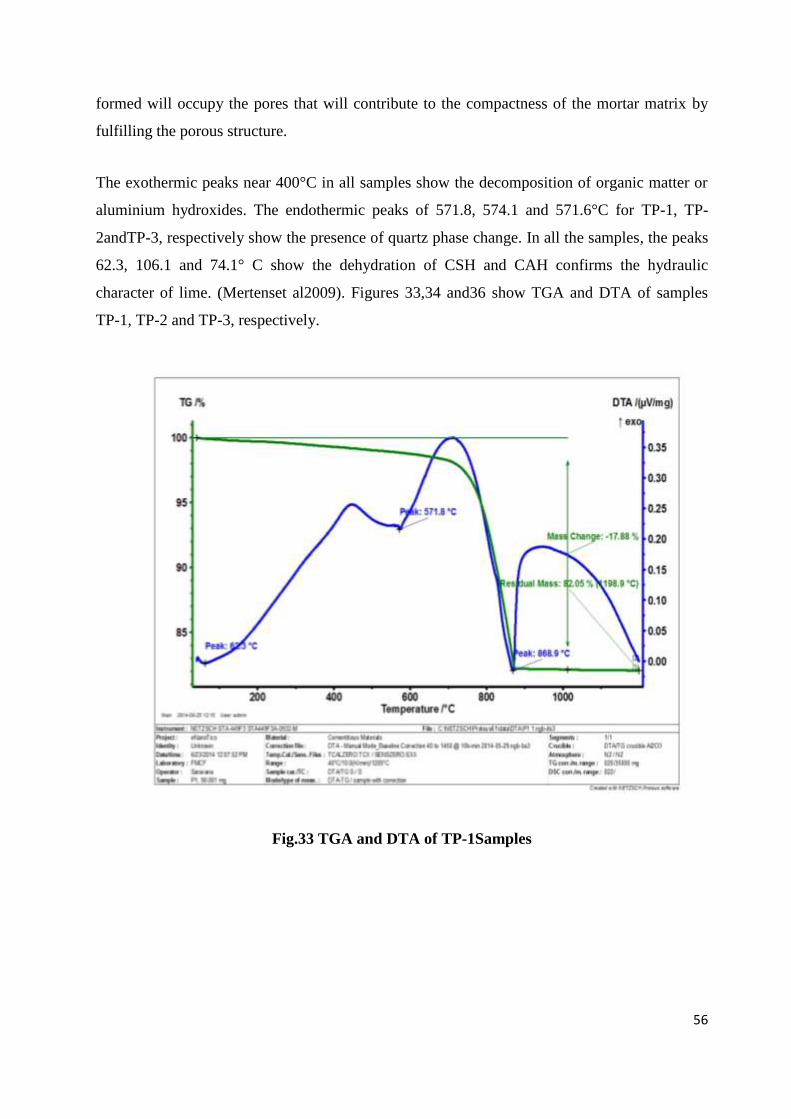
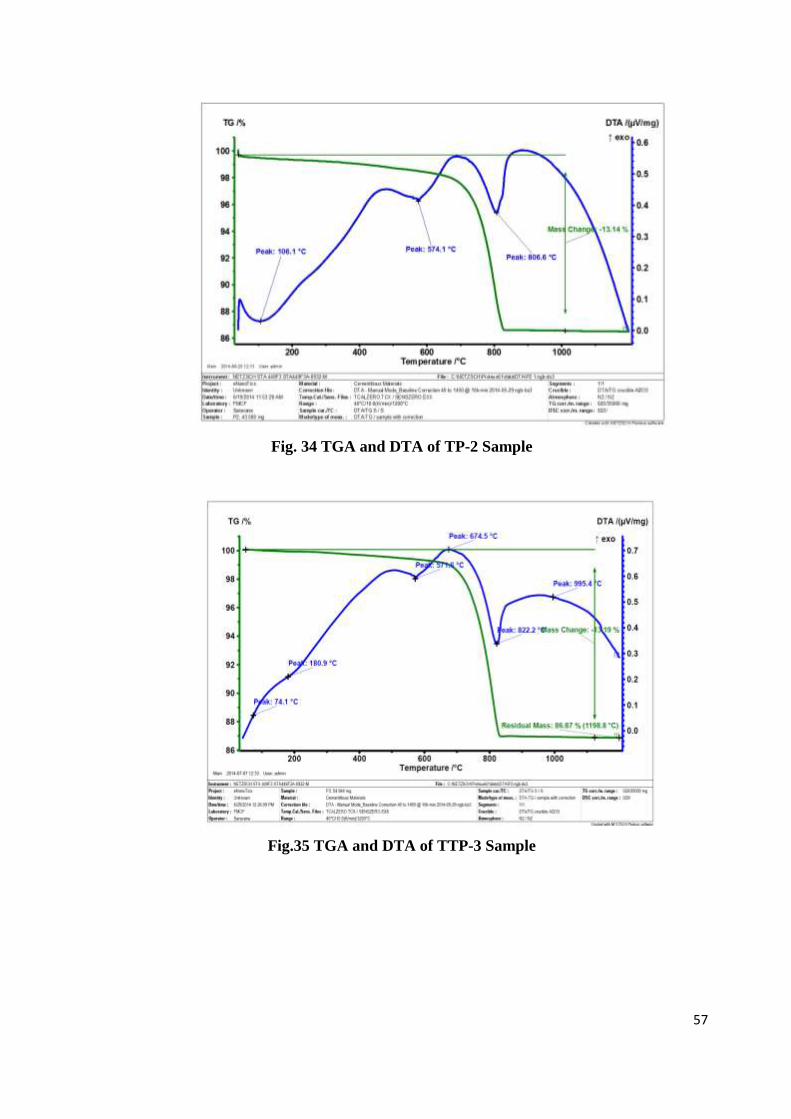
The exothermic peaks near 400°C in all samples show the decomposition of organic matter or
aluminium hydroxides. The endothermic peaks of 571.8, 574.1 and 571.6°C for TP-1, TP-
2andTP-3, respectively show the presence of quartz phase change. In all the samples, the peaks
62.3, 106.1 and 74.1° C show the dehydration of CSH and CAH confirms the hydraulic
character of lime. (Mertenset al2009). Figures 33,34 and36 show TGA and DTA of samples
TP-1, TP-2 and TP-3, respectively.
Fig.33 TGA and DTA of TP-1Samples
57
Fig. 34 TGA and DTA of TP-2 Sample
Fig.35 TGA and DTA of TTP-3 Sample

58
3.8 SEM INTERPRETATION
3.8.1 Naganathaswamy Temple
SEM images are presented from Fig.36 to 38. The images clearly support the other analytical
techniques and shows the formation of calcite crystals. The amorphous form of calcite is also
present.The lime sand matrix is very compact in all the images. The complete carbonation on
external surface is evident. The presence of organics is confirmed by simultaneous presence of
amorphous and crystal calcite.
Fig. 36 Lime sand matrix
59
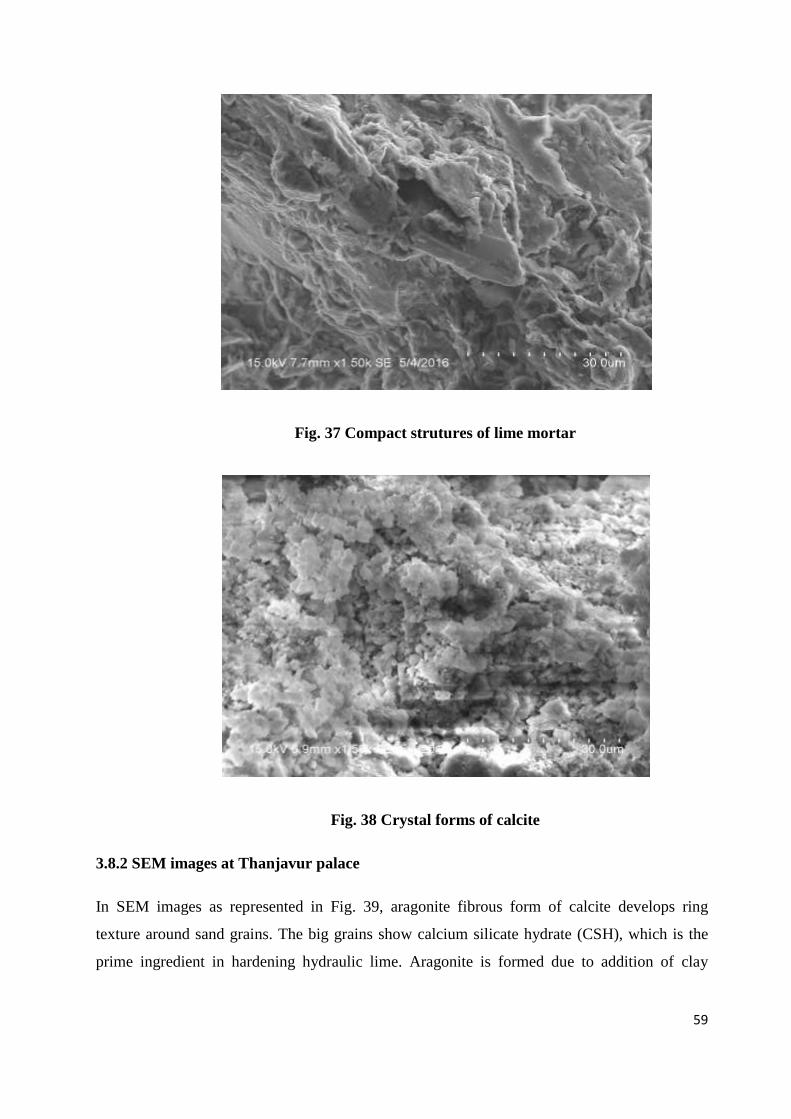
Fig. 37 Compact strutures of lime mortar
Fig. 38 Crystal forms of calcite
3.8.2 SEM images at Thanjavur palace
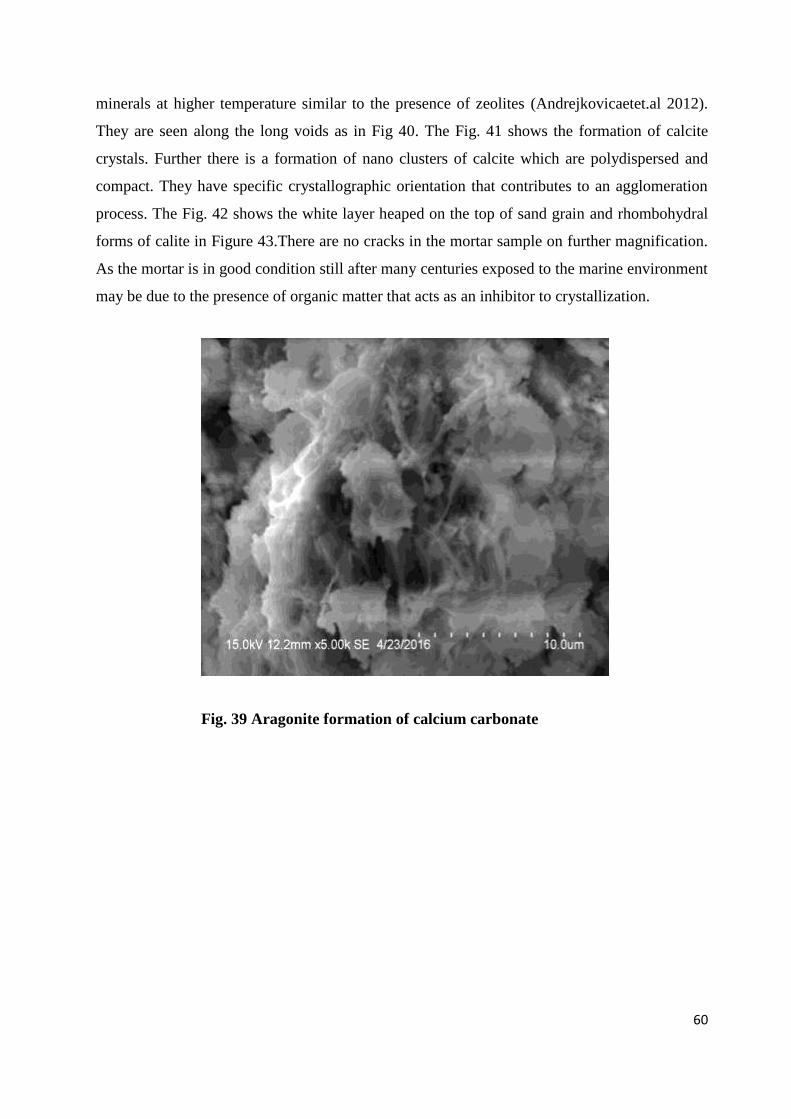
In SEM images as represented in Fig. 39, aragonite fibrous form of calcite develops ring
texture around sand grains. The big grains show calcium silicate hydrate (CSH), which is the
prime ingredient in hardening hydraulic lime. Aragonite is formed due to addition of clay
60
minerals at higher temperature similar to the presence of zeolites (Andrejkovicaetet.al 2012).
They are seen along the long voids as in Fig 40. The Fig. 41 shows the formation of calcite
crystals. Further there is a formation of nano clusters of calcite which are polydispersed and
compact. They have specific crystallographic orientation that contributes to an agglomeration
process. The Fig. 42 shows the white layer heaped on the top of sand grain and rhombohydral
forms of calite in Figure 43.There are no cracks in the mortar sample on further magnification.
As the mortar is in good condition still after many centuries exposed to the marine environment
may be due to the presence of organic matter that acts as an inhibitor to crystallization.
Fig. 39 Aragonite formation of calcium carbonate

61
Fig. 40 Long voids in between the mortar
Fig. 41 Calcite crystals

62
Fig. 42 White layers heaped on the top of sand grain
Fig.43 Formation of rhomhedral crystals of calcite
63
3.9 NEW MORTAR SIMULATION
3.9.1 Characteristics of lime
Chemical characteristics of lime such as oxides of calcium and magnesium, silica, alumina and
iron are determined, and their significance on the behavior of lime are discussed to ascertain
the class and hydraulicity of lime. Field tests are conducted on lime, and the observations are
correlated to classify the lime. Influence of admixtures on the setting time of lime is also
discussed in this section.
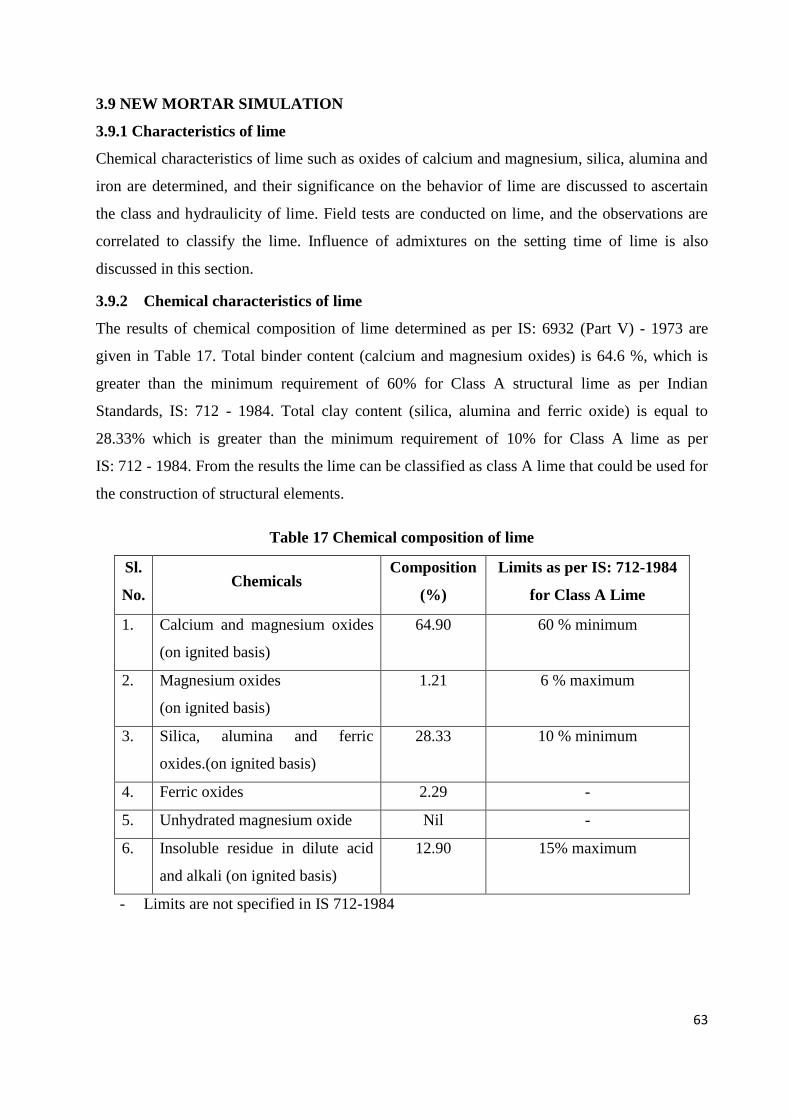
3.9.2 Chemical characteristics of lime
The results of chemical composition of lime determined as per IS: 6932 (Part V) - 1973 are
given in Table 17. Total binder content (calcium and magnesium oxides) is 64.6 %, which is
greater than the minimum requirement of 60% for Class A structural lime as per Indian
Standards, IS: 712 - 1984. Total clay content (silica, alumina and ferric oxide) is equal to
28.33% which is greater than the minimum requirement of 10% for Class A lime as per
IS: 712 - 1984. From the results the lime can be classified as class A lime that could be used for
the construction of structural elements.
Table 17 Chemical composition of lime
Sl.
No. Chemicals
Composition
(%)
Limits as per IS: 712-1984
for Class A Lime
1. Calcium and magnesium oxides
(on ignited basis)
64.90 60 % minimum
2. Magnesium oxides
(on ignited basis)
1.21 6 % maximum
3. Silica, alumina and ferric
oxides.(on ignited basis)
28.33 10 % minimum
4. Ferric oxides 2.29 -
5. Unhydrated magnesium oxide Nil -
6. Insoluble residue in dilute acid
and alkali (on ignited basis)
12.90 15% maximum
- Limits are not specified in IS 712-1984

64
3.10 HYDRAULICITY OF LIME
Hydraulic Index (HI) is an indication of the hydraulicity of lime. It is based on the oxides
content in lime. Hydraulic index of the lime used in the study is equal to 0.43. Eminently
hydraulic lime have values greater than 0.4 (Cowper 2000).Hence, the lime used is categorized
as eminently hydraulic.
3.11 FIELD TESTS ON LIME
The outcome of the field tests conducted as per IS: 1624 - 1986 are presented in Table 18. The
inferences are discussed to assess the nature of lime. Lime is examined visually for the colour,
texture, fineness and the presence of grit particles. On visual examination, the lime used for the
investigation is light grey and does not contain coarse and gritty lime pieces larger than 2.30
mm. Hence, it could be categorized as Class A lime.
In the hydrochloric acid test, a thick gel formation is observed and did not flow out of the glass
tube when tilted, which shows signs of Class A Lime.
Results of the ball test infer that there are no signs of disintegration after six hours observation
of the prepared lime ball (50 mm diameter). Hence, the lime is categorized as Class A,
structural lime.
Table 18 Field tests on lime
Test
Conducted Observation Inference
Visual
examination
Does not contain coarse and gritty lime pieces
larger than about 2.30 mm
Class A, structural lime
Ball test Sign of disintegration in the ball of 50mm
diameter after six hours
Class A, structural lime
Hydrochloric
acid Test
A thick gel formation observed and did not
flow out of the cylinder when tilted
Class A, structural lime
65
Table 19 Sample Description
Category Description
Category 1 12.5% of jaggery and 2.5 of kadukkai
Category 2 12.5 of kadukkai and 2.5 of jaggery
Category 3 6.25 % jaggery and 6.25 % of kadukkai
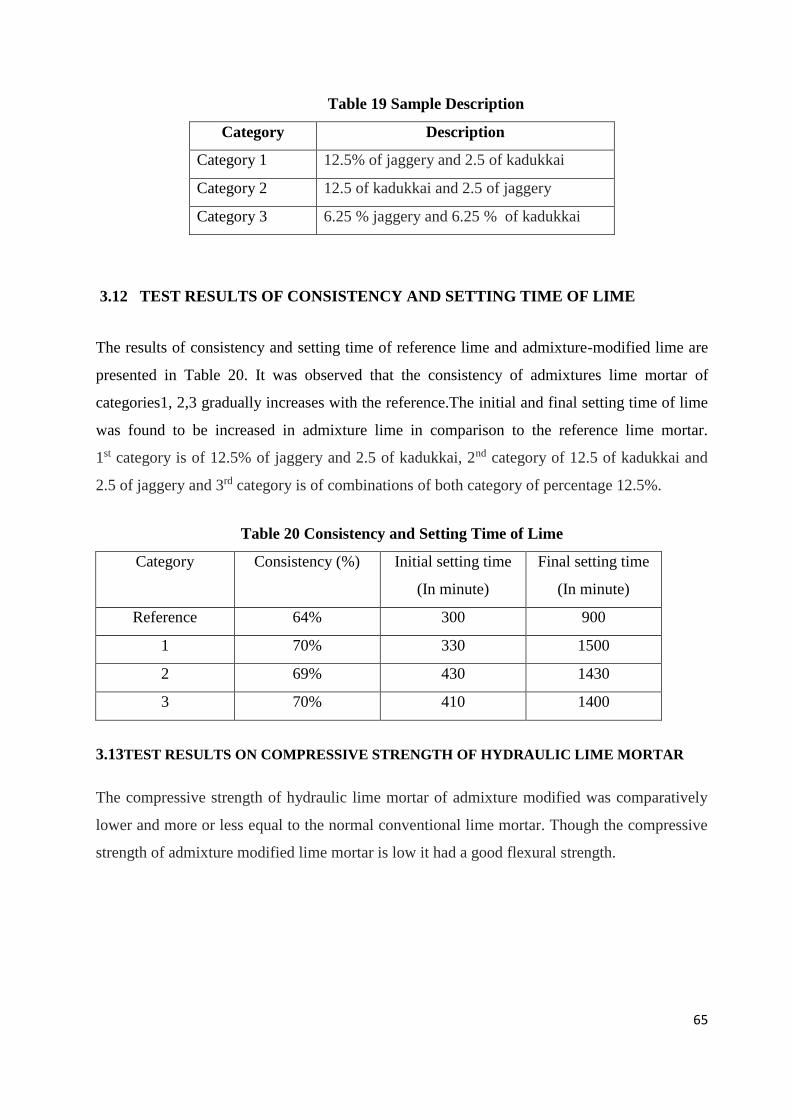
3.12 TEST RESULTS OF CONSISTENCY AND SETTING TIME OF LIME
The results of consistency and setting time of reference lime and admixture-modified lime are
presented in Table 20. It was observed that the consistency of admixtures lime mortar of
categories1, 2,3 gradually increases with the reference.The initial and final setting time of lime
was found to be increased in admixture lime in comparison to the reference lime mortar.
1st category is of 12.5% of jaggery and 2.5 of kadukkai, 2nd category of 12.5 of kadukkai and
2.5 of jaggery and 3rd category is of combinations of both category of percentage 12.5%.
Table 20 Consistency and Setting Time of Lime
Category Consistency (%) Initial setting time
(In minute)
Final setting time
(In minute)
Reference 64% 300 900
1 70% 330 1500
2 69% 430 1430
3 70% 410 1400
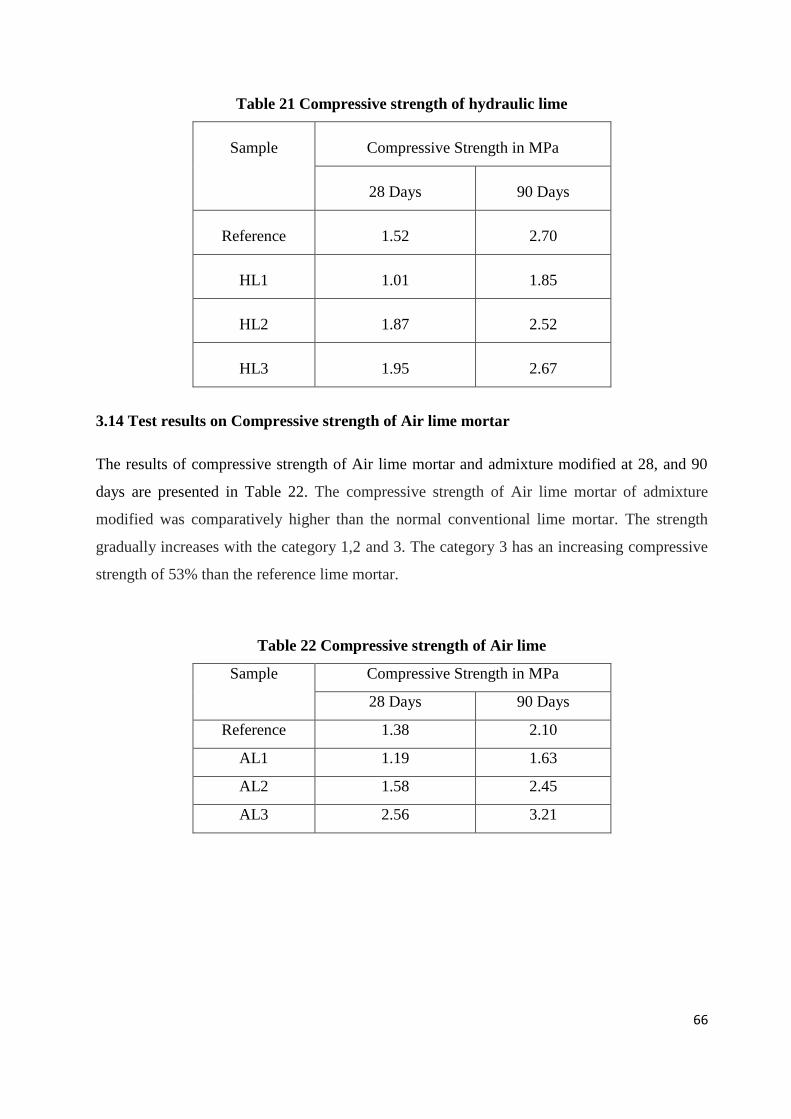
3.13TEST RESULTS ON COMPRESSIVE STRENGTH OF HYDRAULIC LIME MORTAR
The compressive strength of hydraulic lime mortar of admixture modified was comparatively
lower and more or less equal to the normal conventional lime mortar. Though the compressive
strength of admixture modified lime mortar is low it had a good flexural strength.
66
Table 21 Compressive strength of hydraulic lime
Sample Compressive Strength in MPa
28 Days 90 Days
Reference 1.52 2.70
HL1 1.01 1.85
HL2 1.87 2.52
HL3 1.95 2.67
3.14 Test results on Compressive strength of Air lime mortar
The results of compressive strength of Air lime mortar and admixture modified at 28, and 90
days are presented in Table 22. The compressive strength of Air lime mortar of admixture
modified was comparatively higher than the normal conventional lime mortar. The strength
gradually increases with the category 1,2 and 3. The category 3 has an increasing compressive
strength of 53% than the reference lime mortar.
Table 22 Compressive strength of Air lime
Sample Compressive Strength in MPa
28 Days 90 Days
Reference 1.38 2.10
AL1 1.19 1.63
AL2 1.58 2.45
AL3 2.56 3.21
67
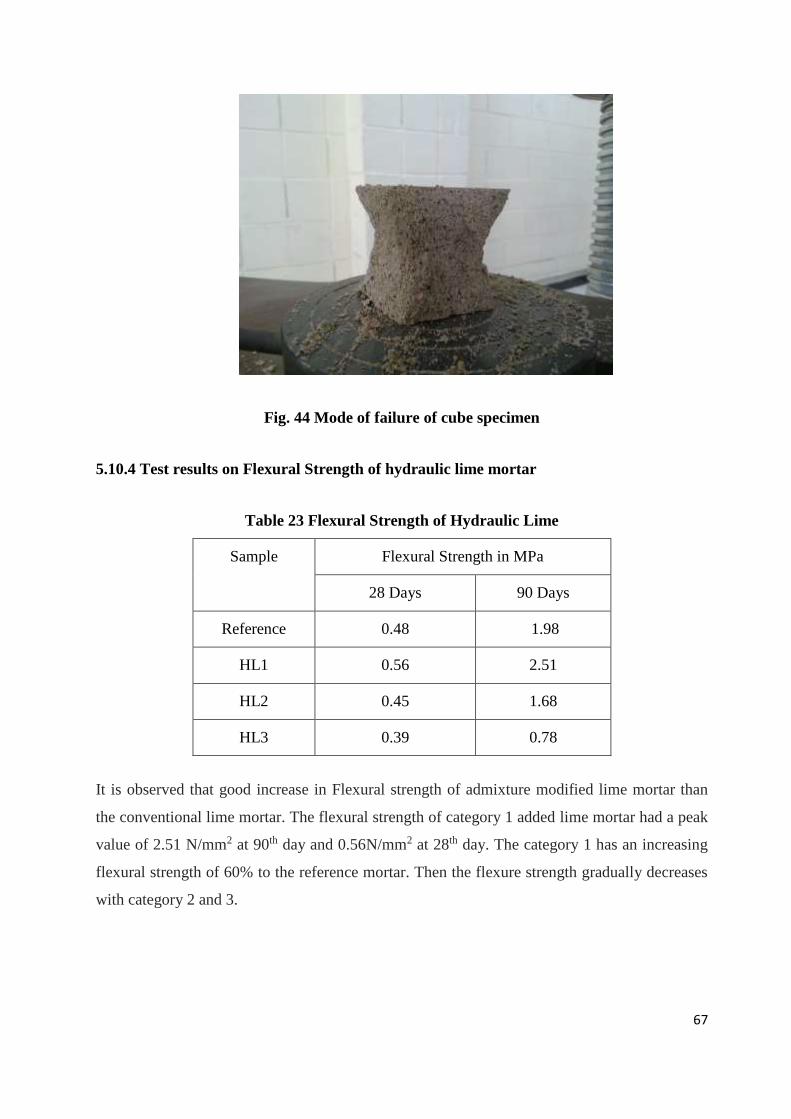
Fig. 44 Mode of failure of cube specimen
5.10.4 Test results on Flexural Strength of hydraulic lime mortar
Table 23 Flexural Strength of Hydraulic Lime
Sample Flexural Strength in MPa
28 Days 90 Days
Reference 0.48 1.98
HL1 0.56 2.51
HL2 0.45 1.68
HL3 0.39 0.78
It is observed that good increase in Flexural strength of admixture modified lime mortar than
the conventional lime mortar. The flexural strength of category 1 added lime mortar had a peak
value of 2.51 N/mm2 at 90th day and 0.56N/mm2 at 28th day. The category 1 has an increasing
flexural strength of 60% to the reference mortar. Then the flexure strength gradually decreases
with category 2 and 3.
68
5.10.5 Test results on Flexural Strength of Air lime mortar
Table 24 Flexural strength of Air lime
Sample Flexural Strength in MPa
28 Days 90 Days
Reference 0.22 0.12
AL1 0.45 0.18
AL2 0.34 0.56
AL3 0.60 0.16
The results of flexure strength of the air lime mortar on reference lime concrete and admixture
modified concrete at 28 and 90 days are presented in Table 24. The flexure strength of concrete
was found to be increased gradually of 64%at 28 days in three categories than the reference
mortar. Lime with admixtures dosage increases the flexural strength of the mortar with age, in
comparatively with the reference mortar.
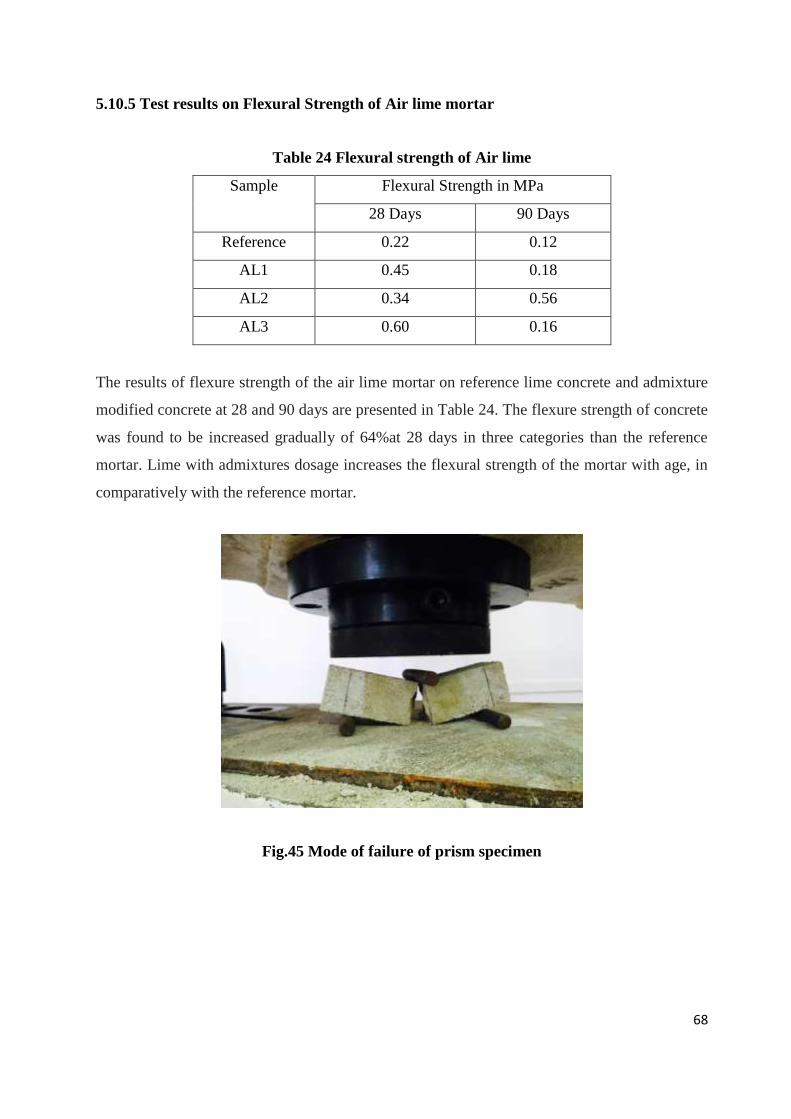
Fig.45 Mode of failure of prism specimen
69
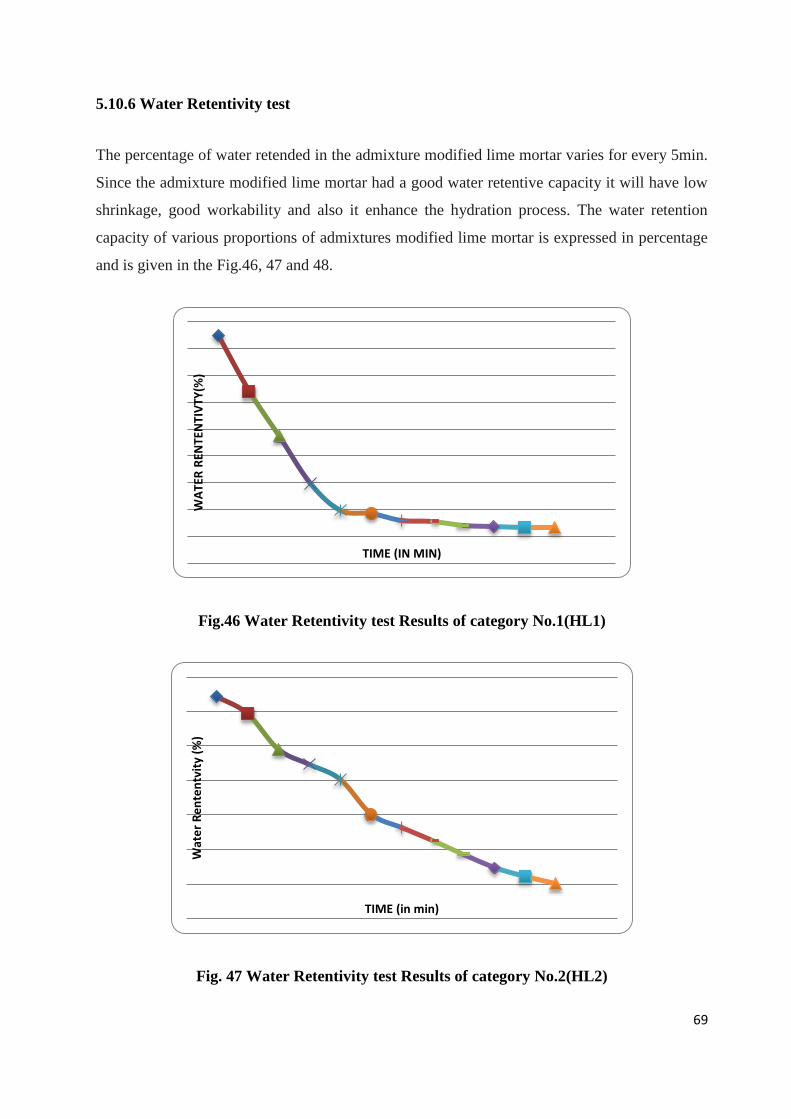
5.10.6 Water Retentivity test
The percentage of water retended in the admixture modified lime mortar varies for every 5min.
Since the admixture modified lime mortar had a good water retentive capacity it will have low
shrinkage, good workability and also it enhance the hydration process. The water retention
capacity of various proportions of admixtures modified lime mortar is expressed in percentage
and is given in the Fig.46, 47 and 48.
Fig.46 Water Retentivity test Results of category No.1(HL1)
Fig. 47 Water Retentivity test Results of category No.2(HL2)
WA
TER
REN
TEN
TIV
TY(%
)
TIME (IN MIN)
Wat
er
Re
nte
ntv
ity
(%)
TIME (in min)
70
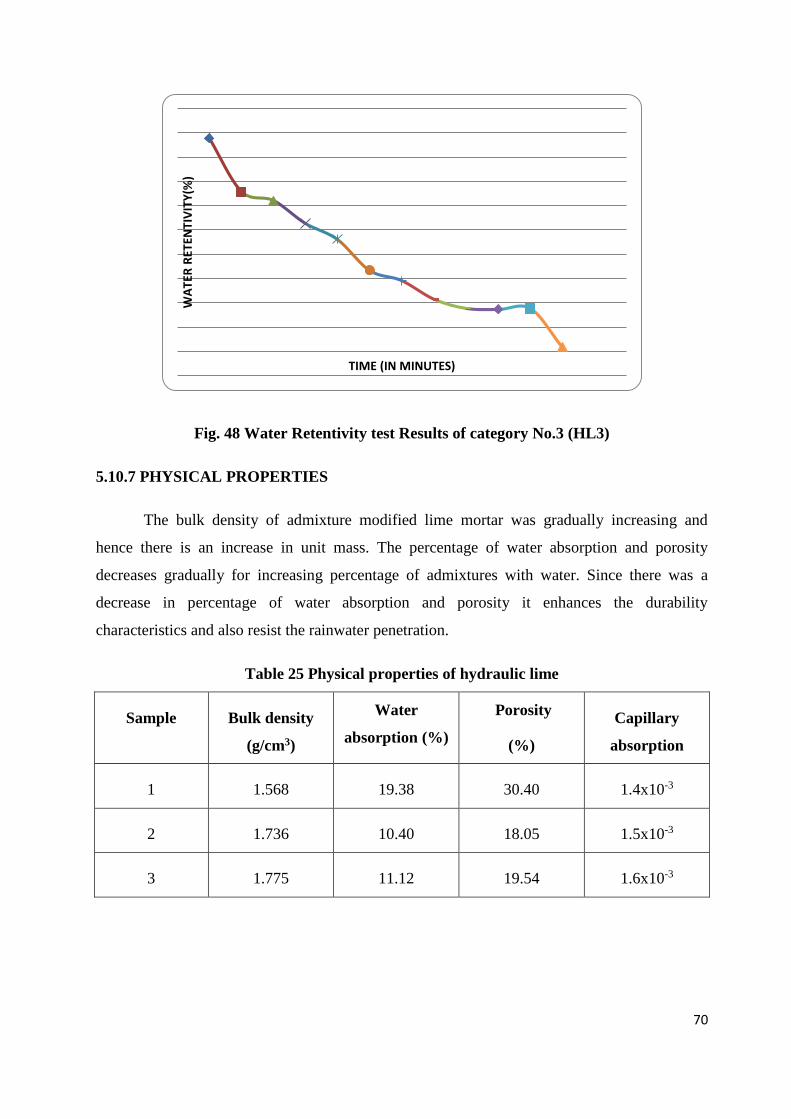
Fig. 48 Water Retentivity test Results of category No.3 (HL3)
5.10.7 PHYSICAL PROPERTIES
The bulk density of admixture modified lime mortar was gradually increasing and
hence there is an increase in unit mass. The percentage of water absorption and porosity
decreases gradually for increasing percentage of admixtures with water. Since there was a
decrease in percentage of water absorption and porosity it enhances the durability
characteristics and also resist the rainwater penetration.
Table 25 Physical properties of hydraulic lime
Sample Bulk density
(g/cm3)
Water
absorption (%)
Porosity
(%)
Capillary
absorption
1 1.568 19.38 30.40 1.4x10⁻³
2 1.736 10.40 18.05 1.5x10⁻³
3 1.775 11.12 19.54 1.6x10⁻³
WA
TER
RET
ENTI
VIT
Y(%
)
TIME (IN MINUTES)
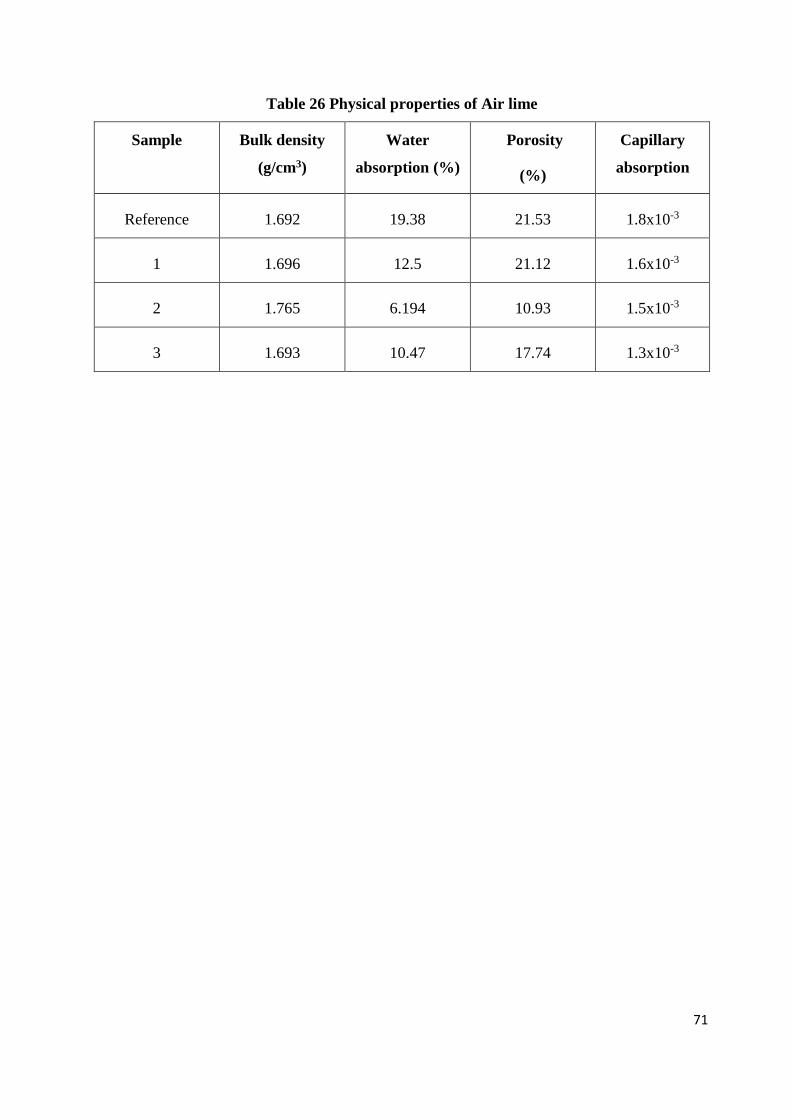
71
Table 26 Physical properties of Air lime
Sample Bulk density
(g/cm3)
Water
absorption (%)
Porosity
(%)
Capillary
absorption
Reference 1.692 19.38 21.53 1.8x10⁻³
1 1.696 12.5 21.12 1.6x10⁻³
2 1.765 6.194 10.93 1.5x10⁻³
3 1.693 10.47 17.74 1.3x10⁻³
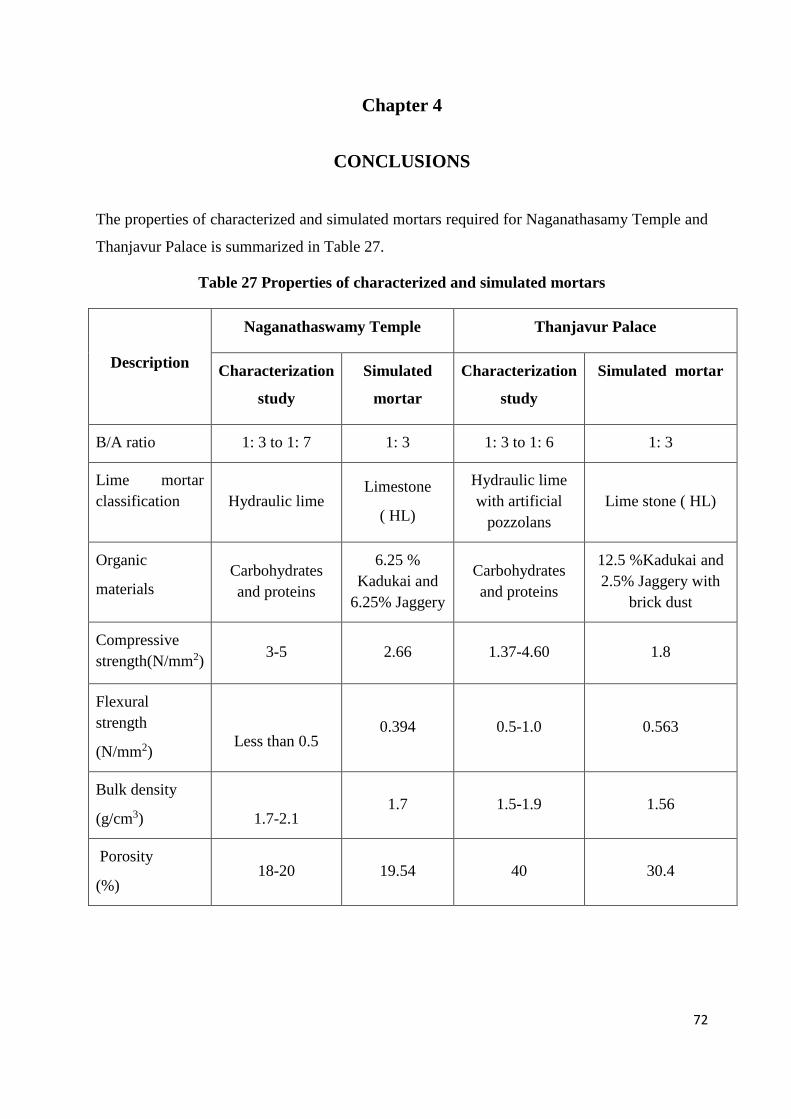
72
Chapter 4
CONCLUSIONS
The properties of characterized and simulated mortars required for Naganathasamy Temple and
Thanjavur Palace is summarized in Table 27.
Table 27 Properties of characterized and simulated mortars
Description
Naganathaswamy Temple Thanjavur Palace
Characterization
study
Simulated
mortar
Characterization
study
Simulated mortar
B/A ratio 1: 3 to 1: 7 1: 3 1: 3 to 1: 6 1: 3
Lime mortar
classification Hydraulic lime Limestone
( HL)
Hydraulic lime
with artificial
pozzolans
Lime stone ( HL)
Organic
materials
Carbohydrates
and proteins
6.25 %
Kadukai and
6.25% Jaggery
Carbohydrates
and proteins
12.5 %Kadukai and
2.5% Jaggery with
brick dust
Compressive
strength(N/mm2) 3-5 2.66 1.37-4.60 1.8
Flexural
strength
(N/mm2)
Less than 0.5 0.394 0.5-1.0 0.563
Bulk density
(g/cm3)
1.7-2.1 1.7 1.5-1.9 1.56
Porosity
(%) 18-20 19.54 40 30.4
73
Based on the study output the restoration of the both structures can be carried out. The results
of the experimental investigation will be much helpful for the Department of Archaeology both
for conservation of the ancient monuments and for preparation of restoration mortars which
will make our Country’s Monuments to stand rigid for further centuries.
--------------------------------------------------