Embed Size (px)
Citation preview

1
Characteristic Enhancement of Blood Pressure V-shaped Waves
in Sinoaortic-denervated Rats in a Conscious and Quiet State
Huan Changa,b,c,1
, Hong-Xia Gud,1
, Min Gonge, Ji-Ju Han
a, Yun Wang
a, Zuo-Li Xia
a,Xiao-Min
Zhaoa,b*
a Key Laboratory of Atherosclerosis in Universities of Shandong (Taishan Medical
University), Taian, China.
bDepartment of Pharmocology, Taishan Medical University, Taian, China
cDepartment of Pharmacy, Affiliated Hospital of Jining Medical College, Jining , China
d Department of Nephrology, No.88 Hospital of PLA, Taian, China
e Department of Laboratory Management, Taishan Medical University, Taian, China
*Corresponding author: Key Laboratory of Atherosclerosis in Universities of Shandong
(Taishan Medical University), No.2 Yingsheng Dong Road,Taian 271000, China.Tel.&Fax.:
+86 538 6225275. E-mail: zhaoxiaominty@ hotmail.com.
1These two authors contributed equally to the study.
Short title: Blood pressure V-shaped waves in sinoaortic-denervated rats.
2
Summary
A hemodynamic feature of chronic sinoaortic-denervated (SAD) rats is the increase in blood
pressure variability (BPV) without significant changes in the average level of blood pressure
(BP). The current study was designed to investigate the changes in BP V-shaped waves (V
waves) in SAD rats. Sprague-Dawley (SD) rats were divided into 2 groups: SAD rats and
sham-operated rats (n = 13). Hemodynamics measurements were obtained in conscious, freely
moving rats, four weeks after sinoaortic denervation or sham operation. V wave indices were
evaluated in rats in both conscious and quiet states. Additionally, normal and high BPV was
simulated by the production of V waves with different amplitudes. The results showed that the
V wave amplitude was dramatically increased, with a significantly prolonged duration and
reduced frequency in SAD rats. V wave BPV in SAD rats was significantly increased, though
BP remained unchanged. The twenty-four hour BPV in all rats was positively correlated with
amplitude, duration time and V wave BPV and negatively correlated with frequency. The
systolic BP spectral powers in the low frequency range (0.38-0.45 Hz) were significantly
reduced in the V waves of SAD rats. Moreover, there was a remarkable increase in mean BPV
and a normal mean BP after simulating high BPV in SAD rats. These results suggest that
enhancement of V waves might be a waveform character of BP in SAD rats in both the
conscious and quiet states. These types of V waves appear to be related to a depression of
sympathetic regulation of BP induced by sinoaortic denervation.
Key words
Rat • Sinoaortic denervation • Nerve • Blood pressure • Blood pressure variability
3
Introduction
Increased blood pressure variability (BPV) is an independent risk factor for
end-organ damage in hypertension (Parati et al. 2006, Chowdhury et al. 2014, Leoncini et al.
2013, Miao et al. 2006). Animals that have undergone sinoaortic denervation are commonly
used as models for studying high BPV. Long-term monitoring of conscious, sinoaortic
denervated (SAD) animals has shown increased BPV, with no change in the average level of
blood pressure (BP) (Norman et al. 1981; Flues et al. 2012, Sirvente et al. 2014). In fact,
studies have suggested that BPV contributes more to end-organ damage than the level of BP
itself (Miao et al. 2006). The possible mechanisms for end-organ damage induced by high
BPV in SAD animals are direct endothelial lesions (Shen et al. 2006), inflammation (Zhang et
al. 2003), oxidative stress (Zhang et al. 2015), renin-angiotensin system activation (Miao et al.
2003, Zhang et al. 2011), and increased cardiomyocyte apoptosis (Tao et al. 2004). Because
of the marked feature of high BPV in SAD rats, it is reasonable to speculate that high BPV
itself produces direct biophysical effects on the body, resulting in dysfunction. Simulating
high BPV may be a better way of studying BPV itself; however this requires a more thorough
understanding of the BP waveform. It has been reported that BP values were measured on the
basis of BP wave recordings. Furthermore, pulse wave analysis was used to assess central
aortic pressure. This is helpful when investigating the effect of anti-hypertensive agents on
end organs (Avolio et al. 2010, Manisty and Hughes 2013). The four different patterns of the
nocturnal BP profile are identified as normal dipping, nondipping, extreme dipping, and
reverse dipping. These BP profile patterns are useful for assessing prognosis for organ
damage (Afsar et al. 2015, Bendzala et al. 2015, O'Brien et al. 2003, Pickering et al. 2006).
4
However, there is little information regarding BP waveforms in high BPV and substantive
knowledge of the BP waveform characteristic that simulates high BPV is lacking, thus the
above speculation has not been examined further.
BPV is regulated by neural (Ramirez et al. 1985, Dai et al. 1997), humoral and
vascular factors (Shen and Su 2000) and influenced by genetic and environmental factors (Xu
et al. 2013). All of these factors ultimately impact the blood vessels in SAD animals. The BP
waveforms of these animals may exhibit characteristic changes induced by high BPV;
however, the characteristic changes in BP waveforms, when they occur, would be masked in
moving animals. Therefore, the aim of this study is to examine whether the BP waveform
characteristic appears in SAD rats in both conscious and quiet states. These results may
contribute to our knowledge of SAD rats and be useful for simulating high BPV.

5
Materials and Methods
Animals
Male, Sprague-Dawley (SD) rats, weighing 220-250 g, were supplied by Beijing
Vital River Laboratory Animal Technology Co., Ltd. Rats were housed in a 12 h light/12 h
dark cycle at a controlled temperature of 24 ± 2 °C and humidity of 45%-60% and had free
access to food and water. The Animal Care Ethics Committee of Taishan Medical University
(2013004) approved all animal experiments.
Preparation of the SAD rat model and experimental group
Sinoaortic denervation was performed according to the method described by
Krieger with minor modifications (Krieger 1964, Liu et al. 2013, Yu et al. 2013). The SD rats
were adapted to the housing conditions for 7 days prior to any procedures. Animals were
anesthetized with pentobarbital sodium (40 mg/kg; Merck & Co., Inc, New Jersey, USA). A
midline incision was made on the neck and bilateral sinoaortic denervation was performed.
The superior laryngeal was isolated along the vagus nerve and a 5 mm segment was removed.
The common carotid artery and the vagal trunk were isolated, and the rest of the tissue,
including the aortic nerve, sympathetic trunk, and arterial sheath tissue were all cut by
removing a 5 mm segment. The superior cervical ganglion was then removed, and the
adventitia and its adjacent tissues in the carotid bifurcation were carefully isolated in the
direction of the head. A 10% phenol in ethanol solution was applied to the isolated internal,
external, and occipital arteries to remove any residual of nerve endings in the sinus caroticus
region.

6
For the sham operation (Sham) a midline neck incision was made; the neck muscles were
isolated bilaterally and phenol was applied to each common carotid artery to control for any
potential effects of phenol in SAD rats. Rats were divided into 2 groups: an SAD group (n =
13) and a Sham group (n = 13). SAD was considered complete when the heart rate decreased
by < 20 beats per minute after a BP elevation of ≥ 50 mmHg after intravenous injection of
phenylephrine (2–5 mg/kg). A heart rate decrease of 60–100 beats per minute has been
discovered in sham-operated rats (Yu et al. 2013).
Hemodynamic monitoring of conscious rats
BP and heart rate were continuously recorded in conscious, freely moving rats as
previously described (Liu et al. 2013, Yu et al. 2013, Shang et al. 2011, Xie et al. 2003).
Briefly, 4 weeks after SAD or sham operations, rats were anesthetized with pentobarbital
sodium and a floating catheter (PE10; Biotrol, Paris, France) was inserted into the lower
abdominal artery via the left femoral artery; another catheter (PE50) was inserted into the left
femoral vein for intravenous injection. After 2 days of recovery, rats were placed in individual
cylindrical cages with food and water. A biosignal analytical system (model MPA 2000,
Shanghai Alcott Biotech Co., Ltd, Shanghai, China) was connected to the arterial catheter to
record BP. After a 14 h habituation, beat-to-beat BP and heart period (HP) values were
acquired online for 24 hours. Offline analysis was performed to obtain related hemodynamic
parameters. The beat-to-beat BP mean values were used as indexes of BP and the standard
deviations of beat-to-beat BP values as indexes of BPV (Liu et al. 2013, Yu et al. 2013, Shang
et al. 2011, Xie et al. 2003).
7
Determination of arterial baroreflex sensitivity (BRS)
BRS was measured in conscious rats, after recording normal BP for 24 hours, using
a previously described method (Smyth et al.1969, Song et al. 2010, Yu et al. 2013). Briefly, a
bolus of phenylephrine (3-5 μg /kg; Sigma Chemical Co., St. Louis, MO, USA.) was
administered via the femoral vein and BP was recorded. The dosage of phenylephrine was
adjusted to elevate systolic BP(SBP) by 20-40 mmHg. There was a delay (about 1 second)
between the increase in BP (stimulus) and the prolongation of the HP (response). HP (Y-axis)
was plotted against SBP (X-axis) for linear regression analysis with 2 to 8 shifts. The slope
with the largest correlation coefficient was taken as the BRS (msec/mmHg). The mean of two
measurements served as the final result.
Measurement of amplitude, duration time and frequency of V waves
BP was recorded from 9:00 a.m.-11:00 a.m. A surveillance camera (model 7028,
Anni Digital Technology Co., Ltd, Shenzhen, China) was used to watch the rats during BP
recording. Rats that did not move or engage in activity for 5 minutes were considered to be in
a conscious and quiet state. Uncompressed BP of V waves in these rats were selected and
analyzed offline using MPA 2000 software (Version 3.04.04.25). An entire V wave was taken
as the point at which the BP started to drop until the point at which it was restored to the
initial level. The amplitude of a V wave was represented by the difference between the
maximum and minimum BP. The duration was taken as the time at which the BP of V wave
started to drop to the time at which it was restored to the initial level. The frequency was
calculated as the number of V waves that appeared in 5 minutes. The V wave amplitude and

8
duration time means over 5 minutes were taken as the final results. In this study, a V wave
was considered valid only if the amplitude of diastolic BP(DBP) was more than 10 mmHg.
Detection of the hemodynamic parameters of V waves
The beat-to beat BP and BPV values for the V waves that appeared over 5 minutes
in conscious, quiet rats were calculated using MPA 2000 software. The mean values of these
parameters were taken as the final results.
Power spectrum analysis of V waves
The power spectrum of all V waves that appeared over 5 minutes in conscious, quiet
rats was analyzed using MPA 2000 software. Calculations of SBP spectral powers in the low
frequency (LF: 0.38-0.45 Hz) range and HP spectral powers in the high frequency (HF:
1.04-1.13 Hz) range were performed (Howarth et al. 2005, Cerutti et al. 1991) and mean SBP
and HP powers were taken as the final results.
Simulation of BPV in SAD and Sham rats
The simulation system consisted of a flow control pump (model BT-100B, Huxi
Instrument Company, Shanghai, China), a pressure roller pump (model PERIPRO-2H-220,
Guangzhou Coslan instrument co. Ltd, Guangzhou, China), a pressure variability roller pump
(model PERIPRO-2H-220, Guangzhou Coslan instrument co. Ltd, Guangzhou, China) and
hemodynamic monitor (model MPA2000, Shanghai Alcott Biotech Co., Ltd, Shanghai, China).
Heparinized whole blood from rats was allowed to flow into the simulation system and the
9
pressure pump was used to simulate BP. BPV in Sham rats was simulated by the producing
repeated V waves each with an amplitude of about 15 mmHg, a duration times of about 2 s
and a frequency of about 1 wave/5 seconds. BPV in SAD rats was simulated with repeated V
waves of the same duration and frequency as above, but with amplitudes of approximately 40
mmHg. The amplitude, duration, and frequency were adjusted with a pressure variability
roller pump (n = 4 simulations). BP results were recorded for 5 minutes via an MPA 2000
system. Mean BP (MBP) and mean BPV (MBPV) were obtained using the offline analysis
detailed above.
Statistical analysis
Data are presented as means ± SD. Statistical analysis was performed using SPSS
13.0 (SPSS Inc., Chicago, IL, USA). Comparison of two groups was conducted with a t test or
nonparametric test. Correlation analysis of two variables was performed using linear
regression. Statistical significance was accepted at P < 0.05.
10
Results
Twenty-four-hour hemodynamic data from SAD and Sham rats
Hemodynamic changes were examined over a 24-hour period in order to describe the
hemodynamic characteristics of SAD rats. SBP, DBP and MBP were not significantly
different in SAD compared with Sham rats, however SBPV, DBPV and MBPV were
significantly higher in SAD compared to Sham rats (P < 0.01) (Fig. 1). Additionally, BRS was
significantly lower in SAD than in Sham rats. Thus, the SAD rats exhibited high BPV with no
change in BP, indicating that the SAD model was successfully generated in the current study
(Yu et al. 2013, Yang et al. 2011).
Amplitude, duration time, and frequency of V waves in SAD and Sham rats in a conscious and
quiet state
The amplitude, duration time, and frequency were measured in order to identify the
V wave characteristics (Figs. 2F, 2G) of rats in conscious, quiet states. The amplitude of SBP,
DBP, and MBP of V waves was significantly higher in SAD rats compared to sham-operated
rats (P < 0.01). Also, the duration time of V waves was longer (P < 0.01), and the frequency of
V waves was lower (P < 0.05) in SAD compared to sham-operated rats (Figs. 2A-2E)
Correlation analysis of the 24-hour hemodynamic parameters and the amplitude, duration
time and frequency of V waves
In both SAD and Sham rats, the 24-hour SBPV, DBPV, and MBPV were
significantly positively correlated with the respective amplitudes of SBP, DBP, and MBP in V

11
waves (P < 0.01) and with the respective duration times of V waves (P < 0.01) while the
24-hour BPV was strongly negatively correlated with V wave frequency (P < 0.01). The
24-hour SBP, DBP, and MBP were not correlated with any of the respective V wave
parameters above (Table 1).
Hemodynamic parameters of V waves in SAD and Sham rats
Hemodynamic parameters were examined in SAD and Sham rats in a conscious and
quiet state in order to investigate BP and BPV changes of V waves The results showed that
the SBPV, DBPV, and MBPV of V waves in the SAD group were significantly higher (P <
0.01) than in the Sham group, though there was no significant difference in SBP, DBP, and
MBP of V waves between these groups (Fig. 3).
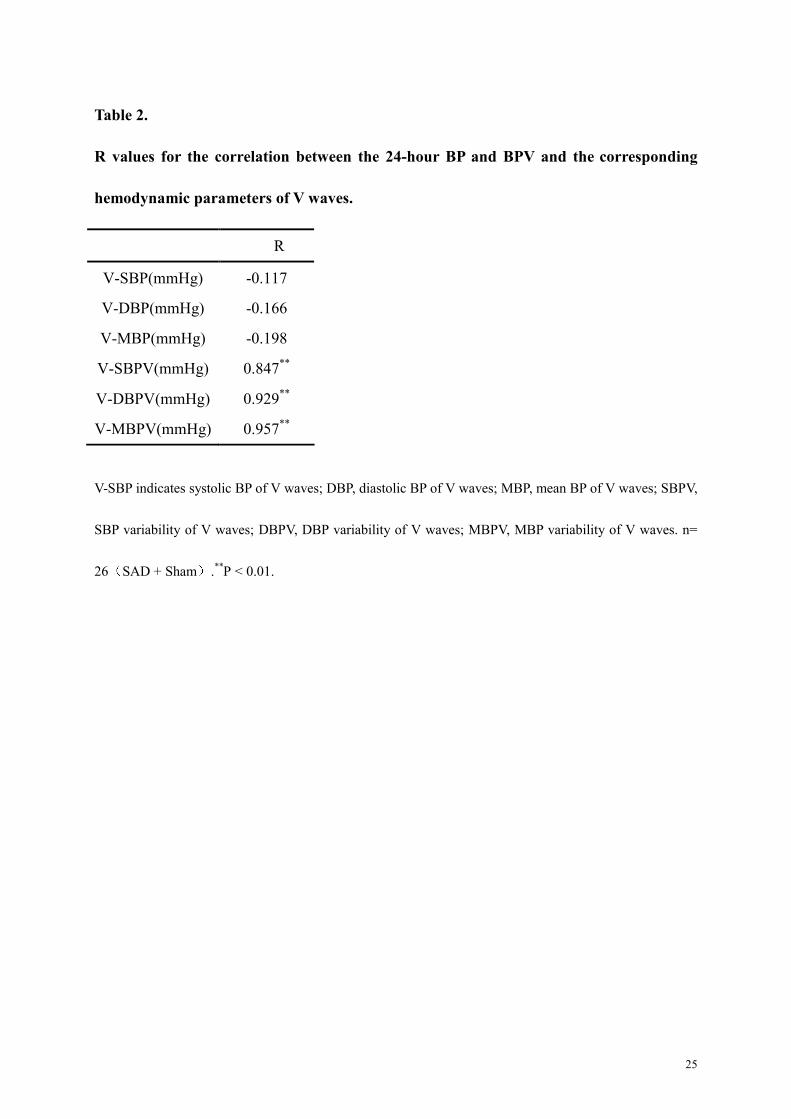
Correlation analysis between 24-hour hemodynamic parameters and BP and BPV of V waves
in SAD and Sham rats,
The 24-hour SBPV, DBPV, and MBPV were significantly positively correlated with
the SBPV, DBPV, and MBPV of V waves, respectively, in both SAD and Sham rats, (P <
0.01). However, the 24-hour SBP, DBP, and MBP were not correlated with the SBP, DBP, and
MBP of V waves, respectively (Table 2).
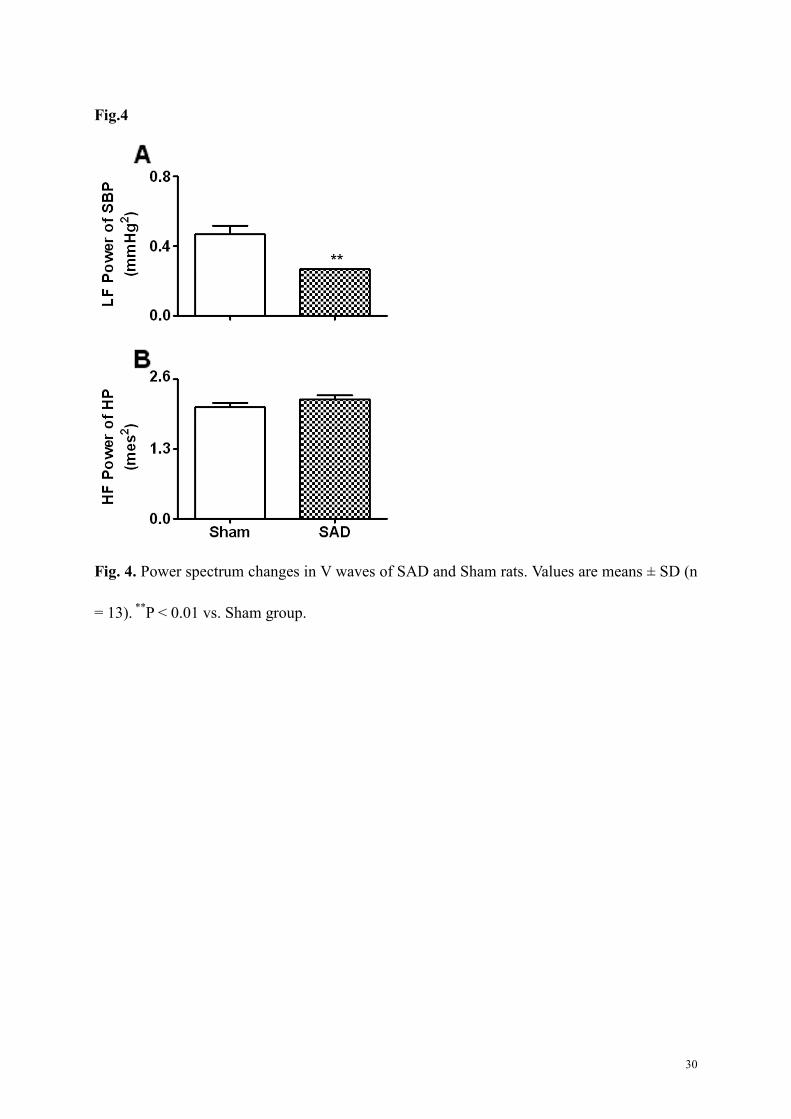
V wave Power spectrum changes in SAD and Sham rats
Power spectrum analysis was performed to describe changes in autonomic nerve
function in V waves of rats in a conscious and quiet state. SBP spectral powers in the LF

12
range decreased markedly in SAD compared with Sham rats (Fig. 4). There were no
significant differences in HP spectral powers between SAD and Sham rats in the HF range.
Simulated Hemodynamic parameters for SAD and Sham rats
Simulated MBP for SAD rats was almost the same as the simulated MBP for Sham
rats (Fig. 5A). However, simulated MBPV for SAD rats was markedly increased compared to
that for Sham rats (Fig. 5B).

13
Discussion
In this study, it was demonstrated that V waves are enhanced in conscious, quiet
SAD rats. The enhancement of V waves in these rats was exhibited by larger amplitude,
longer duration time, and lower frequency. Moreover, there was high BPV and no change in
BP of V waves in SAD rats. The 24-hour BPV and the V wave BPV were significantly
positively correlated in rats. The enhancement of V waves resulting from sinoaortic
denervation may be related to a depression in the sympathetic regulation of BP. Furthermore,
simulation of high BPV in SAD rats was produced when the corresponding V waves were
simulated.
Since BP waveform characteristics can be disturbed by activity, the waveforms in
this study were observed while rats were in a quiet state. The BP waveforms in conscious,
quiet SAD rats were characterized as enhanced V waves. This suggests that V wave
enhancement may be a waveform characteristic of BP in conscious, quiet SAD rats. The
following evidence supports the V wave enhancement observed in this study: First, the V
wave amplitude was dramatically increased, the duration time was significantly prolonged
and the frequency was obviously reduced in SAD rats. In addition, the 24-hour BPV was
positively correlated with V wave amplitude and duration time and negatively correlated with
V wave frequency. Secondly, the SBPV, DBPV, and MBPV of V waves were significantly
increased in SAD rats, however there were no significant changes in SBP, DBP, and MBP of
V waves. Interestingly, these hemodynamic changes in V waves are consistent with the
increased BPV and unchanged BP observed in SAD rats (Mancia and Parati 2003, Xie et al.
2005, Yu et al. 2013, Yang et al. 2011). Moreover, the 24-hour BPV was positively correlated

14
with the BPV of V waves in rats, but was not correlated with BP of V waves, indicating that
the BPV of V waves reflected the 24-hour BPV. Third, simulation of high BPV was achieved
when the corresponding V waves were simulated. On the basis of these findings, all V wave
amplitudes of SBP in conscious, quiet SAD rats were more than 30 mmHg. Thus, enhanced V
wave amplitude may be an indicator of successful baroreceptor denervation in SAD rats.
Vagus and sympathetic nerves play important roles in regulating BP and HP and
alterations in their function can be analyzed with power spectrum analysis. HP spectral
powers in the HF (1.04-1.13 Hz) range represent the function of vagus nerves and BP spectral
powers in the LF range (0.38-0.45 Hz) are generally accepted as a marker of sympathetic
modulation (Aubert et al.1999, Pires et al. 2013, Cerutti et al. 1991, Howarth et al. 2005,
Yeragani et al. 1998). The power spectrum was further analyzed to describe the production
mechanism of V waves associated with autonomic nerve function. The present study indicated
that, the SBP power in the LH range was reduced in the V waves of SAD rats whereas the HP
power in the HF range showed no significant change. These results suggest that the
sympathetic regulation of BP in V waves was depressed in SAD rats. Therefore, the
dysfunction of sympathetic nerves might be one of the reasons for enhancement of V waves in
conscious, quiet SAD rats.
In summary, these results indicate that enhancement of V waves may be a waveform
characteristic of BP in conscious, quiet SAD rats. This enhancement may be related to
depression of the sympathetic regulation of BP induced by sinoaortic denervation. The
enhancement of V waves may add a new feature to SAD rats. Additionally, the V wave
characteristics (an SBP amplitude of more than 30 mmHg) may be useful for evaluating the

15
success of sinoaortic denervation and simulation of high BPV. Future studies are needed to
further investigate the mechanism(s) underlying the production of V waves.

16
Conflict of Interest
The authors report no conflict of interest.

17
Acknowledgements
This work was supported by the National Natural Science Foundation of China (81173061)
and the Excellent Young Research Award Fund of Shandong Province of China (BS2011YY
059).

18
References
AFSAR B, ELSURER R, KIRKPANTUR A, KANBAY M: Urinary sodium excretion and
ambulatory blood pressure findings in patients with hypertension.J Clin Hypertens
(Greenwich) 17:200-206,2015.
AVOLIO AP, BUTLIN M, WALSH A: Arterial blood pressure measurement and pulse wave
analysis--their role in enhancing cardiovascular assessment.Physiol Meas
31:R1-47,2010.
AUBERT AE, RAMAEKERS D, BECKERS F, BREEM R, DENEF C, VAN DE WERF F,
ECTOR H: The analysis of heart rate variability in unrestrained rats. Validation of
method and results. Comput Methods Programs Biomed 60:197-213, 1999.
CERUTTI C, GUSTIN M P, PAULTARE C Z, LO M, JULIEN C, VINTURAL M,
SASSARD J: Autonomic nervous system and cardiovascular variability in rats: a
spectral analysis approach. Am J Physiol 261:H1292-H1299, 1991.
BENDZALA M, KRUZLIAK P, GASPAR L, SOUCEK M, MRDOVIC I, SABAKA P,
DUKAT A, GASPAROVA I, MALAN L, TAKAZAWA K: Prognostic
significance of dipping in older hypertensive patients.Blood Press 24:103-110,2015
CHOWDHURY EK, OWEN A, KRUM H, WING LM, NELSON MR, REID CM; SECOND
AUSTRALIAN NATIONAL BLOOD PRESSURE STUDY MANAGEMENT
COMMITTEE: Systolic blood pressure variability is an important predictor of
cardiovascular outcomes in elderly hypertensive patients. J Hypertens 32: 525-533,
2014
DAI SM, SHAN ZZ, MIAO CY, YIN M, SU DF:Hemodynamic responses to endothelin-1

19
and endothelin antagonists microinjected into the nucleus tractus solitarius in rats. J
Cardiovasc Pharmaco l30: 475-480, 1997.
FLUES K, MORAES-SILVA IC, MOSTARDA C, SOUZA PR, DINIZ GP, MOREIRA ED,
PIRATELLO AC, CHAVES ML, DE ANGELIS K, SALEMI VM, IRIGOYEN MC,
CALDINI EG: Cardiac and pulmonary arterial remodeling after sinoaortic denervation
in normotensive rats. Auton Neurosci 166:47-53, 2012.
HOWARTH FC, JACOBSON M, NASEER O, ADEGHA TE E:Short-term effects of
streptozotocin-induced diabetes on the electrocardiogram, physical activity and body
temperature in rats. Exp Physiol 90:237-245, 2005.
KRIEGER EM: Neurogenic hypertension in the rat. Circ Res 15: 511-521, 1964.
LEONCINI G, VIAZZI F, STORACE G, DEFERRARI G, PONTREMOLI R: Blood
pressure variability and multiple organ damage in primary hypertension. J Hum
Hypertens 27::::663-670, 2013
LIU AJ, GUO JM, LIU W, SU FY, ZHAI QW, MEHTA JL, WANG WZ, SU DF: Involvement
of arterial baroreflex in the protective effect of dietary restriction against stroke. J
Cereb Blood Flow Metab 33:906-913, 2013.
MANISTY CH, HUGHES AD: Meta-analysis of the comparative effects of different classes
of antihypertensive agents on brachial and central systolic blood pressure, and
augmentation index.Br J Clin Pharmacol 75:79-92,2013.
MANCIA G, PARATI G:The role of blood pressure variability in end-organ damage. J
Hypertens Suppl 21:S17-S23, 2003.
MIAO CY, ZHANG LM, YUAN WJ, SU DF: Angiotensin II and AT1 receptor in

20
hypertrophied ventricles and aortas of sinoaortic-denervated rats. Acta Pharmacol
Sin 24:812-818, 2003.
MIAO CY, XIE HH, ZHAN LS, SU DF: Blood pressure variability is more important than
blood pressure level in determination of end-organ damage in rats. J Hypertens
24:1125-1135, 2006.
NORMAN RA JR, COLEMAN TG, DENT AC: Continuous monitoring of arterial pressure
indicates sinoaortic denervated rats are not hypertensive. Hypertension 3:119-125,
1981.
O'Brien E, Asmar R, Beilin L, Imai Y, Mallion JM, Mancia G, Mengden T, Myers M, Padfield
P, Palatini P, Parati G, Pickering T, Redon J, Staessen J, Stergiou G, Verdecchia P;
European Society of Hypertension Working Group on Blood Pressure Monitoring:
European Society of Hypertension recommendations for conventional, ambulatory
and home blood pressure measurement.J Hypertens 21:821-848, 2003.
PARATI G, FAINI A, VALENTINI M: Blood pressure variability: its measurement and
significance in hypertension. Curr Hypertens Rep 8:199-204, 2006.
PICKERING TG, SHIMBO D, HAAS D: Ambulatory blood-pressure monitoring.N Engl J
Med 354:2368-2374, 2006.
PIRES W, WANNER SP, LIMA MR, FONSECA IA, FUMEGA U, HAIBARA AS,
COIMBRA CC, LIMA NR: Physical exercise performance in temperate and warm
environments is decreased by an impaired arterial baroreflex. PLoS One 8: e72005,
2013.

21
RAMIREZ AJ, BERTINIERI G, BELLI L, CAVALLAZZI A, DI RIENZO M, PEDOTTI A,
MANCIA G: Reflex control of blood pressure and heart rate by arterial baroreceptors
and by cardiopulmonary receptors in the unanaesthetized cat. J Hypertens 3:327-335,
1985.
SHANG W, HAN P, YANG CB, GU XW, ZHANG W, XU LP, FU ST, SU DF, XIE HH:
Synergism of irbesartan and amlodipine on hemodynamic amelioration and organ
protection in spontaneously hypertensive rats.Acta Pharmacol Sin 32:1109-1115,
2011.
SHEN FM, SU DF: The effect of adenosine on blood pressure variability in sinoaortic
denervated rats is mediated by adenosine A2a-Receptor.J CardiovascPharmacol 36:
681-686, 2000.
SHEN FM, ZHANG SH, XIE HH,CJING Q, WANG DS, SU DF: Early structural changes of
aortic wall in sinoaortic denervated rats. Clin Exp Pharmacol Physiol 33:358-363,
2006.
SMYTH HS, SLEIGHT P, PICKERING GW: Reflex regulation of arterial pressure during
sleep in man: a quantitative method of assessing baroreflex sensitivity. Circ
Res 24:109-121, 1969.
SIRVENTE RA, IRIGOYEN MC, SOUZA LE, MOSTARDA C, LA FUENTE RN,
CANDIDO GO,SOUZA PR, MEDEIROS A, MADY C, SALEMI VM: Cardiac
impairment evaluated by transesophageal echocardiography and invasive
measurements in rats undergoing sinoaortic denervation. PLoS One 9:e87935, 2014.
SONG SW, LIU AJ, BAI C, SU BL, MA XJ, SHEN FM, DUAN JL, SU DF: Blood pressure
22
reduction combining baroreflex restoration for stroke prevention in hypertension in
rats. Front Pharmacol 1: 6, 2010.
TAO X, ZHANG SH, SHEN FM, SU DF: High-level apoptosis is persistent in
myocardiocytes of sinoaortic-denervated rats. J Hypertens 22:557-563, 2004.
XIE HH, MIAO CY, LIU JG, SU DF: Effects of long-term treatment with candesartan on
organ damages in sinoaortic denervated rats. J Cardiovasc Pharmacol 41:325-331,
2003.
XIE HH, SHEN FM, CAO YB LI HL, SU DF: Effects of low-dose ketanserin on blood
pressure variability, baroreflex sensitivity and end-organ damage in spontaneously
hypertensive rats. Clin Sci (Lond) 108:547-552, 2005.
XU X, DING X, ZHANG X, SU S, TREIBER FA, VLIETINCK R, FAGARD R, DEROM
C,GIELEN M, LOOS RJ, SNIEDER H, WANG X:Genetic and environmental
influences on blood pressure variability: a study in twins. J Hypertens 31:690-697,
2013.
YANG ZW, LI DJ, LIU C, HAN P, YANG YL, SU DF, SHEN FM: Role of vascular
K(ATP)channels in blood pressure variability after sinoaortic denervation in rats. Acta
Pharmacol Sin 32:194-200, 2011
YERAGANI VK, SOBOLEWSKI E, JAMPALA VC, KAY J, YERAGANI S, IGEL G:
Fractal dimension and approximate entropy of heart period and heart rate: awake
versus sleep differences and methodological issues. Clin Sci (Lond) 95:295-301, 1998.
YU JG, SONG SW, SHU H, FAN SJ, LIU AJ, LIU C, GUO W, GUO JM, MIAO CY, SU DF:
Baroreflex deficiency hampers angiogenesis after myocardial infarction via

23
acetylcholine-α7-nicotinic ACh receptor in rats. Eur Heart J 34:2412-2420, 2013.
ZHANG C, CHEN H, XIE HH,SHU H, YUAN WJ, SU DF: Inflammation is involved in the
organ damages induced by sinoaortic denervation in rats. J Hypertens 21: 2141-2148,
2003.
ZHANG L, LI F, ZHI G, ZHANG B, CHEN YD: NADPH oxidase contributes to the left
ventricular dysfunction induced by sinoaortic denervation in rats. Free Radic Res
49:57- 66, 2015.
ZHANG LC, LI ZZ, YU YS, WANG ZB, WEI X, SU DF, LI L: Angiotensin-
convertingenzyme and Angiotensin-converting enzyme 2 are involved in sinoaortic
denervation-induced cardiovascular hypertrophy in rats. Biol Pharm Bull
34:1398-1403, 2011.

24
Table 1. R-values for the correlation between 24-hour hemodynamic parameters and the
amplitude, duration time and frequency of V waves.
SBP indicates systolic blood pressure; DBP, diastolic blood pressure; MBP, mean blood pressure; SBPV,
SBP variability; DBPV, DBP variability; MBPV, MBP variability. n = 26 (SAD + Sham). **
P < 0.01.
Variable SBP DBP MBP SBPV DBPV MBPV
Amplitude (SBP) 0.120 0.114 0.079 0.898**
0.828**
0.966**
Amplitude (DBP) 0.104 0.094 0.069 0.709**
0.735**
0.934**
Amplitude (MBP) 0.144 0.156 0.139 0.544**
0.781**
0.887**
Duration time 0.156 0.075 0.118 0.665**
0.658**
0.730**
Frequency 0.116 0.110 0.156 -0.801**
-0.796**
-0.597**
25
Table 2.
R values for the correlation between the 24-hour BP and BPV and the corresponding
hemodynamic parameters of V waves.
V-SBP indicates systolic BP of V waves; DBP, diastolic BP of V waves; MBP, mean BP of V waves; SBPV,
SBP variability of V waves; DBPV, DBP variability of V waves; MBPV, MBP variability of V waves. n=
26(SAD + Sham).**
P < 0.01.
R
V-SBP(mmHg) -0.117
V-DBP(mmHg) -0.166
V-MBP(mmHg) -0.198
V-SBPV(mmHg) 0.847**
V-DBPV(mmHg) 0.929**
V-MBPV(mmHg) 0.957**

26
Fig.1
Fig. 1. Hemodynamic changes in SAD and Sham rats over 24 hours. (A) A comparison of BP
and BPV in SAD and Sham rats. (B) A comparison of BRS in SAD and Sham rats. Values are
means ± SD (n = 13). **
P < 0.01 vs. Sham group.

27
Fig. 2. Amplitude (A, B, C), duration time (D), and frequency (E) of V waves and typical V

28
wave diagram in uncompressed state displayed with the MPA 2000 software in Sham (F) and
SAD (G) rats. Red (top) represents SBP recording curve. Green (middle) represents MBP
recording curve. Blue (bottom) represents DBP recording curve. Values are means ± SD (n =
13). **
P < 0.01 vs. Sham group.

29
Fig.3
Fig. 3. Hemodynamic changes in V waves of SAD and Sham rats. Values are means ± SD (n
= 13). **
P < 0.01 vs. Sham group.
30
Fig.4
Fig. 4. Power spectrum changes in V waves of SAD and Sham rats. Values are means ± SD (n
= 13). **
P < 0.01 vs. Sham group.

31
Fig.5
Fig. 5. Simulated hemodynamic changes. (A) Simulated V wave diagram for Sham and SAD
rats in uncompressed state displayed with MPA 2000 software. (B) Simulated hemodynamic
parameters for Sham and SAD rats. Values are means ± SD (n = 4). **
P < 0.01 vs. Simulation
of Sham group.


![The Central Vein Sign Relationship to the Blood-Brain ... · established animal model of MS pathophysiology [19]. Gadolinium-DTPA enhancement on MRI is an indicator of blood-brain](https://img.pdfslide.net/doc/110x75/5e8b5e7c6c0ff77ef16fd42c/the-central-vein-sign-relationship-to-the-blood-brain-established-animal-model.jpg)