Embed Size (px)
Citation preview
DOT HS 810 857 November 2007
Characteristics of Crash Injuries Among Young, Middle-Aged, and Older DriversTechnical Report
This document is available to the public from the National Technical Information Service, Springfield, Virginia 22161

[This Page Intentionally Left Blank]
Technical Report Documentation Page 1. Report No. 2. Government Accession No. 3. Recipient’s Catalog No. DOT HS 810 857
5. Report Date November 2007
4. Title and Subtitle Characteristics of Crash Injuries Among Young, Middle-Aged, and Older Drivers 6. Performing Organization Code
NVS-421 7. Author(s) 8. Performing Organization Report No. Cejun Liu,* Dennis Utter,† and Chou-Lin Chen†
10. Work Unit No. (TRAIS)n code
9. Performing Organization Name and Address * Program analyst, employed by URC, Inc., works with the Mathematical Analysis Division, National Center for Statistics and Analysis, NHTSA. † Mathematical statisticians, Mathematical Analysis Division, National Center for Statistics and 11. Contract of Grant No.
Analysis, NHTSA. 13. Type of Report and Period Covered NHTSA Technical Report
12. Sponsoring Agency Name and Address Mathematical Analysis Division, National Center for Statistics and Analysis National Highway Traffic Safety Administration U.S. Department of Transportation 14. Sponsoring Agency Code 1200 New Jersey Avenue SE., Washington, DC 20590 15.Supplementary Notes The authors wish to thank Rajesh Subramanian, Joseph Tessmer, Seymour Stern, Mark Mynatt, Eric Ferguson, Kirk Allen, John Kindelberger, and Xuemei Pan for helpful comments and Cecily Williams and Richard Maurey for proofreading this report. 16. Abstract One of the most important factors that affects a person’s risk of injury in a motor vehicle crash is the age of the person. This study investigates patterns of injury severity, location of injuries, and contact sources for the driver injuries by driver age. Based on the data from NHTSA’s National Automotive Sampling System — Crashworthiness Data System (NASS-CDS) from 1993 through 2004, this study examines in great detail the driver injury severity, injured body regions, and injury contact sources by driver age in rollover and non-rollover real-world traffic crashes. The effect of seat belt use on injury patterns is also investigated. Studies show that among older drivers, females are more likely to sustain severe injuries, as measured by the Maximum Abbreviated Injury Scale (MAIS) of 4 or above, as compared to males. This pattern is reversed for drivers under age 65. The pattern of severe injuries to those in rollovers was independent of age. However, in non-rollover crashes, the older drivers are more likely to sustain severe injuries, especially in left-side impact crashes. There is a statistically significant reduction in injury severity in both rollover and non-rollover crashes to the drivers when seat belts were used. This study by analyzing the injury locations, source, and severity, enables the identification of features associated with crash protection of drivers from aspects such as engineering, human factors, and clinical research. Studies also call attention to the need for vehicle improved crashworthiness and design to make vehicles more protective for older drivers.
17. Key Words 18. Distribution Statement Driver, age, gender, older drivers, rollover, non-rollover, frontal, right- Document is available to the public through the National Technical side, rear, left-side, MAIS, AIS, seat belt, injury severity, NASS-CDS Information Service, Springfield, VA 22161
19. Security Classif. (of this report) 20. Security Classif. (of this page) 21. No of Pages 22. Price Unclassified Unclassified 48
Form DOT F1700.7 (8-72) Reproduction of completed page authorized
Table of Contents 1. Executive Summary......................................................................................................................... 2 2. Introduction ...................................................................................................................................... 4 2.1 Background .................................................................................................................................. 4 2.2 Object of the Study ...................................................................................................................... 6 3. Data and Methods ............................................................................................................................ 7 4. Driver Overall Injury Severity.......................................................................................................... 8 4.1 Driver Overall Injury Severity...................................................................................................... 8 4.2 Driver Overall Injury Severity by Gender................................................................................... 9 5. Driver Injury Severity by Crash Modes........................................................................................ 10 5.1 Driver Injury Severity in Rollover Crashes.............................................................................. 10 5.2 Driver Injury Severity in Non-Rollover Crashes...................................................................... 11 5.3 Driver Injury Severity by Seat Belt Use.................................................................................... 12 5.4 Logistic Regression Modeling on Driver Injury Severity ....................................................... 14 6. Driver Injured Body Region .......................................................................................................... 15 6.1 Rollover Crashes........................................................................................................................ 15 6.2 Non-Rollover Crashes ............................................................................................................... 17 7. Driver Injury Contact Sources ...................................................................................................... 25 7.1 Rollover Crashes........................................................................................................................ 25 7.2 Non-Rollover Crashes ............................................................................................................... 27 8. Discussions .................................................................................................................................... 35 9. Conclusions.................................................................................................................................... 36 10. References.................................................................................................................................... 38 11. Appendix....................................................................................................................................... 41 11.1 Driver Overall Injury Severity.................................................................................................. 41 11.2 Driver Overall Injury Severity by Gender............................................................................... 41 11.3 Driver Injury Severity by Crash Modes.................................................................................. 42 11.4 Driver Injury Severity by Seat Belt Use.................................................................................. 43 11.5 Driver Injured Body Region .................................................................................................... 44 11.6 Driver Injury Contact Sources ................................................................................................ 47
________________________________________________________________________ NHTSA’s National Center for Statistics and Analysis 1200 New Jersey Avenue SE., Washington, DC 20590
2
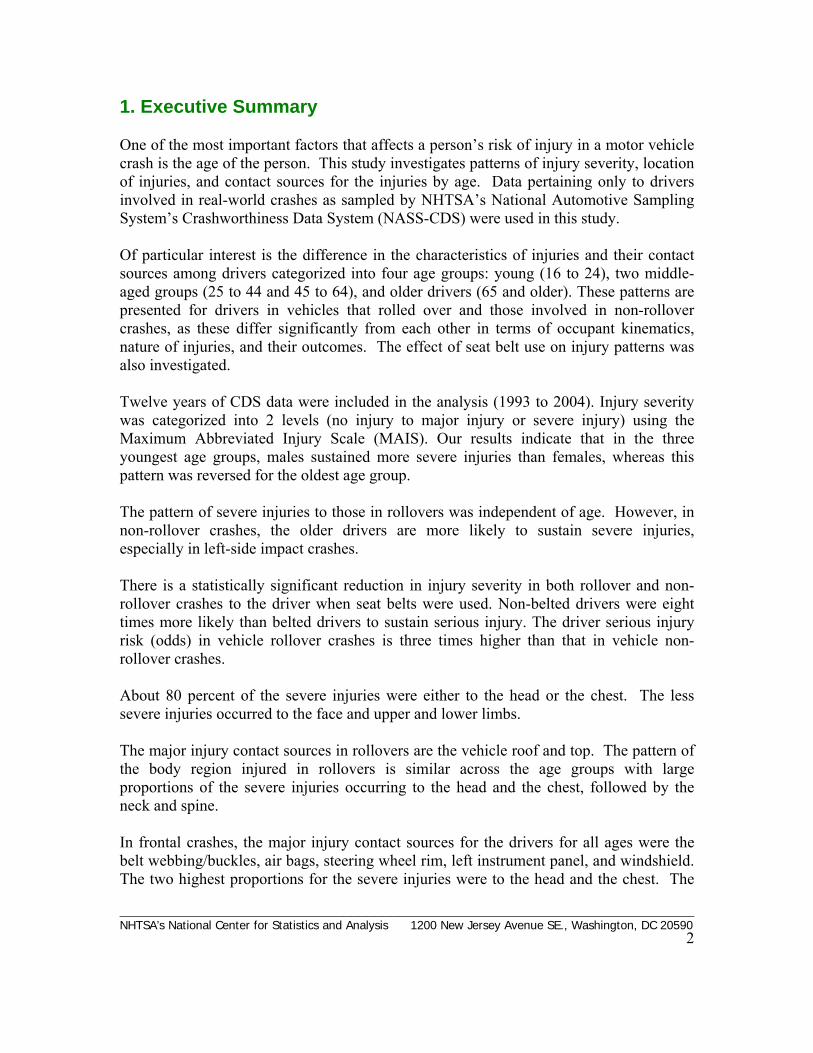
1. Executive Summary
One of the most important factors that affects a person’s risk of injury in a motor vehicle crash is the age of the person. This study investigates patterns of injury severity, location of injuries, and contact sources for the injuries by age. Data pertaining only to drivers involved in real-world crashes as sampled by NHTSA’s National Automotive Sampling System’s Crashworthiness Data System (NASS-CDS) were used in this study. Of particular interest is the difference in the characteristics of injuries and their contact sources among drivers categorized into four age groups: young (16 to 24), two middle-aged groups (25 to 44 and 45 to 64), and older drivers (65 and older). These patterns are presented for drivers in vehicles that rolled over and those involved in non-rollover crashes, as these differ significantly from each other in terms of occupant kinematics, nature of injuries, and their outcomes. The effect of seat belt use on injury patterns was also investigated. Twelve years of CDS data were included in the analysis (1993 to 2004). Injury severity was categorized into 2 levels (no injury to major injury or severe injury) using the Maximum Abbreviated Injury Scale (MAIS). Our results indicate that in the three youngest age groups, males sustained more severe injuries than females, whereas this pattern was reversed for the oldest age group. The pattern of severe injuries to those in rollovers was independent of age. However, in non-rollover crashes, the older drivers are more likely to sustain severe injuries, especially in left-side impact crashes. There is a statistically significant reduction in injury severity in both rollover and non-rollover crashes to the driver when seat belts were used. Non-belted drivers were eight times more likely than belted drivers to sustain serious injury. The driver serious injury risk (odds) in vehicle rollover crashes is three times higher than that in vehicle non-rollover crashes. About 80 percent of the severe injuries were either to the head or the chest. The less severe injuries occurred to the face and upper and lower limbs. The major injury contact sources in rollovers are the vehicle roof and top. The pattern of the body region injured in rollovers is similar across the age groups with large proportions of the severe injuries occurring to the head and the chest, followed by the neck and spine. In frontal crashes, the major injury contact sources for the drivers for all ages were the belt webbing/buckles, air bags, steering wheel rim, left instrument panel, and windshield. The two highest proportions for the severe injuries were to the head and the chest. The
________________________________________________________________________ NHTSA’s National Center for Statistics and Analysis 1200 New Jersey Avenue SE., Washington, DC 20590
3
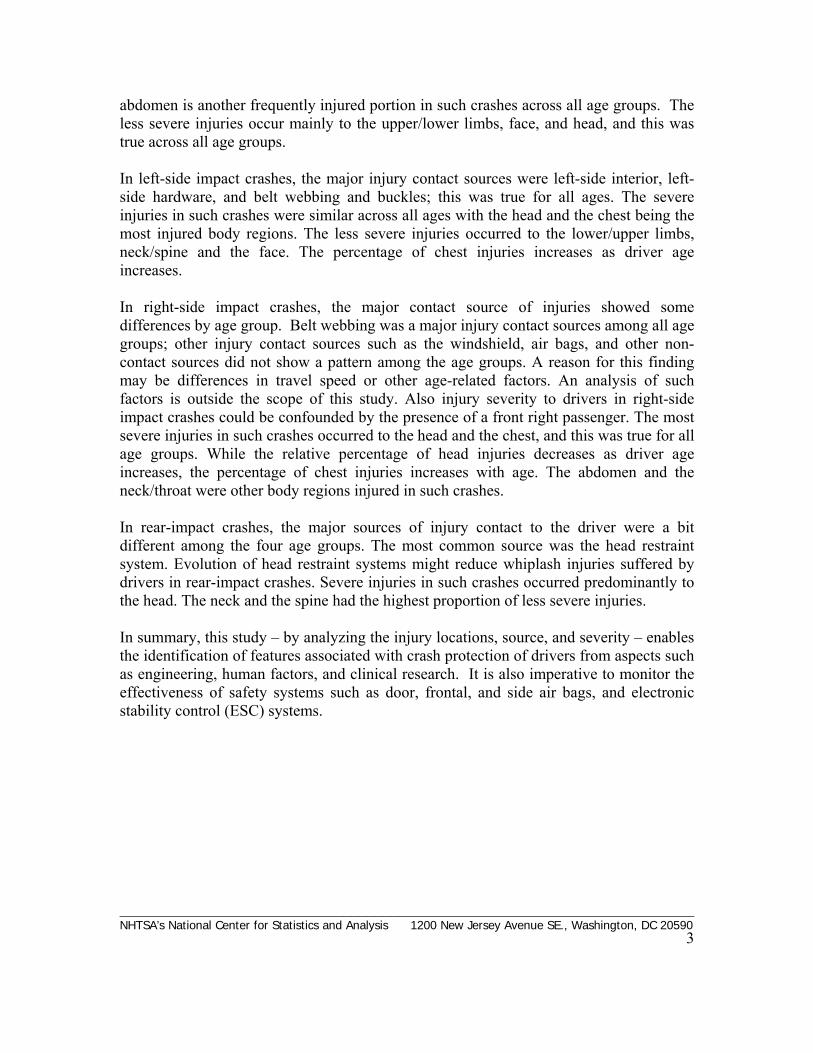
abdomen is another frequently injured portion in such crashes across all age groups. The less severe injuries occur mainly to the upper/lower limbs, face, and head, and this was true across all age groups. In left-side impact crashes, the major injury contact sources were left-side interior, left- side hardware, and belt webbing and buckles; this was true for all ages. The severe injuries in such crashes were similar across all ages with the head and the chest being the most injured body regions. The less severe injuries occurred to the lower/upper limbs, neck/spine and the face. The percentage of chest injuries increases as driver age increases. In right-side impact crashes, the major contact source of injuries showed some differences by age group. Belt webbing was a major injury contact sources among all age groups; other injury contact sources such as the windshield, air bags, and other non-contact sources did not show a pattern among the age groups. A reason for this finding may be differences in travel speed or other age-related factors. An analysis of such factors is outside the scope of this study. Also injury severity to drivers in right-side impact crashes could be confounded by the presence of a front right passenger. The most severe injuries in such crashes occurred to the head and the chest, and this was true for all age groups. While the relative percentage of head injuries decreases as driver age increases, the percentage of chest injuries increases with age. The abdomen and the neck/throat were other body regions injured in such crashes. In rear-impact crashes, the major sources of injury contact to the driver were a bit different among the four age groups. The most common source was the head restraint system. Evolution of head restraint systems might reduce whiplash injuries suffered by drivers in rear-impact crashes. Severe injuries in such crashes occurred predominantly to the head. The neck and the spine had the highest proportion of less severe injuries. In summary, this study – by analyzing the injury locations, source, and severity – enables the identification of features associated with crash protection of drivers from aspects such as engineering, human factors, and clinical research. It is also imperative to monitor the effectiveness of safety systems such as door, frontal, and side air bags, and electronic stability control (ESC) systems.
________________________________________________________________________
NHTSA’s National Center for Statistics and Analysis 1200 New Jersey Avenue SE., Washington, DC 20590
4
2. Introduction
2.1 Background
One of the most important variables related to crash risk is driver age. Numerous studies have confirmed that the crash risk, as a function of age, conforms to a U-shaped relationship – crash rates, when based on vehicle miles traveled (VMT), are high among teenagers, are lower among middle-aged drivers, and increase again among older drivers. Young drivers are over-involved in head-on crashes and crashes related to speeding and rollover. Drivers of middle age were found to have a higher percentage of crashes while under the influence of alcohol. Whether at intersections or at other locations, older drivers were found to be over-involved in right- and left-turn crashes.1 2 3 4 Results from highway crashes generally have been and continue to be major problems, and they have been attracting increased attention from researchers in engineering, human factors, and clinical science.5 6 7 8 9 The difference in characteristics of crashes between young, middle-aged, and older drivers has already resulted in the difference of crash injuries to young, middle-aged, and older drivers. For instance, a study conducted by the Trauma Center of the University of Michigan shows that older drivers are at higher risk of chest injuries.10 This finding can be partially explained from the following two perspectives: Older drivers are more likely to be involved in left-turn (driver-side-impact) crashes, which lead to a higher percentage of driver chest injuries; and older drivers have higher percentages of restraint use,11 and the chest is the major load-bearing area for restraint systems. † ‡ For driver injury severity by age, it is generally acknowledged that the energy required to cause an injury decreases with age, given assumed similar crash conditions, and therefore older drivers are more vulnerable to injury in a crash. Their skeletal structures are more easily damaged, and the consequences of any assault are likely to be more serious compared with younger drivers.14 15 16 17 18 19
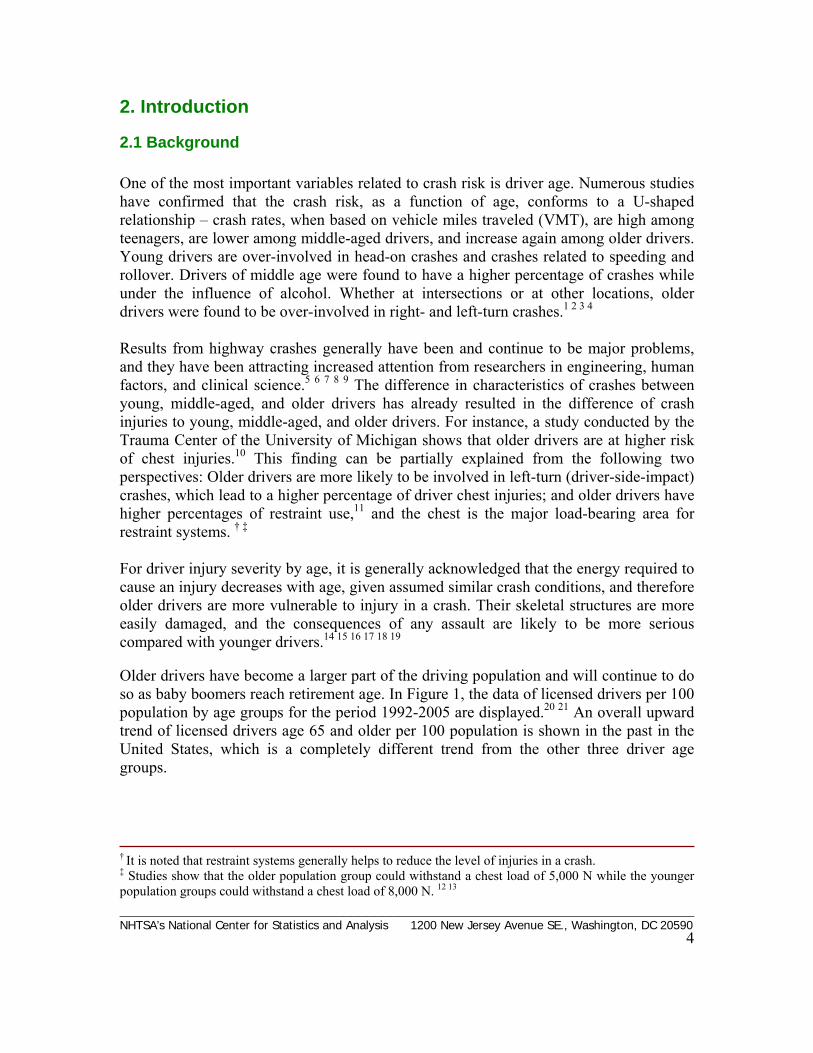
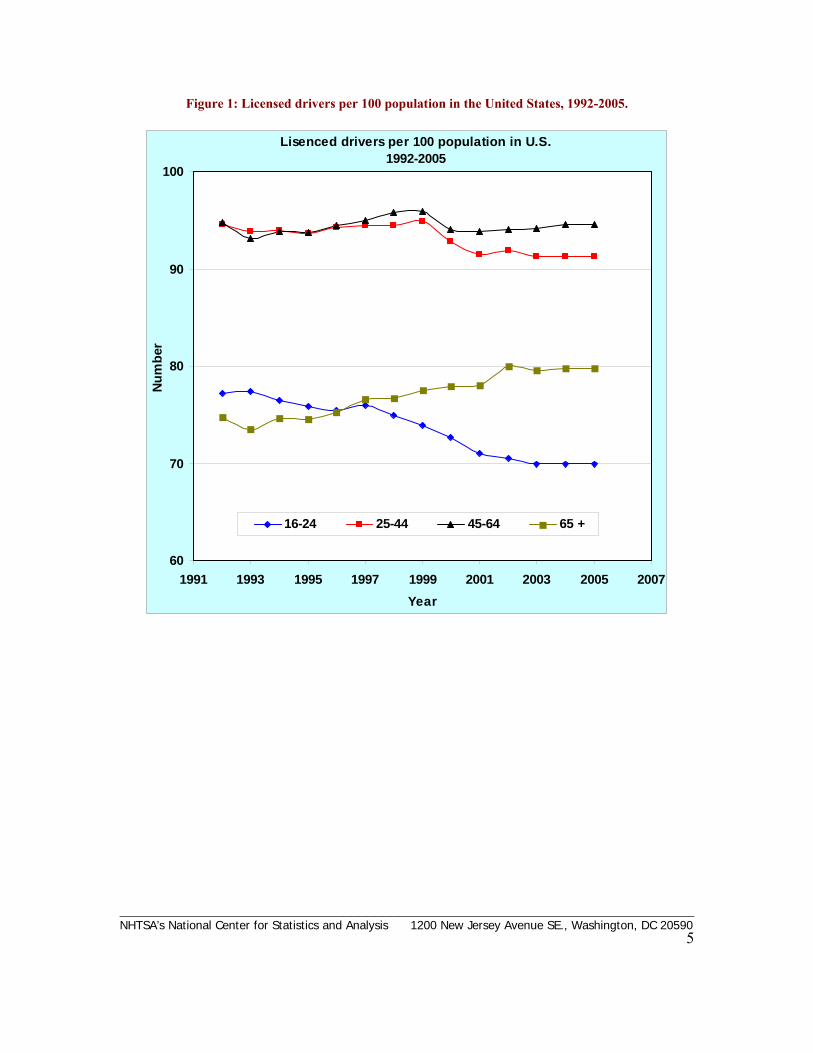
Older drivers have become a larger part of the driving population and will continue to do so as baby boomers reach retirement age. In Figure 1, the data of licensed drivers per 100 population by age groups for the period 1992-2005 are displayed.20 21 An overall upward trend of licensed drivers age 65 and older per 100 population is shown in the past in the United States, which is a completely different trend from the other three driver age groups.
† It is noted that restraint systems generally helps to reduce the level of injuries in a crash. ‡ Studies show that the older population group could withstand a chest load of 5,000 N while the younger population groups could withstand a chest load of 8,000 N. 12 13
________________________________________________________________________ NHTSA’s National Center for Statistics and Analysis 1200 New Jersey Avenue SE., Washington, DC 20590
5
Figure 1: Licensed drivers per 100 population in the United States, 1992-2005.
Lisenced drivers per 100 population in U.S.1992-2005
60
70
80
90
100
1991 1993 1995 1997 1999 2001 2003 2005 2007Year
Num
ber
16-24 25-44 45-64 65 +
________________________________________________________________________ NHTSA’s National Center for Statistics and Analysis 1200 New Jersey Avenue SE., Washington, DC 20590
6
2.2 Object of the Study
One fundamental area of traffic safety study, either by means of experiment or sources of real-world crash data, is to understand injury severity, injured body regions, and injury mechanisms (i.e., the injury contact sources), and hence to understand how to minimize driver injuries when vehicle crashes inevitably occur. These analyses have provided helpful information for vehicle design and crashworthiness standards development and evaluation programs to effectively protect occupants.7 8 14 22 23 The severity of injuries sustained by drivers involved in crashes is of considerable interest to policy makers and safety specialists.† In this study, the driver injury severity, injured body regions, and injury contact sources by driver age in real-world traffic crashes are examined in great detail. Specifically, since the injury pattern and injury mechanism of drivers in rollover vehicles are completely different from those in non-rollover vehicles in crashes, driver injuries were extensively studied by vehicle crash modes: rollover crashes versus non-rollover crashes. Furthermore, non-rollover crash vehicles were divided into four types by vehicle highest impact damage area (frontal, right-side, rear, and left-side). Difference in driver injury pattern by seat belt use and crash modes is also investigated in the study. Driver age was partitioned into four age groups: 16 to 24, 25 to 44, 45 to 64, and 65 and older (i.e., four groups of drivers including one younger group, two middle-aged groups, and one older driver group).24 Although different age groups of drivers are used in existing studies, “older driver” typically refers to drivers 65 and older.3 24 This analysis could better enable the identification of features associated with crash protection of drivers from such aspects as engineering, human factors, and clinical science. † Kockelman, K.M., and Kweon, Y.-J. (2002). Driver injury severity: an application of ordered probit models. Accident Analysis and Prevention, 34, 313.
________________________________________________________________________
NHTSA’s National Center for Statistics and Analysis 1200 New Jersey Avenue SE., Washington, DC 20590
7
3. Data and Methods
The primary database used in this study is the National Automotive Sampling System—Crashworthiness Data System (NASS-CDS), 1993-2004. NASS-CDS contains data on passenger vehicle crashes in which at least one vehicle was towed due to damage. In this study a vehicle had a rollover crash if the vehicle experienced a rollover event in a crash, regardless of the event sequence number. Otherwise, the vehicle had a non-rollover (planar) crash. Vehicle rollover could be further coded with the number of quarter-turns, end-over-end rollover, or rollover with details unknown in the NASS-CDS dataset. † ‡ The rollover crash is complicated by a lot of confounding factors. The injury pattern and injury mechanism of drivers in rollover crashes are completely different from the ones in non-rollover crashes. In this study, driver injuries by crash modes were extensively studied as follows: rollover crashes, and non-rollover crashes by vehicle highest impact damage area in crashes (frontal, right-side, rear, and left-side). Differences in driver injury pattern by seat belt use are also investigated in this study. Crashes with missing or unknown variables (e.g., crash modes, occupant type, and unknown vehicle damage area) were excluded from the study.
Driver injury severity in the crash was measured by the Maximum Abbreviated Injury Severity Score (MAIS)††: 0-not injured, 1-minor, 2-moderate, 3-serious, 4-severe, 5-critical, and 6-maximum (fatal). In this analysis, driver injury severity was separated into two groups: no injury to serious injury (MAIS ≤ 3) versus severe injury to fatal (MAIS ≥ 4).8 *
Frequency (percentage) tables in the following sections are all based on weighted estimates. Due to the complex nature of the NASS-CDS sample design, the standard errors, and the statistical methods used in this study, chi-square statistics (for assessing the difference in percentage distributions among groups) and logistic regression were implemented by the professional software for survey data analysis for multistage sample designs, SUDAAN, 8.0.1, developed by Research Triangle Institute (RTI). ** † In FARS and NASS-GES database, rollover is defined as any vehicle rotation of 90 degrees or more, about any true longitudinal or lateral axis, regardless of the event sequence (first or subsequent event) and whether tripped rollover (by curb, guardrail, ditch, soft soil, other and unknown mechanism) or untripped rollover. ‡ For a discussion of rollover crash and its severity measurements in NASS-CDS, one may see Digges, K., and Eigen, A. (2005). Severity Measurements for Rollover Crashes. Prague: IRCOBI, and references therein. †† 2000 NASS Injury Codeing Manual, NHTSA, U.S. DOT. *Another reason is that there exist two significantly different distributions of driver injured body regions between two groups of AIS (AIS ≤ 3 versus AIS ≥ 4, see Section 6). ** Sudaan User’s Manual, Research Triangle Institute, NC, 1997.
________________________________________________________________________ NHTSA’s National Center for Statistics and Analysis 1200 New Jersey Avenue SE., Washington, DC 20590
8
4.1 Driver Overall Injury Severity
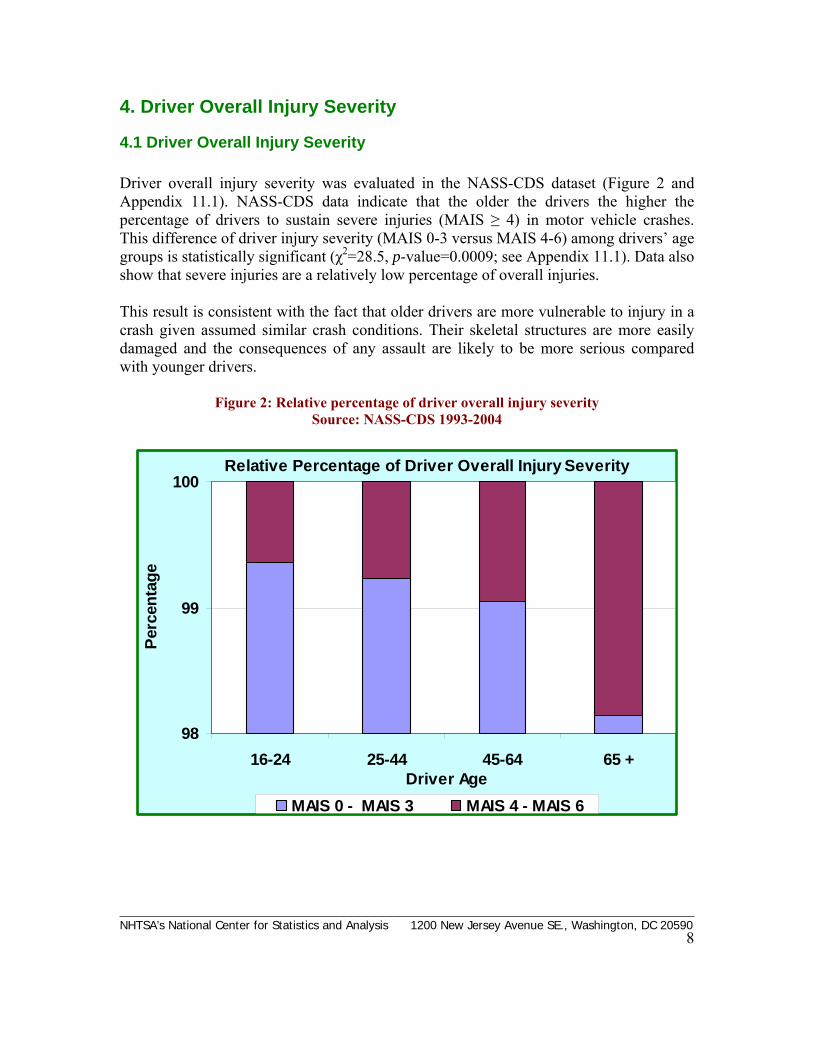
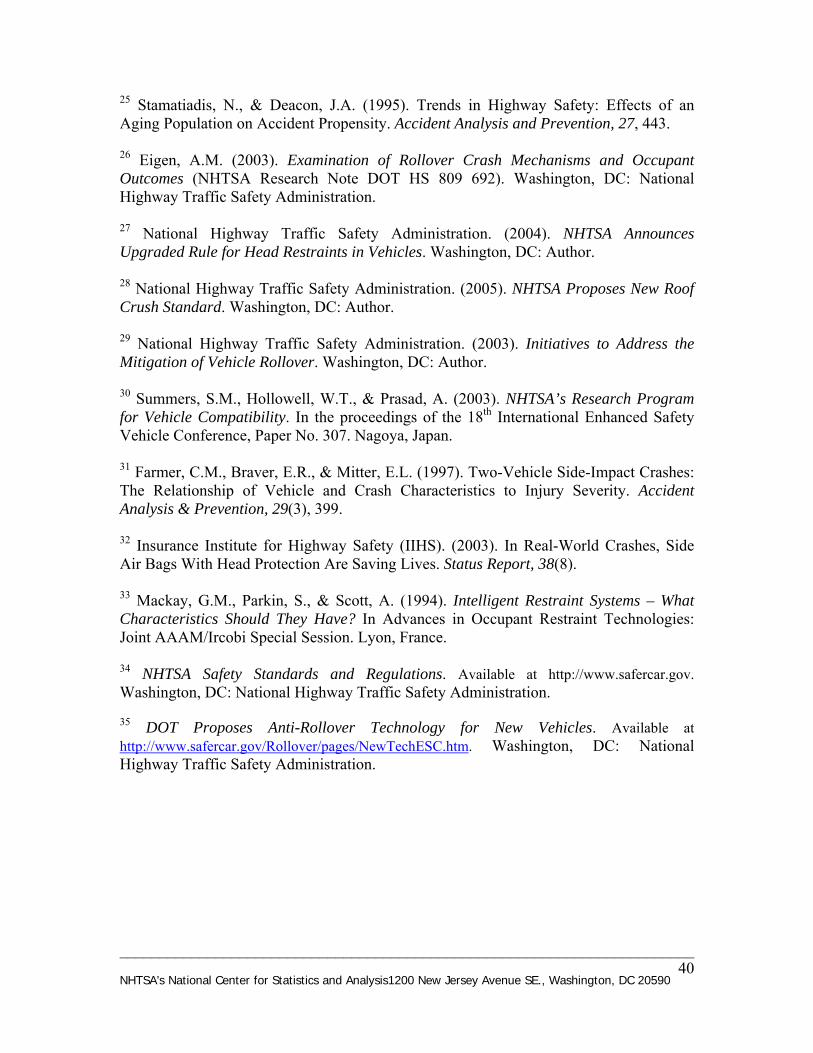
Driver overall injury severity was evaluated in the NASS-CDS dataset (Figure 2 and Appendix 11.1). NASS-CDS data indicate that the older the drivers the higher the percentage of drivers to sustain severe injuries (MAIS ≥ 4) in motor vehicle crashes. This difference of driver injury severity (MAIS 0-3 versus MAIS 4-6) among drivers’ age groups is statistically significant (χ2=28.5, p-value=0.0009; see Appendix 11.1). Data also show that severe injuries are a relatively low percentage of overall injuries. This result is consistent with the fact that older drivers are more vulnerable to injury in a crash given assumed similar crash conditions. Their skeletal structures are more easily damaged and the consequences of any assault are likely to be more serious compared with younger drivers.
Figure 2: Relative percentage of driver overall injury severity Source: NASS-CDS 1993-2004
4. Driver Overall Injury Severity
Relative Percentage of Driver Overall Injury Severity
98
99
100
16-24 25-44 45-64 65 +Driver Age
Perc
enta
ge
MAIS 0 - MAIS 3 MAIS 4 - MAIS 6
________________________________________________________________________ NHTSA’s National Center for Statistics and Analysis 1200 New Jersey Avenue SE., Washington, DC 20590
9
4.2 Driver Overall Injury Severity by Gender
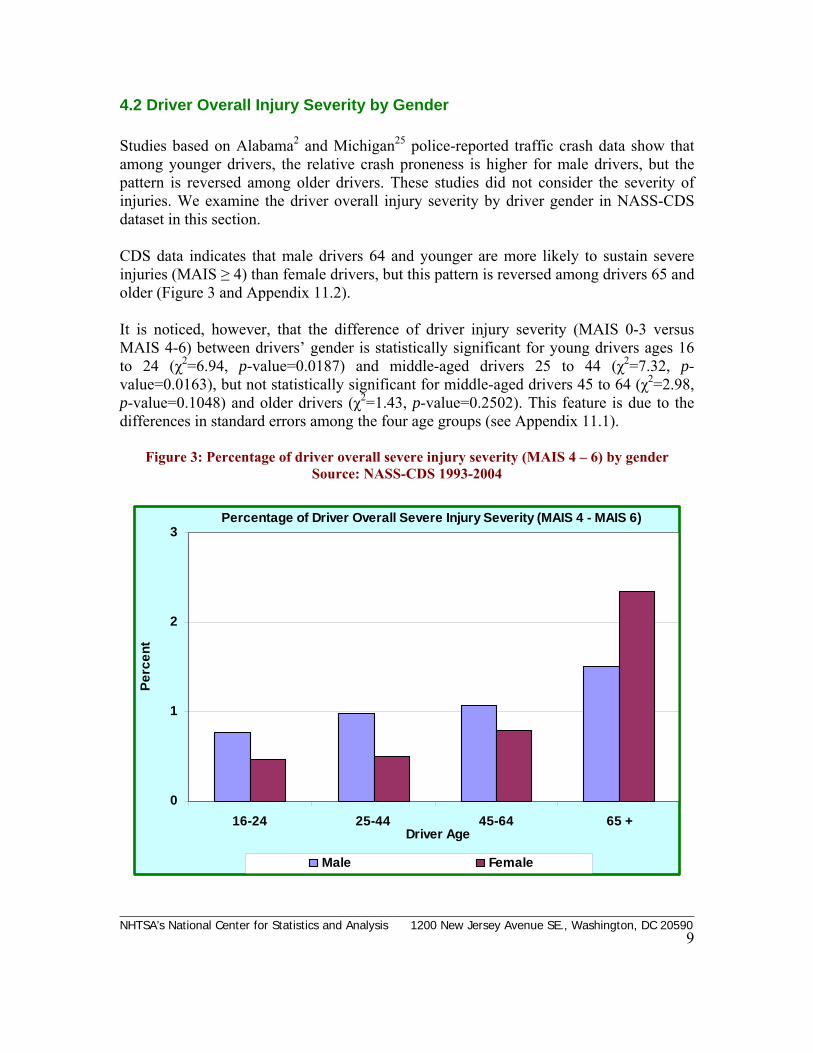
Studies based on Alabama2 and Michigan25 police-reported traffic crash data show that among younger drivers, the relative crash proneness is higher for male drivers, but the pattern is reversed among older drivers. These studies did not consider the severity of injuries. We examine the driver overall injury severity by driver gender in NASS-CDS dataset in this section. CDS data indicates that male drivers 64 and younger are more likely to sustain severe injuries (MAIS ≥ 4) than female drivers, but this pattern is reversed among drivers 65 and older (Figure 3 and Appendix 11.2). It is noticed, however, that the difference of driver injury severity (MAIS 0-3 versus MAIS 4-6) between drivers’ gender is statistically significant for young drivers ages 16 to 24 (χ2=6.94, p-value=0.0187) and middle-aged drivers 25 to 44 (χ2=7.32, p-value=0.0163), but not statistically significant for middle-aged drivers 45 to 64 (χ2=2.98, p-value=0.1048) and older drivers (χ2=1.43, p-value=0.2502). This feature is due to the differences in standard errors among the four age groups (see Appendix 11.1).
Figure 3: Percentage of driver overall severe injury severity (MAIS 4 – 6) by gender Source: NASS-CDS 1993-2004
Percentage of Driver Overall Severe Injury Severity (MAIS 4 - MAIS 6)
0
1
2
3
16-24 25-44 45-64 65 +Driver Age
Perc
ent
Male Female
________________________________________________________________________ NHTSA’s National Center for Statistics and Analysis 1200 New Jersey Avenue SE., Washington, DC 20590
10
5. Driver Injury Severity by Crash Modes
Injury pattern and injury mechanism of drivers in rollover crashes are completely different from those in non-rollover crashes; driver injuries by crash modes are extensively examined. Difference in driver injury pattern by seat belt use is also investigated in the study.
5.1 Driver Injury Severity in Rollover Crashes
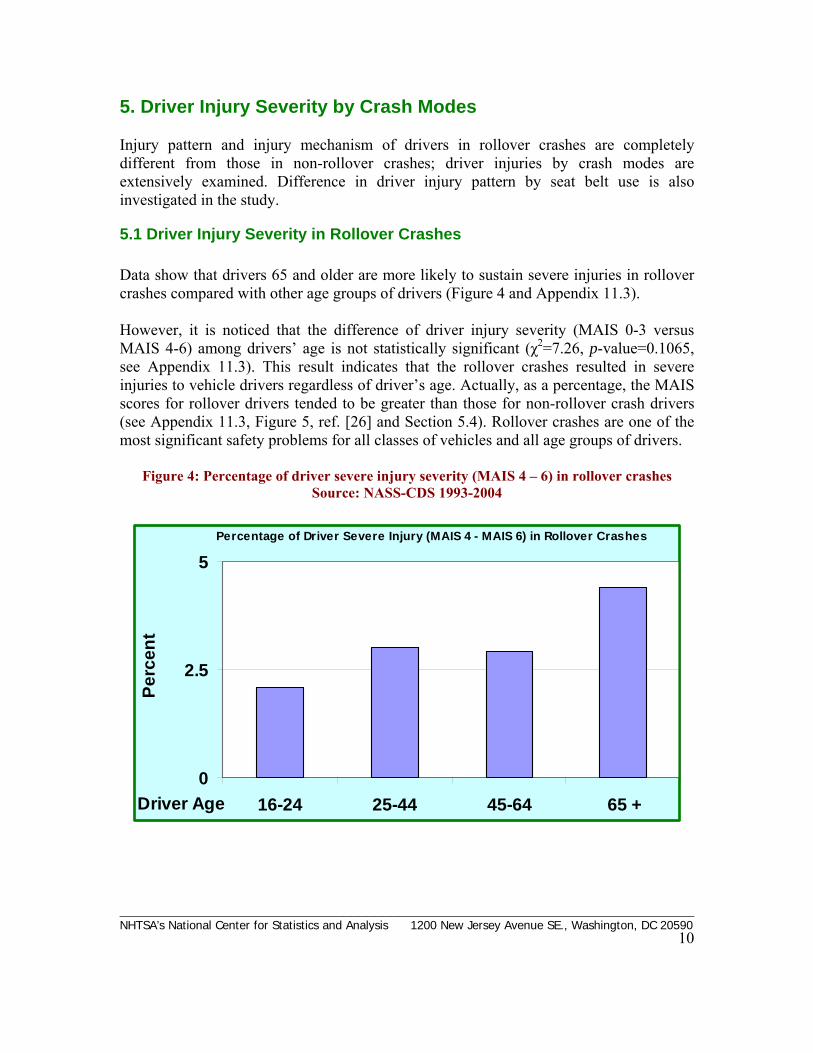
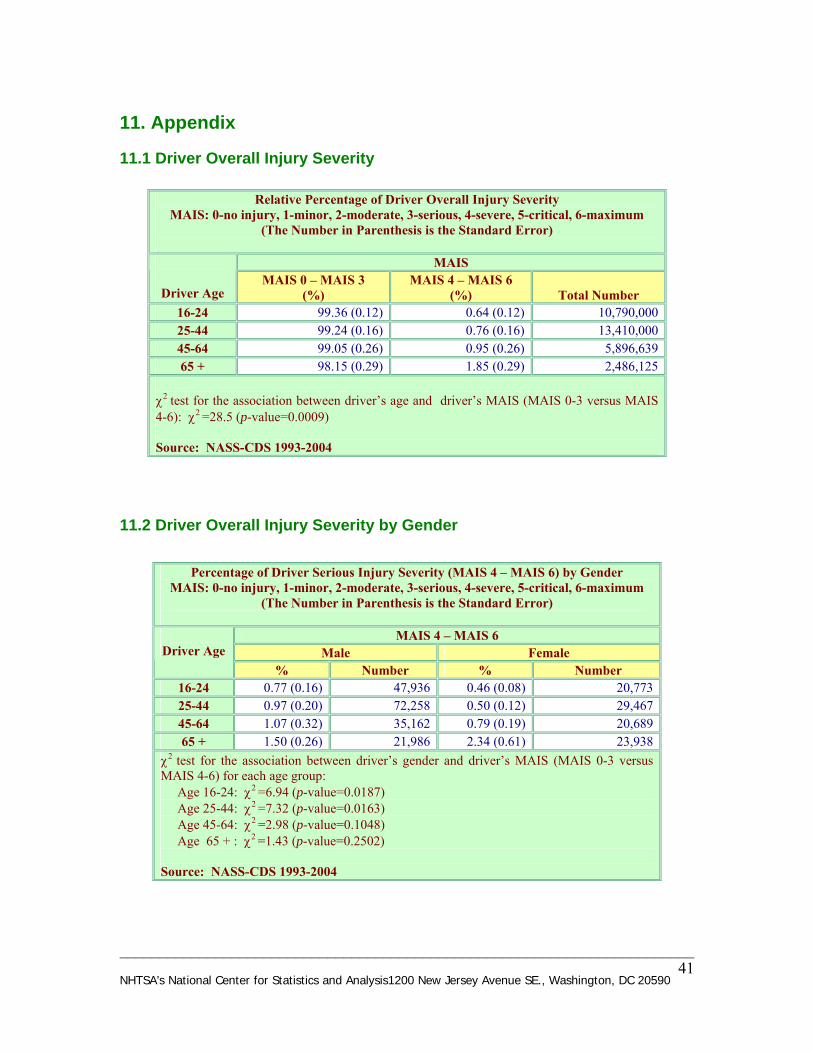
Data show that drivers 65 and older are more likely to sustain severe injuries in rollover crashes compared with other age groups of drivers (Figure 4 and Appendix 11.3). However, it is noticed that the difference of driver injury severity (MAIS 0-3 versus MAIS 4-6) among drivers’ age is not statistically significant (χ2=7.26, p-value=0.1065, see Appendix 11.3). This result indicates that the rollover crashes resulted in severe injuries to vehicle drivers regardless of driver’s age. Actually, as a percentage, the MAIS scores for rollover drivers tended to be greater than those for non-rollover crash drivers (see Appendix 11.3, Figure 5, ref. [26] and Section 5.4). Rollover crashes are one of the most significant safety problems for all classes of vehicles and all age groups of drivers.
Figure 4: Percentage of driver severe injury severity (MAIS 4 – 6) in rollover crashes Source: NASS-CDS 1993-2004
Percentage of Driver Severe Injury (MAIS 4 - MAIS 6) in Rollover Crashes
0
2.5
5
16-24 25-44 45-64 65 +Driver Age
Perc
ent
________________________________________________________________________ NHTSA’s National Center for Statistics and Analysis 1200 New Jersey Avenue SE., Washington, DC 20590
11
5.2 Driver Injury Severity in Non-Rollover Crashes
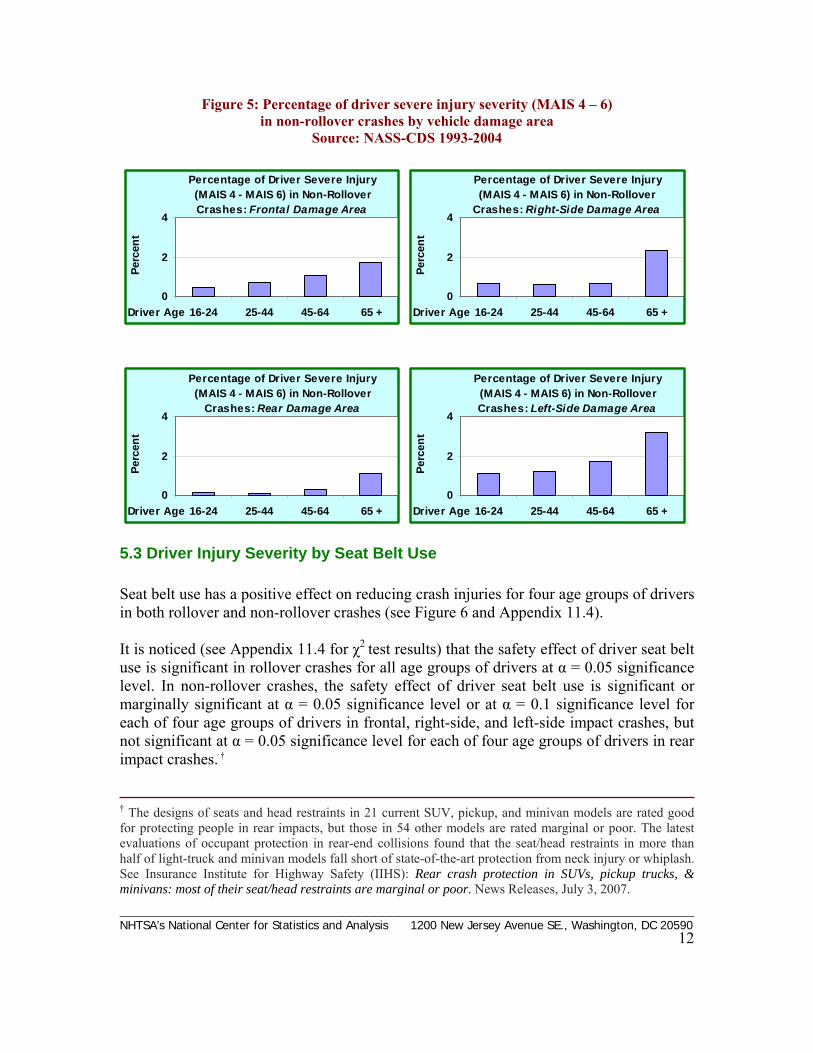
In this section, the driver injury severity in non-rollover (planar) crash by vehicle highest impact damage area (frontal, right-side, rear, and left-side) is studied (Figure 5 and Appendix 11.3). The older the drivers the higher the percentage of drivers to sustain severe injuries (MAIS ≥ 4) in frontal impact crashes. This difference of driver injury severity (MAIS 0-3 versus MAIS 4-6) among drivers’ age groups is statistically significant (χ2=15.9, p-value=0.0108, see Appendix 11.3) in frontal impact crashes. Drivers 65 and older are more likely to sustain severe injuries (MAIS ≥ 4) in right-side impact crashes. However, the difference of driver injury severity (MAIS 0-3 versus MAIS 4-6) among drivers’ age groups is not statistically significant (χ2=2.81, p-value=0.4476, see Appendix 11.3) in right-side impact crashes. This result may be due to the relatively wide space between the driver and the right-side impact area, which may help reduce impact injuries for all driver age groups. Older drivers are more likely to sustain severe injuries (MAIS ≥ 4) in rear-impact crashes. The difference of driver injury severity (MAIS 0-3 versus MAIS 4-6) among drivers’ age groups is not statistically significant at 0.05 significance level but is significant at 0.1 significance level (χ2=8.45, p-value=0.0748, see Appendix 11.3) in rear- impact crashes. The older the drivers the higher the percentage of drivers to sustain severe injuries (MAIS ≥ 4) in left-side impact crashes. This difference of driver injury severity (MAIS 0-3 versus MAIS 4-6) among drivers’ age groups is statistically significant (χ2=18.6, p-value=0.0060, see Appendix 11.3) in left-side impact crashes. There is a high percentage of drivers 65 and older to sustain severe injuries compared with other age groups of drivers in left-side impact crashes.
________________________________________________________________________
NHTSA’s National Center for Statistics and Analysis 1200 New Jersey Avenue SE., Washington, DC 20590
12
Figure 5: Percentage of driver severe injury severity (MAIS 4 – 6) in non-rollover crashes by vehicle damage area
Source: NASS-CDS 1993-2004
Percentage of Driver Severe Injury (MAIS 4 - MAIS 6) in Non-Rollover Crashes: Frontal Damage Area
0
2
4
16-24 25-44 45-64 65 +Driver Age
Perc
ent
Percentage of Driver Severe Injury (MAIS 4 - MAIS 6) in Non-Rollover
Crashes: Right-Side Damage Area
0
2
4
16-24 25-44 45-64 65 +Driver Age
Perc
ent
Percentage of Driver Severe Injury (MAIS 4 - MAIS 6) in Non-Rollover
Crashes: Rear Damage Area
0
2
4
16-24 25-44 45-64 65 +Driver Age
Perc
ent
Percentage of Driver Severe Injury (MAIS 4 - MAIS 6) in Non-Rollover Crashes: Left-Side Damage Area
0
2
4
16-24 25-44 45-64 65 +Driver Age
Perc
ent
5.3 Driver Injury Severity by Seat Belt Use
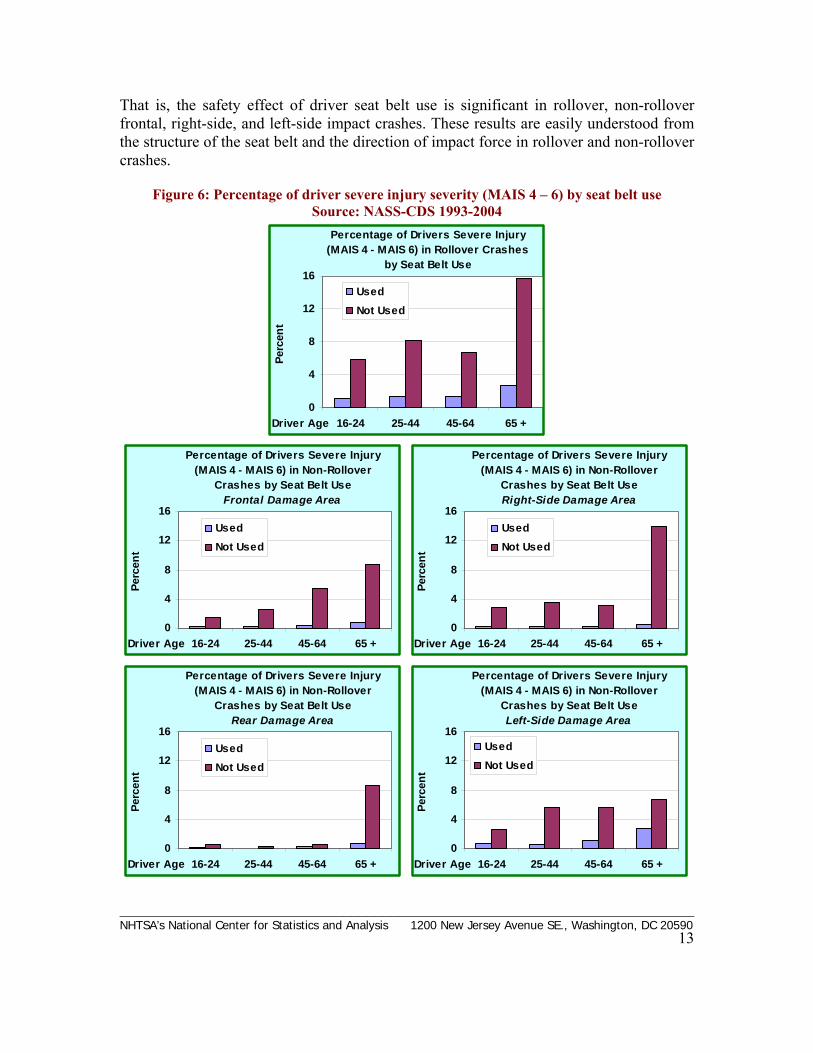
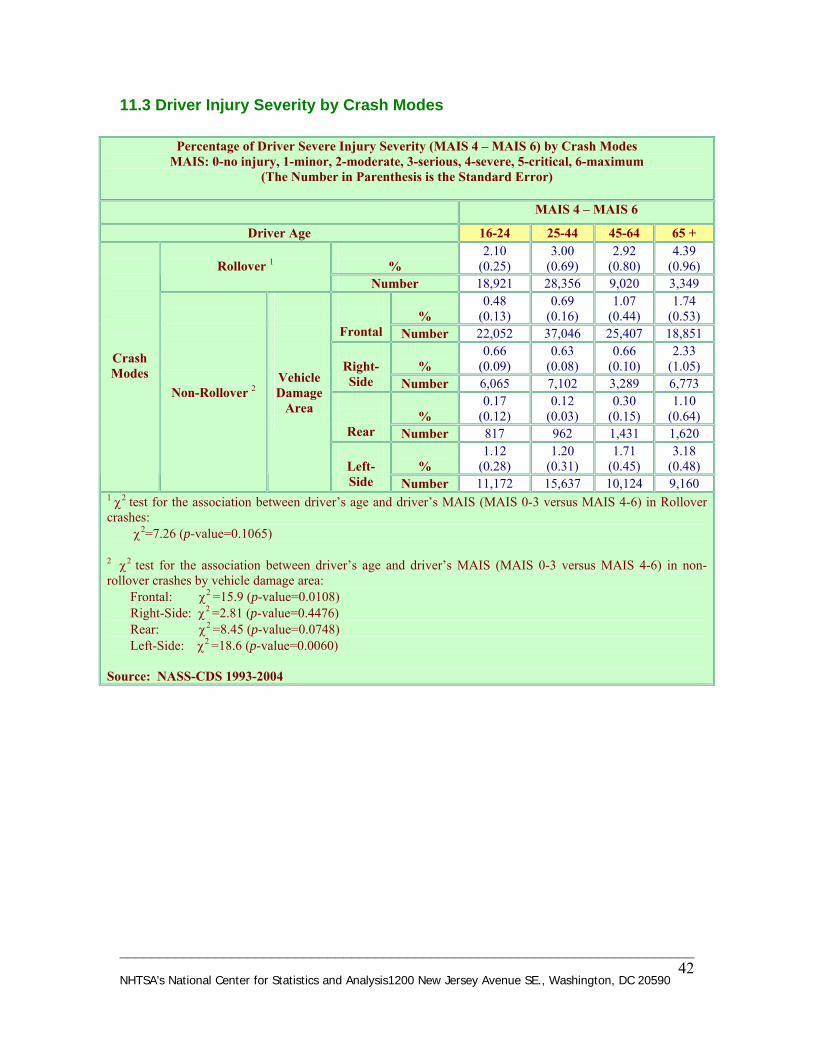
Seat belt use has a positive effect on reducing crash injuries for four age groups of drivers in both rollover and non-rollover crashes (see Figure 6 and Appendix 11.4). It is noticed (see Appendix 11.4 for χ2 test results) that the safety effect of driver seat belt use is significant in rollover crashes for all age groups of drivers at α = 0.05 significance level. In non-rollover crashes, the safety effect of driver seat belt use is significant or marginally significant at α = 0.05 significance level or at α = 0.1 significance level for each of four age groups of drivers in frontal, right-side, and left-side impact crashes, but not significant at α = 0.05 significance level for each of four age groups of drivers in rear impact crashes. † † The designs of seats and head restraints in 21 current SUV, pickup, and minivan models are rated good for protecting people in rear impacts, but those in 54 other models are rated marginal or poor. The latest evaluations of occupant protection in rear-end collisions found that the seat/head restraints in more than half of light-truck and minivan models fall short of state-of-the-art protection from neck injury or whiplash. See Insurance Institute for Highway Safety (IIHS): Rear crash protection in SUVs, pickup trucks, & minivans: most of their seat/head restraints are marginal or poor. News Releases, July 3, 2007.
________________________________________________________________________
NHTSA’s National Center for Statistics and Analysis 1200 New Jersey Avenue SE., Washington, DC 20590
13
Figure 6: Percentage of driver severe injury severity (MAIS 4 – 6) by seat belt use Source: NASS-CDS 1993-2004
That is, the safety effect of driver seat belt use is significant in rollover, non-rollover frontal, right-side, and left-side impact crashes. These results are easily understood from the structure of the seat belt and the direction of impact force in rollover and non-rollover crashes.
Percentage of Drivers Severe Injury (MAIS 4 - MAIS 6) in Rollover Crashes
by Seat Belt Use
0
4
8
12
16
16-24 25-44 45-64 65 +Driver Age
Perc
ent
UsedNot Used
Percentage of Drivers Severe Injury
(MAIS 4 - MAIS 6) in Non-Rollover Crashes by Seat Belt Use
Frontal Damage Area
0
4
8
12
16
16-24 25-44 45-64 65 +Driver Age
Perc
ent
UsedNot Used
Percentage of Drivers Severe Injury (MAIS 4 - MAIS 6) in Non-Rollover
Crashes by Seat Belt UseRight-Side Damage Area
0
4
8
12
16
16-24 25-44 45-64 65 +Driver Age
Perc
ent
UsedNot Used
Percentage of Drivers Severe Injury
(MAIS 4 - MAIS 6) in Non-Rollover Crashes by Seat Belt Use
Rear Damage Area
0
4
8
12
16
16-24 25-44 45-64 65 +Driver Age
Perc
ent
UsedNot Used
Percentage of Drivers Severe Injury (MAIS 4 - MAIS 6) in Non-Rollover
Crashes by Seat Belt UseLeft-Side Damage Area
0
4
8
12
16
16-24 25-44 45-64 65 +Driver Age
Perc
ent
UsedNot Used
________________________________________________________________________
NHTSA’s National Center for Statistics and Analysis 1200 New Jersey Avenue SE., Washington, DC 20590
14
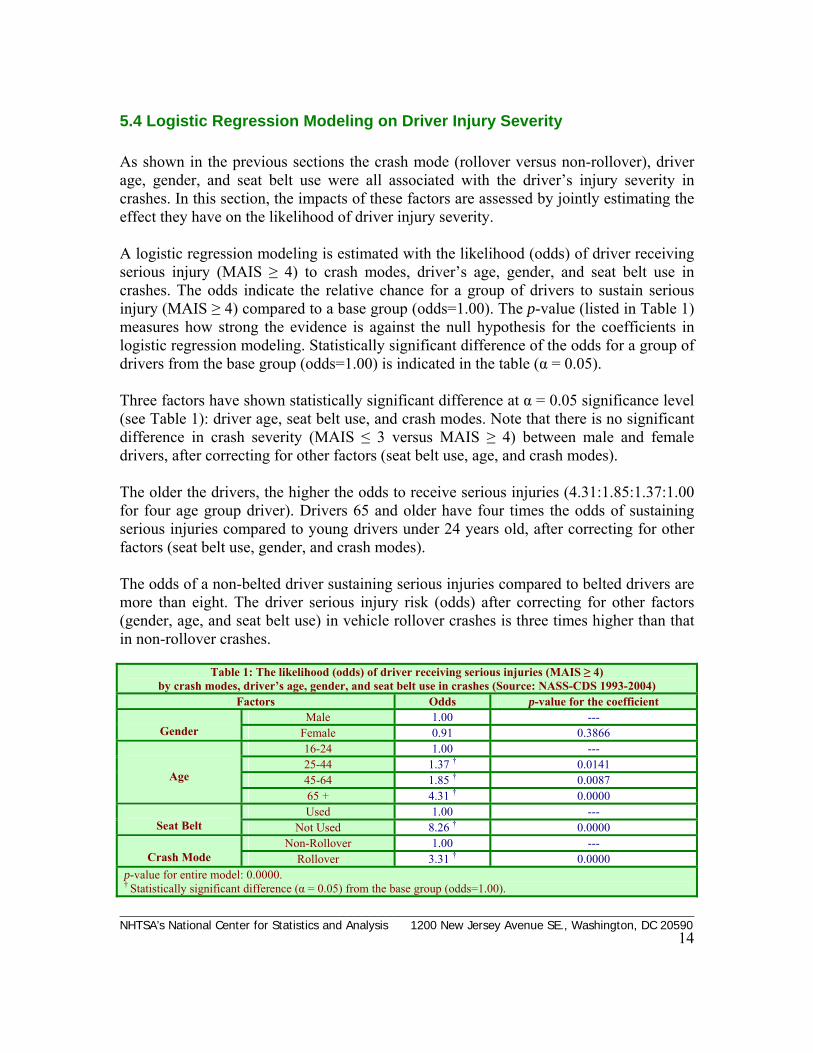
As shown in the previous sections the crash mode (rollover versus non-rollover), driver age, gender, and seat belt use were all associated with the driver’s injury severity in crashes. In this section, the impacts of these factors are assessed by jointly estimating the effect they have on the likelihood of driver injury severity. A logistic regression modeling is estimated with the likelihood (odds) of driver receiving serious injury (MAIS ≥ 4) to crash modes, driver’s age, gender, and seat belt use in crashes. The odds indicate the relative chance for a group of drivers to sustain serious injury (MAIS ≥ 4) compared to a base group (odds=1.00). The p-value (listed in Table 1) measures how strong the evidence is against the null hypothesis for the coefficients in logistic regression modeling. Statistically significant difference of the odds for a group of drivers from the base group (odds=1.00) is indicated in the table (α = 0.05). Three factors have shown statistically significant difference at α = 0.05 significance level (see Table 1): driver age, seat belt use, and crash modes. Note that there is no significant difference in crash severity (MAIS ≤ 3 versus MAIS ≥ 4) between male and female drivers, after correcting for other factors (seat belt use, age, and crash modes). The older the drivers, the higher the odds to receive serious injuries (4.31:1.85:1.37:1.00 for four age group driver). Drivers 65 and older have four times the odds of sustaining serious injuries compared to young drivers under 24 years old, after correcting for other factors (seat belt use, gender, and crash modes). The odds of a non-belted driver sustaining serious injuries compared to belted drivers are more than eight. The driver serious injury risk (odds) after correcting for other factors (gender, age, and seat belt use) in vehicle rollover crashes is three times higher than that in non-rollover crashes.
5.4 Logistic Regression Modeling on Driver Injury Severity
by Table 1: The likelihood (odds) of driver receiving serious injuries (MAIS ≥ 4)
crash modes, driver’s age, gender, and seat belt use in crashes (Source: NASS-CDS 1993-2004) Factors Odds p-value for the coefficient
Male 1.00 ---Gender Female 0.91 0.3866
16-24 1.00 --- 25-44 1.37 † 0.0141
Age 45-64 1.85 † 0.0087 65 + 4.31 † 0.0000
Used 1.00 ---Seat Belt Not Used 8.26 † 0.0000
Non-Rollover 1.00 ---Crash Mode Rollover 3.31 † 0.0000
p-value for entire model: 0.0000. † Statistically significant difference (α = 0.05) from the base group (odds=1.00).
________________________________________________________________________ NHTSA’s National Center for Statistics and Analysis 1200 New Jersey Avenue SE., Washington, DC 20590
15
The driver injured body regions and the driver major injury contact sources will be examined in this section and the next. In a crash, an injured driver might sustain multiple injuries in different body regions, and an AIS injury scale was recoded for each injured body region. All recorded body regions were included in the following analysis. †
6.1 Rollover Crashes
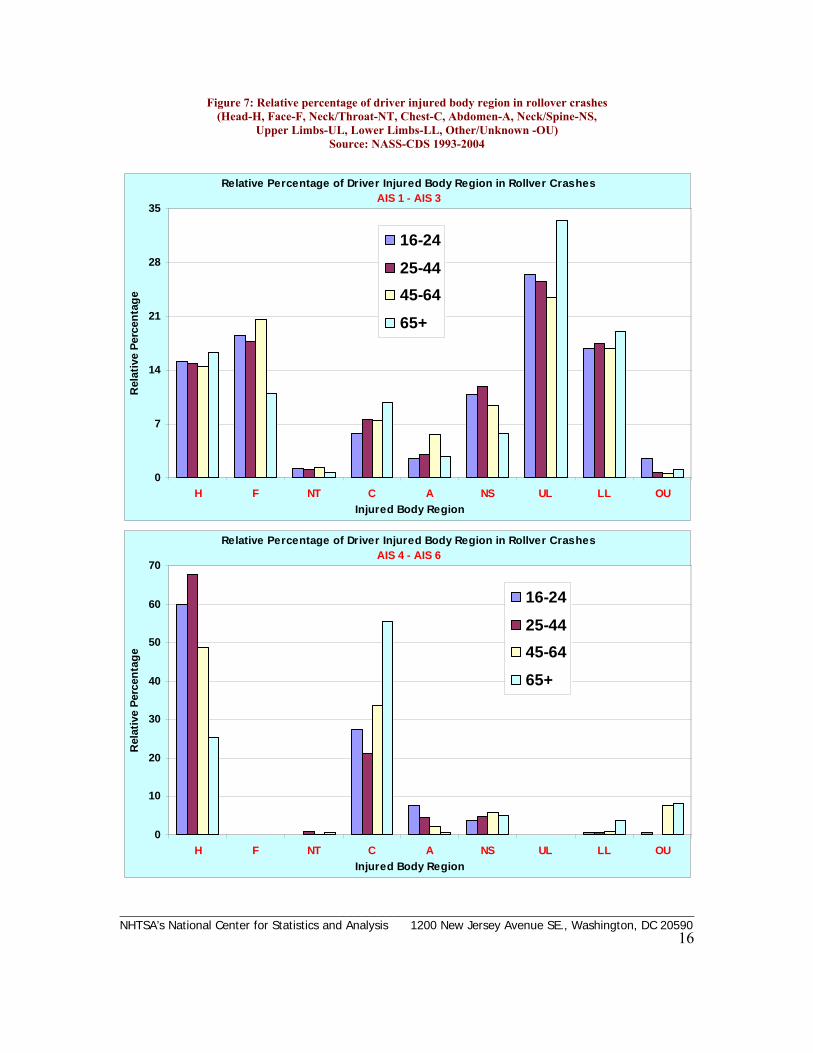
In rollover crashes, for minor to serious injuries (AIS ≤ 3), the pattern of driver injured body region is similar for the four age groups of drivers. The four highest percentages of injured body regions related to upper limbs (UL), lower limbs (LL), face (F), and head for all age groups of drivers. Upper limbs are the most-injured body regions in rollover crashes (Figure 7 and Appendix 11.5 (a)). For severe injuries to drivers (MAIS ≥ 4), the pattern of driver injured body region is also similar for the four age groups of drivers. The two highest percentages of injured body regions related to the head and chest (C), which are much higher than other injured body regions. Older drivers receive a large percentage of chest injuries in rollover crashes. For all age groups of drivers in rollover crashes, neck and throat (NT) is another injured body region (Figure 7 and Appendix 11.5 (a)).
† In this section and the next, the standard error of the estimate and the χ2 test are not provided in the calculations as the sample size is very small for some cells.
6. Driver Injured Body Region
________________________________________________________________________ NHTSA’s National Center for Statistics and Analysis 1200 New Jersey Avenue SE., Washington, DC 20590
16
Figure 7: Relative percentage of driver injured body region in rollover crashes (Head-H, Face-F, Neck/Throat-NT, Chest-C, Abdomen-A, Neck/Spine-NS,
Upper Limbs-UL, Lower Limbs-LL, Other/Unknown -OU) Source: NASS-CDS 1993-2004
Relative Percentage of Driver Injured Body Region in Rollver CrashesAIS 1 - AIS 3
0
7
14
21
28
35
H F NT C A NS UL LL OUInjured Body Region
Rel
ativ
e Pe
rcen
tage
16-2425-4445-6465+
Relative Percentage of Driver Injured Body Region in Rollver Crashes
AIS 4 - AIS 6
0
10
20
30
40
50
60
70
H F NT C A NS UL LL OUInjured Body Region
Rel
ativ
e Pe
rcen
tage
16-2425-4445-6465+
________________________________________________________________________ NHTSA’s National Center for Statistics and Analysis 1200 New Jersey Avenue SE., Washington, DC 20590
17
6.2 Non-Rollover Crashes
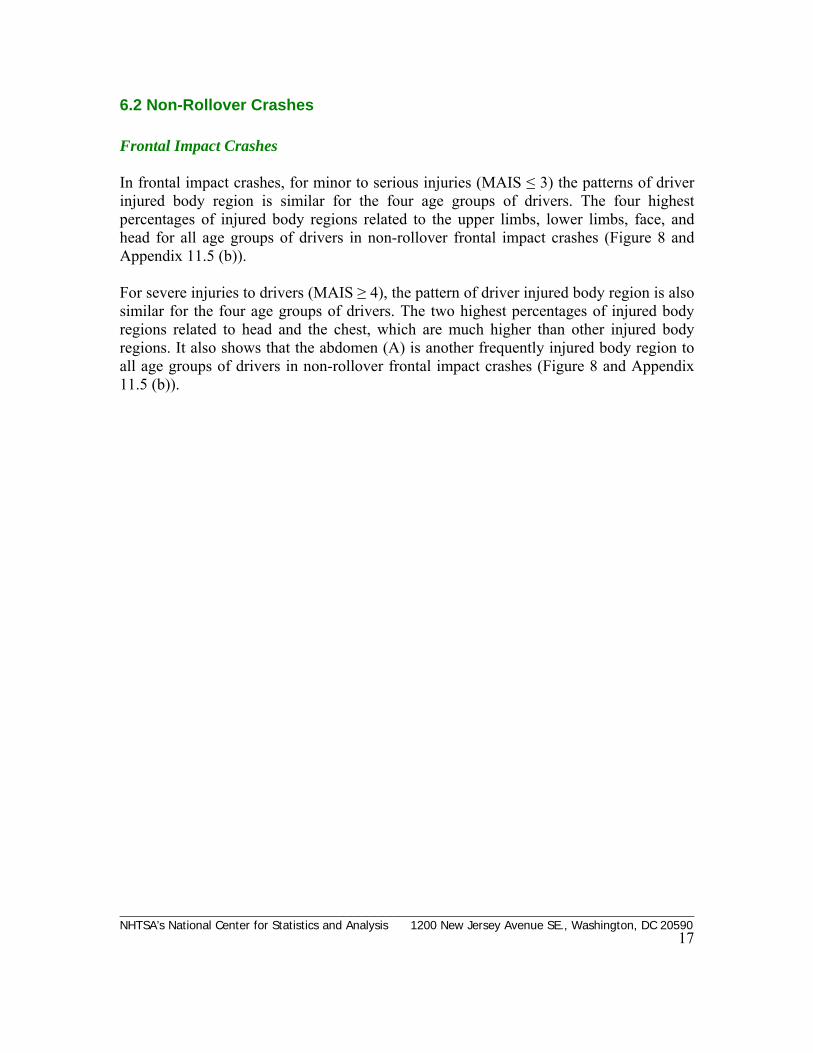
Frontal Impact Crashes In frontal impact crashes, for minor to serious injuries (MAIS ≤ 3) the patterns of driver injured body region is similar for the four age groups of drivers. The four highest percentages of injured body regions related to the upper limbs, lower limbs, face, and head for all age groups of drivers in non-rollover frontal impact crashes (Figure 8 and Appendix 11.5 (b)). For severe injuries to drivers (MAIS ≥ 4), the pattern of driver injured body region is also similar for the four age groups of drivers. The two highest percentages of injured body regions related to head and the chest, which are much higher than other injured body regions. It also shows that the abdomen (A) is another frequently injured body region to all age groups of drivers in non-rollover frontal impact crashes (Figure 8 and Appendix 11.5 (b)).
________________________________________________________________________ NHTSA’s National Center for Statistics and Analysis 1200 New Jersey Avenue SE., Washington, DC 20590
18
Figure 8: Relative percentage of driver injured body region in frontal impact crashes (Head-H, Face-F, Neck/Throat-NT, Chest-C, Abdomen-A, Neck/Spine-NS,
Upper Limbs-UL, Lower Limbs-LL, Other/Unknown -OU) Source: NASS-CDS 1993-2004
Relative Percentage of Driver Injured Body Region in Non-Rollver CrashesFrontal Damage Area / AIS 1 - AIS 3
0
7
14
21
28
35
H F NT C A NS UL LL OUInjured Body Region
Rel
ativ
e Pe
rcen
tage
16-2425-4445-6465+
Relative Percentage of Driver Injured Body Region in Non-Rollver Crashes
Frontal Damage Area / AIS 4 - AIS 6
0
20
40
60
H F NT C A NS UL LL OUInjured Body Region
Rel
ativ
e Pe
rcen
tage
16-2425-4445-6465+
________________________________________________________________________ NHTSA’s National Center for Statistics and Analysis 1200 New Jersey Avenue SE., Washington, DC 20590
19
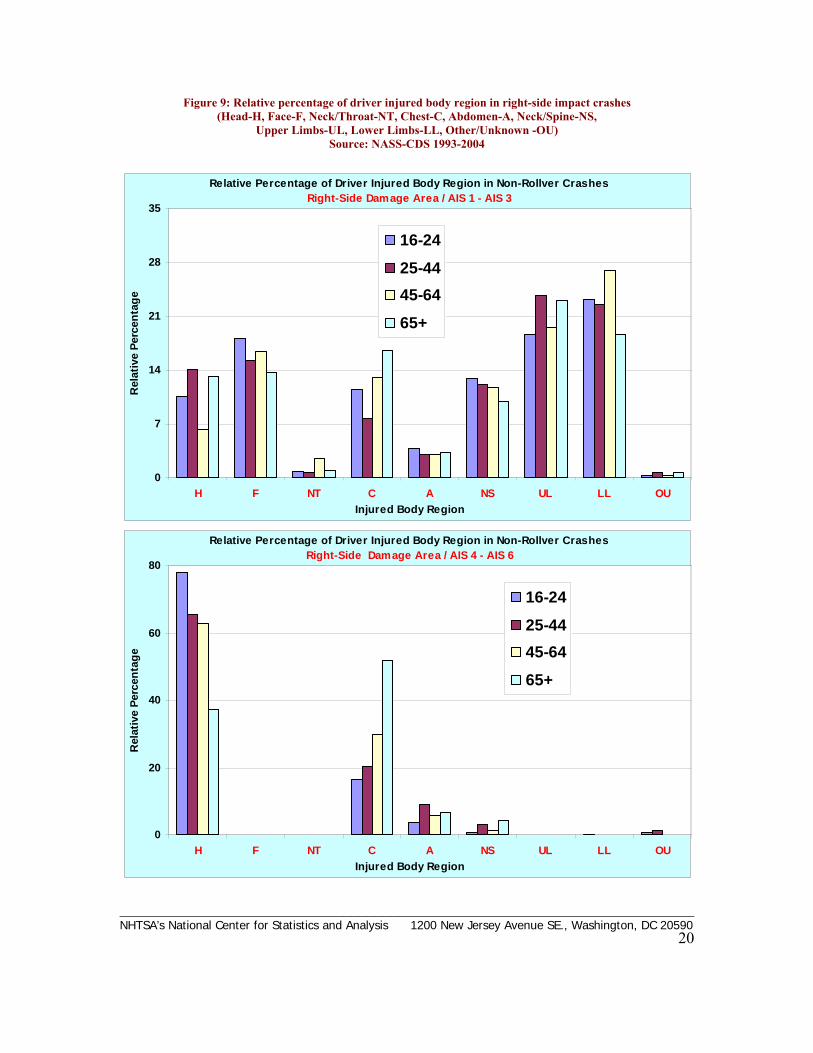
Right-Side Impact Crashes In right-side impact crashes, for minor to serious injuries (MAIS ≤ 3), the pattern of driver injured body region is similar for the four age groups of drivers. The three highest percentages of injured body regions related to the upper limbs, lower limbs, and face for all age groups of drivers in non-rollover right-side impact crashes (Figure 9 and Appendix 11.5 (c)). For severe injuries to drivers (MAIS ≥ 4), the pattern of driver injured body region is also similar for the four age groups of drivers. The two highest percentages of injured body regions related to head and the chest, which are much higher than other injured body regions. It also shows that the relative percentage of head injuries deceases as the driver age increases, but the chest injuries increases as the driver age increases in right-side impact crashes. For all age groups of drivers in non-rollover right-side impact crashes, abdomen and neck and spine are the other two injured body regions (Figure 9 and Appendix 11.5 (c)).
________________________________________________________________________
NHTSA’s National Center for Statistics and Analysis 1200 New Jersey Avenue SE., Washington, DC 20590
20
Figure 9: Relative percentage of driver injured body region in right-side impact crashes (Head-H, Face-F, Neck/Throat-NT, Chest-C, Abdomen-A, Neck/Spine-NS,
Upper Limbs-UL, Lower Limbs-LL, Other/Unknown -OU) Source: NASS-CDS 1993-2004
Relative Percentage of Driver Injured Body Region in Non-Rollver CrashesRight-Side Damage Area / AIS 1 - AIS 3
0
7
14
21
28
35
H F NT C A NS UL LL OUInjured Body Region
Rel
ativ
e Pe
rcen
tage
16-2425-4445-6465+
Relative Percentage of Driver Injured Body Region in Non-Rollver Crashes
Right-Side Damage Area / AIS 4 - AIS 6
0
20
40
60
80
H F NT C A NS UL LL OUInjured Body Region
Rel
ativ
e Pe
rcen
tage
16-2425-4445-6465+
________________________________________________________________________
NHTSA’s National Center for Statistics and Analysis 1200 New Jersey Avenue SE., Washington, DC 20590
21
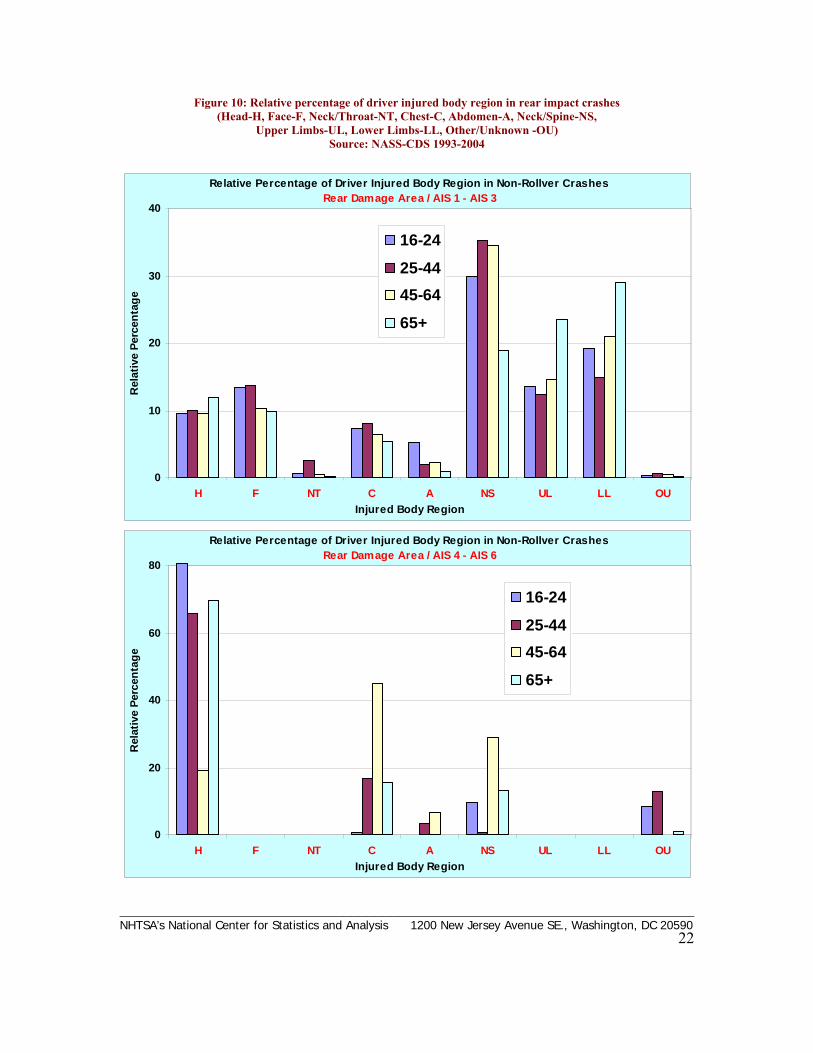
Rear-Impact Crashes In rear-impact crashes, for minor to serious injuries (MAIS ≤ 3), the pattern of driver injured body region are similar for the young and two middle-aged groups of drivers. The body region with the highest percentage of injury is the neck and spine. However, for older drivers, the body region with the highest percentage of injury is the lower limbs, followed by the upper limbs, and neck and spine in non-rollover rear-impact crashes (Figure 10 and Appendix 11.5 (d)). A high percentage of neck and spine injuries to all age groups of drivers related to the impact force the seat back support applied to the drivers. Whiplash injuries to drivers often occurred in rear-end impact crashes. For severe injuries to drivers (MAIS ≥ 4), the pattern of driver injured body region is a little different among the four age groups of drivers (Figure 10 and Appendix 11.5 (d)). This could be due to the relatively small sample size in this type of crash (for MAIS ≥ 4) in the CDS dataset. One significant feature is that drivers sustained a high percentage of head injuries in rear-impact crashes. Improving head restraints could reduce these whiplash injuries of drivers in rear-impact crashes.27
________________________________________________________________________
NHTSA’s National Center for Statistics and Analysis 1200 New Jersey Avenue SE., Washington, DC 20590
22
Figure 10: Relative percentage of driver injured body region in rear impact crashes (Head-H, Face-F, Neck/Throat-NT, Chest-C, Abdomen-A, Neck/Spine-NS,
Upper Limbs-UL, Lower Limbs-LL, Other/Unknown -OU) Source: NASS-CDS 1993-2004
Relative Percentage of Driver Injured Body Region in Non-Rollver CrashesRear Damage Area / AIS 1 - AIS 3
0
10
20
30
40
H F NT C A NS UL LL OUInjured Body Region
Rel
ativ
e Pe
rcen
tage
16-2425-4445-6465+
Relative Percentage of Driver Injured Body Region in Non-Rollver Crashes
Rear Damage Area / AIS 4 - AIS 6
0
20
40
60
80
H F NT C A NS UL LL OUInjured Body Region
Rel
ativ
e Pe
rcen
tage
16-2425-4445-6465+
________________________________________________________________________ NHTSA’s National Center for Statistics and Analysis 1200 New Jersey Avenue SE., Washington, DC 20590
23
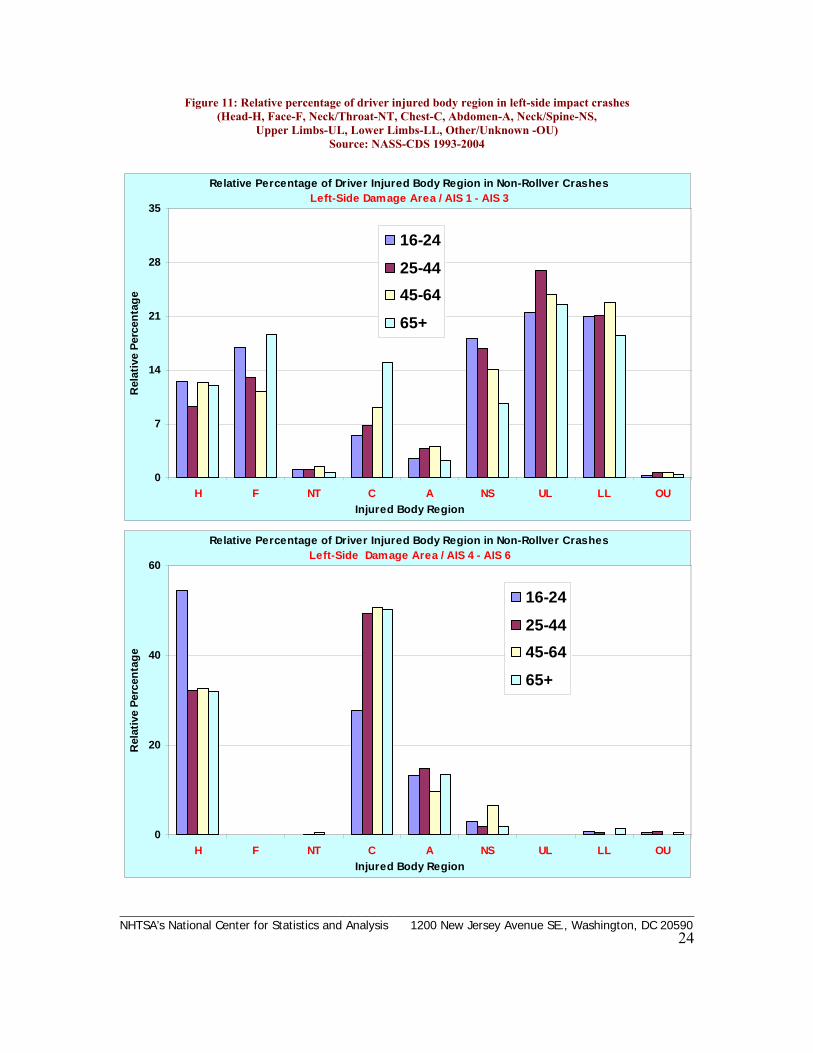
Left-Side-Impact Crashes In left-side-impact crashes, for minor to serious injuries (MAIS ≤ 3) the pattern of driver injured body region is similar between all age groups of drivers. The lower limbs, upper limbs, neck and spine, face, and head are frequently injured regions. The percentage of chest injuries increases as driver age increases (Figure 11 and Appendix 11.5 (e)). For severe injuries to drivers (MAIS ≥ 4), the pattern of driver injured body region is also similar for the four age groups of drivers. The two highest percentages of injured body regions related to the head and chest, which are much higher than other injured body regions. It also shows that the percentage of head injuries is higher for drivers ages 16 to 24, and the percentage of chest injuries is higher for the two middle-aged groups and the older drivers. The abdomen is another injured body region for all age groups of drivers in non-rollover left-side-impact crashes (Figure 11 and Appendix 11.5 (e)).
________________________________________________________________________ NHTSA’s National Center for Statistics and Analysis 1200 New Jersey Avenue SE., Washington, DC 20590
24
Figure 11: Relative percentage of driver injured body region in left-side impact crashes (Head-H, Face-F, Neck/Throat-NT, Chest-C, Abdomen-A, Neck/Spine-NS,
Upper Limbs-UL, Lower Limbs-LL, Other/Unknown -OU) Source: NASS-CDS 1993-2004
Relative Percentage of Driver Injured Body Region in Non-Rollver CrashesLeft-Side Damage Area / AIS 1 - AIS 3
0
7
14
21
28
35
H F NT C A NS UL LL OUInjured Body Region
Rel
ativ
e Pe
rcen
tage
16-2425-4445-6465+
Relative Percentage of Driver Injured Body Region in Non-Rollver Crashes
Left-Side Damage Area / AIS 4 - AIS 6
0
20
40
60
H F NT C A NS UL LL OUInjured Body Region
Rel
ativ
e Pe
rcen
tage
16-2425-4445-6465+
________________________________________________________________________ NHTSA’s National Center for Statistics and Analysis 1200 New Jersey Avenue SE., Washington, DC 20590
25
7. Driver Injury Contact Sources
In this section, we examine the major suspected injury contact sources to injured drivers across the four age groups and two crash modes (rollover and non-rollover frontal, right-side, rear- and left-side impact crashes), regardless of injured body regions and injury severity.† This analysis could enable the identification of the most frequent injury contact sources of the drivers’ injuries resulting from motor vehicle crashes.
7.1 Rollover Crashes
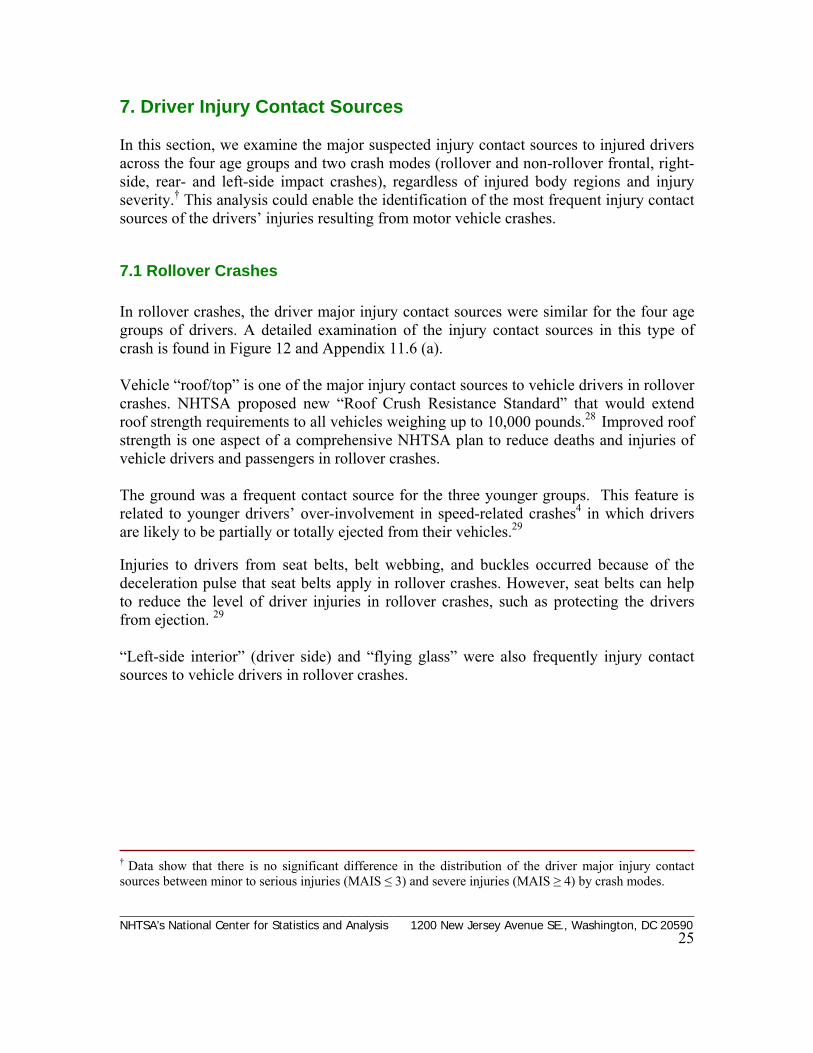
In rollover crashes, the driver major injury contact sources were similar for the four age groups of drivers. A detailed examination of the injury contact sources in this type of crash is found in Figure 12 and Appendix 11.6 (a). Vehicle “roof/top” is one of the major injury contact sources to vehicle drivers in rollover crashes. NHTSA proposed new “Roof Crush Resistance Standard” that would extend roof strength requirements to all vehicles weighing up to 10,000 pounds.28 Improved roof strength is one aspect of a comprehensive NHTSA plan to reduce deaths and injuries of vehicle drivers and passengers in rollover crashes. The ground was a frequent contact source for the three younger groups. This feature is related to younger drivers’ over-involvement in speed-related crashes4 in which drivers are likely to be partially or totally ejected from their vehicles.29 Injuries to drivers from seat belts, belt webbing, and buckles occurred because of the deceleration pulse that seat belts apply in rollover crashes. However, seat belts can help to reduce the level of driver injuries in rollover crashes, such as protecting the drivers from ejection. 29 “Left-side interior” (driver side) and “flying glass” were also frequently injury contact sources to vehicle drivers in rollover crashes. † Data show that there is no significant difference in the distribution of the driver major injury contact sources between minor to serious injuries (MAIS ≤ 3) and severe injuries (MAIS ≥ 4) by crash modes.
________________________________________________________________________ NHTSA’s National Center for Statistics and Analysis1200 New Jersey Avenue SE., Washington, DC 20590
26
Figure 12: The highest percentage of driver injury contact sources in rollover crashes Source: NASS-CDS 1995-2004
Highest Percentages of Injury Contact Sources to Injured Driver in Rollover Crashes
0
5
10
15
Roof/TopGround
Flying Glass
Belt Webbing&Buckles
Left-Side Interior
Injury Contact Sources
Perc
enta
ge
Age 16-24
Highest Percentages of Injury Contact Sources to Injured Driver in Rollover Crashes
0
5
10
15
Roof/TopGround
Belt Webbing&BucklesFlying Glass
Left Instrument Panel
Injury Contact Sources
Perc
enta
ge
Age 25-44
Highest Percentages of Injury Contact Sources to Injured Driver in Rollover Crashes
0
5
10
15
Belt Webbing&BucklesRoof/Top
Flying Glass
Steering Wheel RimGround
Injury Contact Sources
Perc
enta
ge
Age 45-64
Highest Percentages of Injury Contact Sources to Injured Driver in Rollover Crashes
0
5
10
15
Left-Side Interior
Flying GlassRoof/Top
Belt Webbing&Buckles
Steering Wheel Rim
Injury Contact Sources
Perc
enta
ge
Age 65 +
________________________________________________________________________ NHTSA’s National Center for Statistics and Analysis1200 New Jersey Avenue SE., Washington, DC 20590
27
7.2 Non-Rollover Crashes
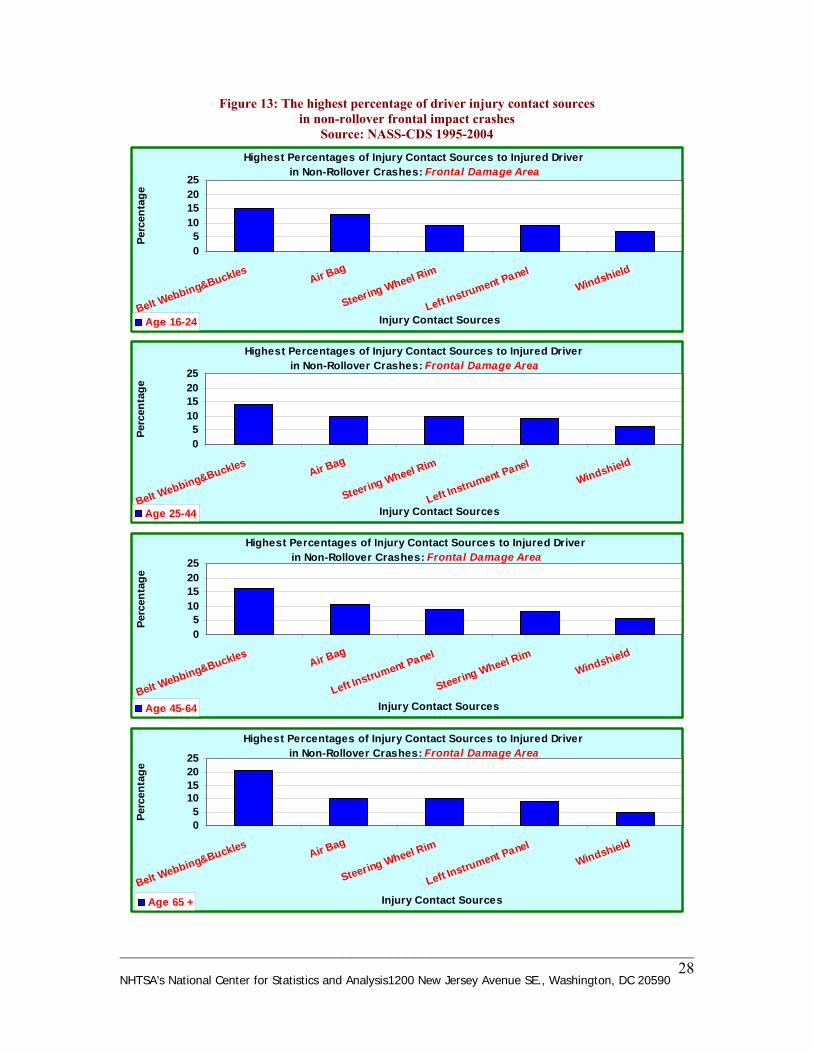
Frontal Impact Crashes In non-rollover frontal impact crashes, the distribution of major injury contact sources was similar across the four age groups of drivers: belt webbing and buckles, air bag, steering wheel rim, left instrument panel, and windshield (Figure 13 and Appendix 11.6 (b)). Injuries from vehicle restraint systems (belt webbing and buckles and air bags) occurred because of the deceleration pulse the restraint systems apply in frontal impact crashes (restraint systems generally help to reduce the level of injuries in a crash). For these injuries, the injured body regions were frequently the chest, face, and upper limbs. The steering wheel rim, left instrument panel (driver side), and windshield were frequently injury contact sources to vehicle drivers. These sources of injury are linked with the direction of impact force and principle of dynamics in non-rollover frontal impact crashes.
________________________________________________________________________
NHTSA’s National Center for Statistics and Analysis1200 New Jersey Avenue SE., Washington, DC 20590 28
Figure 13: The highest percentage of driver injury contact sources in non-rollover frontal impact crashes
Source: NASS-CDS 1995-2004
Highest Percentages of Injury Contact Sources to Injured Driver in Non-Rollover Crashes: Frontal Damage Area
05
10152025
Belt Webbing&BucklesAir Bag
Steering Wheel Rim
Left Instrument PanelWindshield
Injury Contact Sources
Perc
enta
ge
Age 16-24
Highest Percentages of Injury Contact Sources to Injured Driver in Non-Rollover Crashes: Frontal Damage Area
05
10152025
Belt Webbing&BucklesAir Bag
Steering Wheel Rim
Left Instrument PanelWindshield
Injury Contact Sources
Perc
enta
ge
Age 25-44
Highest Percentages of Injury Contact Sources to Injured Driver in Non-Rollover Crashes: Frontal Damage Area
05
10152025
Belt Webbing&BucklesAir Bag
Left Instrument Panel
Steering Wheel RimWindshield
Injury Contact Sources
Perc
enta
ge
Age 45-64
Highest Percentages of Injury Contact Sources to Injured Driver in Non-Rollover Crashes: Frontal Damage Area
05
10152025
Belt Webbing&BucklesAir Bag
Steering Wheel Rim
Left Instrument PanelWindshield
Injury Contact Sources
Perc
enta
ge
Age 65 +
________________________________________________________________________ NHTSA’s National Center for Statistics and Analysis1200 New Jersey Avenue SE., Washington, DC 20590
29
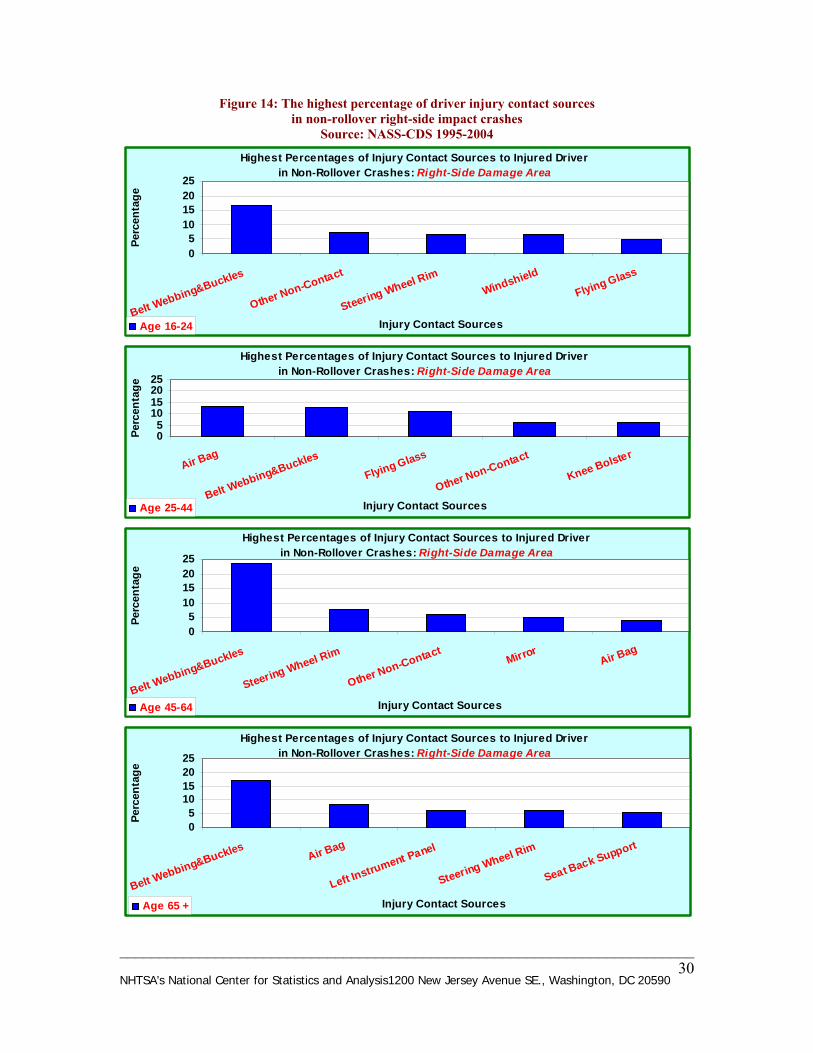
Right-Side-Impact Crashes In non-rollover right-side-impact crashes, the driver major injury contact sources were slightly different among the four age groups of drivers. The most common source was the belt webbing and buckles (Figure 14 and Appendix 11.6 (b)). Again, although this is a seat belt use-related injury (because of the deceleration pulse the seat belt applies to the driver), seat belt use has reduced the level of driver injuries. Other non-contact injury sources, excluding fire in vehicle, flying glass, air bag exhausted gas, etc., (e.g. the flying objects inside the car), are major injury contact sources to the young and two middle-aged groups of drivers but not to the older drivers in right-side-impact crashes. The reason for this is not immediately clear but possible explanations include differences among the four age groups of drivers in travel speed, object struck, and other such factors that were not considered in detail for this particular study.
________________________________________________________________________ NHTSA’s National Center for Statistics and Analysis1200 New Jersey Avenue SE., Washington, DC 20590
30
Figure 14: The highest percentage of driver injury contact sources in non-rollover right-side impact crashes
Source: NASS-CDS 1995-2004
Highest Percentages of Injury Contact Sources to Injured Driver in Non-Rollover Crashes: Right-Side Damage Area
05
10152025
Belt Webbing&Buckles
Other Non-Contact
Steering Wheel RimWindshield
Flying Glass
Injury Contact Sources
Perc
enta
ge
Age 16-24
Highest Percentages of Injury Contact Sources to Injured Driver in Non-Rollover Crashes: Right-Side Damage Area
05
10152025
Air Bag
Belt Webbing&BucklesFlying Glass
Other Non-Contact
Knee Bolster
Injury Contact Sources
Perc
enta
ge
Age 25-44
Highest Percentages of Injury Contact Sources to Injured Driver in Non-Rollover Crashes: Right-Side Damage Area
05
10152025
Belt Webbing&Buckles
Steering Wheel Rim
Other Non-ContactMirror
Air Bag
Injury Contact Sources
Perc
enta
ge
Age 45-64
Highest Percentages of Injury Contact Sources to Injured Driver in Non-Rollover Crashes: Right-Side Damage Area
05
10152025
Belt Webbing&BucklesAir Bag
Left Instrument Panel
Steering Wheel Rim
Seat Back Support
Injury Contact Sources
Perc
enta
ge
Age 65 +
________________________________________________________________________ NHTSA’s National Center for Statistics and Analysis1200 New Jersey Avenue SE., Washington, DC 20590
31
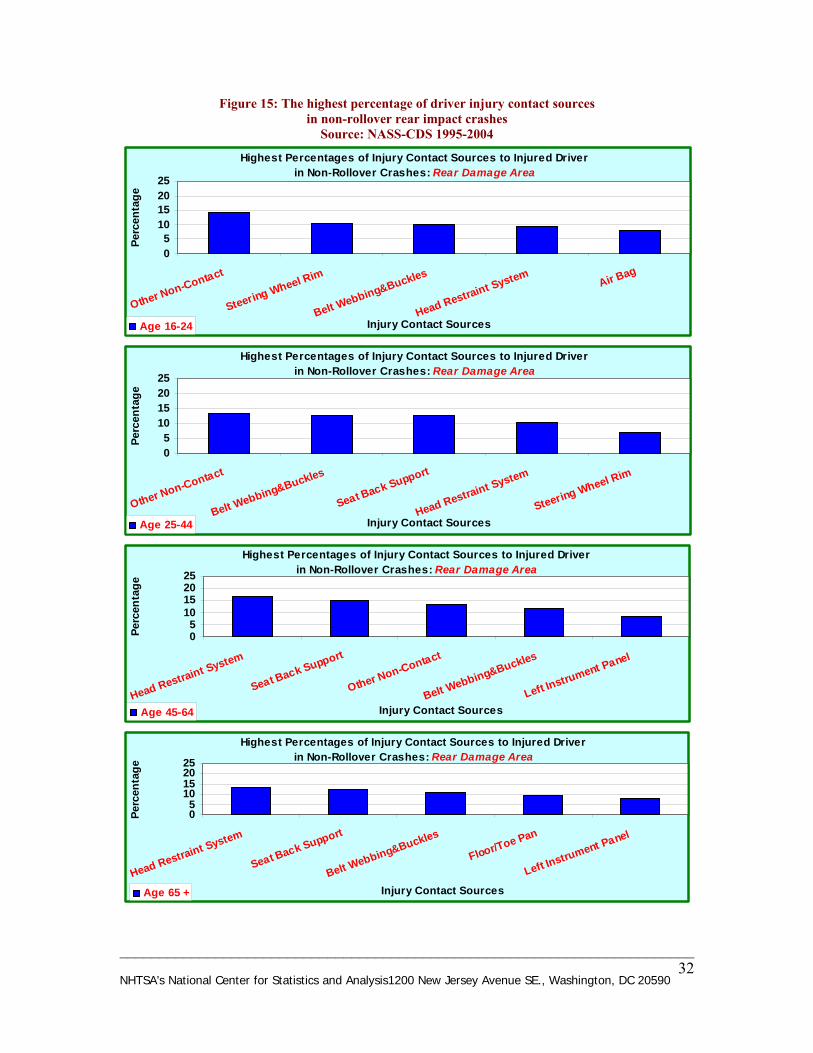
Rear-Impact Crashes In non-rollover rear-impact crashes, the driver major injury contact sources were slightly different among the four age groups of drivers. A common source is the head restraint system (Figure 15 and Appendix 11.6 (b)). This is easily understood from the position of head restraint system and the direction of impact force in non-rollover rear-impact crashes. It can be seen that improved head restraints could further reduce this whiplash injury of drivers in rear-impact crashes.27 Other restraint-related systems (belt webbing and buckles, or air bags), and seat back support are also major injury contact sources for different age groups of drivers. Due to “other non-contact,” excluding fire in vehicle, flying glass, air bag exhausted gas, etc. (e.g. the flying objects inside the car), we see the possible importance of fastening down the free items inside the car when traveling.
________________________________________________________________________ NHTSA’s National Center for Statistics and Analysis1200 New Jersey Avenue SE., Washington, DC 20590
32
Figure 15: The highest percentage of driver injury contact sources in non-rollover rear impact crashes
Source: NASS-CDS 1995-2004
Highest Percentages of Injury Contact Sources to Injured Driver in Non-Rollover Crashes: Rear Damage Area
05
10152025
Other Non-Contact
Steering Wheel Rim
Belt Webbing&Buckles
Head Restraint System Air Bag
Injury Contact Sources
Perc
enta
ge
Age 16-24 Highest Percentages of Injury Contact Sources to Injured Driver
in Non-Rollover Crashes: Rear Damage Area
05
10152025
Other Non-Contact
Belt Webbing&Buckles
Seat Back Support
Head Restraint System
Steering Wheel Rim
Injury Contact Sources
Perc
enta
ge
Age 25-44
Highest Percentages of Injury Contact Sources to Injured Driver in Non-Rollover Crashes: Rear Damage Area
05
10152025
Head Restraint System
Seat Back Support
Other Non-Contact
Belt Webbing&Buckles
Left Instrument Panel
Injury Contact Sources
Perc
enta
ge
Age 45-64
Highest Percentages of Injury Contact Sources to Injured Driver in Non-Rollover Crashes: Rear Damage Area
05
10152025
Head Restraint System
Seat Back Support
Belt Webbing&Buckles
Floor/Toe Pan
Left Instrument Panel
Injury Contact Sources
Perc
enta
ge
Age 65 +
________________________________________________________________________ NHTSA’s National Center for Statistics and Analysis1200 New Jersey Avenue SE., Washington, DC 20590
33
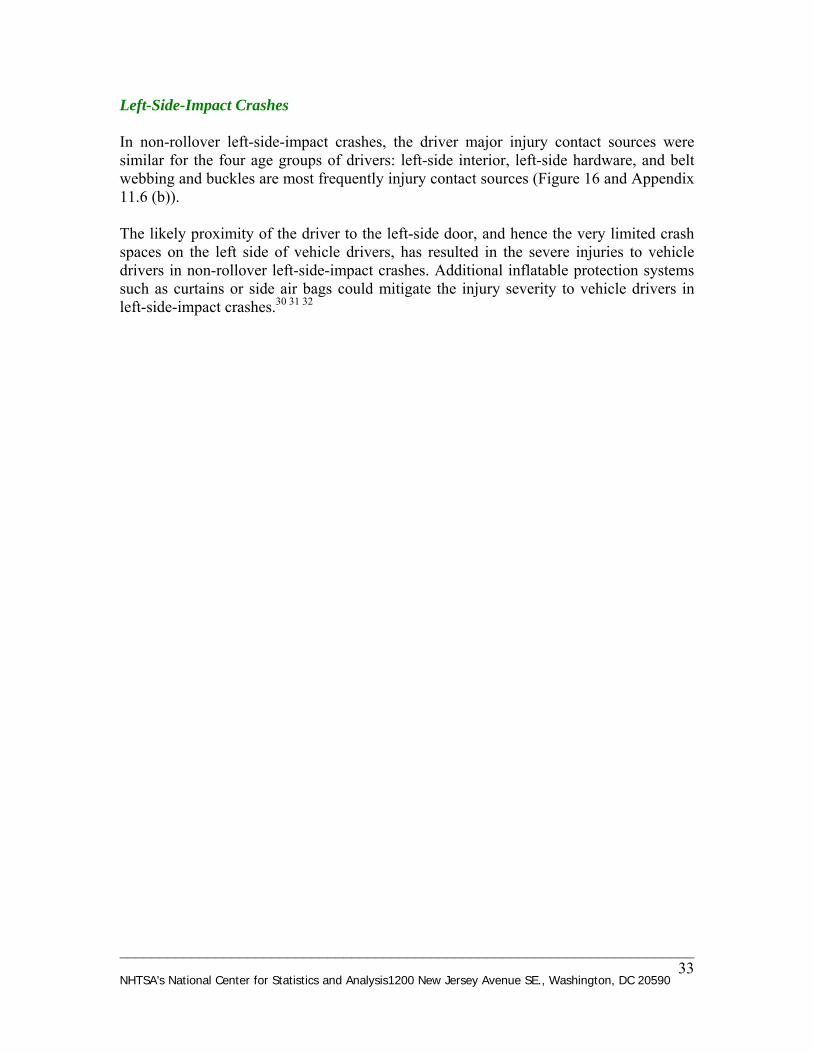
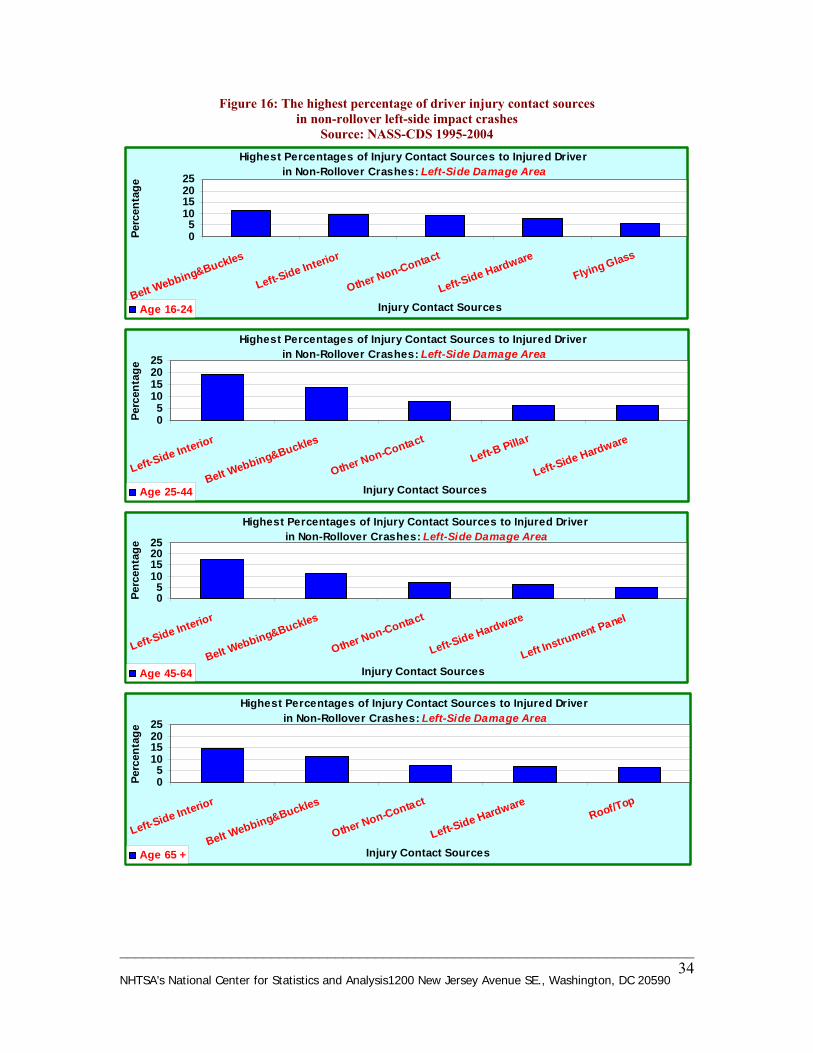
Left-Side-Impact Crashes In non-rollover left-side-impact crashes, the driver major injury contact sources were similar for the four age groups of drivers: left-side interior, left-side hardware, and belt webbing and buckles are most frequently injury contact sources (Figure 16 and Appendix 11.6 (b)). The likely proximity of the driver to the left-side door, and hence the very limited crash spaces on the left side of vehicle drivers, has resulted in the severe injuries to vehicle drivers in non-rollover left-side-impact crashes. Additional inflatable protection systems such as curtains or side air bags could mitigate the injury severity to vehicle drivers in left-side-impact crashes.30 31 32
________________________________________________________________________ NHTSA’s National Center for Statistics and Analysis1200 New Jersey Avenue SE., Washington, DC 20590
34
Figure 16: The highest percentage of driver injury contact sources in non-rollover left-side impact crashes
Source: NASS-CDS 1995-2004
Highest Percentages of Injury Contact Sources to Injured Driver in Non-Rollover Crashes: Left-Side Damage Area
05
10152025
Belt Webbing&Buckles
Left-Side Interior
Other Non-Contact
Left-Side HardwareFlying Glass
Injury Contact Sources
Perc
enta
ge
Age 16-24
Highest Percentages of Injury Contact Sources to Injured Driver in Non-Rollover Crashes: Left-Side Damage Area
05
10152025
Left-Side Interior
Belt Webbing&Buckles
Other Non-ContactLeft-B Pillar
Left-Side Hardware
Injury Contact Sources
Perc
enta
ge
Age 25-44
Highest Percentages of Injury Contact Sources to Injured Driver in Non-Rollover Crashes: Left-Side Damage Area
05
10152025
Left-Side Interior
Belt Webbing&Buckles
Other Non-Contact
Left-Side Hardware
Left Instrument Panel
Injury Contact Sources
Perc
enta
ge
Age 45-64
Highest Percentages of Injury Contact Sources to Injured Driver in Non-Rollover Crashes: Left-Side Damage Area
05
10152025
Left-Side Interior
Belt Webbing&Buckles
Other Non-Contact
Left-Side HardwareRoof/Top
Injury Contact Sources
Perc
enta
ge
Age 65 +
________________________________________________________________________ NHTSA’s National Center for Statistics and Analysis1200 New Jersey Avenue SE., Washington, DC 20590
35
8. Discussions
This study has investigated in great detail the driver injury severity, injured body regions, and injury contact sources by driver age in rollover and non-rollover real-world traffic crashes. Although the characteristics examined in the report were that only of driver injuries, the existence of passengers in vehicles could affect the patterns of driver injuries in vehicle crashes. With careful consideration of nonexistence of passengers in vehicles, we have examined the driver injury patterns with only single occupant (the driver) in vehicles in rollover and non-rollover frontal, right-side, rear, and left-side crashes (detailed results were not presented here). We found that all patterns and the measurements of quantities related to driver injuries with only the single drivers in vehicles are almost the same as the ones obtained in preceding studies in this report, except that unbelted drivers are a little more likely to sustain severe injuries (MAIS ≥ 4) in non-rollover right-side impact crashes. Also, the right-side interior or the right-side hardware becomes one of the major injury contact sources to drivers in right-side impact crashes. This feature could be due to the fact that the existence of other passengers in vehicles could prevent unbelted drivers from hitting the right-side interior or right-side hardware of the vehicles in right-side impact crashes.
________________________________________________________________________
NHTSA’s National Center for Statistics and Analysis1200 New Jersey Avenue SE., Washington, DC 20590 36
9. Conclusions
In this study, driver injury severity, injured body regions, and injury contact sources by driver age in rollover and non-rollover real-world traffic crashes are examined. Twelve years of CDS data were included in the analysis (1993 to 2004). Injury severity was categorized into two levels (no injury to major injury, or severe injury) using the Maximum Abbreviated Injury Scale (MAIS). Our results indicate that in the three youngest age groups, males sustained more severe injuries than females, whereas this pattern was reversed for the oldest age group. The pattern of severe injuries to those in rollovers was independent of age. However, in non-rollover crashes, the older drivers are more likely to sustain severe injuries, especially in left-side impact crashes. There was a statistically significant reduction in injury severity in both rollover and non-rollover crashes to the driver when seat belts were used. Non-belted drivers were eight times more likely than belted drivers to sustain serious injury. The driver serious injury risk (odds) in vehicle rollover crashes is three times higher than that in vehicle non-rollover crashes. About 80 percent of the severe injuries were either to the head or chest. The less severe injuries occurred to the face, upper limbs, and lower limbs. The major injury contact sources in rollovers are the vehicle roof and top. The pattern of the body region injured in rollovers is similar across the age groups, with large proportions of the severe injuries occurring to the head and chest, followed by the neck and spine. In frontal crashes, the major injury contact sources for the drivers of all ages were the belt webbing and buckles, air bags, steering wheel rim, left instrument panel, and the windshield. The two highest proportions for the severe injuries were to the head and chest. The abdomen is another frequently injured portion in such crashes across all age groups. The less-severe injuries occur mainly to the upper and lower limbs, face, and head, and this was true across all the age groups. In left-side-impact crashes, the major injury contact sources were left-side interior, left-side hardware, and belt webbing and buckles; this was true for all ages. Severe injuries in such crashes were similar across all ages, with the head and chest being the most-injured body regions. The less severe injuries occurred to the lower and upper limbs, neck and spine, and the face. The percentage of chest injuries increases as the driver age increases. In right-side-impact crashes, the major contact source of injuries showed some differences by age group. Belt webbing was a major injury contact source among all age groups. Other injury contact sources such as the windshield, air bags, and other non-
________________________________________________________________________ NHTSA’s National Center for Statistics and Analysis1200 New Jersey Avenue SE., Washington, DC 20590
37
contact sources did not show a pattern among the age groups. A reason for this finding may be differences in travel speed or other age-related factors. The most severe injuries in such crashes occurred to the head and the chest, and this was true for all age groups. While the relative percentage of head injuries decreases as the driver age increases, the percentage that were chest injuries increases with age. The abdomen and the neck/throat were the other body regions injured in such crashes. In rear-impact-crashes, the major sources of injury contact to the drivers were a bit different among the four age groups. The most common source is the head restraint system. Evolution of head restraint systems might reduce the whiplash injuries suffered by drivers in rear-impact crashes. Severe injuries in such crashes occurred predominantly to the head. The neck and the spine had the highest proportion of less severe injuries. This study also indicates a need of intervention through vehicle design. For instance, there may be a requirement to further redefine seat belt systems so that biomechanical variation in tolerance to impact is taken into account. Methods include load limiting or discretionary web-lock mechanisms, which could be calibrated for specific driver characteristics such as age, sex, weight, and height.15 33 It is also important to monitor how effectively the other safety systems such as door, frontal, and side air bags, and new anti-rollover technology for new vehicle (e.g., electronic stability control) afford protection to drivers.15 34 35 This study also calls attention to the need for vehicle improved crashworthiness and design to make vehicles more protective for older drivers.
________________________________________________________________________ NHTSA’s National Center for Statistics and Analysis1200 New Jersey Avenue SE., Washington, DC 20590
38
10. References
1 National Highway Traffic Safety Administration. (2004). Traffic Safety Facts 2003 (DOT HS 809 775). Washington, DC: Author. 2 McGwin, G., Jr., & Brown, D.B. (1999). Characteristics of Traffic Crashes among Young, Middle-Aged, and Older Drivers. Accident Analysis & Prevention, 31, 181. 3 Mayhew, D.R., Simpson, H.M., & Ferguson, S.A. (2006). Collisions Involving Senior Drivers: High-Risk Conditions and Locations. Traffic Injury Prevention, 7, 117. 4 Liu, C., Chen, C.-L., Subramanian, R., & Utter, D. (2005). Analysis of Speeding-Related Fatal Motor Vehicle Traffic Crashes (NHTSA Technical Report DOT HS 809 839). Washington, DC: National Highway Traffic Safety Administration. 5 Morris, A., Hassan, A., Mackay, M., & Hill, J. (1995). Head Injuries in Lateral Impact Collisions. Accident Analysis & Prevention, 27(6), 749. 6 Atkinson, T., & Atkinson P. (2000). Knee Injuries in Motor Vehicle Collisions: A Study of the National Accident Sampling System Database for the Years 1979-1995, Accident Analysis & Prevention, 32, 779. 7 Lee, J.B., & Yang, K.H. (2002). Abdominal Injury Patterns in Motor Vehicle Accidents: A Survey of the NASS Database from 1993 to 1997. Traffic Injury Prevention, 3, 241. 8 Nirula, R., Mock, C., Kaufman, R., Rivara, F.P., & Grossman, D.C. (2003). Correlation of Head Injury to Vehicle Contact Points Using Crash Injury Research and Engineering Network Data. Accident Analysis & Prevention, 35, 201. 9 Chipman, M.L. (2004). Side Impact Crashes – Factors Affecting Incidence and Severity: Review of the Literature, Traffic Injury Prevention, 5, 67.
10 Wang, S.C. (1998). An Aging Population: Fragile, Handle with Care.. Available at http://www-nrd.nhtsa.dot.gov/departments/nrd-50/ciren/um_fragile.html. Washington, DC: National Highway Traffic Safety Administration. 11 National Highway Traffic Safety Administration. (2006). Traffic Safety Facts 2005: Older Population (DOT HS 810 622). Washington, DC: Author.
12 Foret-Bruno, J.Y. et al. (1978). Correlation between Thoracic Lesions and Force Values Measured at the Shoulder of 92 Belted Occupants Involved in Real Accidents. In Proceedings of 22nd Stapp Car Crashes Conference. Ann Arbor, Michigan.
________________________________________________________________________ NHTSA’s National Center for Statistics and Analysis1200 New Jersey Avenue SE., Washington, DC 20590
39
13 Foret-Bruno, J.Y. et al. (1989). Thoracic Deflection of Hybrid III: Dummy Response for Simulations of Real Accidents. In Proceedings of 12th Experimental Safety Vehicle Conference. Gothenburg, Sweden.
14 Morris, A., Welsh, R., Frampton, R., Charlton, J. & Fildes, B. (2002). An Overview of Requirements for the Crash Protection of Older Drivers. Annual Proceeding of the Association for the Advancement of Automotive Medicine, 46:141. 15 Blomqvist, L.H. (1998). Older Drivers’ Accident Risk: Conceptual and Methodological Issues. Accident Analysis & Prevention, 30, 293. 16 Austin, R.A., & Faigin, B.M. (2003). Effect of Vehicle and Crash Factors on Older Occupant Injury. Journal of Safety Research, 34, 441. 17 Li, G., Braver, E.R., & Chen, L. (2003). Fragility versus Excessive Crash Involvement as Determinants of High Death Rates per Vehicle-Mile of Travel among Older Drivers. Accident Analysis & Prevention, 35, 227.
18 Braver, E.R., & Trempel, R.E. (2003). Are Older Drivers at Higher Risks of Involvement in Collisions Resulting in Death or Nonfatal Injuries among Their Passengers and Other Road Users? Arlington, VA: Insurance Institute for Highway Safety, 2003. 19 Lyman, S., Ferguson, S.A., Braver, E.R., & Williams, A.F. (2002). Older Driver Involvements in Police Reported Crashes and Fatal Crashes: Trends and Projections. Injury Prevention, 8, 116. 20 Federal Highway Administration, Washington, DC. 21 U.S. Bureau of Census, Washington, DC. 22 Research and Development (R&D) Program, NHTSA. Available at: http://www-nrd.nhtsa.dot.gov/. Washington, DC: National Highway Traffic Safety Administration.
23 Nirula, R. & Pintar, F.A. (2007). Identification of Vehicle Components Associated with Severe Thoracic Injury in Motor Vehicle Crashes: A CIREN and NASS analysis. Accident Analysis & Prevention, 40. Hanna, R. and Hershman, L. (2007). Evaluation of Thoracic Injuries Among Older Motor Vehicle Occupants. Stapp Car Crash Journal,. 51. 24 Zhang, J., Fraser, S., Lindsay, J., Clarke, K., & Mao, Y. (1998). Age-Specific Patterns of Factors Related to Fatal Motor Vehicle Traffic Crashes: Focus on Young and Elderly Drivers. Public Health, 112, 289.
________________________________________________________________________ NHTSA’s National Center for Statistics and Analysis1200 New Jersey Avenue SE., Washington, DC 20590
40
25 Stamatiadis, N., & Deacon, J.A. (1995). Trends in Highway Safety: Effects of an Aging Population on Accident Propensity. Accident Analysis and Prevention, 27, 443. 26 Eigen, A.M. (2003). Examination of Rollover Crash Mechanisms and Occupant Outcomes (NHTSA Research Note DOT HS 809 692). Washington, DC: National Highway Traffic Safety Administration.
27 National Highway Traffic Safety Administration. (2004). NHTSA Announces Upgraded Rule for Head Restraints in Vehicles. Washington, DC: Author. 28 National Highway Traffic Safety Administration. (2005). NHTSA Proposes New Roof Crush Standard. Washington, DC: Author. 29 National Highway Traffic Safety Administration. (2003). Initiatives to Address the Mitigation of Vehicle Rollover. Washington, DC: Author. 30 Summers, S.M., Hollowell, W.T., & Prasad, A. (2003). NHTSA’s Research Program for Vehicle Compatibility. In the proceedings of the 18th International Enhanced Safety Vehicle Conference, Paper No. 307. Nagoya, Japan.
31 Farmer, C.M., Braver, E.R., & Mitter, E.L. (1997). Two-Vehicle Side-Impact Crashes: The Relationship of Vehicle and Crash Characteristics to Injury Severity. Accident Analysis & Prevention, 29(3), 399. 32 Insurance Institute for Highway Safety (IIHS). (2003). In Real-World Crashes, Side Air Bags With Head Protection Are Saving Lives. Status Report, 38(8). 33 Mackay, G.M., Parkin, S., & Scott, A. (1994). Intelligent Restraint Systems – What Characteristics Should They Have? In Advances in Occupant Restraint Technologies: Joint AAAM/Ircobi Special Session. Lyon, France. 34 NHTSA Safety Standards and Regulations. Available at http://www.safercar.gov. Washington, DC: National Highway Traffic Safety Administration. 35 DOT Proposes Anti-Rollover Technology for New Vehicles. Available at http://www.safercar.gov/Rollover/pages/NewTechESC.htm. Washington, DC: National Highway Traffic Safety Administration.
________________________________________________________________________ NHTSA’s National Center for Statistics and Analysis1200 New Jersey Avenue SE., Washington, DC 20590
41
11. Appendix
11.1 Driver Overall Injury Severity
Relative Percentage of Driver Overall Injury Severity MAIS: 0-no injury, 1-minor, 2-moderate, 3-serious, 4-severe, 5-critical, 6-maximum
(The Number in Parenthesis is the Standard Error)
MAIS MAIS 0 – MAIS 3 MAIS 4 – MAIS 6
Driver Age (%) (%) Total Number 16-24 99.36 (0.12) 0.64 (0.12) 10,790,00025-44 99.24 (0.16) 0.76 (0.16) 13,410,00045-64 99.05 (0.26) 0.95 (0.26) 5,896,63965 + 98.15 (0.29) 1.85 (0.29) 2,486,125
χ2 test for the association between driver’s age and driver’s MAIS (MAIS 0-3 versus MAIS 4-6): χ2 =28.5 (p-value=0.0009) Source: NASS-CDS 1993-2004
11.2 Driver Overall Injury Severity by Gender
Percentage of Driver Serious Injury Severity (MAIS 4 – MAIS 6) by Gender
MAIS: 0-no injury, 1-minor, 2-moderate, 3-serious, 4-severe, 5-critical, 6-maximum (The Number in Parenthesis is the Standard Error)
MAIS 4 – MAIS 6
Driver Age Male Female % Number % Number
16-24 0.77 (0.16) 47,936 0.46 (0.08) 20,773 25-44 0.97 (0.20) 72,258 0.50 (0.12) 29,467 45-64 1.07 (0.32) 35,162 0.79 (0.19) 20,689 65 + 1.50 (0.26) 21,986 2.34 (0.61) 23,938
χ2 test for the association between driver’s gender and driver’s MAIS (MAIS 0-3 versus MAIS 4-6) for each age group: Age 16-24: χ2 =6.94 (p-value=0.0187) Age 25-44: χ2 =7.32 (p-value=0.0163) Age 45-64: χ2 =2.98 (p-value=0.1048) Age 65 + : χ2 =1.43 (p-value=0.2502) Source: NASS-CDS 1993-2004
________________________________________________________________________ NHTSA’s National Center for Statistics and Analysis1200 New Jersey Avenue SE., Washington, DC 20590
42
11.3 Driver Injury Severity by Crash Modes
Percentage of Driver Severe Injury Severity (MAIS 4 – MAIS 6) by Crash Modes MAIS: 0-no injury, 1-minor, 2-moderate, 3-serious, 4-severe, 5-critical, 6-maximum
(The Number in Parenthesis is the Standard Error)
MAIS 4 – MAIS 6
Driver Age 16-24 25-44 45-64 65 +
Crash Modes
1Rollover
%
2.10 (0.25)
3.00 (0.69)
2.92 (0.80)
4.39 (0.96)
Number 18,921 28,356 9,020 3,349
2Non-Rollover
Vehicle Damage
Area
Frontal
%
0.48 (0.13)
0.69 (0.16)
1.07 (0.44)
1.74 (0.53)
Number 22,052 37,046 25,407 18,851
Right- Side
%
0.66 (0.09)
0.63 (0.08)
0.66 (0.10)
2.33 (1.05)
Number 6,065 7,102 3,289 6,773
Rear
%
0.17 (0.12)
0.12 (0.03)
0.30 (0.15)
1.10 (0.64)
Number 817 962 1,431 1,620
Left- Side
%
1.12 (0.28)
1.20 (0.31)
1.71 (0.45)
3.18 (0.48)
Number 11,172 15,637 10,124 9,160 1 χ2 test for the association between driver’s age and driver’s MAIS (MAIS 0-3 versus MAIS 4-6) in Rollover crashes: χ2=7.26 (p-value=0.1065) 2 χ2 test for the association between driver’s age and driver’s MAIS (MAIS 0-3 versus MAIS 4-6) in non-rollover crashes by vehicle damage area: Frontal: χ2 =15.9 (p-value=0.0108) Right-Side: χ2 =2.81 (p-value=0.4476) Rear: χ2 =8.45 (p-value=0.0748) Left-Side: χ2 =18.6 (p-value=0.0060) Source: NASS-CDS 1993-2004
________________________________________________________________________
NHTSA’s National Center for Statistics and Analysis1200 New Jersey Avenue SE., Washington, DC 20590 43
11.4 Driver Injury Severity by Seat Belt Use
Percentage of Driver Serious Crash Injury Severity (MAIS 4 – MAIS 6) by Seat Belt Use MAIS: 0-no injury, 1-minor, 2-moderate, 3-serious, 4-severe, 5-critical, 6-maximum
(The Number in Parenthesis is the Standard Error)
MAIS 4 – MAIS 6 (%)
Driver Age 16-24 25-44 45-64 65 + 1.10 1.37 1.37 2.68 Used (0.33) (0.46) (0.44) (0.84)
1 Rollover 5.76 8.10 6.71 15.7 Not Used (0.71) (1.64) (2.34) (6.39) Total Number 18,886 28,188 8,747 2,993 0.22 0.26 0.36 0.84 Used (0.05) (0.05) (0.06) (0.26) Frontal Not 1.45 2.66 5.43 8.77 Used (0.36) (0.50) (2.61) (3.62) Crash Total Number 21,476 36,161 24,952 18,601 Modes 0.27 0.25 0.34 0.49
Vehicle Right- Used (0.04) (0.03) (0.06) (0.14) 2Non-Rollover Damage Side Not 2.83 3.52 3.10 14.0 Area Used (0.52) (0.37) (0.51) (7.33) Total Number 6,006 7,005 3,260 6,594
0.10 0.06 0.28 0.72 Used (0.08) (0.02) (0.16) (0.38)
Rear Not 0.55 0.33 0.59 8.58 Used (0.33) (0.17) (0.25) (7.60)
Total Number 782 655 1,399 1,599 0.74 0.60 1.16 2.71
Left- Used (0.17) (0.12) (0.44) (0.59) Side Not 2.57 5.58 5.61 6.71
Used (0.77) (2.16) (1.31) (1.67) Total Number 10,861 15,289 10,040 8,977
1 χ2 test for the association between driver’s seat belt use (used versus not used) and driver’s MAIS (MAIS 0-3 versus MAIS 4-6) in Rollover crashes for each age group: Age 16-24: χ2 =15.2 (p-value=0.0014); Age 25-44: χ2 =7.24 (p-value=0.0168) Age 45-64: χ2 =6.27 (p-value=0.0243); Age 65 + : χ2 =4.65 (p-value=0.0476) 2 χ2 test for the association between driver’s seat belt use (used versus not used) and driver’s MAIS (MAIS 0-3 versus MAIS 4-6) in non-rollover crashes by vehicle damage area for each age group (the number in the parenthesis is the p-value):
Driver Vehicle Damage Area
Age Frontal Right-Side Rear Left-Side 16-24 χ2 =6.19 (0.0251) χ2 =20.8 (0.0004) χ2 =2.10 (0.1680) χ2 =5.55 (0.0325) 25-44 χ2 =8.88 (0.0093) χ2 =32.9 (0.0000) χ2 =3.17 (0.0952) χ2 =3.73 (0.0725) 45-64 χ2 =3.13 (0.0972) χ2 =13.0 (0.0026) χ2 =0.71 (0.4120) χ2 =27.7 (0.0001) 65 + χ2 =4.35 (0.0546) χ2 =2.79 (0.1156) χ2 =1.44 (0.2486) χ2 =7.05 (0.0180)
Source: NASS-CDS 1993-2004
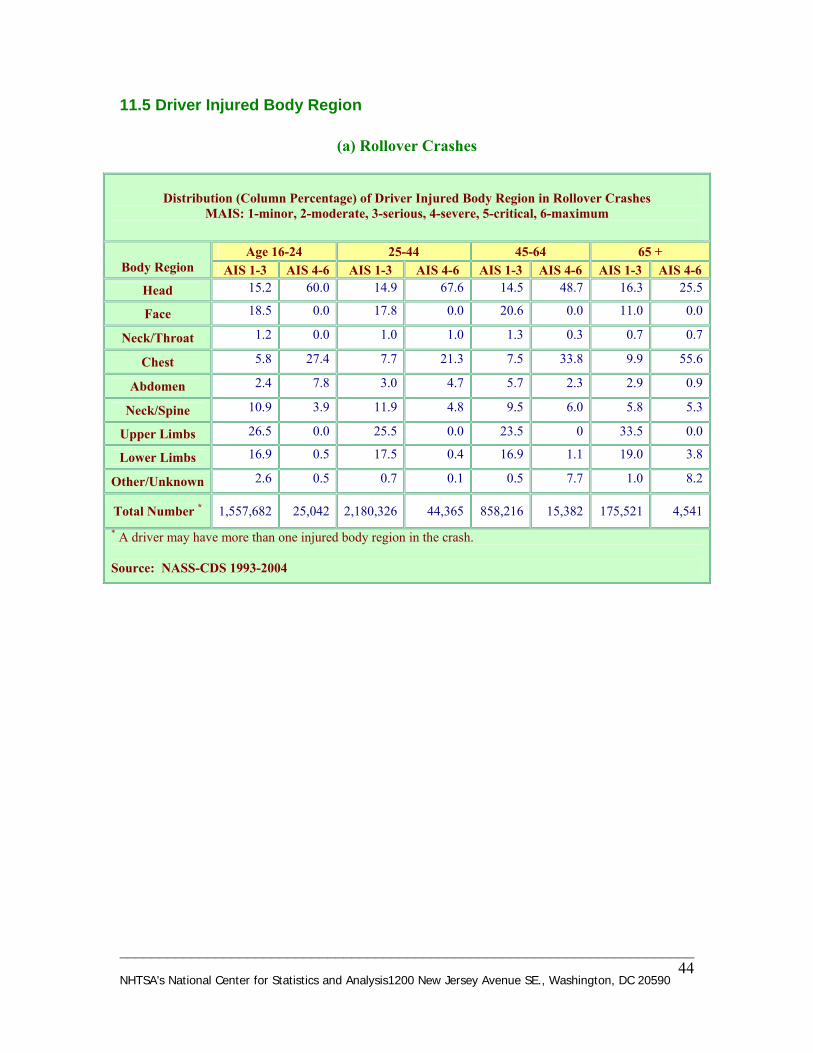
________________________________________________________________________ NHTSA’s National Center for Statistics and Analysis1200 New Jersey Avenue SE., Washington, DC 20590
44
(a) Rollover Crashes
Distribution (Column Percentage) of Driver Injured Body Region in Rollover Crashes
MAIS: 1-minor, 2-moderate, 3-serious, 4-severe, 5-critical, 6-maximum
Age 16-24 25-44 45-64 65 + Body Region AIS 1-3 AIS 4-6 AIS 1-3 AIS 4-6 AIS 1-3 AIS 4-6 AIS 1-3 AIS 4-6
Head 15.2 60.0 14.9 67.6 14.5 48.7 16.3 25.5
Face 18.5 0.0 17.8 0.0 20.6 0.0 11.0 0.0
Neck/Throat 1.2 0.0 1.0 1.0 1.3 0.3 0.7 0.7
Chest 5.8 27.4 7.7 21.3 7.5 33.8 9.9 55.6
Abdomen 2.4 7.8 3.0 4.7 5.7 2.3 2.9 0.9
Neck/Spine 10.9 3.9 11.9 4.8 9.5 6.0 5.8 5.3
Upper Limbs 26.5 0.0 25.5 0.0 23.5 0 33.5 0.0
Lower Limbs 16.9 0.5 17.5 0.4 16.9 1.1 19.0 3.8
Other/Unknown 2.6 0.5 0.7 0.1 0.5 7.7 1.0 8.2
Total Number * 1,557,682 25,042 2,180,326 44,365 858,216 15,382 175,521 4,541* A driver may have more than one injured body region in the crash. Source: NASS-CDS 1993-2004
11.5 Driver Injured Body Region
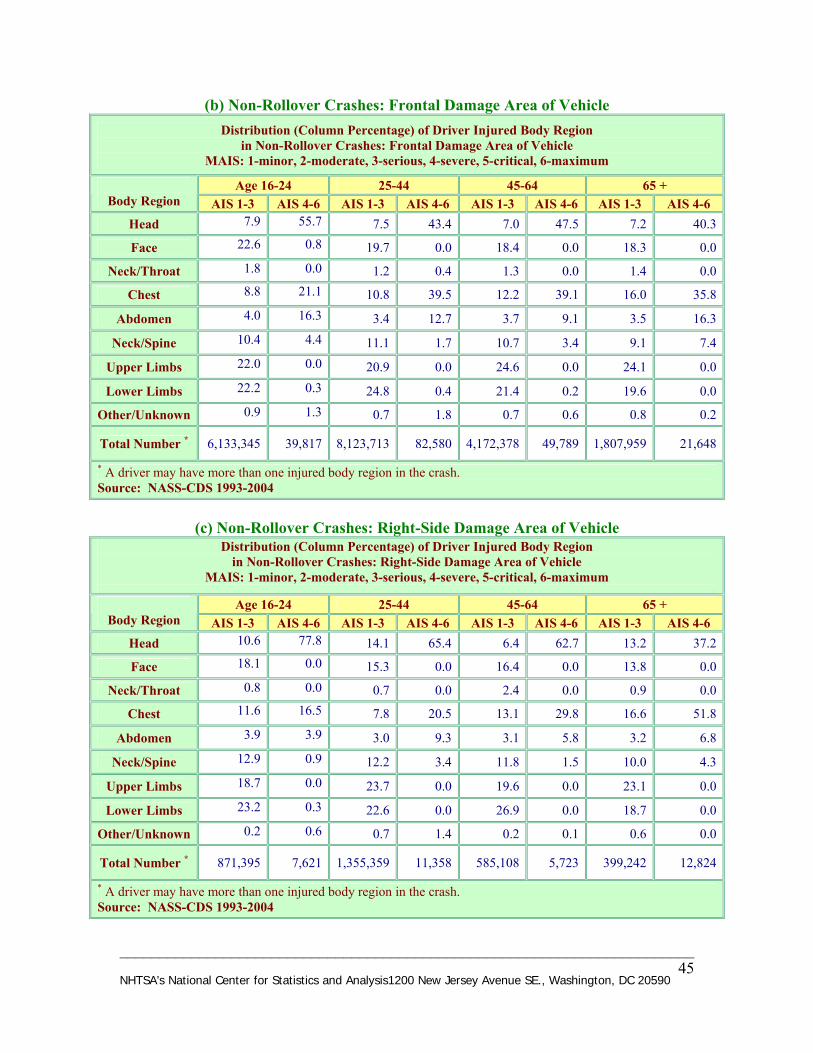
________________________________________________________________________ NHTSA’s National Center for Statistics and Analysis1200 New Jersey Avenue SE., Washington, DC 20590
45
(b) Non-Rollover Crashes: Frontal Damage Area of Vehicle Distribution (Column Percentage) of Driver Injured Body Region
in Non-Rollover Crashes: Frontal Damage Area of Vehicle MAIS: 1-minor, 2-moderate, 3-serious, 4-severe, 5-critical, 6-maximum
Body Region
Age 16-24 25-44 45-64 65 + AIS 1-3 AIS 4-6 AIS 1-3 AIS 4-6 AIS 1-3 AIS 4-6 AIS 1-3 AIS 4-6
Head 7.9 55.7 7.5 43.4 7.0 47.5 7.2 40.3
Face 22.6 0.8 19.7 0.0 18.4 0.0 18.3 0.0
Neck/Throat 1.8 0.0 1.2 0.4 1.3 0.0 1.4 0.0
Chest 8.8 21.1 10.8 39.5 12.2 39.1 16.0 35.8
Abdomen 4.0 16.3 3.4 12.7 3.7 9.1 3.5 16.3
Neck/Spine 10.4 4.4 11.1 1.7 10.7 3.4 9.1 7.4
Upper Limbs 22.0 0.0 20.9 0.0 24.6 0.0 24.1 0.0
Lower Limbs 22.2 0.3 24.8 0.4 21.4 0.2 19.6 0.0
Other/Unknown 0.9 1.3 0.7 1.8 0.7 0.6 0.8 0.2
Total Number * 6,133,345 39,817 8,123,713 82,580 4,172,378 49,789 1,807,959 21,648
* A driver may have more than one injured body Source: NASS-CDS 1993-2004
region in the crash.
(c) Non-Rollover Crashes: Right-Side Damage Area of Vehicle Distribution (Column Percentage) of Driver Injured Body Region
in Non-Rollover Crashes: Right-Side Damage Area of Vehicle MAIS: 1-minor, 2-moderate, 3-serious, 4-severe, 5-critical, 6-maximum
Age 16-24 25-44 45-64 65 + Body Region AIS 1-3 AIS 4-6 AIS 1-3 AIS 4-6 AIS 1-3 AIS 4-6 AIS 1-3 AIS 4-6
Head 10.6 77.8 14.1 65.4 6.4 62.7 13.2 37.2
Face 18.1 0.0 15.3 0.0 16.4 0.0 13.8 0.0
Neck/Throat 0.8 0.0 0.7 0.0 2.4 0.0 0.9 0.0
Chest 11.6 16.5 7.8 20.5 13.1 29.8 16.6 51.8
Abdomen 3.9 3.9 3.0 9.3 3.1 5.8 3.2 6.8
Neck/Spine 12.9 0.9 12.2 3.4 11.8 1.5 10.0 4.3
Upper Limbs 18.7 0.0 23.7 0.0 19.6 0.0 23.1 0.0
Lower Limbs 23.2 0.3 22.6 0.0 26.9 0.0 18.7 0.0
Other/Unknown 0.2 0.6 0.7 1.4 0.2 0.1 0.6 0.0
Total Number * 871,395 7,621 1,355,359 11,358 585,108 5,723 399,242 12,824
* A driver may have more than one injured body region in the crash. Source: NASS-CDS 1993-2004
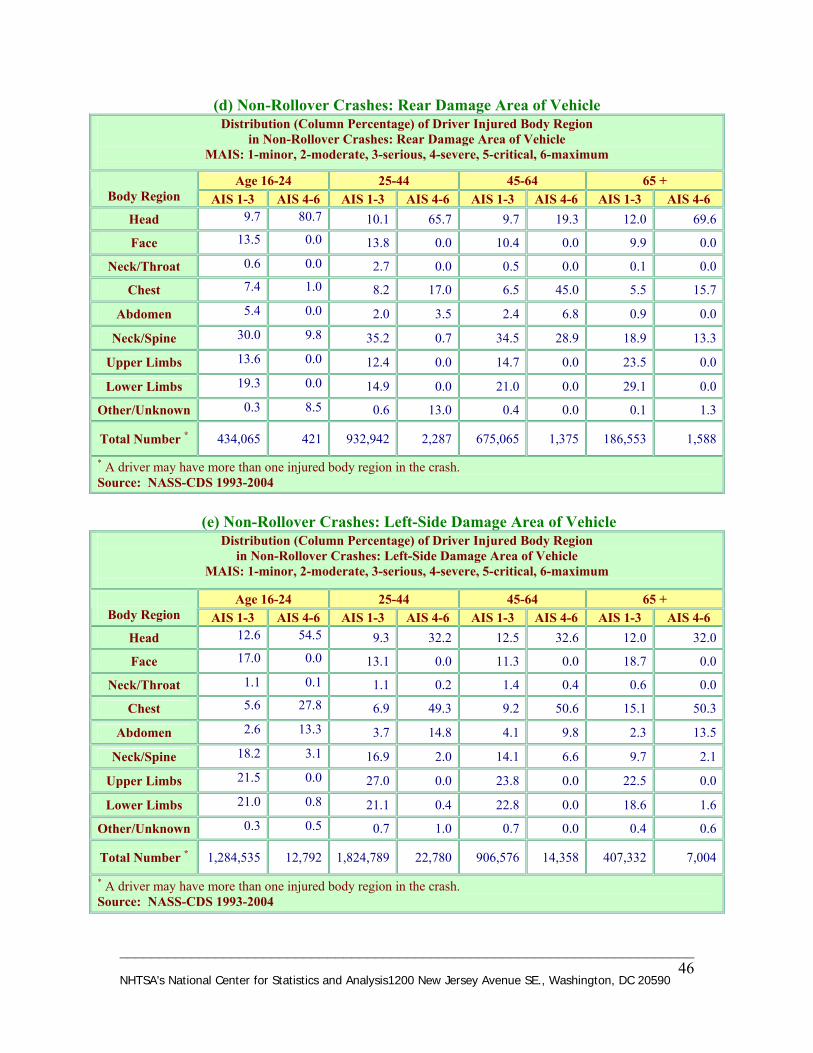
________________________________________________________________________ NHTSA’s National Center for Statistics and Analysis1200 New Jersey Avenue SE., Washington, DC 20590
46
(d) Non-Rollover Crashes: Rear Damage Area of Vehicle Distribution (Column Percentage) of Driver Injured Body Region
in Non-Rollover Crashes: Rear Damage Area of Vehicle MAIS: 1-minor, 2-moderate, 3-serious, 4-severe, 5-critical, 6-maximum
Age 16-24 25-44 45-64 65 + Body Region AIS 1-3 AIS 4-6 AIS 1-3 AIS 4-6 AIS 1-3 AIS 4-6 AIS 1-3 AIS 4-6
Head 9.7 80.7 10.1 65.7 9.7 19.3 12.0 69.6
Face 13.5 0.0 13.8 0.0 10.4 0.0 9.9 0.0
Neck/Throat 0.6 0.0 2.7 0.0 0.5 0.0 0.1 0.0
Chest 7.4 1.0 8.2 17.0 6.5 45.0 5.5 15.7
Abdomen 5.4 0.0 2.0 3.5 2.4 6.8 0.9 0.0
Neck/Spine 30.0 9.8 35.2 0.7 34.5 28.9 18.9 13.3
Upper Limbs 13.6 0.0 12.4 0.0 14.7 0.0 23.5 0.0
Lower Limbs 19.3 0.0 14.9 0.0 21.0 0.0 29.1 0.0
Other/Unknown 0.3 8.5 0.6 13.0 0.4 0.0 0.1 1.3
Total Number * 434,065 421 932,942 2,287 675,065 1,375 186,553 1,588
* A driver may have more than one injured body region in the crash. Source: NASS-CDS 1993-2004
(e) Non-Rollover Crashes: Left-Side Damage Area of Vehicle Distribution (Column Percentage) of Driver Injured Body Region
in Non-Rollover Crashes: Left-Side Damage Area of Vehicle MAIS: 1-minor, 2-moderate, 3-serious, 4-severe, 5-critical, 6-maximum
Age 16-24 25-44 45-64 65 + Body Region AIS 1-3 AIS 4-6 AIS 1-3 AIS 4-6 AIS 1-3 AIS 4-6 AIS 1-3 AIS 4-6
Head 12.6 54.5 9.3 32.2 12.5 32.6 12.0 32.0
Face 17.0 0.0 13.1 0.0 11.3 0.0 18.7 0.0
Neck/Throat 1.1 0.1 1.1 0.2 1.4 0.4 0.6 0.0
Chest 5.6 27.8 6.9 49.3 9.2 50.6 15.1 50.3
Abdomen 2.6 13.3 3.7 14.8 4.1 9.8 2.3 13.5
Neck/Spine 18.2 3.1 16.9 2.0 14.1 6.6 9.7 2.1
Upper Limbs 21.5 0.0 27.0 0.0 23.8 0.0 22.5 0.0
Lower Limbs 21.0 0.8 21.1 0.4 22.8 0.0 18.6 1.6
Other/Unknown 0.3 0.5 0.7 1.0 0.7 0.0 0.4 0.6
Total Number * 1,284,535 12,792 1,824,789 22,780 906,576 14,358 407,332 7,004
* A driver may have more than one injured body region in the crash. Source: NASS-CDS 1993-2004
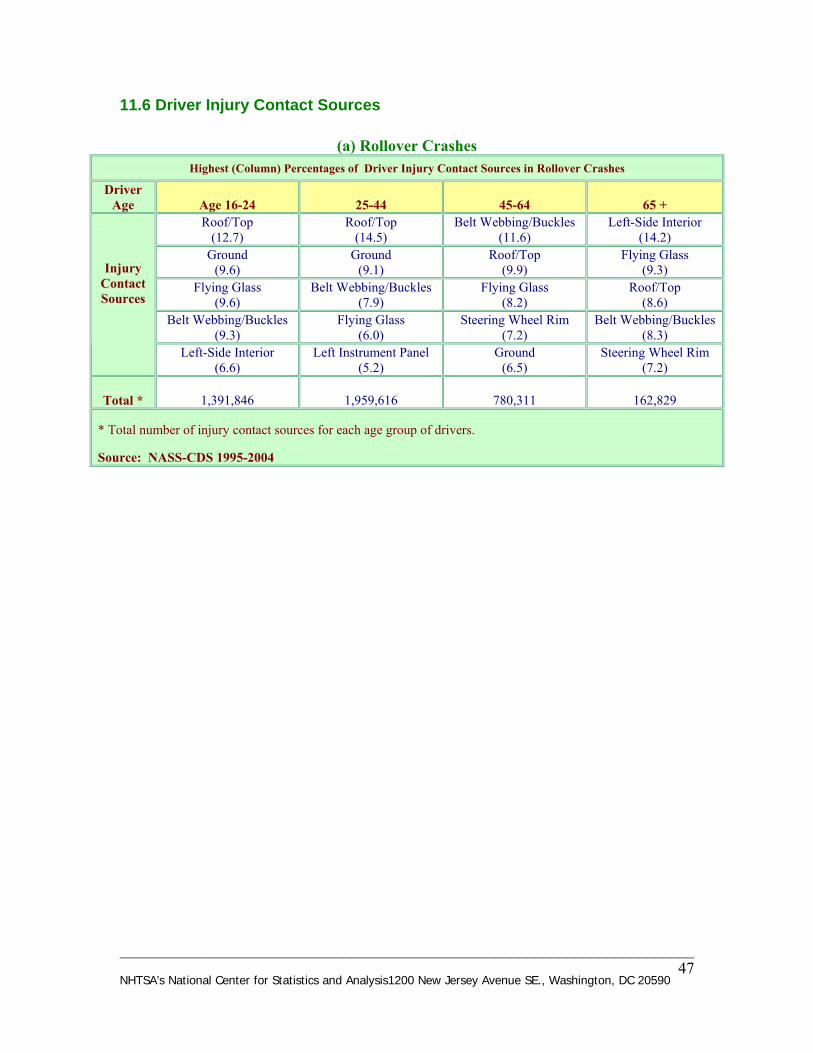
________________________________________________________________________ NHTSA’s National Center for Statistics and Analysis1200 New Jersey Avenue SE., Washington, DC 20590
47
11.6 Driver Injury Contact Sources
(a) Rollover Crashes Highest (Column) Percentages of Driver Injury Contact Sources in Rollover Crashes
Driver Age Age 16-24 25-44 45-64 65 +
Roof/Top Roof/Top Belt Webbing/Buckles Left-Side Interior
Injury Contact Sources
(12.7) (14.5) (11.6) (14.2) Ground
(9.6) Ground
(9.1) Roof/Top
(9.9) Flying Glass
(9.3) Flying Glass
(9.6) Belt Webbing/Buckles
(7.9) Flying Glass
(8.2) Roof/Top
(8.6) Belt Webbing/Buckles Flying Glass Steering Wheel Rim Belt Webbing/Buckles
(9.3) (6.0) (7.2) (8.3) Left-Side Interior Left Instrument Panel Ground Steering Wheel Rim
(6.6) (5.2) (6.5) (7.2)
Total * 1,391,846 1,959,616 780,311 162,829 * Total number of injury contact sources for each age group of drivers. Source: NASS-CDS 1995-2004
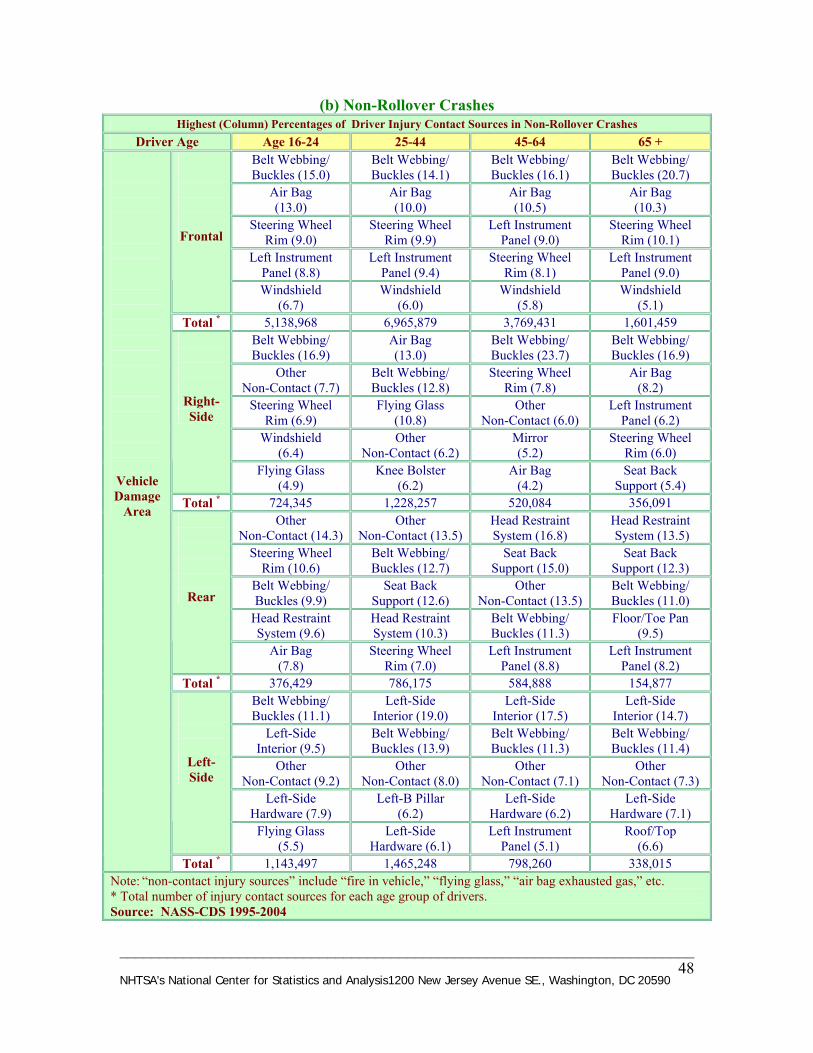
________________________________________________________________________ NHTSA’s National Center for Statistics and Analysis1200 New Jersey Avenue SE., Washington, DC 20590
48
(b) Non-Rollover Crashes Highest (Column) Percentages of Driver Injury Contact Sources in Non-Rollover Crashes
Driver Age Age 16-24 25-44 45-64 65 + Belt Webbing/ Buckles (15.0)
Belt Webbing/ Buckles (14.1)
Belt Webbing/ Buckles (16.1)
Belt Webbing/ Buckles (20.7)
Air Bag (13.0)
Air Bag (10.0)
Air Bag (10.5)
Air Bag (10.3)
Steering Wheel Rim (9.0)
Steering Wheel Rim (9.9)
Left Instrument Panel (9.0)
Steering Wheel Rim (10.1)
Left Instrument Panel (8.8)
Left Instrument Panel (9.4)
Steering Wheel Rim (8.1)
Left Instrument Panel (9.0)
Frontal
Windshield (6.7)
Windshield (6.0)
Windshield (5.8)
Windshield (5.1)
Total * 5,138,968 6,965,879 3,769,431 1,601,459 Belt Webbing/ Buckles (16.9)
Air Bag (13.0)
Belt Webbing/ Buckles (23.7)
Belt Webbing/ Buckles (16.9)
Other Non-Contact (7.7)
Belt Webbing/ Buckles (12.8)
Steering Wheel Rim (7.8)
Air Bag (8.2)
Steering Wheel Rim (6.9)
Flying Glass (10.8)
Other Non-Contact (6.0)
Left Instrument Panel (6.2)
Windshield (6.4)
Other Non-Contact (6.2)
Mirror (5.2)
Steering Wheel Rim (6.0)
Right-Side
Flying Glass (4.9)
Knee Bolster (6.2)
Air Bag (4.2)
Seat Back Support (5.4)
Total * 724,345 1,228,257 520,084 356,091 Other
Non-Contact (14.3) Other
Non-Contact (13.5) Head Restraint System (16.8)
Head Restraint System (13.5)
Steering Wheel Rim (10.6)
Belt Webbing/ Buckles (12.7)
Seat Back Support (15.0)
Seat Back Support (12.3)
Belt Webbing/ Buckles (9.9)
Seat Back Support (12.6)
Other Non-Contact (13.5)
Belt Webbing/ Buckles (11.0)
Head Restraint System (9.6)
Head Restraint System (10.3)
Belt Webbing/ Buckles (11.3)
Floor/Toe Pan (9.5)
Rear
Air Bag (7.8)
Steering Wheel Rim (7.0)
Left Instrument Panel (8.8)
Left Instrument Panel (8.2)
Total * 376,429 786,175 584,888 154,877 Belt Webbing/ Buckles (11.1)
Left-Side Interior (19.0)
Left-Side Interior (17.5)
Left-Side Interior (14.7)
Left-Side Interior (9.5)
Belt Webbing/ Buckles (13.9)
Belt Webbing/ Buckles (11.3)
Belt Webbing/ Buckles (11.4)
Other Non-Contact (9.2)
Other Non-Contact (8.0)
Other Non-Contact (7.1)
Other Non-Contact (7.3)
Left-Side Hardware (7.9)
Left-B Pillar (6.2)
Left-Side Hardware (6.2)
Left-Side Hardware (7.1)
Left-Side
Flying Glass (5.5)
Left-Side Hardware (6.1)
Left Instrument Panel (5.1)
Roof/Top (6.6)
Vehicle Damage
Area
Total * 1,143,497 1,465,248 798,260 338,015 Note: “non-contact injury sources” include “fire in vehicle,” “flying glass,” “air bag exhausted gas,” etc. * Total number of injury contact sources for each age group of drivers. Source: NASS-CDS 1995-2004
DOT HS 810 857November 2007


![New Brunswick Health Indicators · head injuries or concussions. Hockey injuries are the most commonly reported injury among school-aged boys [20]. In New Brunswick, approximately](https://img.pdfslide.net/doc/110x75/5f7023d204a50125214b036a/new-brunswick-health-indicators-head-injuries-or-concussions-hockey-injuries-are.jpg)