Embed Size (px)
Citation preview

NCES 2013-313 U.S. DEPARTMENT OF EDUCATION
Characteristics of Public and Private Elementary and Secondary School Principals in the United States: Results From the 2011–12 Schools and Staffing Survey
First Look

Characteristics of Public and Private Elementary and Secondary School Principals in the United States: Results From the 2011–12 Schools and Staffing Survey
First Look
August 2013
Amy Bitterman Rebecca Goldring Lucinda Gray Westat
Stephen Broughman Project Officer National Center for Education Statistics
NCES 2013-313 U.S. DEPARTMENT OF EDUCATION

U.S. Department of Education Arne Duncan Secretary
Institute of Education Sciences John Q. Easton Director
National Center for Education Statistics Jack Buckley Commissioner
Elementary/Secondary and Library Studies Division Jeffrey Owings Associate Commissioner
The National Center for Education Statistics (NCES) is the primary federal entity for collecting, analyzing, and reporting data related to education in the United States and other nations. It fulfills a congressional mandate to collect, collate, analyze, and report full and complete statistics on the condition of education in the United States; conduct and publish reports and specialized analyses of the meaning and significance of such statistics; assist state and local education agencies in improving their statistical systems; and review and report on education activities in foreign countries.
NCES activities are designed to address high-priority education data needs; provide consistent, reliable, complete, and accurate indicators of education status and trends; and report timely, useful, and high-quality data to the U.S. Department of Education, the Congress, the states, other education policymakers, practitioners, data users, and the general public. Unless specifically noted, all information contained herein is in the public domain.
We strive to make our products available in a variety of formats and in language that is appropriate to a variety of audiences. You, as our customer, are the best judge of our success in communicating information effectively. If you have any comments or suggestions about this or any other NCES product or report, we would like to hear from you. Please direct your comments to
NCES, IES, U.S. Department of Education 1990 K Street NW Washington, DC 20006-5651
August 2013
The NCES Home Page address is http://nces.ed.gov. The NCES Publications and Products address is http://nces.ed.gov/pubsearch.
This publication is only available online. To download, view, and print the report as a PDF file, go to the NCES Publications and Products address shown above.
This report was prepared for the National Center for Education Statistics under Contract No. ED-IES-12-D-005 with Westat. Mention of trade names, commercial products, or organizations does not imply endorsement by the U.S. Government.
Suggested Citation
Bitterman, A., Goldring, R., and Gray, L. (2013). Characteristics of Public and Private Elementary and Secondary School Principals in the United States: Results From the 2011–12 Schools and Staffing Survey (NCES 2013-313). U.S. Department of Education. Washington, DC: National Center for Education Statistics. Retrieved [date] from http://nces.ed.gov/pubsearch.
Content Contact
Stephen Broughman (202) 502-7315 [email protected]

Contents Page
List of Tables ....................................................................................................................... iv
Introduction .......................................................................................................................... 1
Selected Findings ................................................................................................................. 3
References ............................................................................................................................ 4
Estimate Tables .................................................................................................................... 5
Appendix A: Standard Error Tables .................................................................................... A-1
Appendix B: Methodology and Technical Notes.................................................................. B-1
Appendix C: Description of Data Files ................................................................................. C-1
Appendix D: Description of Variables ................................................................................. D-1
iii

List of Tables Table Page
1. Total number of school principals and percentage distribution of school principals, by race/ethnicity, school type, and selected school characteristics: 2011–12 .......................................................................................... 6
2. Average and median age of school principals, and percentage distribution of principals, by age category, sex, school type, and selected school characteristics: 2011–12 .......................................................................................... 8
3. Percentage distribution of school principals, by highest degree earned, school type, and selected school characteristics: 2011–12 ..................................... 10
4. Average annual salary for school principals, by years of experience as a principal, school type, and selected school characteristics: 2011–12 ..................... 12
5. Average hours per week that school principals spent on all school-related activities and interacting with students, by school type and selected school characteristics: 2011–12 .......................................................................................... 14
6. Average total years of experience as a school principal, average years as a principal at current school, and percentage distribution of principals, by reported years of experience as a principal at current school, school type, and selected school characteristics: 2011–12 ................................................. 16
7. Percentage of school principals who thought they had a major influence on decisions concerning various activities at their school, by school type and selected school characteristics: 2011–12 .......................................................... 18
Appendix A: Standard Error Tables A-1. Standard errors for Table 1: Total number of school principals and
percentage distribution of school principals, by race/ethnicity, school type, and selected school characteristics: 2011–12 .......................................................... A-2
A-2. Standard errors for Table 2: Average and median age of school principals, and percentage distribution of principals, by age category, sex, school type, and selected school characteristics: 2011–12 ................................................. A-4
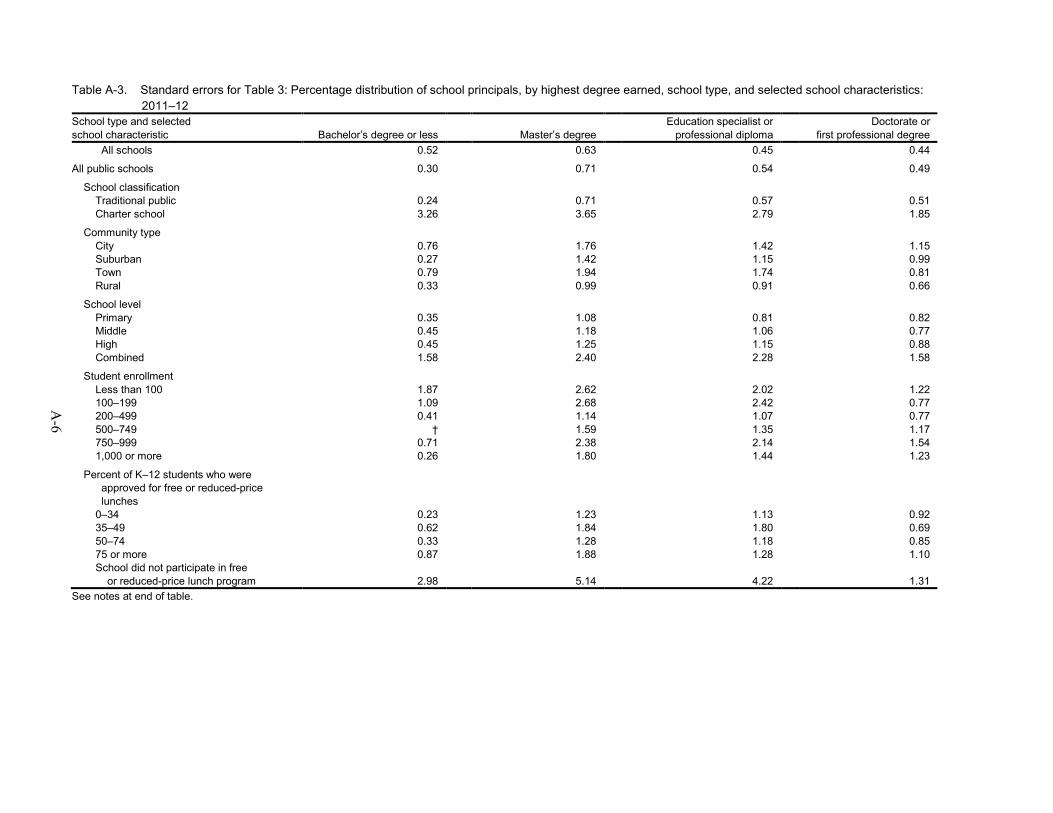
A-3. Standard errors for Table 3: Percentage distribution of school principals, by highest degree earned, school type, and selected school characteristics: 2011–12 ................................................................................................................... A-6
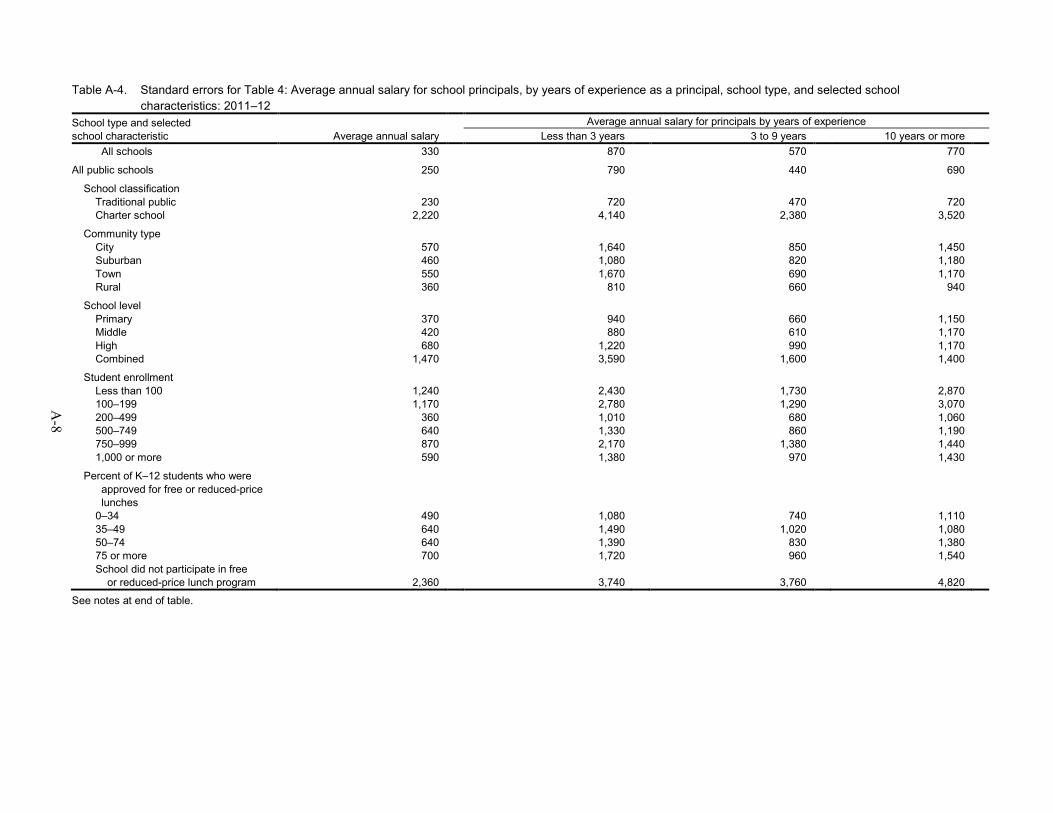
A-4. Standard errors for Table 4: Average annual salary for school principals, by years of experience as a principal, school type, and selected school characteristics: 2011–12 .......................................................................................... A-8
A-5. Standard errors for Table 5: Average hours per week that school principals spent on all school-related activities and interacting with students, by school type and selected school characteristics: 2011–12 .................. A-10
iv

Table Page
A-6. Standard errors for Table 6: Average total years of experience as a school principal, average years as a principal at current school, and percentage distribution of principals, by reported years of experience as a principal at current school, school type, and selected school characteristics: 2011–12.................................................................................................................... A-12
A-7. Standard errors for Table 7: Percentage of school principals who thought they had a major influence on decisions concerning various activities at their school, by school type and selected school characteristics: 2011–12 ............. A-14
Appendix B: Methodology and Technical Notes B-1. Weighted unit and overall response rates using initial base weight, by
survey: 2011–12 ....................................................................................................... B-6
B-2. Indication of potential sources of bias for public school principal data at the national level based on comparisons between frame distribution and base-weighted or nonresponse-adjusted respondent distributions: 2011–12 ........... B-8
B-3. Indication of potential sources of bias for private school principal data at the national level based on comparisons between frame distribution and base-weighted or nonresponse-adjusted respondent distributions: 2011–12 ........... B-8
B-4. Summary of weighted item response rates, by survey: 2011–12 ............................. B-9
Appendix C: Description of Data Files C-1. Names of data files and the questionnaires from which the data were
drawn: 2011–12 ....................................................................................................... C-2
C-2. The number of cases in the Public School District Data File, by respondent and source of data: 2011–12 ................................................................. C-3
Appendix D: Description of Variables D-1. Variables used in the Characteristics of Public and Private Elementary
and Secondary School Principals in the United States: Results From the Schools and Staffing Survey report: 2011–12 ......................................................... D-2
v

Introduction This report presents selected findings from the Public School Principal and Private School Principal Data Files of the 2011–12 Schools and Staffing Survey (SASS). SASS is a nationally representative sample survey of public1 and private K–12 schools, principals, and teachers in the 50 states and the District of Columbia. School districts associated with public schools and library media centers in public schools are also part of SASS. Developed by the National Center for Education Statistics (NCES) of the Institute of Education Sciences within the U.S. Department of Education and conducted by the U.S. Census Bureau, SASS was first conducted in school year 1987–88. Since then, SASS has been conducted six times: in school years 1990–91, 1993–94, 1999–2000, 2003–04, 2007–08, and, most recently, 2011–12.
The purpose of SASS is to collect information that can provide a detailed picture of U.S. elementary and secondary schools and their staff. This information is collected through the following surveys: district, school, principal, teacher, and library media center. Information from all the surveys can be linked. For more information about surveys and data files, see appendix C. The SASS questionnaires can be found at http://nces.ed.gov/surveys/sass/questionnaire.asp.
The 2011–12 SASS uses a school-based sample of public and private schools. Because SASS uses a school-based sample design, districts, principals, and library media centers associated with public schools were included, as were principals associated with private schools. Teachers associated with a selected school were sampled from a teacher list provided by the school or district. The selected samples include about 11,000 traditional and charter public schools, public school principals, and public school library media centers; 5,800 public school districts; 51,100 public school teachers; 3,000 private schools and their principals; and 7,100 private school teachers. The samples were drawn to support estimates by geography, grade span, and charter school status for public schools, and by geography, grade span, and affiliation group for private schools for a wide range of topics. The reader is referred to the Survey Documentation for the 2011–12 Schools and Staffing Survey (Chambers et al. forthcoming) for details about these estimation domains and their precision criteria.
The data were collected via mailed questionnaires with telephone and in-person field follow-up. The first questionnaires were mailed in October 2011, and data collection ended in June 2012. The weighted unit response rates varied from 65 percent for private school principals to 81 percent for public school districts. For information about response rates, bias analysis results, methodology, and design of the 2011–12 SASS, please see the technical notes of this report in appendix B or the Survey Documentation for the 2011–12 Schools and Staffing Survey (Chambers et al. forthcoming).
The purpose of this First Look is to introduce new data through the presentation of tables containing descriptive information. Selected findings chosen for this report demonstrate the range of information available on the 2011–12 SASS Public School Principal and Private School Principal Data Files. The selected findings do not represent a complete review of all observed differences in the data and are not meant to emphasize any particular issue. This First Look report highlights findings from the SASS public and private principal surveys. Findings from the district, school, teacher, and library media center files will be presented in four companion First Look reports:
• Characteristics of Public School Districts in the United States: Results From the 2011–12 Schools and Staffing Survey (NCES 2013-311);
1 Public schools include traditional public and charter schools.
1

• Characteristics of Public and Private Elementary and Secondary Schools in the United States: Results From the 2011–12 Schools and Staffing Survey (NCES 2013-312);
• Characteristics of Public and Private Elementary and Secondary School Teachers in the United States: Results From the 2011–12 Schools and Staffing Survey (NCES 2013-314); and
• Characteristics of Public Elementary and Secondary School Library Media Centers in the United States: Results From the 2011–12 Schools and Staffing Survey (NCES 2013-315).
The tables in this report contain counts and percentages demonstrating bivariate relationships. All of the results have been weighted to reflect the sample design and to account for nonresponse and other adjustments. Comparisons drawn in the selected findings have been tested for statistical significance at the .05 level using Student’s t statistics to ensure that the differences are larger than those that might be expected due to sampling variation. No adjustments were made for multiple comparisons. Many of the variables examined are related to one another, and complex interactions and relationships have not been explored. Statistical Analysis Software (SAS 9.3) and SUDAAN (10.0) were used to compute the statistics for this report. Tables of standard errors are provided in appendix A. Detailed information about the survey methodology is provided in appendix B. Appendix C contains a description of the survey data files, and appendix D contains a description of the variables used in this report.
More information about the SASS can be found at http://nces.ed.gov/surveys/sass.
2
Selected Findings • During the 2011–12 school year, there were an estimated 115,540 principals of K–12 schools in the
United States; 89,810 were public school principals and 25,730 were private school principals (table 1). Among public school principals, 80 percent were non-Hispanic White, 10 percent were non-Hispanic Black or African American, 7 percent were Hispanic, and 3 percent were another race/ethnicity.2 Among private school principals, 87 percent were non-Hispanic White, 7 percent were non-Hispanic Black or African American, 3 percent were Hispanic, and 3 percent were another race/ethnicity.
• The percentage of public school principals who were female was 52 percent overall, 64 percent in primary schools, 42 percent in middle schools, 30 percent in high schools, and 40 percent in combined schools (table 2). The percentage of private school principals who were female was 55 percent overall, 75 percent in Catholic schools, 41 percent in other religious schools, and 62 percent in nonsectarian schools. The average age of public and private school principals was 48 and 52, respectively.
• Among public schools, more principals held a master’s degree (62 percent) as their highest degree than a bachelor’s degree or less (2 percent), an education specialist/professional diploma3 (26 percent) or a doctorate/first professional degree (10 percent) (table 3). Among private schools, more principals held a master’s degree (50 percent) as their highest degree earned, compared to those with a bachelor’s degree or less (31 percent), an education specialist/professional diploma (10 percent), or a doctorate/first professional degree (9 percent).
• The average annual salary of public school principals was $90,500 (table 4).4 Principals in public high schools earned more ($97,000) than principals in public middle schools ($91,900), public primary schools ($89,200) and public combined schools ($80,800). Among private school principals, the average annual salary was $65,300. Principals in private secondary schools earned more ($84,900) than principals in private elementary schools ($60,400) and in private combined schools ($66,900).
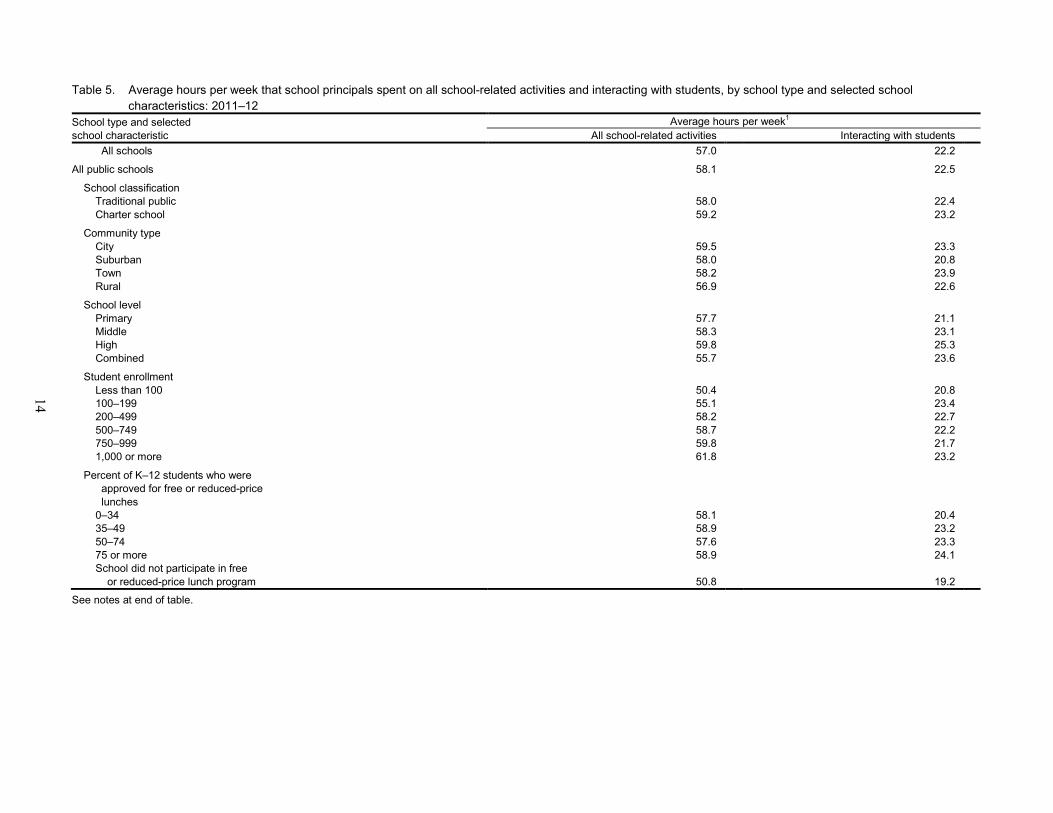
• On average, public school principals spent 58.1 hours per week on all school-related activities,5 including 22.5 hours per week interacting with students (table 5). Private school principals, on average, spent 53.2 hours per week on all school-related activities, including 21.2 hours per week interacting with students.
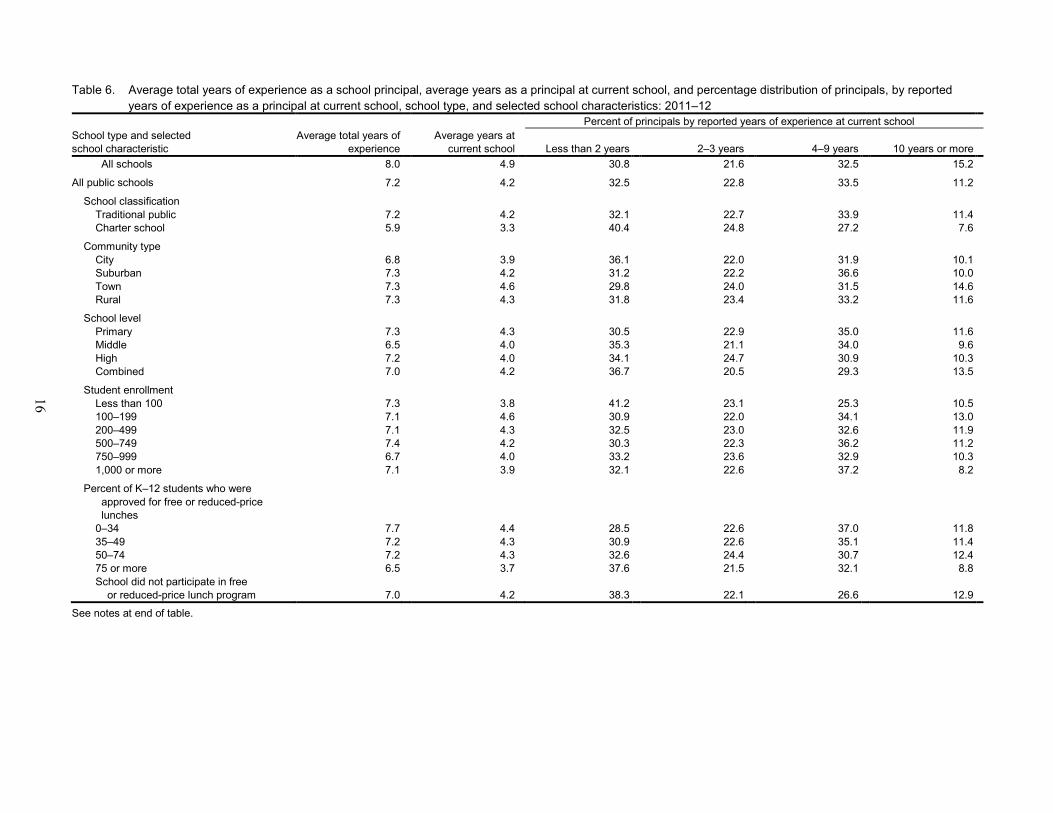
• Public school principals had, on average, 7.2 years of experience as a principal, of which 4.2 years were spent in their current school (table 6). Principals in traditional public schools had 7.2 years of experience and principals in charter schools had 5.9 years of experience. Private school principals had, on average, 10.8 years of experience as a principal, of which 7.4 years were spent in their current school. Principals in private Catholic, other religious, and nonsectarian schools had 10.5, 10.1, and 12.7 years of experience, respectively.
• Public and private school principals reported having a major influence on decisions concerning evaluating teachers (96 and 84 percent, respectively), hiring new full-time teachers (85 and 86 percent, respectively), and setting discipline policy (80 and 82 percent, respectively) (table 7).
2 Hispanic includes Latino. Other race/ethnicity includes American Indian/Alaska Native, non-Hispanic; Asian, non-Hispanic; Native Hawaiian or Other Pacific Islander, non-Hispanic; and two or more races, non-Hispanic. 3 At least 1 year beyond the master’s level. 4 Principals who reported an annual salary of zero were excluded from the calculation of average salary. 5 Includes hours spent during the school day, before and after school, and on the weekends.
3
References Chambers, L., Graham, S., Parmer, R., Stern, S., Strizek, G., and Thomas, T. (forthcoming). Survey Documentation for the 2011–12 Schools and Staffing Survey. U.S. Department of Education. Washington, DC: National Center for Education Statistics.
Cochran, W.G. (1977). Sampling Techniques. New York: John Wiley & Sons.
Goldring, R., Taie, S., Rizzo, L., Colby, D., and Fraser, A. (2013). User’s Manual for the 2011–12 Schools and Staffing Survey Volumes 1–6. (NCES 2013-330 through 2013-335). U.S. Department of Education. Washington, DC: National Center for Education Statistics.
U.S. Department of Education, National Center for Education Statistics. (2003). NCES Statistical Standards (NCES 2003-601). Washington, DC: U.S. Government Printing Office.
4
Estimate Tables
5

6
Table 1. Total number of school principals and percentage distribution of school principals, by race/ethnicity, school type, and selected school characteristics: 2011–12
School type and selected school characteristic
Total number of principals
Percent of principals by race/ethnicity Hispanic,
regardless of race
White, non-Hispanic
Black or African American,
non-Hispanic Other1 All schools 115,540 6.0 81.8 9.4 2.7
All public schools 89,810 6.8 80.3 10.1 2.8
School classification Traditional public 85,350 6.6 81.0 9.7 2.7 Charter school 4,460 11.7 65.0 18.3 5.0 !
Community type City 23,440 11.9 63.4 20.8 3.9 Suburban 24,520 7.0 81.5 9.2 2.2 Town 12,330 5.4 86.1 5.4 3.1 Rural 29,520 3.2 90.1 4.4 2.2
School level Primary 50,210 7.9 79.4 10.1 2.6 Middle 13,930 5.9 79.7 11.6 2.9 High 18,390 6.0 82.6 8.8 2.6 Combined 7,280 3.5 ! 81.1 11.2 4.2
Student enrollment Less than 100 6,600 4.3 83.4 9.1 3.3 100–199 6,480 3.7 85.8 7.4 3.1 ! 200–499 37,140 6.6 78.9 11.5 3.0 500–749 21,830 6.8 81.1 9.3 2.8 750–999 8,680 9.6 79.8 9.1 1.5 1,000 or more 9,080 9.2 78.0 10.3 2.5
Percent of K–12 students who were approved for free or reduced-price lunches 0–34 26,840 2.6 91.7 3.4 2.3 35–49 14,850 4.1 88.0 6.1 1.8 50–74 23,010 4.8 82.4 10.1 2.7 75 or more 22,020 16.3 57.8 22.0 3.9 School did not participate in free or reduced-price lunch program 3,090 4.0 87.7 3.6 4.7 ! See notes at end of table.

7
Table 1. Total number of school principals and percentage distribution of school principals, by race/ethnicity, school type, and selected school characteristics: 2011–12–Continued
School type and selected school characteristic
Total number of principals
Percent of principals by race/ethnicity Hispanic,
regardless of race
White, non-Hispanic
Black or African American,
non-Hispanic Other1 All private schools 25,730 3.3 87.3 6.8 2.5
School classification Catholic 6,760 4.3 90.4 3.2 2.1 ! Other religious 12,590 2.6 86.2 8.5 2.6 Nonsectarian 6,380 3.7 ! 86.2 7.2 2.9 !
Community type City 8,590 5.1 79.6 11.0 4.3 Suburban 8,110 3.1 89.0 5.7 2.1 ! Town 2,630 ‡ 93.6 5.1 ! ‡ Rural 6,390 2.1 ! 92.9 3.3 ! 1.7 !
School level Elementary 14,510 3.6 86.6 7.0 2.8 Secondary 2,660 4.8 90.3 2.4 ! ‡ Combined 8,570 2.4 ! 87.6 7.9 2.1 !
Student enrollment Less than 100 12,740 3.0 83.7 10.1 3.2 100–199 5,060 4.8 87.8 5.1 2.3 ! 200–499 6,150 3.2 ! 92.1 2.6 ! 2.1 ! 500–749 1,090 ‡ 95.4 ‡ ‡ 750 or more 690 ‡ 94.9 ‡ # # Rounds to zero. ! Interpret data with caution. The coefficient of variation (CV) for this estimate is between 30 percent and 50 percent (i.e., the standard error is at least 30 percent and less than 50 percent of the estimate). ‡ Reporting standards not met. The coefficient of variation (CV) for this estimate is 50 percent or greater (i.e., the standard error is 50 percent or more of the estimate). 1 Other includes American Indian/Alaska Native, non-Hispanic; Asian, non-Hispanic; Native Hawaiian or Other Pacific Islander, non-Hispanic; and two or more races, non-Hispanic. NOTE: Hispanic includes Latino. Detail may not sum to totals because of rounding. SOURCE: U.S. Department of Education, National Center for Education Statistics, Schools and Staffing Survey (SASS), “Public School Principal and Private School Principal Data Files,” 2011–12.

8
Table 2. Average and median age of school principals, and percentage distribution of principals, by age category, sex, school type, and selected school characteristics: 2011–12
School type and selected school characteristic
Average age of principals
Median age of principals
Percent of principals by Age Sex
Less than 45 years 45–54 years
55 years or more Male Female
All schools 49 48 37.4 31.1 31.6 47.6 52.4
All public schools 48 47 39.7 33.1 27.1 48.4 51.6
School classification Traditional public 48 47 39.3 33.5 27.2 48.5 51.5 Charter school 46 45 47.9 27.1 25.0 46.5 53.5
Community type City 48 47 40.4 31.0 28.6 40.5 59.5 Suburban 48 47 40.5 32.2 27.3 45.1 54.9 Town 48 47 39.0 34.9 26.2 51.5 48.5 Rural 48 47 38.9 34.9 26.2 56.0 44.0
School level Primary 48 47 39.6 32.2 28.1 36.2 63.8 Middle 47 46 44.4 34.2 21.5 57.7 42.3 High 49 48 36.8 35.5 27.8 69.9 30.1 Combined 48 47 39.1 31.7 29.3 60.4 39.6
Student enrollment Less than 100 50 50 35.3 31.1 33.6 51.2 48.8 100–199 48 47 35.3 38.0 26.6 56.3 43.7 200–499 48 47 41.1 32.3 26.6 45.9 54.1 500–749 48 47 39.4 34.1 26.5 42.8 57.2 750–999 48 47 41.8 32.0 26.3 46.5 53.5 1,000 or more 48 47 39.4 33.5 27.1 65.9 34.1
Percent of K–12 students who were approved for free or reduced-price lunches 0–34 48 47 41.0 32.9 26.1 52.6 47.4 35–49 48 48 38.7 33.8 27.5 54.0 46.0 50–74 48 47 38.5 34.4 27.1 45.7 54.3 75 or more 48 47 40.9 31.8 27.4 42.1 57.9 School did not participate in free or reduced-price lunch program 49 48 35.3 32.5 32.2 50.1 49.9
See notes at end of table.

9
Table 2. Average and median age of school principals, and percentage distribution of principals, by age category, sex, school type, and selected school characteristics: 2011–12—Continued
School type and selected school characteristic
Average age of principals
Median age of principals
Percent of principals by Age Sex
Less than 45 years 45–54 years
55 years or more Male Female
All private schools 52 53 29.1 23.7 47.1 44.6 55.4
School classification Catholic 54 56 17.7 27.1 55.2 25.1 74.9 Other religious 50 50 36.5 22.6 40.9 58.6 41.4 Nonsectarian 53 54 26.6 22.4 51.0 37.7 62.3
Community type City 53 54 24.6 25.2 50.2 39.1 60.9 Suburban 53 55 22.6 24.7 52.7 37.2 62.8 Town 51 51 28.9 26.6 44.5 37.4 62.6 Rural 48 47 43.6 19.4 37.0 64.6 35.4
School level Elementary 52 52 28.5 25.2 46.3 34.9 65.1 Secondary 53 55 23.1 25.5 51.3 57.1 42.9 Combined 51 53 32.0 20.8 47.2 57.3 42.7
Student enrollment Less than 100 49 49 38.4 21.9 39.6 43.1 56.9 100–199 53 55 20.7 26.2 53.1 38.0 62.0 200–499 54 55 20.3 25.2 54.5 46.0 54.0 500–749 55 57 12.8 27.6 59.7 65.1 34.9 750 or more 54 55 23.6 21.0 55.4 77.4 22.6 NOTE: Detail may not sum to totals because of rounding. SOURCE: U.S. Department of Education, National Center for Education Statistics, Schools and Staffing Survey (SASS), “Public School Principal and Private School Principal Data Files,” 2011–12.

10
Table 3. Percentage distribution of school principals, by highest degree earned, school type, and selected school characteristics: 2011–12 School type and selected school characteristic Bachelor’s degree or less Master’s degree
Education specialist or professional diploma1
Doctorate or first professional degree
All schools 8.6 59.0 22.7 9.7
All public schools 2.2 61.7 26.2 9.9
School classification Traditional public 1.4 61.8 26.8 10.0 Charter school 16.5 59.2 16.4 8.0
Community type City 3.6 59.4 24.7 12.3 Suburban 1.2 59.0 26.9 12.9 Town 2.5 ! 61.4 29.1 7.0 Rural 1.7 65.9 25.8 6.6
School level Primary 1.7 62.8 26.1 9.3 Middle 1.8 62.6 26.2 9.4 High 2.3 58.3 27.0 12.4 Combined 5.7 61.1 25.2 8.1
Student enrollment Less than 100 8.7 59.1 26.0 6.2 100–199 4.8 67.7 23.9 3.7 200–499 1.8 64.0 25.8 8.4 500–749 ‡ 59.6 26.7 12.8 750–999 1.6 ! 59.3 28.5 10.6 1,000 or more 0.8 ! 57.3 26.4 15.5
Percent of K–12 students who were approved for free or reduced-price lunches 0–34 0.9 59.1 28.2 11.8 35–49 1.6 ! 63.8 27.9 6.7 50–74 1.0 ! 65.1 25.4 8.6 75 or more 4.3 61.2 23.1 11.5 School did not participate in free or reduced-price lunch program 10.1 52.9 30.3 6.7
See notes at end of table.

11
Table 3. Percentage distribution of school principals, by highest degree earned, school type, and selected school characteristics: 2011–12—Continued School type and selected school characteristic Bachelor’s degree or less Master’s degree
Education specialist or professional diploma1
Doctorate or first professional degree
All private schools 31.0 49.7 10.1 9.1
School classification Catholic 7.9 72.5 13.5 6.1 Other religious 46.2 37.0 7.5 9.4 Nonsectarian 25.6 50.9 11.8 11.7
Community type City 20.9 56.7 10.1 12.3 Suburban 26.3 52.4 11.1 10.2 Town 38.2 47.6 9.5 ! 4.8 ! Rural 47.7 37.8 9.3 5.1
School level Elementary 34.8 50.3 9.2 5.7 Secondary 9.1 57.1 15.4 18.3 Combined 31.5 46.6 10.0 11.9
Student enrollment Less than 100 49.7 34.8 8.5 7.0 100–199 20.0 60.7 10.8 8.5 200–499 8.8 67.3 12.9 11.0 500–749 ‡ 64.0 11.2 20.1 750 or more 7.8 ! 67.2 8.9 ! 16.1 ! ! Interpret data with caution. The coefficient of variation (CV) for this estimate is between 30 percent and 50 percent (i.e., the standard error is at least 30 percent and less than 50 percent of the estimate). ‡ Reporting standards not met. The coefficient of variation (CV) for this estimate is 50 percent or greater (i.e., the standard error is 50 percent or more of the estimate). 1 At least 1 year beyond the master’s level. NOTE: Detail may not sum to totals because of rounding. SOURCE: U.S. Department of Education, National Center for Education Statistics, Schools and Staffing Survey (SASS), “Public School Principal and Private School Principal Data Files,” 2011–12.

12
Table 4. Average annual salary for school principals, by years of experience as a principal, school type, and selected school characteristics: 2011–12 School type and selected school characteristic Average annual salary
Average annual salary for principals by years of experience Less than 3 years 3 to 9 years 10 years or more
All schools $85,400 $78,300 $87,100 $88,300
All public schools 90,500 83,500 90,900 96,000
School classification Traditional public 91,100 84,000 91,500 96,300 Charter school 80,100 76,800 79,800 86,200
Community type City 95,900 89,000 97,800 99,200 Suburban 101,600 93,800 101,200 108,900 Town 82,900 78,100 81,500 89,300 Rural 80,200 72,400 80,800 85,800
School level Primary 89,200 82,600 89,100 94,800 Middle 91,900 86,100 93,200 95,800 High 97,000 88,500 97,300 103,100 Combined 80,800 74,100 81,200 86,900
Student enrollment Less than 100 76,200 67,200 77,300 83,900 100–199 77,800 71,800 78,000 83,400 200–499 88,600 83,000 88,500 93,800 500–749 93,000 86,000 92,400 98,800 750–999 96,300 90,200 97,800 100,200 1,000 or more 106,400 97,900 107,000 112,300
Percent of K–12 students who were approved for free or reduced-price lunches 0–34 98,100 89,800 98,100 103,500 35–49 88,800 83,100 88,000 95,300 50–74 84,800 80,300 85,000 88,600 75 or more 89,400 82,700 91,200 93,700 School did not participate in free or reduced-price lunch program 83,400 72,900 84,600 92,200
See notes at end of table.

13
Table 4. Average annual salary for school principals, by years of experience as a principal, school type, and selected school characteristics: 2011–12—Continued School type and selected school characteristic Average annual salary
Average annual salary for principals by years of experience Less than 3 years 3 to 9 years 10 years or more
All private schools $65,300 $53,100 $64,300 $70,900
School classification Catholic 63,800 59,300 64,200 65,400 Other religious 52,700 38,800 50,900 60,600 Nonsectarian 88,000 76,800 88,800 90,800
Community type City 72,500 61,100 71,100 78,200 Suburban 68,000 58,300 67,500 71,700 Town 45,100 40,900 49,400 43,900 Rural 58,000 38,000 55,100 67,600
School level Elementary 60,400 52,900 58,300 65,000 Secondary 84,900 70,000 82,100 91,400 Combined 66,900 49,500 68,000 73,700
Student enrollment Less than 100 47,700 39,900 49,200 50,900 100–199 60,800 54,100 62,100 62,600 200–499 85,000 78,400 81,200 88,700 500–749 100,300 82,200 100,200 103,400 750 or more 121,600 124,100 113,400 126,800 NOTE: Principals who reported an annual salary of zero are excluded from the table. SOURCE: U.S. Department of Education, National Center for Education Statistics, Schools and Staffing Survey (SASS), “Public School Principal and Private School Principal Data Files,” 2011–12.
14
Table 5. Average hours per week that school principals spent on all school-related activities and interacting with students, by school type and selected school characteristics: 2011–12
School type and selected school characteristic
Average hours per week1 All school-related activities Interacting with students
All schools 57.0 22.2
All public schools 58.1 22.5
School classification Traditional public 58.0 22.4 Charter school 59.2 23.2
Community type City 59.5 23.3 Suburban 58.0 20.8 Town 58.2 23.9 Rural 56.9 22.6
School level Primary 57.7 21.1 Middle 58.3 23.1 High 59.8 25.3 Combined 55.7 23.6
Student enrollment Less than 100 50.4 20.8 100–199 55.1 23.4 200–499 58.2 22.7 500–749 58.7 22.2 750–999 59.8 21.7 1,000 or more 61.8 23.2
Percent of K–12 students who were approved for free or reduced-price lunches 0–34 58.1 20.4 35–49 58.9 23.2 50–74 57.6 23.3 75 or more 58.9 24.1 School did not participate in free or reduced-price lunch program 50.8 19.2
See notes at end of table.

15
Table 5. Average hours per week that school principals spent on all school-related activities and interacting with students, by school type and selected school characteristics: 2011–12—Continued
School type and selected school characteristic
Average hours per week1 All school-related activities Interacting with students
All private schools 53.2 21.2
School classification Catholic 56.7 19.6 Other religious 51.8 22.8 Nonsectarian 52.3 19.6
Community type City 55.1 19.4 Suburban 54.1 21.0 Town 50.9 22.0 Rural 50.5 23.5
School level Elementary 53.4 20.8 Secondary 56.1 22.1 Combined 52.0 21.4
Student enrollment Less than 100 49.6 23.7 100–199 54.9 20.3 200–499 57.8 18.1 500–749 57.7 15.1 750 or more 60.2 16.9 1 Includes hours spent during the school day, before and after school, and on the weekends. SOURCE: U.S. Department of Education, National Center for Education Statistics, Schools and Staffing Survey (SASS), “Public School Principal and Private School Principal Data Files,” 2011–12.
16
Table 6. Average total years of experience as a school principal, average years as a principal at current school, and percentage distribution of principals, by reported years of experience as a principal at current school, school type, and selected school characteristics: 2011–12
Percent of principals by reported years of experience at current school School type and selected school characteristic
Average total years of experience
Average years at current school Less than 2 years 2–3 years 4–9 years 10 years or more
All schools 8.0 4.9 30.8 21.6 32.5 15.2
All public schools 7.2 4.2 32.5 22.8 33.5 11.2
School classification Traditional public 7.2 4.2 32.1 22.7 33.9 11.4 Charter school 5.9 3.3 40.4 24.8 27.2 7.6
Community type City 6.8 3.9 36.1 22.0 31.9 10.1 Suburban 7.3 4.2 31.2 22.2 36.6 10.0 Town 7.3 4.6 29.8 24.0 31.5 14.6 Rural 7.3 4.3 31.8 23.4 33.2 11.6
School level Primary 7.3 4.3 30.5 22.9 35.0 11.6 Middle 6.5 4.0 35.3 21.1 34.0 9.6 High 7.2 4.0 34.1 24.7 30.9 10.3 Combined 7.0 4.2 36.7 20.5 29.3 13.5
Student enrollment Less than 100 7.3 3.8 41.2 23.1 25.3 10.5 100–199 7.1 4.6 30.9 22.0 34.1 13.0 200–499 7.1 4.3 32.5 23.0 32.6 11.9 500–749 7.4 4.2 30.3 22.3 36.2 11.2 750–999 6.7 4.0 33.2 23.6 32.9 10.3 1,000 or more 7.1 3.9 32.1 22.6 37.2 8.2
Percent of K–12 students who were approved for free or reduced-price lunches 0–34 7.7 4.4 28.5 22.6 37.0 11.8 35–49 7.2 4.3 30.9 22.6 35.1 11.4 50–74 7.2 4.3 32.6 24.4 30.7 12.4 75 or more 6.5 3.7 37.6 21.5 32.1 8.8 School did not participate in free or reduced-price lunch program 7.0 4.2 38.3 22.1 26.6 12.9
See notes at end of table.

17
Table 6. Average total years of experience as a school principal, average years as a principal at current school, and percentage distribution of principals, by reported years of experience as a principal at current school, school type, and selected school characteristics: 2011–12—Continued
Percent of principals by reported years of experience at current school School type and selected school characteristic
Average total years of experience
Average years at current school Less than 2 years 2–3 years 4–9 years 10 years or more
All private schools 10.8 7.4 24.7 17.5 28.8 29.1
School classification Catholic 10.5 6.3 25.1 20.1 31.5 23.4 Other religious 10.1 6.9 28.2 17.9 26.4 27.6 Nonsectarian 12.7 9.5 17.4 13.8 30.7 38.1
Community type City 11.0 7.6 22.0 17.7 29.8 30.5 Suburban 11.8 8.2 22.8 15.5 30.8 30.9 Town 10.2 6.4 28.0 17.8 29.2 25.0 Rural 9.7 6.5 29.4 19.5 24.6 26.5
School level Elementary 10.6 7.0 26.4 19.1 29.1 25.4 Secondary 11.0 7.6 22.8 13.4 ! 32.2 31.6 Combined 11.2 8.0 22.4 16.0 27.2 34.5
Student enrollment Less than 100 9.9 7.4 27.1 18.1 26.3 28.5 100–199 10.5 6.5 23.7 18.7 31.6 26.1 200–499 12.3 7.6 22.9 15.1 31.5 30.5 500–749 13.7 9.2 20.0 13.5 28.6 37.8 750 or more 13.4 8.2 10.7 ! 23.8 29.7 35.8 ! Interpret data with caution. The coefficient of variation (CV) for this estimate is between 30 percent and 50 percent (i.e., the standard error is at least 30 percent and less than 50 percent of the estimate). NOTE: Years of experience do not include the current school year. Detail may not sum to totals because of rounding. SOURCE: U.S. Department of Education, National Center for Education Statistics, Schools and Staffing Survey (SASS), “Public School Principal and Private School Principal Data Files,” 2011–12.

18
Table 7. Percentage of school principals who thought they had a major influence on decisions concerning various activities at their school, by school type and selected school characteristics: 2011–12
School type and selected school characteristic
Setting performance standards for
students Establishing
curriculum
Determining the content of in-service
professional development
programs for teachers
Evaluating teachers
Hiring new full-time
teachers
Setting discipline
policy
Deciding how their school
budget will be spent
All schools 75.2 49.2 71.6 93.5 85.3 80.3 64.0
All public schools 73.6 43.2 69.8 96.2 85.1 79.8 64.1
School classification Traditional public 72.9 42.1 69.3 96.4 84.9 79.7 64.7 Charter school 87.0 64.2 77.7 92.8 88.6 81.1 53.2
Community type City 77.3 38.9 73.6 95.7 82.0 78.8 69.1 Suburban 71.7 36.2 66.8 95.3 83.3 80.5 64.5 Town 71.9 47.2 68.0 96.3 88.1 80.6 64.2 Rural 73.1 50.6 69.9 97.4 87.8 79.6 59.9
School level Primary 73.1 39.5 69.7 96.6 83.5 81.1 66.8 Middle 76.3 39.7 68.7 96.8 88.8 80.6 66.3 High 73.3 49.3 69.8 95.5 87.5 77.6 60.7 Combined 72.9 59.1 72.3 94.1 83.0 74.7 50.3
Student enrollment Less than 100 69.4 56.4 65.7 94.1 79.9 74.9 60.6 100–199 76.7 59.7 71.7 96.3 91.4 84.0 57.8 200–499 74.6 43.0 68.6 97.3 84.9 80.5 63.5 500–749 72.6 36.7 70.5 96.0 83.2 79.8 64.1 750–999 75.1 40.3 73.0 95.8 87.1 80.8 70.1 1,000 or more 71.6 40.6 70.9 94.3 87.8 76.6 68.1
Percent of K–12 students who were approved for free or reduced-price lunches 0–34 72.6 40.4 70.7 96.7 87.0 81.2 64.5 35–49 70.6 41.3 69.4 96.8 87.4 80.1 63.1 50–74 73.2 43.2 69.6 96.6 87.2 79.8 64.1 75 or more 76.8 46.2 68.4 95.0 78.7 79.0 63.2 School did not participate in free or reduced-price lunch program 78.5 54.7 74.7 95.8 88.0 71.4 72.5
See notes at end of table.

19
Table 7. Percentage of school principals who thought they had a major influence on decisions concerning various activities at their school, by school type and selected school characteristics: 2011–12—Continued
School type and selected school characteristic
Setting performance standards for
students Establishing
curriculum
Determining the content of in-service
professional development
programs for teachers
Evaluating teachers
Hiring new full-time
teachers
Setting discipline
policy
Deciding how their school
budget will be spent
All private schools 80.6 70.4 78.5 83.7 85.8 81.9 63.4
School classification Catholic 86.2 70.2 84.6 94.3 97.6 90.6 67.1 Other religious 75.5 68.7 73.5 77.5 76.1 77.5 55.3 Nonsectarian 84.9 73.8 81.0 84.4 91.8 81.2 75.0
Community type City 88.0 76.5 79.6 87.7 89.9 85.4 65.4 Suburban 86.8 75.3 84.3 88.5 91.2 88.9 65.8 Town 77.7 68.4 73.9 85.2 88.2 82.0 66.8 Rural 64.2 56.6 70.2 70.8 71.6 68.0 56.1
School level Elementary 77.5 65.8 77.5 84.6 85.8 82.5 61.8 Secondary 87.8 75.8 77.1 84.2 92.3 82.9 71.2 Combined 83.7 76.4 80.7 82.1 83.8 80.5 63.6
Student enrollment Less than 100 73.3 66.6 72.6 80.1 78.4 76.8 58.5 100–199 85.2 71.8 80.7 91.8 91.2 89.1 64.1 200–499 88.7 74.6 86.0 86.2 94.9 85.9 72.7 500–749 91.5 76.6 86.1 80.2 93.4 91.2 63.7 750 or more 93.0 81.8 82.0 72.6 86.7 70.8 62.1 NOTE: Response options included “no influence,” “minor influence,” “moderate influence,” “major influence,” and “not applicable.” Principals who reported “not applicable” are excluded from the table. SOURCE: U.S. Department of Education, National Center for Education Statistics, Schools and Staffing Survey (SASS), “Public School Principal and Private School Principal Data Files,” 2011–12.

Appendix A: Standard Error Tables
A-1

A-2
Table A-1. Standard errors for Table 1: Total number of school principals and percentage distribution of school principals, by race/ethnicity, school type, and selected school characteristics: 2011–12
School type and selected school characteristic
Total number of principals
Percent of principals by race/ethnicity Hispanic,
regardless of race
White, non-Hispanic
Black or African American,
non-Hispanic Other All schools 789 0.39 0.56 0.35 0.26
All public schools 406 0.46 0.66 0.43 0.29
School classification Traditional public 306 0.46 0.66 0.42 0.30 Charter school 214 3.02 3.11 2.66 1.71
Community type City 274 1.30 1.77 1.36 0.75 Suburban 356 0.75 1.23 0.92 0.50 Town 341 1.13 1.27 0.79 0.77 Rural 430 0.44 0.67 0.46 0.33
School level Primary 417 0.72 0.96 0.67 0.44 Middle 177 0.57 1.08 0.85 0.46 High 477 0.61 0.92 0.70 0.44 Combined 631 1.70 1.91 1.18 0.97
Student enrollment Less than 100 402 0.92 1.73 1.51 0.97 100–199 355 1.07 2.08 1.44 1.11 200–499 682 0.78 1.12 0.82 0.55 500–749 599 0.94 1.19 0.95 0.49 750–999 446 1.51 1.75 1.19 0.41 1,000 or more 352 1.27 1.80 1.07 0.52
Percent of K–12 students who were approved for free or reduced-price lunches 0–34 649 0.44 0.72 0.42 0.40 35–49 554 0.90 1.38 0.92 0.41 50–74 541 0.84 1.31 1.07 0.56 75 or more 643 1.56 1.85 1.40 0.78 School did not participate in free or reduced-price lunch program 259 1.11 2.45 0.97 1.65 See notes at end of table.

A-3
Table A-1. Standard errors for Table 1: Total number of school principals and percentage distribution of school principals, by race/ethnicity, school type, and selected school characteristics: 2011–12—Continued
School type and selected school characteristic
Total number of principals
Percent of principals by race/ethnicity Hispanic,
regardless of race
White, non-Hispanic
Black or African American,
non-Hispanic Other All private schools 605 0.56 1.08 0.75 0.50
School classification Catholic 39 1.08 1.60 0.93 0.82 Other religious 605 0.71 1.51 1.12 0.72 Nonsectarian 72 1.25 2.15 1.46 1.04
Community type City 267 1.16 2.04 1.42 1.08 Suburban 298 0.92 1.69 1.11 0.71 Town 323 † 2.86 2.54 † Rural 510 0.90 1.45 1.16 0.71
School level Elementary 505 0.70 1.28 0.88 0.66 Secondary 138 1.40 2.14 1.20 † Combined 210 0.83 1.94 1.57 0.80
Student enrollment Less than 100 575 0.80 1.71 1.27 0.82 100–199 277 1.34 1.83 1.21 1.07 200–499 241 0.99 1.43 0.84 0.78 500–749 118 † 1.89 † † 750 or more 75 † 2.75 † † † Not applicable. SOURCE: U.S. Department of Education, National Center for Education Statistics, Schools and Staffing Survey (SASS), “Public School Principal and Private School Principal Data Files,” 2011–12.
A-4
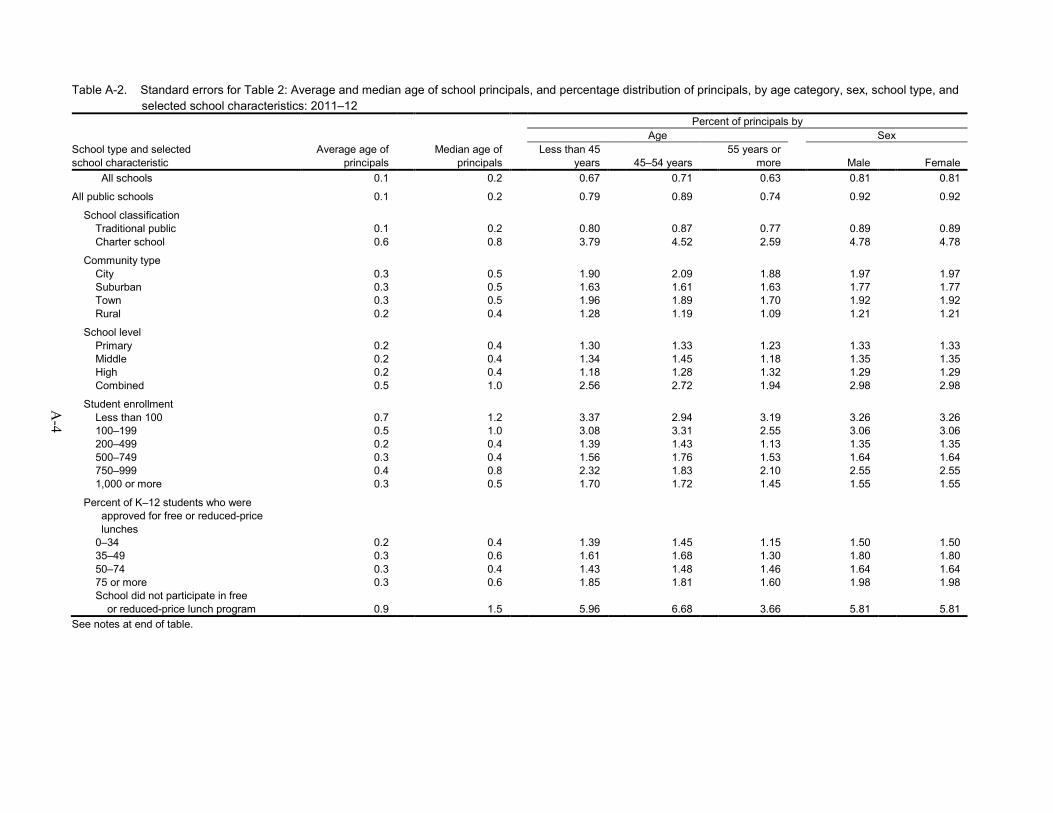
Table A-2. Standard errors for Table 2: Average and median age of school principals, and percentage distribution of principals, by age category, sex, school type, and selected school characteristics: 2011–12
School type and selected school characteristic
Average age of principals
Median age of principals
Percent of principals by Age Sex
Less than 45 years 45–54 years
55 years or more Male Female
All schools 0.1 0.2 0.67 0.71 0.63 0.81 0.81
All public schools 0.1 0.2 0.79 0.89 0.74 0.92 0.92
School classification Traditional public 0.1 0.2 0.80 0.87 0.77 0.89 0.89 Charter school 0.6 0.8 3.79 4.52 2.59 4.78 4.78
Community type City 0.3 0.5 1.90 2.09 1.88 1.97 1.97 Suburban 0.3 0.5 1.63 1.61 1.63 1.77 1.77 Town 0.3 0.5 1.96 1.89 1.70 1.92 1.92 Rural 0.2 0.4 1.28 1.19 1.09 1.21 1.21
School level Primary 0.2 0.4 1.30 1.33 1.23 1.33 1.33 Middle 0.2 0.4 1.34 1.45 1.18 1.35 1.35 High 0.2 0.4 1.18 1.28 1.32 1.29 1.29 Combined 0.5 1.0 2.56 2.72 1.94 2.98 2.98
Student enrollment Less than 100 0.7 1.2 3.37 2.94 3.19 3.26 3.26 100–199 0.5 1.0 3.08 3.31 2.55 3.06 3.06 200–499 0.2 0.4 1.39 1.43 1.13 1.35 1.35 500–749 0.3 0.4 1.56 1.76 1.53 1.64 1.64 750–999 0.4 0.8 2.32 1.83 2.10 2.55 2.55 1,000 or more 0.3 0.5 1.70 1.72 1.45 1.55 1.55
Percent of K–12 students who were approved for free or reduced-price lunches 0–34 0.2 0.4 1.39 1.45 1.15 1.50 1.50 35–49 0.3 0.6 1.61 1.68 1.30 1.80 1.80 50–74 0.3 0.4 1.43 1.48 1.46 1.64 1.64 75 or more 0.3 0.6 1.85 1.81 1.60 1.98 1.98 School did not participate in free or reduced-price lunch program 0.9 1.5 5.96 6.68 3.66 5.81 5.81 See notes at end of table.
A-5
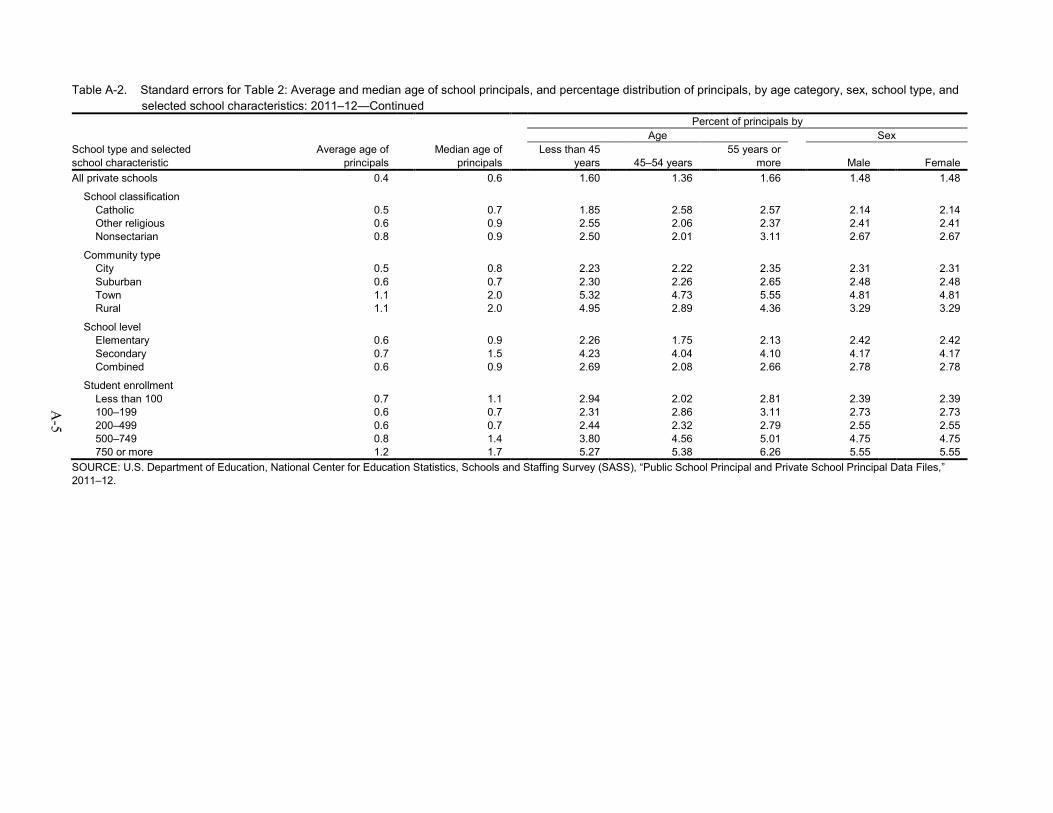
Table A-2. Standard errors for Table 2: Average and median age of school principals, and percentage distribution of principals, by age category, sex, school type, and selected school characteristics: 2011–12—Continued
School type and selected school characteristic
Average age of principals
Median age of principals
Percent of principals by Age Sex
Less than 45 years 45–54 years
55 years or more Male Female
All private schools 0.4 0.6 1.60 1.36 1.66 1.48 1.48
School classification Catholic 0.5 0.7 1.85 2.58 2.57 2.14 2.14 Other religious 0.6 0.9 2.55 2.06 2.37 2.41 2.41 Nonsectarian 0.8 0.9 2.50 2.01 3.11 2.67 2.67
Community type City 0.5 0.8 2.23 2.22 2.35 2.31 2.31 Suburban 0.6 0.7 2.30 2.26 2.65 2.48 2.48 Town 1.1 2.0 5.32 4.73 5.55 4.81 4.81 Rural 1.1 2.0 4.95 2.89 4.36 3.29 3.29
School level Elementary 0.6 0.9 2.26 1.75 2.13 2.42 2.42 Secondary 0.7 1.5 4.23 4.04 4.10 4.17 4.17 Combined 0.6 0.9 2.69 2.08 2.66 2.78 2.78
Student enrollment Less than 100 0.7 1.1 2.94 2.02 2.81 2.39 2.39 100–199 0.6 0.7 2.31 2.86 3.11 2.73 2.73 200–499 0.6 0.7 2.44 2.32 2.79 2.55 2.55 500–749 0.8 1.4 3.80 4.56 5.01 4.75 4.75 750 or more 1.2 1.7 5.27 5.38 6.26 5.55 5.55 SOURCE: U.S. Department of Education, National Center for Education Statistics, Schools and Staffing Survey (SASS), “Public School Principal and Private School Principal Data Files,” 2011–12.
A-6
Table A-3. Standard errors for Table 3: Percentage distribution of school principals, by highest degree earned, school type, and selected school characteristics: 2011–12
School type and selected school characteristic Bachelor’s degree or less Master’s degree
Education specialist or professional diploma
Doctorate or first professional degree
All schools 0.52 0.63 0.45 0.44
All public schools 0.30 0.71 0.54 0.49
School classification Traditional public 0.24 0.71 0.57 0.51 Charter school 3.26 3.65 2.79 1.85
Community type City 0.76 1.76 1.42 1.15 Suburban 0.27 1.42 1.15 0.99 Town 0.79 1.94 1.74 0.81 Rural 0.33 0.99 0.91 0.66
School level Primary 0.35 1.08 0.81 0.82 Middle 0.45 1.18 1.06 0.77 High 0.45 1.25 1.15 0.88 Combined 1.58 2.40 2.28 1.58
Student enrollment Less than 100 1.87 2.62 2.02 1.22 100–199 1.09 2.68 2.42 0.77 200–499 0.41 1.14 1.07 0.77 500–749 † 1.59 1.35 1.17 750–999 0.71 2.38 2.14 1.54 1,000 or more 0.26 1.80 1.44 1.23
Percent of K–12 students who were approved for free or reduced-price lunches 0–34 0.23 1.23 1.13 0.92 35–49 0.62 1.84 1.80 0.69 50–74 0.33 1.28 1.18 0.85 75 or more 0.87 1.88 1.28 1.10 School did not participate in free or reduced-price lunch program 2.98 5.14 4.22 1.31 See notes at end of table.

A-7
Table A-3. Standard errors for Table 3: Percentage distribution of school principals, by highest degree earned, school type, and selected school characteristics: 2011–12—Continued
School type and selected school characteristic Bachelor’s degree or less Master’s degree
Education specialist or professional diploma
Doctorate or first professional degree
All private schools 1.73 1.49 0.80 0.87
School classification Catholic 1.71 2.45 1.67 1.11 Other religious 2.75 2.08 1.18 1.47 Nonsectarian 2.43 3.04 1.72 1.55
Community type City 2.16 2.60 1.39 2.05 Suburban 2.27 2.20 1.34 1.94 Town 5.31 5.43 3.17 2.19 Rural 3.97 3.29 1.77 1.18
School level Elementary 2.23 1.92 1.06 0.80 Secondary 2.19 4.60 2.71 4.83 Combined 2.43 2.33 1.65 1.42
Student enrollment Less than 100 2.70 2.27 1.25 1.44 100–199 2.61 3.04 2.10 1.45 200–499 1.70 2.94 1.68 2.45 500–749 † 4.86 3.05 4.79 750 or more 3.14 5.71 3.47 5.08 † Not applicable. SOURCE: U.S. Department of Education, National Center for Education Statistics, Schools and Staffing Survey (SASS), “Public School Principal and Private School Principal Data Files,” 2011–12.
A-8
Table A-4. Standard errors for Table 4: Average annual salary for school principals, by years of experience as a principal, school type, and selected school characteristics: 2011–12
School type and selected school characteristic Average annual salary
Average annual salary for principals by years of experience Less than 3 years 3 to 9 years 10 years or more
All schools 330 870 570 770
All public schools 250 790 440 690
School classification Traditional public 230 720 470 720 Charter school 2,220 4,140 2,380 3,520
Community type City 570 1,640 850 1,450 Suburban 460 1,080 820 1,180 Town 550 1,670 690 1,170 Rural 360 810 660 940
School level Primary 370 940 660 1,150 Middle 420 880 610 1,170 High 680 1,220 990 1,170 Combined 1,470 3,590 1,600 1,400
Student enrollment Less than 100 1,240 2,430 1,730 2,870 100–199 1,170 2,780 1,290 3,070 200–499 360 1,010 680 1,060 500–749 640 1,330 860 1,190 750–999 870 2,170 1,380 1,440 1,000 or more 590 1,380 970 1,430
Percent of K–12 students who were approved for free or reduced-price lunches 0–34 490 1,080 740 1,110 35–49 640 1,490 1,020 1,080 50–74 640 1,390 830 1,380 75 or more 700 1,720 960 1,540 School did not participate in free or reduced-price lunch program 2,360 3,740 3,760 4,820
See notes at end of table.

A-9
Table A-4. Standard errors for Table 4: Average annual salary for school principals, by years of experience as a principal, school type, and selected school characteristics: 2011–12—Continued
School type and selected school characteristic Average annual salary
Average annual salary for principals by years of experience Less than 3 years 3 to 9 years 10 years or more
All private schools 1,160 2,470 2,890 1,770
School classification Catholic 920 1,720 1,960 1,670 Other religious 2,010 2,390 5,330 3,440 Nonsectarian 2,780 6,860 5,610 4,310
Community type City 2,090 3,510 3,520 4,140 Suburban 2,450 3,380 6,570 2,450 Town 2,290 5,810 3,770 3,850 Rural 2,710 3,880 6,640 4,420
School level Elementary 1,160 2,480 1,840 1,900 Secondary 6,940 5,840 15,060 8,840 Combined 2,290 5,180 5,140 3,470
Student enrollment Less than 100 1,070 2,430 2,250 1,760 100–199 1,570 3,370 2,550 2,590 200–499 3,230 4,840 9,670 5,080 500–749 6,360 5,550 16,890 7,540 750 or more 7,750 20,970 15,810 12,450 SOURCE: U.S. Department of Education, National Center for Education Statistics, Schools and Staffing Survey (SASS), “Public School Principal and Private School Principal Data Files,” 2011–12.

A-10
Table A-5. Standard errors for Table 5: Average hours per week that school principals spent on all school-related activities and interacting with students, by school type and selected school characteristics: 2011–12
School type and selected school characteristic
Average hours per week All school-related activities Interacting with students
All schools 0.20 0.20
All public schools 0.23 0.23
School classification Traditional public 0.23 0.22 Charter school 1.28 1.22
Community type City 0.63 0.52 Suburban 0.34 0.41 Town 0.54 0.63 Rural 0.32 0.33
School level Primary 0.34 0.33 Middle 0.29 0.38 High 0.41 0.46 Combined 0.88 0.99
Student enrollment Less than 100 0.89 0.95 100–199 0.87 0.75 200–499 0.42 0.39 500–749 0.42 0.44 750–999 0.51 0.58 1,000 or more 0.39 0.54
Percent of K–12 students who were approved for free or reduced-price lunches 0–34 0.33 0.32 35–49 0.48 0.56 50–74 0.36 0.42 75 or more 0.56 0.61 School did not participate in free or reduced-price lunch program 1.97 1.78
See notes at end of table.

A-11
Table A-5. Standard errors for Table 5: Average hours per week that school principals spent on all school-related activities and interacting with students, by school type and selected school characteristics: 2011–12—Continued
School type and selected school characteristic
Average hours per week All school-related activities Interacting with students
All private schools 0.51 0.43
School classification Catholic 0.49 0.69 Other religious 0.85 0.66 Nonsectarian 0.84 0.87
Community type City 0.49 0.59 Suburban 0.66 0.73 Town 1.45 1.63 Rural 1.40 1.28
School level Elementary 0.64 0.56 Secondary 0.95 1.36 Combined 0.80 0.70
Student enrollment Less than 100 0.88 0.73 100–199 0.68 0.92 200–499 0.56 0.61 500–749 1.24 1.53 750 or more 1.93 1.69 SOURCE: U.S. Department of Education, National Center for Education Statistics, Schools and Staffing Survey (SASS), “Public School Principal and Private School Principal Data Files,” 2011–12.

A-12
Table A-6. Standard errors for Table 6: Average total years of experience as a school principal, average years as a principal at current school, and percentage distribution of principals, by reported years of experience as a principal at current school, school type, and selected school characteristics: 2011–12
Percent of principals by reported years of experience at current school School type and selected school characteristic
Average total years of experience
Average years at current school Less than 2 years 2–3 years 4–9 years 10 years or more
All schools 0.09 0.07 0.72 0.51 0.71 0.52
All public schools 0.09 0.07 0.78 0.59 0.76 0.54
School classification Traditional public 0.09 0.07 0.84 0.60 0.80 0.55 Charter school 0.39 0.27 4.98 4.11 2.66 1.93
Community type City 0.21 0.15 1.79 1.54 1.59 1.17 Suburban 0.21 0.14 1.73 1.21 1.51 0.86 Town 0.24 0.16 2.11 1.87 1.71 1.25 Rural 0.15 0.12 1.25 1.04 1.24 0.86
School level Primary 0.15 0.11 1.22 0.93 1.27 0.84 Middle 0.15 0.10 1.21 1.02 1.33 0.75 High 0.18 0.11 1.27 1.00 0.96 0.80 Combined 0.29 0.21 2.78 2.57 2.25 1.56
Student enrollment Less than 100 0.46 0.27 2.89 2.12 2.49 1.66 100–199 0.44 0.38 2.64 2.73 3.17 2.21 200–499 0.17 0.13 1.48 1.13 1.31 0.92 500–749 0.20 0.12 1.55 1.37 1.68 1.02 750–999 0.26 0.18 2.34 1.93 2.06 1.30 1,000 or more 0.19 0.12 1.59 1.54 1.75 0.85
Percent of K–12 students who were approved for free or reduced-price lunches 0–34 0.18 0.12 1.31 1.14 1.32 0.92 35–49 0.21 0.15 1.89 1.39 1.88 1.14 50–74 0.21 0.17 1.68 1.31 1.55 1.08 75 or more 0.20 0.13 1.48 1.23 1.55 1.04 School did not participate in free or reduced-price lunch program 0.58 0.40 5.79 5.04 4.48 2.62
See notes at end of table.

A-13
Table A-6. Standard errors for Table 6: Average total years of experience as a school principal, average years as a principal at current school, and percentage distribution of principals, by reported years of experience as a principal at current school, school type, and selected school characteristics: 2011–12—Continued
Percent of principals by reported years of experience at current school School type and selected school characteristic
Average total years of experience
Average years at current school Less than 2 years 2–3 years 4–9 years 10 years or more
All private schools 0.31 0.25 1.41 1.38 1.53 1.57
School classification Catholic 0.47 0.36 2.30 2.26 2.30 2.56 Other religious 0.47 0.40 2.29 2.03 2.20 2.34 Nonsectarian 0.64 0.53 2.04 1.78 2.65 2.68
Community type City 0.53 0.43 1.66 1.80 2.61 2.59 Suburban 0.49 0.39 2.00 1.95 2.49 2.12 Town 1.00 0.73 5.21 4.08 5.38 4.63 Rural 0.76 0.62 4.31 3.70 3.19 3.46
School level Elementary 0.39 0.33 1.81 2.06 1.96 2.08 Secondary 0.89 0.55 3.43 4.31 4.25 4.26 Combined 0.57 0.47 2.24 1.86 2.09 2.71
Student enrollment Less than 100 0.50 0.43 2.52 2.21 2.38 2.41 100–199 0.49 0.42 2.63 2.53 2.96 3.09 200–499 0.59 0.42 2.13 2.52 3.13 2.56 500–749 0.96 0.92 4.49 3.56 5.61 5.63 750 or more 1.25 0.98 4.79 5.43 5.93 6.21 SOURCE: U.S. Department of Education, National Center for Education Statistics, Schools and Staffing Survey (SASS), “Public School Principal and Private School Principal Data Files,” 2011–12.

A-14
Table A-7. Standard errors for Table 7: Percentage of school principals who thought they had a major influence on decisions concerning various activities at their school, by school type and selected school characteristics: 2011–12
School type and selected school characteristic
Setting performance standards for
students Establishing
curriculum
Determining the content of in-service
professional development
programs for teachers
Evaluating teachers
Hiring new full-time
teachers
Setting discipline
policy
Deciding how their school
budget will be spent
All schools 0.69 0.69 0.78 0.40 0.59 0.63 0.68
All public schools 0.74 0.83 0.79 0.26 0.53 0.66 0.75
School classification Traditional public 0.76 0.79 0.76 0.24 0.54 0.68 0.75 Charter school 2.59 4.61 4.69 1.91 3.86 2.95 6.72
Community type City 1.59 1.85 1.63 0.62 1.15 1.52 1.71 Suburban 1.63 1.71 1.29 0.65 1.13 1.22 1.49 Town 1.74 1.80 2.24 0.88 1.93 1.59 1.87 Rural 1.08 1.39 1.31 0.39 0.99 1.02 1.12
School level Primary 1.15 1.24 1.15 0.40 0.76 0.95 1.23 Middle 1.07 1.37 1.28 0.52 0.94 0.93 1.47 High 1.16 1.36 1.11 0.51 0.79 1.08 0.98 Combined 2.67 2.72 3.12 1.58 2.62 2.92 4.29
Student enrollment Less than 100 2.66 3.08 2.78 1.79 2.63 2.57 2.71 100–199 2.14 3.00 2.71 0.99 1.18 2.00 3.02 200–499 1.10 1.22 1.16 0.36 0.98 1.03 1.19 500–749 1.58 1.55 1.68 0.69 1.24 1.41 1.70 750–999 1.95 2.42 2.12 0.92 1.81 1.69 2.60 1,000 or more 1.51 1.81 1.78 0.71 1.17 1.55 1.48
Percent of K–12 students who were approved for free or reduced-price lunches 0–34 1.37 1.33 1.11 0.46 0.90 0.96 1.27 35–49 1.90 1.98 1.76 0.54 1.42 1.78 1.62 50–74 1.34 1.68 1.43 0.61 1.02 1.20 1.48 75 or more 1.51 1.81 1.47 0.83 1.48 1.47 1.51 School did not participate in free or reduced-price lunch program 2.80 6.28 4.68 1.39 5.59 4.87 4.60
See notes at end of table.

A-15
Table A-7. Standard errors for Table 7: Percentage of school principals who thought they had a major influence on decisions concerning various activities at their school, by school type and selected school characteristics: 2011–12—Continued
School type and selected school characteristic
Setting performance standards for
students Establishing
curriculum
Determining the content of in-service
professional development
programs for teachers
Evaluating teachers
Hiring new full-time
teachers
Setting discipline
policy
Deciding how their school
budget will be spent
All private schools 1.50 1.71 1.52 1.44 1.55 1.33 1.49
School classification Catholic 1.91 2.55 1.94 1.08 0.87 1.45 2.34 Other religious 2.67 2.79 2.59 2.64 2.78 2.43 2.45 Nonsectarian 1.86 2.83 1.99 2.01 1.68 2.34 2.46
Community type City 1.54 2.04 2.28 2.10 1.71 1.62 2.04
Suburban 1.39 1.73 1.62 1.35 1.29 1.46 2.39 Town 4.31 5.61 5.22 3.50 3.50 3.68 4.48 Rural 4.22 3.95 4.09 3.71 4.21 3.26 4.04
School level Elementary 2.27 2.24 2.07 2.01 2.04 1.79 2.13 Secondary 2.24 3.92 3.91 4.47 3.34 3.95 3.30 Combined 2.21 2.58 2.47 1.91 2.26 2.24 2.47
Student enrollment Less than 100 2.58 2.60 2.52 2.34 2.59 2.36 2.71 100–199 2.05 2.43 2.82 1.49 1.44 1.98 2.75 200–499 1.63 2.64 2.33 2.62 1.61 2.38 2.47 500–749 2.88 4.40 3.72 4.14 2.53 3.43 4.70 750 or more 3.52 4.22 4.75 4.98 4.50 6.22 5.95 SOURCE: U.S. Department of Education, National Center for Education Statistics, Schools and Staffing Survey (SASS), “Public School Principal and Private School Principal Data Files,” 2011–12.

Appendix B: Methodology and Technical Notes
B-1

Overview of the Schools and Staffing Survey The Schools and Staffing Survey (SASS) is sponsored by the National Center for Education Statistics (NCES) of the Institute of Education Sciences within the U.S. Department of Education and is conducted by the U.S. Census Bureau. SASS is a nationally representative sample survey of public and private K–12 schools, principals, and teachers in the 50 states and the District of Columbia. School districts associated with public schools and library media centers in public schools are also part of SASS. SASS has been conducted seven times: in school years 1987–88, 1990–91, 1993–94, 1999–2000, 2003–04, 2007–08, and 2011–12.
The 2011–12 SASS consisted of questionnaires for five types of respondents: school districts (public), schools (public and private), principals (public and private), teachers (public and private), and school library media centers (public). Modified versions of the public school principal, public school, and public school teacher questionnaires that incorporated wording and questions appropriate for private school settings were sent to private schools. Charter schools and schools in single-school districts received a modified public school questionnaire that included both district and school items.
For public schools, information can be linked across teachers and their principals, schools, library media centers, and districts. For private schools, information can be linked across teachers and their principals and schools. For the content of the questionnaires, see http://nces.ed.gov/surveys/sass/questionnaire.asp. Appendix C of this report provides information about how the SASS data files used to produce this report were created.
SASS was designed to produce national, regional, and state estimates for public elementary and secondary schools, school districts, principals, teachers, and school library media centers; and national and regional estimates for public charter schools, as well as principals, teachers, and school library media centers within these schools. For private schools, the sample supports national, regional, and affiliation strata estimates for schools, principals, and teachers. Comparisons between public and private schools and their principals and teachers are possible only at the regional and national levels, because private schools were selected for sampling by affiliation strata and region rather than by state.
The teacher survey was designed to support comparisons between new and experienced teachers (3 years or less of experience vs. more than 3 years of experience) at the state level for public school teachers and at the regional or affiliation strata level for private school teachers.
This appendix includes information on all components of SASS. For additional information on the specific SASS-related topics discussed in this appendix, consult the Survey Documentation for the 2011–12 Schools and Staffing Survey (Chambers et al. forthcoming) or the User’s Manual for the 2011–12 Schools and Staffing Survey Volumes 1–6 (Goldring et al. 2013). To access additional general information on SASS or for electronic copies of the questionnaires, go to the SASS home page (http://nces.ed.gov/surveys/sass).
Sampling Frames and Sample Selection
Public schools. The starting point for the 2011–12 SASS public school sampling frame was the preliminary 2009–10 Common Core of Data (CCD) Nonfiscal School Universe data file.1 The sampling frame was adjusted from the CCD in order to fit the definition of a school eligible for SASS. To be eligible for SASS, a school was defined as an institution or part of an institution that provides classroom
1 For more information about the CCD, see http://nces.ed.gov/ccd/.
B-2

instruction to students, has one or more teachers to provide instruction, serves students in one or more of grades 1–12 or the ungraded equivalent, and is located in one or more buildings apart from a private home. It was possible for two or more schools to share the same building; in that case, they were treated as different schools if they had different administrators (i.e., principal or school head).
The SASS 2011–12 universe of schools is confined to the 50 states plus the District of Columbia and excludes the other jurisdictions, Department of Defense overseas schools, Bureau of Indian Education schools, and CCD schools that do not offer teacher-provided classroom instruction in grades 1–12 or the ungraded equivalent. This last group includes schools that are essentially administrative units that may oversee entities that provide classroom instruction or may only provide funding and oversight.
The SASS definition of a school is generally similar to the CCD definition, with some exceptions. Because SASS allows schools to define themselves, Census Bureau staff observed that schools generally report as one entity in situations where the administration of two or more schools reported separately on CCD is the same. Thus, CCD schools with the same location, address, and phone number were collapsed during the SASS frame building on the assumption that the respondent would consider them to be one school. A set of rules was applied in certain states to determine in which instances school records should be collapsed together. When school records were collapsed together, the student and teacher counts, grade ranges, and names as reported to CCD were all modified to reflect the change.
Finally, additional school records were added to the sampling frame. Most of these records were for alternative, special education, or juvenile justice facilities in California, Pennsylvania, and New York.2 For a detailed list of frame modifications, see the Survey Documentation for the 2011–12 Schools and Staffing Survey (Chambers et al. forthcoming). After deleting, collapsing, and adding school records, the SASS public school sampling frame consisted of about 90,530 traditional public schools and 5,080 public charter schools.
SASS uses a stratified, probability proportionate to size (PPS) sample (for an explanation of PPS sampling, see Cochran, 1977). The first level of stratification was school type: (1) schools in a subset of the states where counties are the school districts (Florida, Maryland, Nevada, and West Virginia) so that each of these districts had school(s) selected; (2) public charter schools; and (3) all other traditional public schools. The second-level stratification was state and school district for type 1 schools, and states or groups of states for type 2 and 3 schools. Each of the school types was then stratified by grade level (elementary, secondary, and combined for public charter schools; primary, middle, high, and combined for traditional public schools). Within each stratum, schools were sorted prior to sampling by state, community type (12 categories), collapsed ZIP code, percent free or reduced-price lunch (2 categories), highest grade in the school, percent minority enrollment (4 categories), and enrollment. The measure of size used for the schools was the square root of the number of full-time-equivalent teachers reported or imputed for each school during sampling frame development. If a school’s measure of size was greater than the sampling interval, the school was included in the sample with certainty. Each stratum was assigned a sample size to meet the defined precision goals of the survey. For example, for public primary schools, the goal was 15 percent or lower for coefficient of variation (CV) for national, regional, and state estimates for key characteristics. These sampling procedures resulted in a total public school sample of about 10,250 traditional public schools and 750 public charter schools.
Private schools. The 2011–12 SASS private school frame was based on the 2009–10 Private School Universe Survey (PSS) as updated for the 2011–12 PSS.3 That update is conducted prior to each
2 In the 2007–08 SASS, records for Career Technical Centers (CTCs) were added to the frame because they were believed to be underrepresented in CCD. In 2011–12 SASS, special handling of CTCs was not deemed necessary. However, CTCs listed in CCD that met the SASS eligibility criteria were included on the SASS sampling frame. 3 For more information about the PSS, see http://nces.ed.gov/surveys/pss.
B-3

administration of PSS by collecting membership lists from private school associations and religious denominations, as well as private school lists from state education departments. The 2011–12 SASS private school frame was further augmented by the inclusion of additional schools that were identified through the 2009–10 PSS area frame data collection; these area frame schools were included in the SASS sample survey with certainty. Schools with kindergarten as the highest grade level were deleted from the frame to fit the SASS definition. After these changes, the private school sampling frame consisted of about 28,490 private schools.
Private schools were stratified by affiliation strata, grade level (elementary, secondary, and combined), and Census region (Northeast, Midwest, South, and West). The 11 affiliation strata included 3 strata for Catholic (parochial, diocesan, and private); Baptist; Jewish; Lutheran; Seventh-day Adventist; other religious; and 3 strata for nonsectarian (regular, special emphasis, and special education). Within each stratum, private schools in the list frame were sorted prior to sampling by: state, highest grade in the school, community type (12 categories), ZIP code, and enrollment. The measure of size and PPS procedures described for public schools were used for private schools as well. Of the 3,000 private schools sampled for the 2011–12 SASS, about 2,750 were from the list frame and about 250 were from the 2009–10 PSS area frame.
Public school districts. Since the SASS sample design calls for schools to be selected first, the public school district sample consists of the districts that were associated with the schools in the public school sample. This provides the linkage between the district and the school. In Florida, Maryland, Nevada, and West Virginia, school sampling was done in such a way that all districts were taken with certainty. About 5,800 public school districts were pulled into the sample by being associated with sampled public schools.
Teachers. Teachers are defined as staff members who teach regularly scheduled classes to students in any of grades K–12. Teacher Listing Forms (i.e., teacher rosters) were collected from sampled schools and districts, primarily by mail, and compiled at the Census Bureau. This compilation was done on an ongoing basis throughout the roster collection period. Along with the names of teachers, sampled schools were asked to provide information about each teacher’s teaching experience (1st year, 2–3 years, 4–19 years, and 20 or more years), teaching status (full or part time), and subject matter taught (special education, general elementary, math, science, English/language arts, social studies, vocational/technical, or other).
Sampling was also done on an ongoing basis throughout the roster collection period. The Census Bureau first stratified teachers into four teacher strata: (1) beginning teachers (in their first year of teaching); (2) early-career teachers (in their second or third years of teaching), (3) mid-career teachers (in their 4th through 19th years of teaching), and (4) experienced teachers (in their 20th or later years of teaching). Beginning and early-career teachers were oversampled to improve the survey estimates for this subpopulation. Teachers within a school were sorted by the teacher stratum code, the subject matter taught, and the teacher line number code. The teacher line number is a unique number assigned to identify the individual within the teacher list. Within each teacher stratum in each school, teachers were selected systematically with equal probability.
So that a school would not be overburdened by sampling too large a proportion of its teachers, the maximum number of teachers per school was set at 20. About 20 percent of the eligible public schools and 28 percent of the eligible private schools did not provide teacher lists that could be used for sampling teachers. For these schools, no teachers were selected. About 51,100 public schools teachers and 7,100 private school teachers were sampled.
B-4

Principals. The principal of each sampled school was selected. About 14,000 school principals were sampled (10,250 traditional public school principals, 750 public charter school principals, and 3,000 private school principals).
Library media centers. A library media center in each sampled public school was also selected. Private schools were not included in the library media center survey. About 10,250 traditional public school and 750 public charter school library media centers were sampled.
For details on sampling at all levels, see the Survey Documentation for the 2011–12 Schools and Staffing Survey (Chambers et al. forthcoming).
Data Collection Procedures
In 2011–12, SASS employed a mail-based survey approach with subsequent telephone and in-person field follow-up. Prior to the beginning of data collection, research applications were submitted to public school districts that required applications to conduct research in their schools. Starting in June 2011, all districts were contacted by telephone to verify or collect the information about the district and sampled school(s) needed for data collection, identify the best person to receive the district questionnaire, and determine if the district would provide an electronic teacher list for sampled school(s). Survey packages were mailed to districts in October 2011.4 Follow-up was conducted sequentially by mail, telephone, and in person to districts that did not provide the requested questionnaire and/or teacher list.
In preparation for school-level data collection, advance letters were mailed to the sampled schools in June 2011 to verify their addresses. School packages were mailed in October 2011.5 Next, schools were telephoned using a computer-assisted telephone-interviewing instrument to verify school information, establish a survey coordinator (who became the main contact person at the school for subsequent communication), and follow up on the Teacher Listing Form if the school district had not already provided an electronic teacher list. Teacher questionnaires were mailed to schools on a flow basis as teachers were sampled on an ongoing basis from the data provided on the Teacher Listing Form or electronic teacher list. The field follow-up period was preceded by phone calls from the telephone centers to remind the survey coordinators to have staff complete and return all forms. Individual survey respondents (principal, librarian, and teachers) were also called from the telephone centers and asked to complete the questionnaire by phone. Data collection ended in June 2012.
Data Processing and Imputation
The Census Bureau used both central processing and headquarters staff to check returned questionnaires, key the data, and implement quality control procedures. Questionnaires that had a preliminary classification of a complete interview were submitted to a series of computer edits consisting of a range check, a consistency edit, a blanking edit,6 and a logic edit. After these edits were run and reviewed by analysts, the records were put through another edit to make a final determination as to whether the case
4 The SASS district package contained a cover letter, the School District Questionnaire, and postage-paid return envelope. Districts that indicated they would provide electronic list(s) of teachers for their selected school(s) received a letter that explained the purpose of the teacher list and provided instructions for uploading the file. In districts with only one school, the school received the Public School Questionnaire (With District Items) in lieu of the School District Questionnaire and School Questionnaire. 5 The SASS school package contained a cover letter to the principal, a cover letter to the survey coordinator, the Teacher Listing Form if the district could not provide it, the Public School Principal Questionnaire or Private School Principal Questionnaire, the Public School Questionnaire or Public School Questionnaire (With District Items) or Private School Questionnaire, the School Library Media Center Questionnaire (for public schools only), postage-paid return envelopes, and the Statistical Abstract of the United States: 2011 CD. 6 Blanking edits delete answers to questions that should not have been filled in (e.g., if a respondent followed a wrong skip pattern).
B-5

was eligible for the survey and whether sufficient data had been collected for the case to be classified as a complete interview.
After the final edits were run, cases with “not-answered” values for items remained. Values were imputed using two main approaches. Donor respondent methods, such as hot-deck imputation, were used. If no suitable donor case could be matched, the few remaining items were imputed using mean or mode from groups of similar cases to impute a value to the item with missing data. After each stage of imputation, computer edits were run again to verify that the imputed data were consistent with the existing questionnaire data. If that was not the case, an imputed value was blanked out by one of these computer edits due to inconsistency with other data within the same questionnaire or because it was out of the range of acceptable values. In these situations, Census Bureau analysts looked at the items and tried to determine an appropriate value. Edit and imputation flags, indicating which edit or imputation method was used, were assigned to each relevant survey variable. For further information, see the sections on data processing and imputation in the Survey Documentation for the 2011–12 Schools and Staffing Survey (Chambers et al. forthcoming).
Response Rates
Unit response rates. The unit response rate indicates the percentage of sampled cases that met the definition of a complete interview. The weighted SASS unit response rate was produced by dividing the weighted number of respondents who completed questionnaires by the weighted number of eligible sampled cases, using the initial base weight (the inverse of the probability of selection).7 Table B-1 summarizes the weighted unit response rates for each survey type. Because response rates vary between surveys, it is possible to not have information for all the components related to a particular school. For example, it is possible that a district does not have a corresponding school record or there may not be a principal record for every school.
Table B-1. Weighted unit and overall response rates using initial base weight, by survey: 2011–12
Survey Unit response rate
(percent) Overall response
rate (percent)
Public School Teacher Listing Form 79.6 † Private School Teacher Listing Form 71.6 †
Public School District 80.6 †
Public School 72.5 † Private School 65.7 †
Public School Principal 72.7 † Private School Principal 64.7 †
Public School Teacher 77.7 61.8 Private School Teacher 69.9 50.1
Public School Library Media Center 72.9 † † Not applicable. NOTE: Response rates were weighted using the inverse of the probability of selection (initial base weight). SOURCE: U.S. Department of Education, National Center for Education Statistics, Schools and Staffing Survey (SASS), “Public School and Private School Teacher Listing Forms; Public School District, Public School, Private School, Public School Principal, Private School Principal, Public School Teacher, Private School Teacher, and Public School Library Media Center Documentation Data Files,” 2011–12.
7 For the formula used to calculate the unit response rate, see NCES Statistical Standards (U.S. Department of Education 2003).
B-6

Overall response rates. The overall response rate represents the response rate to the survey taking into consideration each stage of the survey. For teachers, the overall response rate is calculated as the product of the response rate to two stages: the Teacher Listing Form and the teacher questionnaire.8 The weighted overall response rate using the initial base weight for public school teachers was 61.8 percent; and for private school teachers, 50.1 percent. For the other surveys, the overall and unit response rates are the same since these surveys have only one sampling stage.
Unit nonresponse bias analysis. Because the NCES Statistical Standards (4-4) require analysis of nonresponse bias for any survey stage with a base-weighted response rate less than 85 percent, all SASS files were evaluated for potential bias. For each survey, national-level estimates were first examined for potential bias. For public schools, principals, teachers, and library media centers, these national-level estimates were evaluated within charter and noncharter schools. Next, the base-weighted9 unit response rate was calculated by state or affiliation strata depending on the sector (public and private, respectively). If the base-weighted response rate for any state or affiliation stratum was below 85 percent, a detailed comparison of respondents to the frame population was conducted by examining characteristics. These characteristics were enrollment, community type, and school level for public school principals; school level and region for private school principals. A difference between the frame and respondent population was considered noteworthy if the difference was statistically significant and the following three conditions were met:
• The relative difference between the frame and respondent population was greater than 10 percent;
• The absolute difference was greater than one percentage point; and
• The cell for each subpopulation contained at least 30 interviews.
As shown in table B-1, the weighted response rate using the initial base weight was 80.6 percent for public school districts. The weighted response rate using the initial base weight was 72.5 percent for public schools and 65.7 percent for private schools. The weighted response rate using the initial base weight was 72.7 percent for public school principals and 64.7 percent for private school principals. Table B-2 contains a list of the comparisons between the frame and the weighted distribution where evidence of potential bias was found for national-level data on the public school principal file. Table B-3 contains a similar list for national-level data on the private school principal file. The weighted response rate using the initial base weight for the teacher listing form was 79.6 for public schools and 71.6 for private schools. The weighted questionnaire response rate using the initial base weight for the teacher survey was 77.7 percent for public school teachers and 69.9 percent for private school teachers. The weighted response rate using the initial base weight was 72.9 percent for public school library media centers.
Nonresponse adjustments were designed to reduce or eliminate nonresponse bias. The nonresponse-adjusted comparisons to the frame shown in tables B-2 and B-3 reflect the nonresponse adjustment. These tables show that there is no evidence of potential bias after nonresponse adjustments were made for the national-level items included in the analysis. For further information on unit response rates and nonresponse bias analysis, see the Survey Documentation for the 2011–12 Schools and Staffing Survey (Chambers et al. forthcoming).
8 For the formula used to calculate the overall response rate, see NCES Statistical Standards (U.S. Department of Education 2003). 9 Unit nonresponse bias analysis was conducted using the base weight, defined as the product of the initial base weight (the inverse of the probability of selection) and the sampling adjustment factor. The sampling adjustment factor is an adjustment that accounts for circumstances that affect the school’s probability of selection that are identified after the data collection has begun, such as a merger, duplication, or incorrect building-level collapsing (i.e., a junior high school and a senior high school merge to become a junior/senior high school).
B-7

Table B-2. Indication of potential sources of bias for public school principal data at the national level based on comparisons between frame distribution and base-weighted or nonresponse-adjusted respondent distributions: 2011–12
Potential source of bias
Base-weighted respondent distribution
Nonresponse-adjusted
respondent distribution Estimate level
School type (traditional or
charter) Characteristic Value National Traditional Community type (City) x National Traditional Community type (Town) x National Traditional Community type (Rural) x National Traditional Enrollment (1000 or more) x National Traditional Percent free lunch eligible (75% or more) x National Traditional Percent non-White (5–9%) x National Traditional Percent non-White (10–19%) x National Traditional Percent non-White (50% or more) x National Traditional Number of teachers (50–74) x NOTE: x denotes comparisons that are a potential source of bias. SOURCE: U.S. Department of Education, National Center for Education Statistics, Schools and Staffing Survey (SASS), “Public School Principal Documentation Data Files,” 2011–12.
Table B-3. Indication of potential sources of bias for private school principal data at the national level based on comparisons between frame distribution and base-weighted or nonresponse-adjusted respondent distributions: 2011–12
Potential source of bias
Base-weighted respondent distribution
Nonresponse
-adjusted respondent distribution Estimate level Characteristic Value
National Number of teachers (30–49) x National School level (Combined) x
National Affiliation (Catholic, Parochial) x National Affiliation (Catholic, Diocesan) x National Affiliation (Lutheran) x National Affiliation (Nonsectarian, Regular) x National Affiliation (Nonsectarian, Special Education) x National Affiliation (Other Religious) x NOTE: x denotes comparisons that are a potential source of bias. SOURCE: U.S. Department of Education, National Center for Education Statistics, Schools and Staffing Survey (SASS), “Private School Principal Documentation Data Files,” 2011–12.
Item response rates. The item response rate indicates the percentage of respondents who answered a given survey question or item. The weighted SASS item response rate is calculated by dividing the weighted number of respondents who provided an answer to an item by the weighted number of respondents who were eligible to answer that item.10 Table B-4 provides a brief summary of the weighted item response rates for each questionnaire. For the public and private school principal data, all survey items included in this report have item response rates of 85 percent or more.
10 For the formula to calculate the item response rate, see NCES Statistical Standards (U.S. Department of Education 2003).
B-8

Table B-4. Summary of weighted item response rates, by survey: 2011–12
Survey
Percent of items with a response rate of
85 percent or more
Percent of items with a response rate of
less than 85 percent
Public School District 100.0 0.0
Public School 96.2 3.8 Private School1 93.5 6.1
Public School Principal 98.9 1.1 Private School Principal 98.3 1.7
Public School Teacher 94.2 5.8
Private School Teacher 92.5 7.5
Public School Library Media Center 100.0 0.0 1 There was one item on the Private School Questionnaire that had 0 eligible respondents; thus, the response rate could not be calculated. For this reason, the percentages on this row do not sum to 100. NOTE: Detail may not sum to totals because of rounding. SOURCE: U.S. Department of Education, National Center for Education Statistics, Schools and Staffing Survey (SASS), “Public School and Private School Teacher Listing Forms; Public School District, Public School, Private School, Public School Principal, Private School Principal, Public School Teacher, Private School Teacher, and Public School Library Media Center Documentation Data Files,” 2011–12.
Weighting
The general purpose of weighting is to scale up the sample estimates to represent the target survey population. For SASS, a base weight is used as the starting point. In some cases, this base weight is the simple reciprocal of the unit’s probability of selection on the frame (the initial base weight), and in other cases, adjustments are made to this frame base weight to reflect multiple chances of selection from the frame or other situations such as subsampling.
Next, a series of nonresponse adjustment factors are calculated and applied based on a weighting cell adjustment. Weighting cells are developed using tree search algorithms. These cells are selected to be homogeneous in response propensity within cells and heterogeneous in response propensity across cells (response propensity is the underlying “chance” that a particular sample unit will respond by completing the questionnaire: its individual response rate). The adjustment is the inverse of the weighted response rate within each cell, and each respondent in the cell receives this adjustment. Nonrespondents are given weights of zero: the respondents are reweighted to represent the nonrespondents.
Finally, for some files, a ratio-adjustment factor is calculated and applied to the sample to adjust the sample totals to the frame totals. This improves the precision of survey estimates.
The product of these factors is the final weight for each SASS respondent, which appears as DFNLWGT on the SASS Public School District Data File, AFNLWGT on all SASS Principal Data Files, SFNLWGT on all SASS School Data Files, TFNLWGT on all SASS Teacher Data Files, and MFNLWGT on the SASS Library Media Center Data File.
The counts in table 1 (in the Estimate Tables section) do not necessarily match the frame counts because some cases in the frame were found to be ineligible (i.e., out of scope) and because not all data files (e.g., principal or library media center) are post-stratified to match the frame counts.
B-9

Variance Estimation
In surveys with complex sample designs, such as SASS, direct estimates of sampling errors that assume a simple random sample typically underestimate the variability in the estimates. The SASS sample design and estimation include procedures that deviate from the assumption of simple random sampling, such as stratifying the school sample, oversampling new teachers, and sampling with differential probabilities.
One method of calculating sampling errors of complex sample designs is replication. Replication methods involve constructing a number of subsamples (i.e., replicates) from the full sample and computing the statistic of interest for each replicate. The mean square error of the replicate estimates around the full sample estimate provides an estimate of the variance of the statistic. Each SASS data file includes a set of 88 replicate weights designed to produce variance estimates. The set of replicate weights for each file should be applied to the respondents in that file. The replicate weights for SASS respondents are DREPWT1–DREPWT88 for districts, AREPWT1–AREPWT88 for principals, SREPWT1–SREPWT88 for schools, TREPWT1–TREPWT88 for teachers, and MREPWT1–MREPWT88 for library media centers.
Reliability of Data
SASS estimates are based on samples. The sample estimates may differ somewhat from the values that would be obtained from the universe of respondents using the same questionnaire, instructions, and field representatives. The difference occurs because a sample survey estimate is subject to two types of errors: nonsampling and sampling. Estimates of the magnitude of sampling error for SASS data can be derived or calculated. Nonsampling errors are attributed to many sources, including definitional difficulties, the inability or unwillingness of respondents to provide correct information, differences in the interpretation of questions, an inability to recall information, errors made in collection (e.g., in recording or coding the data), errors made in processing the data, and errors made in estimating values for missing data. Quality control and edit procedures were used to reduce errors made by respondents, coders, and interviewers.
Caution Concerning Changes in Estimates
Care must be taken in estimating change over time in a SASS data element, because some of the measured change may not be attributable to a change in the education system.
Some of the change may be due to changes in the sampling frame, changes in questionnaire item wording, or other changes. For example, the definition of locale codes has undergone major changes since the 2000 Decennial Census. The first major change was an improvement in geocoding technology, which improved the assignment of specific addresses to physical locations. In 2005, a new locale code for CCD was implemented based on the new urban-centric method of classifying locale. Changes in how areas and, thus, schools are categorized may account for at least some changes that are noted from previous administrations.
B-10

Appendix C: Description of Data Files
C-1

Description of Data Files The 2011–12 Schools and Staffing Survey (SASS) data are being released in eight restricted-use data files. Those data files were created from nine survey questionnaires: the School District Questionnaire, School Questionnaire (public), Public School Questionnaire (With District Items),1 Private School Questionnaire, Principal Questionnaire (public), Private School Principal Questionnaire, Teacher Questionnaire (public), Private School Teacher Questionnaire, and Library Media Center Questionnaire (public). Table C-1 identifies each data file and the questionnaire data used to build the file.
Table C-1. Names of data files and the questionnaires from which the data were drawn: 2011–12
Data file Questionnaire source School district School District Questionnaire, Public School Questionnaire (With District Items)
Public school School Questionnaire, Public School Questionnaire (With District Items) Private school Private School Questionnaire
Public school principal Principal Questionnaire Private school principal Private School Principal Questionnaire
Public school teacher Teacher Questionnaire Private school teacher Private School Teacher Questionnaire
Public school library media center Library Media Center Questionnaire SOURCE: U.S. Department of Education, National Center for Education Statistics, Schools and Staffing Survey (SASS), 2011–12.
For the most part, there is a separate data file for each type of respondent (district, school, principal, teacher, and library media center) for each school sector (public2 and private). There are two exceptions: 1) there is no district file for private schools, and 2) there is no library media center file for private schools.
The Public School District Data File includes responses from school districts to the School District Questionnaire along with the “district items” taken from the Public School Questionnaire (With District Items) completed by the subset of public schools that were not associated with “traditional” school districts. These schools include state-run schools, traditional public schools in single-school districts, and independent charter schools. Rather than ask these public schools to complete two questionnaires, School and School District, the National Center for Education Statistics created the Public School Questionnaire (With District Items) to capture district data from these schools. Table C-2 shows the different respondents and questionnaires used to create the Public School District Data File. The “district items” gathered from the Public School Questionnaire (With District Items) were not placed on the Public School Data File.
1 The School Questionnaire (With District Items) is an expanded version of the Public School Questionnaire that includes items from the School District Questionnaire. 2 Public includes traditional public and public charter.
C-2
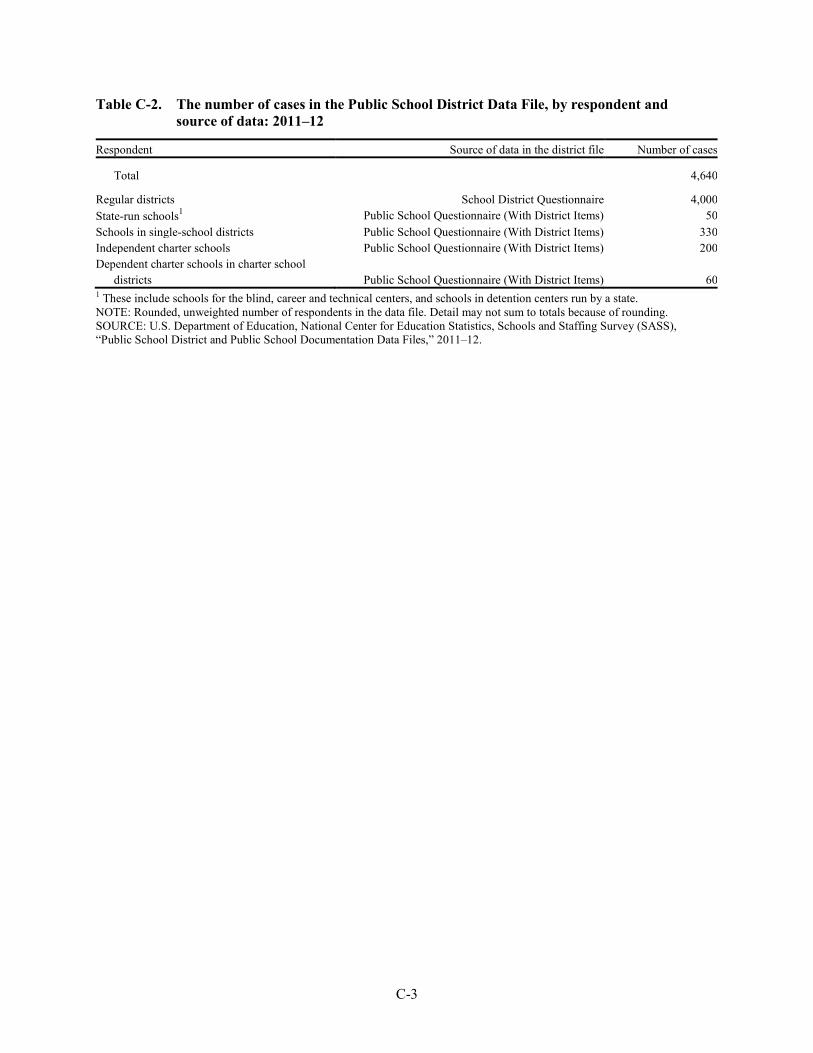
Table C-2. The number of cases in the Public School District Data File, by respondent and source of data: 2011–12
Respondent Source of data in the district file Number of cases
Total 4,640
Regular districts School District Questionnaire 4,000 State-run schools1
Public School Questionnaire (With District Items) 50 Schools in single-school districts Public School Questionnaire (With District Items) 330 Independent charter schools Public School Questionnaire (With District Items) 200 Dependent charter schools in charter school districts Public School Questionnaire (With District Items) 60 1 These include schools for the blind, career and technical centers, and schools in detention centers run by a state. NOTE: Rounded, unweighted number of respondents in the data file. Detail may not sum to totals because of rounding. SOURCE: U.S. Department of Education, National Center for Education Statistics, Schools and Staffing Survey (SASS), “Public School District and Public School Documentation Data Files,” 2011–12.
C-3

Appendix D: Description of Variables
D-1

Description of Variables The variables that are included in this report are listed in table D-1. Those with variable names that begin with “A” and are followed by four digits are survey variables that come from items on the principal questionnaires. For survey variables, the numeric part of the variable name can be found in the questionnaires to the left of the corresponding question. The variables without the letter plus four digit names are “created variables,” meaning they were created using survey variables, frame variables (variables taken from the sampling frame), other created variables, or a combination of these. They are frequently used in National Center for Education Statistics publications and have been added to the data files to facilitate data analysis. The definitions for the created variables follow table D-1. The variables without a variable name were created for the analyses in this report and are not on the data files.
Table D-1. Variables used in the Characteristics of Public and Private Elementary and Secondary School Principals in the United States: Results From the Schools and Staffing Survey report: 2011–12
Variable Variable name in
data file
Annual salary A0335
Charter school identifier1 CHARFLAG
Four-category school level1 SCHLEVE2
Highest degree earned A0058
Hours spent per week interacting with students A0241
Hours spent per week on all school-related activities A0240
Influence deciding how the school budget will be spent2 A0089
Influence determining content of in-service professional development programs for teachers2 A0085
Influence establishing curriculum2 A0084
Influence evaluating teachers2 A0086
Influence hiring new full-time teachers2 A0087
Influence setting discipline policy2 A0088
Influence setting performance standards for students2 A0083
Percentage of students in the school approved for the National School Lunch Program1 NSLAPP_S
Principal’s age1 AGE_P
Principal’s race/ethnicity1 Not in file
Principal’s sex A0320
Student enrollment in K–12 and ungraded1 SCHSIZE
Three-category private school typology1 RELIG See notes at end of table.
D-2

Table D-1. Variables used in the Characteristics of Public and Private Elementary and Secondary School Principals in the United States: Results From the Schools and Staffing Survey report: 2011–12—Continued
Variable Variable name in
data file
Three-category school level1 SCHLEVEL
Total years of experience as a school principal A0025
Total years of experience as a school principal at current school A0026
Urban-centric school locale code1 URBANS12 1 The definition for this variable can be found below. 2 Response categories include, “no influence,” “minor influence,” “moderate influence,” “major influence,” and “not applicable.” SOURCE: U.S. Department of Education, National Center for Education Statistics, Schools and Staffing Survey (SASS), “Public School Principal and Private School Principal Data Files,” 2011–12.
Charter school identifier (CHARFLAG): A flag variable taken from the Public School Data File that identifies charter schools. 1 = School is a public charter school, 2 = School is a traditional public school. A charter school is a public school that, in accordance with an enabling state statute, has been granted a charter exempting it from selected state or local rules and regulation. CHARFLAG is based on S0290 from the public school.
Four-category school level (SCHLEVE2): Taken from the Public School Data File, SCHLEVE2 is a four-category variable based on grades reported by the school: primary, middle, high, and combined. Primary schools are those with at least one grade lower than 5 and no grade higher than 8. Middle schools have no grade lower than 5 and no grade higher than 8. High schools have no grade lower than 7 and at least one grade higher than 8. Combined schools are those with at least one grade lower than 7 and at least one grade higher than 8, or with all students in ungraded classrooms.
Principal’s age (AGE_P): A variable based on a respondent’s reported year of birth. AGE_P is a continuous variable that was created by subtracting the principal’s reported year of birth (A0330) from the year of data collection (2011).
Principal’s race/ethnicity: A variable created for this analysis based on A0321— whether or not the principal is of Hispanic or Latino origin and A0322–A0326—the principal’s race. The following categories were created for analysis.
• Hispanic, regardless of race: the principal indicates he/she is of Hispanic or Latino origin (A0321 = 1).
• White, non-Hispanic: the principal indicates he/she is White (A0322 = 1), not of Hispanic or Latino origin (A0321=2), and does not consider him/herself to be any other race.
• Black or African-American, non-Hispanic: the principal indicates he/she is Black or African-American (A0323 = 1), not of Hispanic or Latino origin (A0321=2), and does not consider him/herself to be any other race.
• Other: the principal indicates he/she is Asian, Native Hawaiian or Other Pacific Islander, or American Indian or Alaska Native (A0324 = 1 or A0325 = 1 or A0326 = 1), or considers him/herself to be more than one race, and not of Hispanic or Latino origin (A0321=2).
D-3

Percentage of students in school approved for the National School Lunch Program (NSLAPP_S): Taken from the Public School Data File, NSLAPP_S is a continuous variable created by dividing the number of K–12 and ungraded students approved for free or reduced-price lunches (S0273) by the total number of K–12 and ungraded students enrolled (S0039) among schools that participated in the National School Lunch Program (NSLP) (S0272=1). Schools that did not participate in the NSLP have valid skip values. For this report, NSLAPP_S is recoded as a categorical variable describing the proportion of students approved for free or reduced-price lunches.
Student enrollment in K–12 and ungraded (SCHSIZE): Taken from the Public and Private School Data Files, SCHSIZE is a categorical variable based on the number of K–12 and ungraded students enrolled in the school (S0039). For this report, SCHSIZE was recoded into six categories for public schools and five categories for private schools.
Three-category private school typology (RELIG): Taken from the Private School Data File, RELIG is a three-category variable based on the variables that identify the religious or nonreligious orientation of a private school (S0738–S0762): Catholic, Other religious, or Nonsectarian.
Three-category school level (SCHLEVEL): Taken from the Public and Private School Data Files, SCHLEVEL is a three-category variable based on grades reported by the school: Elementary, secondary, and combined. Elementary schools are those with any of grades K–6 and none of grades 9–12. Secondary schools have any of grades 7–12 and none of grades K–6. Combined schools are those schools with grade levels in both elementary and secondary grade levels, or with all students in ungraded classrooms.
Urban-centric school locale code (URBANS12): Taken from the Public and Private School Data Files, URBANS12 is a created variable collapsed from the 12 category urban-centric school locale code (SLOCP12) which was assigned using the 2000 Decennial Census data and recoded into four categories: city, suburban, town, and rural.
D-4


![Journal of Computational Physicscaflisch/Pubs/Pubs2013-2014/DimitsLangevinJ… · which the present work based, is Langevin-equations based algorithms [9–12]. In this approach,](https://img.pdfslide.net/doc/110x75/5f41d1b91ec981083b4df80e/journal-of-computational-caflischpubspubs2013-2014dimitslangevinj-which-the.jpg)


![SynthesisofaNewCalix[4]Areneand ...downloads.hindawi.com/archive/2009/601089.pdfcharacteristics of the Ag+ ion-selective electrode were assessed according to the IUPAC recommendation](https://img.pdfslide.net/doc/110x75/5f87cc3c51b4e01afa751a5b/synthesisofanewcalix4areneand-characteristics-of-the-ag-ion-selective-electrode.jpg)