Embed Size (px)
Citation preview
J. Fluid Mech. In Press. 1
Characteristics of vortex packets inturbulent boundary layers
By BHARATHRAM GANAPATHISUBRAMANI,ELLEN K. LONGMIRE AND IVAN MARUSICDepartment of Aerospace Engineering and Mechanics, University of Minnesota,
107 Akerman Hall, 110 Union Street SE, Minneapolis, MN 55455, USAe-mail : [email protected]
(Received 07 August 2002 and in revised form 25 October 2002)
Stereoscopic PIV was used to measure all three instantaneous components of the velocityfield in streamwise-spanwise planes of a turbulent boundary layer at Reτ = 1060 (Reθ =2500). Datasets were obtained in the logarithmic layer and beyond. The vector fieldsin the log layer (z+ = 92 and 150) revealed signatures of vortex packets similar tothose proposed by Adrian and co-workers in their PIV experiments. Groups of legs ofhairpin vortices appeared to be coherently arranged along the streamwise direction. Theseregions also generated substantial Reynolds shear stress, sometimes as high as 40 times−uw. A feature extraction algorithm was developed to automate the identification andcharacterisation of these packets of hairpin vortices. Identified patches contributed 28%to −uw while occupying only 4% of the total area at z+ = 92. At z+ = 150, these patchesoccupied 4.5% of the total area while contributing 25% to −uw. Beyond the log layer(z+ = 198 and 530), the spatial organisation into packets is seen to break down.
1. IntroductionThe structure of the turbulent boundary layer has been the subject of much research
over the past 60 years because of its importance in practical applications. Some of thecurrent studies are aimed at developing models to represent the boundary layer efficientlyat higher Reynolds numbers. Various models have been proposed for a dominant structureincluding long quasi-streamwise vortices in the viscous buffer region (see Lyons, Hanratty& McLaughlin 1989 and Heist, Hanratty & Na 2000). However, a growing consensus isemerging for a model based on individual hairpin vortices (Theodorsen 1952) which isprobably the simplest structural model that explains most of the features observed inwall turbulence. The existence of asymmetric hairpins in the region above the viscouslayer was documented by Robinson (1991) in his analysis of early DNS results. Earlier,Offen & Kline (1975) used a hairpin model to explain the existence of ejections (Q2events, u < 0, w > 0), volumes of low speed fluid that are pushed away from the walland sweeps (Q4 events, u > 0, w < 0), volumes of faster fluid pushed towards the wall,in the logarithmic part of the boundary layer. In this paper u, v and w are defined asthe fluctuating velocity components in the streamwise (x), spanwise (y) and wall-normal(z) directions respectively. Willmarth & Lu (1971) and Blackwelder & Kaplan (1976),among others, documented that ejections and sweeps make a substantial contribution tothe Reynolds shear stress and therefore to the drag associated with the bounding surface.
Bandyopadhyay (1980) and Head & Bandyopadhyay (1981) proposed that hairpinvortices travel in groups after studying the flow visualisation experiments they performed
2 B. Ganapathisubramani, E. K. Longmire and I. Marusic
on a zero pressure gradient boundary layer. Theoretical studies by Smith et al. (1991) andthe study of DNS datasets at low Reynolds number (Reτ = δUτ/ν = 180, where δ is theboundary layer thickness, Uτ is the skin friction velocity and ν is the kinematic viscosity)performed by Zhou et al. (1999) demonstrated that a single vortex of sufficient circulationcould spawn a trailing group of hairpins that convected at the same speed as the leadingstructure. More recently, Adrian, Meinhart & Tomkins (2000b), who performed particleimage velocimetry (PIV) experiments in x−z planes of a zero pressure gradient boundarylayer over a Reynolds number range of 355 < Reτ < 2000, identified packets of hairpinvortex heads that appeared regularly in the near-wall and logarithmic layers. Groups of 5-10 hairpins, which extended over a length of 2δ, were determined to convect at a uniformstreamwise velocity. The authors noted also that the presence of vortex packets explainedthe multiple ejections associated with individual bursts observed by Bogard & Tiederman(1986). The elongated zones of uniform streamwise velocity associated with the packetsalso help explain the long tails in two-point correlations of streamwise velocity found inKovasznay, Kibens & Blackwelder (1970), Townsend (1976) and Brown & Thomas (1977).Recently, Christensen & Adrian (2001) with PIV data in x − z planes of channel flowat Reτ = 547 and 1734, used linear stochastic estimation to estimate the conditionallyaveraged velocity field associated with swirling motion. They concluded that the meanstructure consists of a series of swirling motions along a line inclined at 12◦ − 13◦ withthe wall which is consistent with the earlier observations of packets of hairpin vortices.An attached eddy model applied by Marusic (2001) also demonstrated that packets ofeddies were required in order to match measured boundary layer turbulence statisticsnear the wall.
In recent work similar to the present study (Tomkins & Adrian 2002, see also thethesis by Tomkins 2001), PIV measurements of streamwise-spanwise planes of a turbulentboundary layer at 430 < Reτ < 2270 (only in-plane velocity components were measured)showed long low streamwise momentum zones enveloped by positive and negative vortexcores representing packets of hairpin structures.
The objective of the current study was to apply the stereo PIV technique to examinex−y planes in the outer region of a zero pressure gradient boundary layer (z+ = zUτ/ν >60) in order to identify the typical structures and to determine their contribution to theReynolds shear stress, thereby investigating the role, if any, the packet structures play inthe transport of momentum in the boundary layers. Based on the previous work describedabove, feature identification algorithms were developed to search for individual hairpinvortices as well as packets of hairpins.
2. Facility and methods2.1. Experimental facility, methods and qualification
The measurements were carried out in a suction wind tunnel with working section of0.33 m height, 1.22 m width and 4.8 m length. The coordinate system used is depictedin figure 1. Measurement planes were located 3.3 m downstream of a trip wire in a zero-pressure-gradient flow with freestream velocity U∞ = 5.9 m s−1. Hot-wire measurementsshowed that the turbulence intensity in the freestream was less than 0.2%. The wall shearstress (τw) was computed using the mean velocity profile and the Clauser chart method.All quantities measured and computed are normalised using the skin friction velocity Uτ
(=√
τw/ρ, where ρ is the density of the fluid) and ν and are denoted with a superscript+. The Reynolds number based on the momentum thickness Reθ was 2500, and Reτ was1060. The value of δ in the region of the measurement planes was 69 mm.
Vortex packets in boundary layers 3
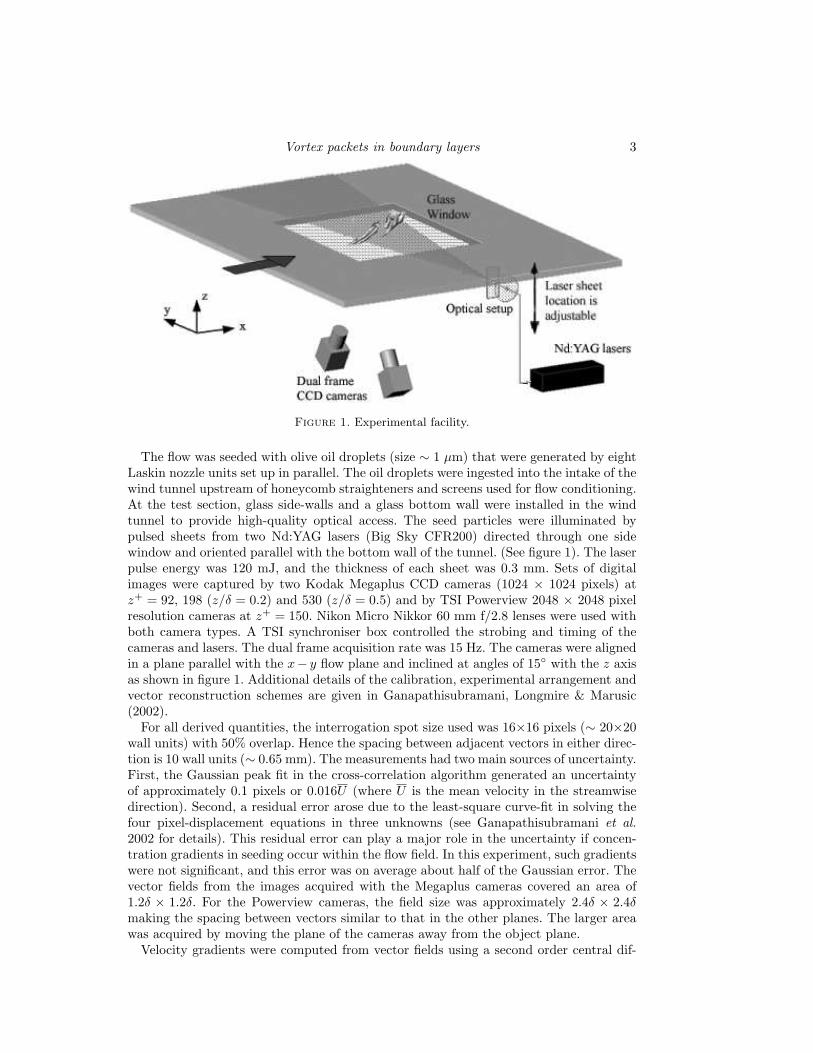
Figure 1. Experimental facility.
The flow was seeded with olive oil droplets (size ∼ 1 µm) that were generated by eightLaskin nozzle units set up in parallel. The oil droplets were ingested into the intake of thewind tunnel upstream of honeycomb straighteners and screens used for flow conditioning.At the test section, glass side-walls and a glass bottom wall were installed in the windtunnel to provide high-quality optical access. The seed particles were illuminated bypulsed sheets from two Nd:YAG lasers (Big Sky CFR200) directed through one sidewindow and oriented parallel with the bottom wall of the tunnel. (See figure 1). The laserpulse energy was 120 mJ, and the thickness of each sheet was 0.3 mm. Sets of digitalimages were captured by two Kodak Megaplus CCD cameras (1024 × 1024 pixels) atz+ = 92, 198 (z/δ = 0.2) and 530 (z/δ = 0.5) and by TSI Powerview 2048 × 2048 pixelresolution cameras at z+ = 150. Nikon Micro Nikkor 60 mm f/2.8 lenses were used withboth camera types. A TSI synchroniser box controlled the strobing and timing of thecameras and lasers. The dual frame acquisition rate was 15 Hz. The cameras were alignedin a plane parallel with the x− y flow plane and inclined at angles of 15◦ with the z axisas shown in figure 1. Additional details of the calibration, experimental arrangement andvector reconstruction schemes are given in Ganapathisubramani, Longmire & Marusic(2002).
For all derived quantities, the interrogation spot size used was 16×16 pixels (∼ 20×20wall units) with 50% overlap. Hence the spacing between adjacent vectors in either direc-tion is 10 wall units (∼ 0.65 mm). The measurements had two main sources of uncertainty.First, the Gaussian peak fit in the cross-correlation algorithm generated an uncertaintyof approximately 0.1 pixels or 0.016U (where U is the mean velocity in the streamwisedirection). Second, a residual error arose due to the least-square curve-fit in solving thefour pixel-displacement equations in three unknowns (see Ganapathisubramani et al.2002 for details). This residual error can play a major role in the uncertainty if concen-tration gradients in seeding occur within the flow field. In this experiment, such gradientswere not significant, and this error was on average about half of the Gaussian error. Thevector fields from the images acquired with the Megaplus cameras covered an area of1.2δ × 1.2δ. For the Powerview cameras, the field size was approximately 2.4δ × 2.4δmaking the spacing between vectors similar to that in the other planes. The larger areawas acquired by moving the plane of the cameras away from the object plane.
Velocity gradients were computed from vector fields using a second order central dif-

4 B. Ganapathisubramani, E. K. Longmire and I. Marusic
z+ Nt U+
u2+
v2+
w2+ −uw+ σωz
+
92 750 16.3 2.96 1.25 1.28 0.91 0.0422150 300 17.1 2.85 1.31 1.14 0.78 0.0378198 750 18.7 2.78 1.06 1.32 0.83 0.0334530 750 21.5 1.46 0.99 1.31 0.49 0.0212
Table 1. Ensemble averaged flow statistics. σωz is the r.m.s (root mean square) of the fluctuatingwall normal vorticity and Nt is the total number of PIV realisations included in the ensemble.
ference scheme wherever possible in the domain and a first order forward or backwarddifference at the boundaries. To identify swirling motion caused by the eddies in the flowfield, we used swirl strength λci (Zhou et al. 1999), which is defined as the magnitude ofthe imaginary part of the eigenvalue of the local velocity gradient tensor. Since the PIVimages were planar, we used only the in-plane gradients and formed a two dimensionalform of the tensor. Vortices could be identified by extracting iso-regions of λci (Adrian,Christensen & Liu 2000a).
The values of U computed from the PIV data at each wall-normal location agreed wellwith the hot-wire measurements. Table 1 shows a summary of some ensemble averagedturbulence statistics. The values shown compare well with previous data in the literature(Balint, Wallace & Vukoslavcevic 1991; Naguib & Wark 1992; Adrian et al. 2000b).
2.2. Feature extractionAlthough a variety of coherent structures can be found in a turbulent boundary layer, wefocus on the hairpin vortices discussed in the introduction. Since, the stereo PIV data areobtained in streamwise-spanwise planes, hairpin legs could appear as neighbouring coresof positive and negative wall-normal vorticity (ωz) aligned in the spanwise direction.If these hairpins were to travel in groups, one might also see multiple pairs of coresaligned approximately along the streamwise direction. Also, individual or groups of angledhairpins are expected to generate large values of instantaneous Reynolds shear stress(−uw+ = −uw/Uτ
2). Hence, an algorithm was developed to identify regions in which allof these events occur. In the algorithm description, the flow is assumed to be from leftto right :• Step 1: Regions of positive vorticity > 1.5σωz
+ and negative vorticity < −1.5σωz+
are detected. At z+ = 92, this value was ±0.065.• Step 2: Zones of strong Reynolds shear stress (−uw+) greater than 2σ−uw
+ (whereσ−uw
+ is the r.m.s of −uw+) are detected independently. No distinction is attached tosweep or ejection events. The values of σ−uw
+ at z+ = 92 and 150 were 3.43 and 2.68respectively.• Step 3: All the zones found in step 2 are searched to mark regions of high Reynolds
shear stress occurring between strips of positive and negative vorticity (found in step1) such that positive vorticity lies beneath negative vorticity. This vorticity arrangementwas chosen to fit the pattern displayed by the legs of a hairpin vortex.• Step 4: Each location of large −uw+ marked in step 3 is used as a seed point for a
region growing algorithm. This algorithm, based on the streamwise velocity, identifies aconnected region of neighbouring points lying within local thresholds such that the finalcoherent region is a patch of uniform momentum. The lower bound of the velocity wasfixed as the minimum velocity in the Reynolds shear stress zone and the upper boundwas the average velocity in the two surrounding vorticity regions. If multiple seed zonesare enveloped by the same vorticity regions, the thresholds are adjusted such that the
Vortex packets in boundary layers 5
lower bound is the minimum velocity in all the seed points of −uw+ in that region. Ifthe region growth from one location intersects the patches from other seed points, thenthey are merged and marked as one patch.• Step 5: After detection of all patches in a given vector field, patches that are
adjacent to one another along the streamwise direction are merged provided that thestreamwise distance between the patches is less than the average width of the patchesbeing merged.
3. Results and discussionPlease note that the flow is from left to right in all vector plots, and the local mean U
is subtracted from the vectors to clearly illustrate the slow and fast moving zones. Thecontour/vector plots shown in figure 2 are from individual realisations, but the patternsare representative of those found in many vector fields. The plots revealing the statisticalfeatures of the hairpin packets (figure 3) were obtained by investigating all vector fieldsat a given wall normal position.
3.1. Hairpin packetsExamples of packets found by the feature extraction algorithm at z+ = 92 and 150are shown in figure 2. Plots of instantaneous vorticity (ωz
+) and Reynolds shear stress(−uw+) at z+ = 92 are shown in figures 2(a) and 2(b). The ωz
+ plot clearly reveals apattern of cores of opposite sign of ωz
+ organised along the streamwise direction thatare indicative of hairpin legs intersecting the measurement plane. Contours of λci
+(notshown) were also studied and confirmed the presence of swirling motion corresponding tothe centres of blobs of vorticity. The region outlined in black (A) is the zone of uniformmomentum identified by the extraction algorithm. The presence of this zone sandwichedbetween the cores of positive and negative vorticity solidifies the claim that the hairpinvortices convect with similar speeds as part of a group. The Reynolds shear stress plotcontains values as large as 20Uτ
2 in the zone of uniform momentum between the vortexcores. Further, the negative direction of the vector arrows in the patch in combinationwith positive −uw+ values indicates the presence of a Q2 event where slow moving fluidis ejected away from the wall. The vorticity plot reveals at least five pairs of vortex coresaligned in the streamwise direction, and the −uw+ plot shows five distinct regions ofstrong −uw+ just upstream of a pair. These regions are likely caused by hairpins inclinedat an angle to the wall that eject fluid upward between their legs. Finally, note that thepacket extends all the way across the field (∼ 1.2δ). Additional plots of−uw+ (not shown)revealed values as high as 40U2
τ within packets compared with the mean value of only0.91U2
τ . Plots of complete fields depicting vorticity, swirl strength and Reynolds shearstress within and surrounding packets can be seen in Longmire, Ganapathisubramani &Marusic (2001).
Usually, the hairpin vortices observed have two legs. The legs may be aligned or some-what offset in streamwise location. Sometimes, the hairpins appear to have single legs orhave significant asymmetries in the strength of each leg (see the single negative vortexcore to the left of region marked (A) at x+ = 50 and y+ = 280). Although Robinson(1991) saw mostly single-legged hairpins in DNS datasets at low Reynolds numbers,Tomkins & Adrian (2002) in their PIV measurements of x− y planes at higher Reynoldsnumbers found both symmetric and asymmetric structures.
Figures 2(c) and 2(d) are larger views with plots of ωz+ and −uw+ at z+ = 150. The
total field length is twice as long as in 2(a) and 2(b). The region marked (B) is a zoneof uniform momentum identified by our feature extraction algorithm. The contours of

6 B. Ganapathisubramani, E. K. Longmire and I. Marusic
(a)
(b)
(c)
(d)
Figure 2. Hairpin packets identified using the feature extraction algorithm. At z+ = 92, forclarity only every second vector resolved is shown, (a) ω+
z , (b)−uw+. At z+ = 150, every thirdvector resolved is shown, (c) ω+
z , (d) −uw+. Note that (c) and (d) cover four times the area of
(a) and (b). The flow is from left to right and the vectors shown have U subtracted.

Vortex packets in boundary layers 7
ω+z and λci
+ (not shown) along with the vectors again show regions of swirling motionbounding the patch. The Reynolds shear stress shows discrete zones of high magnitudealong the entire length of (B). The zones of strong −uw+ always seems to occur betweenpairs of swirls on opposite sides of the patch. In this patch, the maximum values of −uw+
are smaller than in figure 2(b), but they are still significantly higher than the global mean(−uw+ = 0.78). The length of the patch is 1.9δ.
Many shorter patches like (C) were also identified at both z+ = 92 and 150. Thesepatches usually contained either one or two vortex core pairs and a small area contributingto the Reynolds shear stress. There are also even smaller patches like the one just abovepatch (B). On further investigation of the λci
+ plot, it is clear that this is a single hairpinvortex encompassing a small area of significant −uw+. However, it is unclear whether thisor other smaller patches travel with nearby longer patches. Sometimes, patches containing2-3 hairpins were closely followed by an additional short patch at a streamwise distanceof 150 - 300 wall units.
The region marked (D) exhibits Q4 characteristics. From the direction of the vectorarrows it is quite clear that u is greater than zero and −uw+ is positive, so w must beless than zero. These regions frequently appeared adjacent to packets identified by thealgorithm at both z+ = 92 and 150. The inclination of hairpin vortices with respect to thewall is such that the region outside of the legs/necks should induce Q4 events. These Q4regions often carry a significant amount of Reynolds shear stress, and the maximum localvalues are comparable to the maximum values observed in a Q2 type event (−uw+ ∼ 40).
The patches identified by the algorithm are typically aligned in the streamwise directionbut sometimes inclined at small angles such that they have a spanwise component. Theseries of vortex cores are at times offset in the spanwise direction by 100 - 150 wall unitsso that the zones of uniform momentum are oriented at an angle of 10◦ − 20◦ to thestreamwise direction.
The data acquired further from the wall (z+ = 198 and 530) revealed a variety ofcoherent structures, but no patterns of long low-speed streaks, elongated regions of highReynolds shear stress or organisation of vorticity in the form of a train of hairpins. Thus,the results indicate that the legs of most hairpins do not extend as far as z/δ = 0.2(z+ = 198). However, it is possible that the largest hairpin in a given packet crosses thismeasurement plane such that only individual structures are evident. Typical structuresobserved included individual vortex cores, large regions of upwash with scales approaching300 wall units, and spanwise strips of wall-normal velocity with alternating signs possiblyindicative of hairpin heads. Contour plots of wall-normal vorticity and velocity at z+ =198 are shown in Longmire et al. (2001). At z/δ = 0.5 (z+ = 530), we observed onlyoccasional large vortex cores with diameter of up to 300 wall units.
The reduced spatial coherence in the streamwise direction at the edge of the logarithmiclayer and beyond is consistent with the results obtained by Adrian et al. (2000b) in theirPIV measurements of streamwise-wall-normal planes. This behaviour is also consistentwith the attached eddy modelling study by Marusic (2001), in which the kinematic stateof the boundary layer was modelled by an ensemble of eddies of varying height. Theresults of that study suggested that packets with long streamwise coherence did not needto extend beyond the log layer in order to obtain the proper correlation statistics. In thisregion, only uncorrelated eddies were required.
Figures 3(a) and 3(b) show the length and width distributions of the patches identifiedby the feature extraction algorithm in all vector fields at z+ = 92, 150 and 198. Theordinate is the number of patches found in a certain bin divided by the total area searchedin all of the vector fields. The length distribution clearly illustrates the lack of patches atz+ = 198 relative to the two planes in the logarithmic layer. The peak of this distribution
8 B. Ganapathisubramani, E. K. Longmire and I. Marusic
Length (viscous units)0 500 1000 1500 2000
0
5
10
15
20
25
30
z+ = 92z+ = 150z+ = 198
σ Lx
108
(a)
Width (viscous units)0 100 200 300 400 500
0
10
20
30
40
50
60
70
z+ = 92z+ = 150z+ = 198
σ Wx
108
(b)
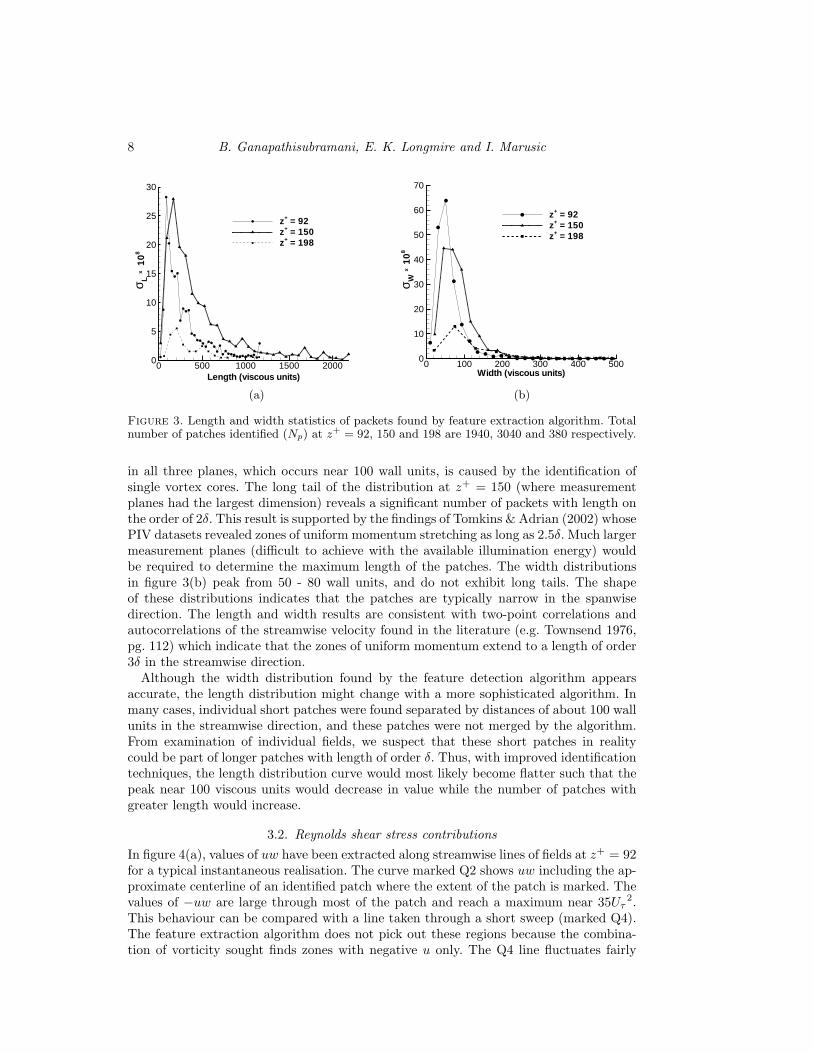
Figure 3. Length and width statistics of packets found by feature extraction algorithm. Totalnumber of patches identified (Np) at z+ = 92, 150 and 198 are 1940, 3040 and 380 respectively.
in all three planes, which occurs near 100 wall units, is caused by the identification ofsingle vortex cores. The long tail of the distribution at z+ = 150 (where measurementplanes had the largest dimension) reveals a significant number of packets with length onthe order of 2δ. This result is supported by the findings of Tomkins & Adrian (2002) whosePIV datasets revealed zones of uniform momentum stretching as long as 2.5δ. Much largermeasurement planes (difficult to achieve with the available illumination energy) wouldbe required to determine the maximum length of the patches. The width distributionsin figure 3(b) peak from 50 - 80 wall units, and do not exhibit long tails. The shapeof these distributions indicates that the patches are typically narrow in the spanwisedirection. The length and width results are consistent with two-point correlations andautocorrelations of the streamwise velocity found in the literature (e.g. Townsend 1976,pg. 112) which indicate that the zones of uniform momentum extend to a length of order3δ in the streamwise direction.
Although the width distribution found by the feature detection algorithm appearsaccurate, the length distribution might change with a more sophisticated algorithm. Inmany cases, individual short patches were found separated by distances of about 100 wallunits in the streamwise direction, and these patches were not merged by the algorithm.From examination of individual fields, we suspect that these short patches in realitycould be part of longer patches with length of order δ. Thus, with improved identificationtechniques, the length distribution curve would most likely become flatter such that thepeak near 100 viscous units would decrease in value while the number of patches withgreater length would increase.
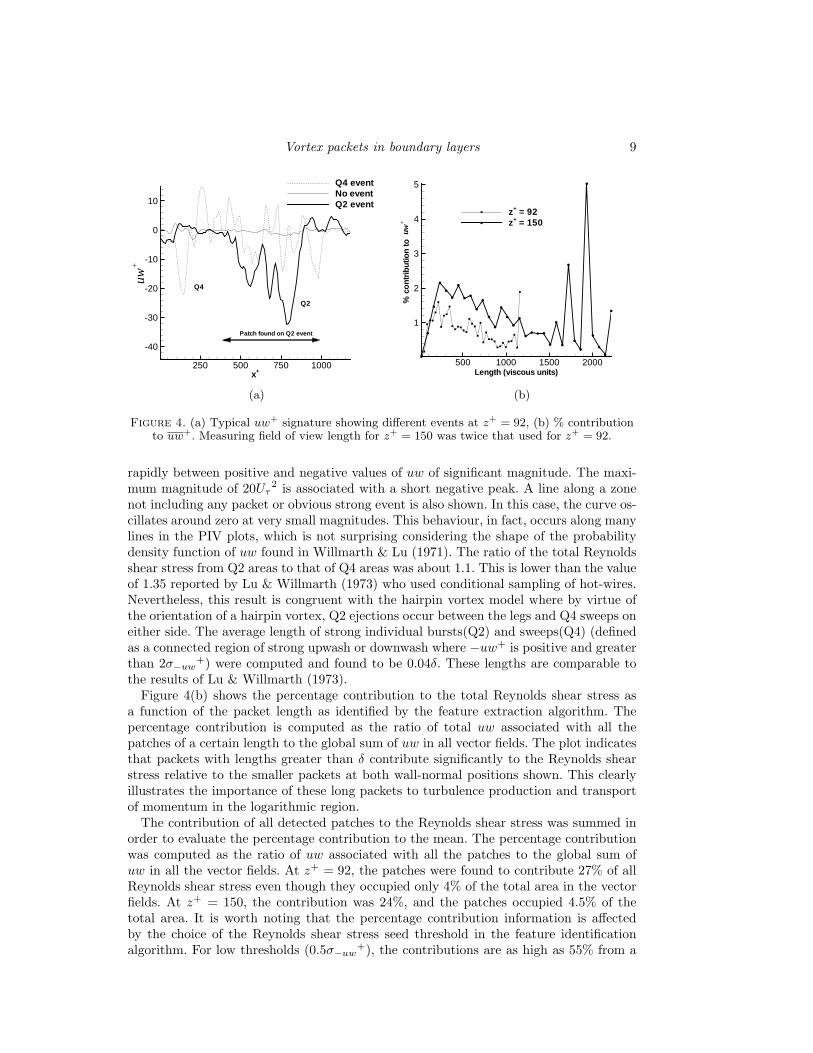
3.2. Reynolds shear stress contributionsIn figure 4(a), values of uw have been extracted along streamwise lines of fields at z+ = 92for a typical instantaneous realisation. The curve marked Q2 shows uw including the ap-proximate centerline of an identified patch where the extent of the patch is marked. Thevalues of −uw are large through most of the patch and reach a maximum near 35Uτ
2.This behaviour can be compared with a line taken through a short sweep (marked Q4).The feature extraction algorithm does not pick out these regions because the combina-tion of vorticity sought finds zones with negative u only. The Q4 line fluctuates fairly
Vortex packets in boundary layers 9
x+
uw+
250 500 750 1000
-40
-30
-20
-10
0
10
Q4 eventNo eventQ2 event
Patch found on Q2 event
Q4
Q2
(a)
Length (viscous units)
%co
ntrib
utio
nto
500 1000 1500 2000
1
2
3
4
5
z+ = 92z+ = 150
uw+
(b)
Figure 4. (a) Typical uw+ signature showing different events at z+ = 92, (b) % contributionto uw+. Measuring field of view length for z+ = 150 was twice that used for z+ = 92.
rapidly between positive and negative values of uw of significant magnitude. The maxi-mum magnitude of 20Uτ
2 is associated with a short negative peak. A line along a zonenot including any packet or obvious strong event is also shown. In this case, the curve os-cillates around zero at very small magnitudes. This behaviour, in fact, occurs along manylines in the PIV plots, which is not surprising considering the shape of the probabilitydensity function of uw found in Willmarth & Lu (1971). The ratio of the total Reynoldsshear stress from Q2 areas to that of Q4 areas was about 1.1. This is lower than the valueof 1.35 reported by Lu & Willmarth (1973) who used conditional sampling of hot-wires.Nevertheless, this result is congruent with the hairpin vortex model where by virtue ofthe orientation of a hairpin vortex, Q2 ejections occur between the legs and Q4 sweeps oneither side. The average length of strong individual bursts(Q2) and sweeps(Q4) (definedas a connected region of strong upwash or downwash where −uw+ is positive and greaterthan 2σ−uw
+) were computed and found to be 0.04δ. These lengths are comparable tothe results of Lu & Willmarth (1973).
Figure 4(b) shows the percentage contribution to the total Reynolds shear stress asa function of the packet length as identified by the feature extraction algorithm. Thepercentage contribution is computed as the ratio of total uw associated with all thepatches of a certain length to the global sum of uw in all vector fields. The plot indicatesthat packets with lengths greater than δ contribute significantly to the Reynolds shearstress relative to the smaller packets at both wall-normal positions shown. This clearlyillustrates the importance of these long packets to turbulence production and transportof momentum in the logarithmic region.
The contribution of all detected patches to the Reynolds shear stress was summed inorder to evaluate the percentage contribution to the mean. The percentage contributionwas computed as the ratio of uw associated with all the patches to the global sum ofuw in all the vector fields. At z+ = 92, the patches were found to contribute 27% of allReynolds shear stress even though they occupied only 4% of the total area in the vectorfields. At z+ = 150, the contribution was 24%, and the patches occupied 4.5% of thetotal area. It is worth noting that the percentage contribution information is affectedby the choice of the Reynolds shear stress seed threshold in the feature identificationalgorithm. For low thresholds (0.5σ−uw
+), the contributions are as high as 55% from a
10 B. Ganapathisubramani, E. K. Longmire and I. Marusic
total area of 15% due to the inclusion of all possible singular vortex cores with substantialReynolds shear stress. However, above a certain value of the threshold, i.e. 1.5σ−uw
+,the contributions taper off towards the values quoted above. It is important to note thatthe patches frequently have regions of positive uw in addition to the dominant negativeuw. Hence, if only the negative values of uw were included, the contribution would beeven higher. The patches thus make a sizable contribution to the Reynolds shear stressconsidering the fact that they do not include certain Q2 events and all possible Q4 events.
4. Summary and conclusionsIn this paper, results of stereo PIV measurements in streamwise-spanwise planes of a
zero pressure gradient turbulent boundary layer are presented. The velocity fields and thecorresponding derived gradient quantities paint a good picture of the types of structuresintersecting and crossing through different heights in the logarithmic layer and beyond.An algorithm for structure identification was presented that searched for zones of uniformmomentum enveloped by cores of vorticity of opposite sign that contained seed points ofsignificant Reynolds shear stress. Some of the key conclusions from analysing the resultsof this algorithm and the resulting vector fields from the stereo PIV experiments are :• Packets of hairpin vortices, sometimes extending over a length of 2δ, were identified
in the logarithmic region of the boundary layer using an objective feature extractionalgorithm. This result is consistent with the conclusions of Adrian et al. (2000b) afteranalysing their PIV datasets in x− z planes. Here we used stereo PIV datasets in x− yplanes which enabled us to quantify the Reynolds shear stress contribution and spanwiseorientation of these structures.• The packets carry a large percentage of the Reynolds shear stress which suggests
that this packet structure is an integral part of the turbulence transport mechanism. Thepackets contribute more than 25% to −uw even though they occupy less than 4% of thetotal area.• The streamwise spatial coherence and organisation of vortices is seen to break down
beyond the log layer, consistent with the findings of Marusic (2001) who used the attachededdy hypothesis. The stereo PIV datasets at z = 0.2δ and 0.5δ reveal a wide range ofstructures but do not include long low speed streaks caused by organisation of hairpinvortices. Instead, there were regions of upwash, adjacent spanwise strips of positive andnegative wall-normal velocity oriented and large single vortex cores.
The authors wish to thank Tim Urness, Cheonghee Lee and Prof. Victoria Interrante(Computer Science), for their help with the feature extraction algorithm and visualisa-tion, and Gary Kunkel for providing his hot-wire data. We would like to thank the Editorfor bringing the related study by Tomkins & Adrian (2002) to our attention. This workwas supported by the National Science Foundation through Grants ACI-9982274 andCTS-9983933.
REFERENCES
Adrian, R. J., Christensen, K. T. & Liu, Z. C. 2000a Analysis and interpretation of in-stantaneous turbulent velocity fields. Exp. Fluids 29, 275–290.
Adrian, R. J., Meinhart, C. D. & Tomkins, C. D. 2000b Vortex organization in the outerregion of the turbulent boundary layer. J. Fluid Mech. 422, 1–53.
Balint, J.-L., Wallace, J. M. & Vukoslavcevic, P. 1991 The velocity and vorticity vectorfields of a turbulent boundary layer. Part 2. Statistical properties. J. Fluid Mech. 228,53–86.

Vortex packets in boundary layers 11
Bandyopadhyay, P. 1980 Large structure with a characteristic upstream interface in turbulentboundary layers. Phys. Fluids 23-11, 2326–2327.
Blackwelder, R. F. & Kaplan, R. E. 1976 On the wall structure of the turbulent boundarylayer. J. Fluid Mech. 76-1, 89–120.
Bogard, D. G. & Tiederman, W. G. 1986 Burst detection with single-point velocity mea-surements. J. Fluid Mech. 162, 389–413.
Brown, G. R. & Thomas, A. S. W. 1977 Large structure in a turbulent boundary layer. Phys.Fluids 20, S243–S251.
Christensen, K. T. & Adrian, R. J. 2001 Statistical evidence of hairpin vortex packets inwall turbulence. J. Fluid Mech. 431, 433–443.
Ganapathisubramani, B., Longmire, E. K. & Marusic, I. 2002 Investigation of three di-mensionality in the near field of a round jet using stereo PIV. J. Turbulence 3, 017.
Head, M. R. & Bandyopadhyay, P. 1981 New aspects of turbulent boundary-layer structure.J. Fluid Mech. 107, 297–337.
Heist, D. K., Hanratty, T. J. & Na, Y. 2000 Observations of the formation of streamwisevortices by rotation of arch vortices. Phys. Fluids 12, 2965–2975.
Kovasznay, L. S. G., Kibens, V. & Blackwelder, R. F. 1970 Large-scale motion in theintermittent region of a turbulent boundary layer. J. Fluid Mech. 41, 283–326.
Longmire, E. K., Ganapathisubramani, B. & Marusic, I. 2001 Structure identification andanalysis in turbulent boundary layers by stereo PIV. In Proc. 4th International symposiumon Particle Image Velocimetry, Sept. 17-19 . Gottingen, Germany.
Lu, S. S. & Willmarth, W. W. 1973 Measurements of the structure of the Reynolds stress ina turbulent boundary layer. J. Fluid Mech. 60, 481–511.
Lyons, S. L., Hanratty, T. J. & McLaughlin, J. B. 1989 Turbulence-producing eddies inviscous wall region. AIChE J. 35, 1962.
Marusic, I. 2001 On the role of large-scale structures in wall turbulence. Phys. Fluids 13(3),735–743.
Naguib, A. M. & Wark, C. E. 1992 An investigation of wall-layer dynamics using a combinedtemporal filtering and correlation technique. J. Fluid Mech. 243, 541–560.
Offen, G. R. & Kline, S. J. 1975 A proposed model of the bursting process in turbulentboundary layer. J. Fluid Mech. 70-2, 209–228.
Robinson, S. K. 1991 Coherent motions in turbulent boundary layers. Annu. Rev. Fluid Mech.23, 601–639.
Smith, C. R., Walker, J. D. A., Haidari, A. H. & Soburn, U. 1991 On the dynamics ofnear-wall turbulence. Phil. Trans. R.Soc. Lond. A 336, 131–175.
Theodorsen, T. 1952 Mechanism of turbulence. In Proc. Second Midwestern Conference onFluid Mechanics, Mar. 17-19 . Ohio state Univesity, Columbus, Ohio.
Tomkins, C. D. 2001 The structure of turbulence over smooth and rough walls. PhD the-sis, Department of Theoretical and Applied Mechanics, University of Illinois at Urbana-Champaign.
Tomkins, C. D. & Adrian, R. J. 2002 Spanwise structure and scale growth in turbulentboundary layers. TAM Reports, University of Illinois at Urbana-Champaign # 1006.
Townsend, A. A. 1976 The Structure of Turbulent Shear Flow . Cambridge University Press.Willmarth, W. W. & Lu, S. S. 1971 Structure of the Reynolds stress near the wall. J. Fluid
Mech. 55, 65–92.Zhou, J., Adrian, R. J., Balachandar, S. & Kendall, T. M. 1999 Mechanisms for gener-
ating coherent packets of hairpin vortices in channel flow. J. Fluid Mech. 387, 353–396.