Embed Size (px)
Citation preview

ORI GIN AL PA PER
Characterization and assessment of the devastatingnatural hazards across the Canadian Prairie Provincesfrom 2009 to 2011
Julian Brimelow • Ronald Stewart • John Hanesiak • Bohdan Kochtubajda •
Kit Szeto • Barrie Bonsal
Received: 5 August 2013 / Accepted: 20 February 2014� Springer Science+Business Media Dordrecht 2014
Abstract From 2009 to 2011, the Canadian Prairies were subjected to exceptionally
variable precipitation regimes, ranging between record drought and unprecedented flood-
ing. Adjacent regions concurrently experienced droughts and floods, and individual areas
transitioned rapidly from pluvial to drought conditions and vice versa. Such events had
major impacts; for example, damages from floods in the Assiniboine River Basin (ARB)
have exceeded $1 billion, and forest fires ravaged the town of Slave Lake, Alberta. This
study first characterizes, and then assesses, these devastating natural hazards in terms of
their physical processes (across multiple spatial and temporal scales) related to both the
spatially contrasting precipitation states and rapid temporal transitions between these
states. Subtle differences in large-scale atmospheric flow had marked impacts on precip-
itation. Primary factors controlling the distribution and amount of precipitation included
the location and persistence of key surface and upper-air features, as well as their inter-
action. Additionally, multiple events—rather than individual extremes—were responsible
for the flooding over the Saskatchewan River Basin and the ARB. Very heavy rainfall
events (C25 mm d-1) accounted for up to 55 % of warm season rain at some locations,
and the frequency of heavy rainfall events was critical for determining whether a region
experienced drought or pluvial conditions. This study has increased our knowledge of the
characteristics, impacts and mechanisms of rapidly transitioning disparate precipitation
J. Brimelow (&) � R. Stewart � J. HanesiakDepartment of Environment and Geography, Centre for Earth Observation Science (CEOS),468 Wallace Building, University of Manitoba, Winnipeg, MB R3T 2N2, Canadae-mail: [email protected]
B. KochtubajdaEnvironment Canada, Edmonton, AB, Canada
K. SzetoEnvironment Canada, Downsview, ON, Canada
B. BonsalEnvironment Canada, Saskatoon, SK, Canada
123
Nat HazardsDOI 10.1007/s11069-014-1107-6

states on the Canadian Prairies and will aid in better understanding both past and projected
future hydro-climatic extremes in the region.
Keywords Flooding � Heavy precipitation � Drought � Wildfires �Canadian Prairies � Precipitation variability � Natural hazard
1 Introduction and background
The Canadian Prairie region of Canada (Fig. 1) has one of the most variable climates in
North America. Drought, flooding and forest fires sometimes occur simultaneously across
the region, while extreme dry and wet conditions can be observed within a single growing
season at a given location (Hanesiak et al. 2011; Szeto et al. 2011).
This spatio-temporal variability makes it challenging for governments and communities
to effectively respond and adapt to hazardous events. For example, when multiple hazards
occur close in space and time, the cumulative impacts can negatively affect the capacity for
communities to respond and this in turn increases their vulnerability (Bonsal et al. 2011;
IPCC 2012). Benestad and Haugen (2007) noted that concurrent events (which need not be
extreme) can have negative impacts beyond those expected from the individual events.
Further, Turner et al. (2003) identified the importance of including multiple stressors when
conducting vulnerability analyses. Consequently, it is important to quantify the impacts
asscociated with the dramatic temporal shifts and spatial contrasts in precipitation on the
Canadian Prairies from 2009 to 2011, as well as improve our understanding of the pro-
cesses associated with both wet and dry precipitation extremes.
In the last decade, the Prairies have been subjected to large variations in precipitation
with devastating consequences. For example, damage to the Canadian economy from the
1999–2005 Prairie drought, part of possibly the worst drought over western North America
in 800 years (Schwalm et al. 2012), was estimated at $4.5 billion for 2001 and 2002 alone
(Wheaton et al. 2008). The western Prairies again experienced a short-lived, yet severe
drought in 2009. According to Agriculture and Agri-Food Canada, the spring of 2009 was
the driest in 70 years, and Saskatoon, Saskatchewan experienced its driest spring since
records began in 1892 (Phillips 2010). The Prairie drought was followed by widespread
and historic flooding in 2010 and 2011 (see Fig. 1). Saskatoon experienced its wettest
growing season (April through September) on record in 2010, and the Canadian Wheat
Board estimated that about 5 million ha of farmland went unseeded—the largest area since
1971 (Phillips 2011). The unprecedented and devastating flooding observed over the
Assiniboine River Basin (ARB) was rated as Canada’s number one weather event for 2011
(Phillips 2012). The Canadian Wheat Board estimated that almost 5.5 million hectares of
farmland did not produce crops in 2011 due to flooding (Phillips 2012). Simultaneously,
northern portions of the Prairies experienced extensive forest fires (Fig. 1), including one
that destroyed parts of the town of Slave Lake, Alberta and caused at least $750 million of
insured damage—the number two weather event for 2011 (Phillips 2012).
In 2009, southern Manitoba transitioned from spring flooding to the driest July since
records began in 1887, and some farmers in southern Manitoba claimed flood and drought
insurance in the same growing season. Impacts of the 2011 floods are ongoing, with many
people still displaced. At the time of writing, the cost of the floods is estimated to be
greater than $1 billion (Government of Manitoba 2012). Further, 5 of the 10 largest insured
Nat Hazards
123

weather-related events on the Prairies (1991–2011) occurred between 2009 and 2011 and
accounted for 75 % of the insured losses (Insurance Bureau of Canada 2012).
Research has been undertaken to examine some of these types of events, with the main
focus being on droughts. One of the most comprehensive studies was the Drought Research
Initiative that focused on the main physical factors associated with the severe 1999–2005
Prairie drought (Stewart et al. 2011). A comprehensive review of Canadian Prairie drought
research is provided in Bonsal et al. (2011).
The objective of this paper is to characterize and assess the devastating natural hazards
experienced across the Canadian Prairies from 2009 through 2011. This is realized through
an examination of two issues. Firstly, the physical impacts related to the extreme wet and
dry events from 2009 to 2011 are characterized. Secondly, the atmospheric processes (i.e.
upper-air and surface circulation) related to the temporal shifts and spatial contrasts in
Fig. 1 Canadian PrairieProvinces study area, includingthe Assiniboine River Basin(ARB). Solid-coloured areasrepresent burn scars. Shadedbrown and blue regions wereaffected by drought and floodingfor at least three consecutivemonths between 2009 and 2011,respectively. ‘‘PC’’ is the PeaceCountry region. Insert shows thelocation of the study area. Urbancentres referred to in the text areshown by yellow dots
Nat Hazards
123

precipitation are investigated. The paper is organized as follows. Section 2 outlines the
study area and datasets. In Sect. 3, the spatio-temporal variability of the surface temper-
ature and precipitation is documented, including heavy precipitation events. Lightning and
wildfire characteristics during the study period are reviewed in Sect. 4, whereas Sect. 5
examines atmospheric forcing mechanisms associated with key break points and concur-
rent wet and dry regions. The paper concludes with a discussion and conclusions in Sect. 6.
2 Study area and datasets
The Canadian Prairie Provinces (Fig. 1) encompass an area of approximately 1.9 mil-
lion km2. The region typically receives 350–500 mm of precipitation annually, of which
approximately 65–75 % falls in the warm season (May through September). Higher annual
precipitation is observed near the Rocky Mountains. Mean accumulated snowfall ranges
between 110 and 160 cm, contributing 25–35 % of the annual precipitation (National
Climate Data and Information Archive at http://www.climate.weatheroffice.ec.gc.ca). Land
cover over the Prairie Provinces is diverse. The southern agricultural region comprises
mainly seasonal cropland and is bordered to the north by the boreal plains, which consists
of deciduous and coniferous forest. Over extreme northern Saskatchewan and Manitoba,
the boreal shield is covered by coniferous forest and taiga. To gain better insight into the
processes associated with the spatial variability of precipitation, the study area is divided
into two sub-regions, namely the agricultural zone and the boreal zone (see Fig. 1).
Because this analysis investigates the variability of precipitation on a variety of tem-
poral and spatial scales, gridded climate data sets are used. These include the 50-km
monthly precipitation and temperature data from the Canadian gridded (CANGRD) data
product and the 0.2-gridded 6-hour precipitation data from the Canadian Precipitation
Analysis project (CaPA) (Mahfouf et al. 2007). CANGRD temperature values are derived
from climate station data that have been corrected for homogeneity issues caused by station
relocation, changes to instrumentation and observing times (Vincent 1998; Vincent and
Gullet 1999), and precipitation has been adjusted for gauge under-catch, wetting loss and
trace events (Mekis and Hogg 1999). To better understand the physical processes asso-
ciated with the identified precipitation extremes, key atmospheric variables including
vertically integrated moisture, mean sea-level pressure, vertical and horizontal motion, and
geopotential heights from the NCEP-NCAR reanalysis product (Kalnay et al. 1996) are
utilized.
Lightning data are monthly quality-controlled records of cloud-to-ground strikes (CG)
from the Canadian Lightning Detection Network (CLDN) (Burrows and Kochtubajda
2010). Streamflow values are from archived hydrometric data maintained by the Water
Survey of Canada (http://www.wsc.ec.gc.ca/applications/H2O/index-eng.cfm). Point and
polygon data from the Canadian National Fire Database (Canadian Forest Service 2012)
are used to characterize lightning-caused fire and associated area burned statistics.
3 Precipitation and temperature
3.1 Spatial and temporal characteristics
The high spatio-temporal variability in precipitation during 2009 through 2011 is high-
lighted by the area-averaged monthly CANGRD precipitation departures (relative to the
Nat Hazards
123

1971–2000 averages) in Fig. 2. These data show that over the agricultural zone, 50 % of
the 36 months from 2009 to 2011 received above-average precipitation ([110 % of nor-
mal), and 25 % of the months received below-average (\90 % of normal) precipitation.
Similarly, over the boreal zone, 53 % of the months experienced above-average precipi-
tation, compared to 28 % with below-average values.
Despite the preponderance of months with above-average precipitation, some regions in
both zones experienced very dry monthly conditions (\40 % below average) in each of the
3 years (Fig. 1, also see Figs. 11b, 14a). In 2009, south-western Saskatchewan and central
and southern Alberta experienced very dry conditions from late May through September.
In 2010, the agricultural zone was very dry in February and March, as was the Peace
Country in the late summer. In May and June 2011, central Alberta and west-central
Saskatchewan experienced very dry conditions, as did portions of the agricultural zone
(especially southern Manitoba) between July and September 2011. Over parts of the boreal
zone (Fig. 1), very dry conditions were observed in May and November 2009, February
and June 2010, and May and September 2011.
Closer inspection of the precipitation departures and temperature anomalies reveals four
key time periods (Fig. 2). The first period, from April through September 2009, was
characterized by below-average precipitation (\90 % of average) and temperature (Fig. 2).
In May, June and July 2009, most of the agricultural zone experienced dry conditions (with
central Alberta receiving\40 % of its average precipitation in June). Two exceptions were
the central boreal zone, where precipitation was 110–130 % above average in June (up to
200 % above average over northern Saskatchewan), and far southern Alberta, where heavy
rainfall (up to 125 mm) in early July alleviated drought conditions. Monthly temperature
departures (Fig. 2b) indicate that below-average temperatures (-1 to -2 �C) accompanied
the dry conditions in the spring. The cooler regime continued into August, with large areas
experiencing below-average temperatures (-0.5 to -2 �C) interspersed with near-average
temperatures.
The second period, between October 2009 and March 2010 (Fig. 2), was dominated by
below-average precipitation and above-average temperatures (?2 to ?6 �C). With the
exception of October 2009 and January 2010, precipitation was typically below average
over the agricultural zone, with precipitation for some months being 50–60 % below
average and some locations receiving\40 % of their average. Early in 2010, a shift from
an extremely dry (\40 % of average) March to an extremely wet ([200 % of average)
April marked the onset of a prolonged wet phase.
During the third period, between April 2010 and July 2011, precipitation was above
average ([160 % in some months) and temperatures were typically near to below average
(Fig. 2). The 2010 warm season over the agricultural zone was especially wet, with pre-
cipitation over much of Saskatchewan being 200 % above average. In contrast, the Peace
Country and the boreal zone were dry and warm in June and July, with precipitation at
\40 % of average in places; the dry and warm ([?2 �C) conditions over northern Sas-
katchewan and northern Manitoba were accompanied by forest fires. Above-average pre-
cipitation was observed over most of the Prairie Provinces in August and September 2010.
Although precipitation during the winter of 2010–2011 was characterized by high spatial
variability across the Prairie Provinces, monthly values were average to above average
([150 % in January 2011). During spring, the boreal zone and north-central agricultural
zone were very dry (\40 % of average precipitation in places); elsewhere precipitation was
average to above average, but much-above average over the ARB ([160 %). In the early
summer, most of the agricultural and boreal zones were wet (120–140 % above-average
precipitation), with near-to average temperatures. June and July were especially wet over
Nat Hazards
123
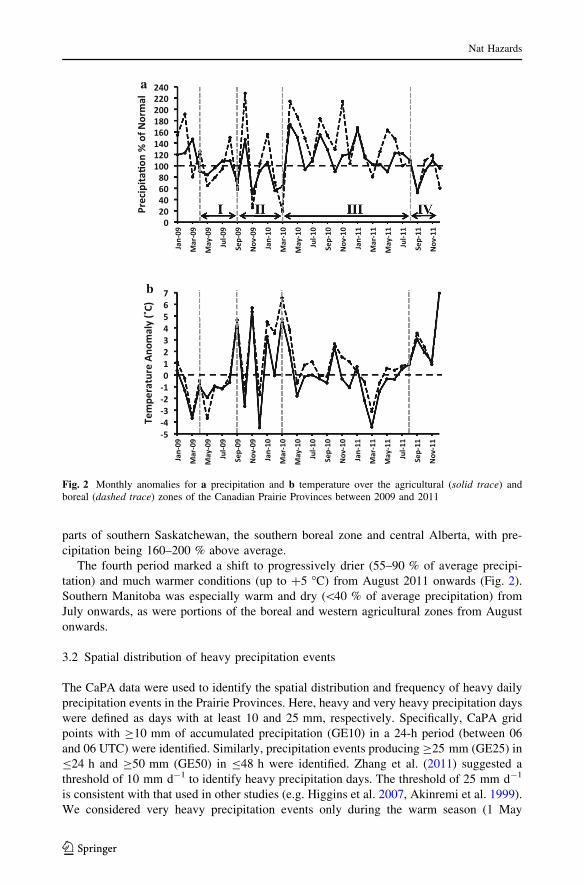
parts of southern Saskatchewan, the southern boreal zone and central Alberta, with pre-
cipitation being 160–200 % above average.
The fourth period marked a shift to progressively drier (55–90 % of average precipi-
tation) and much warmer conditions (up to ?5 �C) from August 2011 onwards (Fig. 2).
Southern Manitoba was especially warm and dry (\40 % of average precipitation) from
July onwards, as were portions of the boreal and western agricultural zones from August
onwards.
3.2 Spatial distribution of heavy precipitation events
The CaPA data were used to identify the spatial distribution and frequency of heavy daily
precipitation events in the Prairie Provinces. Here, heavy and very heavy precipitation days
were defined as days with at least 10 and 25 mm, respectively. Specifically, CaPA grid
points with C10 mm of accumulated precipitation (GE10) in a 24-h period (between 06
and 06 UTC) were identified. Similarly, precipitation events producing C25 mm (GE25) in
B24 h and C50 mm (GE50) in B48 h were identified. Zhang et al. (2011) suggested a
threshold of 10 mm d-1 to identify heavy precipitation days. The threshold of 25 mm d-1
is consistent with that used in other studies (e.g. Higgins et al. 2007, Akinremi et al. 1999).
We considered very heavy precipitation events only during the warm season (1 May
a
b
Fig. 2 Monthly anomalies for a precipitation and b temperature over the agricultural (solid trace) andboreal (dashed trace) zones of the Canadian Prairie Provinces between 2009 and 2011
Nat Hazards
123

through 30 September). The rationale for focusing on heavy precipitation events is because
the preponderance, or scarcity, of heavy precipitation events is important for determining
whether a region is in drought or a pluvial (e.g. Evans et al. 2011). Specifically, Evans et al.
(2011) found that droughts were characterized by a scarcity of heavy rainfall events,
whereas pluvials were characterized by a preponderance of heavy rainfall events.
We identified 63 GE50 events in the 2009–2011 warm seasons, of which 39 were over the
agricultural zone. In 2009, most GE50 events occurred over the boreal zone (Fig. 3), with grid
points over the western boreal receiving up to two events. In 2010, there was a paucity of GE50
events over Saskatchewan, whereas up to three events were identified at grid points over
northern Manitoba. In 2011, up to three events were observed at grid points over the boreal zone
and Peace Country of Alberta. Several areas over southern Saskatchewan and Manitoba were
affected by GE50 events. In contrast, parts of the southern Prairies experienced only one GE50
event.
An analysis of daily rainfall data for five stations (Edmonton, Saskatoon, Medicine Hat,
Winnipeg and Prince Albert) across the agricultural zone from 1981 to 2010 found that the
stations typically experienced a total of ten GE10 events between May and September, two
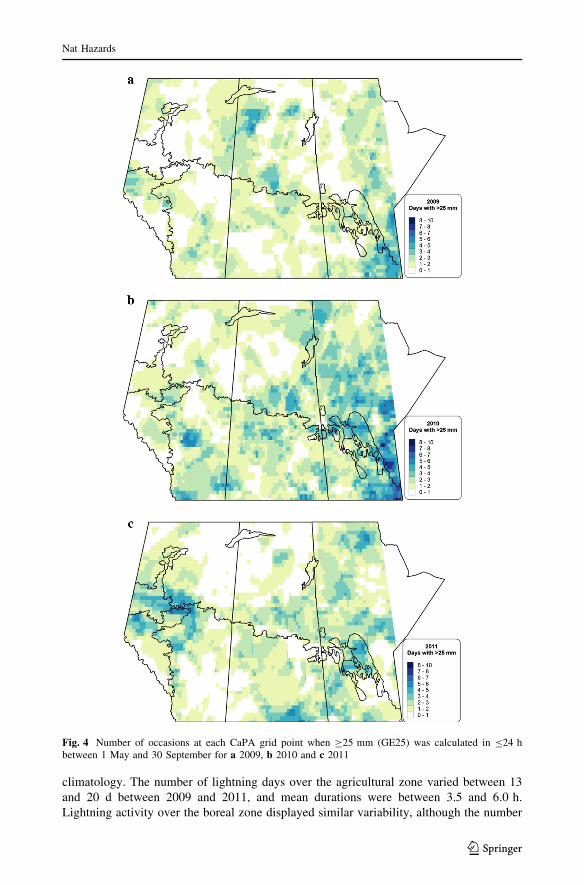
of which were GE25 events. In 2009, the frequency of GE25 events was highest over
south-eastern Manitoba, northern Saskatchewan and south-central Alberta (Fig. 4a). The
mean frequency over the agricultural zone was 0.95 per grid point (or 2,229 events for all
grids), with similar values (1.0; 4,366) over the boreal zone (Fig. 4a). The mean contri-
bution of GE25 events to the warm season rainfall totals was 24 and 19 % over the
agricultural zone and the boreal zone, respectively (Fig. 5a).
The frequency and spatial extent of GE25 events increased markedly in 2010 (Fig. 4b).
The frequency was greatest over Manitoba, with up to 10 events; central Saskatchewan and
southern Alberta were also active. The mean frequency of GE25 events was 1.6 (4,017 events)
over the agricultural zone and 1.5 (8,238 events) over the boreal zone. The contribution to
warm season rainfall (Fig. 5b) was near 20 % over both the agricultural and boreal zones.
The 2011 warm season was similar to that of 2010 (Fig. 4c). The most active regions
were west-central Alberta and the Peace Country (consistent with the drought being broken
there), along with most of Manitoba and portions of central Saskatchewan. In contrast to
2009 and 2010, very few GE25 events were identified over southern Alberta and south-
eastern Manitoba. The mean frequency was 1.8 for the agricultural zone (4,366 events) and
\0.5 (1,982 events) for the boreal zone. The mean contribution to warm season rain totals
(Fig. 5c) over the agricultural zone was 25 %, compared to 22 % over the boreal zone.
The spatial distribution of the GE10 events during the warm season (not shown) was
very similar to that of the GE25 events, although the frequency of GE10 events was higher.
Specifically, the mean frequency for GE10 (GE25) events was 7.0 (1.5) over the agri-
cultural zone and 7.5 (1.0) over the boreal zone. The mean contribution of GE10 events to
warm season rain totals was also higher, at 51.5 and 46 % over the agricultural and boreal
zones, respectively.
The frequency of GE10 events for the cold seasons (1 October through 30 April) of
2009–2010 and 2010–2011 was much lower than that for the warm seasons (Fig. 6). The
highest occurrence of GE10 events was over southern Manitoba and south-eastern Sas-
katchewan, where up to 11 events were identified for the 2010–2011 cold season, com-
pared to GE10 maxima of up 20 events in the 2010 and 2011 warm seasons. Overall, GE10
events occurred mostly over the eastern Prairies and along the foothills of the Rockies;
very few GE10 events occurred over the western Prairie Provinces for the years studied.
In summary, for the three warm seasons considered here, GE25 events were infrequent
(B5 events per grid point) and limited to the far south-eastern part of the Prairies. Drier
Nat Hazards
123

regions typically received fewer GE25 events than did areas experiencing pluvial condi-
tions. Also, very heavy events accounted for up to 55 % of warm season rain in places.
Typically, the mean contribution of GE25 events over the agricultural zone during the
warm season was between 20 and 25 %.
4 Lightning and fire activity
4.1 Lightning
Cloud-to-ground (CG) lightning flashes are common over the Canadian Prairie Provinces
(Burrows and Kochtubajda 2010). The vast majority of flashes are observed between May
and September, with the greatest frequency occurring in July. The number of lightning
days (d) and the total length of time (h) during which lightning occurred (on a 0.2� 9 0.2�grid) between May and September from 1999 to 2012 are illustrated in Figs. 7a and 8a,
respectively.
The temporal variability in lightning days and in total duration (from May to Sep-
tember) during the 2009–2011 period was atypical when compared to the 1999–2012
Fig. 3 Occasions at each CaPAgrid point when C50 mm (GE50)was calculated in B48 h between1 May and 30 September fora 2009, b 2010 and c 2011.Green indicates one event, bluetwo events and red three events
Nat Hazards
123
climatology. The number of lightning days over the agricultural zone varied between 13
and 20 d between 2009 and 2011, and mean durations were between 3.5 and 6.0 h.
Lightning activity over the boreal zone displayed similar variability, although the number
Fig. 4 Number of occasions at each CaPA grid point when C25 mm (GE25) was calculated in B24 hbetween 1 May and 30 September for a 2009, b 2010 and c 2011
Nat Hazards
123

of lightning days (9.5–12.0 d) and the lightning duration (2–3 h) were fewer and shorter,
reflecting the more northerly location of the boreal zone and shorter warm season (Burrows
and Kochtubajda 2010).
Fig. 5 Contribution of GE25 events to the warm season total precipitation for a 2009, b 2010 and c 2011
Nat Hazards
123

Annual maps depicting regions of above-normal or below-normal lightning days and
duration reveal considerable spatial variability (Figs. 7, 8). The anomaly map for 2009—a
dry period—shows a less active thunderstorm season than average. Large areas experienced
below-normal activity both in the number of lightning days and in the lightning duration over
the agricultural zone (Figs. 7b, 8b). A reduction in lightning occurrence by C4 d and dura-
tions by C4 h below normal was noted over many areas of the agricultural zone. A few areas
in southern Alberta experienced C2 more lightning days and 2 h longer lightning duration
than normal. A large portion of the boreal zone also experienced reduced lightning activity,
except over north-central Saskatchewan where activity was above normal.
The agricultural zone experienced an active lightning season in 2010 (Figs. 7c, 8c);
nearly 60 % of the zone experienced an increase in C4 lightning days above normal.
Lightning duration was more than 6 h above normal over the southernmost region of the
Saskatchewan-Manitoba border and over east-central Alberta. These data suggest longer-
lived and/or more electrically active thunderstorms. Lightning activity over the boreal zone
was mixed. Some areas experienced C2 fewer days than normal and C2 h less lightning
duration (e.g. northern Manitoba), while some regions experienced a more active season
(e.g. north-western Alberta).
Fig. 6 Number of occasions at each CaPA grid point when C10 mm (GE10) was calculated in B24 hbetween 1 October and 30 April a 2009–2010, and b 2010–2011
Nat Hazards
123

The anomaly patterns in 2011—a wet period—show near-normal lightning activity over
the agricultural zone and above-normal activity over the boreal zone (Figs. 7d, 8d).
Anomalies of at least 4 lightning days more than normal are evident over several regions
(e.g. the foothills of Alberta and south-western Saskatchewan). Some areas experienced
Fig. 7 May through September thunderstorm day counts for 1999–2012 a, and thunderstorm day anomaliesfor 2009, 2010 and 2011, respectively b–d. Crosses indicate where large fires ([200 ha) initiated
Fig. 8 May through September thunderstorm duration (h) for 1999–2012 a, and thunderstorm durationanomalies for 2009, 2010 and 2011, respectively b–d
Nat Hazards
123

fewer lightning days than normal, including far southern Manitoba and east-central
Alberta. The lightning duration anomaly map for 2011, however, indicates that the sea-
sonal duration was C2 h lower over several areas in the agricultural zone, and throughout
many areas in the boreal zone. These patterns suggest that thunderstorms in 2011 were
likely shorter lived than average and did not produce much lightning.
Thunderstorms can produce varying amounts of convective precipitation and lightning,
triggering flash floods when intense precipitation falls over short times (Soula et al. 1998),
or igniting wildfires when little or no precipitation falls to the surface (Rorig and Ferguson
1999). A pattern of increasing average lightning activity associated with increasing
amounts of convective precipitation was found across Canada’s ecozones; this is consistent
with the findings of (Kochtubajda et al. 2013).
4.2 Forest fires
Forest fires are a common disturbance on the Canadian Prairies. Based on data from 1981
to 2011, over 2,300 fires occur annually and burn an average of over 1 million ha
(Canadian Forest Service 2012). Various factors can influence areas burned, including:
weather, topography, fuels and composition, and human factors such as land-use man-
agement and fire suppression policies and priorities (Parisien et al. 2006).
The annual variability of lightning-caused fires and associated area burned and the
distribution of large fires (fires larger than 200 ha in area) over this period is described in
Fig. 9. CG lightning flashes trigger over 1,200 forest fires (about 52 % of the total number
of fires) annually on the Prairie Provinces and burn about 0.9 million ha. The total area of
the boreal forest in the Prairies Provinces is about 144 million ha (Canadian Boreal
Initiative 2013). The least active lightning-caused fire season occurred during 2011, with
only 438 lightning-caused fires; 1998 was the most active season, with 2,273 fires. Large
fires in Canada represent only 3 % of the fires, yet account for about 97 % of the area
burned (Stocks et al. 2003). The Prairies typically experience about 90 large lightning-
caused fires annually, which is just over 7 % of the lightning-caused fires, yet accounts for
about 94 % of the area burned. A large fraction of these large fires (47 %) occurs in
northern Saskatchewan (Fig. 9). According to Saskatchewan’s Wildfire Management
Strategy (2013), minimal fire suppression is carried out in this region and fires are gen-
erally allowed to burn naturally, with the exclusion of communities and major infra-
structures such as mines. This, combined with the quick-drying shallow soils
characterizing the region, explains the higher fraction of large fires over northern Sas-
katchewan (Flannigan pers. comm. 2013).
The number of lightning-caused fires and area burned between 2009 and 2011 was highly
variable (Fig. 9). During this time, 2,700 lightning-caused fires burned nearly 2.3 million ha.
The most active season was 2010, when over 1,400 fires burned nearly 1.8 million ha. Large
fires in 2010 accounted for *11.5 % of the fires and over 96 % of the area burned. The
majority of these fires (55 %) occurred in northern Saskatchewan (Fig. 1). The fewest
number of lightning-caused fires occurred in 2011, whereas the smallest area burned was in
2009. The highly variable spatial distribution of burn areas is shown in Fig. 1. In 2009, large
fires were found along a swath extending from southern Manitoba into northern Alberta.
Large burn areas in northern Saskatchewan are evident in 2010, while in 2011 large burn areas
are observed in north-eastern Alberta and north-western Saskatchewan.
Nat Hazards
123

5 Large-scale and event-scale forcing mechanisms
5.1 Temporal shifts and break points
The transition between precipitation regimes in early 2010 can be explained by the large-
scale flow (Fig. 10). In March 2010, the circulation over the Prairies was characterized by
persistent ridging (Fig. 10c), with troughs off the west coast and over eastern Canada.
Height anomalies at 500 mb approached ?100 gpm over southern Manitoba (Fig. 10e),
with the greatest anomaly over western Ontario. Consequently, ascent over the agricultural
zone was muted (not shown). In contrast, enhanced ascent and above-normal precipitation
(Fig. 10a) was present over northern Saskatchewan. At the surface (not shown), a rela-
tively dry downslope flow over the agricultural zone was unfavourable for precipitation.
According to the NCEP-NCAR reanalysis, the height anomaly observed over western
Ontario (50�N; 90�W) in March 2010 was the largest recorded since 1948, with one
exception: only March 2012 had a greater height anomaly at the aforementioned grid point
over western Ontario.
In April 2010, the upper-air long-wave pattern moved eastwards with the upper-air
trough over the west coast of Canada (Fig. 10d). This eastward shift proved critical in the
Prairies transitioning from dry conditions in March to wet conditions in April. Specifically,
the region of positive height anomalies over southern British Columbia was replaced by
negative anomalies, while positive anomalies persisted over north-eastern Saskatchewan
and Manitoba (Fig. 10f). This configuration of the upper-air flow resulted in enhanced
ascent over most of the Prairie Provinces, with the exception of a small region over central
Manitoba. At low levels (not shown), the flow was predominantly easterly over the agri-
cultural zone, resulting in the upslope transport of moisture, which in turn favoured heavy
precipitation. This regime led to much-above-normal precipitation for April over most of
the Prairies (Fig. 10b).
The second marked transition occurred late in the summer of 2011 and was charac-
terized by progressively unfavourable large-scale conditions for precipitation between July
and September. In July, a long-wave ridge (Fig. 11c) dominated over the eastern Prairies
(consistent with the drought over southern Manitoba). A dipole anomaly pattern was
evident at 500 mb, with a -60 gpm anomaly over northern British Columbia and ?50 gpm
over Wisconsin (Fig. 11e). As a result, descent dominated over the south-eastern Prairies
(not shown), while the mean upper trough over British Columbia favoured ascent and
above-average precipitation over the western Prairies. By September, the upper ridge
(Fig. 11d) and associated descent dominated the circulation over most of the Prairie
Provinces (anomalies[60 gpm), and a strong westerly flow developed at the surface. The
positive height anomalies over the Prairies in September 2011 were the fifth highest in the
NCEP-NCAR reanalysis since 1948. This configuration was not favourable for precipi-
tation, and most of the Prairies experienced much-below-normal precipitation in Sep-
tember 2011 (Fig. 11b).
5.2 Concurrent wet and dry regions
The monthly data for the contrasting events discussed below suggest that the atmospheric
flow patterns that resulted in the precipitation gradients tended to be persistent and/or
stagnant. For example, although June 2009 was near the peak of the drought over the
agricultural zone, precipitation anomalies of up to 200 % above normal were observed
over the western boreal zone only 250–300 km away (Fig. 12a). Reasons for the
Nat Hazards
123

Fig. 9 Number of lightning-caused fires (bars) and the area burned (solid line) over the Canadian PrairieProvinces between 1981 and 2011 (left panel). The distribution of the large fires ([200 ha) by province isshown in the right-hand side panel
Fig. 10 Monthly fields for March and April 2010 for a, b precipitation departures, c, d 500-mb heights, ande, f 500-mb height anomalies
Nat Hazards
123

contrasting precipitation over a relatively short distance included a split flow in the 500-mb
heights (Fig. 12b), with a trough over the coast of California and zonal flow over the
Canadian Prairies. Heights were above average over British Columbia and below average
over most of the Prairies (Fig. 12c), especially in the southeast. A weak upper-air trough
over the northern Prairie Provinces is evident in Fig. 12b. Although subtle, this feature
resulted in ascent over northern Saskatchewan and Manitoba (Fig. 12d). In contrast, mean
descent was observed over most of the agricultural zone, especially in the west. At 850 mb,
vector wind anomalies show enhanced westerly to south-westerly flow over most of the
agricultural zone (Fig. 12e), with an axis of convergence extending from north-eastern
Alberta to Manitoba. These factors worked in concert to produce the sharp precipitation
gradient over the western Prairies that persisted through the summer.
In June 2010, while severe flooding was occurring over the central and southern Prairies
(Phillips 2011), forest fires were raging over northern Saskatchewan and a drought was
occurring in the Peace Country of Alberta. Over a distance of only *250 km, monthly
precipitation amounts transitioned from[150 % of average over southern Saskatchewan to
\40 % of average over the boreal zone (Fig. 13a). A trough was present over British
Columbia with ridge downstream (Fig. 13b). Heights were below average over British
Columbia, but were near normal over the Prairies (Fig. 13c). Enhanced ascent was present
downstream of the trough over most of the Prairies, with descent over northern Sas-
katchewan and Manitoba (Fig. 13d). At 850 mb, vector wind anomalies indicated a per-
sistent cyclonic flow over the southern Prairies (Fig. 13e), with northward transport of
moist air from the USA. The combination of enhanced ascent and high low-level moisture
led to above-normal precipitation over most of the agricultural zone (110–180 % of
average). In contrast, mid-tropospheric descent caused very dry conditions (\40 % of
average) over most of the boreal zone.
In May 2011, very dry conditions were observed over most of the boreal zone (as well
as central Alberta and Saskatchewan), with wet conditions over far south-eastern Sas-
katchewan and southern Manitoba (Fig. 14a). A trough was present along the west coast at
500 mb (Fig. 14b), with an omega block over the boreal zone (anomalies[?80 gpm near
Great Slave Lake were the second highest on record for this region in May in the NCEP-
NCAR reanalysis). Consequently, heights were above average over most of the Prairie
Provinces, with below-average heights evident south of the Canada–US border (Fig. 14c).
Strong descent was observed over drought areas (Fig. 14d), with enhanced ascent over
southern Alberta, southern Saskatchewan and Manitoba. A moist easterly flow was evident
over southern Manitoba and south-eastern Saskatchewan. Heavy precipitation (monthly
precipitation *150 mm or [200 % of average) occurred along the southern base of the
omega block over south-eastern Saskatchewan and far south-western Manitoba (Fig. 14a).
5.3 Composite maps for heavy precipitation events
High-impact heavy rainfall events between May and September for 2009, 2010 and 2011
were identified. To qualify, a precipitation event had to be associated with C50 mm of rain
in 48 h in the CaPA data or station data and had to be associated with a damage report or
societal disruption. Events over the agricultural zone were divided into nine events west of
105� W and six events east of 105�W.
Composite maps for the nine high-impact events over the western agricultural zone are
shown in Fig. 15. All but one of the events was associated with a 500-mb closed low over
southern British Columbia or southern Alberta. This is reflected by the closed 5,600 gpm
contour over British Columbia (Fig. 15a). This observation is consistent with previous
Nat Hazards
123
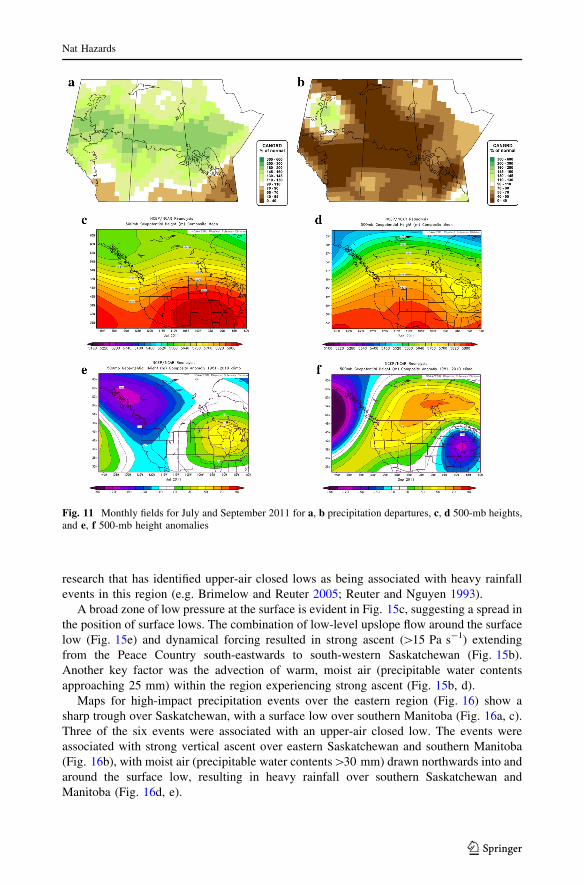
research that has identified upper-air closed lows as being associated with heavy rainfall
events in this region (e.g. Brimelow and Reuter 2005; Reuter and Nguyen 1993).
A broad zone of low pressure at the surface is evident in Fig. 15c, suggesting a spread in
the position of surface lows. The combination of low-level upslope flow around the surface
low (Fig. 15e) and dynamical forcing resulted in strong ascent ([15 Pa s-1) extending
from the Peace Country south-eastwards to south-western Saskatchewan (Fig. 15b).
Another key factor was the advection of warm, moist air (precipitable water contents
approaching 25 mm) within the region experiencing strong ascent (Fig. 15b, d).
Maps for high-impact precipitation events over the eastern region (Fig. 16) show a
sharp trough over Saskatchewan, with a surface low over southern Manitoba (Fig. 16a, c).
Three of the six events were associated with an upper-air closed low. The events were
associated with strong vertical ascent over eastern Saskatchewan and southern Manitoba
(Fig. 16b), with moist air (precipitable water contents[30 mm) drawn northwards into and
around the surface low, resulting in heavy rainfall over southern Saskatchewan and
Manitoba (Fig. 16d, e).
Fig. 11 Monthly fields for July and September 2011 for a, b precipitation departures, c, d 500-mb heights,and e, f 500-mb height anomalies
Nat Hazards
123

6 Discussion and conclusions
This study has characterized the devastating natural hazards that occurred on the Canadian
Prairies from 2009 through 2011 in terms of the physical processes related to spatially
contrasting precipitation states and rapid temporal transitions between precipitation
regimes. Several key observations concerning the spatio-temporal distribution of precipi-
tation, their causes and impacts have been made. Subtle differences in large-scale flow had
marked impact on precipitation, and primary factors controlling the distribution and
amount of precipitation included the location and persistence of key surface and upper-air
features and their interaction.
Fig. 12 Monthly maps for June 2009 for a precipitation departure (per cent of normal), b mean 500-mbheights (gpm), c 500-mb height anomalies (relative to 1981–2010 climatology), d 500-mb vertical motion(Pa s-1) anomalies and e 850-mb vector wind anomalies (m s-1)
Nat Hazards
123

Two break points in precipitation regimes were observed. The first in April 2010
marked the transition to pluvial conditions following a prolonged period of drought. The
second occurred between July and September 2011 when pluvial conditions transitioned to
drought. The former shift was the result of an eastward progression of the Rossby wave
train, whereas the latter was in response to the retrogression of the wave train. Shifts in
Rossby waves may have affected the storm track and the precipitation distribution. For
example, much-below-average cyclonic activity over the southern prairies in March 2010
transitioned to much-above-average activity over the south-central regions in April as the
upper trough shifted eastwards.
Three months during which adjacent regions had contrasting precipitation regimes (June
2009, June 2010 and May 2011) were found to share similar, but sometimes subtly
Fig. 13 Same as in Fig. 12 except for June 2010
Nat Hazards
123
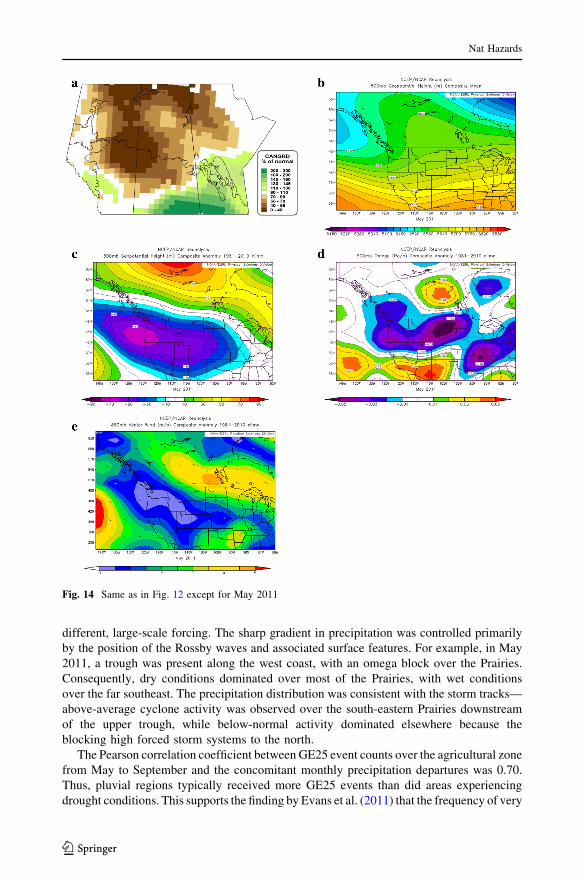
different, large-scale forcing. The sharp gradient in precipitation was controlled primarily
by the position of the Rossby waves and associated surface features. For example, in May
2011, a trough was present along the west coast, with an omega block over the Prairies.
Consequently, dry conditions dominated over most of the Prairies, with wet conditions
over the far southeast. The precipitation distribution was consistent with the storm tracks—
above-average cyclone activity was observed over the south-eastern Prairies downstream
of the upper trough, while below-normal activity dominated elsewhere because the
blocking high forced storm systems to the north.
The Pearson correlation coefficient between GE25 event counts over the agricultural zone
from May to September and the concomitant monthly precipitation departures was 0.70.
Thus, pluvial regions typically received more GE25 events than did areas experiencing
drought conditions. This supports the finding by Evans et al. (2011) that the frequency of very
Fig. 14 Same as in Fig. 12 except for May 2011
Nat Hazards
123

heavy rainfall events is critical for determining whether a region experiences drought or
pluvial conditions. Further, GE25 events are an important component of the hydrological
cycle in this region and can account for up to 55 % of warm season rain at some locations,
although the mean contribution averaged over the agricultural zone is *20 %. Station data
for three Prairie sites in Evans et al. (2011) showed that from circa 1900 to 2004 the con-
tribution of 25 mm events to warm season rainfall was 20–25 %.
All but one of the nine high-impact heavy rainfall events over the western Prairies were
associated with a closed 500-mb low over southern British Columbia or southern Alberta,
with a surface low in the lee of the Rockies. Over the eastern Prairies, high-impact heavy
events were associated with a sharp upper trough over Saskatchewan, with a surface low
over southern Manitoba. Only three of the eastern events were associated with a cold low;
thus, cold lows may not be as critical for producing heavy rainfall events in this region. In
both regions, advection of moist low-level air from the US beneath strong dynamically
Fig. 15 Composite maps for nine high-impact heavy rainfall events (locations indicated by ‘‘X’’) over theagricultural zone west of 105�W. Shown are a 500-mb heights (gpm), b 500-mb vertical motion (Pa s-1;negative values indicate ascent), c mean sea-level pressure (mb), d columnar integrated water vapour(kg m-2) and e 850-mb vector winds (speeds in m s-1)
Nat Hazards
123

forced ascent led to heavy rain. In the west, upslope flow processes forced by the Rockies
likely enhanced the lift and precipitation (Flesch and Reuter 2012). The synoptic-scale
setting for western events is consistent with previous research on heavy events over the
western Prairies (e.g. Chung et al. 1976; Brimelow and Reuter 2005; Szeto et al. 2011).
Over the Canadian Prairies, temperature is modulated primarily by cloud cover and
precipitation in the spring and summer months (Tang and Leng 2013); specifically, tem-
perature is typically negatively correlated with cloud cover and precipitation in this region.
However, between April and September 2009, drought conditions were associated with
below-average temperatures. This particular combination is rare but not unprecedented on
the Prairies—for example, Stewart et al. (2012) identified 15 months from 1900 to 2009
when the temperature and precipitation were both below normal over central Alberta.
The Slave Lake fire in May 2011 and large fires in northern Saskatchewan in June and
July 2010 were preceded by anomalously warm and dry conditions. Although weather is
but one of several factors that influence seasonal fire activity and burn area (e.g. Flannigan
et al. 2005), it does play an important role. To elucidate this, concurrent anomalies of
Fig. 16 Same as for Fig. 15, except for six high-impact heavy rainfall events (locations indicated by opencircles) over the agricultural zone east of 105�W
Nat Hazards
123

monthly temperature, precipitation and thunderstorm day counts at grid points closest to
initiation point for 226 fires observed over the Canadian Prairie Provinces between 2009
and 2011 were identified.
For 58 % of the fire initiation points, the temperature was above- to much-above normal
for that time of the year. Similarly, the majority of fires (55 %) started at locations with
below-average precipitation. In contrast, 32 % of the fires started at grid points with above-
normal precipitation. About 45 % of the fires started at locations that experienced above-
normal temperatures and below-normal precipitation, whereas 20 % of the fires started at
locations that experienced near- to above-normal temperatures and above-normal precip-
itation. A possible explanation for this last finding is that dry conditions likely preceded the
time the fire started, with rain falling after the fire start date. An analysis of thunderstorm
day counts revealed that there were almost equal chances of fire start locations being
associated with either below-, near- or above-normal thunderstorm day anomalies. This is
perhaps expected given the stochastic nature of lightning and the fact that only one CG
strike under ideal conditions is needed to start a fire.
The high spatio-temporal variability of precipitation identified in this study corroborates
similar findings in the literature (e.g. Soule 1993; Potop et al. 2013) and underscores the
challenges of issuing reliable monthly and seasonal forecasts. Importantly, multiple heavy
rainfall events—rather than individual extremes—were responsible for flooding over the
Prairies and the ARB. This is somewhat analogous to the conditions that caused the 1993
floods over the midwestern USA (Kunkel et al. 1993; Guttman et al. 1994; Junker et al.
1999) when extreme flooding was aggravated by multiple mesoscale convective complexes
that produced heavy rain (Kempf and Krider 2003).
This study showed how varying types of natural hazards can occur close together in
space and time as the result of persistent circulation patterns. We, however, examined only
a three-year period and cannot speak to the significance of the observed spatio-temporal
variability in the historical record. Work is underway to quantify spatio-temporal changes
in precipitation variability close together in space and time in the climate record, to
examine the atmospheric and surface processes at play in the development of the historic
flooding over the ARB, and to quantify the contribution of thunderstorm rain to warm
season rainfall. We anticipate that these efforts will present a cohesive understanding of
precipitation-related extremes on the Prairies, in addition to helping develop appropriate
adaptation strategies.
Acknowledgments This research was supported by the Canadian Foundation for Climate and Atmo-spheric Sciences and the Changing Cold Regions Network funded by the Natural Sciences and EngineeringResearch Council of Canada. The authors appreciate the assistance of Lucie Vincent, Eva Mekis and EwaMilewska for providing the CANGRD temperature and precipitation data, respectively; Vincent Fortin andBruce Davison for providing the CaPA data; and John Little of the Canadian Forest Service for providingthe wildfire data and area-burned shapefiles. NCEP reanalysis data were provided by the NOAA/OAR/ESRLPSD, Boulder, Colorado, US, from their website at http://www.esrl.noaa.gov/psd/. The authors would alsolike to thank the two anonymous reviewers for their very helpful reviews.
References
Akinremi OO, McGinn SM, Cutforth HW (1999) Precipitation trends on the Canadian Prairies. J Clim12:2996–3003
Benestad RE, Haugen JE (2007) On complex extremes: flood hazards and combined high spring-timeprecipitation and temperature in Norway. Clim Change 85:381–406
Nat Hazards
123

Bonsal BR, Wheaton EE, Chipanshi AC, Lin C, Sauchyn DJ, Wen L (2011) Drought research in Canada: areview. Atmos Ocean 49:303–309
Brimelow JC, Reuter GW (2005) Transport of atmospheric moisture during three extreme rainfall eventsover the Mackenzie River basin. J Hydrometeor 6:423–440
Burrows WR, Kochtubajda B (2010) A decade of cloud-to-ground lightning in Canada: 1999–2008. Part 1:flash density and occurrence. Atmos Ocean 48:177–194
Canadian Boreal Initiative (2013) http://borealcanada.ca/boreal-regions-e.php. Accessed 11 Oct 2013Canadian Forest Service (2012) National Fire Database—Agency Fire Data. Natural Resources Canada,
Canadian Forest Service, Northern Forestry Centre, Edmonton, Alberta. http://cwfis.cfs.nrcan.gc.ca/en_CA/nfdb/poly
Chung YS, Hage KD, Reinelt ER (1976) On lee cyclogenesis and airflow in the Canadian Rocky Mountainsand the East Asian mountains. Mon Weather Rev 104:879–891
Evans E, Stewart RE, Henson W, Saunders K (2011) On precipitation and virga over three locations duringthe 1999–2004 Canadian Prairie drought. Atmos Ocean 49:366–379
Flannigan MD, Logan KA, Amiro BD, Skinner WR, Stocks BJ (2005) Future area burned in Canada. ClimChange 72:1–16
Flesch TK, Reuter RW (2012) WRF model simulation of two Alberta flooding events and the impact oftopography. J Hydrometeor 13:695–708
Government of Manitoba (2012) http://news.gov.mb.ca/news/index.html?archive=2012-11-01&item=15561. Accessed 25 Jan 2013
Guttman NB, Hosking JRM, Wallis JR (1994) The 1993 Midwest extreme precipitation in historical andprobabilistic perspective. Bull Am Met Soc 75:1785–1792
Hanesiak JM, Stewart R, Bonsal B, Harder P, Lawford R, Aider R, Amiro B, Atallah E, Barr A, Black T,Bullock P, Brimelow J, Brown R, Carmichael H, Derksen C, Flanagan L, Gachon P, Greene H,Gyakum J, Henson W, Hogg E, Kochtubajda B, Leighton H, Lin C, Luo Y, McCaughey J, Meinert A,Shabbar A, Snelgrove K, Szeto K, Trishchenko A, van der Kamp G, Wang S, Wen L, Wheaton E,Wielki C, Yang Y, Yirdaw S, Zha T (2011) Characterization and summary of the 1999–2005 CanadianPrairie drought. Atmos Ocean 49:421–452
Higgins RW, Silva VBS, Shi W, Larson J (2007) Relationships between climate variability and fluctuationsin daily precipitation over the United States. J Clim 20:3561–3579
Insurance Bureau of Canada (2012) Telling the weather story. Final report, prepared by the Institute forCatastrophic Loss Reduction 2012, 67 pp
IPCC (2012) Managing the risks of extreme events and disasters to advance climate change adaptation. In:Field CB, Barros V, Stocker TF, Qin D, Dokken DJ, Ebi KL, Mastrandrea MD, Mach KJ, Plattner G-K,Allen SK, Tignor M, Midgley PM (eds) A Special Report of Working Groups I and II of the Inter-governmental Panel on Climate Change. Cambridge University Press, Cambridge, 582 pp
Junker NW, Schneider RS, Fauver SF (1999) A study of heavy rainfall events during the great Midwestflood of 1993. Weather Forecast 14:701–712
Kalnay E, Kanamitsu M, Kistler R, Collins W, Deaven D, Gandin L, Iredell M, Saha S, White G, Woollen J,Zhu Y, Chelliah M, Ebisuzaki W, Higgins W, Janowiak J, Mo KC, Ropelewski C, Wang J, Leetmaa A,Reynolds R, Jenne R, Joseph D (1996) The NMC/NCAR 40-Year Reanalysis Project. Bull Am MeteorSoc 77:437–471
Kempf NM, Krider EP (2003) Cloud-to-ground lightning and surface rainfall during the great flood of 1993.Mon Weather Rev 131:1140–1149
Kochtubajda B, Burrows WR, Liu A, Patten JK (2013) Surface rainfall and cloud-to ground lightningrelationships in Canada. Atmos Ocean 51:226–238
Kunkel KE, Changnon SA, Angel JR (1993) Climatic aspects of the 1993 upper Mississippi River basinflood. Bull Am Meteorol Soc 75:811–822
Mahfouf J, Brasnett B, Gagnon S (2007) A Canadian Precipitation Analysis (CaPA) Project: description andpreliminary results. Atmos Ocean 45:1–17
Mekis E, Hogg WD (1999) Rehabilitation and analysis of Canadian daily precipitation time series. AtmosOcean 37:53–85
Parisien M-A, Peters VS, Wang Y, Little JM, Bosch EM, Stocks BJ (2006) Spatial patterns of forest fires inCanada, 1980–1999. Int J Wildland Fire 15:361–374
Phillips D (2010) Top 10 Canadian weather stories for 2009. CMOS Bull 38:18–24Phillips D (2011) Top 10 Canadian weather stories for 2010. CMOS Bull 39:12–21Phillips D (2012) Top 10 Canadian weather stories for 2011. CMOS Bull 40:12–22Potop V, Boroneant C, Mozny M, Stepanek P, Skalak P (2013) Observed spatiotemporal characteristics of
drought on various time scales over the Czech Republic. Theor Appl Climatol. doi:10.1007/s00704-013-0908-y
Nat Hazards
123
Reuter GW, Nguyen CD (1993) Organization of cloud and precipitation in an Alberta storm. Atmos Res30:127–141
Rorig M, Ferguson SA (1999) Characteristics of lightning and wildfire ignition in the Pacific Northwest.J Appl Meteorol 38:1565–1575
Saskatchewan Wildfire Management Strategy (2013) http://www.environment.gov.sk.ca/fire. Accessed Oct11 2013
Schwalm CR, Williams CA, Schaefer K, Baldocchi D, Black TA, Goldstein AH, Law BE, Oechel WC, PawKT, Scott RL (2012) Reduction in carbon uptake during turn of the century drought in western NorthAmerica. Nat Geosci 5:551–556
Soula S, Sauvageot H, Molinie G, Mesnard F, Chauzy S (1998) The CG lightning activity of a storm causinga flash-flood. Geophys Res Lett 25:1181–1184
Soule PT (1993) Hydrologic drought in the contiguous United States, 1900–1989: spatial patterns andmultiple comparison of means. J Geophys Res 20:2367–2370
Stewart RE, Pomeroy J, Lawford R (2011) The Drought Research Initiative: a comprehensive examinationof drought over the Canadian Prairies. Atmos Ocean 49:298–302
Stewart RE, Bonsal BR, Harder P, Henson W, Kochtubajda B (2012) Cold and hot periods associated withdrought over the Canadian Prairies. Atmos Ocean 50:364–372
Stocks BJ, Mason JA, Todd JB, Bosch EM, Wotton BM, Amiro BD, Flannigan MD, Hirsch KG, Logan KA,Martell DL, Skinner WR (2003) Large forest fires in Canada, 1959–1997. J Geophys Res 108:8149.doi:10.1029/2001JD000484
Szeto KK, Henson W, Stewart RE, Gascon G (2011) The catastrophic June 2002 Prairie rainstorm. AtmosOcean 49:380–395
Tang Q, Leng G (2013) Changes in cloud cover, precipitation, and summer temperature in North Americafrom 1982 to 2009. J Clim 26:1733–1744
Turner BL, Kasperson RE, Matson PA, McCarthy JJ, Corell RW, Christensen L, Eckley N, Kasperson JX,Luers A, Martello ML, Polsky C, Pulsipher A, Schiller A (2003) A framework for vulnerabilityanalysis in sustainability science. Proc Natl Acad Sci 100:8074–8079
Vincent LA (1998) A technique for the identification of inhomogeneities in Canadian temperature series.J Clim 11:1094–1104
Vincent LA, Gullet DW (1999) Canadian historical and homogeneous temperature datasets for climatechange analyses. Int J Climatol 19:1375–1388
Wheaton EE, Kulshreshtha S, Wittrock V, Koshida G (2008) Dry times: lessons from the Canadian droughtof 2001 and 2002. Can Geogr 52:241–262. Saskatchewan Research Council Publiction No.11927-6A06
Zhang X, Alexander L, Hegerl GC, Jones P, Tank A, Peterson TC, Trewin B, Zwiers FW (2011) Indices formonitoring changes in extremes based on daily temperature and precipitation data. WIREs ClimChange 2:851–870. doi:10.1002/wcc.147
Nat Hazards
123