Embed Size (px)
Citation preview

PhD Thesis
Characterization and modification of cell
membrane derived vesicles
Róbert Deák
BIOLOGICAL NANOCHEMISTY RESEARCH GROUP, RESEARCH CENTRE FOR NATURAL
SCIENCES
Supervisor: Attila Bóta, PhD, DSc
Consultant: Judith Mihály, PhD
CHEMISTRY DOCTORAL SCHOOL, INSTITUE OF CHEMISTRY, EÖTVÖS LORÁND UNIVERSITY
Head: Attila Császár, PhD, DSc
SYNTHETIC CHEMISTRY, ORGANIC AND BIOMOLECULAR CHEMISTRY
Head: András Perczel, PhD, DSc
2019


i
Table of contents
Abbreviations ................................................................................................ I
1. Introduction ............................................................................................. 1
2. Background and Literature ................................................................... 3
2.1. Vesicles; their formation and main characteristics ....................................................... 3
2.2. Extracellular vesicles (EVs) ............................................................................................. 6
2.2.1. Genesis and biological function of EVs ...................................................................... 6
2.2.2. Characterization of EVs .............................................................................................. 7
2.3. Artificial vesicles with natural origin ............................................................................. 8
2.4. Characterization methods of vesicles and membrane systems .................................. 11
2.4.1 Size determination ...................................................................................................... 12
2.4.2 Morphology ................................................................................................................ 14
2.4.3 Thermal behaviour ..................................................................................................... 16
2.4.4 Structure in the nanometre range ............................................................................... 17
2.4.5 Structure in the atomic scale ...................................................................................... 21
3. Aims of the work ................................................................................... 27
4. Materials and Methods ......................................................................... 29
4.1. Chemicals and reagents ................................................................................................. 29
4.2. Preparation protocols .................................................................................................... 30
4.2.1. Preparation of reference – model – vesicles .............................................................. 30
4.2.2. Extracellular vesicle (EV) isolation protocols .......................................................... 30
4.2.3. Preparation of haemoglobin free ghosts and nanoerythrosomes ............................... 32
4.3. Instruments and parameters of measurements ........................................................... 34
5. Results and Discussion .......................................................................... 38
5.1. Physicochemical characterization of extracellular vesicles ........................................ 38
5.2. Spectroscopic characterization of extracellular vesicles ............................................. 40
5.2.1. FTIR analysis of Jurkat cell derived EV suspensions ............................................... 40
5.2.2. Spectroscopic assessment of protein and lipid components of biological vesicles ... 44
5.2.3. Structural analysis of EVs by polarized light spectroscopy ...................................... 49

ii
5.3. From ghost membranes to nanoerythrosomes ............................................................. 51
5.3.1. The utilization of cell membranes in vesicle preparation .......................................... 51
5.3.2. The tailoring of nanoerythrosomes with phospholipid additives .............................. 60
Summarization of the results ................................................................... 87
Acknowledgements .................................................................................... 93
List of figures ............................................................................................. 94
List of tables ............................................................................................... 97
References .................................................................................................. 99

I
Abbreviations
AB – apoptotic body
ATR – attenuated total reflection
BSA – bovine serum albumin
CD – circular dichroism
DLS – dynamic light scattering
DOPC - 1,2-dioleoyl-sn-glycero-3-phosphocholine
DPPC - 1,2-dipalmitoyl-sn-glycero-3-phosphocholine
DPPE - 1,2-dipalmitoyl-sn-glycero-3-phosphoethanolamine
DSC – differential scanning calorimetry
ED – electron density
EMP – extra-membrane particle
EV – extracellular vesicle
EXO - exosome
FBS – fetal bovine serum
FF – freeze fracture
FTIR - Fourier transform infrared spectroscopy
LC MS - liquid chromatography–mass spectrometry
LD – linear dichroism
LPC - lysophosphatidylcholine
MLV – multilamellar vesicle
MVA – multivesicular aggregate
P/L – protein to lipid ratio
PBS – phosphate buffered saline
PC - phosphatidylcholine

II
PE - phosphatidylethanolamine
PEG - polyethylene-glycol
PI - phosphatidylinositol
PS - phosphatidylserine
RBC – red blood cell
REV – red blood cell derived extracellular vesicle
RNA – ribonucleic acid
SAXS – small angle x-ray scattering
SM - sphingomyelin
TDM – transition dipole moment
TEM – transmission electron microscopy
UCF - ultracentrifugation
ULV – unilamellar vesicle
US - ultrasonication
WAXS – wide angle x-ray scattering

1
1. Introduction
Vesicles may be one of the most important pharmaceutical delivery systems on
the expanding field of nanomedicines. Intravenously injectable liposomes contain
PEGylated phospholipids (polyethylene glycol covalently coupled with
phosphoethanolamine, DSPE-PEG 2000 Da). The PEG chains cover the surface of the
vesicles and result in the steric stabilisation of the objects, whereby a long circulation
time in the vascular system is assured. Although the PEGylated surface of the vesicles
may induce a reduced response from the immune system of the patient, a complement
pseudo-allergy frequently occurs, which can lead to lethal cases in the clinical praxis. To
avoid the toxic effects, an intense worldwide research is in progress to replace the
PEGylated lipids and find alternative constituents for steric stabilisation. Different
biomacromolecules (for example: hyaluronan, chitosan, poly-malic-acid, poly-lactic-
acid) have already been used for the manufacturing of vesicles. Recently the presence of
hyaluronan coated extracellular vesicles was reported in human synovial fluid, which
directs our attention on natural vesicles, where the stabilization is assured by the
automatized mechanisms of biological evolution.
Natural vesicles are complex, versatile relatives of the liposomes, produced by all
kinds of living cells, from the smallest prokaryotes to the most complex organisms. These
vesicles are derived from the plasma membrane and secreted into the extracellular space,
earning their name: extracellular vesicles (EVs) based on this process. Extracellular
vesicles have an extremely complex composition, which grants them properties best fit
for their biological role. As EVs are the tools of transport and communication between
cells, they are small (certain types have an average size of 30 nm), stabile, targeted and
loaded with numerous functional biomolecules (e.g. proteins and RNAs).
The connection between artificial and natural vesicles is represented by
nanoerythrosomes. Nanoerythrosomes are derived from erythrocyte ghosts. The
produced vesicles reportedly keep their natural composition and achieve stabile,
approximately 150 nm size. Due to their natural origin, these particles are biocompatible
and could possibly be further modified by synthetic additives as well. Beside their useful
properties, nanoerythrosomes can be produced in abundance, as red blood cells are
arguably one of the best and most frequent source of cell membrane material.

2
Nanoerythrosomes can bypass the blood-brain barrier and have been used as
additives to camouflage nanoparticles - for example gold nanoparticles in biological
imaging. They could also be used as reference materials for extracellular vesicles, due to
their similar biological membrane. As a fully biomimetic system, nanoerythrosomes are
promising tools for personalized medicines. The elaboration of a nanoerythrosomal drug
delivery system may start from the patient’s own blood, considerably reducing the risk of
immunogenicity. I hope that my work represents perspectives on the path leading in this
direction.
The studying of both the artificial and natural vesicle-like systems require a
number of techniques, not only to determine different features (e.g. structural,
morphological, calorimetric, optical, mechanical) in static and dynamic manners, but also
to reveal quantities on a wide size range extending from the atomic scale to the
micrometres. In the Thesis, after the presentation of the vesicle-like systems I briefly
describe the applied methods, focusing on parts, which may be important for the
interpretation of the results. The results are mainly concerning the novel types of
nanoerythrosomes, produced by me first, therefore I intend to give a detailed description
on the preparation and measurement protocols, to assure the reproduction of the systems
by potential successors.

3
2. Background and Literature
2.1. Vesicles; their formation and main characteristics
Vesicles, or with other word liposomes, are lipid based, nearly spherical, typically
multilamellar objects, which are composed from alternating lipid bilayers and water shells
(1). The „vesicle” terminology was originally referring to small compartments of different
natural, biological systems used in cytology, while “liposome” was a biochemical
denomination. Recently both names are widespread. Vesicles, as artificial creations are
formed via self-assembly in a two-component liquid phase system consisting of
amphipathic lipids and water (Figure 1) (2) (3). The self-assembly results in different
formations depending on the ratio of the two components as well as the size, shape and
chemical behaviour of the lipid at a given temperature (4). The rigorous classification is
used in physics and the systems of hydrated lipids are referred to as lyotropic systems (5)
(6).
The vesicles could be considered as model systems of the biological membranes
because their characteristic structural units, the lipid bilayers are highly similar (7). For
bilayer formation the shape of the molecules is an important attribute: majority of the
phospholipids have to be cylindrical, or slightly conical. Cylindrical lipids support the
horizontal growth of the membrane, because the head group and the chain regions of the
molecules occupy approximately the same lateral space and they do not induce curvature
when densely packed together. As huge planar bilayers are not favoured
thermodynamically, the large membranes eventually turn into spherical vesicles, which
minimalize their surface energy (8).
Vesicles are either produced from one (or more) types of artificial lipids, or from
natural lipids extracted from different organisms (bacteria, plants, mammals) or tissues
(brain etc.). In the latter case more realistic and fully bio-mimic membranes could be
obtained, but these vesicles exhibit complex, hardly adjustable physico-chemical features
(9) (10).
Hydrated phospholipids typically result in large stacks of concentric bilayers,
called multilamellar vesicles (MLVs) – or even vesicles inside another: multivesicular
aggregates (Figure 1) (11). In this case the correlation between the multilayers is strongly
disrupted and “vesicles in vesicle” can occur. Single bilayer containing unilamellar
vesicles (ULVs) could also be prepared but these forms are not stabile without additives.

4
When the number of lamellae is a reduced number, typically between 2 and 6, the objects
are called oligolamellar vesicles (12) (13).
Figure 1. Phospholipid molecules and their formations in aqueous buffers. The effect of
lipid geometries [e.g. phosphatidylcholine (PC), lysophosphatidylcholine (LPC) and
phosphatidylethanolamine (PE)] on the membrane curvature. Typical bilayer formations:
unilamellar- (ULV) and multilamellar vesicles (MLV) and multivesicular aggregates
(MVA).
The spontaneous arrangement of phospholipids and the aggregation of membrane
particles make vesicular suspensions highly polydisperse. To produce stabile,
homogeneous, unilamellar vesicles, typically additives - such as cholesterol, or special
phospholipids (conical or conjugated ones) are required. The preparation process almost
always include some kind of sonication or extrusion, in which the applied intensity and
pore size are used to adjust the size of the particles, respectively (14).
Furthermore, membrane-mimicking vesicles are not static systems. Their molecular
constituents make intensive fluctuations and rotations, they move laterally in the
membrane with high frequency and rarely even change their place between the inner and
outer leaflet of the bilayer. This fluid character of the membranes and the interactions
between the vesicles induce the aggregation and fusion of the particles with time (15).
As lipid molecules are the smallest essential packing elements of the membrane,
their character and composition have a significant impact on the resulting vesicles. Lipids

5
represent a diverse group of organic compounds including fats, oils, hormones and other
small, organic, membrane constituents, which are not water soluble. The three principal
classes of lipids that can construct bilayers are glycerophospholipids (shortly:
phospholipids), sphingolipids, and sterols (principally cholesterol) (16). In the Thesis the
observed physicochemical effects are in connection with phospholipids, therefore the
term “lipid” generally refers to “phospholipids”. The basic structure of the bilayer is
created by phospholipids. The length and saturation of the lipids acyl chains define the
hydrophobic region of the bilayer. By the modification of the lipid chains, the thickness
and fluidity of the membrane can be altered. Incorporation of guest molecules, such as
cholesterol, into the hydrophobic region also has a significant effect on the dynamics and
thermotropic attributes of the membranes (17).
Figure 2. Modification of the liposome membrane (18)
The phosphate head group of the lipid molecules and its alternation is responsible
for the surface character of the vesicles (Figure 2) (19) (20). The phosphate groups could
be conjugated with functional molecules, which might either help in signalling and
targeting (e.g. functional proteins), or grant steric stabilization (polyethylene-glycol -
PEG) for the vesicle (21). The head group is also responsible for the charge of the lipid:
positive, negative or zwitterionic lipids are all available. Finally, the size of the head
group compared to occupied space of fatty acid chains (defined by their number, length

6
and saturation), determines the geometrical properties of the phospholipids. The shape of
the molecule created the structure of the established membranes, resulting in bilayers, or
different types of micelles, by cylindrical or conical lipids, respectively (Figure 1) (16).
2.2. Extracellular vesicles (EVs)
2.2.1. Genesis and biological function of EVs
Extracellular vesicles are natural vesicles, created by living cells and secreted into
the extracellular space (22) (23) Figure 3. They serve as tools of intercellular
communication and transport processes (24) (25). The EVs are derived from cellular
membranes and have similar composition to their parent cells (26). They carry a wide
variety of molecules, depending on the type of the vesicle as well as the physiological
state of the emitter cell. Typical transported molecules are functional proteins and nucleic
acids – especially RNAs, like messenger- (mRNA), micro- (miRNA) or small interfering
RNA (siRNA) (27) (28) (29) (30). The composition and concentration of the released
vesicles alter in healthy and in sick patients, therefore their detailed analysis is important
for diagnostic and therapeutic purposes (31) (32) (33) (34).
Figure 3. Extracellular vesicle classification according to production pathway and
characteristic size
EVs are a diverse group of vesicles that can be classified easiest by the way of
production. According to their origin, the common classes of EVs are microvesicles
(MVs), exosomes (EXOs) and apoptotic bodies (AB) (35). Strictly speaking the former

7
two, MVs and EXOs form a smaller group of EVs as they are created by an internal desire
of the cell to affect on its environment. Microvesicles are derived from the plasma
membrane by a shedding process, while exosomes are built up in an intracellular organell,
called the multivesicular body (MVB). The MVB is responsible for the loading and
functionalization of the exosomes and by its fusion with the cell membrane the vesicles
are secreted into the extracellular matrix. In contrast, apoptotic bodies are the products of
the programmed cell death (apoptosis), where the cell is disrupted in a controlled process,
resulting in giant vesicles of residual cellular material (36) (37).
Due to their different production pathways, the subpopulations of extracellular
vesicles have significantly different characteristics. Apoptotic bodies are the most
heterogeneous vesicles, as far as their size and composition is concerned (25). They are
the largest of all the EVs, usually above one micrometre, often comparable to the size of
the cells. According to their function ABs may be viewed as degraded cellular packages,
containing partially decomposed organelles and inflammation molecules (38). Their in
vivo clearance from the extracellular matrix is quick, consequently an increased quantity
of ABs can be a sign of cell damaging agents (39). Microvesicles are approximately 100-
300 nm large particles produced by a shedding process from the plasma membrane (40).
As these particles are the direct derivatives of the outer membrane, they carry significant
information about its biomolecular pattern (41). Examination of microvesicles may be
important in processes that are related to the plasma membrane, or in the case of certain
cell types, which have simplified intracellular composition (such as red blood cells).
Exosomes are the smallest and most specific group of EVs. They are approximately 30-
100 nm large particles with the ability to transport signalling molecules to great distances
(42) (43). This function requires a unique composition that grants the vesicle stability and
targeting ability as well as the possibility to fuse with the membrane of the recipient cell.
These special characteristics put the exosomes in the spotlight of scientific experiments
in order to develop new and effective diagnostic, therapeutic and carrier nanostructures
(44) (45) (46). The exosomes represent the most advanced vesicles that the model lipid
systems aim to mimic in the future.
2.2.2. Characterization of EVs
The EV containing extracellular matrix is a complex suspension of cells,
submicron particles and biological molecules. The cells, cellular debris and other

8
nanoparticles make the isolation and characterization of EVs complicated. Furthermore,
the detection and studying of EVs from a single cell type could be challenging due to
their low concentration, especially in vivo (47) (48). Consequently, for modelling
purposes and fundamental research in-vitro cell cultures or purified suspensions of a
single cell type are used. In either case the general methods of isolation are the same.
Namely: separation by centrifugation (differential or gradient ultracentrifugation), gel
filtration (size exclusion chromatography) or using an immunoassay that isolates the
vesicles according to their specific surface markers (e.g. exosomal marker proteins: CD9,
CD63 or CD81) (49).
The purity and concentration are critical quality attributes of isolated EV
suspensions, but also limiting parameters for their characterization techniques.
Techniques that are used to examine unilamellar model vesicles could be applied for
extracellular vesicles as well. The structure and composition of small unilamellar vesicles
could be used for modelling exosomes and microvesicles with a few simplification - such
as the lack of membrane proteins and the lower diversity of lipid components (50).
Techniques that have limitation for complex membranes – such as DSC – cannot be used
for EV characterization.
The first step quality control of EV suspensions is the determination of their
particles size distribution (51). For this purpose generally DLS is used. DLS gives
information about the EV type and the purity of the EV population, by measuring its size
distribution and polydispersity. Compositional analysis is also important to typify the
vesicular suspensions, by the identification of EV marker molecules. There are a number
of techniques available for compositional analysis, ranging from simple electrophoretic
or colorimetric experiments to the complete proteomics and lipidomics of the vesicles
(52) (30). The previous ones have the disadvantage of being fairly unreliable, while the
latter ones are time and sample consuming and also not commonly accessible.
2.3. Artificial vesicles with natural origin
On the field of organic nanoparticle development, the ultimate goal could be the
reproduction of extracellular vesicles. EVs, especially exosomes and microvesicles are
small (approx. 100-200 nm) unilamellar vesicles that are stabilized by their unique
biomolecular - mostly lipid and membrane protein - composition (53). This special
composition grants them natural targeting, enhanced membrane permeability- and

9
therapeutic potential (46). EVs are the products of the cells, they are fully biocompatible
and degradable. Although the listed positive properties make them ideal nanocarrier
candidates, their direct application is complicated because of their low concentration and
difficult purification from the biological milieu.
On the other hand model vesicles are accessible in large quantities and are easily
tuneable by different additives. They are prepared from synthetic lipids in a laboratory or
industrial environment (54). By their modification many positive properties can be
achieved, such as enhanced stability, stealth character or even targeting ability (55) (56).
However, the stability of the vesicles can be increased by additives in vitro as well as in
vivo, their clearance from the organism is generally fast and the applied surface
modifications could easily lead to strong immune responses (57).
In the development of artificial vesicles one step towards the EVs is the
combination of natural membranes, or membrane components, with synthetic vesicles
(58) (59). By this process “hybrid” vesicles can be created that combine the biological
properties of the cellular membranes with the variability of model vesicles. These systems
are trying to reproduce extracellular vesicles, while remaining their more controlled
models, hoping to combine the positive properties of the two.
There are two practical approaches for the preparation of “hybrid” vesicles. The
first is to prepare the model vesicles in the desired amount and composition and then
trying to incorporate the extracted cell membrane components into them. Since in this
case the incorporated membrane particles are typically functional proteins, the created
vesicles are called proteoliposomes (59). Another method is when the cellular membrane
is isolated and purified in high concentration and then transformed into vesicles by
physicochemical processes (usually by extrusion and sonication) (60) (61). These vesicles
can be further supplemented with additives – typically with phospholipids, as their protein
content is already high. The nomenclature of these vesicles is based on their cellular
origin, for example vesicles prepared from red blood cell (erythrocyte) membrane are
called erythrosomes, or nanoerythrosomes – reflecting their small size (62).
Red blood cells (RBCs) are the most abundant cellular components of the blood,
giving approximately 40% of its total volume. In their matured form RBCs loose their
nucleus and most of their cellular organelles, to maximize space for haemoglobin
molecules. Haemoglobin makes up approximately 96% (w/w %) of the dry material
content of the cell and it is responsible for the binding and transport of oxygen and carbon-
dioxide. Red blood cells are ideal sources of membrane material as their plasma

10
membrane is widely characterized and can be isolated in high purity, without intracellular
membrane contamination (63).
Figure 4. Schematic representation of red blood cell membrane structure (64)
The RBC membrane has a unique composition that grants the cell high
deformability and flexibility (Figure 4) (65) (66). Their membrane is composed of three
layers: a glycocalyx (rich in carbohydrates) on the exterior, a lipid bilayer (containing
numerous transmembrane proteins) and a membrane skeleton, which is connected to the
inner side of the bilayer (67). The RBC membrane is rich in proteins, in human RBCs the
protein content is approximately half of the total membrane mass. According to their
function, the proteins can be transport proteins for molecules and ions (e.g.: Band 3
proteins, Na+/K+ transporters), adhesive molecules (e.g.: ICAM-4) or structural proteins
(e.g.: Ankyrin, Adducin or Spectrin). The lipid composition is also characteristic and
widely detailed for human RBCs (Figure 5). Generally speaking, the bilayer is composed
of phospholipids and cholesterol in 1:1 mass ratio. The phospholipid content has a special
distribution: the outer monolayer is mainly built up from phosphatidylcholine (PC) and
sphingomyelin (SM), while the inner monolayer contains phosphatidylethanolamine
(PE), phosphatidylinositol (PI) and phosphatidylserine (PS). This asymmetric
phospholipid distribution is crucial for the cell integrity and functions and it is maintained
by a series of lipid transporter molecules (scramblases, flippases and floppases) (68).

11
Figure 5. Asymmetric lipid composition of human red blood cell membrane (69)
Red blood cells tolerate the extremities of the environmental parameters very well.
Their structural properties allow them to go through the smallest capillaries (approx. 2
μm, while the diameter of RBCs is approximately 7-8 μm) and to be swollen or shrunken
in hypotonic or hypertonic solutions, respectively. If the cell is put in a hypotonic
medium, its volume is increased until a point when the integrity of the plasma membrane
is broken and the cytoplasm flows out, through the newly formed holes. This process is
often induced artificially and used for RBC membrane preparation. The empty residue
membranes are called ghosts (70). For membrane studies and nanoerythrosome
preparation typically RBC ghosts are used (71).
Nanoerythrosomes are approximately 100-200 nm large vesicles, produced from
RBC ghost membrane by extrusion or sonication (72) (62). The vesicles are direct
derivatives of the original plasma membrane, having its compositional heritage. With
lipid additives further modification of the nanoerythrosomes is possible. The character of
the lipid additive has a significant impact on the physicochemical properties of the
produced vesicles, whereby the homogeneity of the suspension could also be increased.
Their natural origin and tailoring ability make nanoerythrosomes ideal tools for
personalised therapeutics in the future (73) (74).
2.4. Characterization methods of vesicles and membrane systems
The relationship between function and structure is a fundamental importance for
understanding membrane mechanisms. The exploration of this relationship is frequently
effortful and in the case of complex membrane systems not trivial. In case of novel,
vesicle-like nanosystems - such as nanoerythrosomes, we put emphases on the complex
structural characterization.

12
The self-assembly of lipid molecules generally result in large multilamellar
vesicles with a diameter of several micrometres. Combined sonication and extrusion
processes as well as the application of additives produce different, characteristic size-
ranges, which have an impact on the function and applicability of the products. For
example the laterally extended (7-8 µm) ghost membranes can be transformed into
vesicle-like nanoerythrosomes with a characteristic diameter of approx. 150 nm. Further
additives can cause the formation of small vesicles with a size of only 30 – 40 nm. The
formation of nanoerythrosomes goes with the appearance of different surface patterns,
composed from a variety of membrane particles. Therefore the size characterization
should be supported with picturesque information as well. Nowadays, the cryo-electron
microscopy provides excellent possibilities in the description of three-dimensional shapes
even in sub-nanometre range (75), but freeze-fracture combined transmission electron
microscopy has an advantage over cryo-EM by showing all local forms of surface patterns
and domain formations in the vesicles (76). Beside the size, shape and morphological
characteristics of vesicles and vesicle-like nanoerythrosomes, one of the main concerns
is their stability over time. Few of the pure lipid-water systems are considered to be stable
on their own, most of the time this property is achieved by additives and surface
modification, like the conjugation of polyethylene-glycol chains, or incorporation of
sterane molecules (e.g. cholesterol or ursolic acid).
When vesicles with a net charge on their surface are dispersed in liquids, a layer
from counter-ions gather around them. This oppositely charged layer of ions is known as
the Stern layer. The Stern layer induces the formation of a second, outer layer, which
unlike the Stern layer only loosely connects to the vesicle. This outer layer is called a
diffusive layer and the two layers together form the electrical double layer. When the
vesicle moves in the liquid there is a boundary between the ions of the diffusive layer that
move with the particle and one that remains in the bulk dispersant. The electrostatic
potential in this moving plane boundary is called the zeta potential, its measurements is
also required for the characterization of the colloidal stability (77).
2.4.1 Size determination
Dynamic Light Scattering (DLS) is a routinely used technique to determine the
size distribution of a vesicle suspensions (51). The technique is based on the Brownian
motion of the particles (78). This means, that the solvent molecules are in permanent
movement by their thermal energy and continuously collide with the suspended particles
13
(in our case with the vesicles). These collisions induce a movement of the particles, which
is called the Brownian motion. The speed of the Brownian motion can be directly
measured from the scattered light pattern of the moving vesicle. The relation between the
speed of a particle’s Brownian motion and its hydrodynamic diameter is described by the
Einstein-Stokes equation:
𝐷 = 𝑘𝑇
3𝜋𝜂𝐷𝐻
Where D is the diffusion speed; k is the Boltzmann’s constant; T is the absolute
temperature; η is viscosity and DH is the hydrodynamic diameter of the particle.
According to the equation, the hydrodynamic diameter of the vesicles can be
calculated from the measured diffusion speed, if the temperature and viscosity of the
suspension is known and kept constant. DLS is suitable for the examination of
nanoparticles in a size ranging from 1 nm to micrometers, in concentration between 0.1
and 0.01 % (w/w), typically. Biggest limitation of the technique is its sensitivity for the
monodispersity of sample. Furthermore, sedimentation- or multiple light scattering of the
particles could also be limitation parameters of the method.
Measurement of zeta potential gives an indirect information about the net charge
on the particles surface. This charge is important, because it influences the stability of the
vesicle as well as its interactions with other particles in biological systems. Zeta potential
values can also predict the aggregation tendency of vesicles in the aqueous medium (79).
During zeta potential measurement an electrical field is applied, which induces
the movement of the charged particles in the suspension. The ratio between the vesicles
velocity and the applied external field – called electrophoretic mobility (µe) is then
measured and converted into the zeta potential (z) using the Henry equation:
𝜇𝑒 =2𝜀𝑧𝑓(𝑘𝛼)
3𝜂
Where ε is the dielectric constant, η is the absolute zero sheer viscosity of the medium
and f(kα) is the Henry function. In details α is the radius of the vesicle and k is the Debye
parameter that represents the electrical double layer, depending on the ionic strength of
the medium and on the temperature of the medium being 1/k:

14
1
𝑘= √
𝜀0𝜀𝑘𝑏𝑇
2000𝑒2𝐼𝑁
Here, kb is the Boltzmann constant, T is the temperature of the sample, e is the charge of
electron, N the Avogadro number and I is the ionic strength of the medium.)
For particles in polar medium (water) the f(kα) is approximately at its maximum
value: 1.5, for particles in non-polar medium the f(kα) can be approximated by its minimal
value: 1. In water based buffers, which are relevant for biological conditions, the
commonly used value is 1.5. During a zeta potential measurement, the electrophoretic
mobility is quantified by measuring the small frequency shift of the light of a coherent
laser source, scattered by the charged NPs during their movement in the external electric
field.
2.4.2 Morphology
The self-assembly of phospholipid molecules can lead to a wide variety of
membrane structures in aqueous solutions. Although the -thermodynamically - favoured
particles are typically spherical objects like micelles or vesicles, depending on the
compositional and environmental parameters destroyed and non-lamellar (hexagonal, or
cubic) formations could also be possible.
The fine details of vesicular systems are in the size range of only a few
nanometres. The visual observation of these small elements need a very high resolution
microscopic technique, which could only be achieved by transmission electron
microscopy (TEM) (80). The problem with conventional TEM measurement is that it is
carried out in high vacuum, which could damage the biological samples irreversibly by
the evaporation of their water content. The high energy of the irradiating electron beam
could also disrupt the sensitive membrane particles, making their observation impossible.
Freeze fracture (FF) sample preparation offers a solution for both problems (76). During
the freeze fracturing process the sample is in frozen form, which is used for the creation
of a fractured surface, followed by the preparation of a replica from the surface. This
replica could then be easily observed by TEM and also stored for a very long time.

15
Figure 6. The process of freeze fracturing in the case of membrane bilayers. The
fracturing frequently opens up the two membrane leaflets, resulting in a cytoplasmic- and
an extracellular half, which faces are called P face and E face, respectively.
There are some key parameters for the freeze fracturing of vesicle samples. First
of all, the suspension has to be rapidly frozen to avoid the formation of large ice crystals.
During rapid freezing a cooling-rate of approximately 104 - 105 °C/s is applied. This speed
is achieved by a secondary cryogenic liquid, such as freon, cooled by liquid nitrogen. As
the sample is rapidly cooled to approximately -196°C (the boiling point of nitrogen, at 1
bar), the water is frozen in an amorphous form. Amorphous ice consists of very small
crystals, consequently it is less harmful to the membranes (81).
The frozen sample is then put into a cooled vacuum chamber (incubated at -110°C,
instead of -196 °C, to increase the sublimation of ice), where a cooled knife produce
fractured surface of it. During the fracturing process the sample is “broken” in its weakest
plane. Covalent, hydrogen and ionic bonds are strong, while hydrophobic interactions are
the weakest. When the plane of fracturing encounters the vesicles, it either breaks off the
ice from them, breaks the vesicles out of the icy sample, or brakes the membrane bilayer
into two half. As a result of this process the outer surface of the vesicles as well as the
structure of the bilayer could be observed. The two characteristic sides of the fractured
bilayer are called E (extracellular)-face or P (protoplasmic)-face, referring to the
membranes position in the living cells (Figure 6) (82) (83).
In the final step of freeze-fractured procedure, platinum and carbon are vaporised
on the fractured surface, creating and shading the final replica, respectively. The
resolution of the FF-TEM images is approx. 2±1 nm, due to the average size of the
platinum particles formed during the sputtering process. The secondly vaporized carbon

16
forms a continuous covering film, whereby the features of the fractured surface are
conserved. After the removal of the sample residues, the replica can be stored and
observed for an unlimited amount of time.
Freeze fracturing provides an excellent tool to visualize the individual artificial or
natural vesicles and nanoerythrosomes embedded in the aqueous matrix. In
electronmicrographs three kinds of fracturing could be observed. Vesicles with convex
fractured outer surfaces, frequently protruding from their local flat surrounding, and
concave imprints of other vesicles broken out entirely from the medium are visible. The
third type of characteristic fractured surface represents vesicles that are broken through
entirely, leaving half of them in the medium. Instead of being sharp, the contours of these
fractures are rather wide, corresponding to the wall-thickness of the vesicles.
It must be noted, that the electron microscopic study can serve information about
the individual particles and their details therefore it does not render high statistical
reliability. Relatively long and laborious procedure is required to obtain numerical data
and to achieve a high statistical relevance.
2.4.3 Thermal behaviour
Thermal analysis of lipid membranes is generally carried out by Differential
Scanning Calorimetry (DSC). DSC is capable of accurately determining the phase
transition temperatures and the associated enthalpies of pure lipid systems. The impact of
guest molecules and different mediums can also be studied via the changes of the thermal
behaviour.
The principle of the measurement is fairly simple. The DSC device has a sample
and a reference cell. Both cells are heated, timely following the exact same temperature
profile. In case a thermal event – such as a phase transition happens, the device measures
a heat flow between the sample and the reference cell. The informational output of the
DSC is a differential heat flow as the function of temperature, in which the intensity of
the signal is proportional to the scanning rate (dT/dt).
On the thermogram of the vesicles one or more peaks could be seen. In pure lipid
systems the peaks correspond to the phase transitions. The peak position Tm, is the
temperature value of the melting point and the peak area under the DSC trace is a measure
of the change in enthalpy, corresponding to phase transition, ΔH [kJ/mol].

17
2.4.4 Structure in the nanometre range
It was already mentioned, that the vesicles and nanoerythrosomes are objects with
a typical diameter of few hundred nanometre. Their main attribute is the double-layered
lipid sheets extending up to 5 – 11 nm in thickness. This size-range can be characterized
by scattering of X-ray or neutron beams in the frame of the coherent scattering, while the
wavelength of the incoming and scattered beams remains the same. From a practical point
of view, x-ray scattering is one of the most commonly used for the examination of
vesicular systems (84) (85) (86) (87). This scattering technique is dissected into two
types; the small angle x-ray scattering (SAXS) and the wide angle x-ray scattering
(WAXS) corresponding to the angle of the scattered x-ray wave. SAXS gives information
about the shells of the vesicles, the location of guest molecules, the lamellarity of the
vesicles and in the case of unilamellar vesicles it serves with an estimation for the size of
the vesicles as well (88) (89). The WAXS holds information about finer details about the
bilayer structure, for example, about the distance between the neighbouring lipids, the
geometrical parameters of subcells constituted by strongly correlated alkyl chains of
lipids (90).
When a monochromatic x-ray radiation passes through a matter, part of the x-rays
are scattered by electrons and by nuclei of targeted atoms. As the intensity of scattering
is inversely proportional to the quadrate of the mass of the particles, the scattering of x-
rays on the atomic nuclei can be neglected. Therefore the scattering pattern provides
information on the time averaged electron density profile of the sample. The electrons are
given by atoms, molecules, and finally, by the associates or aggregates of all molecules
of the sample. The chemical content of the sample provides the actual electron density.
The goal of the scattering measurement is inverse, namely by means of scattering
phenomenon we intend to determine the electron density, whereby the local chemical
content, in the end the structure can be determined. The amplitude and phase of the
scattered wave depends on the position of each scattering centres (e.g. electrons) in the
matter. As the position of electrons change permanently by thermal motions, the position
of scattering electrons is given by the average special electron density (ED). Due to the
reciprocal relation between the distances in matter (real length) and scattering angle
(reciprocal length), information about the atomic scale are provided at high angles, while
scattering at low angles corresponds to structures of the nanometre scale. The principles
of SAXS and WAXS measurement are the same, with the differences being only practical

18
and technical details; SAXS appears in the small angle scattering regime (between 0 –
10°, in the vicinity of the transparent beam), while WAXS is detectable in the wide angle
regime, between 10 – approx. 130. WAXS (or WAXD wide-angle X-ray diffraction in a
case of a more regular lattice-type arrangement) provides information in the range of
several 0.1 nm. The SAXS describe the whole vesicle with its bilayer structure. As it was
mentioned, for the incoming X-ray beam the vesicles represent complex shell-shaped
centrosymmetrical electron clouds created by the electrons of constituent lipids, proteins
and other constituent molecules with a diameter, which corresponds to vesicle size,
approx. several hundred nm. The electron density of this electron cloud shell along the
radial direction represents the thickness of the bilayer in a range of 5 – 11 nm.
SAXS pattern, i.e. the one-dimensional scattering intensity, is usually presented
as a function of q [nm-1] (scattering variable) instead of the scattering angle (2Θ), its
absolute value defined as
𝑞 = 4𝜋 sin Θ /𝜆
where, λ is the wavelength of X-ray (for example λ=0.1542 nm for Cu Kα radiation,
typically used).
The introduction of “q” variable is very practical because the scattering curves
measured by different wavelengths, can be compared with each other. The small angle
X-ray scattering (SAXS) curves of the vesicles and vesicle-like systems are similar.
The scattering intensity of multilamellar vesicles is given by the multiplication of two
terms, when the correlation between the vesicles is neglected (This assumption is fulfilled
in case of diluted system.)
𝐼(𝑞) = |𝐹(𝑞)|2 ∙ 𝑆(𝑞)/𝑞2
where S(q) is the structure factor for the one-dimensional layer arrangement and F(q) is
the form factor of each double-layered unit (it is the Fourier transformed electron
density of double-layered unit), 1/q2 is the geometrical transformation factor (from sheet
to sphere).
In case of unilamellar vesicles, the expression of the intensity is simplified to the
next form:
𝐼(𝑞) ∝ |𝐹(𝑞)|2

19
The scattered intensity is proportional to the number of the vesicles embedded in
the aqueous sample randomly and to the quadrate of the form factor of bilayer. This factor
is the Fourier transformed electron density of the centrosymmetrical shell of ULVs
(shown in Figure 1). The quadrate of the form factor of bilayer generally appears in every
SAXS curve of unilamellar systems as a broad peak (“hump”), centered about at the q=1
(nm-1).
When the systems contain an increased amount of membrane proteins, scattering
curves exhibit a reduced sign of lipid bilayers (91). In the next paragraphs, I summarize
general information about the SAXS curves of regular unilamellar vesicles, which will be
useful in the interpretation of other curves obtained on complex nanoerythrosomes (92).
Figure 7. Typical SAXS curve of a unilamellar vesicle
The entire SAXS curves (extending from very small q up to high q, corresponding
to the scattering angle regime of 0.007 – 20°, it can be obtained only at some synchrotron
station) make possible the description of both the overall size of the unilamellar vesicles
and the fine structure of their bilayers and yields complete structural and morphological
information. The bend in the scattering curve at the very small q-range (marked with A
in the Figure 7) characterizes the overall mean size of vesicles through the Guinier
approximation. Near q=0.1 1/nm a local maximum appears (B) which is a consequence
of a relatively narrow size distribution. After a local minimum in the scattering curve a
wide scattering peak (C) with two smaller ones (D and E) follows which carry information
on the fine structure of the bilayer. A thorough inspection can reveal that the main peak
(C) is in fact composed of two or more double-layer components (marked with F and G).
whole of vesicle bilayer structure
A
B
C
D
F G
Inte
nsi
ty(1
/cm
)
E
100 nm
~ 6 nm
q (1/nm)
20
These features can be comprehensively interpreted by modelling the scattering
curve using different mathematical models. The basis of the calculation is that the
different parts of the bilayer (two head groups and one carbon chain region) can be
described by different, characteristic electron-densities given by the stoichiometry of their
respective chemical constituents. Although step-like radial electron density functions
would give adequate description for each region, Gaussian functions are more convenient
to respect the thermal fluctuations of the constituents and the lack of sharp boundaries,
which are not present in real systems. Taking into account the size distribution of vesicles
and modelling the electron density (ED) profile along the lipid bilayer normal with sum
of Gaussian functions corresponding to the different regions, the experimental SAXS
curves can be fitted in the least-squares sense.
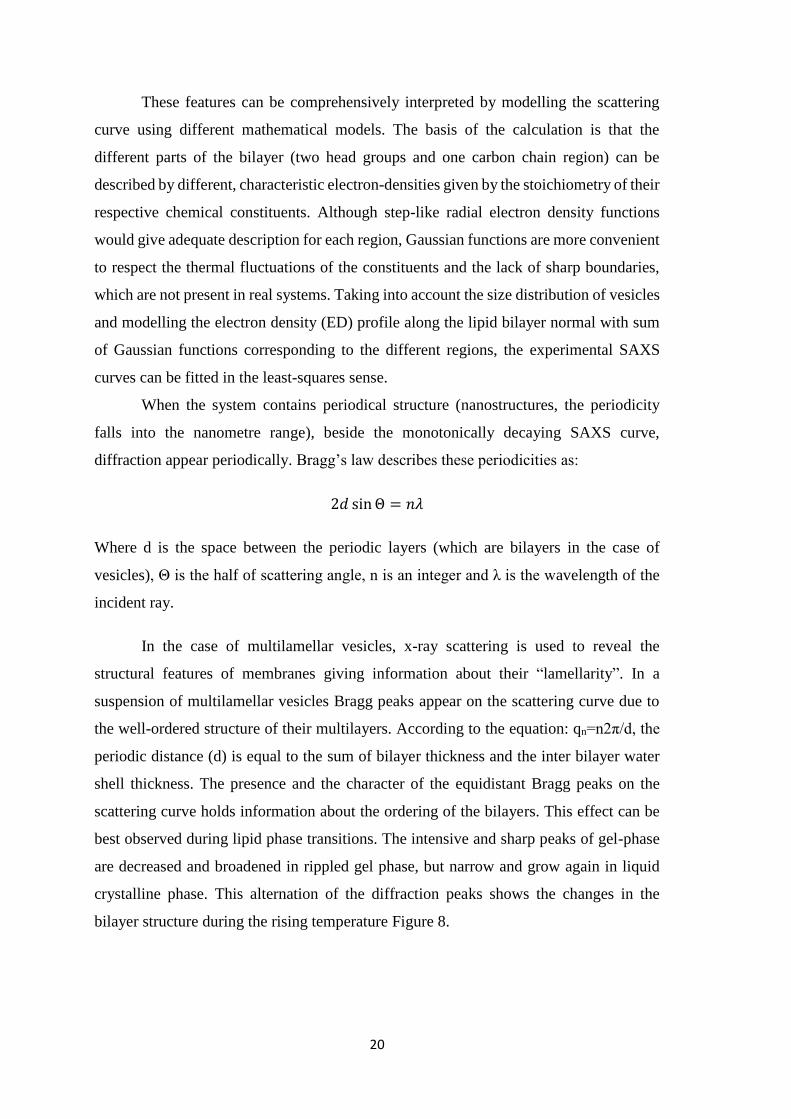
When the system contains periodical structure (nanostructures, the periodicity
falls into the nanometre range), beside the monotonically decaying SAXS curve,
diffraction appear periodically. Bragg’s law describes these periodicities as:
2𝑑 sin Θ = 𝑛𝜆
Where d is the space between the periodic layers (which are bilayers in the case of
vesicles), Θ is the half of scattering angle, n is an integer and λ is the wavelength of the
incident ray.
In the case of multilamellar vesicles, x-ray scattering is used to reveal the
structural features of membranes giving information about their “lamellarity”. In a
suspension of multilamellar vesicles Bragg peaks appear on the scattering curve due to
the well-ordered structure of their multilayers. According to the equation: qn=n2π/d, the
periodic distance (d) is equal to the sum of bilayer thickness and the inter bilayer water
shell thickness. The presence and the character of the equidistant Bragg peaks on the
scattering curve holds information about the ordering of the bilayers. This effect can be
best observed during lipid phase transitions. The intensive and sharp peaks of gel-phase
are decreased and broadened in rippled gel phase, but narrow and grow again in liquid
crystalline phase. This alternation of the diffraction peaks shows the changes in the
bilayer structure during the rising temperature Figure 8.

21
Figure 8. Characteristic scattering curves of multilamellar vesicles (MLV) of DPPC-
water system at typical phase temperatures. In the biologically relevant temperature range
the lipids can either be in gel, rippled gel or in liquid crystalline phase (46 and 55°C are
presented), whereby the number and sharpness of the diffraction peaks on the SAXS
curves indicate different kind of regularity of the membrane system.
Considering the Bragg’s law, we can see that the periodicity of sub-nanometre
range results in a wide angle diffraction (discrete scattering in certain and regular angular
positions). When the periodicity is smoothed instead of wide angle X-ray diffraction the
wide angle X-ray scattering is the correct terminology. The distance between the acyl
chains of lipids in the layer falls in the length-scale of several Angstrom. Consequently,
the vesicles, especially the multilamellar vesicles in concentrated form (typically more
than 10 w/w% water), exhibit a very characteristic diffraction peak around 2Θ= 24°,
corresponding to approx. 0.5 nm chain – chain distance. It means that the rod-shaped acyl
chains of lipid are in parallel positions with each other and the distance between the
neighbouring lipids is 0.5 nm. This value and the character of diffraction peak is altered
during the phase transition, and provide information about the lateral arrangement of
lipids during the thermal processes. The arrangement of lipids is strongly perturbed in the
presence of other additives, especially in the presence of different macromolecules,
proteins, therefore this signal is vanished in the complex systems, for example in cases of
extracellular vesicles, nanoerythrosomes.
2.4.5 Structure in the atomic scale
a) Infrared spectroscopy
Infrared (IR) spectroscopy is based on the interactions between IR light and
matter. The energy of the absorbed (or reflected) IR light is equal to an energy difference

22
between two energy levels of vibrations of atom pairs, group of atoms in the molecules
(93). Different functional groups absorb characteristic frequencies of the IR radiation,
therefore the detected IR spectrum (the intensity as a function of wavenumber [cm-1]) is
a fingerprint of the molecule (94). A vibrational mode of the sample is IR active only if
it can be associated with a change in dipole moment. Since molecular vibrations reflect
chemical features of a molecule, such as, an arrangement of the nuclei and chemical bonds
within the molecule, infrared spectroscopy contributes not only to the identification of
the molecule, but also to the investigation of the molecular structure. In the case of
biological samples, despite the complexity of the spectrum characteristic and well-
defined IR vibrational modes of nucleic acids, proteins, lipids and carbohydrates could
be found (Figure 9).
The IR spectrum of a biological membrane serves with information about the
conformation and dynamics of its molecules. A molecular vibration is defined by its
absorption maximum and peak frequency in the spectrum. It is characteristic for the atoms
of the chemical bond and reflects their conformation, which is also slightly affected by
its environment.
The basic constituents of biological membranes are phospholipids and membrane
proteins. In the case of extracellular vesicles the nucleic acid content can also be a subject
of examination.
Figure 9. FT-IR spectrum of biological samples, with typical molecular vibrations
corresponding to biomolecules highlighted (95)
23
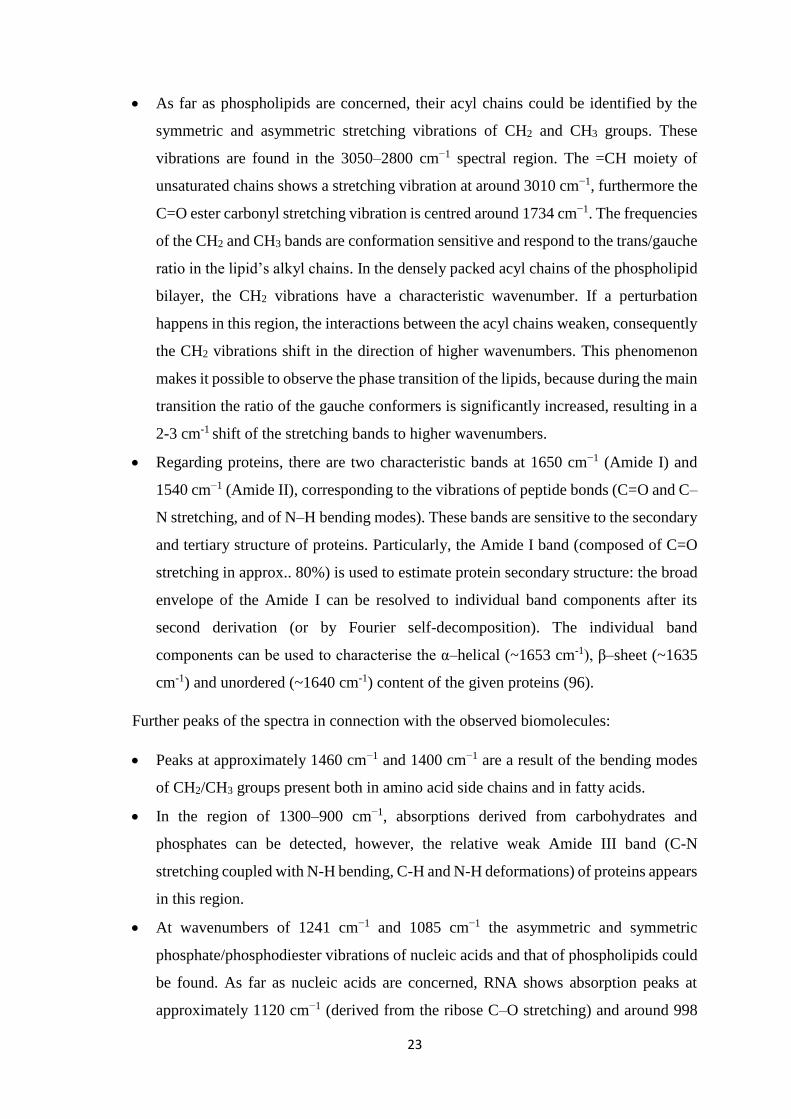
As far as phospholipids are concerned, their acyl chains could be identified by the
symmetric and asymmetric stretching vibrations of CH2 and CH3 groups. These
vibrations are found in the 3050–2800 cm−1 spectral region. The =CH moiety of
unsaturated chains shows a stretching vibration at around 3010 cm−1, furthermore the
C=O ester carbonyl stretching vibration is centred around 1734 cm−1. The frequencies
of the CH2 and CH3 bands are conformation sensitive and respond to the trans/gauche
ratio in the lipid’s alkyl chains. In the densely packed acyl chains of the phospholipid
bilayer, the CH2 vibrations have a characteristic wavenumber. If a perturbation
happens in this region, the interactions between the acyl chains weaken, consequently
the CH2 vibrations shift in the direction of higher wavenumbers. This phenomenon
makes it possible to observe the phase transition of the lipids, because during the main
transition the ratio of the gauche conformers is significantly increased, resulting in a
2-3 cm-1 shift of the stretching bands to higher wavenumbers.
Regarding proteins, there are two characteristic bands at 1650 cm−1 (Amide I) and
1540 cm−1 (Amide II), corresponding to the vibrations of peptide bonds (C=O and C–
N stretching, and of N–H bending modes). These bands are sensitive to the secondary
and tertiary structure of proteins. Particularly, the Amide I band (composed of C=O
stretching in approx.. 80%) is used to estimate protein secondary structure: the broad
envelope of the Amide I can be resolved to individual band components after its
second derivation (or by Fourier self-decomposition). The individual band
components can be used to characterise the α–helical (~1653 cm-1), β–sheet (~1635
cm-1) and unordered (~1640 cm-1) content of the given proteins (96).
Further peaks of the spectra in connection with the observed biomolecules:
Peaks at approximately 1460 cm−1 and 1400 cm−1 are a result of the bending modes
of CH2/CH3 groups present both in amino acid side chains and in fatty acids.
In the region of 1300–900 cm−1, absorptions derived from carbohydrates and
phosphates can be detected, however, the relative weak Amide III band (C-N
stretching coupled with N-H bending, C-H and N-H deformations) of proteins appears
in this region.
At wavenumbers of 1241 cm−1 and 1085 cm−1 the asymmetric and symmetric
phosphate/phosphodiester vibrations of nucleic acids and that of phospholipids could
be found. As far as nucleic acids are concerned, RNA shows absorption peaks at
approximately 1120 cm−1 (derived from the ribose C–O stretching) and around 998

24
cm−1 (due to uracil ring stretching), on the other hand DNA peaks could be found at
1020 cm−1 (as deoxyribose C–O stretching) and at 964 cm−1 which corresponds to the
motions of DNA backbone.
The C–OH vibrational mode of carbohydrates is found at around 1050 cm−1.
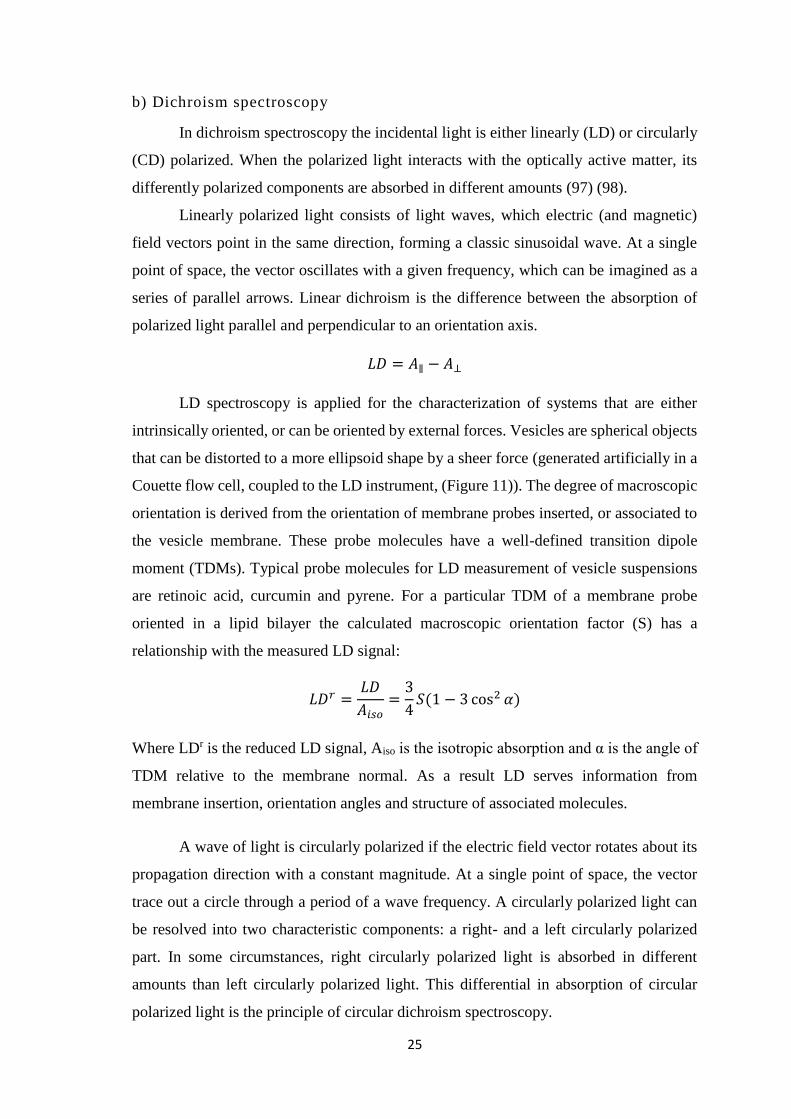
The presence of water could complicate the IR measurement. Its absorption peaks at
around 3285 cm−1, 2100 cm−1 and 1640 cm−1 are overlapping with the bands of other
components. The application of attenuated total reflection (ATR) serves with a possible
improvement. In a single reflection ATR unit a droplet (3-5 µl) of the sample is placed
on an internal reflection element (diamond, germanium or ZnSe). During the
measurement the infrared light strikes the sample and enters the ATR element. Due to
internal reflection, the beam is reflected within the crystal, creating an evanescent wave
that extends beyond the ATR element. Because the sample is in close contact with the
ATR element, this evanescent wave loses energy at frequencies identical to the sample’s
absorbance. The resultant beam is used to generate the absorption spectrum of the sample.
The sample and the ATR element are in full contact, which reduces the effective path
length of IR light inside the sample. Consequently, absorbance of water bands does not
saturate the signal received by the detector. Other possibilities for reducing the water
signals during the measurement may be the subtraction of a water background (spectrum)
and/or measurement of dried film samples (Figure 10).
Figure 10. FTIR spectra of DPPC/water suspension in different measurement conditions:
A: DPPC/water suspension (20m/m%); B: after subtraction of water background; C: dry-
film spectrum
25
b) Dichroism spectroscopy
In dichroism spectroscopy the incidental light is either linearly (LD) or circularly
(CD) polarized. When the polarized light interacts with the optically active matter, its
differently polarized components are absorbed in different amounts (97) (98).
Linearly polarized light consists of light waves, which electric (and magnetic)
field vectors point in the same direction, forming a classic sinusoidal wave. At a single
point of space, the vector oscillates with a given frequency, which can be imagined as a
series of parallel arrows. Linear dichroism is the difference between the absorption of
polarized light parallel and perpendicular to an orientation axis.
𝐿𝐷 = 𝐴∥ − 𝐴⊥
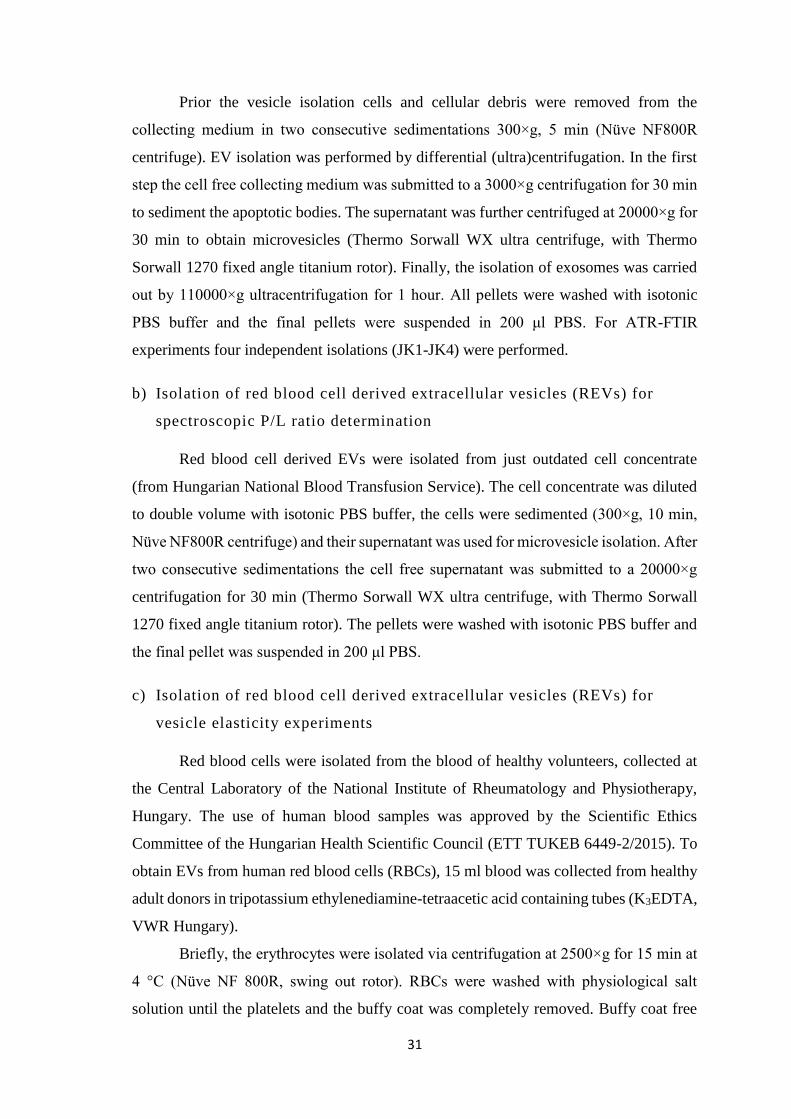
LD spectroscopy is applied for the characterization of systems that are either
intrinsically oriented, or can be oriented by external forces. Vesicles are spherical objects
that can be distorted to a more ellipsoid shape by a sheer force (generated artificially in a
Couette flow cell, coupled to the LD instrument, (Figure 11)). The degree of macroscopic
orientation is derived from the orientation of membrane probes inserted, or associated to
the vesicle membrane. These probe molecules have a well-defined transition dipole
moment (TDMs). Typical probe molecules for LD measurement of vesicle suspensions
are retinoic acid, curcumin and pyrene. For a particular TDM of a membrane probe
oriented in a lipid bilayer the calculated macroscopic orientation factor (S) has a
relationship with the measured LD signal:
𝐿𝐷𝑟 =𝐿𝐷
𝐴𝑖𝑠𝑜=
3
4𝑆(1 − 3 cos2 𝛼)
Where LDr is the reduced LD signal, Aiso is the isotropic absorption and α is the angle of
TDM relative to the membrane normal. As a result LD serves information from
membrane insertion, orientation angles and structure of associated molecules.
A wave of light is circularly polarized if the electric field vector rotates about its
propagation direction with a constant magnitude. At a single point of space, the vector
trace out a circle through a period of a wave frequency. A circularly polarized light can
be resolved into two characteristic components: a right- and a left circularly polarized
part. In some circumstances, right circularly polarized light is absorbed in different
amounts than left circularly polarized light. This differential in absorption of circular
polarized light is the principle of circular dichroism spectroscopy.

26
Figure 11. Deformation of vesicle-like objects and probe molecule (pyrene) orientation
in LD flow cell (99)
CD spectroscopy is often used to study structural properties of the membrane
associated proteins. The far-UV CD signals, recorded below λ=250 nm originate from
peptide n-π* and π- π* transitions and represent structural elements, such as α–helix and
β–sheets and turns.

27
3. Aims of the work
The aim of my PhD work was to elaborate a biocompatible, stable, vesicle-like
nanocarrier system, by using red blood cell ghost membranes as starting material.
Although, red blood cell ghosts had already been used for the preparation of vesicle-like
nanoerythrosomes in the past, either by extrusion, or by ultrasound treatment, until now,
nanoerythrosomes were only considered as relatively simple, lipid based vesicular
derivatives of the original cell membrane. Their protein content and especially its
structural role had not been paid attention to. I presumed that ghosts contain the proper
macromolecules for vesicle stabilisation and they could be a promising source material
for the tailoring of nanocarrier systems.
The artificial and natural vesicle-like systems exhibit similar structural hierarchy,
governed by identic physico-chemical principles. Their molecular constituents form
nearly spherical, shell-structured vesicles by self-assembly, which membrane curvature
and size are defined by certain – mostly lipid – constituents. The protein constituents of
natural membranes are determined, both qualitatively and quantitatively, due to their role
and function in the bilayer. I assumed that a partial exchange in their lipid content could
be effective for shaping the laterally extended ghosts into vesicle-like objects. The
complete knowledge about both sides in this “guest - host” relation – both the
incorporated lipid and the enriched natural membrane – is important. On one hand, the
lipid additives as guest molecules are thoroughly studied and described in the literature,
on the other hand the characterization of the natural vesicles, as potential hosts, is in its
infancy. Consequently, I planned to isolate and characterize a wide variety of extracellular
vesicles focusing on their physicochemical and compositional properties. I aimed to
collect information about their structural elements, such as their lipid and protein content.
I planned to study the effect of the releasing cell type on the characteristics of secreted
EVs. For this reason, I isolated EVs from (Jurkat) in vitro cell culture and red blood cell
suspension.
As far as tailoring of the nanoerythrosomes were concerned, I decided to use
artificial forms of representative red blood cell membrane lipids. I chose typical lipid
components of the inner and outer membrane leaflets. Beside the typical constituents of
both leaflets, I also intended to study the effect of the molecular shape on the
nanoerythrosome formation. Therefore I chose the cylindrical dipalmitoyl-

28
phosphatidylcholine (DPPC), the conical-shaped dipalmitoyl-phosphatidylethanolamine
(DPPE) and the inversely conical lyso- phosphatidylcholine (LPC) as additive lipids.
Finally, I have to mention that the Biological Nanochemistry Research-group
offered a unique research infrastructure for my experiments. Beside the large laboratorial
equipments, freeze-fractured electronmicroscopy provided an outstanding possibility to
observe the nanostructural formations that I paid great attention to in my Thesis.

29
4. Materials and Methods
4.1. Chemicals and reagents
Lipids:
- DPPC (1,2-dipalmitoyl-sn-glycero-3-phosphocholine) and
- DOPC (1,2-Dioleoyl-sn-glycero-3-phosphocholine) were purchased from NOF
America Corporation.
- DPPE (1,2-dipalmitoyl-sn-glycero-3-phosphoethanolamine) and
- LPC (1-palmitoyl-2-hydroxy-sn-glycero-3-phosphocholine) were purchased from
Avanti Polar Lipids.
- Cholesterol was purchased from Sigma Aldrich.
- Brain Total Lipid Extract (Cholesterol:DPPC:DOPC:DPPE:DPPS = 5:1:1:2:1)
was purchased from NOF America Corporation.
Bovine Serum Albumin (BSA):
- Used for reference sample preparation in ATR-FTIR spectroscopy, was purchased
from Sigma Aldrich.
- Used as protein standard, for Bradford protein assay was purchased from Bio-Rad
Hungary Ltd.
Reagents and buffers:
- Physiological salt solution (9 g NaCl in 991 ml Millipore water),
- Red blood cell lysis buffer (7.5 mM TRIS/HCl, pH: 7.6),
- Phosphate buffered saline (PBS),
- Bradford reagent for protein concentration determination assay were purchased
from Sigma Aldrich
Medium and chemicals for cell culture:
- Cell culture media (RPMI-1640),
- Fetal bovine serum (FBS),
- Glutamine and penicillin/streptomycin were purchased from PAN Biotech
(Germany).

30
4.2. Preparation protocols
4.2.1. Preparation of reference – model – vesicles
a. Preparation of BSA loaded DOPC vesicles for reference material of ATR-FTIR
DOPC and BSA were mixed in 1:1 weight ratio and were solved in PBS buffer in
a final concentration of 1.3 mg/ml. To achieve homogenous mixture and maximal BSA-
content, repeated heating-cooling cycles (between 37 °C and −196 °C) were applied. The
resulted liposome suspension was used as a stock solution, from which 1 – 1 ml was
extruded through 600, 200 and 80 nm pore sized membranes, respectively, using a LIPEX
extruder (Northern Lipids Inc., Canada). The produced unilamellar vesicles were purified
from soluble BSA by Sepharose CL-4B (GE Healthcare) gelfiltration.
b. Preparation of DOPC liposomes for reference material of LD/CD spectroscopy
DOPC liposomes were prepared according to the lipid thin film hydration
technique, in a final concentration of 1021,3 µg/ml (100). First DOPC was dissolved in a
mixture of chloroform:methanol 2:1, then the solvents were evaporated. The resulting
lipid film was kept in vacuum chamber for 8 hours to remove the traces of residual
solvents. The dry lipid film was hydrated with PBS buffer. To achieve a homogenous
mixture of liposomes, repeated heating-cooling cycles were applied (between 37 °C and
−196 °C). The solution was extruded through polycarbonate filters with 200 nm pore size
(at least 10 times) using a LIPEX extruder.
4.2.2. Extracellular vesicle (EV) isolation protocols
a) Isolation of Jurkat cell derived extracellular vesicles for spectroscopic
P/L ratio determination
EV subpopulations (apoptotic bodies, microvesicles and exosomes) were isolated
from the cell culture of Jurkat T-cell line. RPMI-1640 medium containing 10% fetal
bovine serum (FBS), 1% glutamine and 1% penicillin/streptomycin was used as growing
medium. The collection of vesicles started when approximately 107 cell number was
reached, then the growing medium was replaced with FBS free medium to avoid bovine
serum vesicle contamination. Jurkat cells were incubated in FBS free “EV collecting
medium” for 24 hours. Collecting medium was mixed with 1 μM doxorubicin to induce
apoptosis (101).
31
Prior the vesicle isolation cells and cellular debris were removed from the
collecting medium in two consecutive sedimentations 300×g, 5 min (Nüve NF800R
centrifuge). EV isolation was performed by differential (ultra)centrifugation. In the first
step the cell free collecting medium was submitted to a 3000×g centrifugation for 30 min
to sediment the apoptotic bodies. The supernatant was further centrifuged at 20000×g for
30 min to obtain microvesicles (Thermo Sorwall WX ultra centrifuge, with Thermo
Sorwall 1270 fixed angle titanium rotor). Finally, the isolation of exosomes was carried
out by 110000×g ultracentrifugation for 1 hour. All pellets were washed with isotonic
PBS buffer and the final pellets were suspended in 200 μl PBS. For ATR-FTIR
experiments four independent isolations (JK1-JK4) were performed.
b) Isolation of red blood cell derived extracellular vesicles (REVs) for
spectroscopic P/L ratio determination
Red blood cell derived EVs were isolated from just outdated cell concentrate
(from Hungarian National Blood Transfusion Service). The cell concentrate was diluted
to double volume with isotonic PBS buffer, the cells were sedimented (300×g, 10 min,
Nüve NF800R centrifuge) and their supernatant was used for microvesicle isolation. After
two consecutive sedimentations the cell free supernatant was submitted to a 20000×g
centrifugation for 30 min (Thermo Sorwall WX ultra centrifuge, with Thermo Sorwall
1270 fixed angle titanium rotor). The pellets were washed with isotonic PBS buffer and
the final pellet was suspended in 200 μl PBS.
c) Isolation of red blood cell derived extracellular vesicles (REVs) for
vesicle elasticity experiments
Red blood cells were isolated from the blood of healthy volunteers, collected at
the Central Laboratory of the National Institute of Rheumatology and Physiotherapy,
Hungary. The use of human blood samples was approved by the Scientific Ethics
Committee of the Hungarian Health Scientific Council (ETT TUKEB 6449-2/2015). To
obtain EVs from human red blood cells (RBCs), 15 ml blood was collected from healthy
adult donors in tripotassium ethylenediamine-tetraacetic acid containing tubes (K3EDTA,
VWR Hungary).
Briefly, the erythrocytes were isolated via centrifugation at 2500×g for 15 min at
4 °C (Nüve NF 800R, swing out rotor). RBCs were washed with physiological salt
solution until the platelets and the buffy coat was completely removed. Buffy coat free

32
erythrocytes were suspended in PBS, and were kept at 4 °C for vesicle production. After
7 days the erythrocyte suspension was used for REV isolation. The cells and the cellular
debris were removed by two centrifugation steps at 2500×g and 3000×g for 15 min at
room temperature. The supernatant containing erythrocyte EV was collected and further
ultracentrifugated at 138000×g for 60 min at 4 °C (Thermo Sorwall WX Ultra centrifuge,
T-1270 fixed angle rotor). The REV pellets were suspended in PBS, and stored at 4 °C
until further use.
For spectroscopic experiments, the REV samples were purified from
contaminants, i.e. soluble proteins and protein aggregates, on a Sepharose CL-2B column
to perform size-exclusion chromatography (SEC) according to a modified protocol
published by (102). The column with a diameter of 1.6 cm, height of 5.3 cm and total
volume of 10.6 ml was washed 4 times with PBS buffer and then was loaded with platelet-
free supernatant of erythrocyte (2.5 ml), followed by elution with PBS. After the sample
passed the filter top, buffer was added. The first 2.5 ml of eluate was discarded and the
next 2 ml eluate which contained REV was collected in 2 fractions of 1 ml.
4.2.3. Preparation of haemoglobin free ghosts and nanoerythrosomes
a) Ghost membrane isolation protocols (1-2.)
Freshly collected anticoagulated blood was donated by four healthy volunteers, 18 ml
from one donor at a time. Although the preparations were addressed to each donors, we
did not observed any differences in the characteristics of nanoerythrosomes described.
For blood collection 6 ml K3EDTA tubes were used (Vacuette, Greiner Bio-One,
Austria).
Ghost membrane isolation was carried out at 4°C, according to a modified version of
the protocol of Dodge et al. (70) briefly described in the following section.
Cellular components were sedimented from whole blood by centrifugation, 2480×g,
10 min in swing out rotor (Nüve NF 800R centrifuge). Plasma and the white blood cell
containing buffy coat were removed and the erythrocyte pellet was suspended in
physiological NaCl solution for three times washing. After the last sedimentation the red
blood cells were lysed in hypotonic TRIS buffer (lysis buffer, 7.5 mM TRIS/HCl), stirred
in 40× buffer volume. The erythrocyte ghost membranes were sedimented with an Avanti
J26XP centrifuge in JA-14 fixed angle rotor with an average of 13900×g for 1 hour at
4°C. The final ghost pellet was suspended in isotonic PBS buffer. As a first step quality
attribute of the ghost membrane stock solution, its total dry material was determined. 10

33
μl of homogenized, sonicated ghost suspension was pipetted on a silicate plate. After
complete drying its weight was measured with analytical balance. (This protocol is
referred to as Ghost isolation protocol 1. in the corresponding parts of the thesis.)
The original isolation protocol (Ghost isolation protocol 1.) was improved in the later
stages of the work, in order to achieve higher membrane yields and more precisely
characterized ghost suspensions. (The improved protocol is referred to as Ghost isolation
protocol 2. in the corresponding parts of the thesis.)
In the part of the preparation process, where haemoglobin free ghosts were achieved,
the membrane pellets were suspended in PBS and washed two times in ultracentrifuge
(Thermo Sorwall WX ultracentrifuge, T-1270 fixed angle rotor), average 22200×g, 30
min, 4°C. The final ghost membrane pellet was suspended in PBS, its protein content was
determined by Bradford protein assay and was used as a stock solution for
nanoerythrosome preparation. The ghost membrane aliquots were rapidly frozen and
stored in liquid nitrogen until further use.
b) Nanoerythrosome preparation protocols (1 -2.)
In the initial nanoerythrosome preparation protocol (Protocol 1.) ghost membrane
suspension was diluted with PBS and treated with a Biologics INC ultrasonic
homogenizer (5 minutes, 10% power, 50% pulsar) to achieve a homogeneous stock
solution. Nanoerythrosomes were made from the stock solution by consecutive sonication
and extrusion through a 200 nm pore size polycarbonate membrane, using an Avanti
Mini-Extruder.
For samples without any additive the sonication and extrusion resulted in the final
nanoerythrosome structure and composition. In the case of samples with additional
phospholipids (DPPC, DPPE or LPC), approximately fivefold, tenfold or half of the
original lipid amount of the ghosts, were mixed to the stock solution. The amount of lipid
additives were calculated – according to literature ratios (65) –, from weight
measurements via analytical balance. For nanoerythrosomes with extra lipid an additional
sonication step was applied after the mixing of the ghosts and lipids.
In the case of improved nanoerythrosome preparation protocol (Protocol 2.), the ghost
membrane suspension was put in a bath sonicator (Elmasonic S10, 30W) in glass vial,
either alone or with additional lipids. Sonication lasted 10 min, with pre-set power level
and continuous operation (37 kHz, in 1.5 ml glass vial, sample volume 200 µl). This
34
resulted in a gentler and less invasive mixing of the components compared to the process
used in Protocol 1.
The amount of the lipid additive was determined by Bradford protein assay, assuming
the lipid-protein ratios found in literature (65). As far as additional lipid
(5×,10×phospholipid additive + ghost) containing samples are concerned, the lipid
powders were first solved in chloroform:methanol 2:1 mixture, followed by the complete
removal of the solvents in vacuum. Finally, the dry lipid film was hydrated with the ghost
membrane suspension.
Ultracentrifugal separation of sonicated ghost membrane components (vesicles and
EMPs) was carried out, using a Beckman TL-100 ultracentrifuge with TLA 100.1 fixed
angle rotor, average 96400×g, 30 min.
4.3. Instruments and parameters of measurements
a) Transmission electron microscopy combined with freeze fracture (FF -
TEM)
Approximately 1 μl droplets of the samples, previously incubated at the desired
temperatures, were used for freeze fracturing. The samples were pipetted onto a golden
sample holder and rapidly frozen in liquid freon, then put into liquid nitrogen. Fracturing
was performed at -100°C in a Balzers freeze-fracture device (Balzers BAF 400D, Balzers
AG, Liechtenstein). A replica was made from the fractured surface with vaporized
carbon-platinum. The replica was washed with surfactant solution and distilled water, and
it was transferred to 200 mesh copper grid for transmission electron microscopic
(MORGAGNI 268D, FEI, The Netherlands) examination.
b) Dynamic light scattering (DLS)
A W130i dynamic light scattering apparatus (AvidNano, United Kingdom) was used
for measuring the average size and size distribution of the samples. Because of the small
sample volume, a 50 μl microcuvette was applied. The analysis of the measurement data
was performed with the i-Size software, supplied with the apparatus. In the original
concentration of the samples yielded by the procedure, or diluted with MQ, buffer
systems.

35
c) Zeta potential measurement
Stability of nanoerythrosome samples was assessed by zeta potential measurements
using a Malvern Zetasizer Nano ZS (Malvern Instruments Ltd., United Kingdom)
instrument. The samples, originally in PBS, were diluted to 50× volume with ultrapure
(MilliQ) water, in order to make the surface characteristics of the vesicles measurable.
d) Differential scanning calorimetry (DSC)
A μDSC 3 EVO (Setaram, France) apparatus was used for calorimetric experiments.
Approximately 10 mg samples were loaded per measurement and an empty sample holder
was used for reference. The heating protocol consisted of three cycles, between 20 and
60°C, with two different scan rates, first a faster 1°C/min and then a slower 0.2°C/min
for better resolution. The results are presented from the latter.
e) Bradford protein assay (UV-Vis)
The total protein content of ghost vesicle samples was determined using the Bradford
assay that involves the binding of Coomassie Brilliant Blue G-250 dye to proteins. Bovine
Serum Albumin (BioRad) was used as standard, from which eight consecutive dilution
steps were carried out in three parallel lines. To 5 μl of each standard (0-25 μg/ml) and
unknown sample solution, 250 μl dye reagent was added and the mixtures were vortexed
for 15 sec. The samples were incubated at room temperature for at least 5 min and the
absorbance was measured at 595 nm with BioTek Synergy 2 plate reader on 96 well
plates.
f) Protein identification using LC-MS(MS)
Proteins were extracted from sonicated ghost membrane by repeated freeze-thaw
cycles. 10 μg protein/sample was digested in solution as previously described and
following tryptic digestion desalted using PierceTM C18 spin columns (Thermo Fisher
Scientific, Waltham, MA, United States). Peptides were analysed using a Dionex
Ultimate 3000 RSLCnano LC (Dionex, Sunnyvale, CA) coupled to a high resolution
Bruker Maxis II Q-TOF mass spectrometer (Bruker, Bremen, Germany) equipped with
CaptiveSpray nanoBooster ionization source. Peptides were separated using gradient
elution on a 25 cm Waters Peptide BEH C18 nanoACQUITY 1.7 μm particle size UPLC
column (Waters, Milford, MA).

36
Data were processed using ProteinScape 3.0 software (Bruker Daltonik GmbH,
Bremen, Germany). Proteins were identified using Mascot (version Mascot 2.5; Matrix
Science, London, UK) search engine against the Swissprot Homo sapiens database
(2017_11). The following search parameters were applied: trypsin enzyme, 10 ppm
peptide mass tolerance, 0.15 Da fragment mass tolerance, 2 missed cleavages.
Carbamidomethylation was set as fixed modification, while deamidation (NQ) and
oxidation (M) as variable modifications. Proteins with a minimum of two identified,
unique peptides were accepted. The measurements were carried out by the researchers of
the MS Proteomics Research Group, Institute of Organic Chemistry, Hungarian Academy
of Sciences (in courtesy of Dr. László Drahos and Dr. Lilla Turiák).
g) Fourier transform infrared spectroscopy (FTIR)
FTIR spectroscopic measurements were carried using a Varian 2000 (Scimitar Series,
United States) FT-IR spectrometer, fitted with a diamond attenuated total reflection cell
(‘Golden Gate’ single reflection ATR unit with active area of 600 x 600 μm2, Specac,
United Kingdom).
Approximately 5 μl of the sample was spread onto the diamond ATR surface and a
thin dry film was obtained by slowly evaporating the solvent under ambient conditions
(approx. 5 min). For temperature controlled measurements, a custom-made liquid cell
was applied; the temperature was equilibrated for 5 min before collection of each
spectrum. Typically, 64 scans were collected at a nominal resolution of 2 cm-1. After each
data acquisition, ATR correction (and water background spectral subtraction) was
performed. The actual frequencies of complex IR bands were determined by fitting their
peaks with Lorentzian curves. For all spectral manipulation the Grams/32 software
package (Galactic Inc., USA) was used.
h) Absorption and Polarized light spectroscopy (LD)
Linear (LD) dichroism spectra were recorded using a JASCO-1500 spectrometer
equipped with a Couette flow cell system (CFC-573 Couette cell holder). For recording
LD spectra, the vesicles were oriented under a shear gradient of 2270 s-1 with a total path
length of 0.5 mm. The LD spectra were collected between 195 and 500 nm in 1 nm
increments at a scan speed of 100 nm/min. For LD, baselines at zero shear gradient were
measured and subtracted from all spectra.

37
UV-Vis absorption spectra of all samples were measured at 25°C using a Hewlett-
Packard 8453 diode array spectrophotometer thermostated with Grant LTD 6G
circulating water bath. Spectra were recorded in 1 nm increments between 190 and 450
nm in a quartz cuvette with a 1 mm optical path.
i) Small angle X-ray scattering (SAXS)
Small-angle X-ray scattering measurements were performed using CREDO, an in-
house transmission geometry set-up. Samples were filled into thin-walled quartz
capillaries of 1.2 mm average outer diameter. After proper sealing, these were placed in
a temperature controlled aluminium block, which was inserted into the vacuum space of
the sample chamber. Measurements were done using monochromatized and collimated
Cu Kα radiation (0.1542 nm wavelength), and the scattering pattern was recorded in the
range of 0.23-1.03 nm-1 in terms of the scattering variable, q (q=4πsinθ / λ, where 2θ is
the scattering angle and λ is the X-ray wavelength). The total measurement time was 7.5
hours for each sample. In order to be able to assess sample and instrument stability during
the experiment, the exposures were made in 5 minute units, with frequent sample change
and reference measurements. These individual exposures were corrected for beam flux,
geometric effects, sample self-absorption and instrumental background, as well as
calibrated into physical units of momentum transfer (q, nm-1) and differential scattering
cross-section (absolute intensity, cm-1×sr-1). The average of the corrected and calibrated
5 minute scattering patterns was azimuthally averaged to yield a single one-dimensional
scattering curve for each sample.

38
5. Results and Discussion
5.1. Physicochemical characterization of extracellular vesicles
The physicochemical characterization of extracellular vesicles was performed on
EVs isolated from in vitro cell culture (Jurkat T lymphocyte) and suspension of red blood
cells. Corresponding to the actual guidelines, determination of the size is an important
qualitative parameter to classify these membrane particles (103).
The size analysis of the vesicles was performed by dynamic light scattering
(DLS). The EV preparation process generally resulted in small vesicle concentrations,
which were convenient for this method. Here I present the size characteristics of
extracellular vesicles derived from Jurkat T lymphocytes. These vesicles exhibit three,
strictly different particle subpopulations, corresponding to exosomes (EXO),
microvesicles (MV) and apoptotic bodies (AB). The size-distribution curves are plotted
in Figure 12. The measured average particle sizes are 100 nm, 200 nm and 1500 nm,
corresponding to EXOs, MVs and ABs, respectively. The separated vesicle suspensions
are fairly polydisperse, indicated by their polydispersity indexes (P.d.). Presumably, this
characteristic is in connection with their origin – exosomes and microvesicles are groups
of small, intentionally created vesicles with high homogeneity and similarity to each
other, while apoptotic bodies are large, heterogeneous, encapsulated cellular “debris”.
Figure 12. Size distribution of Jurkat cell derived extracellular vesicles [exosomes (EXO),
microvesicles (MV) and apoptotic bodies (AB)], measured by DLS

39
Despite the separation of the EV subpopulations, we can observe some overlapping
between their size intervals, which can be the result of the separation method. The
appearance of smaller particles – such as exosomes, lipoproteins or protein aggregates-,
in the suspensions of MVs and ABs could happen by co-sedimentation, which may
explain the observed overlap.
Beside size-analysis, morphological studies represent another characterization
possibility for EVs. Due to freeze-fracture procedure, we were able to observe fine
structural features of extracellular vesicles. Figure 13 represents typical FF-TEM images
of the Jurkat T lymphocyte derived EV subpolulations.
Because of the similar physicochemical properties of microvesicles and
exosomes, their visual appearance is also comparable. There is, however a difference in
their size range, as exosomes can be significantly smaller than 100 nm, while MVs are
approximately 200 nm large, which is in full agreement with our DLS measurements. The
similarities of their physicochemical properties often result in their co-sedimentation,
resulting in increased polydispersity (P.d. indexes) observed by both TEM and DLS.
The outer surface of MVs and EXOs contain numerous membrane particles –
similarly to the membrane of ABs, but in their case, the particles frequently form
associates, or dense groups, separated from each other by smooth lipid surfaces.
Apoptotic bodies (ABs) have an average diameter of 700-1000 nm. Their surface
is densely packed with 1-5 nm large membrane particles, sometimes standing as single
particles, other times clearly forming associates of one or two, similarly to membrane
protein complexes. The outer surface of ABs is more particulated, which resembles to the
cellular membranes, where most of the protein content can be found on the outer surface
as well. The membrane particle covering is significantly different on the surface of
apoptotic bodies, which can be due to the heterogeneous encapsulation of the cellular
material during apoptosis.
Beside the convex fractured outer surfaces of the EVs, we can also observe
vesicles broken through entirely, whereby the observation of the inner leaflet of the
bilayer becomes possible. This phenomenon can be observed in the case of EXOs, in
Figure 13, where the unilamellar structure of the vesicles is clearly seen.

40
Figure 13. Representative FF-TEM images of Jurkat cell derived extracellular vesicles
[exosomes (EXO), microvesicles (MV) and apoptotic bodies (AB)] (104)
5.2. Spectroscopic characterization of extracellular vesicles
5.2.1. FTIR analysis of Jurkat cell derived EV suspensions
In the following section, I show the spectroscopic results whereby the size- and
morphological measurements are supplemented with an inner atomic fingerprint
information of the EVs. The typical ATR-FTIR spectra of Jurkat derived apoptotic
bodies, microvesicles and exosomes are presented in (Figure 14), supplemented with the
spectra of their originator cell. These spectra were collected from dried films of an
approximately 4 µl droplet of the suspension. The drying was applied to decrease the
signals from overlapping water bands. The spectra are typically normalized to the
intensity of the phosphate stretching vibrations, which are mostly derived from the signal
of PBS buffer. This way the approximate dry matter content of the EV suspensions could
be compared to each other. The concentration of the suspension is the highest in the case
of apoptotic bodies and decrease in microvesicles and exosomes, respectively. This
suggests that in Jurkat cell medium the vesicle population mainly consists of apoptotic
bodies with significantly fewer microvesicles and a small portion of exosomes.
The FTIR spectra of extracellular vesicles provide structural and conformational
information about their molecular constituents. The main features of the spectra are
common for all biological samples (94) (95), but with detailed analysis special
characteristics of the vesicular samples could be unravelled (104). These characteristics
concern the protein content of the membranes most of all. The absorption bands in
connection with the vesicular proteins: amide I and amide II, could be found at around
1651 cm-1 and 1540 cm-1, respectively. Another absorption band originated from the
protein content of the vesicles is amide A, which gives a strong, but highly masked signal
at 3285 cm-1 wavenumbers. This peak could hardly be seen in the case of diluted

41
suspensions (MVs and exosomes), due to the overlapping –OH stretching vibration of
water bands.
Figure 14. Representative ATR-FTIR spectra of EVs isolated from Jurkat cell line:
exosomes (EXO), microvesicles (MV) and apoptotic bodies (AB) (104)
Absorption peaks from the vesicular lipids appear around 1738 cm−1, 2924 cm−1
and 2850 cm−1. The peak at 1738 cm−1 originates from the ester groups of phospholipids,
triglycerides and cholesterol esters, while the latter two are the dominant antisymmetric
and symmetric stretching vibrations of the lipid acyl CH2 groups.
The spectral region of 1200–950 cm−1 of vesicular suspensions is attributed to the
broad phosphate vibration bands of the isotonic PBS buffer. However, this spectral region
contains the stretching vibrations of the phosphodiester groups of phospholipids and the
C-O-C stretching vibrations of phospholipids, triglycerides and cholesterol esters, in our
case these bands are completely masked by the broad and intensive phosphate bands of
the PBS. The reason for this phenomenon is the diluted nature of the EV suspensions. As
Jurkat cell cultures produce low amount of vesicles, which are further diluted during the
centrifugation and purification steps of the isolation process, the final sample protein
concentration (which is a way to estimate the particles in the suspension) rarely exceeds
0.05 mg/ml (Table 1). Due to the very low sample concentration, the IR absorption band
intensities of the buffer molecules are comparable with the molecules of the vesicles.
Consequently, the subtraction of a pure PBS dry film spectra is applied prior to further
analysis of EV samples.

42
EXO MV AB
Protein concentration
(±SD) [mg/ml] 0.051±0,02 0.053±0,03 0.124±0,02
Table 1. Average protein concentration of Jurkat EV fractions measured by Bradford
protein assay
Different EV fractions (exosomes, microvesicles and apoptotic bodies) have
distinct physicochemical and compositional characteristics, even when isolated from the
same cell type (102). FTIR spectra in the range of 1750-1450 cm−1 corresponds to the
lipid (C=O stretching vibration of glycerol backbone) and protein (amide I, C=O
stretching of peptide backbone) content (Figure 15/A).
The amide I band at approximately 1700–1600 cm−1 contains information about
the secondary structure of the proteins (105). By the second derivative of the amide I
band, its board envelope could be resolved into individual band components. These
components provide information from the α-helical, β-sheet, β-turn and unordered
content of the proteins (Figure 15/B). As far as EVs are concerned, the different
subpopulations have an expense in β-sheet conformations, favouring β-turns (band
component at 1676 cm−1) and unordered protein motifs (1640 cm−1) when going from
apoptotic bodies to exosomes. In the spectra of microvesicles and exosomes, the arising
band component around 1627 cm−1, is characteristic for non-native intermolecular β-
sheets and suggests the appearance of aggregated proteins or apolipoproteins. Another
new band component at 1660 cm−1 is related to triple-helix structure, associated with the
presence of immune complexes or nucleic acid (RNA) content of the EVs.

43
Figure 15. Representative ATR-FTIR spectra of EVs after PBS buffer subtraction in the
1800-1350 cm-1 wavenumber region: C=O stretching from lipid esters, amide I and amide
II bands of proteins (A). Second derivative IR spectra of the amide I region for protein
secondary structure assessing (B). Each minima in the second derivative spectra
correspond to a component band peak. (104)
In microvesicles (MV) the relative intensity of the carbonyl stretching bands
(1737 cm-1) is higher, compared to other fractions. This indicates higher phospholipid
content which could be the consequence of their plasma membrane origin. On the other
hand in exosomes, at around 1737 cm−1 the C=O stretching band intensity is suppressed.
This could be explained by their composition, as exosomes are significantly enriched in
cholesterol, sphingomyelin, and ceramide for the expense of phosphatidylcholine and
phosphatidylethanolamine. Furthermore, the similar spectral features of Jurkat cells and

44
apoptotic bodies is due to their similar composition reflecting on their direct relation to
each other.
5.2.2. Spectroscopic assessment of protein and lipid components of biological vesicles
Spectroscopic examination of Jurkat cell derived EVs
The IR spectra of an EV suspension simultaneously contain the absorption bands
related to all of its constituent molecules. Consequently in a single spectra, between the
different absorption band intensities stand a quasi-quantitative relation. This means that
the ratio of an absorption band intensity characteristic for one constituent and for another
represents concentration ratios for the constituents as well. Accordingly a spectroscopic
protein to lipid ratio (P/L ratio) could be determined by dividing the relative intensities
of the protein amide I band, with the intensities of the lipid associated –CH2/CH3 alkyl
bands (104).
During the utilization of amide I band as a parameter of the P/L ratio, the presence
of non-vesicular materials, like aggregated proteins or amino acids could cause
difficulties. To overcome this problem the integrated amide I intensity is determined by
the curve fitting by Lorentz-function of the 1653 cm-1 band component (Figure 16/A).
Due to this method, the band components derived from amino acids (1600 cm-1) and
protein aggregates or apolipoproteins (1622 cm-1) are not used in the calculation.
Although concerning the lipid content the first approach was to use of lipid related C=O
bonds (around 1735 cm-1) (105), its intensity in the diluted EV samples (MV, EXO) is
very low. This would result in inaccurate and unreliable P/L determination. Therefore,
instead of the carbonyl, the alkyl related bands were used. The intensity of the alkyl bands
is generally higher in EV suspensions than the carbonyl, especially after the subtraction
of the PBS buffer background, which would otherwise overlap with its high intensity –
OH stretching vibration. Beside the –CH2/CH3 bands the olefinic =CH stretching bands
(~3010 cm-1) of unsaturated lipid acyl chains are also included into the calculation (Figure
16/B).
By the usage of the C-H band region instead of the C=O as the lipid component
of the P/L ratio, the sterols – like cholesterol might also have a contribution. This could
be important in the case of exosomes, which membrane is reportedly rich in cholesterol
and cholesterol-ester.

45
Figure 16. Selected wavenumber regions of Jurkat cell derived exosomes used for P/L
determination protocol: amide I and amide II wavenumber region (1770-1470 cm-1) (A)
deconvoluted by curve fitting with Lorentz-function (band denoted by dotted lines), C-H
stretching region (3040-2700 cm-1) acting for lipid components (B). (104)
Calculated spectroscopic P/L values of Jurkat cell derived EVs are presented in
Table 2. The different subpopulations of Jurkat derived vesicles have significantly
different P/L values. The highest ratio belongs to the apoptotic bodies. In their case the
average P/L value is above 1 (approx. 1.2), which means that the apoptotic bodies have
relatively high protein content, compared to their lipid concentration. This could be a
result of their origin, as in the process of apoptosis, a high amount of intracellular debris
is packed into the ABs. This cytoplasmic contamination could give an intensive protein
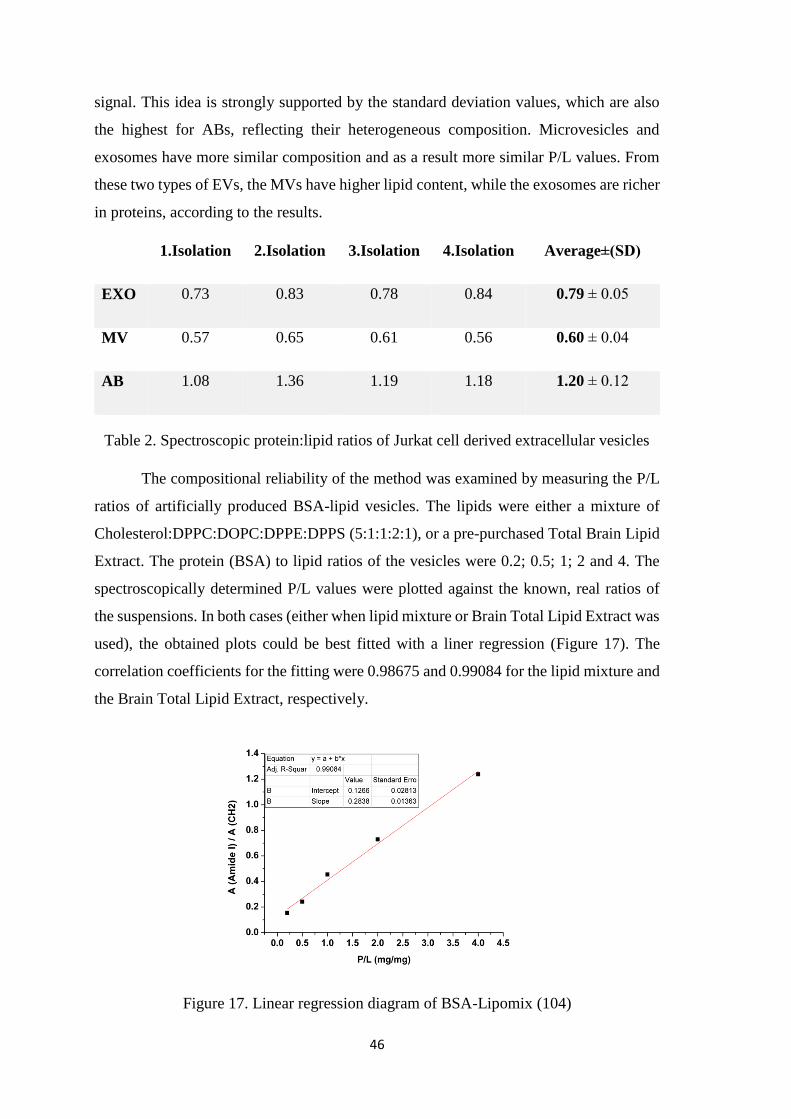
46
signal. This idea is strongly supported by the standard deviation values, which are also
the highest for ABs, reflecting their heterogeneous composition. Microvesicles and
exosomes have more similar composition and as a result more similar P/L values. From
these two types of EVs, the MVs have higher lipid content, while the exosomes are richer
in proteins, according to the results.
1.Isolation 2.Isolation 3.Isolation 4.Isolation Average±(SD)
EXO 0.73 0.83 0.78 0.84 0.79 ± 0.05
MV 0.57 0.65 0.61 0.56 0.60 ± 0.04
AB 1.08 1.36 1.19 1.18 1.20 ± 0.12
Table 2. Spectroscopic protein:lipid ratios of Jurkat cell derived extracellular vesicles
The compositional reliability of the method was examined by measuring the P/L
ratios of artificially produced BSA-lipid vesicles. The lipids were either a mixture of
Cholesterol:DPPC:DOPC:DPPE:DPPS (5:1:1:2:1), or a pre-purchased Total Brain Lipid
Extract. The protein (BSA) to lipid ratios of the vesicles were 0.2; 0.5; 1; 2 and 4. The
spectroscopically determined P/L values were plotted against the known, real ratios of
the suspensions. In both cases (either when lipid mixture or Brain Total Lipid Extract was
used), the obtained plots could be best fitted with a liner regression (Figure 17). The
correlation coefficients for the fitting were 0.98675 and 0.99084 for the lipid mixture and
the Brain Total Lipid Extract, respectively.
Figure 17. Linear regression diagram of BSA-Lipomix (104)

47
Figure 18. Calculated protein/lipid ratios for DOPC-BSA extruded and gelfiltrated
vesicles: effect of sonication in function of vesicles size (B) (104)
Beside the vesicle composition, the effect of vesicle size was also investigated on
the robustness of the method. Vesicles from DOPC and BSA were prepared and extruded
on different pore sized membranes. From the same composition, particles with a mean
diameter of 600, 200 and 80 nm were created, which resemble the size of AB, MV and
EXO populations, respectively. The calculated spectroscopic P/L ratios of the DOPC-
BSA vesicles showed no significant difference by the alternation of their size, neither if
they were extruded, nor when sonicated during the preparation process (Figure 18).
Consequently we were able to rule out the possibility of interference due to size and
protein encapsulation of the vesicles during the ATR-FTIR measurement.
Spectroscopic examination of ghost and red blood cell EV
The technique was also applied for EVs of different sources (Figure 19). Red
blood cell derived extracellular vesicles, show a high diversity in their composition,
depending on the isolation protocol as well as the aging of the cells (106). The RBC EVs
derived from outdated cell concentrate, had a P/L ratio of approximately 0.6. This value
correlates well with the ratios measured for Jurkat microvesicles. Reproduction of the EV
suspensions, from the same cell concentrate had similar P/L ratios, which means that the
approximately 0.6 value is characteristic for the EVs found in outdated blood packs
(Table 3). When the same cells (RBCs) were isolated from freshly collected blood and
were kept in PBS buffer for 5-7 days, the secreted vesicles had a significantly different
2.95 P/L ratio, while their other parameters (such as size distribution) did not change.
This could be due to the different environmental parameters as well as the relatively
young age of the cells. Because RBCs use their microvesicles to remove unnecessary

48
cellular material, the compositional change should be in correlation with the changed
cellular functions. By this phenomenon the characterization of RBC EV microvesicles
and RBC products (e.g. blood packs) with ATR-FTIR technique could be possible.
Concerning the microvesicular properties of RBC EVs, their composition should be
similar to the plasma membrane of the originator cells. To compare the two, RBC ghost
membrane was isolated. The detailed analysis of IR spectra of RBC ghosts and EVs
revealed not only differences in their P/L ratios, but also in their protein content (Table
3). The second derivative of the amide I region showed dominantly α helical protein
structures in the RBC EVs (Figure 19/B). Furthermore, a slight shift in the main amide I
component peak suggests a change in the MV protein conformation compared to the
cellular membrane of ghosts.
Figure 19. Representative ATR-FTIR spectrum of RBC derived EV (blue line) compared
with RBC ghost membrane spectrum (red line) (A). Second derivative IR spectra of the
amide I region for protein secondary structure assessing (B). (104)

49
1.Isolation 2.Isolation 3.Isolation Average
Red blood cell EV 0.54 0.75 0.53 0.61 ± 0.13
Ghost membrane 0.91 0.88 0.91 0.90 ± 0.02
Table 3. Spectroscopic protein:lipid ratios of red blood cell ghosts and extracellular
vesicles
5.2.3. Structural analysis of EVs by polarized light spectroscopy
RBC EV is an ideal subject for chiroptical examination, as it is homogeneous in
size and composition and it can be produced in high concentration, repeatedly. In the case
of membrane particles, such as extracellular vesicles, LD spectra serves with information
about constituents that are either intrinsically oriented or could be oriented by the
externally applied sheer force of a Couette flow cell (99). In the LD spectra of freshly
isolated RBC EVs (Figure 20/B, LD, black line) a characteristic absorption peak appears
at approximately 421 nm wavelength. This band matches with the Soret band of heme
proteins perfectly. As red blood cells carry an enormous amount of haemoglobin and in
addition their intracellular composition lacks other heme containing membrane associated
proteins, this band is a strong signal of vesicular haemoglobin. Its peak on the LD
spectrum suggests that the haemoglobin is somehow oriented in the system, probably due
to membrane association. Contrary to LD spectra, which Soret region only shows the
membrane associated (consequently oriented) portion of the haemoglobin, the standard
UV-Vis spectroscopy provide information from the total haemoglobin content of the
vesicles. The UV-Vis spectrum of the freshly collected RBC EVs had a maximal
absorbance at λ= 415 nm (Figure 20/B, UV, black line), derived from the haemoglobin
content of the vesicles. The broad absorption band could be resolved into two components
by Gaussian function based deconvulation. One at λ= 412 nm (oxygen bound
haemoglobin) and one at λ= 428 nm (deoxy-haemoglobin), suggesting that the RBC EVs
contain both oxy- and deoxy-haemoglobin. The CD spectra of freshly isolated RBC EVs
(Figure 20/C, black line) revealed interesting structural characteristics of the vesicular
proteins. On the far-UV CD curve two negative bands could be seen: a strong, broad one
with n-π* origin and another weaker π-π* excition CD component, centred at λ= 225 nm
and λ= 210 nm wavelengths, respectively. In contrast, CD spectrum of free, dissolved

50
haemoglobin has a typical, α helical pattern with two approximately equal band
amplitudes, above λ= 200 nm. The character of the freshly collected RBC EV CD curve
suggests that despite its high α-helical content additional structural elements such as β-
sheets and turns could be present in the vesicles. These results support the previous ATR-
FTIR conclusions on vesicular protein structures well.
Figure 20. Polarized light spectroscopy of red blood cell EVs. LD spectra (A, upper) and
absorption spectra (A, bottom) of EVs from 0 (black) and 28 (red) days old vesicles. Far-
UV CD curves of 0 (black) and 28 (red) days old vesicles next to the CD spectrum of free
haemoglobin (blue) (B). (99)
By the applied spectroscopic methods, a significant structural alternation could be
detected in stored RBC EVs. The LD spectra of 28 days old EVs showed the
disappearance of the λ= 421 nm peak (Figure 20/B, LD, red line). Because of the

51
unchanged intensity of the Soret bands in UV-Vis spectroscopy, the disappearance of the
haemoglobin signal could only be associated with the detachment of the molecules from
the lipid bilayer. Furthermore a shift in its UV-Vis absorption peak from λ= 415 nm, to
λ= 405 nm showed the conversion of haemoglobin from oxy- form to methaemoglobin.
CD spectral changes also occur in the case of 28 day old samples: the zero crossover point
of the fresh curve moves from λ= 210 nm, to λ= 203 nm, which is the crossover point
measured also for the free haemoglobin. Moreover the band intensities and shape above
λ= 200 nm becomes similar to the free haemoglobin. The observed detachment and
transformation of haemoglobin in the RBC EVs could further support the previously
detailed FTIR results, when different P/L ratios were calculated for fresh and aged RBC
EVs.
The membrane rigidity can also be studied by LD spectroscopy. The vesicle
deformation during external mechanical stress can be directly described by the factor S
(detailed in Introduction). To establish a more confirmed macroscopic orientation factor,
by which the deformation of the vesicles could be characterized, pyrene was employed.
The characteristic absorption bands of pyrene could be seen on the LD spectra at low
wavenumbers λ< 350 nm (Figure 20/A, LD). The intensities of the pyrene peaks are
significantly higher in the 28 day sample than in the fresh suspension of RBC EVs. This
difference can be numerically expressed by the S values of the two samples: S0= 0.007-
0.011 and S28= 0.045-0.067. As a conclusion, the results show that the originally rigid
membrane of the RBC EVs during the ageing process becomes more deformable, which
is potentially a consequence of the haemoglobin detachment till the end of the 28th day.
5.3. From ghost membranes to nanoerythrosomes
5.3.1. The utilization of cell membranes in vesicle preparation
Preparation and characterization of RBC ghosts
The RBC ghost membranes express large, laterally extended membrane sheets as
it can be observed in their FF-TEM images (Figure 21/A,B). The empty membranes keep
numerous properties of their cellular form, like the micrometric size and the high
concentration of membrane particles.

52
Figure 21. FF-TEM images of RBC ghost membrane suspensions (A-D), with typical
representatives of P- and E-faces of the fractured bilayers, (C), (D), respectively. The P-
face (inner cytoplasmic half membrane) is densely packed with membrane proteins, while
in the E-face (outer extracellular half membrane) contains loosely packed proteins and
protein associates.
These observations suggest that the ghosts preserve the main attributes of the cell
membranes, in spite of the fact of destruction caused by hypotonic treatment. The
membrane sheets are single formations, they are not attached to each other rather well
dispersed in the medium. Unfortunately, the resolution of the freeze-fracture technique
does not allow the measurement of the thickness of the membrane bilayers. The method,
however, provides possibility to distinguish the two leaflets (inner and outer) of
membrane and serves with visual information from the interior of the bilayers as well
(107). Namely, the procedure can open the ghost membrane bilayer, whereby the
morphological features of the separated cytoplasmic and extracellular neighbouring
leaflets can be observed. The inner leaflet, also called the cytoplasmic half membrane, is
called the P half and the extracellular half is the E half. Their surfaces facing towards
each other are the P face and the E face, respectively (82). If the subjects of the fracturing
are vesicles, the two sides could be easily distinguished by the convex or concave
character of the replica. In the case of large membrane sheets – such as ghosts, their
particle density is a more reliable attribute for the identification of the different surfaces.

53
The P face (Figure 21/C) of the ghost membranes is more densely packed with particles
than the E face (Figure 21/D), because membrane proteins remain in the cytoplasmic half
in abundance. The detachment of the bilayer leaflets is more common in the case of
biological membranes than in artificial vesicles because the large peripheral
macromolecules (such as glycoproteins) extend relatively far into the aqueous matrix,
consequently, fracturing close to membrane surface is not favourable.
The mechanical stability and the shape of RBCs is assured by the membrane
skeleton located underneath the inner membrane leaflet. This, a quasi-hexagonal
cytoskeletal network, constitued from long and flexible (α,β)-spectrin tetramers
interconnecting short actin filament juctional complexes (108) (109). During the
hypotonic process, the connections between the complexes (ankyrin complex, band 3,
actin junctional complex) and the cytoplasmic side cease to exist and these characteristic
skeletal elements mostly turn into the medium. Presumably, this is the explanation why
we cannot observe (not even partially) morphological features in ghosts, resembling to
the skeletal system of the RBCs.
Sonication of the ghost membrane: the formation of vesicles and extra -
membrane particles
Corresponding to the widespread laboratory practice, a gentle sonication was used
to transform the large, empty ghost membranes of red blood cells into smaller, vesicle-
like nanoerythrosomes (110) (111). Sonication is a general method for small-sized
unilamellar vesicle preparation as far as synthetic liposomes are concerned. In the case of
nanoerythrosome preparation, the parameters of sonication proved to be key factors of
the ghost membrane transformation. Generally, I used the shortest sonication time and
lowest energy, whereby nanoerythrosomes could be obtained. The transformation of
ghosts to nanoerythrosomes is accompanied by drastic morphological changes, shown in
Figure 22 and Figure 23. A significant decrease in the particles size clearly appear in the
DLS measurements, also represented by Figure 22 and Figure 23. The ghost suspension
contains large sheets and the presented form exhibits an “E”-face with inhomogeneous
surface location of membrane proteins (inset of Figure 22). Although, the DLS indicates
the presence of large scattering objects, the calculated size values cannot be realistic,
because of the presence of anisotropic scattering particles. The sonication results in the
formation of uniform and spherical-like nanoerythrosomes. These creations are the
dominant formations of the suspensions, seemingly being the main successors of the

54
ghost membranes. They have an average diameter of approximately 150 nm in the FF-
TEM images. On the outer surface of the nanoerythrosomes numerous embedded
particles could be observed, these objects are presumably aggregated membrane particles,
originating from the membrane proteins of the RBCs. The size and distribution of these
surface particles resemble to the membrane proteins of the ghosts, embedded in their E
and P faces, demonstrated in Figure 21 and Figure 22.
Figure 22. Surface morphology of ghost membrane (A). The FF-TEM images shows a
characteristic “E” face with loose surface protein aggregates. The DLS indicates large
scattering objects (B).
Figure 23. Surface morphology of nanoerythrosomes formed during the sonication of
ghost membranes (A). Size (mass) distribution, measured by DLS (B), shows the
presence of smaller objects too.
A reduced magnification allows the overview observation of the occurring objects,
formed in larger amount during the sonication. Figure 24 reveals morphological

55
characteristics of the sonicated ghosts. Here, two types of particles can be found; larger
ones that were highlighted and described in Figure 23, and smaller, frequently aggregated
creations, marked by white circles and arrows in Figure 24. These particles are nominated
as extra-membrane particles (EMPs). The EMPs are originated from the ghost membrane
and presumably torn out by sonication. Consequently, these out-of-membrane particles
have similar size characteristics to the ghost membrane proteins. Such small, dispersed
particles, however, were absent in the aqueous media of the precursor ghosts. Thus, EMPs
were identified as the product of the sonication process. The exploration of their role in
the nanoerythrosome formation required the separation of the sonicated ghosts
components and the analytical-structural examination of the fractions.
Figure 24 Nanoerythrosomes and free membrane protein particles (marked with
circles) (A). Surface of nanoerythrosomes and free membrane protein particles
(EMPs) under higher magnification (B).
Separation and characterization of nanoerythrosomes and EMPs
In order to separate the nanoerythrosomes and the extra-membrane particles from
the sonicated ghost suspension, ultracentrifugation (UCF) was used (described in the
section of Materials and Methods). The size distribution of the obtained supernatant and
pellet was measured and the characteristic data is summarized in Table 4. Compared to
the approximately 150 nm large particles in the sonicated ghost suspension, The UCF
pellet had a dominant fraction (98 mass%) with an average size of 74 nm, while the
particles, which remained in the supernatant, had only a diameter of 30 nm on average.
Beside these fractions, both the supernatant and the pellet contained a small portion of
larger components as well. In the case of supernatant this part (with an approx. 100 nm
extension) could be the un-sedimented nanoerythrosomes, while as far as the pellet is
200 nm 100 nm
A B

56
concerned the larger (~310 nm) components could be the result of the ineffective
resuspension of the nanoerythrosomes or their aggregates. The measured polydispersity
supports the effectiveness of the separation, as in the case of UCF supernatant the standard
deviation values are only ±9 nm for 90% of the particles, while in the pellet the same
attribute is ±36 nm. These values suggest an effective separation of the particles into two
distinct fractions (UCF supernatant and UCF pellet) prior to their characterization.
Mean diameter
[nm]
Standard dev.
[nm]
Mass distribution
[%]
Sonicated ghost 155 89 100
UCF pellet
74 36 98
312 157 2
UCF supernatant
29 9 90
104 39 10
Table 4. Size distribution of sonicated ghost and its ultracentrifuge-separated fractions
In accordance with the DLS results, the FF-TEM morphological studies also
indicate significant differences in the sonicated ghost and its UCF fractions (Figure 25).
The sonicated ghost and its pellet fraction contain a high amount of nanoerythrosomes,
while in the UCF supernatant the detectable particles are almost always small, extra-
membrane particles (EMPs) (Figure 25/A,B and C, respectively). The TEM images reveal
that the sedimented nanoerythrosomes are highly particulated and form loose association
(Figure 25/B). This attribute can be the result of the centrifugal force that attached the
particles in the UCF pellet together. Next to the pelleted nanoerythrosomes, a high
number of extra-membrane particles could also be seen, frequently associated with the
nanoerythrosomes (see the inset in Figure 25/B). According to DLS and TEM
measurements, the supernatant of the ultracentrifugation could be viewed as a suspension
of membrane particles torn out of the vesicles by the sonication process, while the pellet
contains mainly the vesicles and those particles that remained embedded or associated to
their membranes.

57
Figure 25. Nanoerythrosomes and extra-membrane particles (EMPs) in sonicated ghost
suspension (A). Vesicle rich pellet- (B) and mostly EMP containing supernatant (C) of
ultracentrifugation. (111)
FTIR spectroscopic analysis provides compositional and structural information
from the particles found in the fractions of UCF separation. The absorption bands with
the highest intensities are the lipid derived –CH2/CH3 stretching vibrations (3020-2800
cm-1) and C=O stretching vibration (1800-1700 cm-1) as well as the protein derived amide
A (3290 cm-1), amide I (1700-1600 cm-1) and amide II (1600-1500 cm-1) bands. The FTIR
spectra reveal a significant compositional difference between the supernatant and the
pellet of the ultracentrifugation. Namely, the particles of the UCF supernatant are
enriched in proteins according to their high intensity amide- and surpassed C-H and C=O
bands (Figure 26).

58
Figure 26. FTIR spectra of ghost, sonicated ghost and its UCF fractions. The whole
spectra (A) and the part containing amid I, amid II and C=O vibrations [1350-1800 cm-1]
(B). (111)
This compositional difference is reflected in the spectroscopic P/L ratio, which as far as
nanoerythrosomes are concerned is based on the integrated band intensities of the amide
I and C=O bands – due the higher C=O band intensity, compared to EVs. The calculated
spectroscopic P/L ratio (Table 5) for UCF supernatant is approximately 35.9, which
compared to the 17.2 P/L ratio of the UCF pellet indicates significantly higher protein
content. If we compare these values to the P/L ratio of the ghost starting material: 31.9
(or the slightly lowered value of the sonicated ghost: 28.2) we can conclude, that the
particles released from the ghosts by the sonication are proteins – together with their
nearest membrane-lipid surrounding. After the centrifugation, the protein particles

59
remained in the supernatant, due to their small size, while the nanoerythrosomes with
lower protein content were sedimented into the pellet.
Ghost Ghost US UCF pellet UCF sup.
Spectroscopic P/L ratio 31.9 28.2 17.2 35.9
Table 5. Spectroscopic P/L ratios of ghost, sonicated ghost and its UCF fractions
Beside the different protein- and lipid content of the UCF supernatant and pellet,
the structure of the proteins shows alteration in the two fractions too. By the analysis of
amide I region of the spectra (Figure 26/B), the bands in connection with α-helix (1654
cm-1) and β-sheet (1635 cm-1) secondary structures are revealed. The deconvolution of
the envelope curve shows that most of the proteins has α helical structure in each fraction.
The calculated α-helix/β-sheet ratios - according to the ratio of the integrated area of band
component at 1654 cm-1 and that at 1635 cm-1, are generally 60/40, slightly varying due
to the sonication and sedimentation of the vesicles (Table 6). A significant difference
could be identified in the UCF supernatant, where the β-sheet seemed to be absent. The
symmetricity of the envelope curve of amide I indicates that the band is constituted from
one peak (at approx. 1654 cm-1), which suggests that the absorption band contains
essentially α-helix or unordered structures (which have absorption around the same 1656-
1640 cm-1 wavenumber).
Ghost Ghost US UCF pellet UCF sup.
α-helix/β-sheet 58.7/41.3 60.2/39.8 60.5/39.5 100*
Table 6. α-helix/β-sheet ratios of ghost suspension and its UCF fractions calculated from
ATR-FTIR spectra. In the UCF supernatant practically only α-helical structures could be
observed.
In order to obtain a closer information about the kinds of embedded and secessive
proteins, mass spectrometric (MS) protein analysis of the pellet and supernatant was
carried out. The proteomic data correlated well with the findings of FTIR spectroscopy
(protein enrichment in UCF supernatant).

60
The proteomic analysis showed qualitative and quantitative differences in the
proteins of the ultracentrifugally separated vesicle-like nanoroerythrosomes and extra-
membrane particles (EMPs). According to MS analysis, the preparation procedure of
nanoerythrosomes resulted in significantly different protein content for the vesicles
compared to the separated “free” membrane particles (EMPs), however the four most
frequent proteins in both fractions were the same. MS also showed higher protein
diversity in the EMP suspension, compared to the pelleted vesicles. The number of
identified proteins was nearly twice as much in the supernatant (148) than in the pellet
(79). Furthermore, not just the total number of identified proteins, but the ones that are
specific for one fraction or the other were excess in the supernatant. In the supernatant of
UCF 79 unique proteins were found and only 10 as far as the pellet was concerned.
Surprisingly, the four most frequent proteins identified in both fractions were the same:
Spectrin α and β chains, Ankyrin and Band 3 protein. For each of these proteins
significantly more peptides were identified in the supernatant than in the pellet. The most
common protein contained exclusively by the pellet was the Actin cytoplasmic 2 protein.
To summarize the structural and morphological examinations, a gentle sonication
turned the large, micrometric ghost membranes into spherical nanoerythrosomes, with a
150 nm average size and characteristic membrane protein content. Beside the vesicles a
high concentration of small particles (10-30 nm) were also identified by FF-TEM and
nominated as EMPs. Ultracentrifugation was applied to separate the components into a
mainly nanoerythrosomal pellet and extra membrane particle containing supernatant. The
examination of the different fractions by ATR-FTIR and MS concluded that the
nanoerythrosomes had lower protein to lipid ratio, turning out to be the lipid enriched
derivatives of ghost membranes. On the other hand the EMPs were mainly consisted of
proteins with only a little amount of their original lipid surroundings. These findings
raised the idea of phospholipid addition to the suspension, to achieve homogeneous
nanoerythrosomes. With lipid additives the re-incorporation of EMPs into the newly
formed nanoerythrosomes would also be possible, based on the analogy of
proteoliposomes (112).
5.3.2. The tailoring of nanoerythrosomes with phospholipid additives
As it was presented previously, the sonication of ghosts resulted in the formation
of a complex system consisting of nanoerythrosomes and EMPs. The (UCF) separation

61
and analysis of the particles, implied the need of extra lipid during the vesicularisation
process. When deciding on the types of lipid additives the composition of natural
membranes served with examples to follow. The smallest structural elements of all
membranes are the phospholipids, consequently the phospholipid components of the
natural membranes were taken into consideration. As far as red blood cells are concerned,
the most abundant phospholipids of their membrane are phosphatidylethanolamine (PE)
and phosphatidylcholine (PC) (113) (114). The first one is a typical constituent of the
inner half of the bilayer, while the latter can mainly be found in the outer monolayer.
Building on their properties, these two lipids were chosen to be the synthetic lipid
additives of nanoerythrosome preparation. The extra lipid was applied in high excess in
order to significantly express its effect on the vesicle-like formation. Its amount was based
on the measured protein concentration of the ghost membranes. According to the detailed
information about ghost membranes in the literature, their lipid and protein content is
generally 1:1 in mass ratio. Therefore the measured total protein concentration of ghosts
by Bradford protein assay, serves with an estimation on their total lipid concentration as
well. Compared to the original lipid content of the ghosts, generally five- (5x) or ten (10x)
times more phospholipid (calculated in molar ratio) was added to the suspensions prior
to the sonication. Significant differences were in the case of lysophosphatidylcholine
(LPC) due to its extreme character and strong impact on the vesicles.
a) Non-vesicular formations due to DPPE addition
The addition of dipalmitoyl-phosphatidylethanolamine (DPPE) to red blood cell
ghosts, resulted in highly polydisperse membrane suspensions. The samples remained
cloudy despite to any amount of sonication. Because of the visible polydispersity and
rapid sedimentation of the suspensions DLS measurements couldn’t be carried out. To
still get an insight on the morphology of the membranes, FF-TEM was applied. The freeze
fractured images of the ghost suspensions sonicated together with tenfold of DPPE (ghost
total lipid:DPPE = 1:10; w/w) revealed large, planar stacks of multilayers (Figure 27).
Beside the multilayers EMPs (free membrane proteins) could not be observed. This result
is not surprising when considering the physicochemical properties of the DPPE molecule.
DPPE is a phospholipid with long (C16) acyl chains and small ethanolamine headgroup.
The resulted geometrical shape of the molecule is truncated conical, which does not
support positive curvature radii, necessary for the formation of vesicles. The dominantly
peripheral membrane proteins complement the conical-shaped form of DPPE molecules

62
and constitute a parallel-shaped form practically, making possible the formation of
laterally extended sheets. This finding is not conflicting with our previous information,
as the peripheral proteins in the erythrocytes mainly connect to the inner leaflet rich in
DPPE. Moreover, the membrane of the erythrocytes can be considered as extended, more
planar than nano-spherical. As our aim was to create nanoerythrosomes, changing the
shape (type) of the lipid additive seemed to be reasonable.
Figure 27. FF-TEM images of multilayers in 10×DPPE containing ghost membrane
suspension. The top-view of a laterally extended stacks, consisting of parallel-arranged
sheets (left). A side-view of a laterally extended stack, containing multilayers (right). In
the top view (left) image, some gaps are visible where the larger proteins, protein
aggregates are located in the membrane. (111)
b) Nanoerythrosomes with protein scaffolding
DPPC enriched nanoerythrosomes
Dipalmitoyl-phosphatidylcholine (DPPC) is a cylindrical shaped phospholipid,
which is – compared to DPPE -, more capable of bilayer formation in its pure form (115).
The amount of DPPC additive was calculated to be five (5×DPPC) and ten (10×DPPC)
times more than the total lipid content of the ghost membrane suspensions. The
characteristics of sonicated ghost (nanoerythrosomes and EMPs), ghost+5×DPPC
(nanoerythrosomes with five times of their original lipid content) and ghost+10×DPPC
(nanoerythrosomes with ten times of their original lipid content) were compared to each
other, regarding their homogeneity, morphology and structure of their molecular
constituents.

63
The size-distribution measurement revealed the crucial role of DPPC in the
formation of homogeneous nanoparticles (Table 7). The sonication of ghost membranes
resulted in the formation of vesicle-like objects with an average diameter of 155 nm. The
system did not contain particles larger than approximately 300 nm, but its polydispersity
was quite high (standard deviation: ±89 nm). When an additional fivefold of DPPC was
mixed to the suspension, the sample had a bimodal size distribution till the end of the
sonication. A dominant fraction (89 w/w %) of the particles had an average diameter of
54 nm, but a smaller portion of the particles (11 w/w %) had an average size of 420 nm.
However, in the case of such a wide bimodal distribution, due to the model fitting of light
scattering the calculated mean diameters are not precise, the presence of a small and a
large particle fraction indicates an imperfect mixing of the molecules. The risen amount
of DPPC (10xDPPC) was able to take up (and likely incorporate) the protein particles
(EMPs) into the nanoerythrosomes more effectively. In the 10×DPPC containing
suspension the average size of the vesicles was 134 nm, with a standard deviation value
of only ±36 nm.
Mean diameter
[nm]
Standard dev.
[nm]
Mass distribution
[%]
Sonicated ghost 155 89 100
Ghost+5×DPPC
54 13 89
420 335 11
Ghost+10×DPPC 134 36 100
Table 7. Size distribution of sonicated ghosts prior and after (5× and 10×) DPPC addition
The zeta potential values served with an estimation on the stability of the vesicular
suspensions and showed good correlation with the amount of DPPC additive (Figure 28).
The sonicated ghost suspension without extra lipid had the largest negative zeta potential.
In this case, the nanoerythrosomes contained the highest concentration of membrane
proteins, and they preserved their original lipid composition as well. These two attributes
together resulted in a high net charge of the particles. The measured zeta potential
decreased with the risen amount of DPPC additive, but in the nanoerythrosomes with

64
10×DPPC concentration its value was still significantly negative, suggesting that
nanoerythrosome suspensions even with the most lipid additive have a decent stability.
Figure 28. Zeta potential of sonicated ghosts prior and after (5× and 10×) DPPC addition
(62)
The morphological and structural studies definitely proved that the newly formed
DPPC containing nano-objects were nanoerythrosomes (Figure 29). In the case of
5×DPPC additive, nanoerythrosomes with approximately 50-80 nm size, and slightly
particulated surface were created (Figure 29/A,B). The amount of EMPs in the aqueous
medium was also hardly observable, suggesting a possible uptake of the protein particles
by the extra lipid. When the amount of DPPC was ten times compared to the ghost’s
original lipid content, the resulting nanoerythrosomes had an unexpected morphology.
The objects were roughly still spherical, but a peculiar scaffolding appeared on their
surface (Figure 29/C,D). This network as a surface pattern could only be observed by the
application of FF-TEM, as the freezing process conserved the fine structural details of the

65
nanoerythrosomes in its original, hydrated state. The nanoerythrosomal scaffolding
usually consisted of hexagons and pentagons. This surface pattern was similar to
fullerenes, but only in the geometrical sense. The contact points of the polygons fell on
to the regular surface of spherical balls. The side of the polygons seemed to be
characteristic, it extended to approx. 25 nm. The sides, as edges, protruded from the
spherical surface. They were not homogeneous creations, but they were constituted from
small particles closely packed to each other. The contour of the network could be detected
on the inner side of the bilayer as well. On the nanoerythrosomes, which were broken
through entirely, shells of the network could be seen. These cases are shown in Figure
29/D. In this vesicle, the contour of the broken shell is not cyclic, but consists of linear
sections. These linear sections exhibit the same length as the sides of the hexagons and
pentagons on the outer side of nanoerythrosomes (these hexagons and pentagons can be
observed on surface of the neighbouring nanoerythrosomes also in Figure 29/D).
Furthermore, the scaffolding was continuous on the broken edge of the vesicles in every
observed case, indicating it is an extended formation, which covers the whole of the
nanoerythrosomes and not a local association of the constituents.
Figure 29. FF-TEM images of nanoerythrosomes with 5×DPPC (A,B) and 10×DPPC
(C,D) additive. Particles (white arrow) inside the nanoerythrosome and the characteristic
length of the polygonal network (red arrow) can be seen on the nanoerythrosome surface
and also on the linear section of the shell of the broken nanoerythrosome (D).

66
From the electron micrographs it is clear, that the addition of 10×DPPC caused a
structural change in the nanoerythrosomes. The originally smooth surface of the
nanoerythrosomes without DPPC additive expressed an angular formation, which
indicates the association and possibly also the segregation of certain components. The
appearance of the scaffolding, in combination with the observable disappearance of the
protein particles (EMPs) from the extravesicular space could mean, that the extra lipid
induced the uptake of the proteins and their association in the DPPC enriched membranes.
Consequently, the nanoerythrosomal scaffolding could be a protein network that
surrounds DPPC rich lipid rafts.
Small angle x-ray scattering (SAXS) provides further information on the shell
structure of the nanoerythrosomes. The ghosts (suspended in PBS, in the same condition
as it was obtained after the sonication treatment, without additional lipids), and its DPPC
modified forms, the nanoerythrosomes with 5× and 10×DPPC ratios were measured.
These samples were identical with the ones used for FF-TEM studies. The scattering
patterns were recorded in the q-range between 2∙10-1 and 6 nm-1 in our Credo laboratory
apparatus which are shown in Figure 30. This measurement covers significantly narrower
interval compared to the one that was demonstrated in Figure 7. The small q-range is
missing, therefore I could not receive information about the whole nanoerythrosomes,
namely about their shape, size and size-distribution. The observed q-interval carries
information about the layer-structure of the objects as the quadrate of the bilayer
formfactor, centred at approximately q=1 nm-1 appears (116). In Figure 30 we can see
that the shape of all the three curves are strictly alter from the regular unilamellar vesicles,
taken into consideration the same relevant q-range (2∙10-1 ̶ 6 nm-1), shown in Figure 7.
The SAXS curve exhibits a strongly decreasing exponential form. This scattering attribute
originates from the proteins and protein-aggregates, which are abundantly present in the
samples. The FF-TEM images (Figure 24) show the existence of single, smaller or larger
proteins and their aggregates that can cause this exponential scattering pattern. It has to
be noted that the scattering of proteins is always present independently even if the proteins
or their associates are associated to the nanoerythrosomes or dispersed in the medium.
Beside the dispersed proteins, their membrane embedded forms are also present in the
suspensions, therefore the scattering of the lipid bilayers should be very weak. That is the
explanation for shape of the SAXS curve of nanoerythrosomes without lipid additive
(Figure 30, blue line), where only a “shoulder” appears. Shortly summarized; the
scattering of proteins suppresses the scattering of lipids. When extra-added 5×DPPC is

67
present and consequently the amount of lipid bilayers is increased, instead of the shoulder,
a significant intensity of the quadrate of the bilayer formfactor is observable. This part
will be referred in the followings as “the peak of bilayer”. After adding 10×DPPC to the
ghosts, the intensity of the bilayer derived peak became double, compared to the case of
5×DPPC. The intensity of the peak (at q=1) correlates with the increased lipid
concentration in the system very well. This strengthening of the unilamellar character by
the additional lipid indicates that the DPPC molecules were incorporated into the
nanoerythrosomal membrane and did not suffer any segregation, by creating
multilamellar structures. However a very weak sign of oligolamellarity (the formation of
a few concentric bilayers) appears in the 10×DPPC containing nanoerythrosomes (Figure
30, green line), as a small and narrow diffraction peak is observable at q=1 value. This
extremely small peak corresponds to a very small amount of oligolamellas, therefore the
nanoerythrosomes could still be considered as unilamellar vesicles, with heterodisperse
domains consisting of lipids and proteins.
Figure 30. SAXS curves of ghost membrane and nanoerythrosomes with DPPC additives.
The enhancement of scattering peak, corresponding to the bilayer form (black circle) is
due to the rise of incorporated DPPC. (111)
Considering the visual information obtained by the freeze-fracture method we can
suppose that the scattering objects are nearly spherical unilamellar nanoerythrosomes.
Although the shell of the DPPC enriched nanoerythrosomes is not homogeneous, a

68
spherical shell structure, as a crude model can quantify the shape of their scattering curve.
In other words, a structural analogy between nanoerythrosomes and sterically stabilized
unilamellar vesicles is assumed. (The sterically stabilized vesicles contain additional
shell-layers on both sides of the bilayer, which can be analogous with the proteins of the
nanoerythrosomes.) By employing a shell model of spherical symmetry, an approximate
description of the layer structure becomes feasible. Neglecting the interactions between
individual nanoerythrosomes and assuming their spherical symmetry, the scattering
intensity can be calculated by the symmetric ‘2 Gaussian’ (89). Here one pair of Gaussian
functions represent the polar head group regions of the lipid bilayers, while another pair
the protein molecules located in the bilayer and on its both sides (surfaces?). It must be
noted that a third, single Gaussian contribution is also used to describe the hydrocarbon
chain region of lipid double layers. To reduce the number of independent parameters in
the model and to support its convergence to a physically relevant result, the characteristic
values for the Gaussians of the lipid head groups and the chain region of a pure DPPC
bilayer were used in the first attempt and only the Gaussians for protein localization were
fitted. Even though this model might be overly simplistic, the best fit of 5×DPPC
containing nanoerythrosomes indicates an asymmetric protein localization in the
nanoerythrosomes. It shows that the membrane proteins are mainly located in the bilayer
and on its outer leaflet. The layer thickness, approximated to be about 11 nm, is
significantly larger than that of the hydrated pure DPPC bilayer as it is demonstrated in
Figure 31.
Figure 31. Model description of nanoerythrosome containing 5×DPPC. The visual
observation on a nanoerythrosome by FF-TEM (left). Concept of the nano-structure of
the object (middle). Shell model for reconstruction of the SAXS curve of the
nanoerythrosomes (right). (62)
phospholipid bilayer, 4 nm
thickness of nanoerythrosome, ~ 11 nm
100 nm

69
After the nanostructural characterization, calorimerical studies were executed in
order to obtain thermal features of the lipid matrix and its molecular composition in
nanoerythrosomes. The thermal behaviour of the vesicles membrane highly depend on
their composition. The bilayers composed of different lipid molecules can exhibit
characteristic phase transitions according to their components (117). The composition of
biological membranes is extremely diverse. The phospholipids are varied on a large scale,
the cholesterol content is high (approx. 1:1 in molar ratio compared to the phospholipid
content) and the bilayer is constantly disturbed by proteins associated to- or embedded
into the membrane (118). Consequently, the biological membranes are highly perturbed,
and do not express a characteristic phase transition. The same could be observed on the
thermograms of nanoerythrosomes (Figure 32).
Figure 32. The appearing minor phase transition in DPPC enriched nanoerythrosomes:
5×DPPC - blue, 10×DPPC – green –, values scaled up twenty times compared to a typical
DPPC/water system. (62)
Nanoerythrosomes even with 5×DPPC additive were free from characteristic
phase transitions (blue line). An extremely small sign of chain melting occurred only in
the 10×DPPC containing vesicles (green line). The value of its corresponding change in
enthalpy was approximately 0.4 kJ/mol(DPPC) which is only 1% of the same value of a
pure hydrated DPPC system (ΔH= 33.7 kJ/mol(DPPC)) (Table 8). Also the temperature of
the phase transition was slightly shifted in nanoerythrosomes, compared to DPPC
liposomes, from 41.5°C to 39.6°C. The results suggest that the additional DPPC was fully
mixed in the system, if applied in fivefold amount compared to the amount of ghost lipid.

70
Although the higher amount of extra lipid (10×DPPC) showed some thermal feature, its
intensity and position was far from the typical DPPC membranes.
To summarize: the thermal characteristics of the nanoerythrosome suspensions
revealed similar attributes to the ones obtained by SAXS. The DPPC, even in its highest
concentration incorporated into the vesicles’ membrane. Due to its enrichment in the
10×DPPC containing vesicles, the additive lipid formed DPPC rich domains. These
domains were capable of expressing a small and shifted change in enthalpy, observed by
DSC.
T [°C] ΔH [kJ/mol]
Pretransition Main transition Pretransition Main transition
Ghost+5×DPPC - - - -
Ghost+10×DPPC - 39.6 ± 0.1 - 0.39 ± 0.4
DPPC-water 35.4 ± 0.1 41.5 ± 0.1 4.96 ± 0.5 33.68 ± 0.2
Table 8. Phase transition temperature- (T) and change in enthalpy (ΔH) values of
nanoerythrosomes containing 5×DPPC and 10×DPPC additives and DPPC liposomes
The structural consequences of the nanoerythrosome formation on the atomic size-
range were revealed by ATR-FTIR spectroscopy. The IR spectra of the nanoerythrosomal
suspensions show that the intensities of the lipid related C-H and C=O absorption bands
are significantly getting higher with the rising amount of DPPC (Figure 33). Additionally
the peak positions of CH2 symmetrical and asymmetrical stretching vibrations are shifted
towards the characteristic values of the pure DPPC (νs 2918 cm-1; νas 2850 cm-1) (Figure
33/A). Further changes could be seen in the amide bands of the nanoerythrosomes (Figure
33/B). The protein related amide I peak is slightly shifted, from 1651 cm-1 to 1655 cm-1
due to the DPPC addition, furthermore the small satellite peak at approx. 1630 cm-1 also
shows decreasing tendency. These two processes indicate a change in the secondary
structure of the proteins, from a generally β-sheet character to a more α-helical form.

71
Figure 33. The effect of additional DPPC on the structure of nanoerythrosomes. The
changes of lipid –CH2 (A) and protein – amide I (B) region (111)
The deconvolution of the amide I band - achieved by the help of spectroscopist
colleagues - shows significantly higher α-helix components in the 10×DPPC containing
nanoerythrosomes than in the vesicles without lipid additive (Figure 34). The structural
changes of the proteins could be the consequence of their enriched DPPC environment.
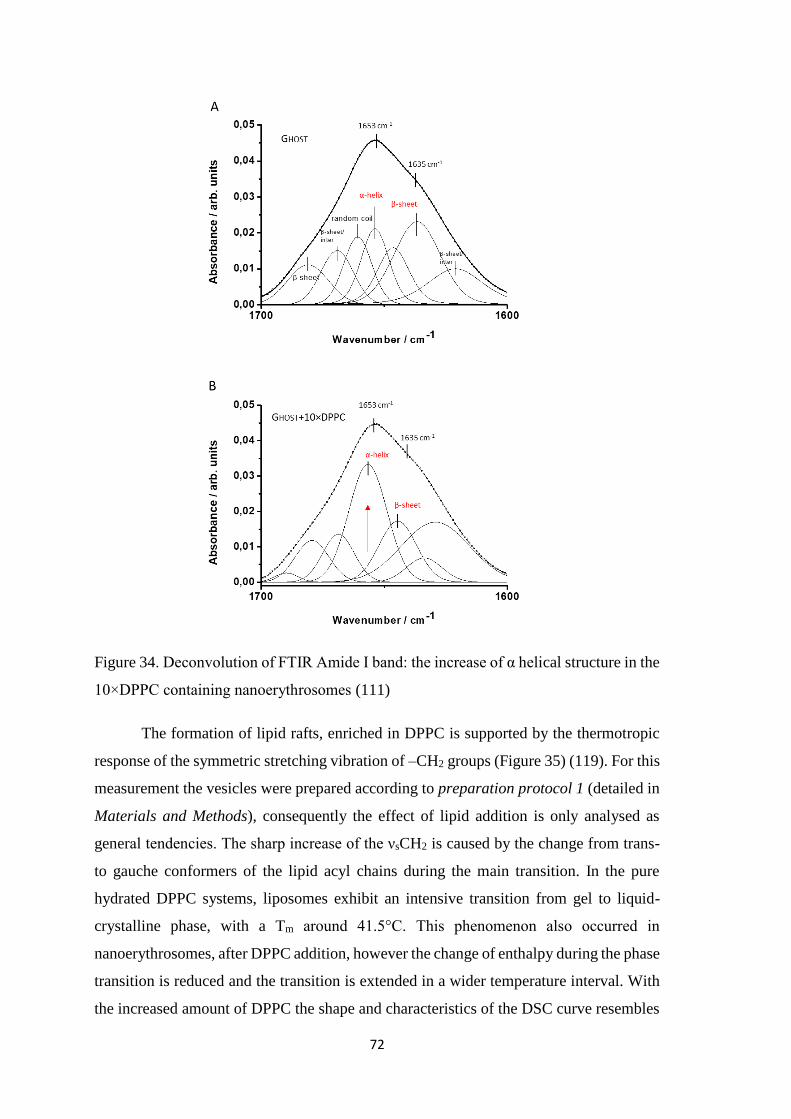
72
Figure 34. Deconvolution of FTIR Amide I band: the increase of α helical structure in the
10×DPPC containing nanoerythrosomes (111)
The formation of lipid rafts, enriched in DPPC is supported by the thermotropic
response of the symmetric stretching vibration of –CH2 groups (Figure 35) (119). For this
measurement the vesicles were prepared according to preparation protocol 1 (detailed in
Materials and Methods), consequently the effect of lipid addition is only analysed as
general tendencies. The sharp increase of the νsCH2 is caused by the change from trans-
to gauche conformers of the lipid acyl chains during the main transition. In the pure
hydrated DPPC systems, liposomes exhibit an intensive transition from gel to liquid-
crystalline phase, with a Tm around 41.5°C. This phenomenon also occurred in
nanoerythrosomes, after DPPC addition, however the change of enthalpy during the phase
transition is reduced and the transition is extended in a wider temperature interval. With
the increased amount of DPPC the shape and characteristics of the DSC curve resembles

73
significantly to the curve of the pure hydrated DPPC system, indicating the formation and
enhancement of lipid domains with the risen amount of DPPC additive. This result shows
an interesting consequence of the compounding. In spite of the fact that the lipid (DPPC)
is present in significant amount, its phase transitional enthalpy-change disappears but its
structural change is in progress. In this case the phase transition character is changed; the
first order type of phase transition changed to second order type. This change is also
accompanied with further alterations; the system became sensitive against any
perturbation, the correlation length became also long, whereby the range of interaction
between the molecules became also extreme long. Presumably, these attributes play
important roles in the formation of protein scaffolding of nanoerythrosomes.
Figure 35. Changes in lipid acyl chain from trans- to gauche conformers during phase
transition of DPPC enriched nanoerythrosomes and synthetic DPPC liposomes (62)
In order to examine the contribution of the scaffolding to the mechanical
properties of the nanoerythrosomes, LD measurements were performed. The
nanoerythrosomes were oriented in linear flow cells – similarly to the extracellular
vesicles -, in the presence of pyrene probe molecules. Due to the sheer force applied in
the flow cell, the spherical vesicles could be deformed according to their flexibility,
resulting in the orientation of their membrane associated probe molecules. The absorption
and LD spectra of membrane embedded pyrene probe molecules are shown in Figure 36.
The values of the orientation factors (S, its connection to LD signal is shown in page 31)
indicate a decreasing tendency starting from the UCF pellet of sonicated ghost (S=0.016),
followed by the 5×DPPC (S=0.011) and 10×DPPC (0.005) containing nanoerythrosome

74
suspensions. The decreasing tendency in the orientation factor shows, that the formation
of the protein scaffolding increased the rigidity of the nanoerythrosemes and resulted in
its lower deformability.
Figure 36. The decreasing elasticity (which is roughly proportional with the magnitude
of LD signal) of nanoerythrosomes – measured by LD spectroscopy - shows correlation
with the formation of the surface scaffolding in 10×DPPC containing vesicles. (111)
Addition of DPPC to purified EMP suspension
The appearance of the protein scaffolding on nanoerythrosomes seemed to be the
consequence of either the lipid addition or the EMP reincorporation, but most probably
both. The importance of the DPPC had been pointed out clearly by a set of measurements
so far. Therefore, to examine the role of the EMPs, the supernatant of ultracentrifugation
(a purified EMP suspension) was mixed with tenfold DPPC - compared to its measured
protein concentration. In the final step of preparation a gentle sonication was applied to
mix the components and induce the particle formation.
Electron microscopic examination of the DPPC enriched EMPs revealed
extremely angular structures. The originally 4-10 nm sized individual particles and their
2-3 fold larger associates (Figure 37/A) disappeared from the suspension and were
replaced by a heterodisperse system. Angular membrane sheets extended into 200-300
nm range (Figure 37/B) and nanoerythrosome-like particles with polyhedral surface
character, with a size up to 100 nm (Figure 37/C) were visible in the electronmicrographs
of DPPC-EMP containing system. These formations are not typical for the pure DPPC
systems, consequently their presence in the suspension had to be the result of an
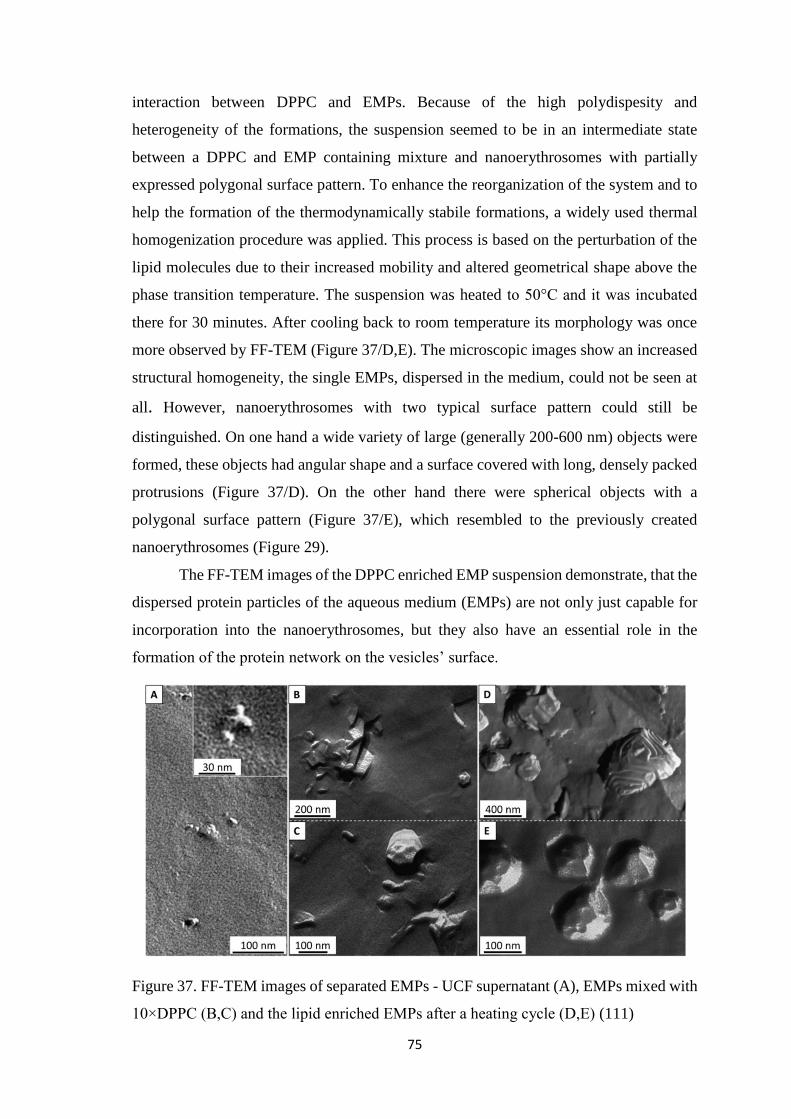
75
interaction between DPPC and EMPs. Because of the high polydispesity and
heterogeneity of the formations, the suspension seemed to be in an intermediate state
between a DPPC and EMP containing mixture and nanoerythrosomes with partially
expressed polygonal surface pattern. To enhance the reorganization of the system and to
help the formation of the thermodynamically stabile formations, a widely used thermal
homogenization procedure was applied. This process is based on the perturbation of the
lipid molecules due to their increased mobility and altered geometrical shape above the
phase transition temperature. The suspension was heated to 50°C and it was incubated
there for 30 minutes. After cooling back to room temperature its morphology was once
more observed by FF-TEM (Figure 37/D,E). The microscopic images show an increased
structural homogeneity, the single EMPs, dispersed in the medium, could not be seen at
all. However, nanoerythrosomes with two typical surface pattern could still be
distinguished. On one hand a wide variety of large (generally 200-600 nm) objects were
formed, these objects had angular shape and a surface covered with long, densely packed
protrusions (Figure 37/D). On the other hand there were spherical objects with a
polygonal surface pattern (Figure 37/E), which resembled to the previously created
nanoerythrosomes (Figure 29).
The FF-TEM images of the DPPC enriched EMP suspension demonstrate, that the
dispersed protein particles of the aqueous medium (EMPs) are not only just capable for
incorporation into the nanoerythrosomes, but they also have an essential role in the
formation of the protein network on the vesicles’ surface.
Figure 37. FF-TEM images of separated EMPs - UCF supernatant (A), EMPs mixed with
10×DPPC (B,C) and the lipid enriched EMPs after a heating cycle (D,E) (111)

76
Temperature induced changes in the established nanoerythrosomal
scaffolding
Electron microscopic images revealed that the sample incubation at 50°C had a
significant effect on the surface pattern of nanoerythrosomes, formed by DPPC and
EMPs. The alternation of the structure from planar sheets (Figure 37/B) to spherical
objects (Figure 37/D,E) and the formation of the network elements suggested a new kind
of association between the EMPs. As this transformation was induced by the heating of
the suspension, the effect of temperature change was examined on nanoerythrosomes with
an already established scaffolding as well – prepared directly from ghosts with 10×DPPC
additive.
To examine the effect of consecutive heating and cooling treatments, freeze
fracture was carried out from three parallel batches of nanoerythrosome suspensions. The
first fracturing was made from freshly prepared nanoerythrosomes with 10×DPPC
additive, according to the general procedure (rapidly frozen in liquid Freon, approx. T= -
180°C). The second batch was heated to 50°C and was incubated there for a few minutes,
to reach the desired temperature in its whole volume. The heated suspension was then
quenched and rapidly frozen. Because of the rapidness (approx. 2×10⁵ °C/s) of the
freezing, the molecular interactions were conserved, which is represented on their
replicas. The third sample was also incubated at 50°C for the same amount of time, but
then it was cooled back to room temperature (approx. 25°C) and quenched prior to the
freeze fracturing process. This way the three observed nanoerythrosome suspensions
were: one in its original (general) state (A), one in a heated state (representing the 50°C
conditions) (B) and one that was heated to 50°C, then cooled back to 25°C before the
fracturing process (C).
The electron microscopic examination of incubated nanoerythrosomes showed
significant difference between the structure of vesicles at 50°C and 25°C (Figure 38). At
room temperature, before heating the nanoerythrosomes had a characteristic 100-200 nm
size and polyhedral shape (Figure 38/A). At 50°C a remarkable increase in size (often
particles with an average diameter of 300-400 nm appear) and association of the vesicles
could be seen. The association could result in their fusion, especially above the phase
transition temperature of DPPC, which could be the source of the larger vesicles. The
large vesicles seem to have an oligolamellar structure – on their fractured surface often
more (typically 2-3) concentric bilayers could be identified. Another attribute of the

77
heated membranes is their waved surface (Figure 38/B). On the spherical
nanoerythrosomes long, parallel bands could be seen, covering practically their whole
surface. On the other hand, the surface of the smaller nanoerythrosomes is rough and
particulated, but the original, polygonal structure is less expressed. It seems that at 50°C
the angular associations like polygons (Figure 29/C,D) or folded sheets (Figure 37/B) are
not typical. The closely packed, long bands, presumably the associations of the side
elements of the dissected polygons, are running parallel and cover the whole of the
nanoerythrosome.
Figure 38. The morphology of nanoerythrosomes at different temperatures during a heat
cycle: 25°C (A), 50°C (B) and at the end of the heat cycle – 25°C (C) (111)
When the 50°C suspension is cooled back to room temperature, the morphology
of the nanoerythrosomes changed in a way that resembles to their original, 25°C form
(Figure 38/C). However, most of the vesicles achieved the polyhedral structure, the
heritage of the high temperature could be also detected. Elongated waves are often
expressed on the surface of the nanoerythrosomes, although the edges of these waves are
significantly sharper than it was in the case of curved bands – found at 50°C (Figure
37/D).

78
These features indicate that the protein scaffolding of the nanoerythrosomes is
thermo-sensitive. The protein particles in the nanoerythrosomal membranes form
different types of associations on 50°C and on 25°C. This indicates a loose, rearrangeable
connection between the proteins. Furthermore, the polygonal network seems to be a
favoured formation at room temperature, if the system contains an appropriate amount of
DPPC additive. This explanation is supported by the observation that the
nanoerythrosomes express polygonal surface pattern, when cooled from 50°C back to
25°C.
Beside morphological changes, the increased temperature (up to 50°C) had
structural consequences on the nanoerythrosomes as well. Structural changes on the
molecular level were observed by ATR-FTIR spectroscopy. The IR spectra of
nanoerythrosomes with 10×DPPC additive were collected in three consecutive heating-
cooling cycles between 25°C and 50°C. The spectra were recorded at every incubation
point both in the heating and in the cooling steps. From the processed spectra the
wavenumber values of the lipid related C-H bands and the protein related amide I bands
were retrieved. The average values of the three consecutive measurements are plotted as
the function of temperature (Figure 39).
As far as the lipid related bands of the IR spectra are concerned, with the rise in
the temperature, a shift in the symmetric stretching vibration of the CH2 bands could be
seen (Figure 39). The position of νsCH2 at 2850 cm-1 is characteristic for DPPC
membranes and it represents the DPPC enriched lipid rafts as shown in Figure 33/A
previously. The shift in its position and the shape of the curve is in connection with the
geometrical alteration of the lipid molecule, which results in the phase transition of the
bilayer (detailed previously in Figure 32). In our case, however, the lipid phase transition
is extremely weak (Figure 32; Table 8), but the shift in the CH2 peak position from
approximately 2850 cm-1 to 2852 cm-1 wavenumbers is a significant change. This shift
corresponds to the alteration of the lipid acyl chain conformation, which results in a
truncated conical shape of the molecule.
The shift in the amide I peak position from approx. 1641 cm-1 to 1634 cm-1 is the
sign for the protein conformational change (Figure 39). A shift in the direction of lower
wavenumbers indicates a growing amount of β-sheet conformation in the
nanoerythrosomes. This could either be the result of the increased temperature, or the
alternation of the proteins’ lipid environment.

79
Figure 39. Temperature induced changes in the lipid (CH2) and protein (Amide I) content
of the 10×DPPC enriched nanoerythrosomes: correlation between the characteristic IR
band shifts and morphological alterations. (111)
By the end of the thermal cycles, the characteristic peak positions for both CH2
and amide I returned to its starting value, which indicates the reversibility of the
conformational changes of the components. Although the shifts in the IR spectra represent
significant alterations for both biomolecules, the reversibility excludes their denaturation
or degradation. Compared to the observations of FF-TEM images, the shifts of IR spectra
are presumably the signs of the formation and dissociation of the nanoerythrosomal
scaffolding. These results serve as further indication for the coupled atomic and nano-
sized structural changes both in the lipid and protein constituents.
The effect of Ca2+ ion on the protein scaffolding
The parameters with a potential impact on the vesicles stability have been widely
characterized in model systems. Arguably, the most important environmental parameters
are the temperature (120) and the ionic strength (121) (122). The temperature had already
been shown to have a significant effect on the structure of the nanoerythrosomes by the
reversible alternation of their protein scaffolding (Figure 39). In order to examine the
effect of the increased ionic strength on nanoerythrosomes, the suspensions were diluted
with CaCl2 solution to a final 10mM Ca2+ concentration. The applied nanoerythrosome
samples contained 10×DPPC additive and expressed a polygonal surface morphology, as
detailed previously (Figure 29).
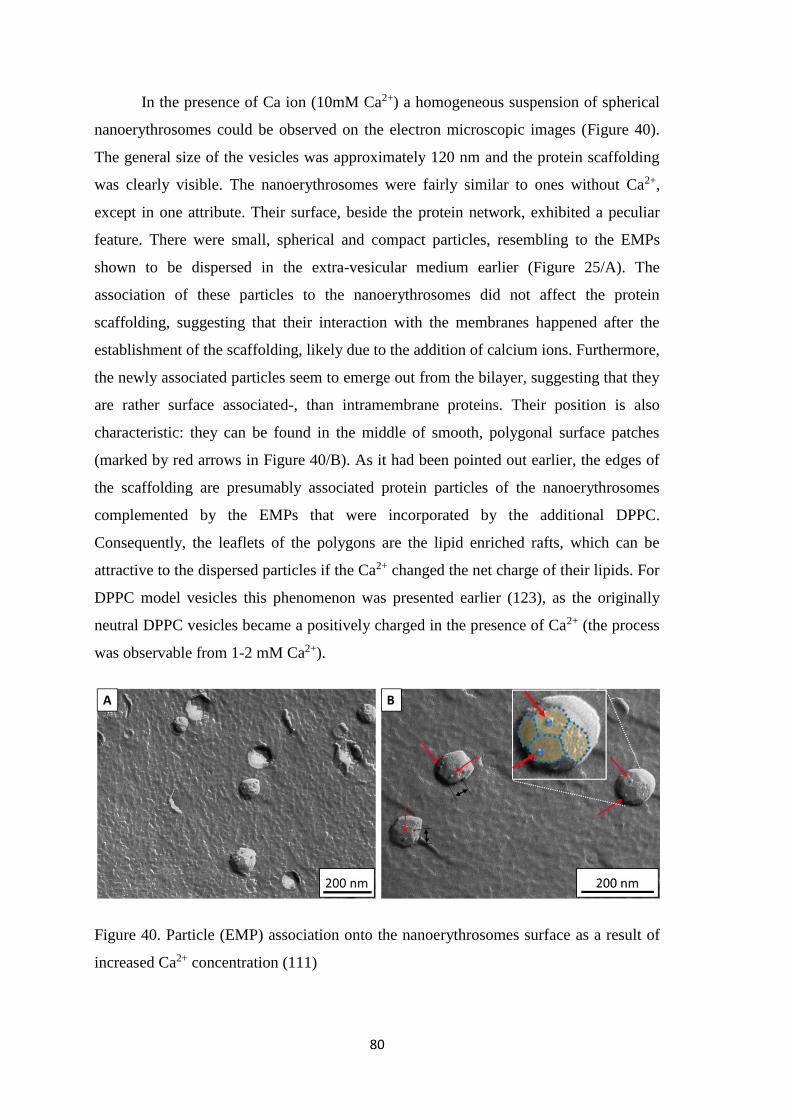
80
In the presence of Ca ion (10mM Ca2+) a homogeneous suspension of spherical
nanoerythrosomes could be observed on the electron microscopic images (Figure 40).
The general size of the vesicles was approximately 120 nm and the protein scaffolding
was clearly visible. The nanoerythrosomes were fairly similar to ones without Ca2+,
except in one attribute. Their surface, beside the protein network, exhibited a peculiar
feature. There were small, spherical and compact particles, resembling to the EMPs
shown to be dispersed in the extra-vesicular medium earlier (Figure 25/A). The
association of these particles to the nanoerythrosomes did not affect the protein
scaffolding, suggesting that their interaction with the membranes happened after the
establishment of the scaffolding, likely due to the addition of calcium ions. Furthermore,
the newly associated particles seem to emerge out from the bilayer, suggesting that they
are rather surface associated-, than intramembrane proteins. Their position is also
characteristic: they can be found in the middle of smooth, polygonal surface patches
(marked by red arrows in Figure 40/B). As it had been pointed out earlier, the edges of
the scaffolding are presumably associated protein particles of the nanoerythrosomes
complemented by the EMPs that were incorporated by the additional DPPC.
Consequently, the leaflets of the polygons are the lipid enriched rafts, which can be
attractive to the dispersed particles if the Ca2+ changed the net charge of their lipids. For
DPPC model vesicles this phenomenon was presented earlier (123), as the originally
neutral DPPC vesicles became a positively charged in the presence of Ca2+ (the process
was observable from 1-2 mM Ca2+).
Figure 40. Particle (EMP) association onto the nanoerythrosomes surface as a result of
increased Ca2+ concentration (111)

81
The Ca2+ induced interactions of nanoerythrosomal protein molecules were
analysed by ATR-FTIR spectroscopy, examining the protein related amide I peak
positions (approx. 1639-1633 cm-1) in three consecutive heating-cooling cycles. At room
temperature (25°C), a slight shift could be seen from approximately 1639 cm-1 to 1637
cm-1 wavenumbers, obtained for nanoerythrosome suspensions without Ca2+ and with
Ca2+, respectively (Figure 41). This shift in the amide I absorption peak indicates slightly
different protein associations for the vesicles with increased Ca2+ concentration. When
the suspensions were heated up to 50°C (plotted only until 45°C as further increase had
no effect), the amide I peaks shifted to lower wavenumbers reaching their minimum
(approx. 1633 cm-1) at around 42°C. As the characteristic phase transition temperature
for DPPC membranes is approximately 41.5°C, this suggests that the Ca2+ interacts with
both the proteins and the lipid bilayer of the vesicles. By heating the suspension above
the phase transition temperature, the Ca2+ induced protein associations are getting weaker,
presumably due to the increased mobility of the membrane components. It is also notable,
that when the suspensions cooled back to room temperature, the difference between Ca2+
enriched and Ca2+ free vesicles reappeared, consequently the effect of calcium ion is
reversible.
Figure 41. The effect of 10 mM Ca2+ on the nanoerythrosomal proteins according to
thermotropic FTIR measurements – the average of three consecutive heating/cooling
cycles
Environmental parameters such as temperature and the presence of bivalent
calcium ion had significant effects on the morphology of the nanoerythrosomes. The
1632
1634
1636
1638
1640
25 30 35 40 45
Am
ide
I pea
k p
osi
tio
n [
cm-1
]
Temperature [°C]
Ghost+10×DPPC Ghost+10×DPPC+Ca2+
Polinom. (Ghost+10×DPPC) Polinom. (Ghost+10×DPPC+Ca2+)
82
finding, connecting to the presence of Ca2+ can also indicate that Ca2+ ion effect certain
proteins, which are not able to take part in the constitution of the scaffolding,
consequently forced to be segregated in the lipid rich domains.
c) Lysophosphatidylcholine (LPC) enriched nanoerythrosomes
Formation of small-scaled nanoerythrosomes
According to the composition of (RBC) cell membranes,
phosphotidyletanolamins and phosphotidylcholines are the most frequent lipids of the
inner- and outer leaflets of the bilayer, respectively (65) (124). For vesicle formation, a
high radii curvature is necessary, which could be induced only by lipids with cylindrical
or conical shape. The effect of lipids with different shape was examined by the addition
of DPPE (Figure 27) and DPPC (Figure 29) molecules to the ghost suspensions. As a
consequence of the extra lipid, spherical vesicles were only observed in the case of DPPC
additive. To further enhance the curvature radii, conical shaped LPC was applied instead
of the cylindrical DPPC. By the incorporation of the LPC into the ghost membranes, a
more frequent vesicle formation and particle size reduction could be expected.
Furthermore, the LPC molecule is closely related to the DPPC, having the same choline
head group and palmitic (C16) acyl chain. One significant difference is that its glycerol
backbone is esterified only by one palmitic acid. On one hand this means, that the surface
character of the LPC rich membranes should be similar to the ones consisted of DPPC.
On the other hand the morphology of the nanoerythrosomes could be significantly altered
compared to the DPPC enriched vesicles, due to the highly conical and reversely shaped
LPC.
For LPC enriched nanoerythrosome preparation lower LPC:ghost ratios were
applied (compared to DPPC:ghost ratios), due to the extreme physicochemical character
of this lysolipid (125). Nanoerythrosomes with 2×, and 5×LPC additives were prepared
and in the case of 5×LPC, no sonication was necessary to achieve homogeneous
suspension. The cloudy suspension of ghosts became transparent as the 5×LPC film
dissolved from the wall of the glass vial, without any physical perturbation. In the case of
2×LPC containing nanoerythrosomes the effect of the additive lipid was not as significant
as in 5× LPC case, the suspension was sonicated according to the general
nanoerythrosome preparation process.

83
It was obvious by visual observation that the addition of LPC resulted in a highly
monodisperse suspension of nanoerythrosomes. DLS measurements showed that the size
of the particles decreased significantly (Table 9), even compared to the size of the
conventional nanoerythrosomes (Table 4). A dominant fraction of small particles (approx.
46 nm in (2×) and 20 nm in (5×) LPC containing samples) were typical for both LPC
concentrations, complemented by a lower amount of larger vesicles. The average vesicles
were larger for the 2×LPC containing nanoerythrosomes. The nanoerythrosomes, which
were formed spontaneously in the presence of 5×LPC additive were extremely small (the
average size was 20 nm, for 95% of the particles) and only a small vesicle fraction with
a mean diameter of 107 nm could be observed. The standard deviation values were also
low, indicating the homogeneity of the suspensions. Considering the micelle formation
tendencies in LPC suspensions, the size distribution of pure LPC reference samples were
also measured by DLS. The hydrodynamic diameter of LPC micelles appeared to be
significantly smaller (approx. 5 nm) compared to the smallest of the LPC containing
nanoerythrosomes.
Mean diameter
[nm]
Standard dev.
[nm]
Mass distribution
[%]
LPC micelle 5 4 100
Ghost+2×LPC
46 7 93
187 46 7
Ghost+5×LPC
20 4 95
107 28 5
Table 9. Size distribution of LPC containing nanoerythrosomes and reference LPC
micelles
The LPC containing nanoerythrosomes are small, spherical objects as observed
on the FF-TEM images (Figure 42/A,B) . The particle distribution according to the
electron micrographs show good correlation with the measured values of DLS (Figure
42/C). In the 2×LPC containing samples most of the spherical particles are smaller than
50 nm (Figure 42/A). With the significantly reduced size, the bilayer structure of the
particles became a relevant question. The spherical particles on the electron micrographs
of the 2×LPC containing nanoerythrosomes clearly express a bilayer character. The

84
particles are generally broken into half, which could only be the result of the hollow
vesicles. On the edges of the spheres that were broken through entirely the thickness of
the membrane could be seen. If the ratio of the LPC additive is increased from 2× to 5×,
the detergent effect of the lysolipid seems to transform the vesicles. Most of the visible
particles in the 5×LPC containing suspension had a size smaller than 20 nm (Figure 42/B).
These small, dispersed particles do not show a lamellar structure, they are more similar
to the EMPs, obtained by the ghost membrane sonication (Figure 37/A). Consequently, it
is believed that the 5× amount of the LPC disrupted the ghost membrane, by extracting
and encapsulating its components into small micelles. The presence of these small-scaled
nanoerythrosomes suggests that by the adjustment of the LPC concentration a tailoring
of the nanoerythrosomes could be possible.
Figure 42. Structural properties of small-scaled nanoerythrosomes due to LPC addition
(111)
Disruption of nanoerythrosomal scaffolding by LPC
The effect of lysolipid on the vesicle’s structure was so significant (when used in
2× and 5× amount) that even its lower concentration resulted in a completely new type of
small nanoerythrosomes (Figure 42/A). In order to only slightly perturb the
nanoerythrosomal bilayer and examine the LPC’s effect on the polygonal protein
scaffolding, a reduced amount of LPC was applied. For experiments with lowered LPC,
10×DPPC containing, polyhedral nanoerythrosomes were used. The polyhedral
nanoerythrosomes were mixed to a suspension of LPC, in a way to achieve a final
LPC:DPPC:ghost-lipid ratio of 0.5:10:1 (n/n ratios). As the LPC was mixed to the
nanoerythrosomes having 10×DPPC (after the establishment of their protein scaffolding),
the impact of the lysolipid on the scaffolding could be examined.
According to the freeze fractured TEM images, the shape and size of the
nanoerythrosomes are not affected by the small amount of LPC additives (Figure 43/A,B),

85
but the protein scaffolding changed significantly. The protrusions, expressed by the
10×DPPC containing nanoerythrosomes (Figure 43/A) were abolished in the presence of
0.5×LPC (Figure 43/B). The surface of the nanoerythrosomes became homogeneous,
without the presence of the angular network, but instead of being smooth they were
roughly particulated. It seemed that the particles of the protein network were evenly
dispersed on the surface of the nanoerythrosomes after the addition of 0.5×LPC to the
suspension.
Figure 43. Morphological (A,B) and structural (C) changes in DPPC enriched
nanoerythrosomes due to a low (0.5×) amount of LPC additive (111)
Structural changes in nanoerythrosomes due to lysolipid addition could be
observed by SAXS measurement (Figure 43/C). On the scattering curve of the
nanoerythrosomes, having 10×DPPC and 0.5×LPC, two differences could be seen,
compared to the scattering of 10×DPPC containing nanoerythrosomes. The
monotonously decreasing beginning section of the scattering curve corresponds to the
protein particles of the suspension. This section is increased significantly when LPC was
present. This is the consequence of the interaction between LPC and the proteins resulted
in a destruction of the protein scaffolding producing smaller scattering units. At the same
time, the characteristic form factor of the bilayers did not change and appear as a broad
peak in both cases. These features of the SAXS curves indicates the LPC molecules likely
interact with the protein constituents of scaffolding causing their presence in the bilayers
unobservable.
To summarize the results, the addition of lysolipid had a strong impact on the
structure and surface morphology of nanoerythrosomes, even in its smallest concentration
(0.5×LPC) (Figure 43). Due to its conical shape, LPC enhanced the formation of

86
extremely small nanoerythrosomes (with an average diameter of 46 nm) when applied in
(2×LPC) concentration (Figure 42/A). If the amount of the lysolipid additive was risen to
fivefold, its detergent effect became dominant and the resulted particles were rather
micelles or dispersed proteins than vesicles (Figure 42/B). In its smallest concentration
(0.5×) the LPC had an effect on the vesicles morphology by dissociating the protein
scaffolding and resulting in homogenous nanoerythrosomal surface. The observations
suggest that LPC could be useful for tailoring the nanoerythrosomes on a wide structural
range.

87
Summarization of the results
Characterization of extracellular vesicles derived from “in-vivo” systems
I carried out the characterization of extracellular vesicles, derived from Jurkat T
lymphocytes and red blood cells. The characterization techniques involved freeze fracture
combined transmission electron microscopy and dynamic light scattering, for the
examination of the vesicles morphology and size distribution, respectively. It was
concluded, that the extracellular vesicle subpopulations could be distinguished according
to their characteristic size. The exosomes, isolated by me, had a size distribution between
60-150 nm, the microvesicles appeared to be larger, approximately 100-400 nm in size.
The third type of extracellular vesicles, the apoptotic bodies were significantly larger with
a typical diameter between 0.5-4 µm. These values are in good correlation with the
literature. The mean diameters of the isolated subpopulations were 100 nm, 180 nm and
1500 nm, for exosomes, microvesicles and apoptotic bodies, respectively. The isolated
vesicles typically had a spherical shape and according to FF-TEM micrographs the
vesicles had a unilamellar form. The surface of all the three vesicle populations were
covered by protein particles and their associated forms. The membrane particle
distribution was homogeneous in the case of apoptotic bodies, but on microvesicles and
exosomes the particles were associated heterogeneously.
An interesting, novel mechanical property of the extracellular vesicles was
observed by linear- (LD) and circular dichroism (CD) spectroscopy. It was revealed that
the red blood cell derived extracellular vesicles could be deformed into an anisotropic
form in a Couette-flow cell, whereby the degree of deformation depended on the
composition and storage time of the isolated vesicles.
My extracellular vesicle isolations showed higher protein content – measured by
Bradford protein assay – in the case of apoptotic bodies, than for exosomes and
microvesicles. FTIR spectroscopy served with further details from the secondary
structure of the vesicles. The ratio of α-helixes, β-sheets, intermolecular β structures
showed variance depending on the vesicle populations and their cellular origin. By the
calculation of certain integrated IR band intensities, the ratio of vesicular proteins and
lipids could be determined. This – so called spectroscopic protein to lipid – ratio served
with a possibility to distinguish extracellular vesicle subpopulations, which is highly
important from a diagnostic point of view.

88
Preparation of nanoerythrosomes from red blood cell ghost membrane
The micrometric sized, planar ghost membranes were transformed into spherical
nanoerythrosomes by sonication. The size of the resulting nanoparticles depended on the
intensity of the sonication process, the average diameter of the vesicles was between 150
and 60 nm. The surface of the nanoerythrosomes was covered by 5-10 nm large proteins
and their 20-30 nm large associates in a heterogeneous distribution. In the aqueous
medium similar sized particles could be found (referred to as extra membrane particles –
EMPs, in the following paragraphs). By ultracentrifugation a typically nanoerythrosome
containing pellet and an EMP containing supernatant could be achieved. The protein
content of the two separated fractions significantly differed from each other. According
to MS analysis the supernatant contained 79- and the pellet 69 different proteins. The four
most frequent proteins in both fractions were the same (spectrin α, β, ankyrin and „Band-
3”). The spectroscopic analysis showed no significant difference between the protein
conformation of the nanoerythrosomes prior and after of the sonication process.
The phospholipid guest molecules, which were applied to structurally modify the
ghost membranes (dipalmitoyl-phosphoethanolamine (DPPE), dipalmitoyl-phosphocholine
(DPPC), lysophosphatidylcholine (LPC)) transformed the ghosts. The transformation
changed the structure and morphology of the precursor membranes significantly. The
degree of transformation depended on the type of the lipid additive as well as the ratio of
the ghost and guest molecules.
The addition of DPPE resulted in laterally extended 200-800 nm wide, planar
membranes, which showed highly ordered stacks of layers on the FF-TEM images.
The addition of DPPC formed typically 150 nm large, spherical
nanoerythrosomes. By changing the amount of the lipid additive (calculated according to
the measured protein concentration of the ghost membrane), a change in the vesicles
morphology was observable. In the case of both DPPC additive ratios (5× and 10×), a
homogeneous nanoerythrosome suspension was formed. When the amount of DPPC was
risen to 10×, a polygonal surface pattern (consisting of pentagons and hexagons) appeared
on the nanoerythrosomes. The complex physicochemical characterization of this novel
type of nanoerythrosome was carried out by FF-TEM, DSC, FTIR and SAXS methods.
The temperature dependence of the polygonal scaffolding was observed by temperature
controlled FTIR, in consecutive heating/cooling cycles. It was presented that the lipid and
protein components have a crucial role in the observed structural alternation. The

89
temperature induced changes appeared to be reversible. The role of the EMPs in the
formation of the polygonal scaffolding was examined by the separation of the EMPs and
their selective enrichment with 10×DPPC. It was presented, that the DPPC additive forms
polyhedral nanoerythrosomes with the EMPs, similarly to DPPC enriched ghosts.
By the application of LD and CD spectroscopy an enhanced stiffness – and
reduced deformability – of the vesicles was seen, caused by the establishment of the
polygonal network.
The addition of LPC resulted in drastic transformation of the ghosts. Its effect was
visually observable in the case of 5×LPC, by the alternation of refracted light through the
suspension. Due to 2×LPC additive, the size of the newly formed vesicles was
approximately 40 nm, while in the case of 2×LPC additive the particles were rather
micelles than vesicles, with an average size of 20 nm.
A small amount of LPC (0.5×) caused the dissociation of the previously
established polygonal network in DPPC enriched nanoerythrosomes. The angular
structural elements of the scaffolding were dispersed on the vesicles surface by the low
amount of LPC additive.
The presence of calcium ion (10 mM) slightly perturbed the polygonal network of
the 10×DPPC containing nanoerythrosomes. The effect of the Ca2+ could be seen both by
FF-TEM, and IR spectroscopy. In the TEM images associated particles appeared at the
centre of the polygons. Furthermore, FTIR spectroscopy revealed the reversible
dissociation of the protein scaffolding.
Figure 44. Summarization of the nanoerythrosome preparation process

90
Az eredmények összefoglalása
„In vivo” rendszerek extracelluláris vezikuláinak jellemzése
Jurkat T limfocitákból és vörösvértestekből izolált extracelluláris vezikulák
fagyasztvatöréssel kombinált transzmissziós elektronmikroszkópos (FF-TEM)
morfológiai vizsgálatát-, valamint dinamikus fényszórással (DLS) történő méretanalízisét
végeztem el. Megállapítható, hogy az extracelluláris vezikulák méretben elkülöníthető
szubpopulációkból állnak. Az általam izolált exoszómák (EXO) mérete 60 és 150 nm
között van, míg az ennél nagyobb mikrovezikulák (MV) 100 és 400 nm közötti méretűek.
A harmadik, extracelluláris vezikula forma képviselői, az apoptotikus testek (AB), ennél
lényegesen nagyobb méretűek 500 nm és 4 μm közötti kiterjedésűek. Ezek az adatok
megfelelnek az extracelluláris vezikulákról ismertetett irodalmi érékeknek. A három
szubpopuláció jellemző mérete, az előbbiek sorrendjében 100, 180 és 1500 nm. Az izolált
vezikulák közelítőleg gömb alakúak. Az FF-TEM képen megfigyelhető, hogy az áttört
vezikulák unilamellás formájúak. Mindhárom szubpopuláció felszínét, membránfehérjék
egyedi vagy asszociálódott formái borítják. A nagyobb méretű apoptotikus testek felszíne
egyenletesen borított, míg a kisméretű exoszómák felületén a fehérjék, és azok
asszociátumainak eloszlása egyenetlen. Az extracelluláris vezikulák különleges, eddig fel
nem tárt mechanikai sajátságát vizsgáltam lineáris dikroizmus (LD) és cirkuláris
dikroizmus (CD) módszerek segítségével. Megállapítható volt, hogy a vörösvértest
eredetű mikrovezikulák a forgó Coutte-cellában anizotrop térbeli formává deformálhatók,
ahol a deformáció mértéke a vizsgált vezikula összetételétől és tárolási idejétől függ. Az
általam izolált extracelluláris vezikulák esetén a klasszikus fehérjemeghatározási
módszer (Bradford assay) az exoszómák és mikrovezikulák fehérjetartalmára hasonló
értéket mutat, míg az apoptotikus testek esetében a fehérje koncentráció lényegesen
nagyobb. A vizsgálatok FTIR spektroszkópiai módszerrel történő kiterjesztése további
eredménnyel járt: a fehérjék másodlagos szerkezetének jellemző motívumai
analizálhatók. Az α-hélix, a β-redő, az intermolekuláris kölcsönhatásokon alapuló β-redő,
valamint rendezetlen régiók arányai sejttípusonként és izolált vezikula
szubpopulációnként is eltérnek. A spektroszkópiai vizsgálatok további ígéretes
alkalmazását jelzi, hogy a megfelelő rezgési sávok felhasználásával, a vezikulák
fehérjéinek és lipidjeinek az aránya is megállapítható. E jellemző (az úgynevezett
spektroszkópiai fehérje-lipid arány) felhasználásával az általam izolált exoszómák és

91
mikrovezikulák is megkülönböztethetők, amelynek diagnosztikai szempontból nagy
jelentősége van.
Nanoeritroszómák kialakítása vörösvértest eredetű ghostmembránból
A több mikrométeres, síkban kiterjedt ghost-membrán ultrahang hatására
hozzávetőlegesen gömbalakú nanoeritroszómákká alakul. A képződött nanorészecskék
mérete az alkalmazott ultrahang teljesítményének fokozásával változik, annak átmérője
az átlagos értékkel jellemezve a 150 – 60 nm-es tartományban csökken. A
nanoerythroszómák felületét rendezetlen módon 5 – 10 nm-es fehérjék és 20 – 30 nm
kiterjedésű fehérjemolekulákból álló asszociátumuk borítják. Ugyanilyen méretű egyedi
(a későbbiekben „membránon kívüli részecskék”-nek nevezett, az értekezésben EMP–vel
rövidített) fehérjék és fehérje asszociátumok találhatók a nanoeritroszómák közötti vizes
közegben. Ultracentrifugálással elválasztva, a (lényegében nanoeritroszómákat
tartalmazó) pellet és a felülúszó fehérje tartalma szignifikánsan különbözik. MS analízis
alapján a felülúszóban 79 –, míg a pelletben 69 féle fehérjét azonosítottunk. Mindkét
frakció négy legjellemzőbb fehérje típusa (spektrin α, β , ankyrin és „Band-3”) azonos
volt. A kiindulási ghost membrán, a nanoeritroszóma, a felülúszó és a pellet
összehasonlító spektroszkópiai vizsgálata alapján, az előállítás során alkalmazott
ultrahangos kezelésnek nem volt kimutatható hatása a membránfehérjék
konformációjára.
Az szerkezet változtatás céljából a ghost membránhoz adott foszfolipid
vendégmolekulák (dipalmitoilfoszfatidiletanolamin (DPPE), dipalmitoilfoszfatidilkolin
(DPPC), lizofoszfatidilkolin: palmitoilfoszfatidilkolin (LPC)) a gazdarendszert
átalakítják. Az átalakulás szignifikáns morfológiai, szerkezeti változással jár, a változás
mértéke a lipid fajtájától és gazda – vendég molekulák arányától függ.
DPPE hozzáadás esetén laterális irányban kiterjedt (200 – 800 nm) síkok, az FF-
TEM képeken jól megfigyelhető, szabályszerű elrendeződését mutató halmazok jöttek
létre.
DPPC adalék hatására tipikusan 150 nm körüli, közel gömbalakú
nanoerythroszómák formálódtak. A lipid adalék kiindulási ghost fehérje mennyiségéhez
viszonyított arányát változtatva, lényeges morfológiai változások voltak
megfigyelhetőek. Mind az 5×DPPC, mind a 10×DPPC lipid beágyazódását követően
homogén nanoerythroszóma szuszpenzió keletkezett. Továbbá a nagyobb DPPC

92
koncentráció esetében a nanoeritroszómák felszínén ötszögekből és hatszögekből álló,
összefüggő poligonális hálózat jelent meg. Az újszerű, eddig az irodalomban nem ismert,
felületi fehérje-mintázattal rendelkező nanoeritroszómák komplex jellemzését FF-TEM,
kalorimetria (DSC), FTIR és kisszögű röntgenszórás (SAXS) módszerek segítségével
végeztük el. Hőmérsékletfüggő FTIR mérésekkel, több fűtési/hűtési cikluson keresztül
igazoltuk, hogy a fehérje hálózat mintázata hőmérsékletfüggő és annak változásában
mind maguk az asszociálódott fehérjék, mind az asszociációt segítő DPPC molekulák
szerepet játszanak. A mérések alapján a fehérje hálózat mintázat-változása reverzibilis. A
hálózat kialakulásához vezető fehérje-lipid kölcsönhatást, szeparáltan, az elválasztott
membránon kívüli részecskék (EMP) és DPPC molekulák összekeverése esetén is
megfigyeltük. Az EMP:DPPC (1:10 tömegarány) is hasonló felületi mintázatú
nanoerythroszómákat eredményezett, mint a 10×DPPC-vel adalékolt ghost.
Az LD és CD módszerek alkalmazásával megfigyeltük, hogy a felületi fehérje
hálózat jelenléte a nanoerythroszóma merevségét okozza és nyírási igénybevétel esetén
nem deformálható, míg a hálózat részleges kiépülése a nanoerythroszóma
plasztikusságának növekedésével jár.
Az LPC ghost membránhoz történő hozzáadása drasztikus változásokkal járt. Az
LPC hatását jól jelzi, hogy 5× mennyiségben a ghost membránhoz adva a keletkező
részecskék fénytörési tulajdonságainak változása már szabad szemmel is követhető.
2×LPC beágyazódását követően átlagosan 40 nm-es vezikulák keletkeztek, míg 5×LPC
tömegarány esetében micella-szerű, objektumok kialakulásához vezetett.
Az LPC relatív kis mennyisége (0.5×), a 10×DPPC lipid jelenlétében kialakult
fehérje hálózatot megbontja és a fehérjék poligonális felületi hálózata a nanoeritroszómák
felületén elhelyezkedő rendezetlen hálózattá alakul.
A kalciumion (Ca2+) jelenléte a tanulmányozott (10 mM) koncentráció
tartományban perturbálja a 10×DPPC-vel kialakult poligonális hálózatot. A Ca2+ ion
hatása mind morfológiailag (FF-TEM), mind spektroszkópiai úton követhető. Az FF-
TEM felvételek, a poligonális hálózat öt- és hatszögeinek centrumában önálló fehérje
asszociátumok jelennek meg. A felületi mintázat le és felépülésével járó reverzibilis
átalakulás figyelhető meg az FTIR alkalmazásával.

93
Acknowledgements
Most of all, I am greatly indebted to my supervisor Attila Bóta and to my consultant Judith
Mihály for all their support and guidance. They were always there for me when I was in
the need of advice - or blood. This work would not have been possible without them!
I am very grateful to Zoltán Varga, for his help and advices, most of all in the field of
extracellular vesicles.
I would like to thank Imola Csilla Szigyártó for her support throughout my research work,
especially concerning the LD, CD and UV-Vis measurements.
I am greatly thankful to Teréz Kiss for her amazing TEM images, without her help the
structural phenomena of nanoerythrosomes would have never been recognised!
I am very grateful to András Wacha for the outstanding SAXS measurements.
I would like to thank Gábor Lelkes, for his help and advices in ghost membrane
preparation.
I would also like to thank to all the members of the Biological Nanochemistry, and
Biological Self-Assembly Research Groups! It has been a wonderful experience working
with such a great group of people!
I am also very grateful to my family, most of all to my wife, my children and my parents,
who were really tolerant and helpful during the whole work!

94
List of figures
Figure 1. Phospholipid molecules and their formations in aqueous buffers. The effect of
lipid geometries [e.g. phosphatidylcholine (PC), lysophosphatidylcholine (LPC) and
phosphatidylethanolamine (PE)] on the membrane curvature. Typical bilayer
formations: unilamellar- (ULV) and multilamellar vesicles (MLV) and
multivesicular aggregates (MVA). 4
Figure 2. Modification of the liposome membrane (18) 5
Figure 3. Extracellular vesicle classification according to production pathway and
characteristic size 6
Figure 4. Schematic representation of red blood cell membrane structure (64) 10
Figure 5. Asymmetric lipid composition of human red blood cell membrane (69) 11
Figure 6. The process of freeze fracturing in the case of membrane bilayers. The
fracturing frequently opens up the two membrane leaflets, resulting in a cytoplasmic-
and an extracellular half, which faces are called P face and E face, respectively. 15
Figure 7. Typical SAXS curve of a unilamellar vesicle 19
Figure 8. Characteristic scattering curves of multilamellar vesicles (MLV) of DPPC-
water system at typical phase temperatures. In the biologically relevant temperature
range the lipids can either be in gel, rippled gel or in liquid crystalline phase, whereby
the number and sharpness of the diffraction peaks on the SAXS curves indicate
different kind of orderings of the membrane components. 21
Figure 9. FT-IR spectrum of biological samples, with typical molecular vibrations
corresponding to biomolecules highlighted (91) 22
Figure 10. FTIR spectra of DPPC/water suspension in different measurement conditions:
A: DPPC/water suspension (20m/m%); B: after subtraction of water background; C:
dry-film spectrum 24
Figure 11. Deformation of vesicle-like objects and probe molecule (pyrene) orientation
in LD flow cell (95) 26
Figure 12. Size distribution of Jurkat cell derived extracellular vesicles [exosomes (EXO),
microvesicles (MV) and apoptotic bodies (AB)], measured by DLS 38
Figure 13. Representative FF-TEM images of Jurkat cell derived extracellular vesicles
[exosomes (EXO), microvesicles (MV) and apoptotic bodies (AB)] (99) 40

95
Figure 14. Representative ATR-FTIR spectra of EVs isolated from Jurkat cell line:
exosomes (EXO), microvesicles (MV) and apoptotic bodies (AB) (99) 41
Figure 15. Representative ATR-FTIR spectra of EVs after PBS buffer subtraction in the
1800-1350 cm-1 wavenumber region: C=O stretching from lipid esters, amide I and
amide II bands of proteins (A). Second derivative IR spectra of the amide I region
for protein secondary structure assessing (B). Each minima in the second derivative
spectra correspond to a component band peak. (99) 43
Figure 16. Selected wavenumber regions of Jurkat cell derived exosomes used for P/L
determination protocol: amide I and amide II wavenumber region (1770-1470 cm-1)
(A) deconvoluted by curve fitting with Lorentz-function (band denoted by dotted
lines), C-H stretching region (3040-2700 cm-1) acting for lipid components (B). (99)
45
Figure 17. Linear regression diagram of BSA-Lipomix (104) 46
Figure 18. Calculated protein/lipid ratios for DOPC-BSA extruded and gelfiltrated
vesicles: effect of sonication in function of vesicles size (B) (99) 47
Figure 19. Representative ATR-FTIR spectrum of RBC derived EV (blue line) compared
with RBC ghost membrane spectrum (red line) (A). Second derivative IR spectra of
the amide I region for protein secondary structure assessing (B). (99) 48
Figure 20. Polarized light spectroscopy of red blood cell EVs. LD spectra (A, upper) and
absorption spectra (A, bottom) of EVs from 0 (black) and 28 (red) days old vesicles.
Far-UV CD curves of 0 (black) and 28 (red) days old vesicles next to the CD
spectrum of free haemoglobin (blue) (B). (95) 50
Figure 21. FF-TEM images of RBC ghost membrane suspensions (A-D), with typical
representatives of P- and E-faces of the fractured bilayers, (C), (D), respectively. The
P-face (inner cytoplasmic half membrane) is densely packed with membrane
proteins, while in the E-face (outer extracellular half membrane) contains loosely
packed proteins and protein associates. 52
Figure 22. Surface morphology of ghost membrane (A). The FF-TEM images shows a
characteristic “E” face with loose surface protein aggregates. The DLS indicates
large scattering objects (B). 54
Figure 23. Surface morphology of nanoerythrosomes formed during the sonication of
ghost membranes (A). Size (mass) distribution, measured by DLS (B), shows the
presence of smaller objects too. 54

96
Figure 24 Nanoerythrosomes and free membrane protein particles (marked with
circles) (A). Surface of nanoerythrosomes and free membrane protein particles
(EMPs) under higher magnification (B). 55
Figure 25. Nanoerythrosomes and extra-membrane particles (EMPs) in sonicated ghost
suspension (A). Vesicle rich pellet- (B) and mostly EMP containing supernatant (C)
of ultracentrifugation. (109) 57
Figure 26. FTIR spectra of ghost, sonicated ghost and its UCF fractions. The whole
spectra (A) and the part containing amid I, amid II and C=O vibrations [1350-1800
cm-1] (B). (109) 58
Figure 27. FF-TEM images of multilayers in 10×DPPE containing ghost membrane
suspension. The top-view of a laterally extended stacks, consisting of parallel-
arranged sheets (left). A side-view of a laterally extended stack, containing
multilayers (right). In the top view (left) image, some gaps are visible where the
larger proteins, protein aggregates are located in the membrane. (109) 62
Figure 28. Zeta potential of sonicated ghosts prior and after (5× and 10×) DPPC addition
(62) 64
Figure 29. FF-TEM images of nanoerythrosomes with 5×DPPC (A,B) and 10×DPPC
(C,D) additive. Particles (white arrow) inside the nanoerythrosome and the
characteristic length of the polygonal network (red arrow) can be seen on the
nanoerythrosome surface and also on the linear section of the shell of the broken
nanoerythrosome (D). 65
Figure 30. SAXS curves of ghost membrane and nanoerythrosomes with DPPC additives.
The enhancement of scattering peak, corresponding to the bilayer form (black circle)
is due to the rise of incorporated DPPC. (109) 67
Figure 31. Model description of nanoerythrosome containing 5×DPPC. The visual
observation on a nanoerythrosome by FF-TEM (left). Concept of the nano-structure
of the object (middle). Shell model for reconstruction of the SAXS curve of the
nanoerythrosomes (right). (62) 68
Figure 32. The appearing minor phase transition in DPPC enriched nanoerythrosomes:
5×DPPC - blue, 10×DPPC – green –, values scaled up twenty times compared to a
typical DPPC/water system. (62) 69
Figure 33. The effect of additional DPPC on the structure of nanoerythrosomes. The
changes of lipid –CH2 (A) and protein – amide I (B) region (109) 71
97
Figure 34. Deconvolution of FTIR Amide I band: the increase of α helical structure in the
10×DPPC containing nanoerythrosomes (109) 72
Figure 35. Changes in lipid acyl chain from trans- to gauche conformers during phase
transition of DPPC enriched nanoerythrosomes and synthetic DPPC liposomes (62)
73
Figure 36. The decreasing elasticity (which is roughly proportional with the magnitude
of LD signal) of nanoerythrosomes – measured by LD spectroscopy - shows
correlation with the formation of the surface scaffolding in 10×DPPC containing
vesicles. (109) 74
Figure 37. FF-TEM images of separated EMPs - UCF supernatant (A), EMPs mixed with
10×DPPC (B,C) and the lipid enriched EMPs after a heating cycle (D,E) (109) 75
Figure 38. The morphology of nanoerythrosomes at different temperatures during a heat
cycle: 25°C (A), 50°C (B) and at the end of the heat cycle – 25°C (C) (109) 77
Figure 39. Temperature induced changes in the lipid (CH2) and protein (Amide I) content
of the 10×DPPC enriched nanoerythrosomes: correlation between the characteristic
IR band shifts and morphological alterations. (109) 79
Figure 40. Particle (EMP) association onto the nanoerythrosomes surface as a result of
increased Ca2+ concentration (109) 80
Figure 41. The effect of 10 mM Ca2+ on the nanoerythrosomal proteins according to
thermotropic FTIR measurements – the average of three consecutive heating/cooling
cycles 81
Figure 42. Structural properties of small-scaled nanoerythrosomes due to LPC addition
(109) 84
Figure 43. Morphological (A,B) and structural (C) changes in DPPC enriched
nanoerythrosomes due to a low (0.5×) amount of LPC additive (109) 85
Figure 44. Summarization of the nanoerythrosome preparation process 89
List of tables
Table 1. Average protein concentration of Jurkat EV fractions measured by Bradford
protein assay ............................................................................................................ 42
Table 2. Spectroscopic protein:lipid ratios of Jurkat cell derived extracellular vesicles 46

98
Table 3. Spectroscopic protein:lipid ratios of red blood cell ghosts and extracellular
vesicles ..................................................................................................................... 49
Table 4. Size distribution of sonicated ghost and its ultracentrifuge-separated fractions
.................................................................................................................................. 56
Table 5. Spectroscopic P/L ratios of ghost, sonicated ghost and its UCF fractions........ 59
Table 6. α-helix/β-sheet ratios of ghost suspension and its UCF fractions calculated from
ATR-FTIR spectra. In the UCF supernatant practically only α-helical structures
could be observed. ................................................................................................... 59
Table 7. Size distribution of sonicated ghosts prior and after (5× and 10×) DPPC addition
.................................................................................................................................. 63
Table 8. Phase transition temperature- (T) and change in enthalpy (ΔH) values of
nanoerythrosomes containing 5×DPPC and 10×DPPC additives and DPPC
liposomes ................................................................................................................. 70
Table 9. Size distribution of LPC containing nanoerythrosomes and reference LPC
micelles .................................................................................................................... 83

99
References
1. Vesicular Systems: An Overview. S. S. Biju, S. Talegaonkar, P. R. Mishra, R. K.
Khar. 2006, Indian J. Pharm. Sci., Vol. 68 (2), pp. 141-153.
2. PROPERTIES AND USES OF LIPID VESICLES: AN OVERVIEW. Bangham, A. D.
1978, Annals of the New York Academy of Sciences, Vol. 308, pp. 2-7.
3. Lipid Self-Assemblies and Nanostructured Emulsions for Cosmetic Formulations.
Kulkarni, C. V. 2016, Cosmetics, Vol. 37(3).
4. THEORY OF SELF-ASSEMBLY OF LIPID BILAYERS AND VESICLES. J. N.
Israelachvili, D. J. Mitchell, B. W. Ninham. 1977, Biochimica et Biophysica Acta, Vol.
470, pp. 185-201.
5. Lyotropic Mesomorphism in Lipid-Water Systems. Lawrence, A. S. C. 1969,
Molecular Crystals and Liquid Crystals, Vol. 7, pp. 1-57.
6. Stability of Lyotropic Phases with Curved Interfaces. Gruner, S. M. 1989, J. Phys.
Chem., Vol. 93, pp. 7562-7570.
7. Membrane fusion: Lipid vesicles as a model system. J. Wilschut, D. Hoekstra. 1986,
Chemistry and Physics of Lipids, Vol. 40, pp. 145-166.
8. The mechanism of vesicle formation. Lasic, D. D. 1988, Biochem J., Vol. 256(1), pp.
1–11.
9. Differential scanning calorimetry and X-ray diffraction studies of the specificity of the
interaction of antimicrobial peptides with membrane-mimetic systems. K. Lohner, E. J.
Prenner. 1999, BBA Biomembranes, Vol. 1462, pp. 141-156.
10. Phosphoinositide-Containing Polymerized Liposomes: Stable Membrane-Mimetic
Vesicles for Protein−Lipid Binding Analysis. C. G. Ferguson, R. D. James, C. S.
Bigman, D. A. Shepard, Y. Abdiche, P. S. Katsamba, D. G. Myszka, G. D. Prestwich.
2005, Bioconjugate Chem., Vol. 16(6), pp. 1475-1483.
11. Optimizing Druggability through Liposomal Formulations: New Approaches to an
Old Concept. D. Bitounis, R. Fanciullino, A. Iliadis, J. Ciccolini. 2012, ISRN
Pharmaceutics, pp. 1-12.
12. Liposome: classification, preparation, and applications. Akbarzadeh, A., Rezaei-
Sadabady, R., Davaran, S. et al. 2013, Nanoscale Res Lett, pp. 1-9.
13. A REVIEW ON LIPOSOME. Mansoori M. A., Agrawal S., Jawade S., Khan M. I.
2012, IJARPB, Vol. 2(4), pp. 453-464.
14. Liposome preparation and size characterization. Woodle, M. C., Papahadjopoulos,
D. 1989, Biomembranes Part R, Vol. 9, pp. 193–217.

100
15. The Fluid—Mosaic Model of Membrane Structure: Still relevant to understanding the
structure, function and dynamics of biological membranes after more than 40 years.
Nicolson, G. L. 2014, BBA Biomembranes, Vol. 1838(6), pp. 1451-1466.
16. Lipid polymorphism and the functional roles of lipids in biological membranes.
Cullis, P. R., De Kruijff, B. 1979, (BBA) - Reviews on Biomembranes, Vol. 559(4), pp.
399–420.
17. Modulation of membrane function by cholesterol. Yeagle, P. L. 1991, Biochimie,
Vol. 73(10), pp. 1303–1310.
18. Liposome-targeted delivery for highly potent drugs. H. Bardania, S. Tarvirdipour,
F. Dorkoosh. 2017, Artificial Cells, Nanomedicine, and Biotechnology, Vol. 45(8), pp.
1478-1489.
19. Surface Engineering of Liposomes for Stealth Behavior. O. K. Nag, V. Awasthi.
2013, Pharmaceutics, Vol. 5(4), pp. 542-569.
20. Surface-modified liposomes: assessment and characterization for increased stability
and prolonged blood circulation. Woodle, M. C. 1993, Chemistry and Physics of Lipids,
Vols. 64(1-3), pp. 249–262.
21. Using solution x-ray scattering to determine the high-resolution structure and. Y.
Schilt, T. Berman, X. Wei, Y. Barenholz, U. Raviv. 2015, BBA - General Subjects,
Vol. 1860(1), pp. 108-119.
22. Biogenesis, Secretion, and Intercellular Interactions of Exosomes and Other
Extracellular Vesicles. Colombo, M., Raposo, G., & Théry, C. 2014, Annual Review
of Cell and Developmental Biology, Vol. 30(1), pp. 255–289.
23. Biogenesis of extracellular vesicles (EV): exosomes, microvesicles, retrovirus-like
vesicles, and apoptotic bodies. J. C. Akers, D. Gonda, R. Kim, B. S. Carter, C. C.
Chen. 2013, Journal of Neuro-Oncology, Vol. 113(1), pp. 1–11.
24. Biological properties of extracellular vesicles and their physiological functions. M.
Yáñez-Mó, P. R.-M. Siljander et al. 2015, Journal of Extracellular Vesicles, Vol. 4.
25. Classification, Functions, and Clinical Relevance of Extracellular Vesicles. Van der
Pol, E., Boing, A. N., Harrison, P., Sturk, A., & Nieuwland, R. 2012, Pharmacological
Reviews, Vol. 64(3), pp. 676–705.
26. Extracellular Vesicles: Composition, Biological Relevance, and Methods of Study.
M. P. Zaborowski, L. Balaj, X. O. Breakefield, C. P. Lai. 2015, BioScience, Vol. 65(8),
pp. 783–797.
27. MicroRNA and mRNA cargo of extracellular vesicles from porcine adipose tissue-
derived mesenchymal stem cells. Eirin, A., Riester, S. M., Zhu, X.-Y., Tang, H., Evans,
J. M., O’Brien, D., Lerman, L. O. 2014, Gene, Vol. 551(1), pp. 55–64.
28. Introduction to Extracellular Vesicles: Biogenesis, RNA Cargo Selection, Content,
Release, and Uptake. Abels, E.R. & Breakefield, X.O. 2016, Cell Mol Neurobiol, Vol.
36, pp. 301–312.

101
29. Proteomic profiling of NCI-60 extracellular vesicles uncovers common protein cargo
and cancer type-specific biomarkers. S. N. Hurwitz, M. A. Rider, J. L. Bundy, X. Liu,
R. K. Singh, D. G. Meckes, Jr. 2016, Oncotarget, Vol. 7(52), pp. 86999–87015.
30. Mass spectrometry of extracellular vesicles. G. Pocsfalvi, C. Stanly, A. Vilasi, I.
Fiume, G. Capasso, L. Turiák, E. I. Buzas, K. Vékey. 2016, Mass Spectrometry
Reviews, Vol. 35, pp. 3–21.
31. Diagnostic and Prognostic Potential of Extracellular Vesicles in Peripheral Blood.
Revenfeld, A. L. S., et al. 2014, Clinical Therapeutics, Vol. 36(6), pp. 830-846.
32. The origin, function, and diagnostic potential of RNA within extracellular vesicles
present in human biological fluids. D. D. Taylor, C. G-Taylor. 2013, Front. Genet., Vol.
142(4).
33. Extracellular vesicles: biology and emerging therapeutic opportunities. EL
Andaloussi, S., Mäger, I., Breakefield, X. O., & Wood, M. J. A. 2013, Nature Reviews
Drug Discovery, Vol. 12(5), pp. 347–357.
34. Extracellular vesicles: emerging targets for cancer therapy. Vader, P., Breakefield,
X. O., & Wood, M. J. A. 2014, Trends in Molecular Medicine, Vol. 20(7), pp. 385–393.
35. Extracellular vesicle isolation and characterization: toward clinical application. R.
Xu, D. W. Greening, H.-J. Zhu, N. Takahashi, R. J. Simpson. 2016, J Clin Invest.,
Vol. 126(4), pp. 1152-1162.
36. Distinct RNA profiles in subpopulations of extracellular vesicles: apoptotic bodies,
microvesicles and exosomes. R. Crescitelli, C. Lässer, T. G. Szabó, A. Kittel, M. Eldh,
I. Dianzani, E. I. Buzás, J. Lötvall. 2013, Journal of Extracellular Vesicles, Vol. 2(1).
37. Horizontal transfer of oncogenes by uptake of apoptotic bodies. Bergsmedh, A.,
Szeles, A., Henriksson, M., Bratt, A., Folkman, M. J., Spetz, A.-L., & Holmgren, L.
2001, Proceedings of the National Academy of Sciences, Vol. 98(11), pp. 6407–6411.
38. Apoptosis: A Review of Programmed Cell Death. Elmore, S. 2007, Toxicologic
Pathology, Vol. 35, pp. 495–516.
39. Frequency of apoptotic bodies positively correlates with Gleason grade in prostate
cancer. Aihara, M., Truong, L. D., Dunn, J. K., Wheeler, T. M., Scardino, P. T.,
Thompson, T. C. 1994, Human Pathology, Vol. 25(8), pp. 797–801.
40. Shedding microvesicles: artefacts no more. Cocucci, E., Racchetti, G., & Meldolesi,
J. 2009, Trends in Cell Biology, Vol. 19(2), pp. 43–51.
41. Tumor-derived microvesicles: shedding light on novel microenvironment modulators
and prospective cancer biomarkers. D’Souza-Schorey, C., & Clancy, J. W. 2012, Genes
& Development, Vol. 26(12), pp. 1287–1299.
42. The biology and function of exosomes in cancer. Kalluri, R. 2016, J Clin Invest., Vol.
126(4), pp. 1208-1215.

102
43. Exosomes: From biogenesis and secretion to biological function. Keller, S.,
Sanderson, M. P., Stoeck, A., Altevogt, P. 2006, Immunology Letters, Vol. 107(2), pp.
102–108.
44. Exosomes in Cancer Diagnostics. Y. H. Soung, S. Ford, V. Zhang, J. Chung. 2017,
Cancers, Vol. 9(1).
45. The application of exosomes as a nanoscale cancer vaccine. A. Tan, H. De La Peña,
A. M Seifalian. 2010, Int J Nanomedicine, Vol. 5, pp. 889–900.
46. Extracellular vesicles as drug delivery systems: Lessons from the liposome field. Van
der Meel, R., Fens, M. H. A. M., Vader, P., van Solinge, W. W., Eniola-Adefeso, O.,
& Schiffelers, R. M. 2014, Journal of Controlled Release, Vol. 195, pp. 72–85.
47. Standardization of sample collection, isolation and analysis methods in extracellular
vesicle research. K. W. Witwer, E. I. Buzás, L. T. Bemis, A. Bora, C. Lässer, J.
Lötvall, E. N. Nolte-‘t Hoen, M. G. Piper, S. Sivaraman, J. Skog, C. Théry, M. H.
Wauben, F. Hochberg. 2013., Journal of Extracellular Vesicles, Vol. 2(1).
48. Current methods for the isolation of extracellular vesicles. Momen-Heravi, F.,
Balaj, L., Alian, S., Mantel, P.-Y., Halleck, A. E., Trachtenberg, A. J., Soria, C. E.,
Oquin, S., Bonebreak, C. M., Kuo, W. P. 2013, Biological Chemistry, Vol. 394(10).
49. Techniques used for the isolation and characterization of extracellular vesicles:
results of a worldwide survey. C. Gardiner, D. Di Vizio, S. Sahoo, C. Théry, K. W.
Witwer, M. Wauben, A. F. Hill. 2016, Journal of Extracellular Vesicles, Vol. 5(1).
50. Analysis of exosome purification methods using a model liposome system and tunable-
resistive pulse sensing. R. E. Lane, D. Korbie, W. Anderson, R. Vaidyanathan, M.
Trau. 2015, Scientific Reports, Vol. 5.
51. Towards traceable size determination of extracellular vesicles. Z. Varga, Y. Yuana,
A. E. Grootemaat, E. van der Pol, C. Gollwitzer, M. Krumrey, R. Nieuwland. 2014,
Journal of Extracellular vesicles, Vol. 3(1).
52. Mass-Spectrometry-Based Molecular Characterization of Extracellular Vesicles:
Lipidomics and Proteomics. Kreimer, S., Belov, A. M., Ghiran, I., Murthy, S. K.,
Frank, D. A., Ivanov, A. R. 2015, Journal of Proteome Research, Vol. 14(6), pp. 2367–
2384.
53. Isolation and characterization of urinary extracellular vesicles: implications for
biomarker discovery. M. L. Merchant, I. M. Rood, J. K. J. Deegens, J. B. Klein. 2017,
Nature Reviews Nephrology, Vol. 13, pp. 731–749.
54. Cancer immunotherapy: Nanodelivery approaches for immune cell targeting and
tracking. J. Conniot, J. M. Silva, J. G. Fernandes, L. C. Silva, R. Gaspar, S.
Brocchini, H. F. Florindo, T. S. Barata. 2014 , Frontiers in Chemistry, Vol. 105(2).
55. Pharmacokinetics of long-circulating liposomes. Allen, T. M., Hansen, C. B., & de
Menezes, D. E. L. 1995, Advanced Drug Delivery Reviews, Vols. 16(2-3), pp. 267–284.
56. Surface modification of liposomes for selective cell targeting in cardiovascular drug
delivery. B. J. Lestini, S. M. Sagnella, Z. Xu, M. S. Shive, N. J. Richter, J.
103
Jayaseharan, A. J. Case, K. Kottke-Marchant, J. M. Anderson, R. E. Marchant.
2002, Journal of Controlled Release, Vol. 78, pp. 235–247.
57. Animal Models of Complement-Mediated Hypersensitivity Reactions to Liposomes
and Other Lipid-Based Nanoparticles. J. Szebeni, C. R. Alving, L. Rosivall, R. Bünger,
L. Baranyi, P. Bedöcs, M. Tóth, Y. Barenholz. 2007, Journal of Liposome Research,
Vol. 17, pp. 107–117.
58. Membrane fusion: from liposomes to biological membranes. J. Wilschut, D.
Hoekstra. 1984, Trends in Biochemical Sciences, Vol. 9(11), pp. 479-483.
59. Excitation energy transfer between Light-harvesting complex II and Photosystem I in
reconstituted membranes. P. Akhtar, M. Lingvay, T. Kiss, R. Deák, A. Bóta, B. Ughy,
G. Garab, P. H. Lambrev. 2016, BBA Bioenergetics, Vol. 1857 , pp. 462–472.
60. Production of membrane vesicles by extrusion: size distribution, enzyme activity and
orientation of plasma membrane and chloroplast inner-envelope membrane vesicles. R.
Shingles, R.E. McCarty,. 1995, Anal. Biochem., Vol. 229 , pp. 92–98.
61. Bioinspired Exosome-Mimetic Nanovesicles for Targeted Delivery of
Chemotherapeutics to Malignant Tumors. S. C. Jang, O. Y. Kim, C. M. Yoon, D.-S.
Choi, T.-Y. Roh, J. Park, J. Nilsson, J. Lötvall, Y.-K. Kim, Y. S. Gho. 2013, ACS
Nano, Vol. 7(9), pp. 7698-7710.
62. Physicochemical characterization of artificial nanoerythrosomes derived from
erythrocyte ghost membranes. R. Deák, J. Mihály, I. Cs. Szigyártó, A. Wacha, G.
Lelkes, A. Bóta. 2015, Colloids and Surfaces B: Biointerfaces , Vol. 135 , pp. 225–234.
63. Shape and Biomechanical Characteristics of Human Red Blood Cells in Health and
Disease. M. Diez-Silva, M. Dao, J. Han, C. T. Lim, S. Suresh. 2010, MRS Bulletin,
Vol. 35(5), pp. 382-388.
64. A Comprehensive Review of Our Current Understanding of Red Blood Cell (RBC)
Glycoproteins. Aoki, T. 2017, Membranes, Vol. 7(4).
65. An overview about erythrocyte membrane. S. de Oliveira, C. Saldanha. 2010,
Clinical Hemorheology and Microcirculation , Vol. 44 , pp. 63–74.
66. Flow Characteristics of Human Erythrocytes through Polycarbonate Sieves. M. I.
Gregersen, C. A. Bryant, W. E. Hammerle, S. Usami, S. Chien. 1967, Science, Vol.
157(3790) , pp. 825-827.
67. The Molecular Structure of Human Red Blood Cell Membranes from Highly Oriented,
Solid Supported Multi-Lamellar Membranes. S. Himbert, R. J. Alsop, M. Rose, L.
Hertz, A. Dhaliwal, J. M. Moran-Mirabal, C. P. Verschoor, D. M. E. Bowdish, L.
Kaestner, C. Wagner,2 M. C. Rheinstädter. 2017, Sci Rep., Vol. 7.
68. Phospholipid asymmetry in human erythrocyte ghosts. P. Williamson, L. Algarin, J.
Bateman, H.‐R. Choe, R. A. Schlegel. 1985, Journal of cellular physiology, Vol. 123(2),
pp. 209-214.
69. Asymmetric Lipid Membranes: Towards More Realistic Model Systems. D.
Marquardt, B. Geier, G. Pabst. 2015, Membranes, Vol. 5(2), pp. 180-196.

104
70. The preparation and chemical characteristics of hemoglobin-free ghosts of human
erythrocytes. J. T.Dodge, C. Mitchell, D. J. Hanahan. 1963, Archives of Biochemistry
and Biophysics, Vol. 100(1), pp. 119-130.
71. Intense, reversible aggregation of intramembrane particles in non-haemolyzed
human erythrocytes A freeze-fracture study. G. Lelkes, G. Lelkes, K. Szinyei Merse, S.
R. Hollán. 1983, BBA Biomembranes, Vol. 732(1), pp. 48-57.
72. Nanoerythrosome, a new derivative of erythrocyte ghost: Preparation and
antineoplastic potential as drug carrier for daunorubicin. A. Lejeune, M. Moorjani, C.
Gicquaud, J. Lacroix, P. Poyet, R. Gaudreault. 1994, Anticancer research, Vol. 14, pp.
915-920.
73. Erythrocytes in nanomedicine: an optimal blend of natural and synthetic materials.
Zhang, H. 2016, Biomater. Sci., Vol. 4, pp. 1024-1031.
74. Erythrocyte membrane-cloaked polymeric nanoparticles for controlled drug loading
and release. S. Aryal, C.-M. J. Hu, R. H. Fang, D. Dehaini, C. Carpenter, D.-E.
Zhang, L. Zhang. 2013, Nanomedicine, Vol. 8(8), pp. 1271–1280.
75. How cryo-EM is revolutionizing structural biology. X-C. Bai, G. McMullan, S. H.
W. Scheres. 2015, Trends in Biochemical Sciences, Vol. 40(1), pp. 49-57.
76. Freeze-fracture electron microscopy. Severs, N. J. 2007, Nature Protocols, Vol. 2,
pp. 547–576.
77. Influence of temperature, anions and size distribution on the zeta potential of DMPC,
DPPC and DMPE lipid vesicles. M. A. Morini, M. B. Sierra, V. I. Pedroni, L. M.
Alarcon, G. A. Appignanesi, E. A. Disalvo. 2015 , Colloids and Surfaces B:
Biointerfaces, Vol. 131, pp. 54-58.
78. Making Sense of Brownian Motion: Colloid Characterization by Dynamic Light
Scattering. P. A. Hassan, S. Rana, G. Verma. 2015, Langmuir, Vol. 31, pp. 3-12.
79. The aggregation kinetics of an electrostatically stabilized dipalmitoyl
phosphatidylcholine vesicle system. B. L. Gamon, J. W. Virden, J. C. Berg. 1989,
Journal of Colloid and Interface Science, Vol. 132(1), pp. 125-138.
80. Fast characterisation of cell-derived extracellular vesicles by nanoparticles tracking
analysis, cryo-electron microscopy, and Raman tweezers microspectroscopy. I.
Tatischeff, E. Larquet, J. M. Falcón-Pérez, P-Y. Turpin, S. G. Kruglik. 2012, Journal
of Extracellular Vesicles, Vol. 1(1).
81. J. Celis, N. Carter, K. Simons, J. Small, T. Hunter, D. Shotton. Cell Biology - A
laboratory handbook. s.l. : Academic Press, 2005.
82. Developmental changes in P-face and E-face particle densities of Xenopus cardiac
muscle plasma membrane. L. Kordylewski, T. Karrison, E. Page. 1986, Tissue and
Cell, Vol. 18(5), pp. 793-801.
83. Topography of Lipid Droplet-Associated Proteins: Insights from Freeze-Fracture
Replica Immunogold Labeling. H. Robenek, I. Buers, M. J. Robenek, O. Hofnagel, A.
Ruebel, D. Troyer, N. J. Severs. 2011, Journal of Lipids, pp. 1-10.

105
84. L. A. Feigin, D .I. Svergun. Structure Analysis by Small-Angle X-Ray and Neutron
Scattering. New York : Plenum Press, 1987.
85. O. Glatter, O. Kratky. Small angle x-ray scattering. New York : Academic Press,
1982.
86. A. Guinier, G. Fournet. Small-angle scattering of X-rays. New York : John Wiley
& Sons, Inc., 1955.
87. E. E. Lattman, T. D. Grant, E. H. Snell. Biological Small Angle Scattering. Oxford :
Oxford University Press, 2018.
88. Small angle X-ray scattering: possibilities and limitations in characterization of
vesicles. Bouwstraa, J. A., et al. 1993, Chemistry and Physics of Lipids, Vols. 64(1-3),
pp. 83-98.
89. Characterization of the PEG layer of sterically stabilized liposomes: a SAXS study.
Z. Varga, A. Wacha, U. Vainio, J. Gummel, A. Bóta. 2012, Chemistry and Physics of
Lipids, Vol. 165(4), pp. 387-392.
90. Effect of 2,4-dichlorophenol on DPPC/water liposomes studied by X-ray and freeze-
fracture electron microscopy. Á. Csiszár, E. Klumpp, A. Bóta, K. Szegedi. 2003,
Chemistry and Physics of Lipids, Vol. 126(2), pp. 155-166.
91. Small-angle scattering gives direct structural information about a membrane protein
inside a lipid environment. S. A. R. Kynde, N. Skar-Gislinge, M. C. Pedersen, S. R.
Midtgaard, J. B. Simonsen, R. Schweins, K. Mortensen, L. Arleth. 2014, Acta Cryst.,
Vol. 70, pp. 371-383.
92. Role of oligo(malic acid) on the formation of unilamellar vesicles. A. Bóta, A.
Wacha, Z. Varga, I. Cs. Szigyártó, S. Kristyán, A. Lőrincz, P. Szabó, M. Kálmán, L.
Naszályi-Nagy, J. Mihály. 2018, Journal of Colloid and Interface Science, Vol. 532, pp.
782-789.
93. A. A. Christy, Y. Ozaki, V. G. Gregoriou. Theory of infrared spectroscopy.
Comprehensive Analytical Chemistry. 2001, pp. 19–40.
94. Infrared spectroscopy as a new tool for studying single living cells: Is there a niche?
S. Sabbatini, C. Conti, G. Orilisi, E. Giorgini. 2017, Biomedical Spectroscopy and
Imaging, Vol. 6, pp. 85–99.
95. Using Fourier transform IR spectroscopy to analyze biological materials. M. J.
Baker et al. 2014, Nature Protocols, Vol. 9, pp. 1771–1791.
96. Infrared spectroscopy of proteins. Barth, A. 2007, BBA Bioenergetics, Vol. 1767
(9), pp. 1073-1101.
97. Spectroscopy with Polarized Light. Dörr, F. 1966, Angew. Chem. internat. Edit. ,
Vol. 5.
98. Chromophore Orientation in Liposome Membranes Probed with Flow Dichroism. M.
Ardhammar, N. Mikati, B. Nordén. 1998, J. Am. Chem. Soc., Vol. 120(38), pp. 9957-
9958.

106
99. Flow Alignment of Extracellular Vesicles: Structure and Orientation of Membrane-
Associated Bio-macromolecules Studied with Polarized Light. I. Cs. Szigyártó, R. Deák,
J. Mihály, S. Rocha, F. Zsila, Z. Varga, T. Beke-Somfai. 2018 , Chembiochem, Vol.
19(6), pp. 545-551.
100. Thin-Film Hydration Followed by Extrusion Method for Liposome Preparation.
Zhang, H. 2016, Liposomes, Vol. 1522, pp. 17-22.
101. Doxorubicin-induced apoptosis: Implications in cardiotoxicity. B. Kalyanaraman,
J. Joseph, S. Kalivendi, S. Wang, E. Konorev, S. Kotamraju. 2002, Molecular and
Cellular Biochemistry, Vol. 234(1), pp. 119–124.
102. Recent developments in the nomenclature, presence, isolation, detection and clinical
impact of extracellular vesicles. E. van der Pol, A. N. Böing, E. L. Gool, R. Nieuwland.
2016, Journal of Thrombosis and Haemostasis, Vol. 14, pp. 48–56.
103. Extracellular Vesicle Quantification and Characterization: Common Methods and
Emerging Approaches. T. A. Hartjes, S. Mytnyk, G. W. Jenster, V. van Steijn, M. E.
van Royen. Bioengineering , : s.n., 2019, Vol. 6 (7).
104. Characterization of extracellular vesicles by IR spectroscopy: Fast and simple
classification based on amide and CH stretching vibrations. J. Mihály, R. Deák, I. Cs.
Szigyártó, A. Bóta, T. Beke-Somfai, Z. Varga. 2017, BBA Biomembranes, Vol.
1859(3), pp. 459-466.
105. Membrane dynamics as seen by Fourier transform infrared spectroscopy in a
cyanobacterium, Synechocystis PCC 6803: The effects of lipid unsaturation and the
protein-to-lipid ratio. B. Szalontai, Y. Nishiyama, Z. Gombos, N. Murata. 2000, BBA
Biomembranes, Vols. 1509(1-2), pp. 409-419.
106. Red blood cell-derived microparticles: An overview. M. Westerman, J. B. Porter.
2016, Blood Cells, Molecules and Diseases , Vol. 59, pp. 134–139.
107. Fundamental Technical Elements of Freeze-fracture/Freeze-etch in Biological
Electron Microscopy. Carson, J. L. 2014, J. Vis. Exp., Vol. 91.
108. Feisty filaments: actin dynamics in the red blood cell membrane skeleton. D. S.
Gokhin, V. M. Fowler. 2016, Curr. Opin. Hematol., Vol. 23 (3), pp. 206-214.
109. Anatomy of the red cell membrane skeleton: unanswered questions. Lux, S. E. 2016,
Blood, Vol. 127(2), pp. 187-199.
110. Comparison of Extruded and Sonicated Vesicles for Planar Bilayer Self-Assembly.
N-J. Cho, L. Y. Hwang, J. J. R. Solandt, C. W. Frank. 2013, Materials, Vol. 6(8), pp.
3294-3308.
111. Nanoerythrosomes tailoring: Lipid induced protein scaffolding in ghost membrane
derived vesicles. R. Deák, J. Mihály, I. Cs. Szigyártó, T. Beke-Somfai, L. Turiák, L.
Drahos, A. Wacha, A. Bóta, Z. Varga. 2019, Materials Science and Engineering: C, p.
https://doi.org/10.1016/j.msec.2019.110428.

107
112. Proteoliposomes in nanobiotechnology. P. Ciancaglini, A. M. S. Simão, M.
Bolean, J. L. Millán, C. F. Rigos, J. S. Yoneda, M. C. Colhone, R. G. Stabeli. 2012,
Biophysical Reviews, Vol. 4(1), pp. 67–81.
113. Membrane lipids: where they are and how they behave. G. van Meer, D. R.
Voelker, G. W. Feigenson. 2008, Nat. Rev. Mol. Cell. Biol. , Vol. 9(2), pp. 112–124.
114. Maintenance of lipid asymmetry in red blood cells and ghosts: effect of divalent
cations and serum albumin on the transbilayer distribution of phosphatidylserine. J.
Connor, K. Gillum, A. J. Schroit. 1990, BBA Biomembranes, Vol. 1025, pp. 82-86.
115. Coupling between Lipid Shape and Membrane Curvature. I. R. Cooke, M. Deserno.
2006, Biophysical Journal, Vol. 91(2), pp. 487-495.
116. Curvature Effect on the Structure of Phospholipid Bilayers. N. Kučerka, J. Pencer,
J. N. Sachs, J. F. Nagle, J. Katsaras. 2007, Langmuir, Vol. 23(3), pp. 1292-1299.
117. Lipid phase transitions and phase diagrams II. Mixtures involving lipids. Lee, A. G.
1977, BBA Reviews on Biomembranes, Vols. 472(3-4), pp. 285-344.
118. Lipid bilayer and cytoskeletal interactions in a red blood cell. Z. Peng, X. Li, I. V.
Pivkin, M. Dao, G. E. Karniadakis, S. Suresh. 2013, PNAS, Vol. 10(33) , pp. 13356-
13361.
119. Phospholipid phase transitions in model and biological membranes as studied by
infrared spectroscopy. H. H. Mantsch, R. N. Mc Elhaney. 1991, Chemistry and Physics
of Lipids, Vols. 57(2–3), pp. 213-226.
120. Effects of divalent cations, temperature, osmotic pressure gradient, and vesicle
curvature on phosphatidylserine vesicle fusion. Ohki, S. 1984, J. Membrain Biol., Vol.
77 (3), pp. 265–275.
121. Membrane ultrastructural changes during calcium phosphate-induced fusion of
human erythrocyte ghosts. N. Zakai, R. G. Kulka, A. Loyter. 1977, PNAS, Vol. 74 (6),
pp. 2417-2421.
122. Intercalation of Bovine Serum Albumin Coated Gold Clusters Between Phospholipid
Bilayers: Temperature-Dependent Behavior of Lipid-AuQC@BSA Assemblies with Red
Emission and Superlattice Structure. B. Söptei, J. Mihály, J. Visy, A. Wacha, A. Bóta.
2014, J. Phys. Chem. B, Vol. 118 (14), pp. 3887-3892.
123. Effect of Calcium Ions on the Surface Charge and Aggregation of
Phosphatidylcholine Liposomes. M. Mosharraf, K. M. G. Taylor, D. Q. M. Craig.
1995, Journal of Drug Targeting, Vol. 2, pp. 541-545.
124. Bilayer balance and regulation of red cell shape changes. N. Mohandas, A. C.
Greenquist, S. B. Shohet. s.l. : 9 (3), 1978, Journal of Supramolecular Structure, pp.
453-458.
125. Membrane-perturbing effect of fatty acids and lysolipids. A. Arouri, O. G.
Mouritsen. 2013, Progress in Lipid Research, Vol. 52 , pp. 130–140.

108
126. Therapeutic biomaterials based on extracellular vesicles: classification of bio-
engineering and mimetic preparation routes. P. García-Manrique, M. Matos, G.
Gutiérrez, C. Pazos, M. C. Blanco-López. 2018, Journal of Extracellular Vesicles, Vol.
7(1).

109
ADATLAP
a doktori értekezés nyilvánosságra hozatalához*
I. A doktori értekezés adatai
A szerző neve: Deák Róbert
MTMT-azonosító: 10054534
A doktori értekezés címe és alcíme: Characterization and modification of cell membrane
derived vesicles
DOI-azonosító46: 10.15476/ELTE.2019.280
A doktori iskola neve: Hevesy György Kémia Doktori Iskola, ELTE
A doktori iskolán belüli doktori program neve: Szintetikus kémia, szerves és
biomolekuláris kémia
A témavezető neve és tudományos fokozata: Bóta Attila, PhD, DSc
A témavezető munkahelye: Természettudományi Kutatóközpont, Anyag és
Környezetkémiai Intézet, Biológiai Nanokémia Kutatócsoport
II. Nyilatkozatok
1. A doktori értekezés szerzőjeként
a) hozzájárulok, hogy a doktori fokozat megszerzését követően a doktori értekezésem és
a tézisek nyilvánosságra kerüljenek az ELTE Digitális Intézményi Tudástárban.
Felhatalmazom a Természettudományi kar Dékáni Hivatal Doktori, Habilitációs és
Nemzetközi Ügyek Csoportjának ügyintézőjét, hogy az értekezést és a téziseket feltöltse
az ELTE Digitális Intézményi Tudástárba, és ennek során kitöltse a feltöltéshez szükséges
nyilatkozatokat.
b) kérem, hogy a mellékelt kérelemben részletezett szabadalmi, illetőleg oltalmi
bejelentés közzétételéig a doktori értekezést ne bocsássák nyilvánosságra az Egyetemi
Könyvtárban és az ELTE Digitális Intézményi Tudástárban;
c) kérem, hogy a nemzetbiztonsági okból minősített adatot tartalmazó doktori értekezést
a minősítés (dátum)-ig tartó időtartama alatt ne bocsássák nyilvánosságra az Egyetemi
Könyvtárban és az ELTE Digitális Intézményi Tudástárban;
d) kérem, hogy a mű kiadására vonatkozó mellékelt kiadó szerződésre tekintettel a
doktori értekezést a könyv megjelenéséig ne bocsássák nyilvánosságra az Egyetemi
Könyvtárban, és az ELTE Digitális Intézményi Tudástárban csak a könyv bibliográfiai
adatait tegyék közzé. Ha a könyv a fokozatszerzést követőn egy évig nem jelenik meg,
hozzájárulok, hogy a doktori értekezésem és a tézisek nyilvánosságra kerüljenek az
Egyetemi Könyvtárban és az ELTE Digitális Intézményi Tudástárban.
2. A doktori értekezés szerzőjeként kijelentem, hogy
a) az ELTE Digitális Intézményi Tudástárba feltöltendő doktori értekezés és a tézisek
saját eredeti, önálló szellemi munkám és legjobb tudomásom szerint nem sértem vele
senki szerzői jogait;
b) a doktori értekezés és a tézisek nyomtatott változatai és az elektronikus adathordozón
benyújtott tartalmak (szöveg és ábrák) mindenben megegyeznek.

110
3. A doktori értekezés szerzőjeként hozzájárulok a doktori értekezés és a tézisek
szövegének plágiumkereső adatbázisba helyezéséhez és plágiumellenőrző vizsgálatok
lefuttatásához.
Kelt: 2019.12.08………………………
……………………………………
a doktori értekezés szerzőjének aláírása
*ELTE SZMSZ SZMR 12. sz. melléklet