Embed Size (px)
Citation preview
CHARACTERIZATION AND MODIFICATION OF OPTICAL PROPERTIES
OF GRAPHENE OXIDE AND REDUCED GRAPHENE OXIDE
by
MD. TANVIR HASAN
Bachelor of Science in Electrical and Electronic Engineering, September 2007
Chittagong University of Engineering and Technology
Chittagong, Bangladesh
Submitted to the Graduate Faculty of the
College of Science and Engineering
Texas Christian University
in partial fulfillment of the requirements
for the degree of
Master of Science
August 2018

ii
ACKNOWLEDGMENTS
I would like to express my earnest gratitude to my advisor Dr. Anton V. Naumov for his close
supervision, guidance, and support to accomplish this work. His motivation, continuous
encouragement, and excellent mentorship help me to overcome any crucial step related to research
projects. I am grateful to Dr. Yuri Strzhemechny for believing in me and making an exception by
evaluating my application on such short notice for the admission at TCU. Next, I am glad to thank
my committee members Dr. Yuri Strzhemechny, Dr. Zyzmunt (Karol) Gryczynski, and Dr. Hana
Dobrovolny for their valuable suggestions, remarks and critical comments to successfully write
this thesis. I am also thankful to all other faculty members, staff, and my fellow graduate students
of physics and astronomy department for offering assistance/advice if needed.
Last but not the least, I am extremely thankful to my parents, other relatives, friends back home
and my wife Sadia Afrin for their unending support to pursue my studies at TCU.
iii
TABLE OF CONTENTS
Acknowledgements ii
List of figures vi
List of tables x
List of abbreviations xi
Chapter-1 1
1.1 Motivation 1
1.2 Questions that will be answered by this study 2
1.3 Literature review 3
1.3.1 Graphene 3
1.3.2 Reduced Graphene Oxide 6
1.4 Introduction 8
Chapter-2 13
2.1 Methods 13
2.1.1 Sample Preparation 13
2.1.2 Characterization of GO samples 15
2.1.3 Optical measurements of GO samples 15
2.1.4 Semi-empirical PM3 calculations 16
2.2 Experimental results and discussions 17
2.2.1 Absorbance 17
2.2.2 Fluorescence 18
2.2.3 Calculation of Quantum Yield (QY) 29
iv
2.2.4 Fluorescence lifetime measurements 31
2.2.5 Detection of the chemical composition of RGO/GO via
FTIR spectroscopy 32
2.3 Structural Characterization/Morphological study 34
2.3.1 Characterization of ozone-treated GO with SEM and AFM 34
2.4 Hyperchem PM3 modeling 38
Chapter-3 41
3.1 Methods 41
3.1.1 Sample Preparation 41
3.1.2 Characterization of GO samples 42
3.1.3 Optical measurements of GO samples 42
3.2 Experimental results and discussions 43
3.2.1 Absorbance 43
3.2.2 Fluorescence 45
3.2.3 Detection of the chemical composition of Oz-GO via
FTIR spectroscopy 51
3.3 Structural Characterization/ Morphological study 53
3.3.1 Characterization of ozone-treated GO with TEM 53
3.4 Calculation of Quantum Yield (QY) 55
3.5 Semi-empirical PM3 modeling 56
v
Chapter 4 59
4.1 conclusion 59
4.2 Questions answered by this study 61
4.3 Future Works Directions 63
References 64
Vita
Abstract
vi
LIST OF FIGURES
Figure 1: Single-layer graphene sheet 4
Figure 2: Band structure of single graphene layer showing 𝜎 bands with solid red lines and π bands
with dotted blue lines. In the x axis G represents the center of a brillouin zone; K and M represents
the middle of an edge joining two rectangular faces and center of a rectangular face of the brillouin
zone, respectively 5
Figure 3: Electronic dispersion in the honeycomb graphene lattice 6
Figure 4: Single layer reduced graphene oxide (RGO) sheet. The red marked regions represent
few defects on RGO 7
Figure 5: (a) A fragment of single layer graphene oxide with hidroxyl, keto, aldehyde and carboxyl
groups surrounding the island of graphitic carbon (b) Fluorescence emission of graphene oxide (c)
Electrostatic potential region surrounding COO- group on GO 9
Figure 6: A schematic of Ozone Treatment setup 14
Figure 7. (a) Pictures of the ozone-oxidized HRGO samples with respective oxidization time in
minutes. (b) Absorption spectra of 0 to 45 min ozone-treated HRGO 17
Figure 8. Fluorescence measurements of 0 to 45 min ozone-treated HRGO in (a) 10x10 mm
cuvette. (b) 3x3 mm cuvette. The arrow shows the increasing trend 20
Figure 9. Fluorescence measurements of 0 to 50 min ozone-treated CRGO in (a) 10x10 mm
cuvette (b) in 1x10 mm cuvette 21
vii
Figure 10. Fluorescence spectra of HRGO ozone-oxidized for 0 to 40 mins inside the spectrometer
measured every 2 minutes 22
Figure 11. Fluorescence spectra of (a) HRGO post 55 min ozone treatment measured for up to 15
h (b) CRGO samples ozone treated for 50 min measured for up to 1 to 13 days. Fluorescence
measurement of 2 ozone-oxidized CRGO samples with respect to time (c) 20 minutes, (d) 30
minutes 24
Figure 12. (a) Fluorescence and (b) absorbance spectra of GO with pH 2.3 for the periods of 0 to
14 days under argon atmosphere. (c) Fluorescence and (d) absorbance spectra of GO with pH 2.3
measured up to 0 to 14 days under ambient conditions 26
Figure 13. (a) Fluorescence and (b) absorbance spectra of GO aging with pH 8.5 for the periods
of 0 to 14 days under argon atmosphere. (c) Fluorescence and (d) absorbance spectra of GO aging
with pH 8.5 measured up to 0 to 14 days under ambient conditions 27
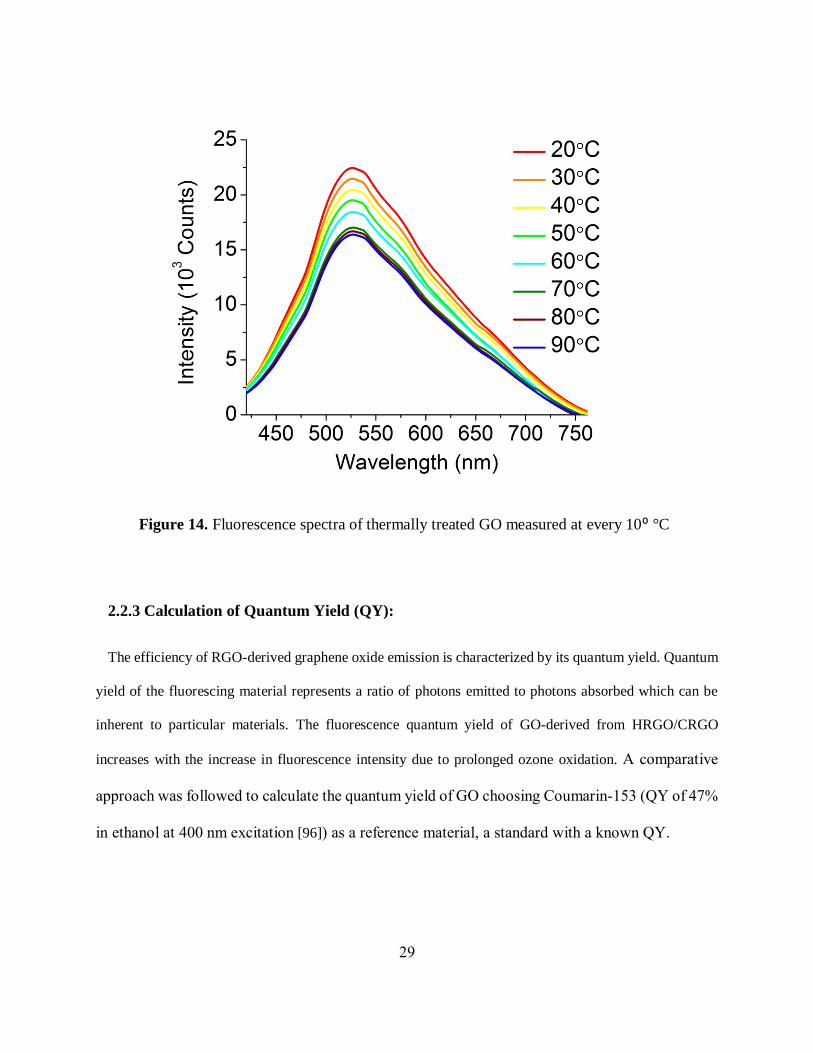
Figure 14. Fluorescence spectra of thermally treated GO measured at every 10 °C 29
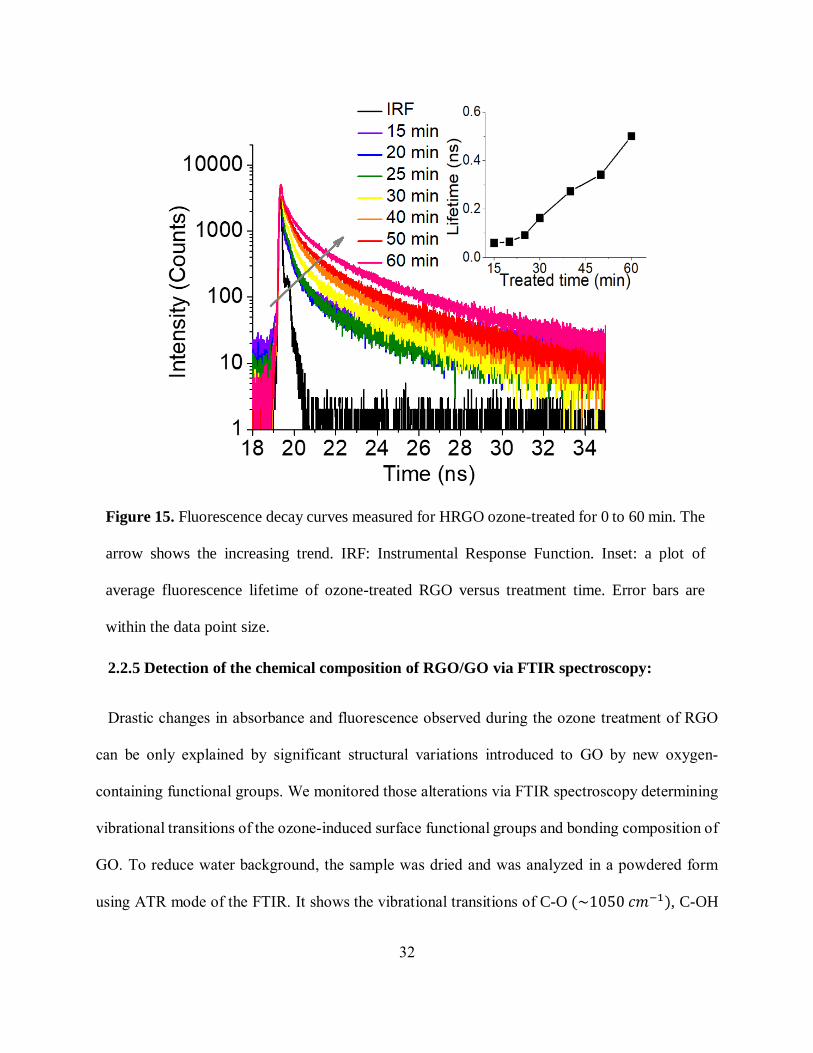
Figure 15. Fluorescence decay curves measured for HRGO ozone-treated for 0 to 60 min. The
arrow shows the increasing trend. IRF: Instrumental Response Function. Inset: a plot of average
fluorescence lifetime of ozone-treated RGO versus treatment time. Error bars are within the data
point size 32
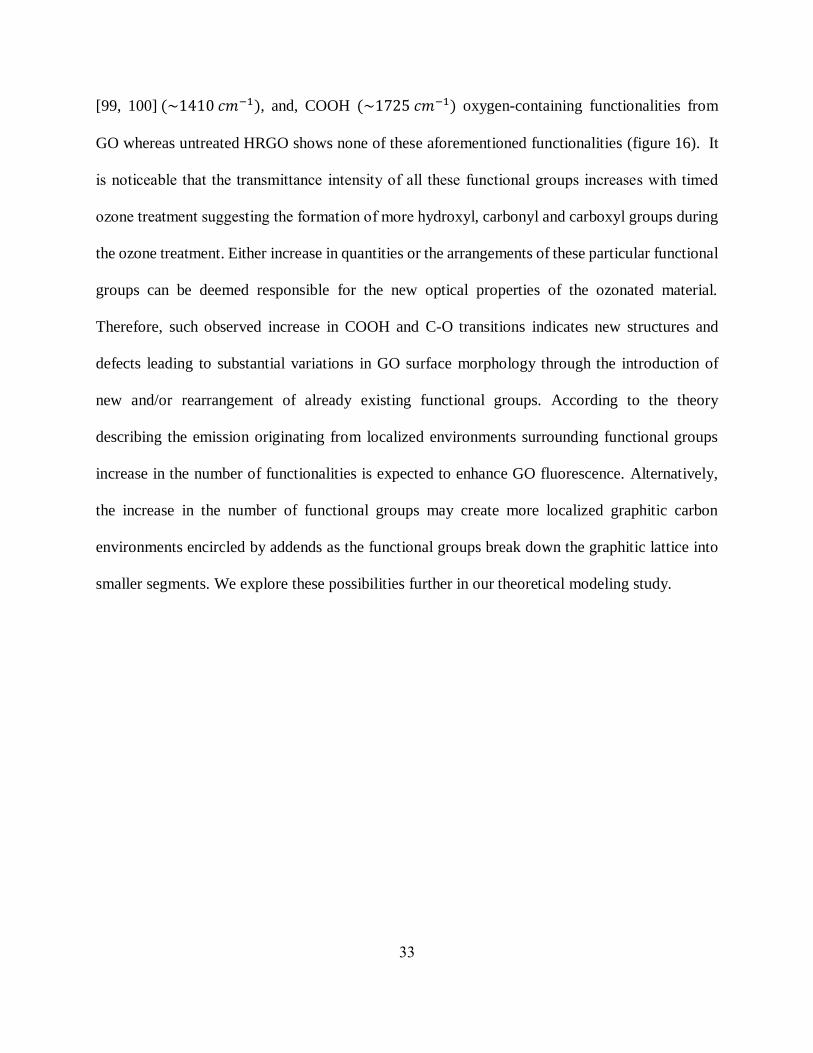
Figure 16. The IR spectra of untreated and ozone-treated HRGO. Main transitions include C-O
stretch (~1050 𝑐𝑚−1), C-OH bend/-O-H deformation (~1410 𝑐𝑚−1), and C=O stretch in COOH
group (~1725 𝑐𝑚−1) 34
viii
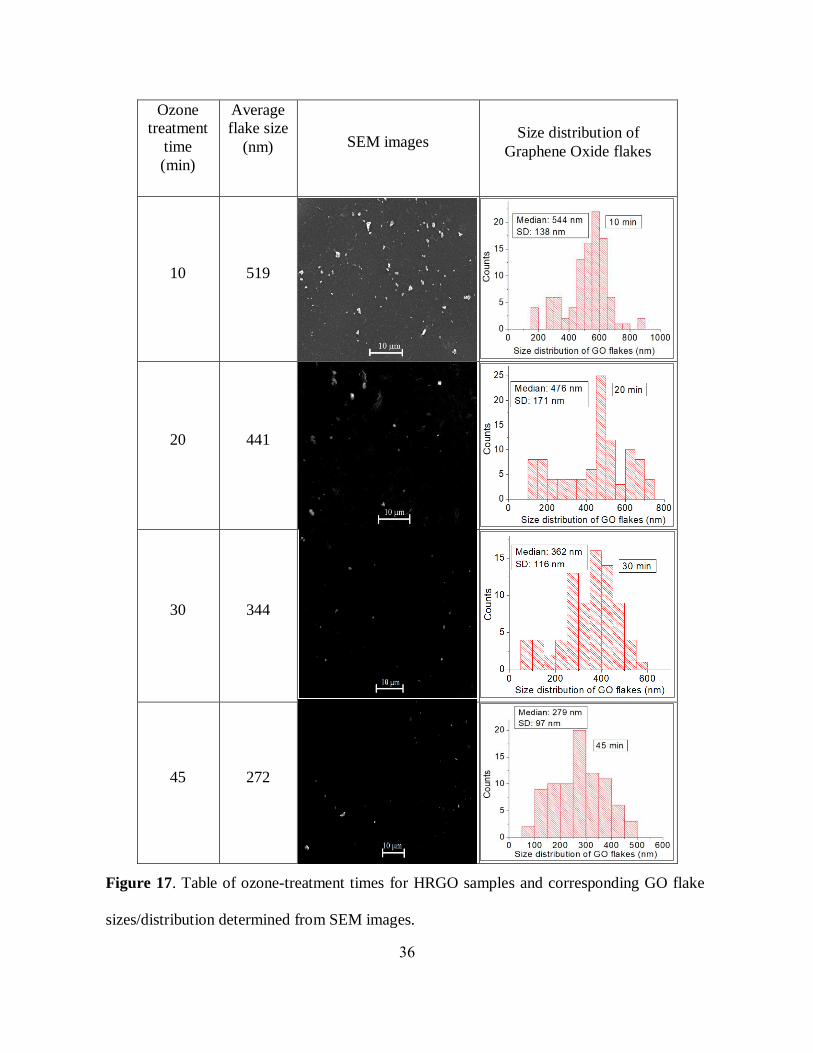
Figure 17. Table of ozone-treatment times for HRGO samples and corresponding GO flake
sizes/distribution determined from SEM images 36
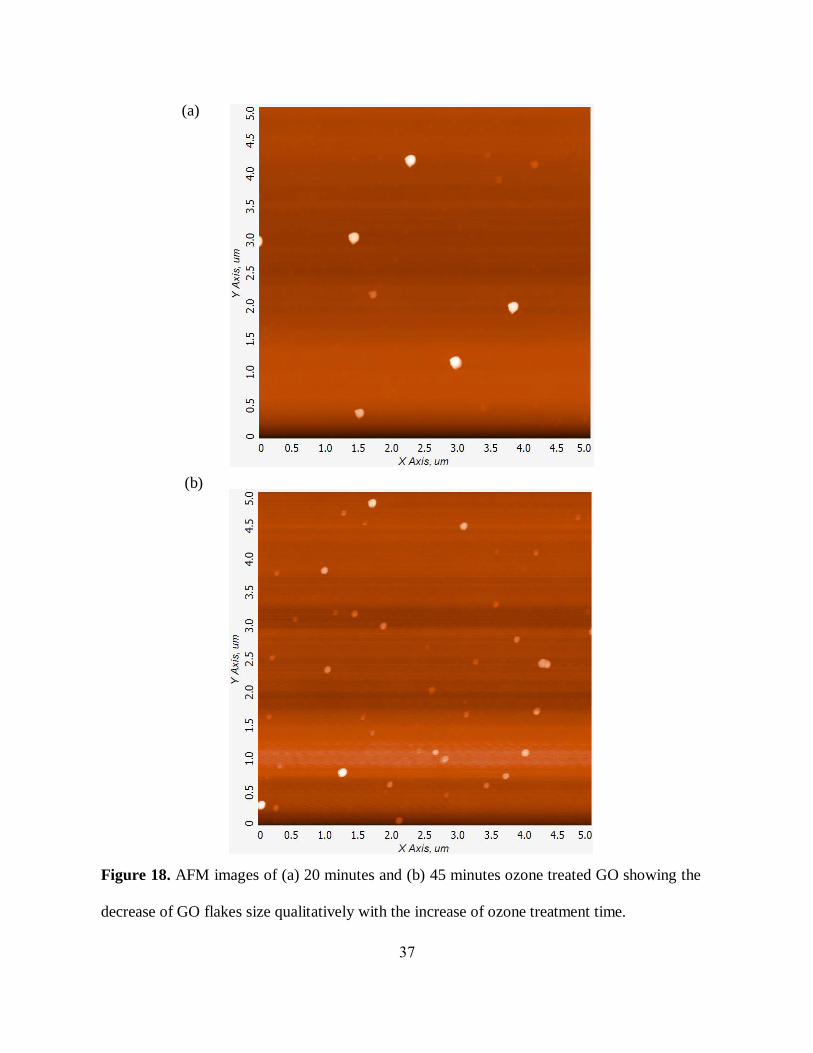
Figure 18. AFM images of (a) 20 minutes and (b) 45 minutes ozone treated GO showing the
decrease of GO flakes size qualitatively with the increase of ozone treatment time 37
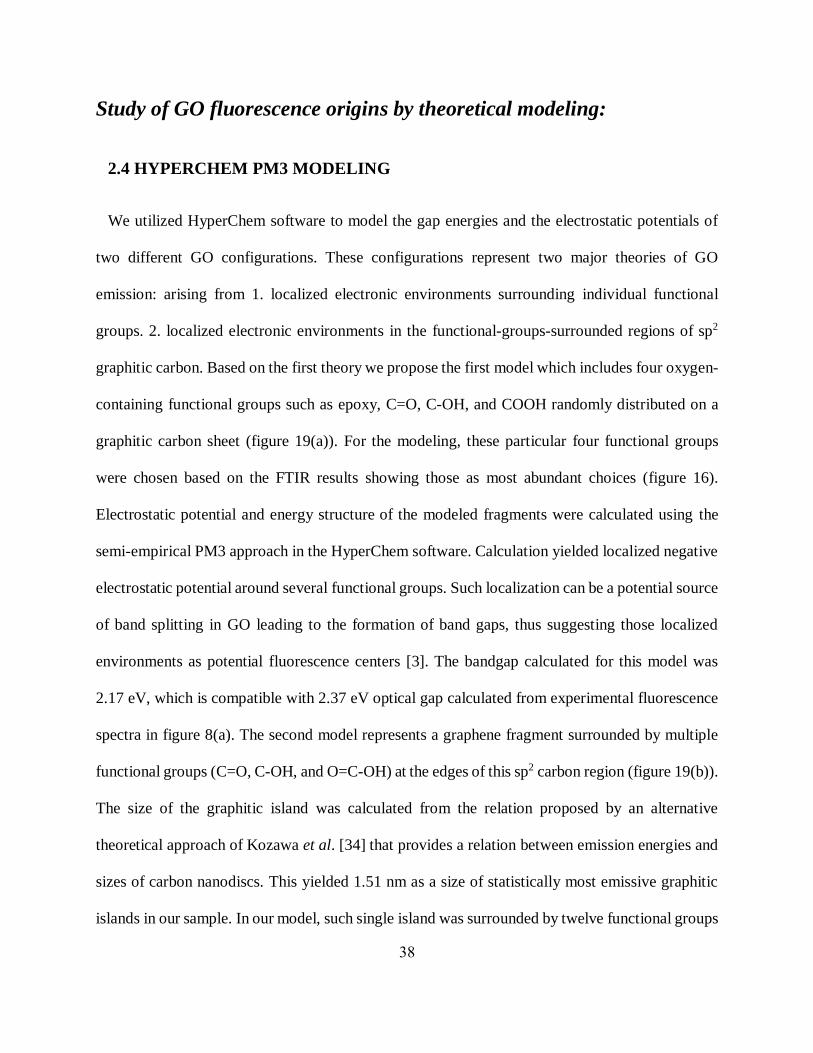
Figure 19. (a) Computation of electrostatic potential of graphene sheet fragment with four
randomly distributed epoxy, C=O, C-OH and O=C-OH groups. (b) Computation of electrostatic
potential of graphene sheet fragment with C=O, C-OH and O=C-OH groups surrounding the
region of graphitic carbon. The white, black and red atoms represent hydrogen, carbon, and oxygen
respectively for both models 39
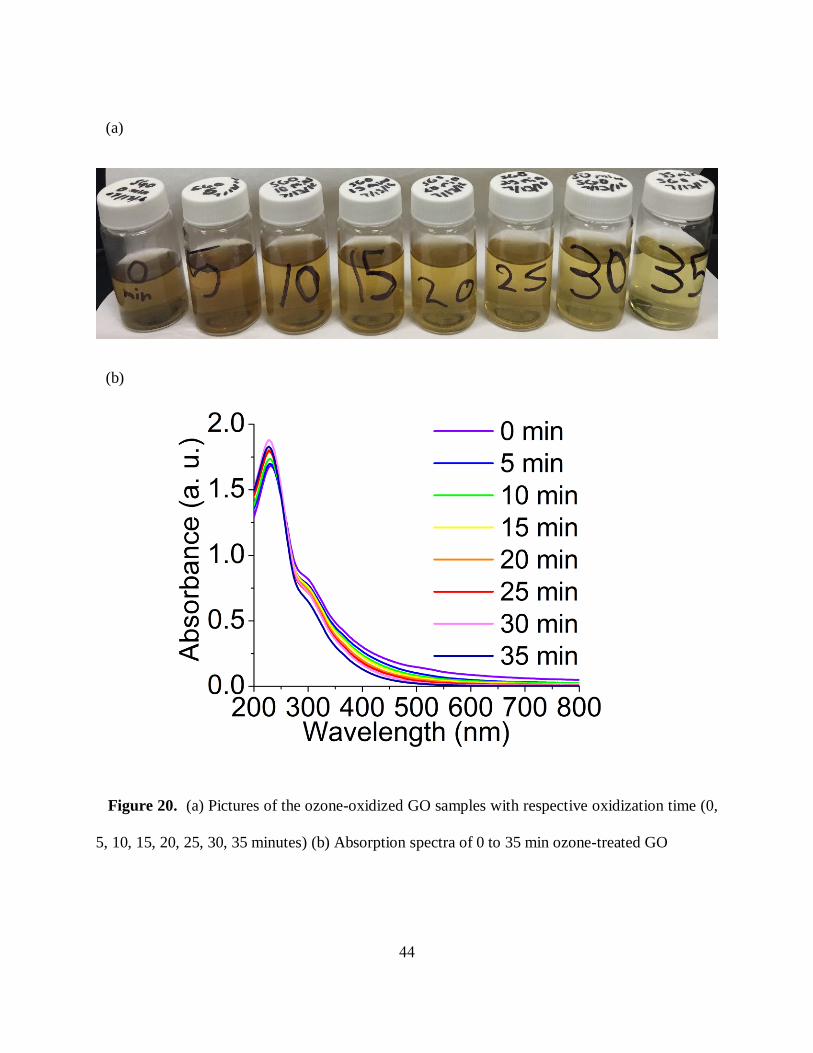
Figure 20. (a) Pictures of the ozone-oxidized GO samples with respective oxidization time (0, 5,
10, 15, 20, 25, 30, 35 minutes) (b) Absorption spectra of 0 to 35 min ozone-treated GO 44
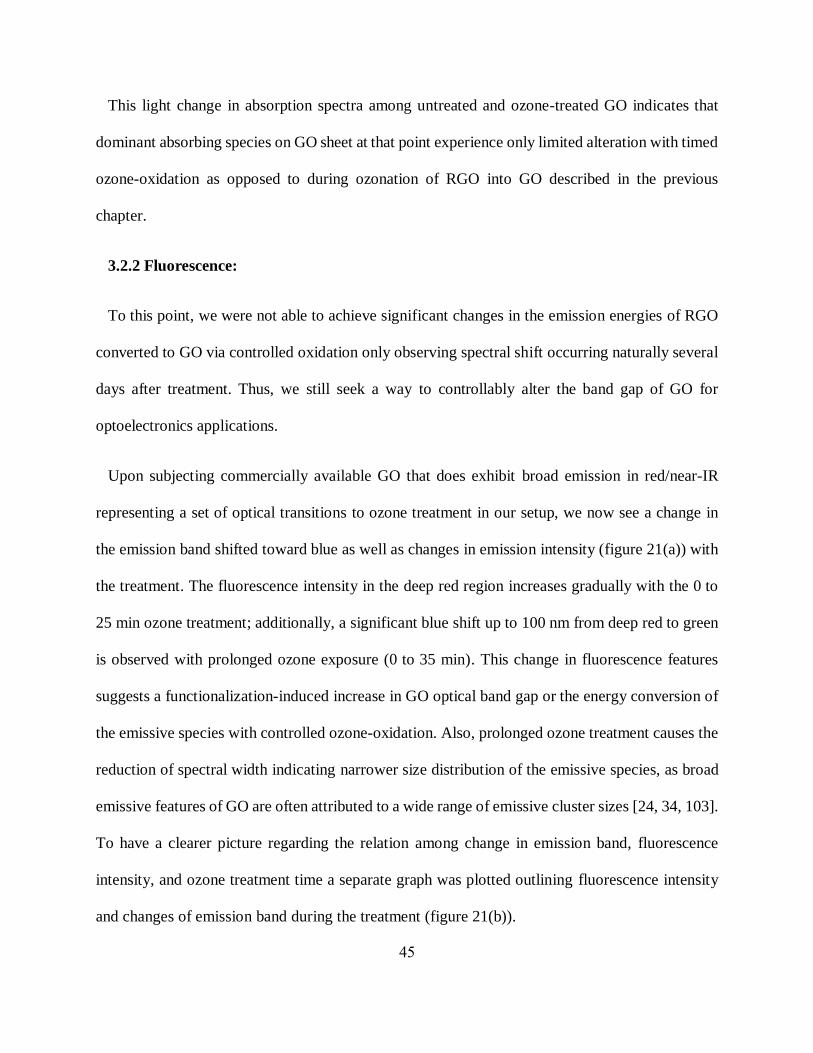
Figure 21. (a) Fluorescence spectra of 0 to 35 min ozone-treated GO (b) Ozone treated time vs.
fluorescence intensity vs. change in the emission band maxima for 0 to 35 min ozone treated
sample 46
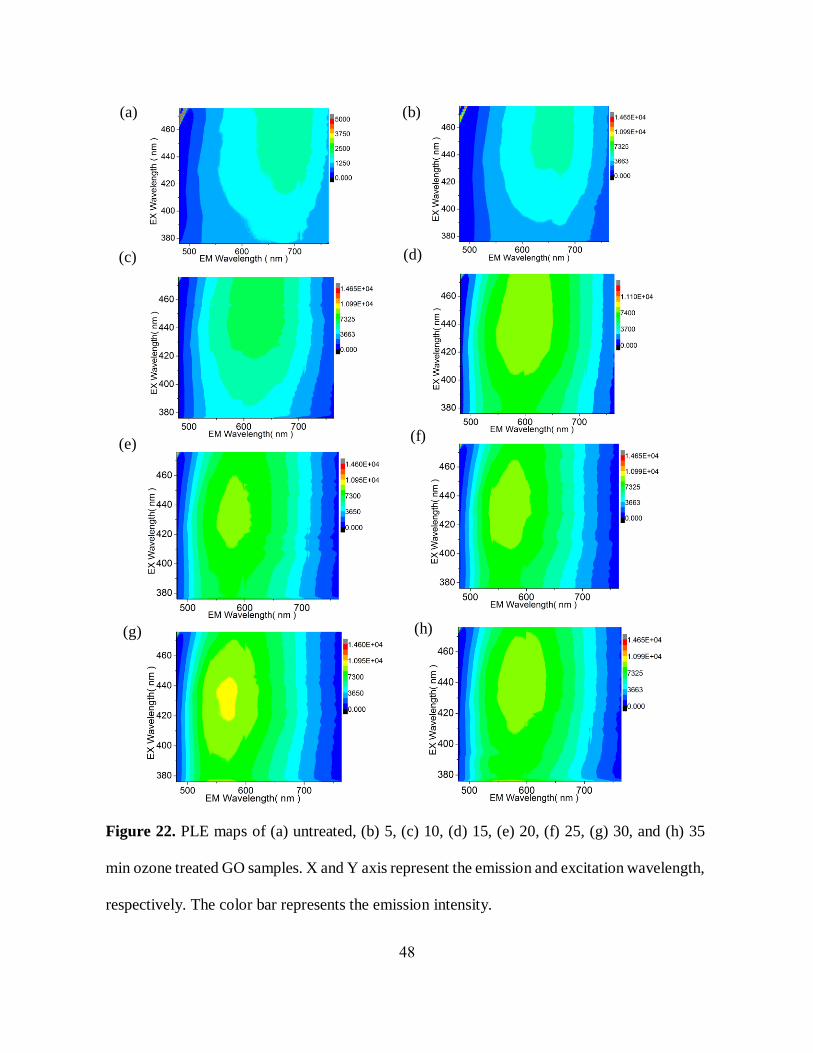
Figure 22. Photoluminescence excitation (PLE) maps of (a) untreated, (b) 5, (c) 10, (d) 15, (e) 20,
(f) 25, (g) 30, and (h) 35 min ozone treated GO samples. X and Y axis represent the emission and
excitation wavelength, respectively 48
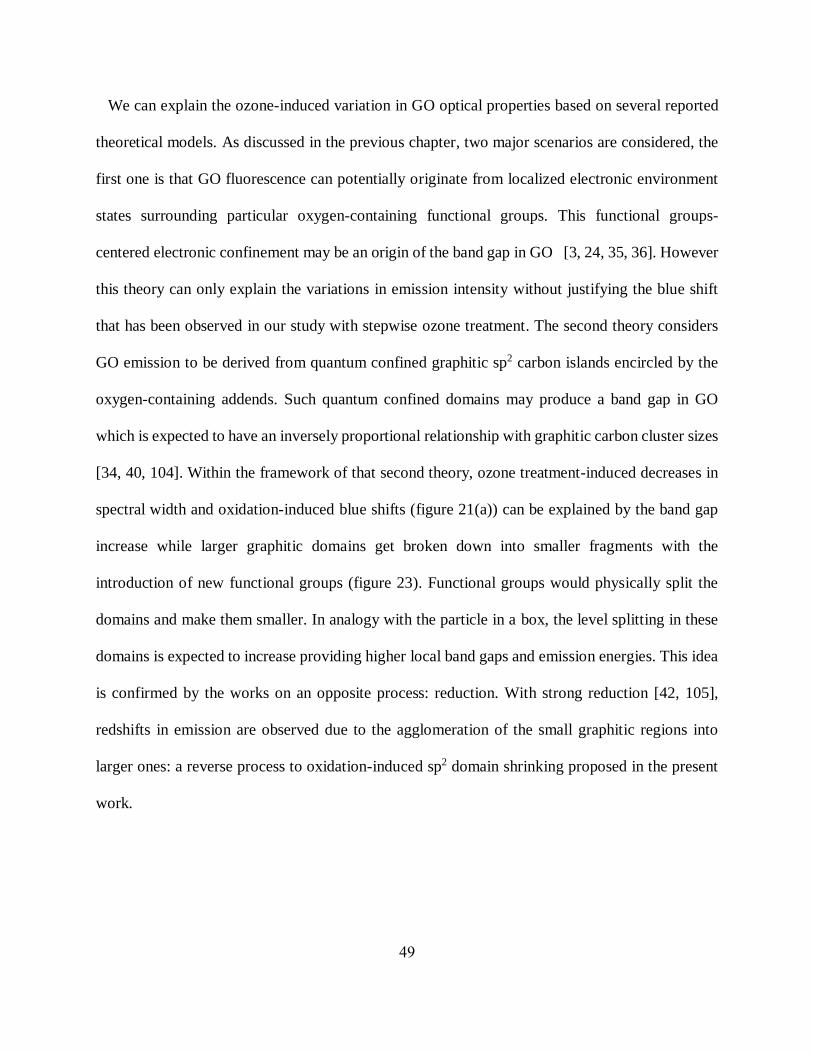
Figure 23. Schematic of graphitic carbon islands due to oxidation and over-oxidation of Graphene
Oxide via ozone treatment showing larger graphitic domains get broken down into smaller
fragments due to prolonged ozone treatment 50
ix
Figure 24. The IR spectra of untreated and ozone-treated GO. Observed transitions include C-O
stretch (~1085 cm−1), COO− stretch in COOH group (~1360 cm−1), C-OH bend / -O-H
deformation (~1425 cm−1), and C=O stretch in COOH group (~1725 cm−1) 52
Figure 25. TEM images for (a) 0 min (b) 10 min (c) 15 min & (d) 30 min ozone treated samples.
The estimated average graphitic carbon cluster sizes for these samples are 3.69, 1.85, 1.73, and
1.28 nm, respectively. Representative regions are circled in red. However, all ordered sp2 regions
were considered in the statistics 54
Figure 26. (a) Computation of electrostatic potential of graphene sheet fragment with C=O, C-OH
and C-O-C groups surrounding the region of graphitic carbon (b) C=O, C-OH and O=C-OH groups
farther away from the edge (c) C=O, C-OH and more O=C-OH groups farthest away from the
edge. The white, black and red atoms represent hydrogen, carbon, and oxygen, respectively for all
the models. Green color represents negative electrostatic potential around the functional groups,
whereas the purple color represents constant potential isosurfaces. (d) The table of calculated
optical band gap by decreasing localized sp² regions size in GO for three separate models 58
x
LIST OF TABLES
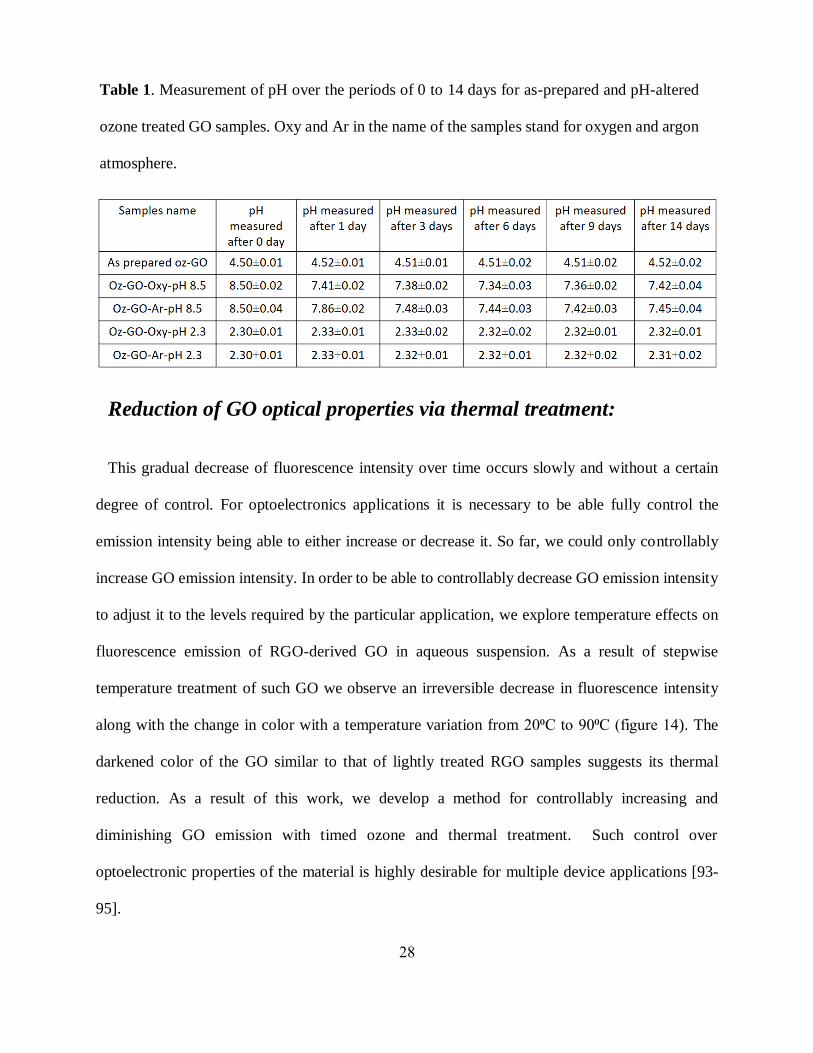
Table 1. Measurement of pH over the periods of 0 to 14 days for as prepared and pH altered ozone
treated GO samples. Oxy and Ar in the name of the samples stand for oxygen and argon
atmosphere 28
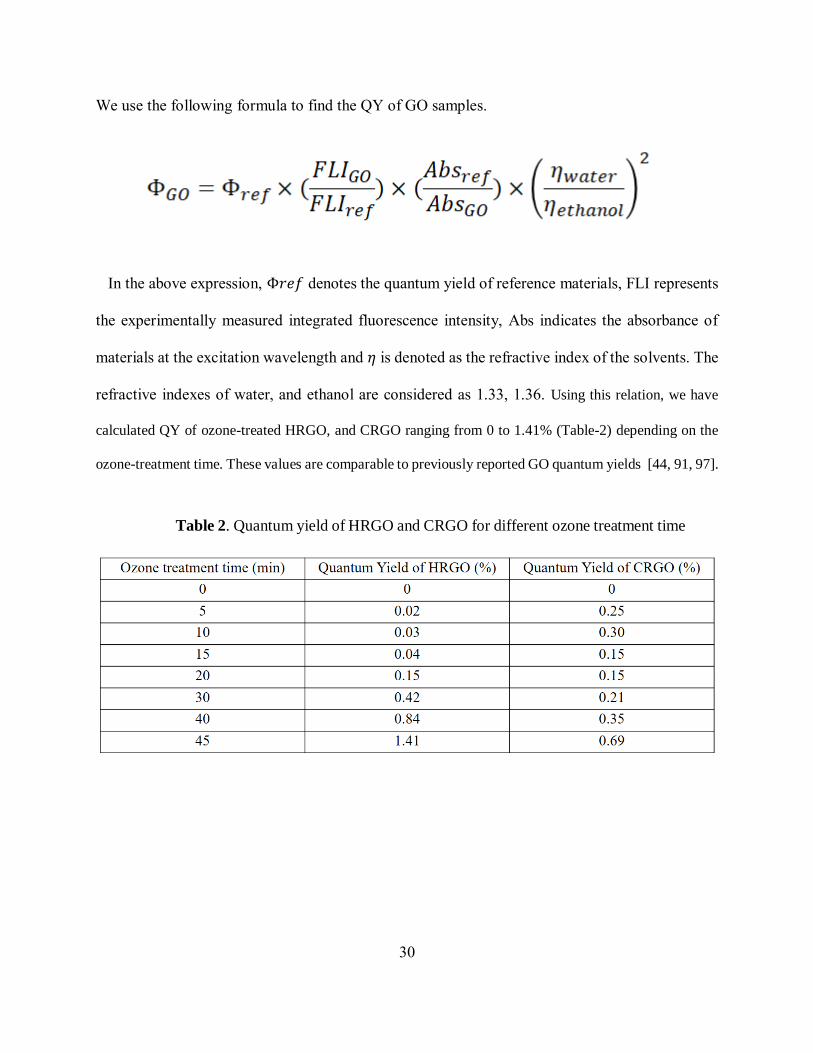
Table 2. Quantum yield of HRGO and CRGO for different ozone treatment time 30
Table 3. Quantum yield of untreated and timed ozone treated GO 55
xi
LIST OF ABBREVIATIONS
GO – Graphene oxide
RGO – Reduced graphene oxide
HRGO – Reduced graphene oxide produced by Hummer’s method
CRGO – Commercially purchased reduced graphene oxide
HGO – Graphene oxide produced from HRGO via ozone treatment
CGO – Graphene Oxide produced from CRGO via ozone treatment
Oz-GO – Ozone-oxidized GO
PL – Photoluminescence
FWHM – Full Width at Half Maximum
NIR – Near-infrared
FTIR – Fourier transformed infrared spectroscopy
SEM – Scanning electron microscope
AFM – Atomic force microscope
PLE – Photoluminescence excitation/emission
TEM – Transmission electron microscope
HRTEM – High-resolution transmission electron microscope
ATR – Attenuated total reflection
PM3- Parameterized model number 3
1
CHAPTER – 1
BACKGROUND STUDY
1.1 MOTIVATION:
The discovery of graphene was highly important for scientific advancement and technological
development as graphene possesses unique properties such as high electrical/ thermal conductivity,
transparency, mechanical strength, chemical stability, etc [4-8]. However, graphene is an optically
inert material, therefore, it cannot be used for any emission-based optoelectronic applications. On
the other hand, graphene derivatives such as graphene oxide can exhibit fluorescence improving
their potential for optoelectronics and bio-imaging/sensing applications. Our goal was to develop
a straightforward and cost-effective way to generate graphene oxide (GO) with controlled optical
and electronic properties that could be in future tailored to a specific application. Methods
implemented in this work will allow for controllably altering both the emission intensity and the
optical band gap of graphene oxide for its applications in optoelectronics and biomedical industry.
Also, since the origin of GO fluorescence is still debatable, we intended to create and compare the
model of GO optical properties to our experimental findings which will facilitate a better
understanding of GO emission, structure and its electronic properties.

2
1.2 QUESTIONS THAT WILL BE ANSWERED BY THIS STUDY:
i. Can we produce GO with control over its emission intensity (increasing and
decreasing it)?
ii. How stable is the fluorescence of as-produced GO over time?
iii. Can we tune the optical bandgap of GO?
iv. Can we predict the GO fluorescence mechanism and trends in emission observed
in this work by theoretical modeling?
3
1.3 LITERATURE REVIEW
1.3.1 GRAPHENE
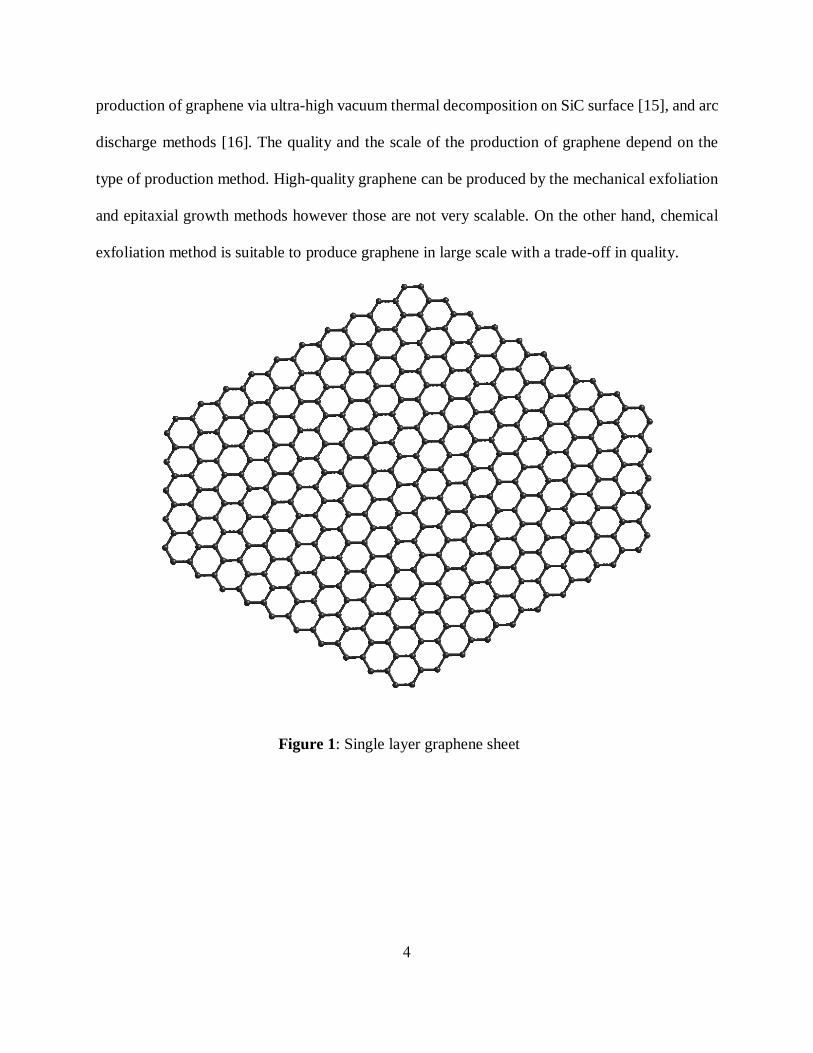
Graphene is a one atomic layer thick hexagonal carbon material that can be considered as the
building block of graphite, reduced graphene oxide, graphene oxide, carbon nanotubes, fullerenes,
graphene quantum dots, graphene nanoribbons, etc. It has the honeycomb lattice of sp² hybridized
carbon (figure-1) with a bond length of 0.12 nm [9]. In graphene layers, 2s, 2px, and 2py orbitals
hybridize in a way that each carbon is covalently bonded with three neighboring carbons by strong
sp2/sigma bonds whereas the 2pz orbital forms a -bond that is shared by neighboring carbons
forming a electron system on the graphene surface. Unlike for metal or insulator, the valence
and conduction bands of graphene touch at their extremities providing only one point of contact.
This resembles more of a semiconductor with a gap bridged at one point. Therefore, graphene is
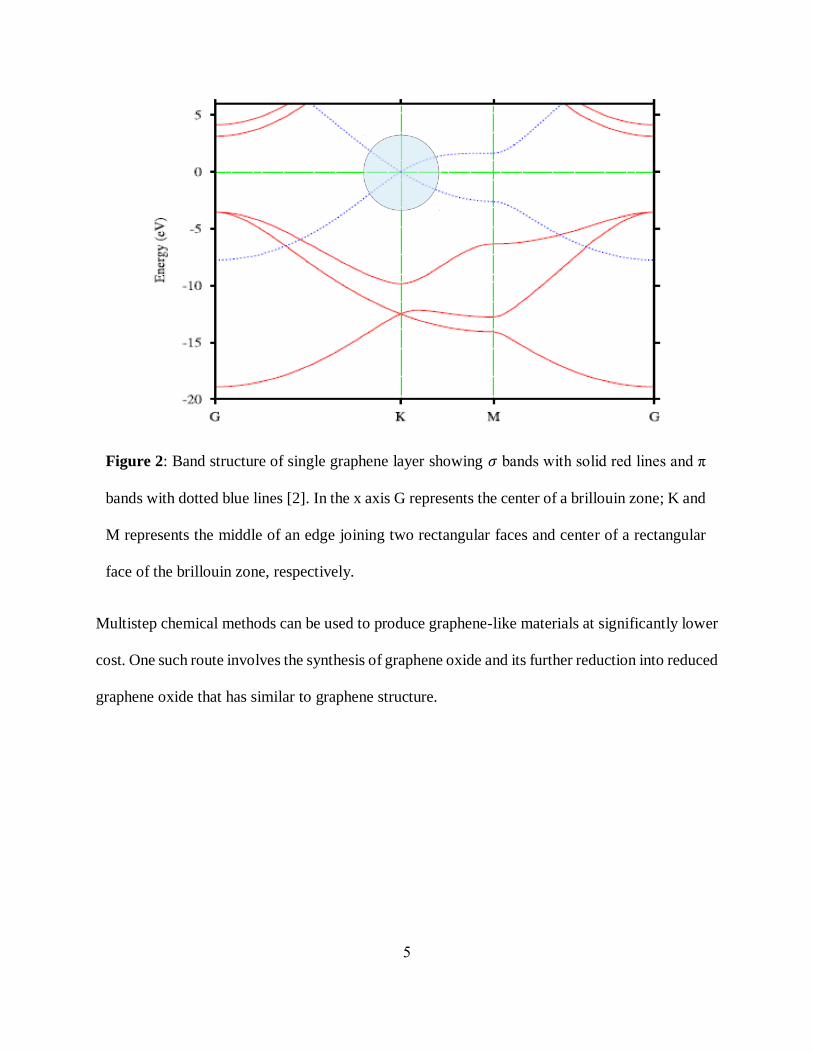
known as a zero-bandgap semiconductor or a semi-metal. The electronic band structure of single-
layer graphene can be calculated by density functional theory (DFT) and reflects its unusual
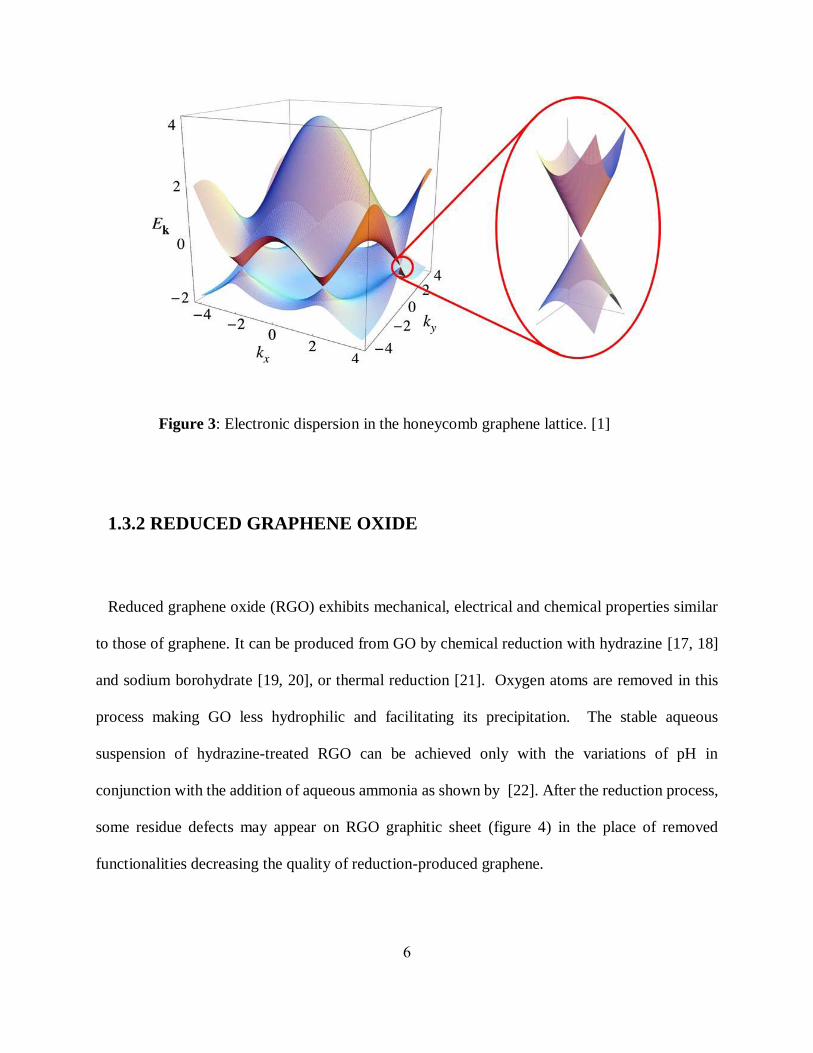
character (figure 2). The energy bands of graphene form conical structures called Dirac cones
(figure 3). DFT suggests that for such band structure delocalized electrons in graphene act as
massless relativistic particles except that their speeds are 300 times slower than the speed of light
[1]. Graphene can be synthesized utilizing both top-down and bottom-up approaches. The top-
down methods include mechanical exfoliation developed by Geim and Novoselov [10],
exfoliation–re-intercalation–expansion of graphite introduced by Li et al. [11], graphite
exfoliation by high-shear mixing [12] etc. On the other hand, the bottom-up methods include
thermal chemical vapor deposition (CVD) using camphor as the precursor on nickel foils [13],
plasma enhanced chemical vapor deposition requiring lower temperature than thermal CVD [14],
4
production of graphene via ultra-high vacuum thermal decomposition on SiC surface [15], and arc
discharge methods [16]. The quality and the scale of the production of graphene depend on the
type of production method. High-quality graphene can be produced by the mechanical exfoliation
and epitaxial growth methods however those are not very scalable. On the other hand, chemical
exfoliation method is suitable to produce graphene in large scale with a trade-off in quality.
Figure 1: Single layer graphene sheet
5
Multistep chemical methods can be used to produce graphene-like materials at significantly lower
cost. One such route involves the synthesis of graphene oxide and its further reduction into reduced
graphene oxide that has similar to graphene structure.
Figure 2: Band structure of single graphene layer showing 𝜎 bands with solid red lines and π
bands with dotted blue lines [2]. In the x axis G represents the center of a brillouin zone; K and
M represents the middle of an edge joining two rectangular faces and center of a rectangular
face of the brillouin zone, respectively.
6
1.3.2 REDUCED GRAPHENE OXIDE
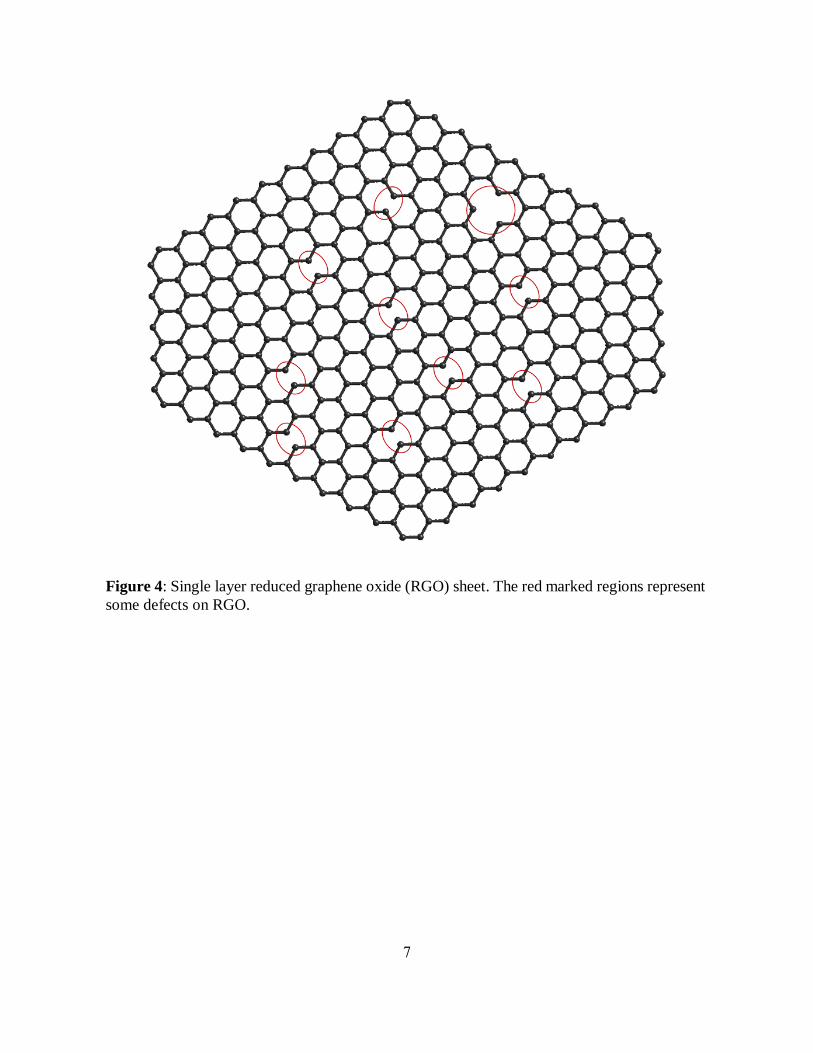
Reduced graphene oxide (RGO) exhibits mechanical, electrical and chemical properties similar
to those of graphene. It can be produced from GO by chemical reduction with hydrazine [17, 18]
and sodium borohydrate [19, 20], or thermal reduction [21]. Oxygen atoms are removed in this
process making GO less hydrophilic and facilitating its precipitation. The stable aqueous
suspension of hydrazine-treated RGO can be achieved only with the variations of pH in
conjunction with the addition of aqueous ammonia as shown by [22]. After the reduction process,
some residue defects may appear on RGO graphitic sheet (figure 4) in the place of removed
functionalities decreasing the quality of reduction-produced graphene.
Figure 3: Electronic dispersion in the honeycomb graphene lattice. [1]
7
Figure 4: Single layer reduced graphene oxide (RGO) sheet. The red marked regions represent
some defects on RGO.
8
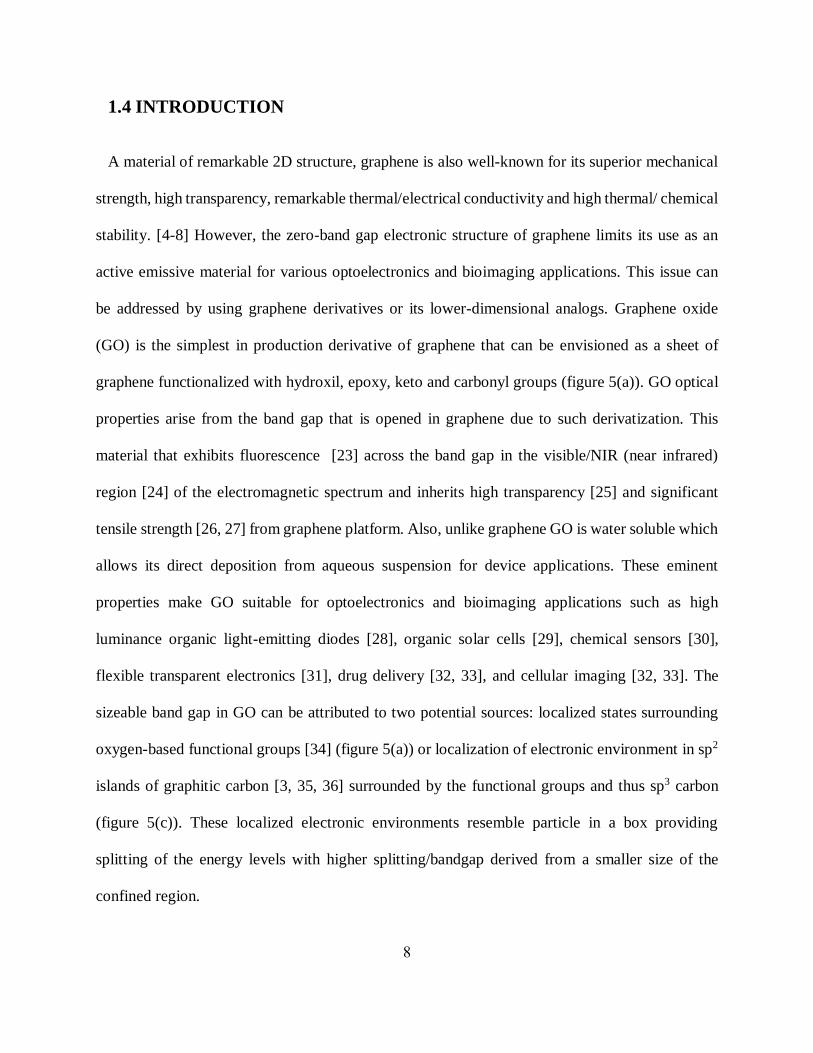
1.4 INTRODUCTION
A material of remarkable 2D structure, graphene is also well-known for its superior mechanical
strength, high transparency, remarkable thermal/electrical conductivity and high thermal/ chemical
stability. [4-8] However, the zero-band gap electronic structure of graphene limits its use as an
active emissive material for various optoelectronics and bioimaging applications. This issue can
be addressed by using graphene derivatives or its lower-dimensional analogs. Graphene oxide
(GO) is the simplest in production derivative of graphene that can be envisioned as a sheet of
graphene functionalized with hydroxil, epoxy, keto and carbonyl groups (figure 5(a)). GO optical
properties arise from the band gap that is opened in graphene due to such derivatization. This
material that exhibits fluorescence [23] across the band gap in the visible/NIR (near infrared)
region [24] of the electromagnetic spectrum and inherits high transparency [25] and significant
tensile strength [26, 27] from graphene platform. Also, unlike graphene GO is water soluble which
allows its direct deposition from aqueous suspension for device applications. These eminent
properties make GO suitable for optoelectronics and bioimaging applications such as high
luminance organic light-emitting diodes [28], organic solar cells [29], chemical sensors [30],
flexible transparent electronics [31], drug delivery [32, 33], and cellular imaging [32, 33]. The
sizeable band gap in GO can be attributed to two potential sources: localized states surrounding
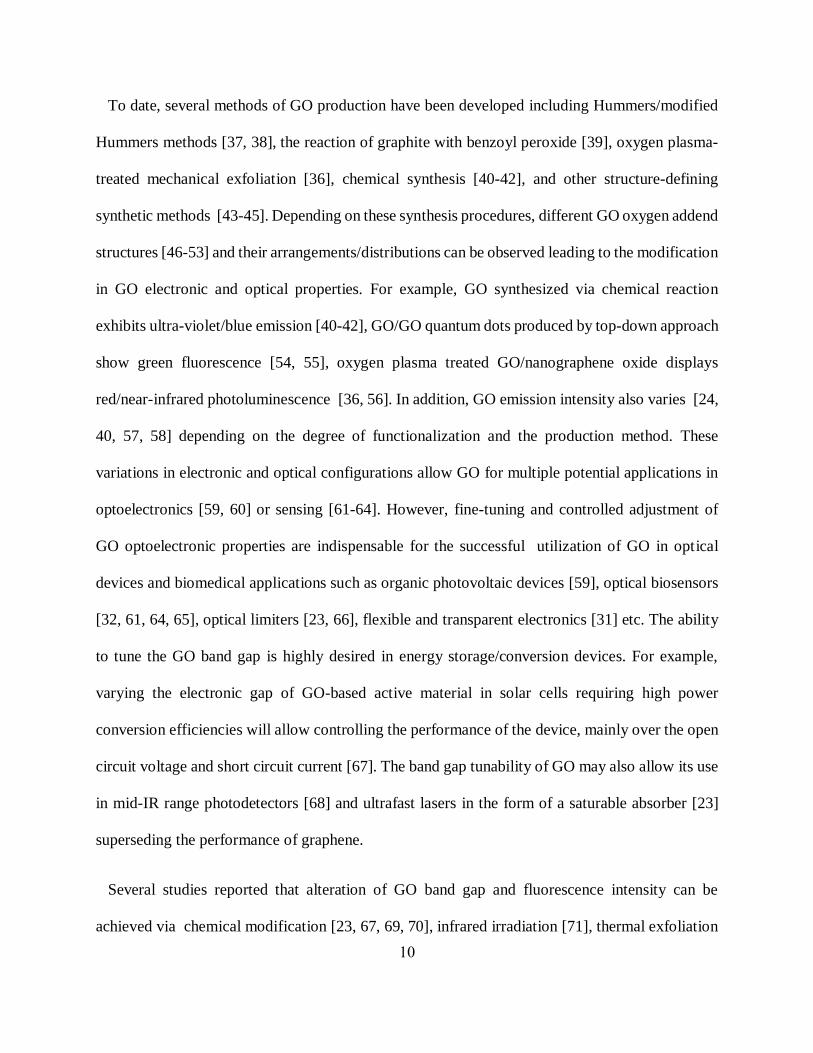
oxygen-based functional groups [34] (figure 5(a)) or localization of electronic environment in sp2
islands of graphitic carbon [3, 35, 36] surrounded by the functional groups and thus sp3 carbon
(figure 5(c)). These localized electronic environments resemble particle in a box providing
splitting of the energy levels with higher splitting/bandgap derived from a smaller size of the
confined region.
9
Thus a broad fluorescence emission in graphene oxide can be explained by the multitude of sizes
of the emissive confined environments leading to multiple emission energies. However, the true
nature of GO emission has not been confirmed yet while several aforementioned theories are
considered as potential pathways for GO emission.
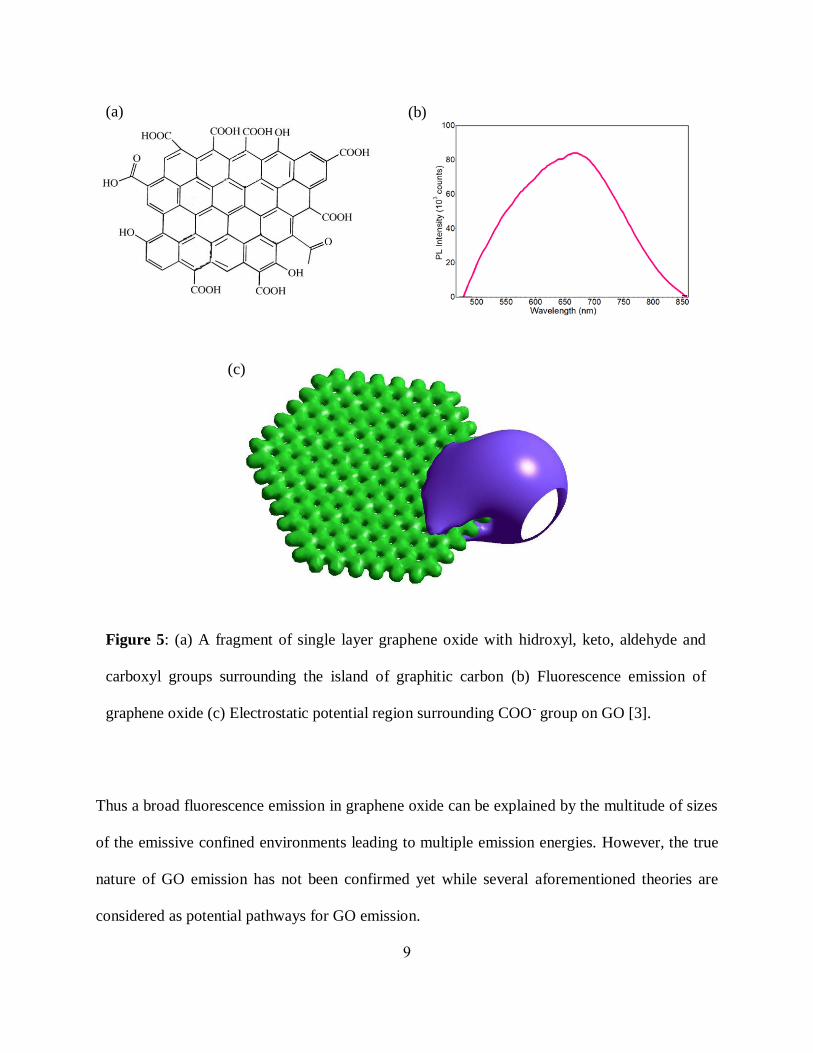
Figure 5: (a) A fragment of single layer graphene oxide with hidroxyl, keto, aldehyde and
carboxyl groups surrounding the island of graphitic carbon (b) Fluorescence emission of
graphene oxide (c) Electrostatic potential region surrounding COO- group on GO [3].
(a) (b)
(c)
10
To date, several methods of GO production have been developed including Hummers/modified
Hummers methods [37, 38], the reaction of graphite with benzoyl peroxide [39], oxygen plasma-
treated mechanical exfoliation [36], chemical synthesis [40-42], and other structure-defining
synthetic methods [43-45]. Depending on these synthesis procedures, different GO oxygen addend
structures [46-53] and their arrangements/distributions can be observed leading to the modification
in GO electronic and optical properties. For example, GO synthesized via chemical reaction
exhibits ultra-violet/blue emission [40-42], GO/GO quantum dots produced by top-down approach
show green fluorescence [54, 55], oxygen plasma treated GO/nanographene oxide displays
red/near-infrared photoluminescence [36, 56]. In addition, GO emission intensity also varies [24,
40, 57, 58] depending on the degree of functionalization and the production method. These
variations in electronic and optical configurations allow GO for multiple potential applications in
optoelectronics [59, 60] or sensing [61-64]. However, fine-tuning and controlled adjustment of
GO optoelectronic properties are indispensable for the successful utilization of GO in optical
devices and biomedical applications such as organic photovoltaic devices [59], optical biosensors
[32, 61, 64, 65], optical limiters [23, 66], flexible and transparent electronics [31] etc. The ability
to tune the GO band gap is highly desired in energy storage/conversion devices. For example,
varying the electronic gap of GO-based active material in solar cells requiring high power
conversion efficiencies will allow controlling the performance of the device, mainly over the open
circuit voltage and short circuit current [67]. The band gap tunability of GO may also allow its use
in mid-IR range photodetectors [68] and ultrafast lasers in the form of a saturable absorber [23]
superseding the performance of graphene.
Several studies reported that alteration of GO band gap and fluorescence intensity can be
achieved via chemical modification [23, 67, 69, 70], infrared irradiation [71], thermal exfoliation
11
[72], exfoliation of GO using focused solar radiation [73], photoreduction [74], photothermal
deoxygenation [75], flash reduction [76], laser-induced reduction [77, 78], photocatalytic
reduction [79] and mechanical compressive strain processing [80]. However, those methods
involve complicated synthetic procedures and do not have enough flexibility to precisely alter GO
band gap and intensity. Therefore, a process allowing a simple, easy and cost-effective fine-tuning
of GO band gap and photoluminescence intensity is highly desirable. In order to alter the GO
emission intensity, new, more efficient techniques have been very recently proposed such as
controlled oxidation [70, 81] or ozone treatment of GO [58, 82] usually used to synthesize
graphene quantum dots from reduced graphene oxide (RGO) [83]. The ozone treatment requires
simple experimental tools and does not involve the introduction of other chemicals in solution
yielding to zero sample contamination. Yet this oxidation method can change the GO structure
significantly. It has been shown by Feng Yang et al. that ozone can introduce oxygen-containing
functional groups onto the graphitic carbon sheets which can increase the GO emission [58].
However, such an ozone treatment of GO [3] so far showed still a limited change in fluorescence
intensities seemingly without the band gap alteration indicating that this new technique is still in
need of improvement.
In this work, we have developed a controlled ozone treatment that allows producing graphene
oxide materials and alters their electronic/optical configurations from a lightly oxidized reduced
graphene oxide (RGO) to emissive GO material as well as controlling a band gap of as-synthesized
GO. Unlike graphene oxide, RGO contains few to no functional groups and exhibits electronic
properties comparable with those of graphene [84-86]. With controlled ozone treatment we show
that oxygen-containing functional groups can be introduced to the graphitic carbon sheets
suggesting conversion of RGO into GO. The emission intensity of newly produced GO increases
12
significantly with timed ozone treatment. We have also designed a timed ozone treatment to
modify fluorescence intensity and the band gap of commercially available GO. We utilize time-
resolved fluorescence, and Fourier transformed infrared (FTIR) spectroscopy to demonstrate the
characteristics of the ozone-induced GO/RGO. This solution-based process, as opposed to
previously developed structural modification methods, is exceptional in its simplicity and high
degree of control. As a result, it provides a route to tailor the electronic properties of GO for such
applications as polymer tandem solar cells [87], energy storage devices [88] and solid-state electric
double layer transistors [89].
In order to explain observed changes in the optical response of GO materials, we perform semi-
empirical PM3 calculations on model GO fragments. These calculations are based on
experimentally observed fluorescence emission and existing theories of charge localization in GO.
Until now, a number of sources suggest possible origins of GO photoluminescence. The most
recognized theoretical study suggested that the origin of GO emission is attributed to the quantum-
confined sp² graphitic islands [34] surrounded by oxygen-containing functional groups, or that it
can potentially originate from localized electronic environments at different oxygen-containing
addends [3]. Our theoretical models based on these assumptions and experimental data (FTIR and
TEM analysis) provide insight into the structural origins of GO fluorescence and allow for optical
characterization of GO structure.
13
CHAPTER – 2
PRODUCTION OF GRAPHENE OXIDE (GO) FROM REDUCED
GRAPHENE OXIDE (RGO) WITH THE CONTROL OVER ITS
EMISSION INTENSITY
2.1 Methods
2.1.1 Sample preparation:
We used two different types of reduced graphene oxide (RGO) as precursor materials to produce
graphene oxide (GO). One type of RGO was produced by Hummers method [90] followed by
hydrazine reduction (HRGO), and another type was purchased commercially (CRGO) from
Graphene Supermarket (HP-RGO-0.5G). RGO suspensions were prepared by dispersing 40 mg of
HRGO, or 2 mg of CRGO in 15 ml of deionized (DI) water. Before the ozone treatment,
HRGO/CRGO materials were processed via direct probe ultrasonic treatment for 5-10 minutes at
3W. After the ultrasonic treatment, HRGO/CRGO yields a black colored, poorly dispersed, and
quickly sedimented suspension. Enaly (Model: 5000BF-1) ozone generator was utilized to
generate ozone supplying a maximum ozone concertation of 3 g/L while fed by oxygen. HRGO
and CRGO samples were ozone-oxidized at 40%, and 70% of maximum ozone level respectively,
with ~1.2 (for HRGO) and ~2.1 g/L (for CRGO) ozone flow concentration. The timed ozone
treatment was introduced to RGO in aqueous suspension under ultrasonic bath agitation to ensure
disaggregation of GO flakes and ozone accessibility to RGO (figure 6). This ozone treatment set
up provides much more effective and controlled ozonation of RGO compared its counterpart [58].
14
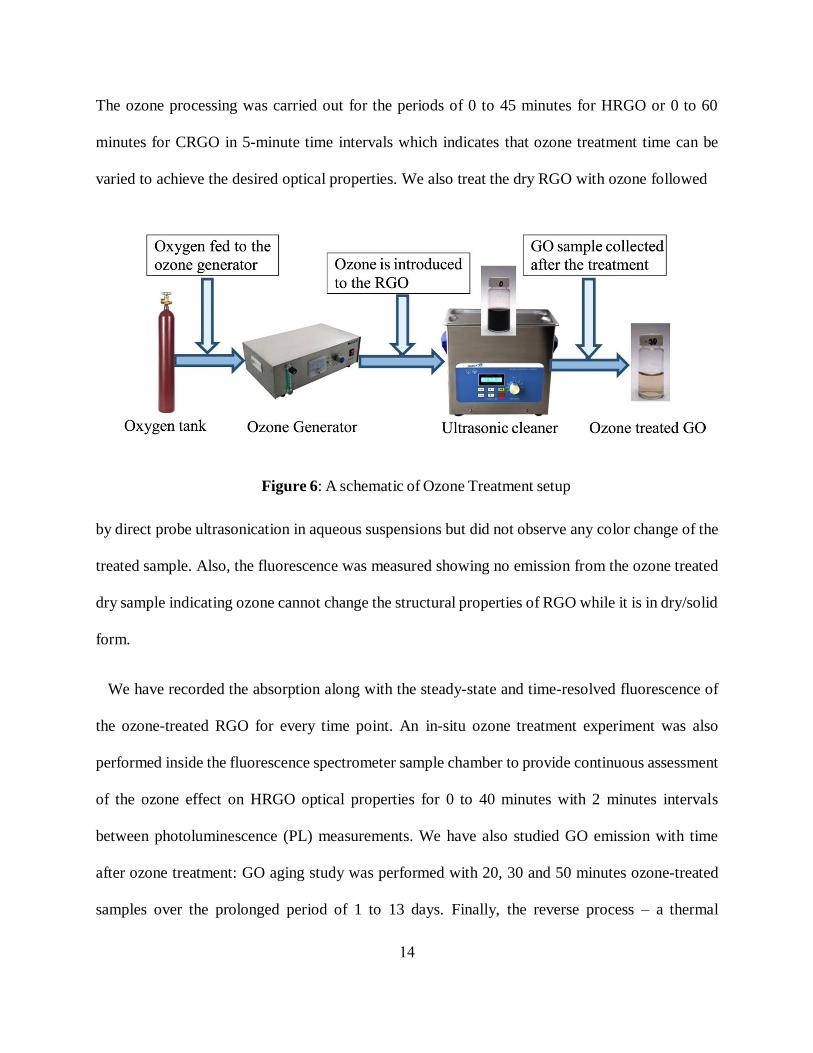
The ozone processing was carried out for the periods of 0 to 45 minutes for HRGO or 0 to 60
minutes for CRGO in 5-minute time intervals which indicates that ozone treatment time can be
varied to achieve the desired optical properties. We also treat the dry RGO with ozone followed
by direct probe ultrasonication in aqueous suspensions but did not observe any color change of the
treated sample. Also, the fluorescence was measured showing no emission from the ozone treated
dry sample indicating ozone cannot change the structural properties of RGO while it is in dry/solid
form.
We have recorded the absorption along with the steady-state and time-resolved fluorescence of
the ozone-treated RGO for every time point. An in-situ ozone treatment experiment was also
performed inside the fluorescence spectrometer sample chamber to provide continuous assessment
of the ozone effect on HRGO optical properties for 0 to 40 minutes with 2 minutes intervals
between photoluminescence (PL) measurements. We have also studied GO emission with time
after ozone treatment: GO aging study was performed with 20, 30 and 50 minutes ozone-treated
samples over the prolonged period of 1 to 13 days. Finally, the reverse process – a thermal
Figure 6: A schematic of Ozone Treatment setup
15
reduction was implemented to allow for a full control over GO emission intensity. Thermal
reduction in the temperature range from 20 to 90⁰C carried out with 45 minutes ozone-treated
samples was studied by recording absorption and fluorescence spectra at every 10⁰C.
2.1.2 Characterization of GO samples:
The topology and average flake size of graphene oxide samples were measured utilizing SEM
(Scanning Electron Microscope: JEOL, JSM-7100F) and tapping mode AFM (Atomic Force
Microscope: NT-MDT nanosolver). Samples for SEM characterization were deposited on carbon
conducting tape dried under ambient conditions. Aqueous GO was spin-coated for three times at
3000 rpm for 30 seconds (each time) on a silicon chip substrate to prepare the samples for AFM
measurements.
2.1.3 Optical measurements of GO samples:
Fluorescence spectra of GO were measured using SPEX NanoLog, Horiba Scientific
spectrofluorometer in the regions 420 to 762 nm at 400 nm excitation. Absorbance was recorded
in the range of 200 to 800 nm with Agilent Technologies (Cary 60 UV-Vis) absorption
spectrometer.
GO fluorescence was measured using the 10x10 mm, 10x1 mm and 3x3 mm quartz cuvettes.
Absorption and fluorescence spectra of over-oxidized (over 55 minutes ozone-treated) GO samples
were measured for the period of 0 to 24 hours. The fluorescence lifetime of GO samples was
measured using FluoTime 300, Pico Quant spectrometer with a picosecond pulsed 405 nm diode
laser (LDH-D-C-405 Pico Quant, GmbH) excitation, which produces laser pulses with a pulse
width (full width at half maximum - FWHM) < 50 ps and 17 MHz repetition rate. In order to detect
16
the distinct oxygen functionalities and their relative abundance in HRGO/GO, we utilized the ATR
mode of Thermo Nicolet Nexus, 670, FTIR (Fourier Transformed Infrared Spectroscopy). FTIR
samples were freeze-dried via Labconco, FreeZone 4.5 freeze-dryer.
2.1.4 Semi-empirical PM3 calculations:
Hyperchem software is utilized to build the model of GO containing several oxygen-containing
functional groups and calculate the energy band gap of GO utilizing the semi-empirical PM3
method. Semi-empirical is a type of quantum mechanics chemical calculation technique that uses
parameters derived from experiments to simplify the calculation process. This method is well-
known for its sufficient accuracy and fast process of computation compared to the calculation
based on density functional theory (DFT). PM3 is a semi-empirical self-consistent field (SCF)
method for chemical calculations. This is an improved version/re-parametrization of AM1 (Austin
Module 1) method. The self-consistent field is considered as an iterative method which accounts
for electron repulsion energies in solutions of the Schrodinger equation with zero interaction
potential boundary condition at infinity. The SCF method simplifies this task by assuming that the
movements of electrons are independent and that an electron interacts with the mean field of all
other electrons in a molecule. An SCF calculation begins by estimating the wavefunction
describing the electron orbitals and electron repulsions. Based on this assumption, Hyperchem
software calculates a new wavefunction and compares the result with the estimate. The software
repeats this process until the estimate, and the result converges or becomes self-consistent. Each
iteration improves the orbitals until the result reaches a convergence limit.
17
2.2 EXPERIMENTAL RESULTS AND DISCUSSIONS
2.2.1 Absorbance
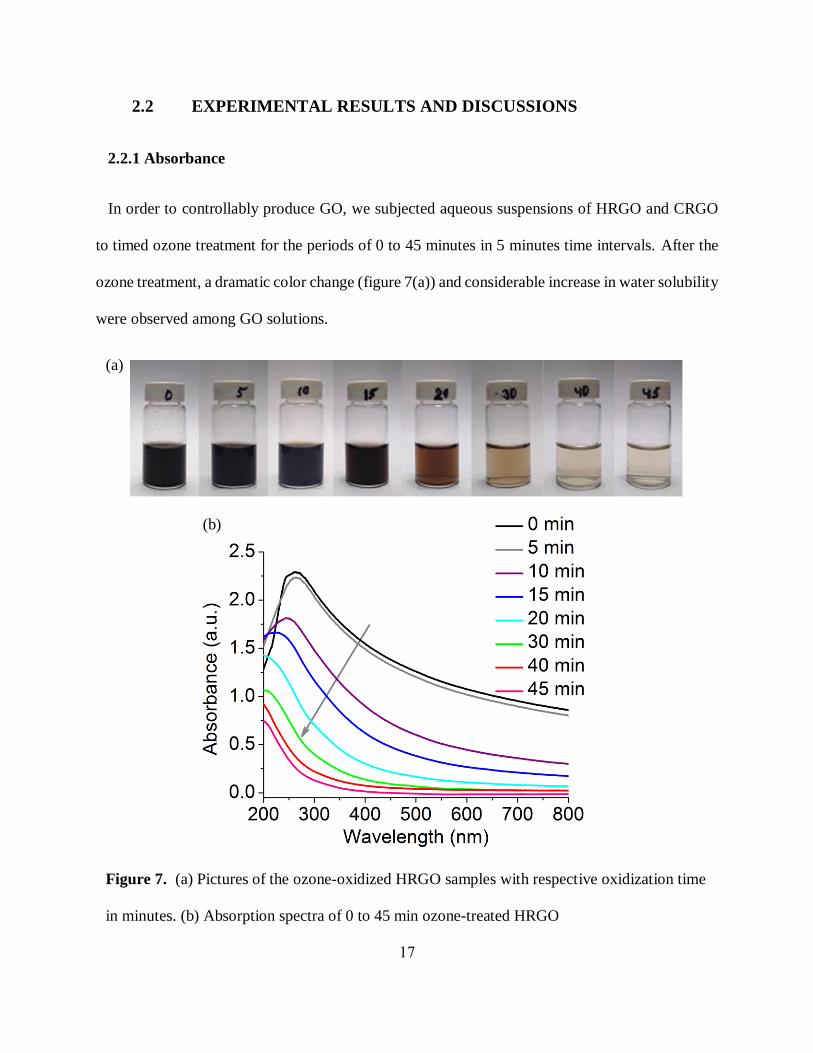
In order to controllably produce GO, we subjected aqueous suspensions of HRGO and CRGO
to timed ozone treatment for the periods of 0 to 45 minutes in 5 minutes time intervals. After the
ozone treatment, a dramatic color change (figure 7(a)) and considerable increase in water solubility
were observed among GO solutions.
Figure 7. (a) Pictures of the ozone-oxidized HRGO samples with respective oxidization time
in minutes. (b) Absorption spectra of 0 to 45 min ozone-treated HRGO
(a)
(b)
18
This solubility improvement is essential as it enhances applications of GO for the direct
deposition from aqueous solution to fabricate optoelectronic devices. The color of the RGO
sample gets significantly lighter with timed ozonation suggesting a change in visible absorption
which may be dictated by the electronic and structural modification of GO. Indeed, the absorption
of untreated and ozone-treated RGO materials exhibits decremental blue shifted absorption peak
starting at ~280 nm (figure 7(b)) corresponding to 𝜋 → 𝜋∗ transition for 𝑠𝑝2 graphitic domains
[24, 42, 91, 92] along with considerable reduction in absorption peak intensity with prolonged
oxidation time. This indicates the replacement of highly absorbing 𝑠𝑝2 graphitic domains with sp3
carbon functionalized by oxygen-containing addends with ozone treatment. These changes are
indicative of the ozone-induced transformation of RGO into GO.
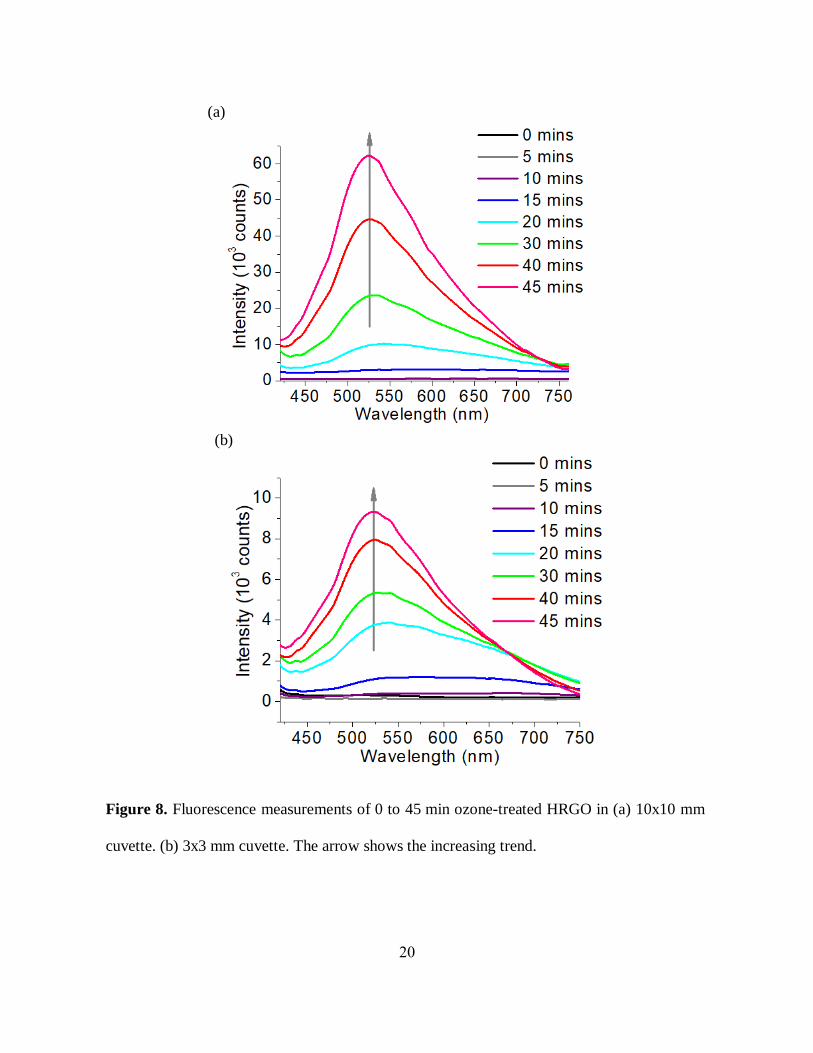
2.2.2 Fluorescence:
Fluorescence is used in our experiments to assess further the change that we introduce into
physical properties of RGO. Untreated initially non-emissive RGO shows bright visible
fluorescence with ozone exposure (Figure 8(a), (b)) suggesting a change in GO electronic
structure. Because of timed ozone-oxidation, the photoluminescence (PL) intensity gradually
increases with a slight blue shift in the emission band maxima suggesting GO PL intensity
dependence on the degree of ozone treatment. A small shift occurring with oxidation treatment
may be also attributed to changes in electronic structure as RGO is converted to GO. Further ozone
treatment likely produces over-oxidized GO showing a decrease in fluorescence intensity
suggesting the potential decomposition of the fluorescing centers. This study indicates that we can
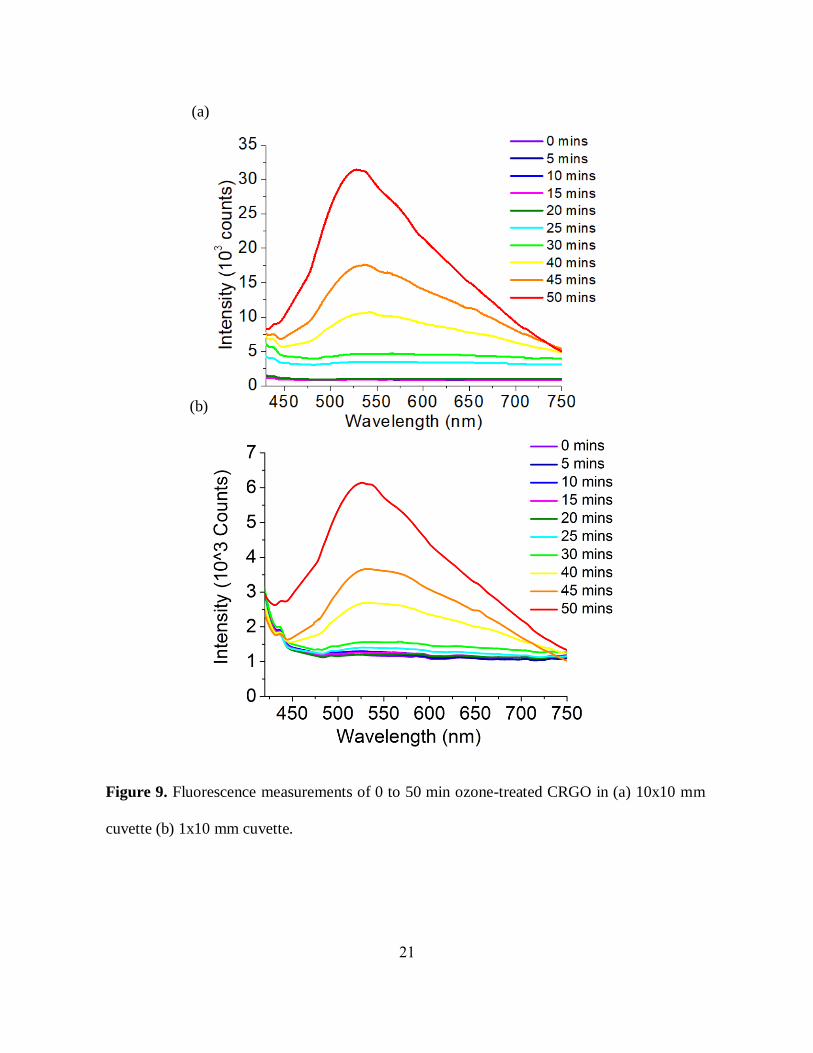
modify GO optical properties with controlled ozone-oxidization. We have observed the same trend
in fluorescence measurements for ozonated CRGO (Figure 9(a), (b)).
19
Potential discrepancy in colored GO samples may occur due to the reabsorption of the
fluorescence by GO. The contribution may be minimal for lighter-colored highly ozonaterd GO
considering an absence of GO absorption transition near the emission region, however we explore
this possibility in order to correct for the emission from lightly oxidized darker RGO. In order to
study the reabsorption effect, we use cuvettes with different optical path length (10x10, 3x3, and
1x10 mm) to measure GO fluorescence. Fluorescence measured in 3x3 mm cuvette (figure 8(b))
containing ozone-treated RGO showed higher intensity as compared to the fluorescence measured
in 10x10 mm cuvette (figure 8(a)) for the same ozone time point suggesting possible reabsorption
effects whereas highly ozonized samples as expected show very negligible change. However, a
trend of gradual increase in fluorescence intensity with prolonged ozonation was observed in both
cases. We have monitored similar reabsorption effects from ozonated CRGO samples using a
10x10 (figure 9(a)) and 1x10 mm (figure 9(b)) cuvette, and the general trend was still preserved.
In addition to accounting for reabsorption, this study also indicates that the change in optical
properties due to ozone-mediated oxidation is not strictly material-specific and occurs in different
types of graphene-like RGO materials.
20
(a)
(b)
Figure 8. Fluorescence measurements of 0 to 45 min ozone-treated HRGO in (a) 10x10 mm
cuvette. (b) 3x3 mm cuvette. The arrow shows the increasing trend.
21
Figure 9. Fluorescence measurements of 0 to 50 min ozone-treated CRGO in (a) 10x10 mm
cuvette (b) 1x10 mm cuvette.
(a)
(b)
22
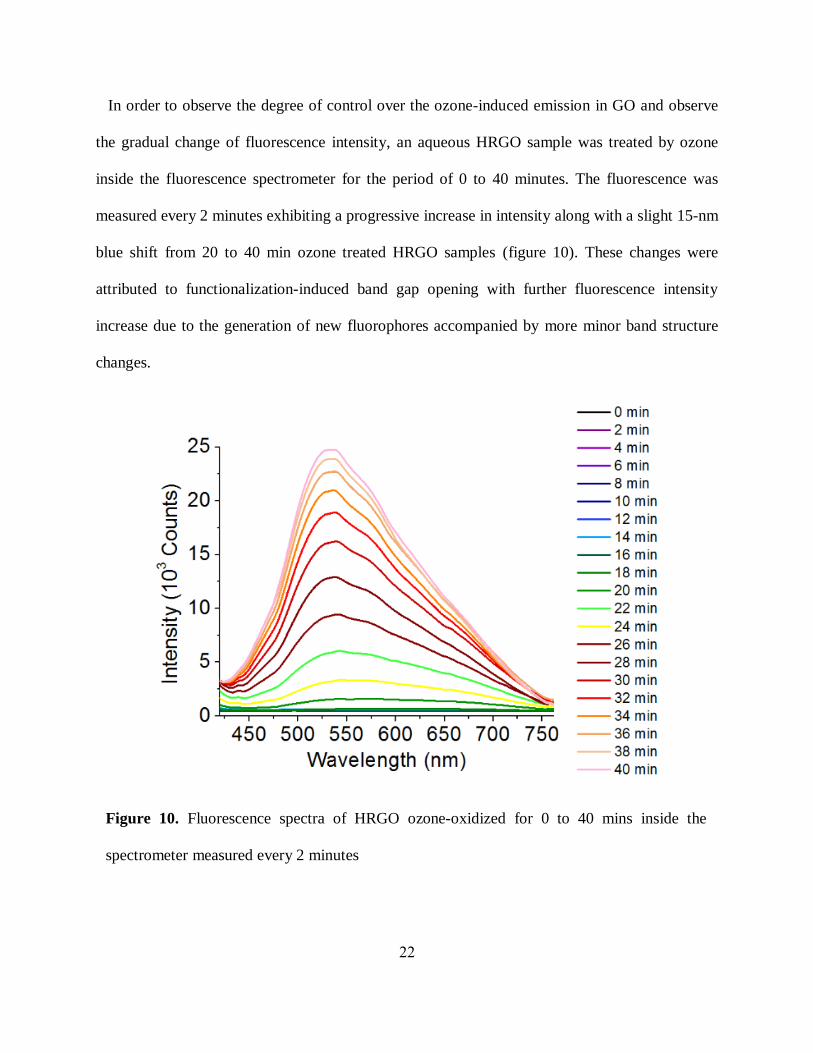
In order to observe the degree of control over the ozone-induced emission in GO and observe
the gradual change of fluorescence intensity, an aqueous HRGO sample was treated by ozone
inside the fluorescence spectrometer for the period of 0 to 40 minutes. The fluorescence was
measured every 2 minutes exhibiting a progressive increase in intensity along with a slight 15-nm
blue shift from 20 to 40 min ozone treated HRGO samples (figure 10). These changes were
attributed to functionalization-induced band gap opening with further fluorescence intensity
increase due to the generation of new fluorophores accompanied by more minor band structure
changes.
Figure 10. Fluorescence spectra of HRGO ozone-oxidized for 0 to 40 mins inside the
spectrometer measured every 2 minutes
23
This observation opens a possibility to control and fine-tune the emission intensity of processed
RGO with ozone-treatment while monitoring these changes with fluorescence spectroscopy.
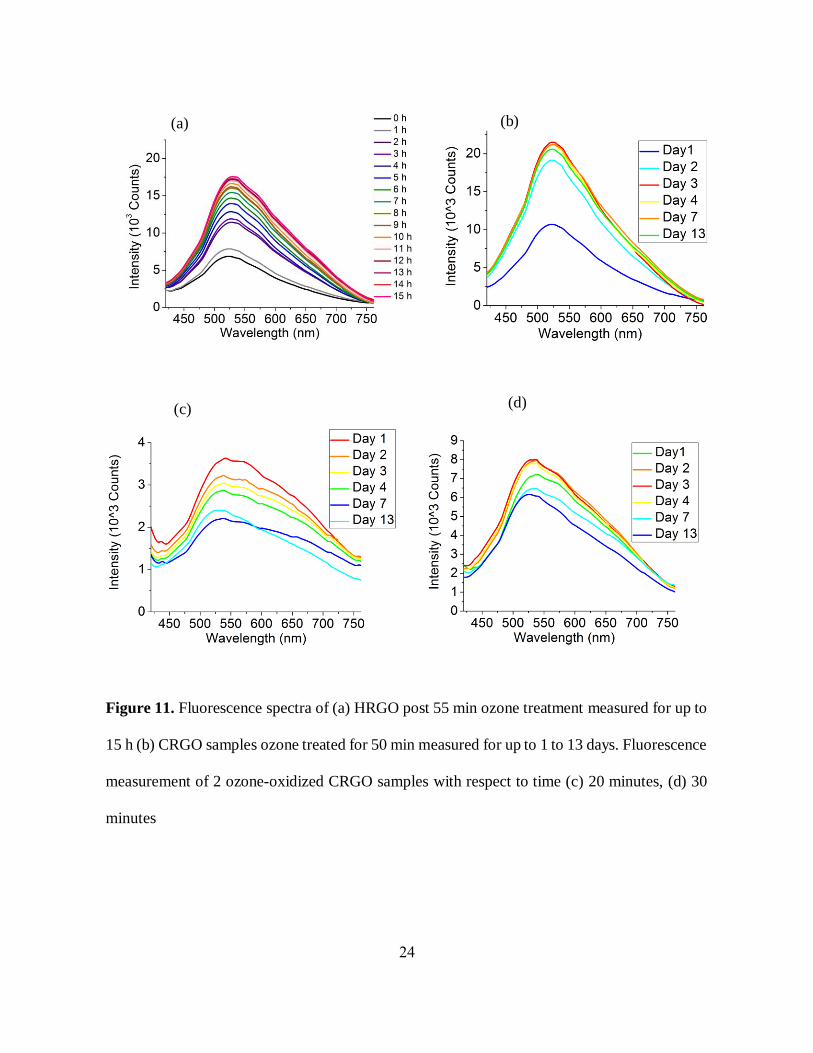
Fluorescence stability of as-produced GO:
It is still arguable whether ozone treatment introduces permanent changes in GO structure. In
order to explore that, we monitored the fluorescence of highly oxidized RGO: HRGO ozone-
treated for 55 minutes (figure 11(a)) for 0 to 15h post treatment and 50 minutes ozone-treated
CRGO (figure 11(b)) over 1 to 13 days. For both cases, there is a gradual increase in emission
intensity with no to negligible red shift in emission maxima potentially indicative of continuing
although slowing down oxidation reaction. We have also observed the fluorescence from mildly
ozone-induced CRGO samples (figure 11(c), (d)) for 1 to 13-day period showing a decrease (figure
11 (c)) or fluctuations (figure 11 (d)) in emission intensity over time with minor random shifting
behavior in fluorescence band maxima. This indistinct/obscure trend and random change in
emission energies can be dictated by several factors such as flake aggregation (especially expected
in under-oxidized more hydrophobic GO), rearrangements of oxygen functionalities over time, de-
functionalization of some emissive species over time for less-oxidized samples.
24
Figure 11. Fluorescence spectra of (a) HRGO post 55 min ozone treatment measured for up to
15 h (b) CRGO samples ozone treated for 50 min measured for up to 1 to 13 days. Fluorescence
measurement of 2 ozone-oxidized CRGO samples with respect to time (c) 20 minutes, (d) 30
minutes
(a) (b)
(c) (d)
25
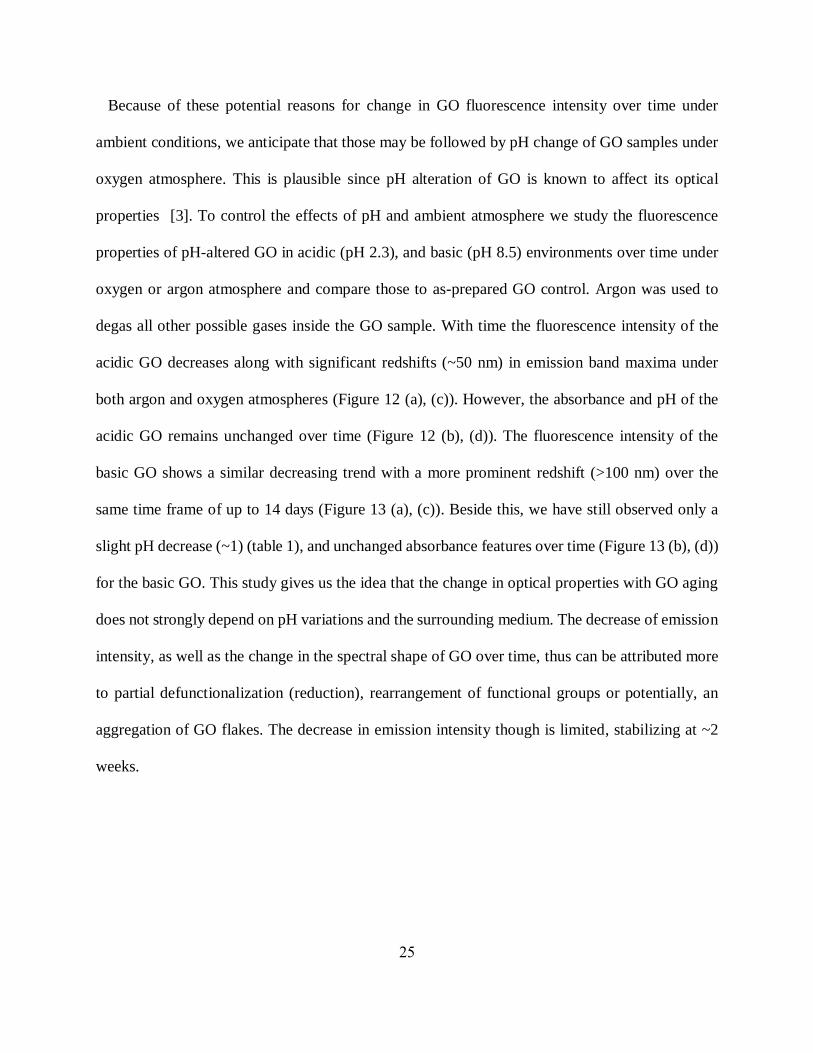
Because of these potential reasons for change in GO fluorescence intensity over time under
ambient conditions, we anticipate that those may be followed by pH change of GO samples under
oxygen atmosphere. This is plausible since pH alteration of GO is known to affect its optical
properties [3]. To control the effects of pH and ambient atmosphere we study the fluorescence
properties of pH-altered GO in acidic (pH 2.3), and basic (pH 8.5) environments over time under
oxygen or argon atmosphere and compare those to as-prepared GO control. Argon was used to
degas all other possible gases inside the GO sample. With time the fluorescence intensity of the
acidic GO decreases along with significant redshifts (~50 nm) in emission band maxima under
both argon and oxygen atmospheres (Figure 12 (a), (c)). However, the absorbance and pH of the
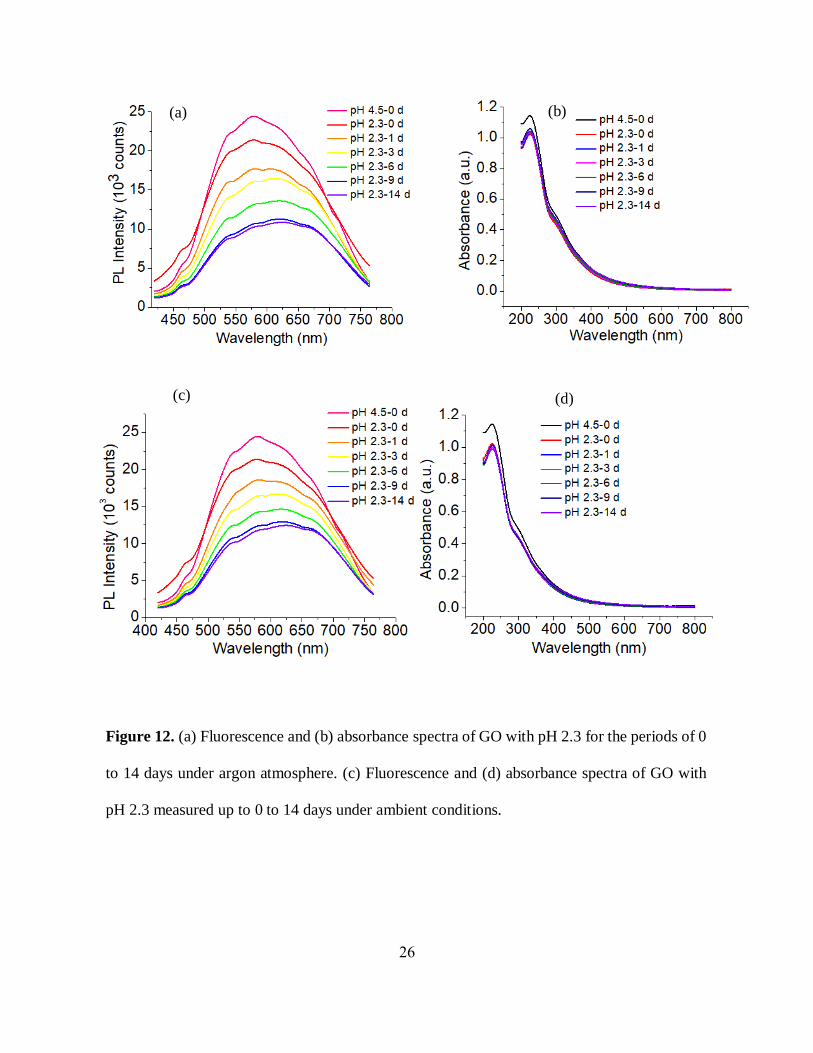
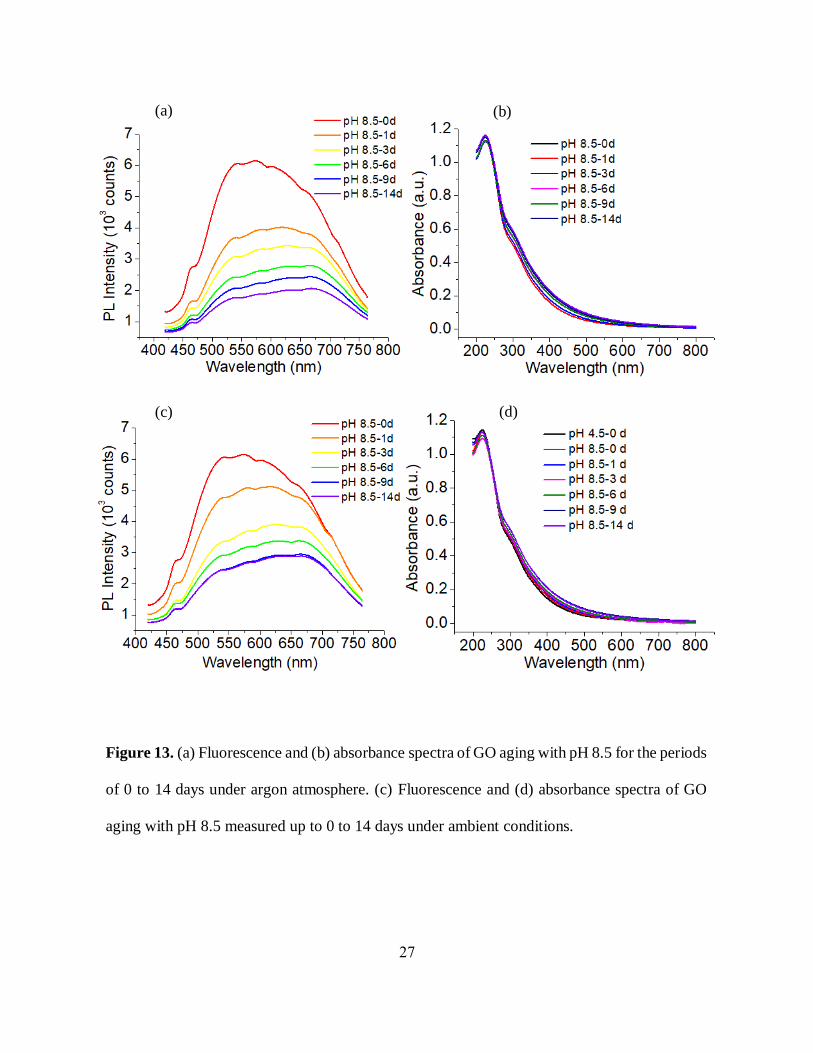
acidic GO remains unchanged over time (Figure 12 (b), (d)). The fluorescence intensity of the
basic GO shows a similar decreasing trend with a more prominent redshift (>100 nm) over the
same time frame of up to 14 days (Figure 13 (a), (c)). Beside this, we have still observed only a
slight pH decrease (~1) (table 1), and unchanged absorbance features over time (Figure 13 (b), (d))
for the basic GO. This study gives us the idea that the change in optical properties with GO aging
does not strongly depend on pH variations and the surrounding medium. The decrease of emission
intensity, as well as the change in the spectral shape of GO over time, thus can be attributed more
to partial defunctionalization (reduction), rearrangement of functional groups or potentially, an
aggregation of GO flakes. The decrease in emission intensity though is limited, stabilizing at ~2
weeks.
26
Figure 12. (a) Fluorescence and (b) absorbance spectra of GO with pH 2.3 for the periods of 0
to 14 days under argon atmosphere. (c) Fluorescence and (d) absorbance spectra of GO with
pH 2.3 measured up to 0 to 14 days under ambient conditions.
(a) (b)
(c) (d)
27
Figure 13. (a) Fluorescence and (b) absorbance spectra of GO aging with pH 8.5 for the periods
of 0 to 14 days under argon atmosphere. (c) Fluorescence and (d) absorbance spectra of GO
aging with pH 8.5 measured up to 0 to 14 days under ambient conditions.
(a) (b)
(c) (d)
28
Reduction of GO optical properties via thermal treatment:
This gradual decrease of fluorescence intensity over time occurs slowly and without a certain
degree of control. For optoelectronics applications it is necessary to be able fully control the
emission intensity being able to either increase or decrease it. So far, we could only controllably
increase GO emission intensity. In order to be able to controllably decrease GO emission intensity
to adjust it to the levels required by the particular application, we explore temperature effects on
fluorescence emission of RGO-derived GO in aqueous suspension. As a result of stepwise
temperature treatment of such GO we observe an irreversible decrease in fluorescence intensity
along with the change in color with a temperature variation from 20⁰C to 90⁰C (figure 14). The
darkened color of the GO similar to that of lightly treated RGO samples suggests its thermal
reduction. As a result of this work, we develop a method for controllably increasing and
diminishing GO emission with timed ozone and thermal treatment. Such control over
optoelectronic properties of the material is highly desirable for multiple device applications [93-
95].
Table 1. Measurement of pH over the periods of 0 to 14 days for as-prepared and pH-altered
ozone treated GO samples. Oxy and Ar in the name of the samples stand for oxygen and argon
atmosphere.
29
2.2.3 Calculation of Quantum Yield (QY):
The efficiency of RGO-derived graphene oxide emission is characterized by its quantum yield. Quantum
yield of the fluorescing material represents a ratio of photons emitted to photons absorbed which can be
inherent to particular materials. The fluorescence quantum yield of GO-derived from HRGO/CRGO
increases with the increase in fluorescence intensity due to prolonged ozone oxidation. A comparative
approach was followed to calculate the quantum yield of GO choosing Coumarin-153 (QY of 47%
in ethanol at 400 nm excitation [96]) as a reference material, a standard with a known QY.
Figure 14. Fluorescence spectra of thermally treated GO measured at every 10⁰ °C
30
We use the following formula to find the QY of GO samples.
In the above expression, Φ𝑟𝑒𝑓 denotes the quantum yield of reference materials, FLI represents
the experimentally measured integrated fluorescence intensity, Abs indicates the absorbance of
materials at the excitation wavelength and 𝜂 is denoted as the refractive index of the solvents. The
refractive indexes of water, and ethanol are considered as 1.33, 1.36. Using this relation, we have
calculated QY of ozone-treated HRGO, and CRGO ranging from 0 to 1.41% (Table-2) depending on the
ozone-treatment time. These values are comparable to previously reported GO quantum yields [44, 91, 97].
Table 2. Quantum yield of HRGO and CRGO for different ozone treatment time
31
2.2.4 Fluorescence lifetime measurements:
In order to develop an understanding of the change in optical transitions in RGO upon ozone
treatment taking us one step closer to the origins of GO emission, we performed time-resolved
fluorescence measurements for 15 to 60 min ozone treated HRGO samples. Apparently GO
emission exhibits progressive increase in fluorescence lifetime with prolonged ozone treatment
(figure 15). The average lifetime for highly-oxidized 60 min ozone-treated HGO (0.50 ns) is more
than eight times higher in magnitude than that of lightly oxidized 15 min ozone-treated HGO (0.06
ns). This trend, generally uncommon for destructive functionalization-related processing, could be
potentially attributed to the decreased probability of fluorescence quenching through non-radiative
processes involving electron transfer to/from the 𝜋 system as it is disrupted by the oxygen addends
[98]. This in turn outlines the importance of the -system in the fluorescence process and the
chemical composition oxygen addends.
32
2.2.5 Detection of the chemical composition of RGO/GO via FTIR spectroscopy:
Drastic changes in absorbance and fluorescence observed during the ozone treatment of RGO
can be only explained by significant structural variations introduced to GO by new oxygen-
containing functional groups. We monitored those alterations via FTIR spectroscopy determining
vibrational transitions of the ozone-induced surface functional groups and bonding composition of
GO. To reduce water background, the sample was dried and was analyzed in a powdered form
using ATR mode of the FTIR. It shows the vibrational transitions of C-O (~1050 𝑐𝑚−1), C-OH
Figure 15. Fluorescence decay curves measured for HRGO ozone-treated for 0 to 60 min. The
arrow shows the increasing trend. IRF: Instrumental Response Function. Inset: a plot of
average fluorescence lifetime of ozone-treated RGO versus treatment time. Error bars are
within the data point size.
33
[99, 100] (~1410 𝑐𝑚−1), and, COOH (~1725 𝑐𝑚−1) oxygen-containing functionalities from
GO whereas untreated HRGO shows none of these aforementioned functionalities (figure 16). It
is noticeable that the transmittance intensity of all these functional groups increases with timed
ozone treatment suggesting the formation of more hydroxyl, carbonyl and carboxyl groups during
the ozone treatment. Either increase in quantities or the arrangements of these particular functional
groups can be deemed responsible for the new optical properties of the ozonated material.
Therefore, such observed increase in COOH and C-O transitions indicates new structures and
defects leading to substantial variations in GO surface morphology through the introduction of
new and/or rearrangement of already existing functional groups. According to the theory
describing the emission originating from localized environments surrounding functional groups
increase in the number of functionalities is expected to enhance GO fluorescence. Alternatively,
the increase in the number of functional groups may create more localized graphitic carbon
environments encircled by addends as the functional groups break down the graphitic lattice into
smaller segments. We explore these possibilities further in our theoretical modeling study.
34
2.3 STRUCTURAL CHARACTERIZATION/ MORPHOLOGICAL STUDY:
2.3.1 Characterization of ozone-treated GO with SEM and AFM:
In order to observe the effect of timed ozone treatment on GO flake structure anticipated in FTIR
measurements, we have utilized SEM (Scanning Electron Microscope) and AFM (Atomic Force
Microscope). SEM study revealed that ozone oxidation forms not only new functional groups
and/or changes their arrangements as determined from FTIR but also introduces progressive GO
flakes scission. The SEM statistical analysis performed on over 200 GO flakes ozone-treated for
10, 20, 30, and 45 minutes (figure 17) resulting in average flake sizes of 519, 441, 344, 272 nm,
respectively. To further verify this result, a qualitative AFM study was performed also showing a
Figure 16. The IR spectra of untreated and ozone-treated HRGO. Main transitions include C-
O stretch (~1050 𝑐𝑚−1), C-OH bend / -O-H deformation (~1410 𝑐𝑚−1), and C=O stretch in
COOH group (~1725 𝑐𝑚−1).
35
decrease in average GO flake sizes (figure 18 (a), (b)) with prolonged ozone-induction suggesting
a scission of GO flakes due to the ozone treatment. Such scission can be explained by
functionalization-induced multiple defect formation that further leads to flake deterioration upon
ultrasonic agitation. Bath ultrasonic agitation on its own does not show appreciable flake size
decrease. Although flake scission may not provide a significant contribution to optical properties
on its own, it verifies that ozone treatment induces substantial functionalization-induced changes
in GO structure that is further translated to the change in its optical properties.
36
Ozone
treatment
time
(min)
Average
flake size
(nm)
SEM images Size distribution of
Graphene Oxide flakes
10 519
20 441
30 344
45 272
Figure 17. Table of ozone-treatment times for HRGO samples and corresponding GO flake
sizes/distribution determined from SEM images.
37
Figure 18. AFM images of (a) 20 minutes and (b) 45 minutes ozone treated GO showing the
decrease of GO flakes size qualitatively with the increase of ozone treatment time.
(a)
(b)
38
Study of GO fluorescence origins by theoretical modeling:
2.4 HYPERCHEM PM3 MODELING
We utilized HyperChem software to model the gap energies and the electrostatic potentials of
two different GO configurations. These configurations represent two major theories of GO
emission: arising from 1. localized electronic environments surrounding individual functional
groups. 2. localized electronic environments in the functional-groups-surrounded regions of sp2
graphitic carbon. Based on the first theory we propose the first model which includes four oxygen-
containing functional groups such as epoxy, C=O, C-OH, and COOH randomly distributed on a
graphitic carbon sheet (figure 19(a)). For the modeling, these particular four functional groups
were chosen based on the FTIR results showing those as most abundant choices (figure 16).
Electrostatic potential and energy structure of the modeled fragments were calculated using the
semi-empirical PM3 approach in the HyperChem software. Calculation yielded localized negative
electrostatic potential around several functional groups. Such localization can be a potential source
of band splitting in GO leading to the formation of band gaps, thus suggesting those localized
environments as potential fluorescence centers [3]. The bandgap calculated for this model was
2.17 eV, which is compatible with 2.37 eV optical gap calculated from experimental fluorescence
spectra in figure 8(a). The second model represents a graphene fragment surrounded by multiple
functional groups (C=O, C-OH, and O=C-OH) at the edges of this sp2 carbon region (figure 19(b)).
The size of the graphitic island was calculated from the relation proposed by an alternative
theoretical approach of Kozawa et al. [34] that provides a relation between emission energies and
sizes of carbon nanodiscs. This yielded 1.51 nm as a size of statistically most emissive graphitic
islands in our sample. In our model, such single island was surrounded by twelve functional groups
39
encircling it as the simulation has shown with multiple regions of negative electrostatic potential
(figure 19(b)). This represents a system that is electronically confined by electrostatic potential of
the functional groups. The band gap of that system was calculated as 2.37 eV which exactly mimics
experimentally observed optical gap corresponding to the maximum in emission intensity. Even
though this model provides a closer approximation for the experimentally observed emission in
ozone-treated RGO, we so far cannot fully rule out the possibility of emission from localized
electronic environments surrounding functional groups.
Figure 19. (a) Computation of electrostatic potential of graphene sheet fragment with 4
randomly distributed epoxy, C=O, C-OH and O=C-OH groups. (b) Computation of
electrostatic potential of graphene sheet fragment with C=O, C-OH and O=C-OH groups
surrounding the region of graphitic carbon. The white, black and red atoms represent hydrogen,
carbon and oxygen respectively for both models.
(a) (b)
40
In this chapter, we have shown that production of graphene oxide from reduced graphene oxide
and modification of fluorescence intensity, quantum yield, fluorescence lifetime of GO can be
achieved utilizing controlled ozone treatment. Also, GO aging study was performed under argon
and oxygen atmosphere resulting in a gradual decrease in fluorescence intensity to a particular
level potentially indicating defunctionalization/rearrangement of functional groups or aggregation
of GO flakes that may occur over time.
41
CHAPTER 3
TUNING THE OPTICAL BANDGAP OF GO BY TIMED OZONE
TREATMENT
3.1 Methods
3.1.1 Sample preparation:
We used single-layer graphene oxide (GO) as a starting material to produce ozone-oxidized
graphene oxide (Oz-GO). The GO starting material for ozone oxidation was acquired
commercially from GooGraphene. GO suspensions were prepared by dispersing 2 mg of GO in 15
ml of deionized (DI) water based on our previous study [45]. GO materials were processed using
direct probe ultrasonic treatment for 30 minutes at 3 W prior to ozone treatment to disperse the
flakes in water producing dark yellow/light brown-colored suspensions. We used Enaly (Model:
5000BF-1) ozone generator to produce ozone which can supply maximum ozone concertation of
3 g/L. GO samples were ozone-oxidized at 40% of maximum ozone level with ~1.2 g/L ozone
concentrations. In order to ensure the disaggregation of GO flakes and proper ozone accessibility
to GO sheet prolonged ozone treatment was introduced to GO in aqueous suspension under
ultrasonic bath agitation (figure 6). This ozone treatment set up offers more controlled ozonation,
much simpler handling and more effective yield of oz-GO compared to previous arrangements
[58]. The ozone processing was carried out for the periods of 0 to 35 minutes in 5-minute time
intervals to achieve desired optical properties simply with the variation of ozone treatment time.
Fluorescence and absorbance of ozone-treated GO were measured for every time point.
42
3.1.2 Characterization of GO samples:
SEM (Scanning Electron Microscope: JEOL, JSM-7100F) analysis of GO dried on a carbon tape
qualitatively shows considerable amounts of single layer GO flakes from untreated GO verifying
the quality of our starting material and confirming AFM analysis results provided by the vendor
(Goographene) showing 99% monolayer ratio with 0.7-1.2 nm in thickness for each layer of GO
[101]. We also analyzed GO flakes spin-coated on silicon substrates by semi-contact mode AFM
(Atomic Force Microscope: NT-MDT nanosolver) to verify commercial characterization.
On a more microscopic level we studied sp² graphitic carbon clusters size on Oz-GO surface via
TEM (Transmission Electron Microscope: JEOL-JEM2100) operating at 200 kV. In order to get
accurate statistics, we considered more than 25 images with over 100 clusters allowing us to
calculate average graphitic carbon cluster sizes (diameters) for 0, 10, 15 and 30 min ozone-treated
GO. ImageJ program was used to outline (inscribe) the graphitic cluster size boundaries to
determine their size. TEM samples were prepared from a drop of aqueous untreated GO and Oz-
GO followed by drying on the carbon-coated 200-mesh copper grid under ambient conditions.
3.1.3 Optical measurements of GO samples:
Fluorescence spectra of Oz-GO were measured using SPEX NanoLog, Horiba Scientific
spectrofluorometer in the regions of 420 to 762 nm at 400 nm excitation based on previous work
[45]. PLE (Photoluminescence excitation/emission) maps of Oz-GO were recorded with the same
emission range considering excitation scanning range from 376 to 476 nm with 2 nm increment.
43
Absorbance was recorded in the range of 200 to 800 nm with Agilent Technologies (Cary 60 UV-
Vis) absorption spectrometer.
In order to detect the vibrational transitions of oxygen-containing functional groups and their
relative abundance in GO/Oz-GO, we utilized the ATR mode of Thermo Nicolet Nexus, 670, FTIR
(Fourier Transformed Infrared Spectroscopy). Samples for FTIR were freeze-dried using
Labconco, FreeZone 4.5 freeze-dryer.
3.2 EXPERIMENTAL RESULTS AND DISCUSSIONS
3.2.1 Absorbance
By following the previous work [45], we have explored ozone treatment of commercially
available GO in this experiment. Aqueous suspensions of GO were also subjected to ozone
treatment under ultrasonic bath agitation for the periods of 0 to 35 minutes in 5-minute time
intervals. After prolonged ozone-oxidation, Oz-GO (ozone-oxidized GO) samples became
somewhat more transparent (Figure 20(a)) but did not experience significant color change. Also,
the change observed in UV – visible absorption spectra (Figure 20(b)) of Oz-GO was not
significant. All the ozone treated single-layer GO samples show similar absorption peaks at ~ 228
nm corresponding to 𝜋 → 𝜋∗ transition of sp² carbon [24, 42, 92, 102] with a negligible 1-2 nm
shift. A shoulder at ~ 296 nm was attributed to 𝑛 → 𝜋∗ transition in C=O bonds of oxygen-
containing functional groups [42, 91, 92, 102].
44
Figure 20. (a) Pictures of the ozone-oxidized GO samples with respective oxidization time (0,
5, 10, 15, 20, 25, 30, 35 minutes) (b) Absorption spectra of 0 to 35 min ozone-treated GO
(a)
(b)
45
This light change in absorption spectra among untreated and ozone-treated GO indicates that
dominant absorbing species on GO sheet at that point experience only limited alteration with timed
ozone-oxidation as opposed to during ozonation of RGO into GO described in the previous
chapter.
3.2.2 Fluorescence:
To this point, we were not able to achieve significant changes in the emission energies of RGO
converted to GO via controlled oxidation only observing spectral shift occurring naturally several
days after treatment. Thus, we still seek a way to controllably alter the band gap of GO for
optoelectronics applications.
Upon subjecting commercially available GO that does exhibit broad emission in red/near-IR
representing a set of optical transitions to ozone treatment in our setup, we now see a change in
the emission band shifted toward blue as well as changes in emission intensity (figure 21(a)) with
the treatment. The fluorescence intensity in the deep red region increases gradually with the 0 to
25 min ozone treatment; additionally, a significant blue shift up to 100 nm from deep red to green
is observed with prolonged ozone exposure (0 to 35 min). This change in fluorescence features
suggests a functionalization-induced increase in GO optical band gap or the energy conversion of
the emissive species with controlled ozone-oxidation. Also, prolonged ozone treatment causes the
reduction of spectral width indicating narrower size distribution of the emissive species, as broad
emissive features of GO are often attributed to a wide range of emissive cluster sizes [24, 34, 103].
To have a clearer picture regarding the relation among change in emission band, fluorescence
intensity, and ozone treatment time a separate graph was plotted outlining fluorescence intensity
and changes of emission band during the treatment (figure 21(b)).
46
Figure 21. (a) Fluorescence spectra of 0 to 35 min ozone-treated GO (b) Ozone treated time vs.
fluorescence intensity vs. change in the emission band maxima for 0 to 35 min ozone treated
sample.
(a)
(b)
47
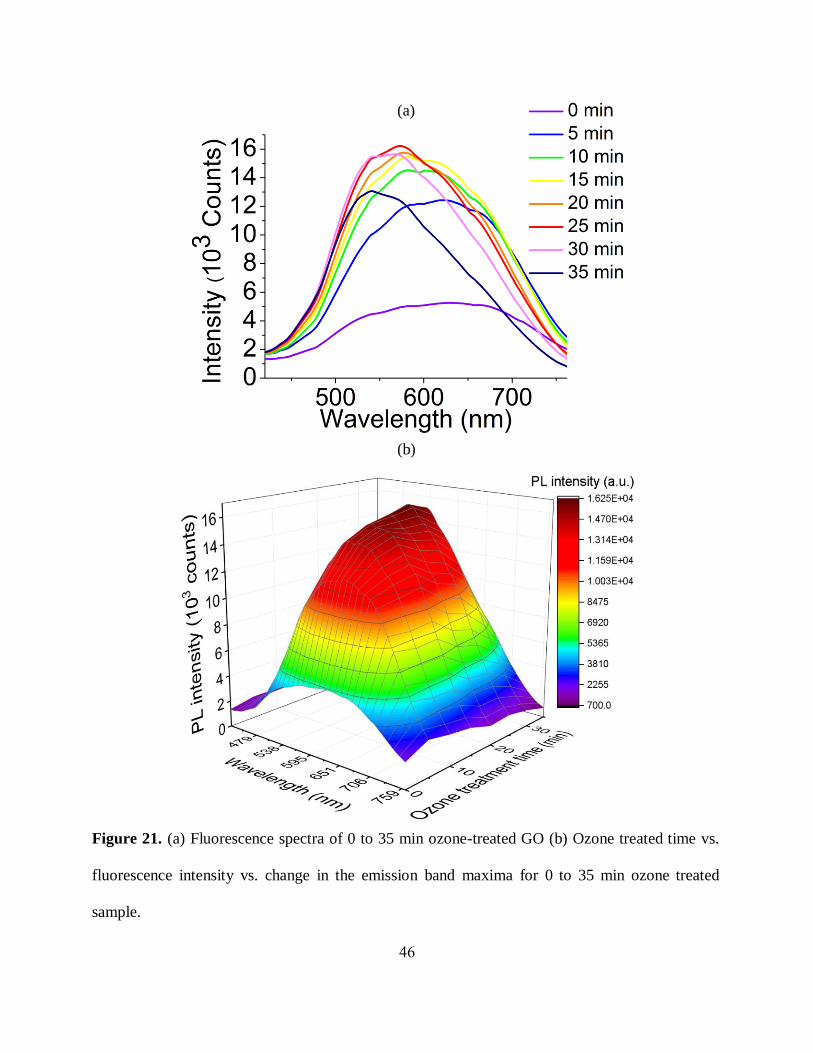
We anticipate that the observed emission changes can be derived from the oxidation-induced
structural alterations on GO platform. However, to confirm that we have to monitor if not only
emission, but also excitation exhibits substantial changes (as absorbance was almost unchanged
(figure 20(b)). To assess both excitation and emission variations, we conducted
photoluminescence-emission/excitation (PLE) experiments in which both the excitation and
emission are scanned. These PLE contour maps show an increase in emission intensity along with
blue-shifted emission-excitation maximum position due to stepwise ozone treatment (figure 22).
Even though we have observed only slight changes in absorbance spectra, the significant variations
in excitation-fluorescence features with timed ozone treatment suggest a structural modification
of fluorescing species without a complete transformation of the major absorbing sp2 platform.
Thus, based on these noticeable spectral changes, we suggest that ozone treatment may change the
amount, type, and/or the arrangement of functional groups in GO, affecting its optoelectronic
properties.
Figure 22(a-h) represents the PLE contour graphs of untreated, 5, 10, 15, 20, 25, 30, and 35
minutes ozone-treated samples, respectively. With stepwise ozone treatment, both excitation and
emission maxima experience a gradual trend of blue shifts, except for the 35 min-treated sample,
optical changes which could be attributed to overoxidation-induced deterioration of GO sheets
[45].
48
(a) (b)
Figure 22. PLE maps of (a) untreated, (b) 5, (c) 10, (d) 15, (e) 20, (f) 25, (g) 30, and (h) 35
min ozone treated GO samples. X and Y axis represent the emission and excitation wavelength,
respectively. The color bar represents the emission intensity.
(h)
(c) (d)
(e) (f)
(g)
49
We can explain the ozone-induced variation in GO optical properties based on several reported
theoretical models. As discussed in the previous chapter, two major scenarios are considered, the
first one is that GO fluorescence can potentially originate from localized electronic environment
states surrounding particular oxygen-containing functional groups. This functional groups-
centered electronic confinement may be an origin of the band gap in GO [3, 24, 35, 36]. However
this theory can only explain the variations in emission intensity without justifying the blue shift
that has been observed in our study with stepwise ozone treatment. The second theory considers
GO emission to be derived from quantum confined graphitic sp2 carbon islands encircled by the
oxygen-containing addends. Such quantum confined domains may produce a band gap in GO
which is expected to have an inversely proportional relationship with graphitic carbon cluster sizes
[34, 40, 104]. Within the framework of that second theory, ozone treatment-induced decreases in
spectral width and oxidation-induced blue shifts (figure 21(a)) can be explained by the band gap
increase while larger graphitic domains get broken down into smaller fragments with the
introduction of new functional groups (figure 23). Functional groups would physically split the
domains and make them smaller. In analogy with the particle in a box, the level splitting in these
domains is expected to increase providing higher local band gaps and emission energies. This idea
is confirmed by the works on an opposite process: reduction. With strong reduction [42, 105],
redshifts in emission are observed due to the agglomeration of the small graphitic regions into
larger ones: a reverse process to oxidation-induced sp2 domain shrinking proposed in the present
work.
50
Figure 23. Schematic of graphitic carbon islands due to oxidation and over-oxidation of
Graphene Oxide via ozone treatment showing larger graphitic domains get broken down into
smaller fragments due to prolonged ozone treatment.
Over-oxidation of GO
51
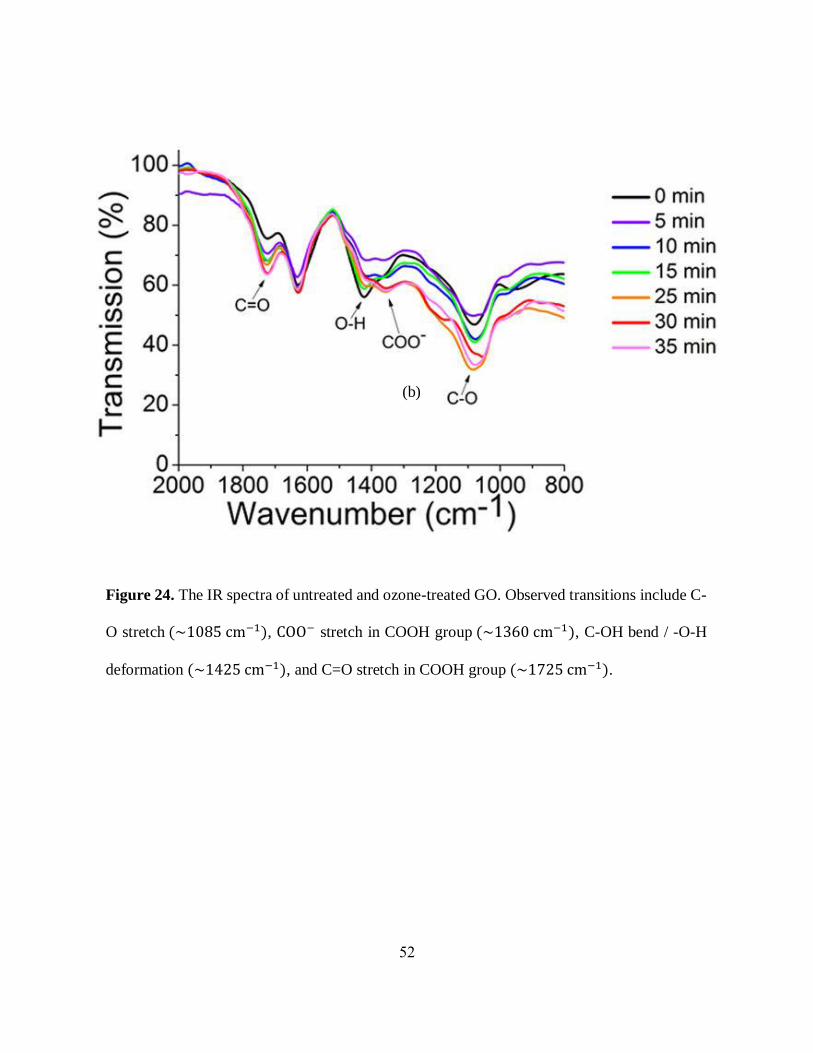
3.2.3 Detection of the chemical composition of GO/ Oz-GO via FTIR spectroscopy:
As we expect that ozone treatment induces significant structural changes in GO we monitored
those alterations via FTIR spectroscopy determining vibrational transitions of the ozone-induced
surface functional groups of Oz-GO. The sample was again dried and analyzed in an ATR mode
of the FTIR to reduce water background. Untreated GO already exhibits absorption bands of
stretching/bending vibrations at ~1085, ~1425, ~1725 cm-1 (figure 24) that can be attributed to the
C-O stretch, C-OH bend / -O-H deformation and a weak C=O stretch of COOH group,
respectively, corresponding to the oxygen-containing addends which split the sp² carbon matrix
into individualized graphitic islands. It is noticeable that due to stepwise ozone-oxidation,
transmittance intensity of vibrational transitions increases for C-O moieties (55 → 45%), C=O
stretch of carboxylic groups (75 → 65%) and COO- peak (70 → 60%) along with a decrease in
bands corresponding to O-H groups. The presence of O-H groups is expected at any point of sp3-
hybridized carbon, but the carboxylic groups can only be present either at the edges or at large
substantial defects at of the internal lattice. Therefore, observed increase in COOH and C-O
transitions suggests the formation of larger defects forming new substructures on GO platform.
The substantial changes in functional group content coupled with internal defect formation points
out to potential splitting of sp² carbon matrix into the smaller islands of graphitic carbon. This
alters the very GO structure and can be assesed via detailed structural characterization methods.
52
Figure 24. The IR spectra of untreated and ozone-treated GO. Observed transitions include C-
O stretch (~1085 cm−1), COO− stretch in COOH group (~1360 cm−1), C-OH bend / -O-H
deformation (~1425 cm−1), and C=O stretch in COOH group (~1725 cm−1).
(b)
53
3.3 STRUCTURAL CHARACTERIZATION/ MORPHOLOGICAL
STUDY:
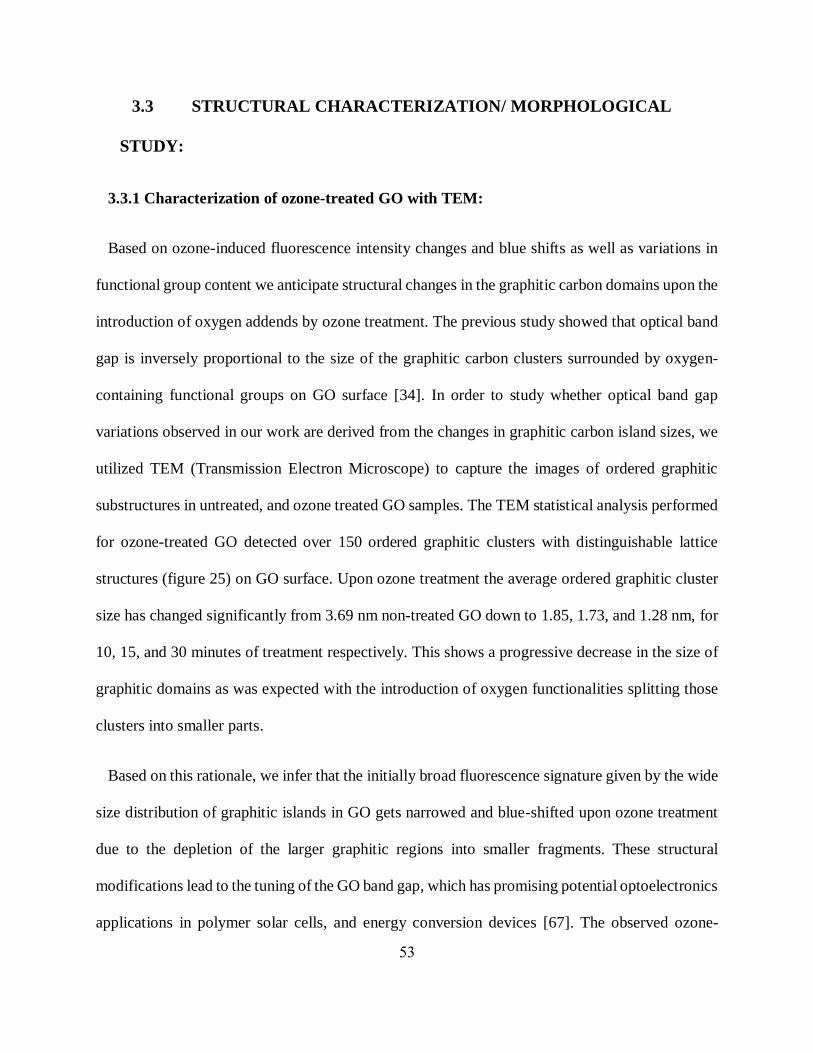
3.3.1 Characterization of ozone-treated GO with TEM:
Based on ozone-induced fluorescence intensity changes and blue shifts as well as variations in
functional group content we anticipate structural changes in the graphitic carbon domains upon the
introduction of oxygen addends by ozone treatment. The previous study showed that optical band
gap is inversely proportional to the size of the graphitic carbon clusters surrounded by oxygen-
containing functional groups on GO surface [34]. In order to study whether optical band gap
variations observed in our work are derived from the changes in graphitic carbon island sizes, we
utilized TEM (Transmission Electron Microscope) to capture the images of ordered graphitic
substructures in untreated, and ozone treated GO samples. The TEM statistical analysis performed
for ozone-treated GO detected over 150 ordered graphitic clusters with distinguishable lattice
structures (figure 25) on GO surface. Upon ozone treatment the average ordered graphitic cluster
size has changed significantly from 3.69 nm non-treated GO down to 1.85, 1.73, and 1.28 nm, for
10, 15, and 30 minutes of treatment respectively. This shows a progressive decrease in the size of
graphitic domains as was expected with the introduction of oxygen functionalities splitting those
clusters into smaller parts.
Based on this rationale, we infer that the initially broad fluorescence signature given by the wide
size distribution of graphitic islands in GO gets narrowed and blue-shifted upon ozone treatment
due to the depletion of the larger graphitic regions into smaller fragments. These structural
modifications lead to the tuning of the GO band gap, which has promising potential optoelectronics
applications in polymer solar cells, and energy conversion devices [67]. The observed ozone-
54
induced reduction in ordered cluster sizes on GO surface also supports the theory of GO emission
based on localized sp2 clusters of graphitic carbon.
Figure 25. TEM images for (a) 0 min (b) 10 min (c) 15 min & (d) 30 min ozone treated samples.
The estimated average graphitic carbon cluster sizes for these samples are 3.69, 1.85, 1.73, and
1.28 nm, respectively. Representative regions are circled in red, however all ordered sp2 regions
were considered in the statistics.
55
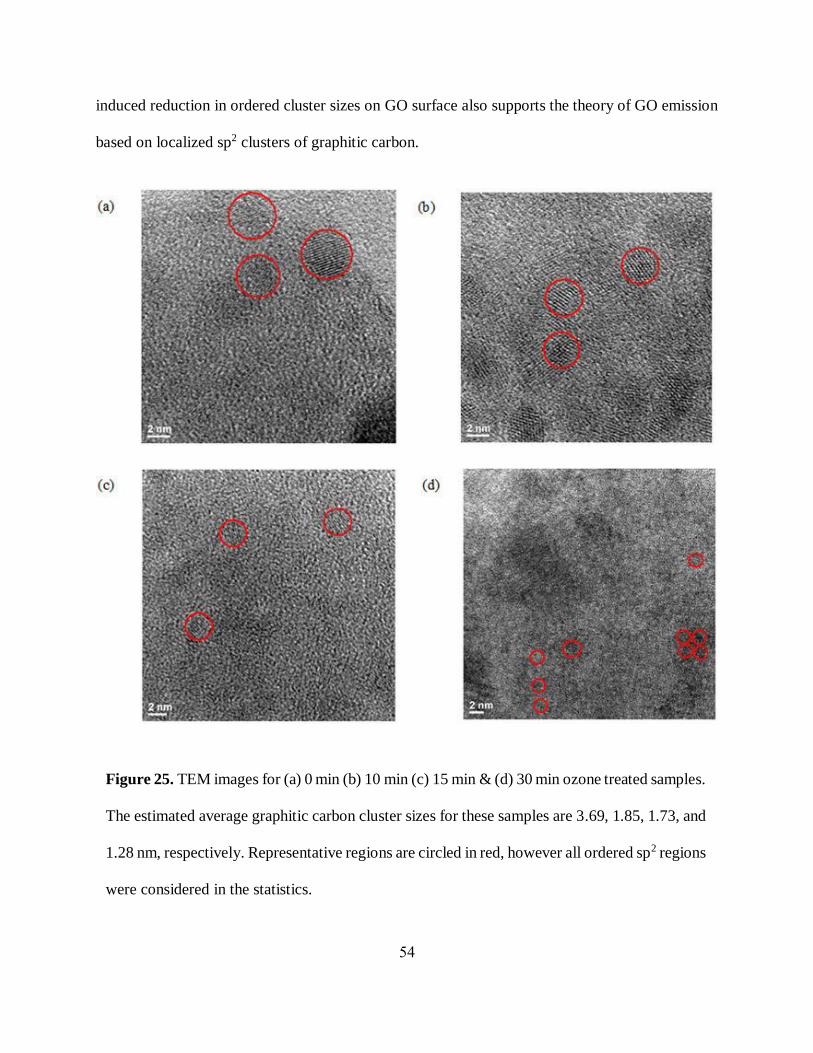
3.4 Calculation of Quantum Yield (QY):
The fluorescence quantum yield of Oz-GO produced from commercially available GO varies with the
increase in fluorescence intensity due to ozone oxidation. Based on the comparative method used in our
previous work [45], we have calculated the QY of ozone-treated GO as ranging from 0.24 to 0.49% (Table-
3), depending on the ozone-treatment time. These values are comparable to previously reported GO
quantum yields [44, 91, 97]. At the highest ozone-treatment time quantum yield is decreased due to
overoxidation as also noted above for fluorescence.
Table 3. Quantum yield of untreated and timed ozone treated GO
56
THEORETICAL STUDY PREDICTING GO FLUORESCENCE MECHANISM
AND OPTICAL BANDGAP VARIATIONS DUE TO OZONE TREATMENT
3.5 Semi-empirical PM3 modeling:
Since our work suggests that the alteration of the optical band gap of ozone-treated GO may be
related to the decrease in average graphitic carbon island sizes [106], we utilized theoretical
HyperChem modeling to verify this prediction with electronic structure calculation. Based on
emission shifts observed experimentally and ozone-induced graphitic sp2 island decomposition we
infer that GO fluorescence is best described by the model of GO emission originating from
confined sp2 graphitic islands.
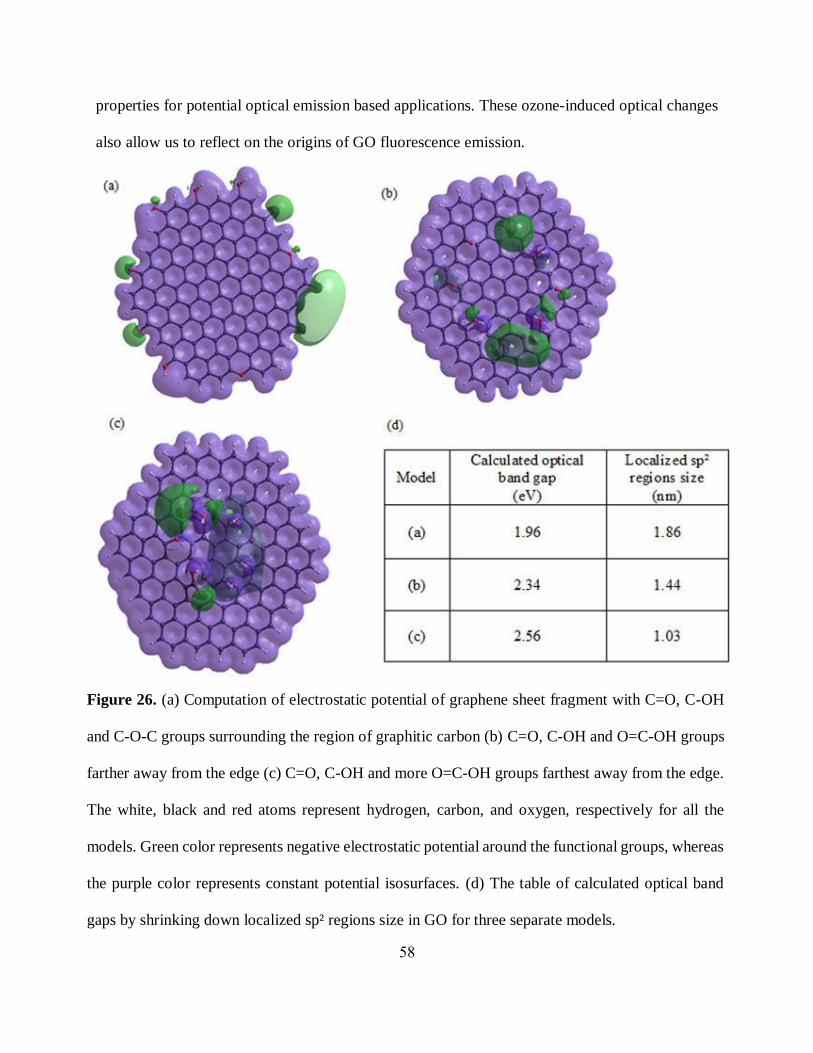
We modeled oxidation-induced changes in the size of sp2 graphitic islands affecting GO optical
response. In order to do so, we introduced three HyperChem models of a graphitic carbon sheet
with regions of sp² carbon surrounded by functional groups and calculated their electronic
configuration using a PM3 semi-empirical approach as one of the standard modeling routines in
HyperChem software. PM3 was chosen as a middle ground due to higher speed than first principle
or DFT (density functional theory) calculations, but still providing a more rigorous approach than
other semi-empirical methods used in this chemical modeling software. In this work we modeled
several sizes of graphitic islands surrounded by functional groups. In each consecutive model the
size of the graphitic island was decreased by the introduction of additional COOH groups (as the
increase in COOH group content was one of the most evident changes in FTIR spectra). All three
models show the regions of negative electrostatic potential surrounding the functional groups and
encircling the sp2 carbon islands (figure 26 (a), (b), (c)) as the islands get smaller in size. This
confined configuration serves to support the graphitic island-related theory of GO emission. The
57
band gaps of the modeled fragments exhibit a monotonic increase with the diminishing size of the
graphitic islands. This calculated trend (Figure 26(d)) akin to theoretical results of Kozawa et al.
[34] for plain carbon nanodiscs directly follows experimental blue shifts in GO emission
introduced by ozone treatment. The agreement of the theoretical model describing the decrease in
graphitic island size by the introduction of new functional groups with experimental results
supports the idea of ozone-induced size alteration of sp2 domains that are responsible for
fluorescence emission in GO. This model may also explain redshifts observed in lightly oxidized
GO after several days post-treatment in the GO aging study as a partial reversal of the oxidation
process in solution and loss of oxygen functionalities leading to the increase of the size, and
broadening of the distribution of graphitic islands. Although models used in this work are
simplistic and neglect the excitonic contribution [34], in conjunction with experimental data, they
provide grounds to explain emission in GO and its modulation due to ozone-induced structural
alteration. Because of the model structural size based computational limitation with the
Hyperchem software we could not simulate the model with multiple clusters or a cluster which is
greater than 2 nm in size. This restriction did not allow us to explore the model with a suitable
graphene oxide flake-like structure (~ 250-600 nm) which may contain tens or even hundreds of
emissive clusters. Therefore, it is also possible that the observed redistribution/shift of the
maximum position of emission band along with other potential optical transitions toward blue
may affect by the change in GO flake size with timed ozone treatment as with flake decomposition
some of the emissive clusters may be lost.
In this chapter, we have observed that timed ozone treatment not only enhances the emission
intensity but also increases the optical bandgap of GO which gives us control over the GO optical
58
properties for potential optical emission based applications. These ozone-induced optical changes
also allow us to reflect on the origins of GO fluorescence emission.
Figure 26. (a) Computation of electrostatic potential of graphene sheet fragment with C=O, C-OH
and C-O-C groups surrounding the region of graphitic carbon (b) C=O, C-OH and O=C-OH groups
farther away from the edge (c) C=O, C-OH and more O=C-OH groups farthest away from the edge.
The white, black and red atoms represent hydrogen, carbon, and oxygen, respectively for all the
models. Green color represents negative electrostatic potential around the functional groups, whereas
the purple color represents constant potential isosurfaces. (d) The table of calculated optical band
gaps by shrinking down localized sp² regions size in GO for three separate models.
59
CHAPTER 4
4.1 CONCLUSION
In this work, we have developed an ozone treatment route for controllable oxidation of reduced
graphene oxide into GO and single-layer graphene oxide into oz-GO to adjust both GO emission
intensity and the emission wavelength (GO optical band gap). We observed that simple ozone
treatment of RGO yields a substantial increase in solubility and concomitant alteration of RGO
optical properties: absorption bleaching in the visible and the appearance of the broad fluorescence
emission centered in green. The fluorescence intensity and position of the absorption transitions
can be controlled by adjusting the degree of ozone treatment or reversed via thermal processing.
The progressive enhancement of IR vibrational transitions with ozonation suggests that the
functional groups are introduced in the ozone treatment facilitating the conversion of RGO into
GO. This also points to a prominent influence of functional groups on the ozone-induced new
optical properties. Hyperchem semi-empirical PM3 models help to elucidate the origin of emission
in ozone-treated RGO as potentially arising from the localized islands of 𝑠𝑝2 graphitic carbon with
a possible contribution from electronic environments surrounding functional groups. This accounts
for experimentally observed band gaps, increase in GO fluorescence intensity with ozonation, mild
blue shifts in the emission of ozone-treated RGO and potentially, the red shifting behavior for
overoxidized samples post treatment.
The control over GO optical band gap and hence the emission wavelength was achieved in our
further work by the ozone treatment of single layer GO. Although absorption features show little
change with continuous ozone treatment, a gradual increase in fluorescence intensity and
60
substantial blue-shifted emission observed in linear fluorescence spectra and PLE contour graphs
suggest an alteration of the band gap in GO. This opens a route for controllable adjustment of
RGO/ GO optical properties for particular optoelectronic applications. We believe that the
observed changes in GO optical properties are due to the structural modifications introduced via
the addition and/or rearrangement of functional groups, alteration of GO flakes size, variations in
graphitic carbon cluster sizes with timed ozone treatment which can be partially explained within
the framework of GO emission model attributing fluorescence to confined graphitic islands.
We expect the addition of new oxygen addends to split the regions of graphitic carbon into
smaller segments, thus increasing a confinement-defined band gap. Semi-empirical modeling of
Oz-GO flakes with different graphitic island sizes describes this scenario providing band gap
values that follow the trend of experimental emission energies. TEM statistical analysis further
support the decrease of graphitic cluster size with ozone treatment. Thus, a controllable variation
of GO optoelectronic properties observed in this work helps elucidate the mechanism of GO
emission and also warrants a capability of adjusting GO optical response to fit multiple
optoelectronics applications. Modifiable electronic properties are critical for the use of GO as a
versatile material in liquid crystal displays [93], broadband optical limiters [23] and biosensors
[61], etc. facilitating the advancement of photonics and optoelectronics.
61
4.2 QUESTIONS ANSWERED BY THIS STUDY
i. Can we produce GO with control over its emission intensity (increasing and decreasing
it)?
Yes, we have produced graphene oxide from reduced graphene oxide via a straight-
forward, cost-efficient method of ozone treatment. The emission intensity of initially non-
emissive RGO is controlled progressively by the time of the ozone treatment. We can also
controllably decrease the GO emission intensity via thermal treatment within the range of
20 to 90°C.
ii. How stable is the fluorescence of as-produced GO?
We have performed a comprehensive study to answer this question. For highly oxidized
GO samples, fluorescence intensity increases over time potentially indicating further
oxidation in solution or rearrangement of functional groups optimizing the emission. For
mildly oxidized GO the fluorescence intensity decreases over time along with a redshift in
fluorescence band maxima under ambient conditions suggesting defunctionalization of
some emissive species with GO aging or aggregation of GO flakes. Also, both acidic and
basic pH GO samples were considered to check the variations in fluorescence, absorbance,
and pH over time under oxygen/argon atmospheric conditions. All those samples showed
similar decreasing emission intensity trend over time. However, the emission only
decreased to a certain level stabilizing at ~2 weeks.
62
iii. Can we tune the optical band of GO?
We have introduced stepwise ozone treatment in which the optical band gap (emission
energies) of GO can be modified utilizing controlled ozone treatment.
iv. Can we predict GO fluorescence mechanism and trends in emission observed in
this work by theoretical modeling?
The origin of GO emission is potentially attributed either to 1. the quantum
confinement-induced bandgap created by graphitic domains surrounded by oxygen-
containing functional groups or 2. localized states at the functional groups. We model the
trends in GO emission observed in this work for both scenarios using semi-empirical
HyperChem modeling. The agreement of ozone-induced experimental spectral shifts
with our models based on the first theory allows us to explore and elucidate the origin of
GO emission.
63
4.3 FUTURE WORKS DIRECTION:
In this study, we have investigated that timed ozone treatment can control the fluorescence
properties of GO. GO fluorescence spectra show emission maxima in green with a tail extended
up to the NIR region. Besides all other optoelectronics applications, this bright visible emission
and large platform of GO has the potential of using it in molecular therapeutics as in-vitro imaging
and drug delivery agent. However, there is a possibility that the dim emission in NIR region will
not be substantial to do in-vivo imaging. NIR light penetrates through the layers of biological tissue
and thus NIR imaging capabilities are critical for in-vivo fluorescence studies. Therefore, we will
seek for lower-dimensional GO quantum dots with NIR emission or an enhancement in GO NIR
fluorescence intensity to serve this purpose. In that case, we have to find a way to enhance the
emission and quantum yield of GO in NIR region along with their emission stability over time.
We prepare GO samples and conduct all the measurements in aqueous suspensions only but did
not explore the optical properties of RGO in solid form as no effect to ozone treatment was
observed. We will further examine those in our future studies. Also, exploration of some
applications is essential utilizing ozone-treated GO such as fabrication of LEDs, solar cells,
photodetectors; using it as a bioimaging probe, etc. We will utilize our GO materials for fabrication
of these devices
Other graphene-based materials, e.g., graphene quantum dots, carbon nanotubes, etc. will
be explored to study/ enhance their optical properties and investigate their potential optoelectronics
and bioimaging applications.
64
REFERENCES:
1. Castro Neto, A.H., et al., The electronic properties of graphene. Reviews of
Modern Physics, 2009. 81(1): p. 109-162.
2. Boukhvalov, D.W., M.I. Katsnelson, and A.I. Lichtenstein, Hydrogen on graphene:
Electronic structure, total energy, structural distortions and magnetism from first-
principles calculations. Physical Review B, 2008. 77(3): p. 035427.
3. Galande, C., et al., Quasi-Molecular Fluorescence from Graphene Oxide.
Scientific Reports, 2011. 1: p. 85.
4. Geim, A.K., Graphene: Status and Prospects. Science, 2009. 324(5934): p. 1530.
5. Okigawa, Y., et al., Electrical characterization of graphene films synthesized by
low-temperature microwave plasma chemical vapor deposition. Applied Physics Letters,
2013. 103(15): p. 153106.
6. Ma, X. and H. Zhang, Fabrication of graphene films with high transparent
conducting characteristics. Nanoscale Research Letters, 2013. 8(1): p. 440.
7. Geim, A.K. and K.S. Novoselov, The rise of graphene. Nature Materials, 2007. 6:
p. 183.
8. Wassei, J.K. and R.B. Kaner, Graphene, a promising transparent conductor.
Materials Today, 2010. 13(3): p. 52-59.
9. Slonczewski, J.C. and P.R. Weiss, Band Structure of Graphite. Physical Review,
1958. 109(2): p. 272-279.
10. Novoselov, K., et al., Electric field effect in atomically thin carbon films. Science,
2004. 306.
65
11. Li, X., et al., Highly conducting graphene sheets and Langmuir–Blodgett films.
Nature Nanotechnology, 2008. 3: p. 538.
12. Paton, K.R., et al., Scalable production of large quantities of defect-free few-layer
graphene by shear exfoliation in liquids. Nature Materials, 2014. 13: p. 624.
13. Somani, P.R., S.P. Somani, and M. Umeno, Planer nano-graphenes from camphor
by CVD. Chemical Physics Letters, 2006. 430(1): p. 56-59.
14. Wang, J., et al., Synthesis of carbon nanosheets by inductively coupled radio-
frequency plasma enhanced chemical vapor deposition. Carbon, 2004. 42(14): p. 2867-
2872.
15. Hass, J., W.A.d. Heer, and E.H. Conrad, The growth and morphology of epitaxial
multilayer graphene. Journal of Physics: Condensed Matter, 2008. 20(32): p. 323202.
16. Subrahmanyam, K.S., et al., Simple Method of Preparing Graphene Flakes by an
Arc-Discharge Method. The Journal of Physical Chemistry C, 2009. 113(11): p. 4257-
4259.
17. Eda, G., G. Fanchini, and M. Chhowalla, Large-area ultrathin films of reduced
graphene oxide as a transparent and flexible electronic material. Nature Nanotechnology,
2008. 3: p. 270.
18. Gómez-Navarro, C., et al., Electronic Transport Properties of Individual
Chemically Reduced Graphene Oxide Sheets. Nano Letters, 2007. 7(11): p. 3499-3503.
19. Bourlinos, A.B., et al., Graphite Oxide: Chemical Reduction to Graphite and
Surface Modification with Primary Aliphatic Amines and Amino Acids. Langmuir, 2003.
19(15): p. 6050-6055.
66
20. Shin, H.J., et al., Efficient Reduction of Graphite Oxide by Sodium Borohydride and
Its Effect on Electrical Conductance. Advanced Functional Materials, 2009. 19(12): p.
1987-1992.
21. McAllister, M.J., et al., Single Sheet Functionalized Graphene by Oxidation and
Thermal Expansion of Graphite. Chemistry of Materials, 2007. 19(18): p. 4396-4404.
22. Li, D., et al., Processable aqueous dispersions of graphene nanosheets. Nature
Nanotechnology, 2008. 3: p. 101.
23. Loh, K.P., et al., Graphene oxide as a chemically tunable platform for optical
applications. Nat Chem, 2010. 2(12): p. 1015-1024.
24. Shang, J., et al., The Origin of Fluorescence from Graphene Oxide. Scientific
Reports, 2012. 2: p. 792.
25. Yun, Y.S., et al., Transparent conducting films based on graphene oxide/silver
nanowire hybrids with high flexibility. Synthetic Metals, 2012. 162(15–16): p. 1364-1368.
26. Cao, C., et al., High strength measurement of monolayer graphene oxide. Carbon,
2015. 81: p. 497-504.
27. Zhu, Y., et al., Graphene and Graphene Oxide: Synthesis, Properties, and
Applications. Advanced Materials, 2010. 22(35): p. 3906-3924.
28. Shi, S., et al., Solution-processable graphene oxide as an efficient hole injection
layer for high luminance organic light-emitting diodes. Journal of Materials Chemistry C,
2013. 1(9): p. 1708-1712.
29. Smith, C.T.G., et al., Graphene oxide hole transport layers for large area, high
efficiency organic solar cells. Applied Physics Letters, 2014. 105(7): p. 073304.
67
30. Borini, S., et al., Ultrafast Graphene Oxide Humidity Sensors. ACS Nano, 2013.
7(12): p. 11166-11173.
31. Rogala, M., et al., Graphene oxide overprints for flexible and transparent
electronics. Applied Physics Letters, 2015. 106(4): p. 041901.
32. Yang, Y., et al., Graphene based materials for biomedical applications. Materials
Today, 2013. 16(10): p. 365-373.
33. Cheng, S.-J., et al., Simultaneous drug delivery and cellular imaging using
graphene oxide. Biomaterials Science, 2018. 6(4): p. 813-819.
34. Kozawa, D., et al., Excitonic Photoluminescence from Nanodisc States in Graphene
Oxides. The Journal of Physical Chemistry Letters, 2014. 5(10): p. 1754-1759.
35. Viet Cuong, T., et al., Temperature-dependent photoluminescence from chemically
and thermally reduced graphene oxide. Applied Physics Letters, 2011. 99(4): p. 041905.
36. Gokus, T., et al., Making Graphene Luminescent by Oxygen Plasma Treatment.
ACS Nano, 2009. 3(12): p. 3963-3968.
37. Hummers, W.S. and R.E. Offeman, Preparation of Graphitic Oxide. Journal of the
American Chemical Society, 1958. 80(6): p. 1339-1339.
38. Yu, H., et al., High-efficient Synthesis of Graphene Oxide Based on Improved
Hummers Method. Scientific Reports, 2016. 6: p. 36143.
39. Shen, J., et al., Fast and Facile Preparation of Graphene Oxide and Reduced
Graphene Oxide Nanoplatelets. Chemistry of Materials, 2009. 21(15): p. 3514-3520.
40. Eda, G., et al., Blue Photoluminescence from Chemically Derived Graphene Oxide.
Advanced Materials, 2010. 22(4): p. 505-509.
68
41. Subrahmanyam, K.S., et al., Blue light emitting graphene-based materials and their
use in generating white light. Solid State Communications, 2010. 150(37–38): p. 1774-
1777.
42. Chen, J.-L. and X.-P. Yan, A dehydration and stabilizer-free approach to
production of stable water dispersions of graphene nanosheets. Journal of Materials
Chemistry, 2010. 20(21): p. 4328-4332.
43. Marcano, D.C., et al., Improved Synthesis of Graphene Oxide. ACS Nano, 2010.
4(8): p. 4806-4814.
44. Naumov, A., et al., Graphene Oxide: A One- versus Two-Component Material.
Journal of the American Chemical Society, 2016. 138(36): p. 11445-11448.
45. Md Tanvir, H., et al., Modifying optical properties of reduced/graphene oxide with
controlled ozone and thermal treatment in aqueous suspensions. Nanotechnology, 2017.
28(6): p. 065705.
46. Nakajima, T., A. Mabuchi, and R. Hagiwara, A new structure model of graphite
oxide. Carbon, 1988. 26(3): p. 357-361.
47. Szabó, T., et al., Enhanced acidity and pH-dependent surface charge
characterization of successively oxidized graphite oxides. Carbon, 2006. 44(3): p. 537-545.
48. Hontoria-Lucas, C., et al., Study of oxygen-containing groups in a series of graphite
oxides: Physical and chemical characterization. Carbon, 1995. 33(11): p. 1585-1592.
49. Stankovich, S., et al., Synthesis and exfoliation of isocyanate-treated graphene
oxide nanoplatelets. Carbon, 2006. 44(15): p. 3342-3347.
69
50. Cassagneau, T., F. Guérin, and J.H. Fendler, Preparation and Characterization of
Ultrathin Films Layer-by-Layer Self-Assembled from Graphite Oxide Nanoplatelets and
Polymers. Langmuir, 2000. 16(18): p. 7318-7324.
51. Cai, W., et al., Synthesis and solid-state NMR structural characterization of 13C-
labeled graphite oxide. Science, 2008. 321(5897): p. 1815-7.
52. Lu, N., et al., First principles nuclear magnetic resonance signatures of graphene
oxide. The Journal of Chemical Physics, 2010. 133(3): p. 034502.
53. Naumov, A.V., Optical Properties of Graphene Oxide., in Graphene Oxide:
Fundamentals and Applications. 2016, Wiley: Oxford, UK. p. 136-155.
54. Neogi, A., et al., Surface plasmon enhancement of broadband photoluminescence
emission from graphene oxide. Nanoscale, 2014. 6(19): p. 11310-11315.
55. Liu, F., et al., Facile synthetic method for pristine graphene quantum dots and
graphene oxide quantum dots: origin of blue and green luminescence. Adv Mater, 2013.
25.
56. Sun, X., et al., Nano-Graphene Oxide for Cellular Imaging and Drug Delivery.
Nano Res, 2008. 1(3): p. 203-212.
57. Kundu, A., R.K. Layek, and A.K. Nandi, Enhanced fluorescent intensity of
graphene oxide-methyl cellulose hybrid in acidic medium: Sensing of nitro-aromatics.
Journal of Materials Chemistry, 2012. 22(16): p. 8139-8144.
58. Yang, F., et al., The role of ozone in the ozonation process of graphene oxide:
oxidation or decomposition? RSC Advances, 2014. 4(102): p. 58325-58328.
70
59. Wan, X., Y. Huang, and Y. Chen, Focusing on Energy and Optoelectronic
Applications: A Journey for Graphene and Graphene Oxide at Large Scale. Accounts of
Chemical Research, 2012. 45(4): p. 598-607.
60. Li, S.-S., et al., Solution-Processable Graphene Oxide as an Efficient Hole
Transport Layer in Polymer Solar Cells. ACS Nano, 2010. 4(6): p. 3169-3174.
61. Sharma, D., et al., Insight into the biosensing of graphene oxide: Present and future
prospects. Arabian Journal of Chemistry, 2016. 9(2): p. 238-261.
62. Lu, C.-H., et al., A Graphene Platform for Sensing Biomolecules. Angewandte
Chemie International Edition, 2009. 48(26): p. 4785-4787.
63. He, Q., et al., Graphene-based electronic sensors. Chemical Science, 2012. 3(6):
p. 1764-1772.
64. Liu, Y., et al., Biocompatible Graphene Oxide-Based Glucose Biosensors.
Langmuir, 2010. 26(9): p. 6158-6160.
65. Jung, J., et al., A graphene oxide based immuno-biosensor for pathogen detection.
Angew Chem Int Edit, 2010. 49.
66. Xu, Y., et al., A Graphene Hybrid Material Covalently Functionalized with
Porphyrin: Synthesis and Optical Limiting Property. Advanced Materials, 2009. 21(12):
p. 1275-1279.
67. Velasco-Soto, M.A., et al., Selective band gap manipulation of graphene oxide by
its reduction with mild reagents. Carbon, 2015. 93: p. 967-973.
68. Vempati, S. and T. Uyar, Fluorescence from graphene oxide and the influence of
ionic, [small pi]- [small pi] interactions and heterointerfaces: electron or energy transfer
dynamics. Physical Chemistry Chemical Physics, 2014. 16(39): p. 21183-21203.
71
69. Hunt, A., E.Z. Kurmaev, and A. Moewes, Band gap engineering of graphene oxide
by chemical modification. Carbon, 2014. 75: p. 366-371.
70. Luo, Z., et al., Photoluminescence and band gap modulation in graphene oxide.
Applied Physics Letters, 2009. 94(11): p. 111909.
71. Maiti, R., et al., Tunable optical properties of graphene oxide by tailoring the
oxygen functionalities using infrared irradiation. Nanotechnology, 2014. 25(49): p.
495704.
72. Muge Acik, Y.J.C., A Review on Thermal Exfoliation of Graphene Oxide. Journal
of Materials Science Research, 2013. Vol. 2: p. 101-112.
73. Eswaraiah, V., S.S. Jyothirmayee Aravind, and S. Ramaprabhu, Top down method
for synthesis of highly conducting graphene by exfoliation of graphite oxide using focused
solar radiation. Journal of Materials Chemistry, 2011. 21(19): p. 6800-6803.
74. Plotnikov, V.G., et al., The graphite oxide photoreduction mechanism. High Energy
Chemistry, 2011. 45(5): p. 411.
75. Gilje, S., et al., Photothermal Deoxygenation of Graphene Oxide for Patterning
and Distributed Ignition Applications. Advanced Materials, 2010. 22(3): p. 419-423.
76. Cote, L.J., R. Cruz-Silva, and J. Huang, Flash Reduction and Patterning of
Graphite Oxide and Its Polymer Composite. Journal of the American Chemical Society,
2009. 131(31): p. 11027-11032.
77. Sokolov, D.A., K.R. Shepperd, and T.M. Orlando, Formation of Graphene
Features from Direct Laser-Induced Reduction of Graphite Oxide. The Journal of Physical
Chemistry Letters, 2010. 1(18): p. 2633-2636.
72
78. Sokolov, D.A., et al., Direct Observation of Single Layer Graphene Oxide
Reduction through Spatially Resolved, Single Sheet Absorption/Emission Microscopy.
Nano Letters, 2014. 14(6): p. 3172-3179.
79. Williams, G., B. Seger, and P.V. Kamat, TiO2-Graphene Nanocomposites. UV-
Assisted Photocatalytic Reduction of Graphene Oxide. ACS Nano, 2008. 2(7): p. 1487-
1491.
80. Venkat Narayana, M.a.N.J., S., Tuning Optical Properties of Graphene Oxide
under Compressive Strain Using Wet Ball Milling Method. Scientific Research Publishing
Inc., 2016. 5(Graphene): p. 73-80.
81. Jeong, H.K., et al., Tailoring the characteristics of graphite oxides by different
oxidation times. Journal of Physics D: Applied Physics, 2009. 42(6): p. 065418.
82. Mulyana, Y., et al., Reversible Oxidation of Graphene Through Ultraviolet/Ozone
Treatment and Its Nonthermal Reduction through Ultraviolet Irradiation. The Journal of
Physical Chemistry C, 2014. 118(47): p. 27372-27381.
83. Yang, F., et al., Influence of pH on the fluorescence properties of graphene
quantum dots using ozonation pre-oxide hydrothermal synthesis. Journal of Materials
Chemistry, 2012. 22(48): p. 25471-25479.
84. Lundie, M., Z. Sljivancanin, and S. Tomic, Electronic and optical properties of
reduced graphene oxide. Journal of Materials Chemistry C, 2015. 3(29): p. 7632-7641.
85. Lundie, M., livancanin, and S. Tomi. Absorption characteristics of reduced
graphene oxide: Application to TCO and solar cells active region. in Photovoltaic
Specialist Conference (PVSC), 2015 IEEE 42nd. 2015.
73
86. Eilho, J., et al., Optical properties of graphite oxide and reduced graphite oxide.
Journal of Physics D: Applied Physics, 2014. 47(26): p. 265306.
87. Chen, Y., et al., Graphene Oxide-Based Carbon Interconnecting Layer for Polymer
Tandem Solar Cells. Nano Letters, 2014. 14(3): p. 1467-1471.
88. Li, F., et al., Graphene oxide: A promising nanomaterial for energy and
environmental applications. Nano Energy, 2015. 16: p. 488-515.
89. Tsuchiya, T., K. Terabe, and M. Aono, In Situ and Non-Volatile Bandgap Tuning
of Multilayer Graphene Oxide in an All-Solid-State Electric Double-Layer Transistor.
Advanced Materials, 2014. 26(7): p. 1087-1091.
90. Hummers, W. and R. Offeman, Preparation of graphitic oxide. J Am Chem Soc,
1958. 80.
91. Chen, J.-L., et al., Graphene Oxide Based Photoinduced Charge Transfer Label-
Free Near-Infrared Fluorescent Biosensor for Dopamine. Analytical Chemistry, 2011.
83(22): p. 8787-8793.
92. Zhang, X.-F., X. Shao, and S. Liu, Dual Fluorescence of Graphene Oxide: A Time-
Resolved Study. The Journal of Physical Chemistry A, 2012. 116(27): p. 7308-7313.
93. Lin, F., et al., Graphene oxide liquid crystals: synthesis, phase transition,
rheological property, and applications in optoelectronics and display. Nanoscale Research
Letters, 2015. 10: p. 435.
94. Narayan, R., et al., Graphene Oxide Liquid Crystals: Discovery, Evolution and
Applications. Advanced Materials, 2016. 28(16): p. 3045-3068.
74
95. Ruan, Y., et al., Integration of conductive reduced graphene oxide into
microstructured optical fibres for optoelectronics applications. Scientific Reports, 2016.
6: p. 21682.
96. Kim, D., et al., Reaction-based two-photon probes for in vitro analysis and cellular
imaging of monoamine oxidase activity. Chemical Communications, 2012. 48(54): p.
6833-6835.
97. Li, M., et al., Fingerprinting photoluminescence of functional groups in graphene
oxide. Journal of Materials Chemistry, 2012. 22(44): p. 23374-23379.
98. Exarhos, A.L., M.E. Turk, and J.M. Kikkawa, Ultrafast Spectral Migration of
Photoluminescence in Graphene Oxide. Nano Letters, 2013. 13(2): p. 344-349.
99. Çiplak, Z., N. Yildiz, and A. Çalimli, Investigation of Graphene/Ag
Nanocomposites Synthesis Parameters for Two Different Synthesis Methods. Fullerenes,
Nanotubes and Carbon Nanostructures, 2015. 23(4): p. 361-370.
100. Kravets, V.G., et al., Engineering optical properties of a graphene oxide
metamaterial assembled in microfluidic channels. Optics Express, 2015. 23(2): p. 1265-
1275.
101. Goographene. 2016-17; Available from:
http://www.goographene.com/store/p1/Single-Layer_Graphene_Oxide_Solid.html.
102. Kochmann, S., T. Hirsch, and O.S. Wolfbeis, The pH Dependence of the Total
Fluorescence of Graphite Oxide. Journal of Fluorescence, 2012. 22(3): p. 849-855.
103. Kozawa, D., et al., Exploring the Origin of Blue and Ultraviolet Fluorescence in
Graphene Oxide. The Journal of Physical Chemistry Letters, 2013. 4(12): p. 2035-2040.
75
104. Pal, S.K., Versatile photoluminescence from graphene and its derivatives. Carbon,
2015. 88: p. 86-112.
105. Amirhasan, N., et al., Bandgap opening in oxygen plasma-treated graphene.
Nanotechnology, 2010. 21(43): p. 435203.
106. Hasan, M.T., et al., Optical Band Gap Alteration of Graphene Oxide via Ozone
Treatment. Scientific Reports, 2017. 7(1): p. 6411.
VITA
PERSONAL
Md. Tanvir Hasan
Fort Worth, Texas
EDUCATION
2015-Present
Texas Christian University, Department of Physics and Astronomy
Graduate Student
2003-2007
Chittagong University of Engineering and Technology, Chittagong, Bangladesh
Department of Electrical and Electronic Engineering,
Bachelor of Science in Electrical and Electronic Engineering
PROFESSIONAL EXPERIENCE
2015-Present Graduate Teaching Assistant, Texas Christian University
2013-2014 Graduate Teaching Assistant, The University of Texas at San Antonio
2012-2015 Graduate Research Assistant, The University of Texas at San Antonio
2011-2012 Senior Executive Engineer, Atlas Copco Bangladesh Limited
2008-2010 Executive Engineer, Siemens Bangladesh Limited
PUBLICATIONS
1. Md. Tanvir Hasan, Roberto Gonzalez-Rodriguez, Conor Ryan, Nicolas Faerber, Jeffery
L. Coffer and Anton V. Naumov “Photo- and Electroluminescence from Nitrogen-doped
and Nitrogen-Sulfur co-doped Graphene Quantum Dots” submitted to Advanced
Functional Materials (2018).
2. Afeefah Khazi-Syed, Md. Tanvir Hasan, E. Campbell, Anton V. Naumov “Single-Walled
Carbon Nanotube-Assisted Antibiotic Delivery and Imaging in S. Epidermidis Strains
Addressing Antibiotic Resistance” under preparation (2018).
3. E. Campbell, Md. Tanvir Hasan, Christine Pho, K. Callaghan, G.R. Akkaraju, and Anton
V. Naumov “Graphene Oxide as a Multifunctional Platform for Intracellular Delivery,
Imaging, and Cancer Sensing” submitted to Scientific Reports (2018).
4. Md. Tanvir Hasan, Brian J. Senger, Conor Ryan, Marais Culp, Roberto Gonzalez-
Rodriguez, Jeffery L. Coffer, Anton V. Naumov “Optical Band Gap Alteration of Graphene
Oxide Via Ozone Treatment” Scientific Reports, 7(1): p. 6411, doi:10.1038/s41598-017-
06107-0 (2017).
5. Md Tanvir Hasan, Brian J. Senger, Price Mulford, Conor Ryan, Hung Doan, Zygmunt
Gryczynski, Anton V. Naumov “Modifying optical properties of reduced/graphene oxide
with controlled ozone and thermal treatment in aqueous suspensions” Nanotechnology 28,
065705, doi:10.1088/1361-6528/aa5232 (2017).
6. Md. Tanvir Hasan, Amar Bhalla, Ruyan Guo “Investigation of Electrical, Optical and
Structural Properties of Sputtered Indium Tin Oxide Thin Film” Proc. of SPIE Vol. 9586
95860J-1 doi: 10.1117/12.2188971 (2015).
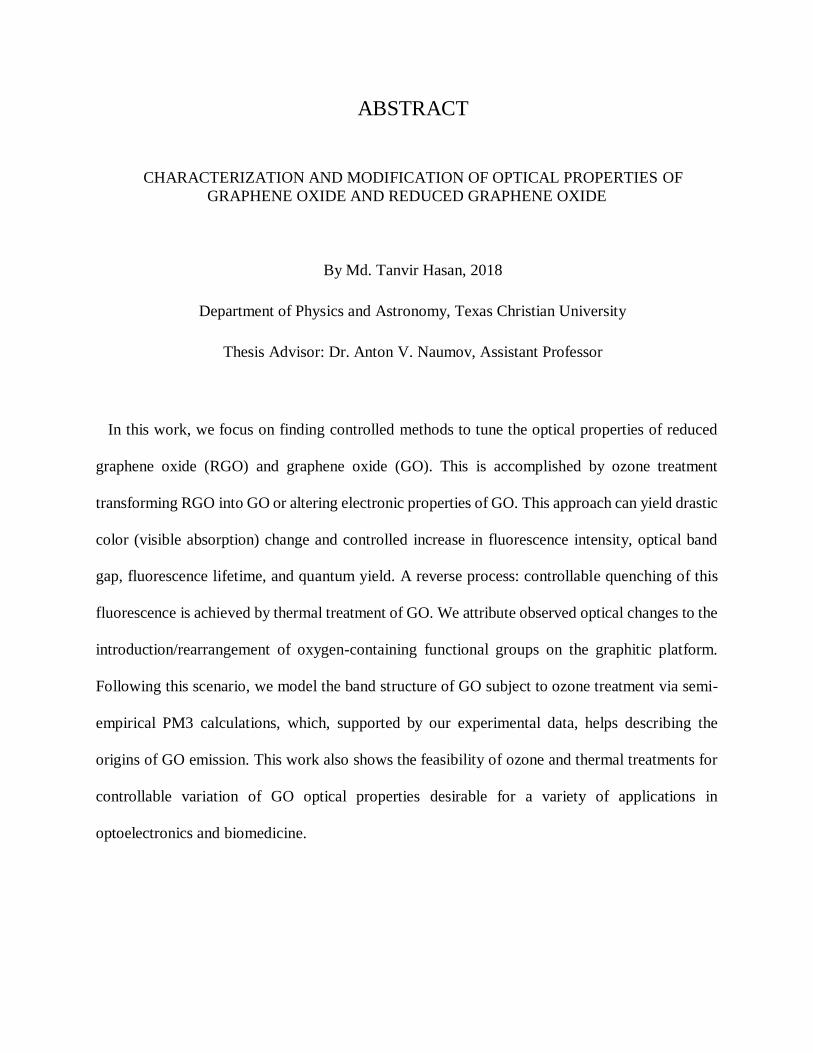
ABSTRACT
CHARACTERIZATION AND MODIFICATION OF OPTICAL PROPERTIES OF
GRAPHENE OXIDE AND REDUCED GRAPHENE OXIDE
By Md. Tanvir Hasan, 2018
Department of Physics and Astronomy, Texas Christian University
Thesis Advisor: Dr. Anton V. Naumov, Assistant Professor
In this work, we focus on finding controlled methods to tune the optical properties of reduced
graphene oxide (RGO) and graphene oxide (GO). This is accomplished by ozone treatment
transforming RGO into GO or altering electronic properties of GO. This approach can yield drastic
color (visible absorption) change and controlled increase in fluorescence intensity, optical band
gap, fluorescence lifetime, and quantum yield. A reverse process: controllable quenching of this
fluorescence is achieved by thermal treatment of GO. We attribute observed optical changes to the
introduction/rearrangement of oxygen-containing functional groups on the graphitic platform.
Following this scenario, we model the band structure of GO subject to ozone treatment via semi-
empirical PM3 calculations, which, supported by our experimental data, helps describing the
origins of GO emission. This work also shows the feasibility of ozone and thermal treatments for
controllable variation of GO optical properties desirable for a variety of applications in
optoelectronics and biomedicine.