Embed Size (px)
Citation preview
Characterization and modification of
powders used to make aluminium-based
metal foams
vorgelegt von
Ingeniera en materiales
Catalina Elena Jiménez
aus Argentinien
von der Fakultät III - Prozesswissenschaften
der Technischen Universität Berlin
zur Erlangung des akademischen Grades
Doktor der Ingenieurwissenschaften
-Dr.-Ing.-
genehmigte Dissertation
Promotionsansschuss:
Vorsitzsender: Prof. Dr. H. Schubert
Berichter: Prof. Dr. J. Banhart
Berichter: Prof. Dr. M. A. Rodríguez Pérez
Tag der wissenschaftlichen Aussprache: 07.10. 2009
Berlin 2010
D 83

2
Abstract
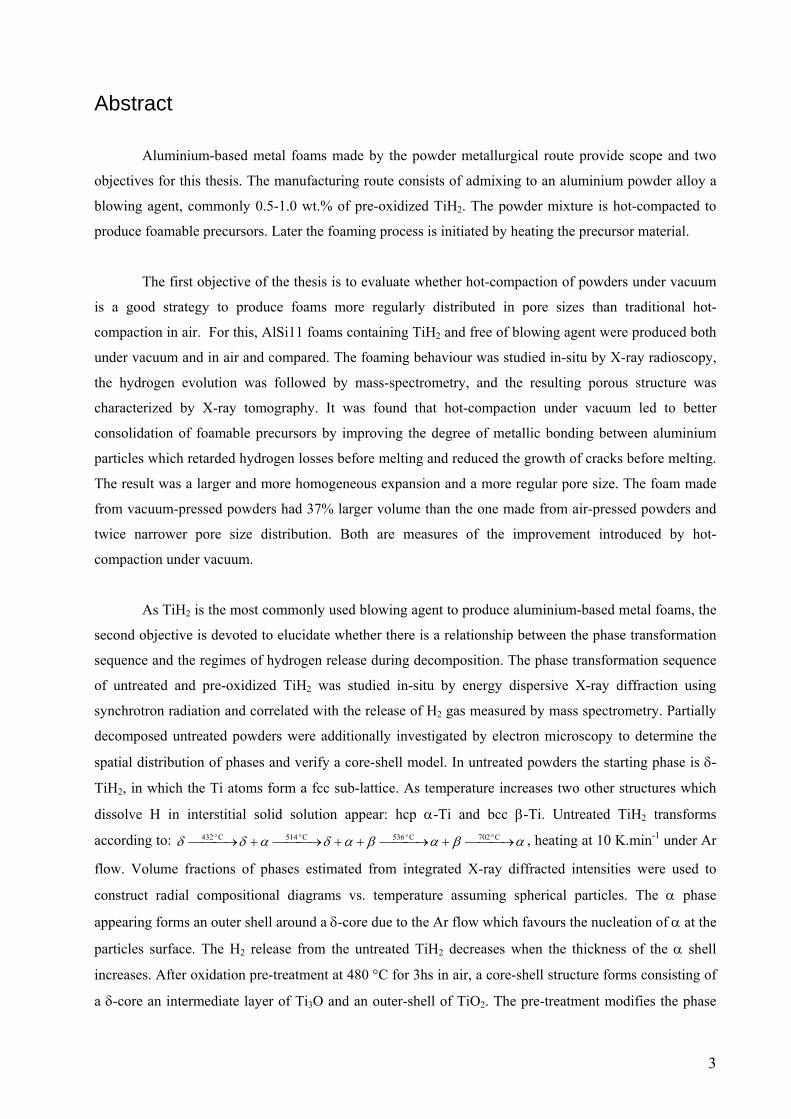
Aluminium-based metal foams made by the powder metallurgical route provide scope and two
objectives for this thesis. The manufacturing route consists of admixing to an aluminium powder alloy a
blowing agent, commonly 0.5-1.0 wt.% of pre-oxidized TiH2. The powder mixture is hot-compacted to
produce foamable precursors. Later the foaming process is initiated by heating the precursor material.
The first objective of the thesis is to evaluate whether hot-compaction of powders under vacuum
is a good strategy to produce foams more regularly distributed in pore sizes than traditional hot-
compaction in air. For this, AlSi11 foams containing TiH2 and free of blowing agent were produced both
under vacuum and in air and compared. The foaming behaviour was studied in-situ by X-ray radioscopy,
the hydrogen evolution was followed by mass-spectrometry, and the resulting porous structure was
characterized by X-ray tomography. It was found that hot-compaction under vacuum led to better
consolidation of foamable precursors by improving the degree of metallic bonding between aluminium
particles which retarded hydrogen losses before melting and reduced the growth of cracks before melting.
The result was a larger and more homogeneous expansion and a more regular pore size. The foam made
from vacuum-pressed powders had 37% larger volume than the one made from air-pressed powders and
twice narrower pore size distribution. Both are measures of the improvement introduced by hot-
compaction under vacuum.
As TiH2 is the most commonly used blowing agent to produce aluminium-based metal foams, the
second objective is devoted to elucidate whether there is a relationship between the phase transformation
sequence and the regimes of hydrogen release during decomposition. The phase transformation sequence
of untreated and pre-oxidized TiH2 was studied in-situ by energy dispersive X-ray diffraction using
synchrotron radiation and correlated with the release of H2 gas measured by mass spectrometry. Partially
decomposed untreated powders were additionally investigated by electron microscopy to determine the
spatial distribution of phases and verify a core-shell model. In untreated powders the starting phase is δ-
TiH2, in which the Ti atoms form a fcc sub-lattice. As temperature increases two other structures which
dissolve H in interstitial solid solution appear: hcp α-Ti and bcc β-Ti. Untreated TiH2 transforms
according to: , heating at 10 K.min-1 under Ar
flow. Volume fractions of phases estimated from integrated X-ray diffracted intensities were used to
construct radial compositional diagrams vs. temperature assuming spherical particles. The α phase
appearing forms an outer shell around a δ-core due to the Ar flow which favours the nucleation of α at the
particles surface. The H2 release from the untreated TiH2 decreases when the thickness of the α shell
increases. After oxidation pre-treatment at 480 °C for 3hs in air, a core-shell structure forms consisting of
a δ-core an intermediate layer of Ti3O and an outer-shell of TiO2. The pre-treatment modifies the phase
αβαβαδαδδ ⎯⎯ →⎯+⎯⎯ →⎯++⎯⎯ →⎯+⎯⎯ →⎯ °°°° C702C536C514C432
3

transformation sequence. The release of H2 from pre-treated powders is controlled by the thickness of the
outer TiO2 layer. Above 535 °C, Ti3O transform into hcp α-Ti which reduces TiO2. The phase
transformation temperatures are retarded by increasing the heating rate and anticipated if powders are
compacted.
4

Declaration
Ich erkläre an Eides Statt, dass die vorliegende Dissertation in allen Teilen von mir selbständig
angefertigt wurde und die benutzten Hilfsmittel vollständig angegeben worden sind.
5

6

Dedication
Dedicado a Eli
7

8
Acknowledgements
I would like to thank Professor John Banhart and Dr. Francisco García Moreno for giving
me the opportunity to join a PhD position in the metal foams group at the TU Berlin and
Helmholtz Centre Berlin. In particular, I would like thank Prof. Banhart for encouraging me to
focus on TiH2 rather than other hydrides and for trying to teach me the importance of keeping a
message logic and simple in scientific writing. I would like to thank Francisco Garcia-Moreno
for giving me always generous access and support to develop my skills. Thanks Francisco also
for being always a positive thinking person, it was helpful many times. It is a pleasure to be a
member of the metal foams group. I would like to thank past and present members since I
learned and continue to learn from everyone: Dr. Manas Mukherjee, Dr. Biljana Matijasevic-
Lux, Dr. Vinod Kumar, Dr. Hans Helwig, Jens Brunner, Avinash Chethan, Dr. Alan Brothers,
Dr. Norbert Babcsan, Nunzio Raffaele, Beate Pfretzschner, Dichao Pan, Andreas Benz, Prashant
Konda and Dr. Eusebio Solórzano Quijano. Very special thanks go to my senior colleague,
office-mate, neighbour, and great friend Dr. Manas Mukherjee. His continuous support, interest
and peace gave room for enjoyable discussions accompanied (or motivated) by home-made food.
Dr. Eusebio Solórzano Quijano gave me many useful suggestions. His passion for doing research
has inspired me since I met him. I would also like to thank Dr. Marité Malachevsky for
introducing me in the field of research metal foams.
I am indebt to Dr. Christian Abromeit who helped me to solve several scientific and non
scientific issues and made me smile in any circumstances. I am very grateful to Dr. Gerald Zehl
who not belonging to our department and having not much to do with my projects, dedicated
considerable amount of time to teach me mass spectrometry, supervise my first measurements,
discuss experiments and results, provide literature, etc. Part of that time was dedicated to
dismantle, repair and reassemble the TG-MS instrument in various occasions, thanks Gerald for
the patience. I would like to thank Dr. Nelia Wanderka for suggesting the experimental design to
initiate TEM investigations. Later on, Dr. Markus Wollgarten assisted the sample examination.
So, thanks to both. Thanks Yvonne Herzog and Christane Ciceron for making our lives easier
concerning paper work and organization. Also thanks to Jörg Bajorat for getting me out of
computer troubles. I am grateful to all technicians from our department because by keeping the
labs and instruments running, they also take care of us. Claudia Leistner taught me how to use
the furnaces. Harald Stapel improved the electrical connections of my chamber at the TU Berlin.
The expert hands of Christiane Förster and Dagmar Köpenick-Welzel prepared the investigated
9
TEM samples. Holger Kropf and Dagmar taught me SEM and EDS. Holger also cut countless
samples which saved time. He also gave valuable suggestions for metallographic investigations.
Thanks to all other department members for the very nice working ambience. Thanks to Dr. Gerd
Schumacher and Dr. Ivo Zizak for the support during the campaigns at the KMC-2 beamline at
BESSY. Thanks to Dr. Michael Tovar who supported the campaign at E6 and introduced me to
Rietveld analysis. In that regard, I would also like to thank the additional kind help of Dr. Liliana
Mogni. Thanks to Dr. Christoph Genzel and Dr. Manuela Klaus for the support during the
campaigns at the EDDI beamline at BESSY. And thanks a lot for letting me use their EDDI-
Mathematica tool to analyze the data. Part of the analysis was done with the very kind help of
Beate Pfretzschner at the beamline and later on at the office. I also received the help of Roman
Grothausmann to handle part of the data. I thank Dr. Oliver Görke for letting us use their
instruments to characterize our powders in the faculty of Ceramics and to Prof. Schubert, Manuel
Hart and again Oliver for the useful discussions and suggestions before the submission.
Good friends in Berlin supported and encouraged me during these years. For this, special
thanks to Dr. Jens Vierke for all the time we shared and for being there for Eli and me. Thanks to
his family too for receiving us always so warmly in Basdorf. Enormous thanks go to Ruth
Slomski and Dr. Roch Hannecart, Jens Brunner, Dr. Meenakshi Sarkar, Dr. Elvira García-Matres
and her family, Dr. Sashank Nayak, Dr. Cynthia Chang, Dr. Stefan Höring and his family,
Dr. Noelia Bocchio, Dr. Nicolás Vives Diaz, Franziska Henning, Dr. Markus Strobl, Dr. Robert
Wimpory, and soon Dr. Katharina Rolfs. I cherish many moments I shared with all of them.
Thanks to Antonio Rueda and Panaceite too, for the music.
Of course I want to thank my family and many friends from Argentina who supported at
the distance and in-situ our Berlin-family-studies-project. Very special thanks go to my mother
because without her help it would have been impossible to complete my studies and come to
Berlin the first time without Eli. The back-up from my sisters, father and brothers, as well as the
ones from Dr. Liliana Mogni, Raúl Stuke, Dr. Eugenia Zelaya, Dr. Marcelo Esquivel, Dr.
Adriana Condó, Nacho Cettigne, Dieguito Somaloma, Gustavo Pesaresci, Carlos Morales,
Natacha Olmedo and LaBabosa were very important for me.
It has been my great honour to share this adventure with Eliana, my daughter, my ground
connection, my flower and my good companion.
10
CONTENTS
Abstract........................................................................................................................................................................ 3
Declaration................................................................................................................................................................... 5
Dedication .................................................................................................................................................................... 7
Acknowledgements...................................................................................................................................................... 9
1. Introduction........................................................................................................................................................... 13 1.1 Basics on metal foams ...................................................................................................................................... 13
Definition of metallic foam ................................................................................................................................ 13 Properties of metallic foams.............................................................................................................................. 13 Production methods........................................................................................................................................... 14 Foaming through the PM route ......................................................................................................................... 15
1.2 Hot-compaction under vacuum vs. hot-compaction in air ............................................................................... 16 Background ....................................................................................................................................................... 16
1.3 Phase transformation sequence and decomposition kinetics of TiH2............................................................... 17 Background ....................................................................................................................................................... 17
1.4 The Ti-H and Ti-O phase diagrams.................................................................................................................. 20 1.5 Objectives and methodology of the thesis......................................................................................................... 25
2. Experimental ......................................................................................................................................................... 27 2.1 Materials and sample preparation methods..................................................................................................... 27
2.1.1 Powder specifications ............................................................................................................................... 27 2.1.2 Oxidation pre-treatment and cold-pressing of TiH2.................................................................................. 27 2.1.3 Foamable precursor preparation under controlled atmosphere................................................................. 28 2.1.4 Foam preparation (in-situ X-ray radioscopy) ........................................................................................... 30
2.2 Characterization Methods................................................................................................................................ 32 2.2.1 Particle size analysis................................................................................................................................. 32 2.2.2 Oxygen content analysis ........................................................................................................................... 32 2.2.3 Pycnometric density determination .......................................................................................................... 32 2.2.4 Light microscopy (LM) ............................................................................................................................ 33 2.2.5 Scanning electron microscopy (SEM) ...................................................................................................... 33 2.2.6 Transmission electron microscopy (TEM) ............................................................................................... 33 2.2.7 Simultaneous thermo-gravimetry (TG) and mass spectrometry (MS)...................................................... 35 2.2.8 Ex-situ angle-dispersive X-ray diffraction (AD-XRD) ............................................................................ 36 2.2.9 In-situ energy-dispersive X-ray diffraction (ED-XRD)............................................................................ 37 2.2.10 X-ray tomography................................................................................................................................... 40
3 Results ..................................................................................................................................................................... 41 3.1 Powder characterization .................................................................................................................................. 41 3.2 Powders consolidation under controlled atmosphere ...................................................................................... 43
3.2.1 Characterization of foamable precursor materials .................................................................................... 43 3.2.2 Hydrogen evolution from precursor material ........................................................................................... 45 3.2.3 Foaming behaviour of compacted precursors with TiH2 (standard foaming) ........................................... 47 3.2.4 Foaming behaviour of compacted precursors free of TiH2 (PIF) ............................................................. 48 3.2.4 Porous structure of foams ......................................................................................................................... 50
3.3 Hydrogen evolution from TiH2 followed by TG-MS thermo-analysis .............................................................. 52 3.3.1 TiH2 N grade............................................................................................................................................. 52 3.3.2 TiH2 PS grade ........................................................................................................................................... 55
3.4 Other solid-gas reactions during the decomposition of TiH2 PS grades.......................................................... 57 3.5 Evolution of the oxygen content of TiH2 PS grade under Ar ............................................................................ 58
11
3.6 Phase transformation sequence during decomposition of TiH2 PS grade ....................................................... 59 3.6.1 Ex-situ characterization of untreated and pre-treated TiH2 by AD-XRD................................................. 59 3.6.2 Phase transformation of TiH2 PS grade followed in-situ by ED-XRD..................................................... 60 3.6.2.1 Untreated condition ............................................................................................................................... 61 3.6.2.1 Pre-treated condition ............................................................................................................................. 64
3.7 Microstructural evolution after partial decomposition of untreated TiH2 PS grade ....................................... 68
4. Discussion .............................................................................................................................................................. 75 4.1 Influence of compaction atmosphere on the foaming behaviour of AlSi11...................................................... 75
4.1.1 Properties of the powder compacts .......................................................................................................... 75 4.1.2 Hydrogen losses to evaluate consolidation, melting sequence, and its influence on expansion and foaming behaviour ............................................................................................................................................ 77 4.1.3 Porous structure of solidified foams......................................................................................................... 79
4.2 The decomposition of TiH2 under Ar flow – hydrogen release and phase transformation sequence............... 80 4.2.1 Methods and data analysis used to study TiH2 decomposition................................................................. 80 4.2.2 Influence of pre-treatment on the mass loss – N vs. PS grade ................................................................. 85 4.2.3 Phase transformation sequences............................................................................................................... 86 4.2.3.1 Untreated powder .................................................................................................................................. 86 Differences to the binary Ti-H phase diagram.................................................................................................. 86 α before β.......................................................................................................................................................... 86 Co-existence of δ + α + β .................................................................................................................................. 88 Absence of the allotropic transition α ↔ β above 882 °C................................................................................ 89 The evolution of the microstructure after partial decompositions .................................................................... 89 Relationship between phase transformation and hydrogen release .................................................................. 94 4.2.3.2 Pre-treated powder ................................................................................................................................ 99 Phases before heating, at high temperature and after cooling ......................................................................... 99 Evolution of Ti3O and TiO2 oxides during decomposition .............................................................................. 100 Relationship between phase transformation sequence and hydrogen evolution ............................................. 105
5. Summary and Conclusions ................................................................................................................................ 109
References................................................................................................................................................................ 113
Appendix A – Calculation of correction factors for mass spectrometry (MS) data.......................................... 121
Appendix B – Decomposition of untreated TiD2 under resting Ar..................................................................... 123
Appendix C – Decomposition of TiD2 under Ar flow .......................................................................................... 125
Appendix D – Isochronal phase transformation sequence of TiH2 PS grade followed in-situ by AD-XRD in reflection geometry ................................................................................................................................................. 127
Appendix E – Crystallographic data of α-Ti, Ti3O and Ti2O ............................................................................. 130
12
1. Introduction
1.1 Basics on metal foams
Definition of metallic foam
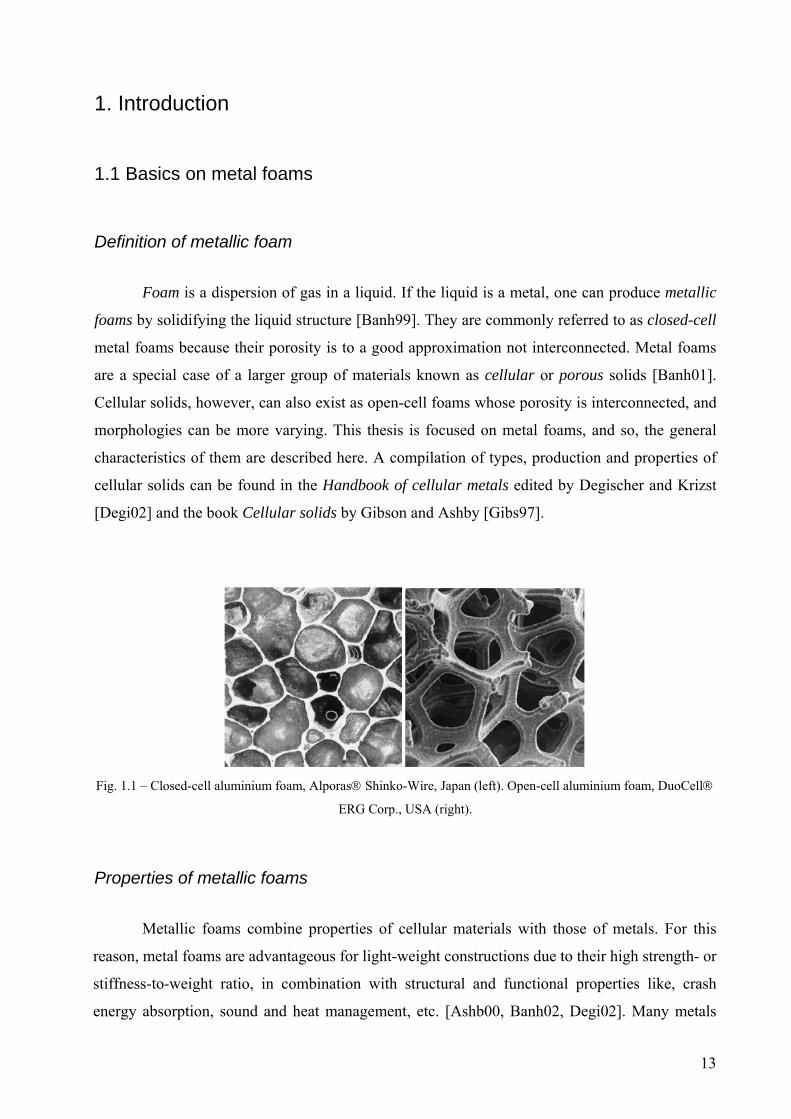
Foam is a dispersion of gas in a liquid. If the liquid is a metal, one can produce metallic
foams by solidifying the liquid structure [Banh99]. They are commonly referred to as closed-cell
metal foams because their porosity is to a good approximation not interconnected. Metal foams
are a special case of a larger group of materials known as cellular or porous solids [Banh01].
Cellular solids, however, can also exist as open-cell foams whose porosity is interconnected, and
morphologies can be more varying. This thesis is focused on metal foams, and so, the general
characteristics of them are described here. A compilation of types, production and properties of
cellular solids can be found in the Handbook of cellular metals edited by Degischer and Krizst
[Degi02] and the book Cellular solids by Gibson and Ashby [Gibs97].
Fig. 1.1 – Closed-cell aluminium foam, Alporas® Shinko-Wire, Japan (left). Open-cell aluminium foam, DuoCell®
ERG Corp., USA (right).
Properties of metallic foams
Metallic foams combine properties of cellular materials with those of metals. For this
reason, metal foams are advantageous for light-weight constructions due to their high strength- or
stiffness-to-weight ratio, in combination with structural and functional properties like, crash
energy absorption, sound and heat management, etc. [Ashb00, Banh02, Degi02]. Many metals
13
and their alloys are amenable to foaming, such as, lead, zinc, gold and aluminium [Irret05,
Kita06, Kita07, Körn04, Davi83, Banh08]. Among the metallic foams, aluminium foams are
commercially the most exploited ones due to their low density, high ductility, high thermal
conductivity, and competitive cost of the metal.
The properties of metallic foams are influenced by morphological features such as pore
size distribution, cell morphology and defects [Gibs97, Ashb02, Degi02]. Progress has been
made in understanding the relationship between properties and morphology. All studies indicate
that the real properties are inferior than theoretically expected, essentially due to various types of
structural imperfections. This demands a better control of pore size, and substantial reduction in
morphological and structural defects. Density variation and morphological defects yield a large
scatter of measured properties, which is detrimental for the reliability of metal foams [Rama04].
Wiggled or missing cell walls reduce strength, and in turn, result in a reduced deformation
energy absorbed under compression [Rama04, Song08, Mark01]. Fatigue studies demonstrate
that selective deformation of the weakest region of the foam structure leads to crush-band
formation [Koll08, Motz05]. In particular, studies have paid attention to the influence of the
pore- or cell-size on mechanical properties [Kene04, Rako04, Daxn04]. Cell morphology and
interconnection could also affect thermal and acoustic properties [Zhao04, Zhao05, Solo08,
Wang99, Brya08]. It is widely accepted that foams with a uniform distribution of pores and free
of morphological defects is desirable. This would make the properties more predictable. Only
then, metallic foams will be considered reliable materials for engineering purposes. Aluminium
foams produced nowadays are better than those produced a decade ago, but there is still room for
improvement concerning regularity of the pore structure. Experimentalists aim to produce more
regular structures with fewer defects in a more reproducible way, which is one of the motivations
of this work.
Production methods
The first patent concerning production of foams from light metals was filed by De Meller
in 1926 [DeMe26]. There it was suggested to foam by gas injection or by using carbonates.
Since then, many foaming methods to produce aluminium foams were developed and patented;
details of which could be found in [Davi83, Ashb02, Brya08, Mukh09]. In terms of their
processing routes, they are often divided broadly into direct and indirect foaming routes
[Banh06].
14
Direct foaming routes start from a specially prepared melt containing particles to which
gas bubbles are injected directly, or generated chemically by the decomposition of a foaming
agent (TiH2, CaCO3, etc.), or by precipitation of gas dissolved in the melt by controlling
temperature and pressure. Foams like Alporas, Metcomb, Aluminair, Gasars or Lotus-type foams
are produced using one of these variants. These are all trade marks and can be found in the
internet by the names.
Indirect foaming methods require the preparation of foamable precursors that are
subsequently foamed by heating. Foaminal or Alulight and thixocasting processes are some
examples. The powder metallurgical (PM) route is one of the commercially exploited indirect
methods to produce aluminium foams [Baum00] and the one used in this thesis. In the PM route,
aluminium powders are mixed with alloying elements (if desired), and a blowing agent is added.
In most cases 0.5–1.0 wt% TiH2 is added as blowing agent, but also ZrH2, CaCo3 can be used.
The powders are consolidated by compaction, extrusion or rolling to yield foamable precursors,
after which the foaming process is initiated by heating [Baum90]. Aluminium Foam Sandwich
(AFS) is an example of commercially available product made by the PM route.
Foaming through the PM route
The pore formation in the foaming process of PM precursors starts during heating before
melting of the alloy [Banh99, Kenn02b, Banh02]. Gas accumulates in residual porosity and
builds up pressure as temperature increases. For this reason, the pores formed at early stages of
foaming appear as cracks aligned perpendicular to the compaction direction [Banh01a, Helf05].
After melting of the alloy, the crack-like pores round off to minimize surface energy. Pore
growth begins, driven by gas release from the blowing agent, and the structure starts to appear as
foam. Processing parameters used for foaming influence significantly the foam expansion
behaviour [Duar00, Helw09]. Liquid foams are unstable, and metallic foams suffer degradation
by liquid drainage through plateau borders driven by gravity. Many questions are still open
regarding stabilization of PM foams [Banh06]. Körner et al. proposed that PM foams are
stabilized by clustering of the oxide films which originally covered the metal powders that create
disjoining forces and behave as a mechanical barrier against liquid drainage [Körn05]. In order
to retain a desired porous structure, solidification needs to take place before degradation of the
liquid foam, and at the right cooling rate in order to minimize solidification defects. This is
15
another challenge, especially for large foams since solidification is not uniform due to the low
heat conduction of the porous structure compared to the dense metal [Mukh09, Solo2008].
1.2 Hot-compaction under vacuum vs. hot-compaction in air
The first objective of this work is to evaluate whether hot-compaction under vacuum can
produce more regular pore structures than traditional hot-compaction in air. This work
concentrates on the PM route for making Al-Si metal foams based on pure Al and Si powders as
they are cost-effective for this indirect foaming method.
Background
Studies based on microscopy and synchrotron X-ray micro-tomography have shown that
in Al-Si precursors pore initiation is spatially correlated with Si particles. In early stages, pores
are crack-like, leading to irregularities in the final products [Mosl01, Helf05]. This was
attributed to the mismatch between the melting of the respective alloy and TiH2 decomposition.
Investigations focused on lower melting aluminium alloys [Baum00, Lehm04, Helw08] and pre-
treated TiH2 powders [Kenn02, Lehm04a, Matl06, Mati06, Gerg00] brought significant progress
in producing more regular porous structures. However, the observed formation of crack-like
pores shows that not only the blowing agent decomposes before melting of the alloy, but it also
makes evident deficiencies of powder consolidation. PM precursors can also be foamed without
the addition of extrinsic blowing agents. This process is called the Pressure Induced Foaming
(PIF) [Garc05, Garc07]. Similar cracks have also been observed in PM precursors free of TiH2 at
early stages of expansion.
On the other hand, in traditional aluminium powder metallurgy hot-compaction under
vacuum is a known practice to improve the quality of PM parts by facilitating consolidation. The
practice is called degassing, and is used to remove entrapped gasses, adsorbed water and dry
hydroxides from the surface of aluminium powders [Pick81, Estr91, Stan91, Wafe81, Wafe87].
Hence, one would expect that hot-compaction under vacuum could reduce the formation of
crack-like elongated pores during foaming of foamable PM precursors both with and free of
TiH2.
16
A previous own study on the effect of relative humidity on PIF of AlSi8Mg4 precursors
showed that powders react with ambient humidity during storage and hot compaction [Jime07].
The cracks observed, by means of in-situ X-ray radioscopy, in these precursors free of TiH2,
indicate that TiH2 is not the only responsible for crack-like pore formation, other gas sources
also contribute. For those AlSi8Mg4 PM precursors it was determined that adsorbed water
resulted in hydrogen pickup that tended to be released before melting of the alloy, leading to
crack formation and later irregular pore structure. Compaction under vacuum was also tested and
yielded a modest ~1.5 area expansion combined with a reduced crack-formation which resulted
in a more regular pore structure. Apart from this, the influence of the compaction atmosphere on
the foaming behaviour of Al-based PM precursors containing TiH2 has not been studied
systematically in the past.
1.3 Phase transformation sequence and decomposition kinetics of TiH2
The second objective of the present thesis is to elucidate whether there is a relationship
between the regimes of hydrogen release and phase transformation sequence undergone in the
decomposition of TiH2. This was performed both on untreated and pre-treated TiH2 during
isochronal heating under Ar flow. In this work, the term “pre-treated TiH2” signifies that
untreated TiH2 powders were oxidized in air at 480 °C for 180 minutes. In addition, effort was
made to evaluate the applicability of a core-shell model for a physico-geometrical description of
the particle evolution during the whole decomposition process. The decomposition kinetics of
untreated and pre-treated TiH2 are utterly relevant to different steps in the PM route: compaction,
foaming and solidification.
Background
A suitable strategy to study a relationship between phase transformation sequence and
kinetics of hydrogen release during decomposition is to combine in-situ techniques, such as
thermo-analysis (for the kinetics) and in-situ diffraction (to follow the phase transformation).
Previous studies followed this strategy, but none of them could clearly relate the phase
transformation sequence with the regimes of hydrogen release for the whole decomposition
process [Taka95, Matl06b, Zsch05, Mala09]. Nevertheless, they provided evidence for the
17
existence of a relationship. They also indicated the applicability of a core-shell model, composed
of three phases from the binary Ti-H phase diagram to describe the phase transformation
sequence inside a particle of untreated TiH2 under flowing inert gas [Scho73, Swis72, Han98].
These three phases are: the hydride δ, and two interstitial solid solutions of hydrogen, β and α,
based on the allotropic α and β forms of pure Ti [SanM87]. Some relevant features of the three
phases will be described later in section 1.4. By now, in order to continue with the core-shell
concept, it is only relevant to know that at any temperature the solubility (S) of hydrogen in the
three phases is minimum in α, intermediate in β and maximum in δ, i.e. . For this
reason, and as hydrogen is released through the surface of particles and removed by inert gas
flow, Han et al. suggested that during the isochronal decomposition of TiH2, the phases β and α
would appear in turn with decreasing hydrogen content [Han98].
δβαHHH SSS <<
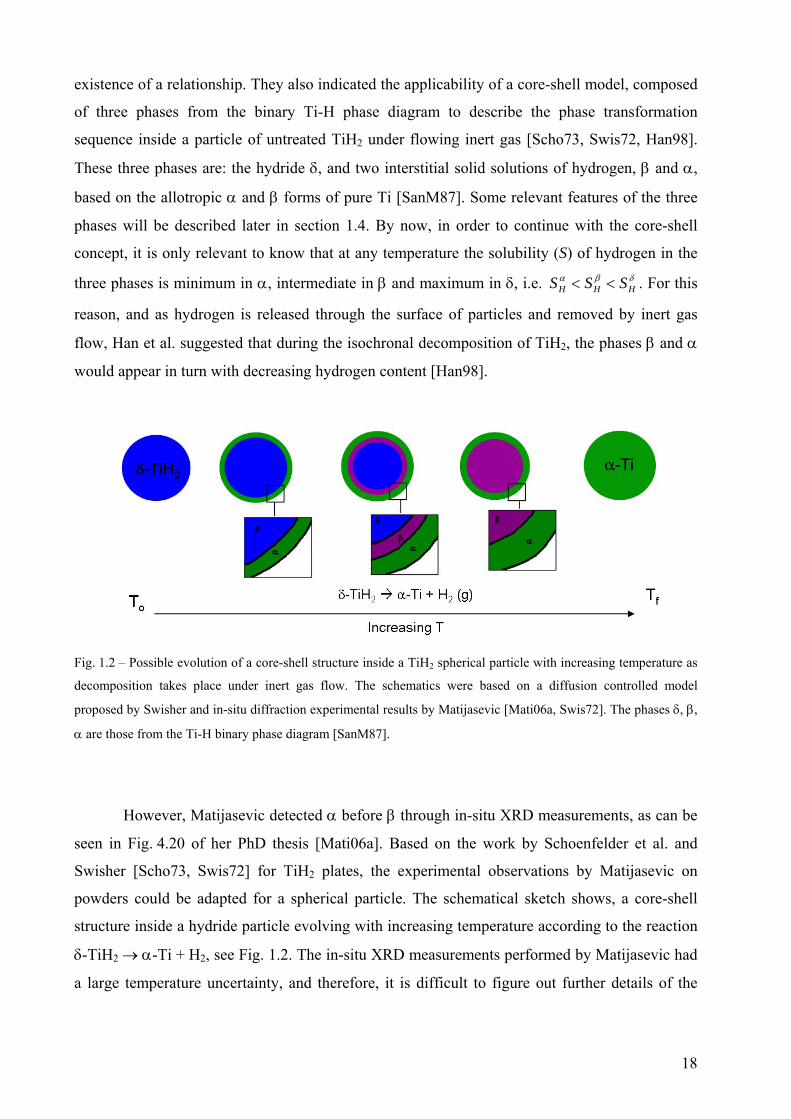
Fig. 1.2 – Possible evolution of a core-shell structure inside a TiH2 spherical particle with increasing temperature as
decomposition takes place under inert gas flow. The schematics were based on a diffusion controlled model
proposed by Swisher and in-situ diffraction experimental results by Matijasevic [Mati06a, Swis72]. The phases δ, β,
α are those from the Ti-H binary phase diagram [SanM87].
However, Matijasevic detected α before β through in-situ XRD measurements, as can be
seen in Fig. 4.20 of her PhD thesis [Mati06a]. Based on the work by Schoenfelder et al. and
Swisher [Scho73, Swis72] for TiH2 plates, the experimental observations by Matijasevic on
powders could be adapted for a spherical particle. The schematical sketch shows, a core-shell
structure inside a hydride particle evolving with increasing temperature according to the reaction
δ-TiH2 → α-Ti + H2, see Fig. 1.2. The in-situ XRD measurements performed by Matijasevic had
a large temperature uncertainty, and therefore, it is difficult to figure out further details of the
18
phase transformation sequence. Thus the relationship between phase transformation sequence
and regimes of hydrogen release remained unclear.
Regarding kinetic studies, most researchers concluded that the phase limiting the out-
gassing from untreated powders is α-Ti [Mati06a, Mala09, Taka95, Swih72, Scho73]. The
activation energies for hydrogen desorption (from TiH2) determined by Takasaki and
Malachevsky from thermo-analysis, are in good agreement with those for diffusion of hydrogen
through α-Ti. Matijasevic suggested that diffusion through α-Ti is the limiting step as hydrogen
has a lower diffusion coefficient in α-Ti than in β-Ti above 500 °C [Mati06a]. Swisher predicted,
using a diffusion-controlled model of layers, much faster decomposition rates than those
measured by Schoenfelder and himself. Therefore it is difficult to rely on his assessment even if
the basic concept of hydrogen out-gassing limited by an α-Ti outer layer makes sense.
Concerning pre-treated TiH2, it is known that oxidation pre-treatments retard the kinetics of
decomposition [Kenn02, Gerg00, Mati06, Lehm08, Mala09, Yen99]. It is also commonly
accepted that thermally grown TiO2 rutile is responsible for the retardation of hydrogen release
from pre-treated TiH2. This is based on the fact that the diffusion coefficient of hydrogen through
TiO2 rutile is lower than through α-Ti.
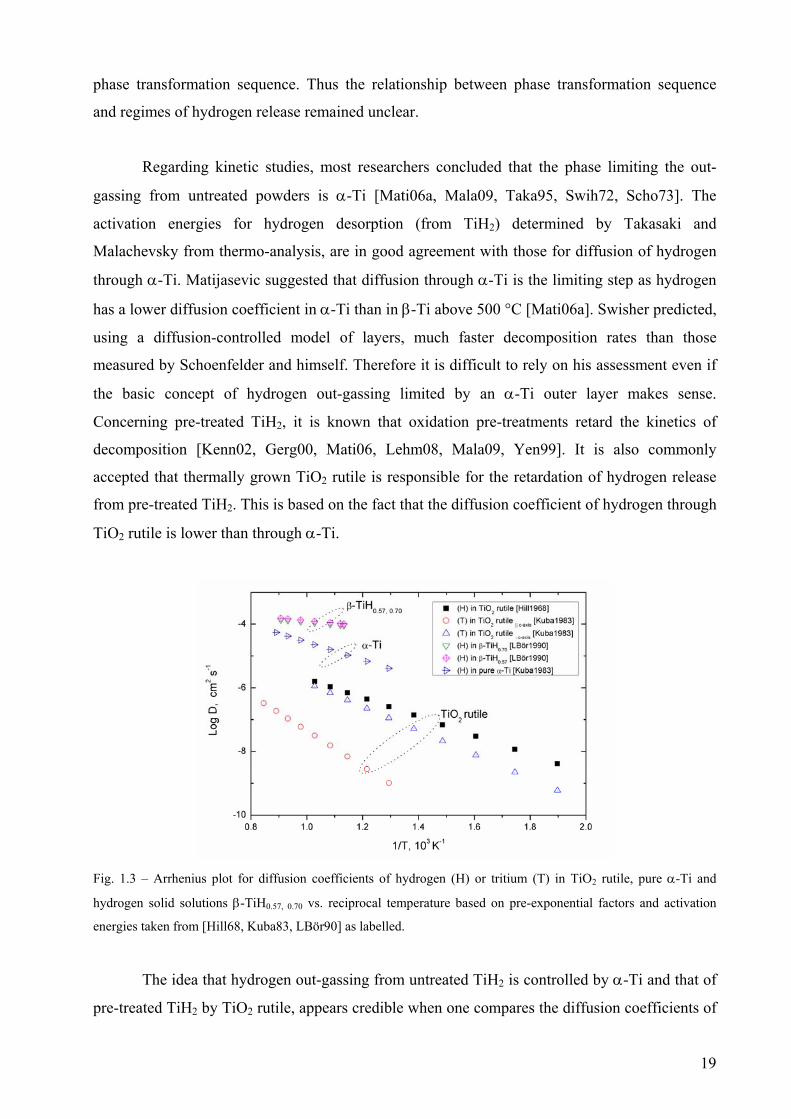
Fig. 1.3 – Arrhenius plot for diffusion coefficients of hydrogen (H) or tritium (T) in TiO2 rutile, pure α-Ti and
hydrogen solid solutions β-TiH0.57, 0.70 vs. reciprocal temperature based on pre-exponential factors and activation
energies taken from [Hill68, Kuba83, LBör90] as labelled.
The idea that hydrogen out-gassing from untreated TiH2 is controlled by α-Ti and that of
pre-treated TiH2 by TiO2 rutile, appears credible when one compares the diffusion coefficients of
19
hydrogen through each phase in the temperature range from 250 to 900 °C. In Fig. 1.3, some
reported values of diffusion coefficients (D) of hydrogen (and tritium through TiO2 rutile)
through pure α-Ti and TiO2 rutile are summarized in an Arrhenius plot (log D vs. 1/T). In any
case, even if hydrogen evolution is controlled by diffusion through α-Ti in untreated TiH2, or
through TiO2 rutile in pre-treated TiH2, the existence of a relationship between decomposition
kinetics and the phase transformation sequence during decomposition remains an open question.
1.4 The Ti-H and Ti-O phase diagrams
The decomposition of untreated and pre-treated TiH2 powders under Ar flow are
non-equilibrium problems. Nevertheless, the binary Ti-H and Ti-O phase diagrams can provide
useful information for the interpretation of the phase transformation sequence. However,
particularly for the Ti-H binary phase diagram, a lack of understanding or knowledge of the
conditions in which the diagram was assessed could mislead the interpretation of results. For this
reason, some features considered necessary corresponding to both phase diagrams will be
introduced in this section.
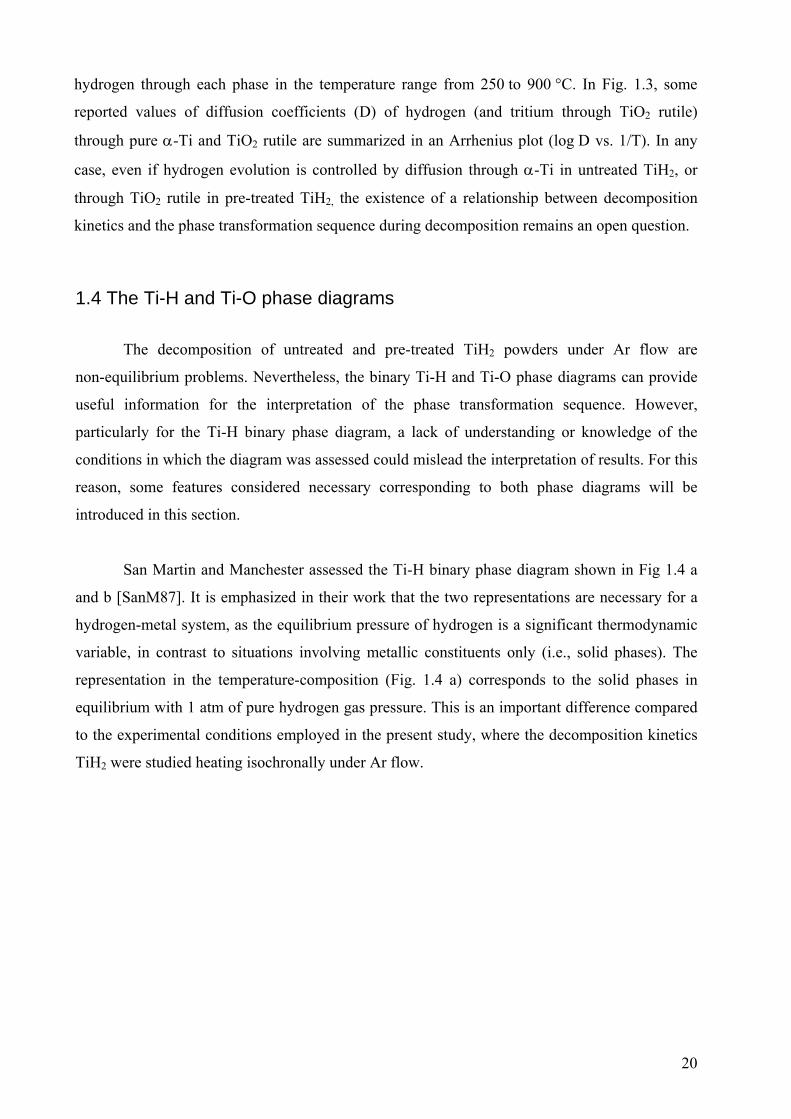
San Martin and Manchester assessed the Ti-H binary phase diagram shown in Fig 1.4 a
and b [SanM87]. It is emphasized in their work that the two representations are necessary for a
hydrogen-metal system, as the equilibrium pressure of hydrogen is a significant thermodynamic
variable, in contrast to situations involving metallic constituents only (i.e., solid phases). The
representation in the temperature-composition (Fig. 1.4 a) corresponds to the solid phases in
equilibrium with 1 atm of pure hydrogen gas pressure. This is an important difference compared
to the experimental conditions employed in the present study, where the decomposition kinetics
TiH2 were studied heating isochronally under Ar flow.
20
(a)
(b) Fig. 1.4 – Two representations of the titanium-hydrogen phase diagram assessed by San-Martin and Manchester. a)
Temperature-concentration plane in °C vs. at.% H and b) Isotherms in °C in the pressure-composition plane in Pa
vs. atomic ratio H/Ti [SanM87].
21
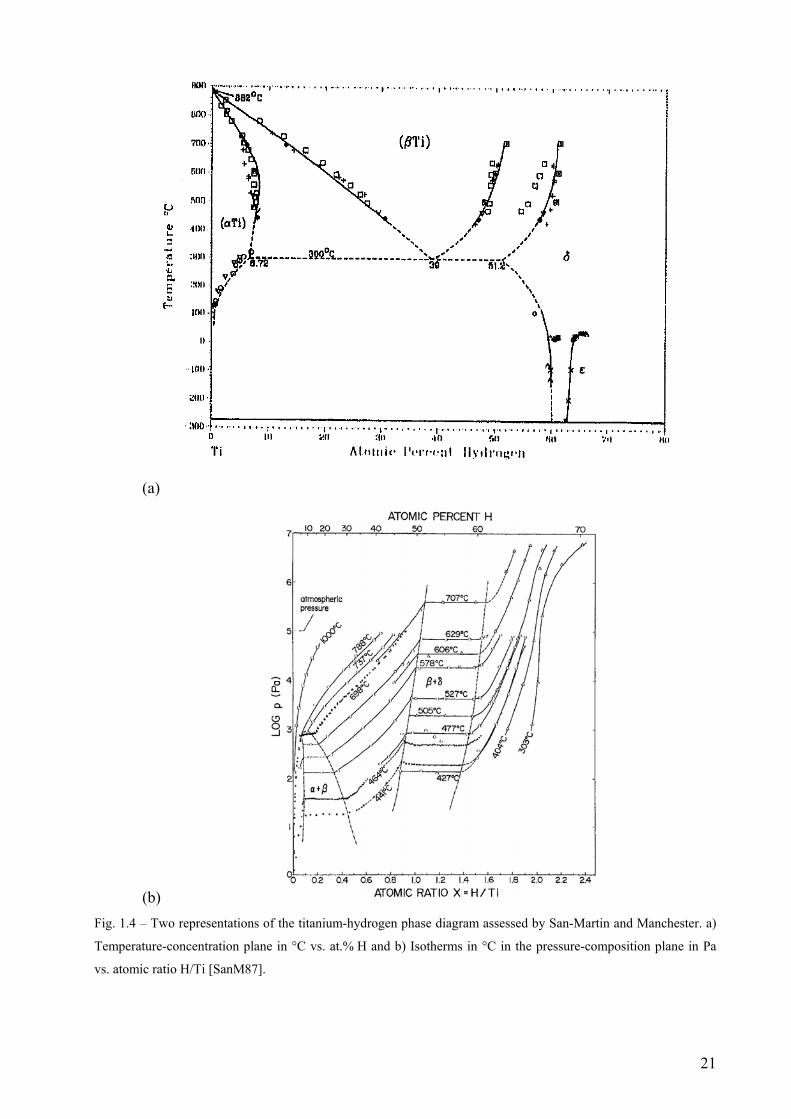
The Ti-H system is of the eutectoid type. Hydrogen in solid solution stabilizes the β
phase down to 300°C at the eutectoid composition 39 at.% H in equilibrium with 1 atm of pure
hydrogen gas pressure. It consists of the following stable phases: the hexagonal closed-packed
α-Ti, the body-centred cubic β-Ti, two interstitial solid solutions of hydrogen based on the
allotropic α and β forms of pure Ti, the face-centred cubic δ-TiH2 and the tetragonal bct ε-TiH2
with axial ratio c/a < 1. Crystal structure and lattice parameter data are given in Tables 1 and 2
[SanM87].
22
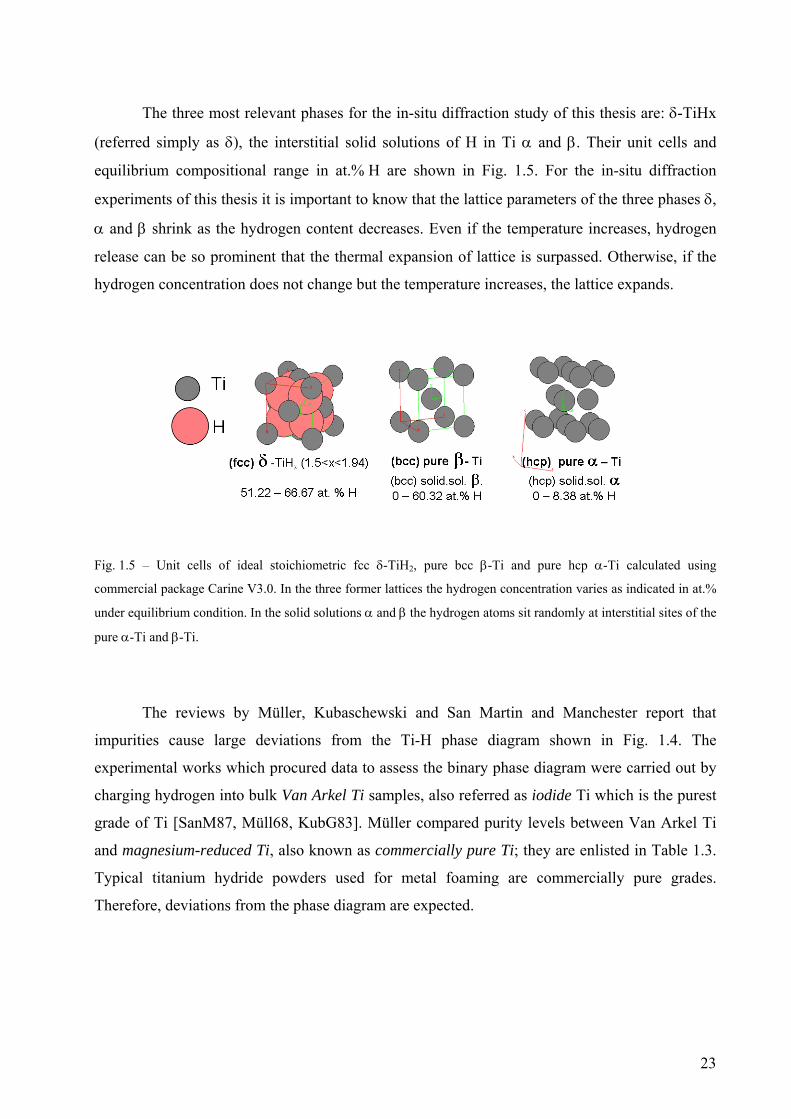
The three most relevant phases for the in-situ diffraction study of this thesis are: δ-TiHx
(referred simply as δ), the interstitial solid solutions of H in Ti α and β. Their unit cells and
equilibrium compositional range in at.% H are shown in Fig. 1.5. For the in-situ diffraction
experiments of this thesis it is important to know that the lattice parameters of the three phases δ,
α and β shrink as the hydrogen content decreases. Even if the temperature increases, hydrogen
release can be so prominent that the thermal expansion of lattice is surpassed. Otherwise, if the
hydrogen concentration does not change but the temperature increases, the lattice expands.
Fig. 1.5 – Unit cells of ideal stoichiometric fcc δ-TiH2, pure bcc β-Ti and pure hcp α-Ti calculated using
commercial package Carine V3.0. In the three former lattices the hydrogen concentration varies as indicated in at.%
under equilibrium condition. In the solid solutions α and β the hydrogen atoms sit randomly at interstitial sites of the
pure α-Ti and β-Ti.
The reviews by Müller, Kubaschewski and San Martin and Manchester report that
impurities cause large deviations from the Ti-H phase diagram shown in Fig. 1.4. The
experimental works which procured data to assess the binary phase diagram were carried out by
charging hydrogen into bulk Van Arkel Ti samples, also referred as iodide Ti which is the purest
grade of Ti [SanM87, Müll68, KubG83]. Müller compared purity levels between Van Arkel Ti
and magnesium-reduced Ti, also known as commercially pure Ti; they are enlisted in Table 1.3.
Typical titanium hydride powders used for metal foaming are commercially pure grades.
Therefore, deviations from the phase diagram are expected.
23
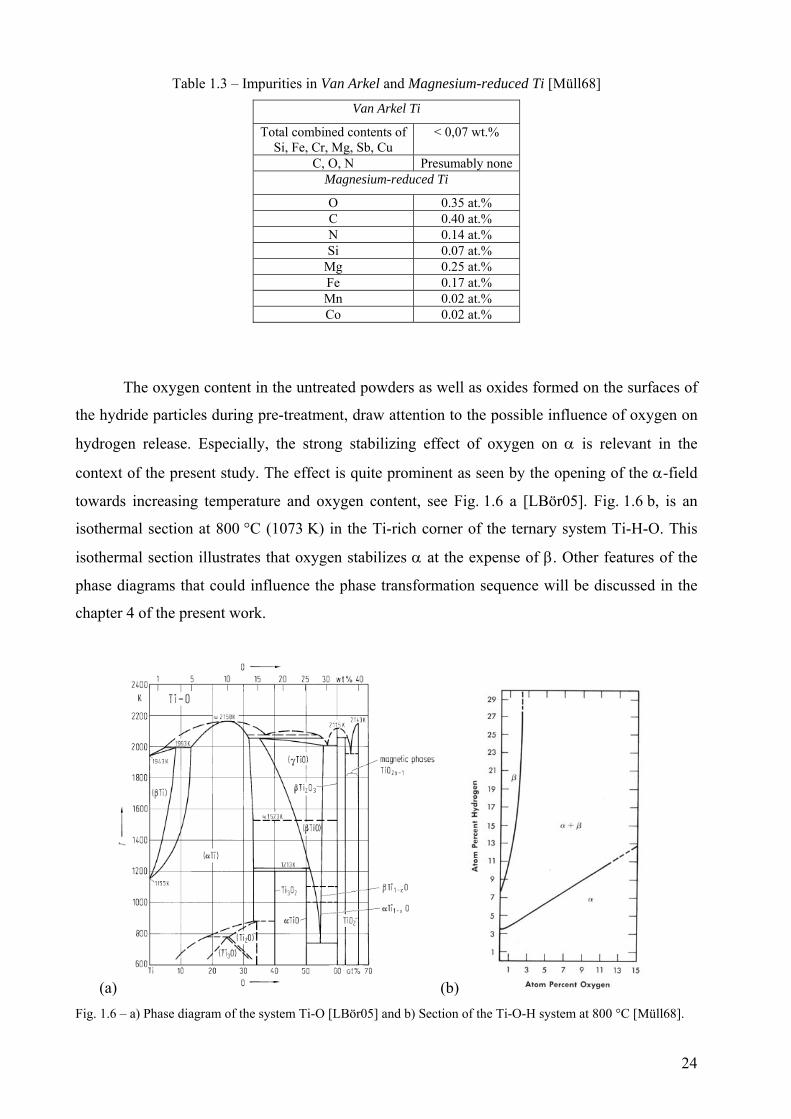
Table 1.3 – Impurities in Van Arkel and Magnesium-reduced Ti [Müll68]
Van Arkel Ti
Total combined contents of Si, Fe, Cr, Mg, Sb, Cu
< 0,07 wt.%
C, O, N Presumably none Magnesium-reduced Ti
O 0.35 at.% C 0.40 at.% N 0.14 at.% Si 0.07 at.%
Mg 0.25 at.% Fe 0.17 at.% Mn 0.02 at.% Co 0.02 at.%
The oxygen content in the untreated powders as well as oxides formed on the surfaces of
the hydride particles during pre-treatment, draw attention to the possible influence of oxygen on
hydrogen release. Especially, the strong stabilizing effect of oxygen on α is relevant in the
context of the present study. The effect is quite prominent as seen by the opening of the α-field
towards increasing temperature and oxygen content, see Fig. 1.6 a [LBör05]. Fig. 1.6 b, is an
isothermal section at 800 °C (1073 K) in the Ti-rich corner of the ternary system Ti-H-O. This
isothermal section illustrates that oxygen stabilizes α at the expense of β. Other features of the
phase diagrams that could influence the phase transformation sequence will be discussed in the
chapter 4 of the present work.
(a) (b) Fig. 1.6 – a) Phase diagram of the system Ti-O [LBör05] and b) Section of the Ti-O-H system at 800 °C [Müll68].
24
1.5 Objectives and methodology of the thesis
• The first objective is to evaluate whether hot compaction under vacuum is a good
strategy to produce aluminium foams, with and without TiH2, of more regular pore sizes. If yes,
why?
In order to give an answer to this question, a chamber to perform hot-compaction under
controlled atmosphere was designed, built and set up. Then, AlSi11 precursors free of and
containing TiH2 were compacted both, under vacuum and air. These four types of compacts were
compared in terms of properties of the compacted materials, foaming behaviour, hydrogen
evolution and resulting foam structure.
• The second objective is to clarify whether there is a relationship between the phase
transformation sequence and the stages of hydrogen release during the decomposition of
untreated and pre-treated TiH2. If yes, could a core-shell model describe the whole process of
decomposition?
For the study of this problem, the phase transformation sequence of both, untreated and
pre-treated TiH2, was followed in-situ by energy dispersive X-ray diffraction (ED-XRD) using
synchrotron radiation at the EDDI beamline which operates at the BESSY synchrotron facility in
Berlin. In addition, the hydrogen release was followed in-situ by simultaneous thermo-
gravimetry and mass spectrometry (TG-MS), and the results from in-situ ED-XRD experiments
were analysed to determine volume fractions of phases. From this analysis, the core-shell
structure of a representative untreated and pre-treated TiH2 particle was estimated. Since both,
in-situ techniques ED-XRD and TG-MS, provide only integral values, the applicability of the
calculated core-shell arrangement of phases was complemented ex-situ by means of electron
microscopy that provided local information, i.e. the spatial distribution of phases.
25

26
2. Experimental
2.1 Materials and sample preparation methods
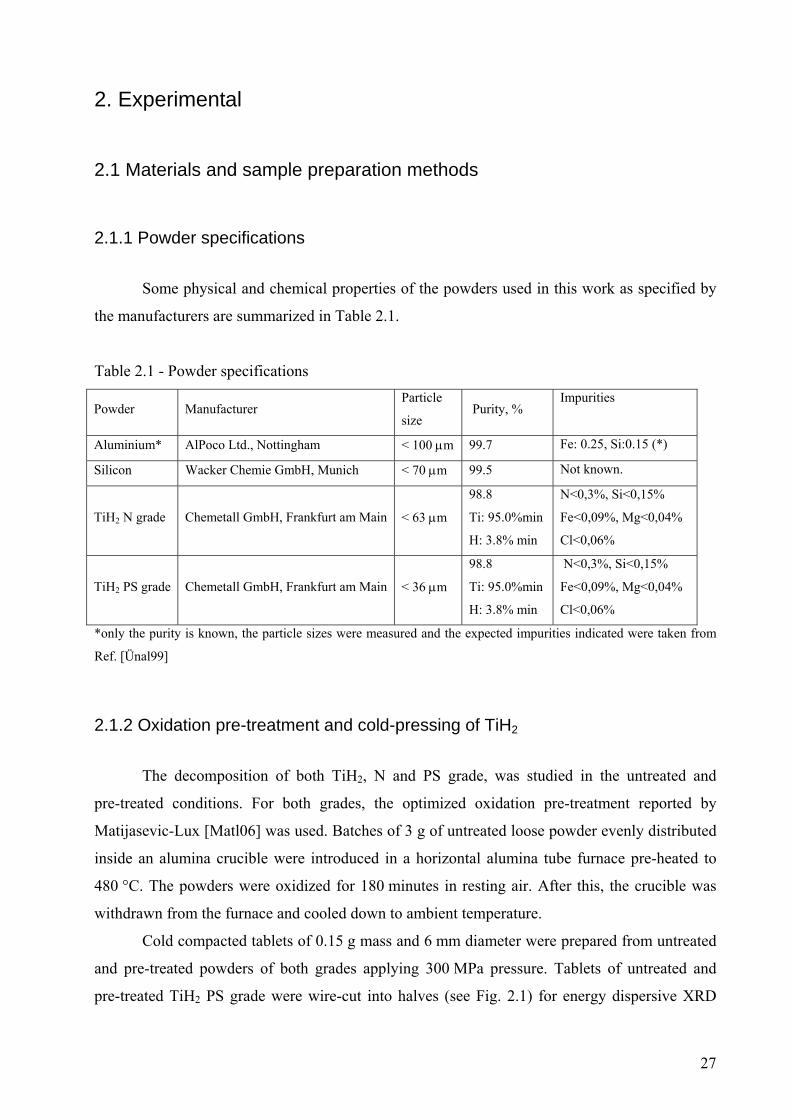
2.1.1 Powder specifications
Some physical and chemical properties of the powders used in this work as specified by
the manufacturers are summarized in Table 2.1.
Table 2.1 - Powder specifications
Powder Manufacturer Particle
size Purity, %
Impurities
Aluminium* AlPoco Ltd., Nottingham < 100 μm 99.7 Fe: 0.25, Si:0.15 (*)
Silicon Wacker Chemie GmbH, Munich < 70 μm 99.5 Not known.
TiH2 N grade Chemetall GmbH, Frankfurt am Main < 63 μm
98.8
Ti: 95.0%min
H: 3.8% min
N<0,3%, Si<0,15%
Fe<0,09%, Mg<0,04%
Cl<0,06%
TiH2 PS grade Chemetall GmbH, Frankfurt am Main < 36 μm
98.8
Ti: 95.0%min
H: 3.8% min
N<0,3%, Si<0,15%
Fe<0,09%, Mg<0,04%
Cl<0,06%
*only the purity is known, the particle sizes were measured and the expected impurities indicated were taken from
Ref. [Ünal99]
2.1.2 Oxidation pre-treatment and cold-pressing of TiH2
The decomposition of both TiH2, N and PS grade, was studied in the untreated and
pre-treated conditions. For both grades, the optimized oxidation pre-treatment reported by
Matijasevic-Lux [Matl06] was used. Batches of 3 g of untreated loose powder evenly distributed
inside an alumina crucible were introduced in a horizontal alumina tube furnace pre-heated to
480 °C. The powders were oxidized for 180 minutes in resting air. After this, the crucible was
withdrawn from the furnace and cooled down to ambient temperature.
Cold compacted tablets of 0.15 g mass and 6 mm diameter were prepared from untreated
and pre-treated powders of both grades applying 300 MPa pressure. Tablets of untreated and
pre-treated TiH2 PS grade were wire-cut into halves (see Fig. 2.1) for energy dispersive XRD
27
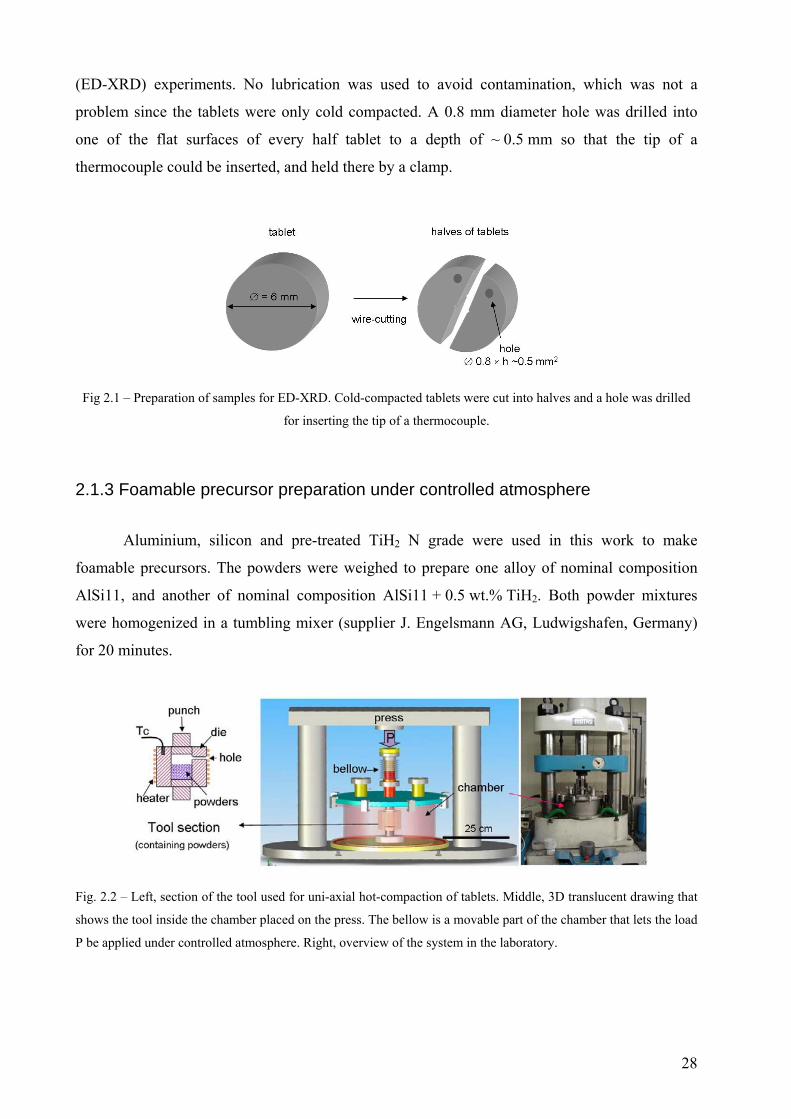
(ED-XRD) experiments. No lubrication was used to avoid contamination, which was not a
problem since the tablets were only cold compacted. A 0.8 mm diameter hole was drilled into
one of the flat surfaces of every half tablet to a depth of ~ 0.5 mm so that the tip of a
thermocouple could be inserted, and held there by a clamp.
Fig 2.1 – Preparation of samples for ED-XRD. Cold-compacted tablets were cut into halves and a hole was drilled
for inserting the tip of a thermocouple.
2.1.3 Foamable precursor preparation under controlled atmosphere
Aluminium, silicon and pre-treated TiH2 N grade were used in this work to make
foamable precursors. The powders were weighed to prepare one alloy of nominal composition
AlSi11, and another of nominal composition AlSi11 + 0.5 wt.% TiH2. Both powder mixtures
were homogenized in a tumbling mixer (supplier J. Engelsmann AG, Ludwigshafen, Germany)
for 20 minutes.
Fig. 2.2 – Left, section of the tool used for uni-axial hot-compaction of tablets. Middle, 3D translucent drawing that
shows the tool inside the chamber placed on the press. The bellow is a movable part of the chamber that lets the load
P be applied under controlled atmosphere. Right, overview of the system in the laboratory.
28
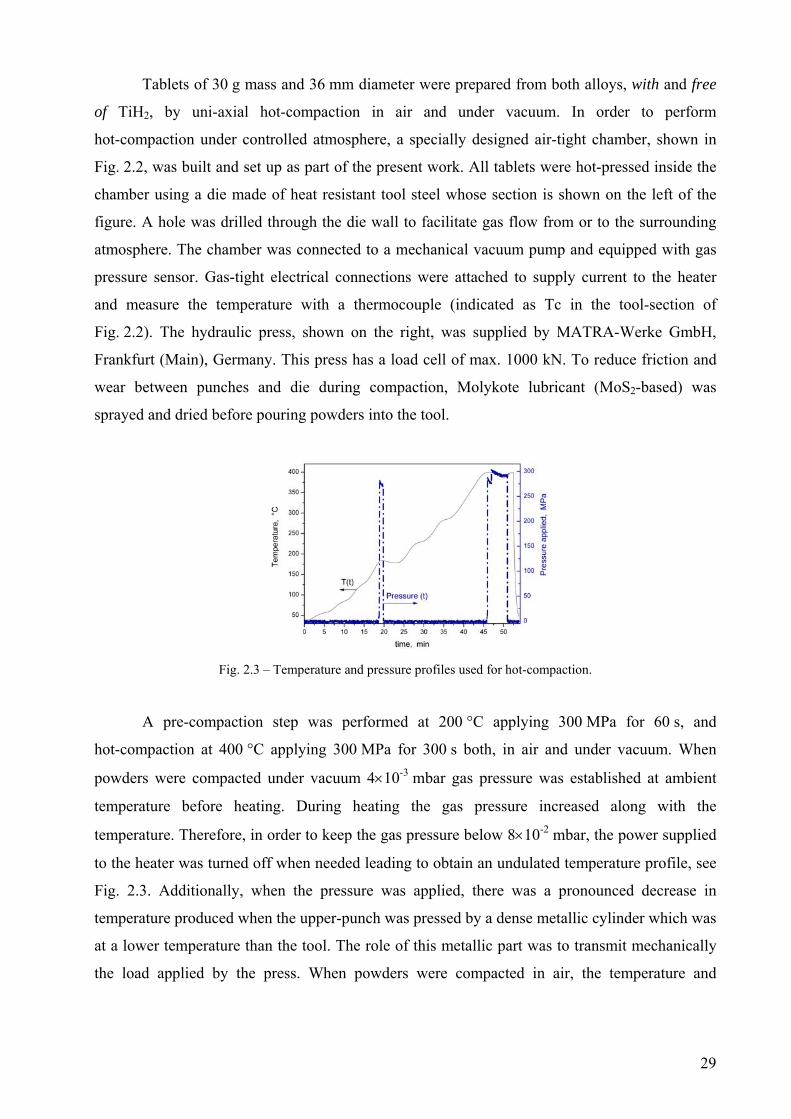
Tablets of 30 g mass and 36 mm diameter were prepared from both alloys, with and free
of TiH2, by uni-axial hot-compaction in air and under vacuum. In order to perform
hot-compaction under controlled atmosphere, a specially designed air-tight chamber, shown in
Fig. 2.2, was built and set up as part of the present work. All tablets were hot-pressed inside the
chamber using a die made of heat resistant tool steel whose section is shown on the left of the
figure. A hole was drilled through the die wall to facilitate gas flow from or to the surrounding
atmosphere. The chamber was connected to a mechanical vacuum pump and equipped with gas
pressure sensor. Gas-tight electrical connections were attached to supply current to the heater
and measure the temperature with a thermocouple (indicated as Tc in the tool-section of
Fig. 2.2). The hydraulic press, shown on the right, was supplied by MATRA-Werke GmbH,
Frankfurt (Main), Germany. This press has a load cell of max. 1000 kN. To reduce friction and
wear between punches and die during compaction, Molykote lubricant (MoS2-based) was
sprayed and dried before pouring powders into the tool.
Fig. 2.3 – Temperature and pressure profiles used for hot-compaction.
A pre-compaction step was performed at 200 °C applying 300 MPa for 60 s, and
hot-compaction at 400 °C applying 300 MPa for 300 s both, in air and under vacuum. When
powders were compacted under vacuum 4×10⁻³ mbar gas pressure was established at ambient
temperature before heating. During heating the gas pressure increased along with the
temperature. Therefore, in order to keep the gas pressure below 8×10⁻² mbar, the power supplied
to the heater was turned off when needed leading to obtain an undulated temperature profile, see
Fig. 2.3. Additionally, when the pressure was applied, there was a pronounced decrease in
temperature produced when the upper-punch was pressed by a dense metallic cylinder which was
at a lower temperature than the tool. The role of this metallic part was to transmit mechanically
the load applied by the press. When powders were compacted in air, the temperature and
29
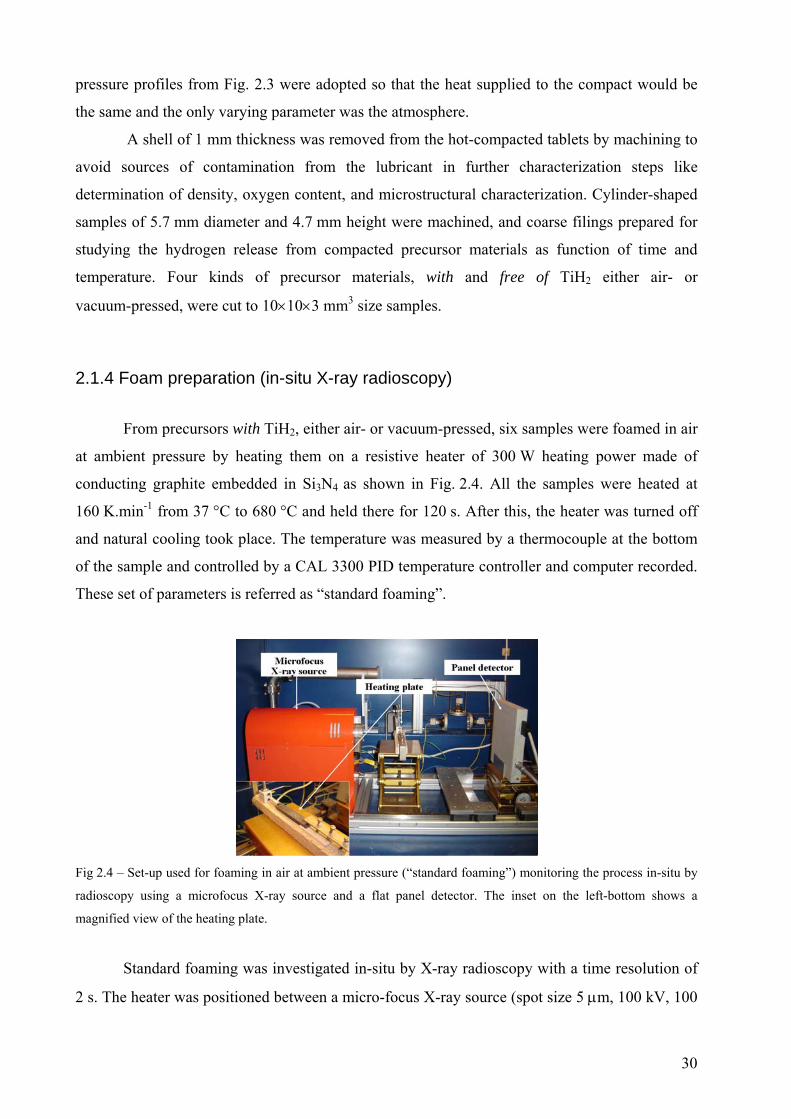
pressure profiles from Fig. 2.3 were adopted so that the heat supplied to the compact would be
the same and the only varying parameter was the atmosphere.
A shell of 1 mm thickness was removed from the hot-compacted tablets by machining to
avoid sources of contamination from the lubricant in further characterization steps like
determination of density, oxygen content, and microstructural characterization. Cylinder-shaped
samples of 5.7 mm diameter and 4.7 mm height were machined, and coarse filings prepared for
studying the hydrogen release from compacted precursor materials as function of time and
temperature. Four kinds of precursor materials, with and free of TiH2 either air- or
vacuum-pressed, were cut to 10×10×3 mm3 size samples.
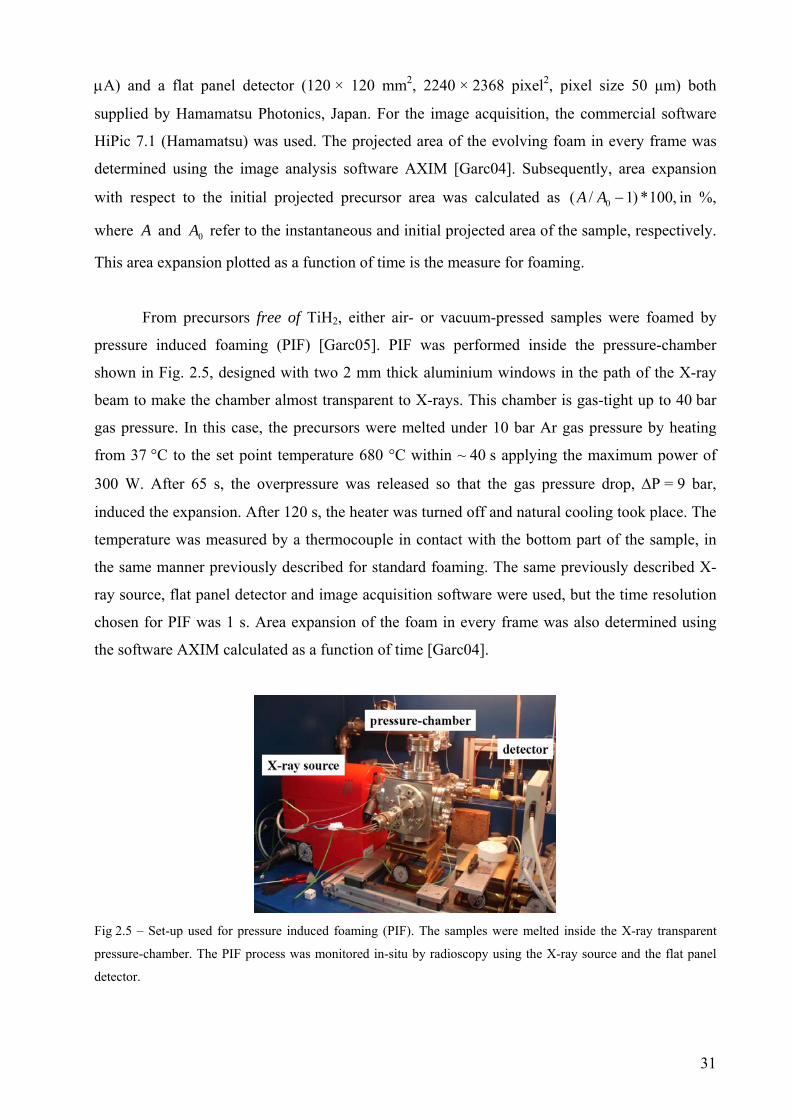
2.1.4 Foam preparation (in-situ X-ray radioscopy)
From precursors with TiH2, either air- or vacuum-pressed, six samples were foamed in air
at ambient pressure by heating them on a resistive heater of 300 W heating power made of
conducting graphite embedded in Si3N4 as shown in Fig. 2.4. All the samples were heated at
160 K.min-1 from 37 °C to 680 °C and held there for 120 s. After this, the heater was turned off
and natural cooling took place. The temperature was measured by a thermocouple at the bottom
of the sample and controlled by a CAL 3300 PID temperature controller and computer recorded.
These set of parameters is referred as “standard foaming”.
Fig 2.4 – Set-up used for foaming in air at ambient pressure (“standard foaming”) monitoring the process in-situ by
radioscopy using a microfocus X-ray source and a flat panel detector. The inset on the left-bottom shows a
magnified view of the heating plate.
Standard foaming was investigated in-situ by X-ray radioscopy with a time resolution of
2 s. The heater was positioned between a micro-focus X-ray source (spot size 5 μm, 100 kV, 100
30
μA) and a flat panel detector (120 × 120 mm2, 2240 × 2368 pixel2, pixel size 50 μm) both
supplied by Hamamatsu Photonics, Japan. For the image acquisition, the commercial software
HiPic 7.1 (Hamamatsu) was used. The projected area of the evolving foam in every frame was
determined using the image analysis software AXIM [Garc04]. Subsequently, area expansion
with respect to the initial projected precursor area was calculated as in %,
where
,100*)1/( 0 −AA
A and refer to the instantaneous and initial projected area of the sample, respectively.
This area expansion plotted as a function of time is the measure for foaming.
0A
From precursors free of TiH2, either air- or vacuum-pressed samples were foamed by
pressure induced foaming (PIF) [Garc05]. PIF was performed inside the pressure-chamber
shown in Fig. 2.5, designed with two 2 mm thick aluminium windows in the path of the X-ray
beam to make the chamber almost transparent to X-rays. This chamber is gas-tight up to 40 bar
gas pressure. In this case, the precursors were melted under 10 bar Ar gas pressure by heating
from 37 °C to the set point temperature 680 °C within ~ 40 s applying the maximum power of
300 W. After 65 s, the overpressure was released so that the gas pressure drop, ΔP = 9 bar,
induced the expansion. After 120 s, the heater was turned off and natural cooling took place. The
temperature was measured by a thermocouple in contact with the bottom part of the sample, in
the same manner previously described for standard foaming. The same previously described X-
ray source, flat panel detector and image acquisition software were used, but the time resolution
chosen for PIF was 1 s. Area expansion of the foam in every frame was also determined using
the software AXIM calculated as a function of time [Garc04].
Fig 2.5 – Set-up used for pressure induced foaming (PIF). The samples were melted inside the X-ray transparent
pressure-chamber. The PIF process was monitored in-situ by radioscopy using the X-ray source and the flat panel
detector.
31
2.2 Characterization Methods
2.2.1 Particle size analysis The particle size distributions of the powders were determined using a Sympatec Helos
Vectra particle analyser. Powders were dispersed in distilled water to which a drop of soap was
added to stabilize a suspension. Possible agglomerates were destroyed by ultrasound. Then the
suspension flowed between two flat glasses so that a layer of the suspension was flowing in
between them. By shining a laser beam through the glass window containing the flowing
suspension, diffracted ring patterns were produced and detected by an area detector from which
the particles size distribution was derived.
2.2.2 Oxygen content analysis The oxygen content of all the powders, including the as-received and pre-treated
conditions of TiH2, compacted foamable precursor material, and partially decomposed TiH2 PS
grade tablets was determined by carrier gas hot extraction in a Horiba EMGA 620 WC
nitrogen/oxygen analyser. Between 5 and 20 mg of material were put into a tin, then into a nickel
capsule, and subsequently into a graphite crucible. By heating electrically the graphite crucible
up to 2300 °C for 40 s and the oxygen in the sample reacted with carbon to form CO (g). The
carbon monoxide was carried by helium and detected and quantified by infrared absorption
analysis [Grun99].
2.2.3 Pycnometric density determination Densities of Al, Si and pre-treated TiH2 N grade powders were determined by Helium
pycnometry in a Pycnometrics multivolume pycnometer 1305. The instrument has a constant
volume and two cells interconnected by a valve. Between 2 and 3 g of powder were poured into
a bucket and then placed into the measuring cell of the pycnometer. The complete system was
gently flushed and backfilled with He four times. Then the system and the valve connecting both
cells were closed. He gas overpressure was established only in the cell containing the sample.
After that, both cells were interconnected and a gas pressure drop took place. The gas pressure
drop had been calibrated for a standard of known volume and mass, so by comparison, the
sample volume was calculated. As the sample mass was known, the density could be calculated.
32
2.2.4 Light microscopy (LM)
The microstructure of hot-compacted precursor materials was characterized by light
microscopy using a Zeiss Axioplan 2 and the software Zeiss Axiovision 4. For this, the largest
surfaces of 10 × 4 × 2 mm3 samples (10 mm were cut parallel to the compaction direction) were
glued to a metallic support and ground with SiC papers (500 – 4000 grit). Polishing using
diamond suspensions of 3 and 1 μm with a MD-Dac disc (Struers), was followed by end-
polishing using OPU-Endpolitur (SiO2 suspension) with a MD-Chem (Struers) disc. After
polishing, the surfaces were etched for 5 s in aqueous solution of NaOH (10 g of NaOH in 80 ml
of distilled water at 50 °C).
2.2.5 Scanning electron microscopy (SEM)
Morphological characterization of all powders, and microstructural investigations were
carried out by scanning electron microscopy using a SmartSEMTM model SUPRA VP scanning
electron microscope manufactured by Zeiss. The microscope has a GEMINI® electron beam
column operated at 10 kV of accelerating voltage. A cross-focussed ion beam was operated at
30 kV and 200 pA in the FIB/SEM workstation to mill sections of untreated and pre-treated TiH2
PS grade particles. The thickness of the oxidized layer created by the pre-treatment was
estimated by imaging with the inlens detector. For powder morphology characterization, a small
quantity of powder was dispersed in a drop of silver suspension. After the solvent had
evaporated, the powders were introduced into the microscope. For microstructural
characterization of compacted precursor material, the surfaces were ground, polished and etched
as already described in the light microscopy section.
2.2.6 Transmission electron microscopy (TEM)
TEM was used to investigate TiH2 PS powders in the untreated condition and
cold-compacted samples after partial decomposition. The microscope used was a LIBRA 200
manufactured by Zeiss. The column has a field emission source running at 200 kV of
accelerating voltage and a parallel illumination system. Bright field images and electron
33
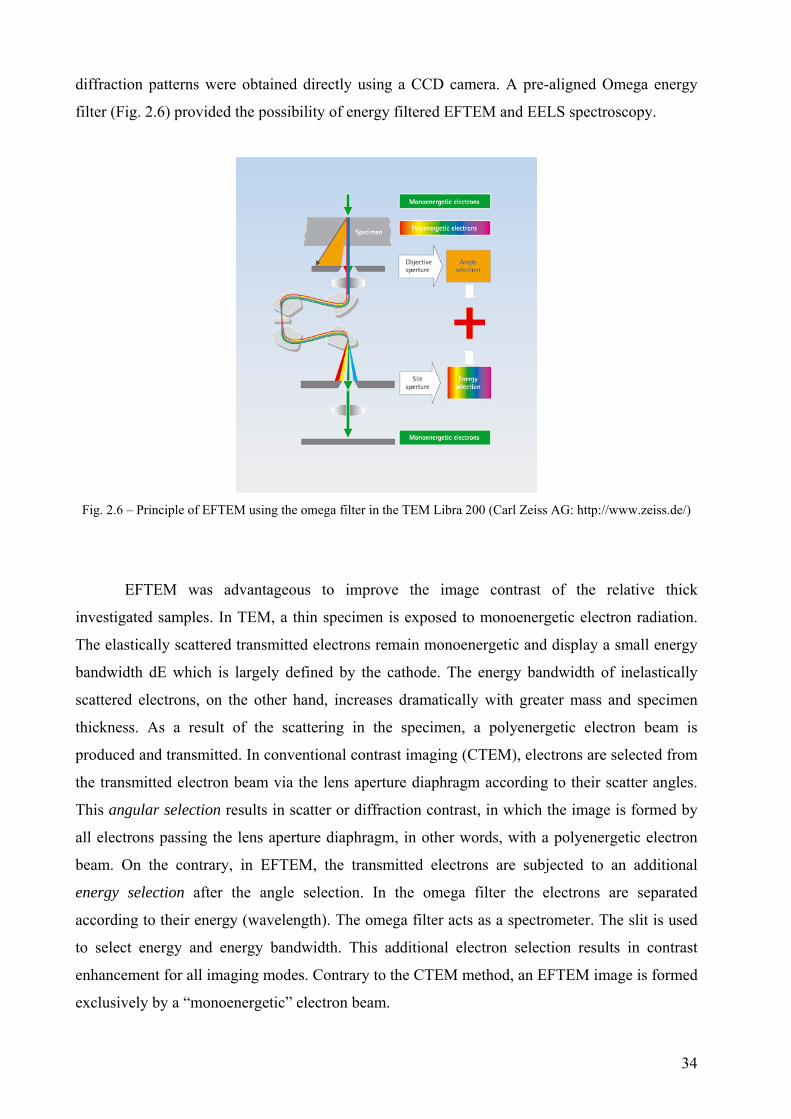
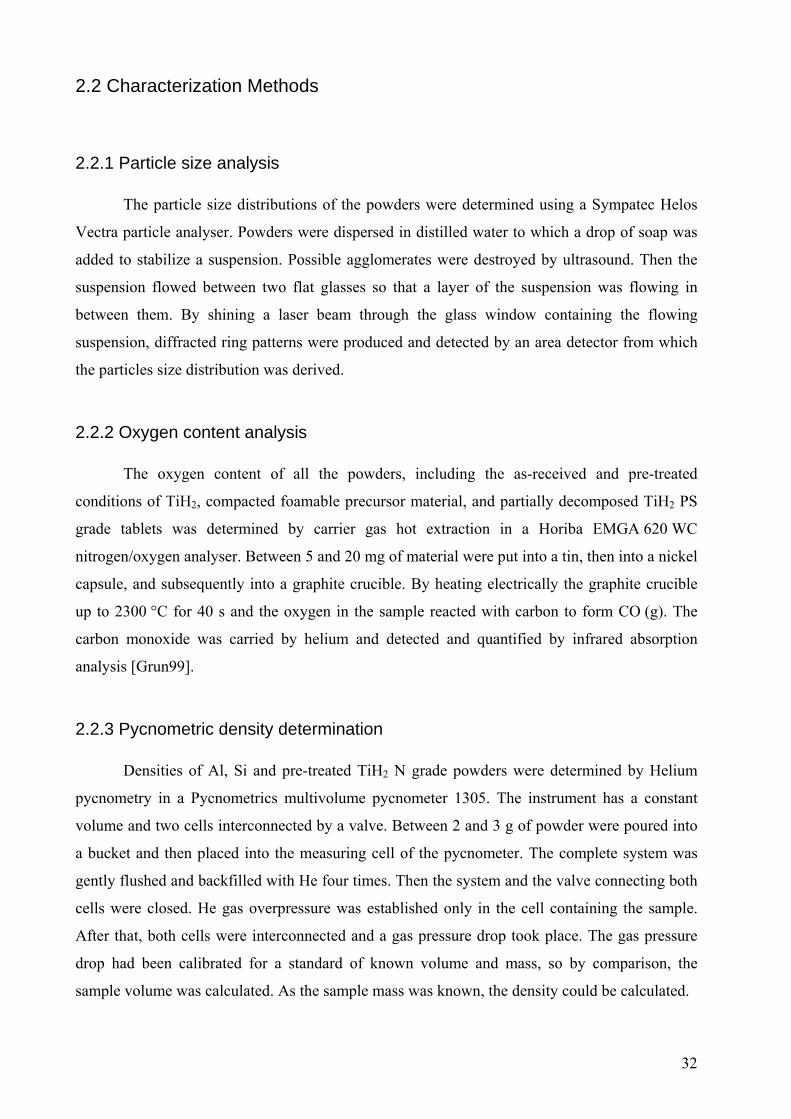
diffraction patterns were obtained directly using a CCD camera. A pre-aligned Omega energy
filter (Fig. 2.6) provided the possibility of energy filtered EFTEM and EELS spectroscopy.
Fig. 2.6 – Principle of EFTEM using the omega filter in the TEM Libra 200 (Carl Zeiss AG: http://www.zeiss.de/)
EFTEM was advantageous to improve the image contrast of the relative thick
investigated samples. In TEM, a thin specimen is exposed to monoenergetic electron radiation.
The elastically scattered transmitted electrons remain monoenergetic and display a small energy
bandwidth dE which is largely defined by the cathode. The energy bandwidth of inelastically
scattered electrons, on the other hand, increases dramatically with greater mass and specimen
thickness. As a result of the scattering in the specimen, a polyenergetic electron beam is
produced and transmitted. In conventional contrast imaging (CTEM), electrons are selected from
the transmitted electron beam via the lens aperture diaphragm according to their scatter angles.
This angular selection results in scatter or diffraction contrast, in which the image is formed by
all electrons passing the lens aperture diaphragm, in other words, with a polyenergetic electron
beam. On the contrary, in EFTEM, the transmitted electrons are subjected to an additional
energy selection after the angle selection. In the omega filter the electrons are separated
according to their energy (wavelength). The omega filter acts as a spectrometer. The slit is used
to select energy and energy bandwidth. This additional electron selection results in contrast
enhancement for all imaging modes. Contrary to the CTEM method, an EFTEM image is formed
exclusively by a “monoenergetic” electron beam.
34
The powder sample preparation consisted of mixing an epoxy resin with titanium nitride
particles. Then, TiH2 powder was added and gently stirred with the previously prepared mixture.
The viscous mixture was cast into small moulds (not much bigger in diameter than the 3 mm
needed to prepare TEM samples, but bulkier) and hardened at 80 °C. Slices were cut, and then
reduced to 8 μm thickness by mechanical polishing. Final thinning was performed by ion
milling. TiH2 and TiN particles were distinguished by EELS spectroscopy. Partially decomposed
compacted powders were wire-cut and embedded in epoxy resin. Then, mechanically polished
and ion milled in the same manner.
2.2.7 Simultaneous thermo-gravimetry (TG) and mass spectrometry (MS)
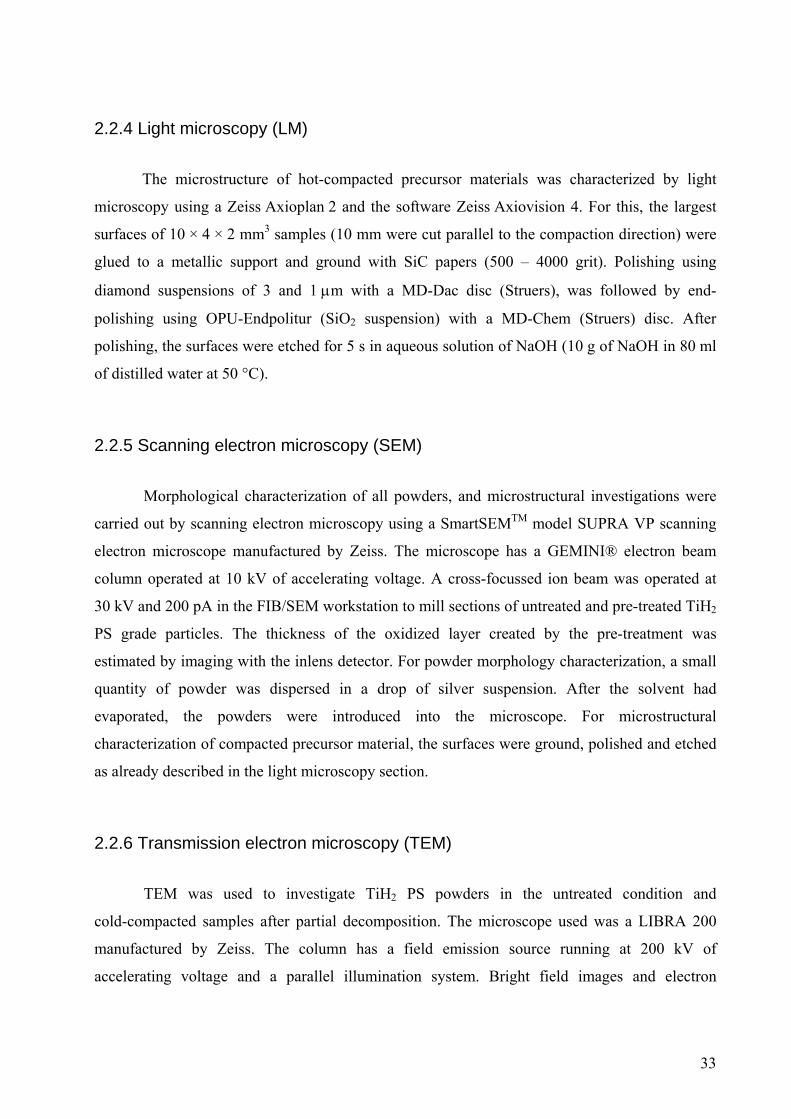
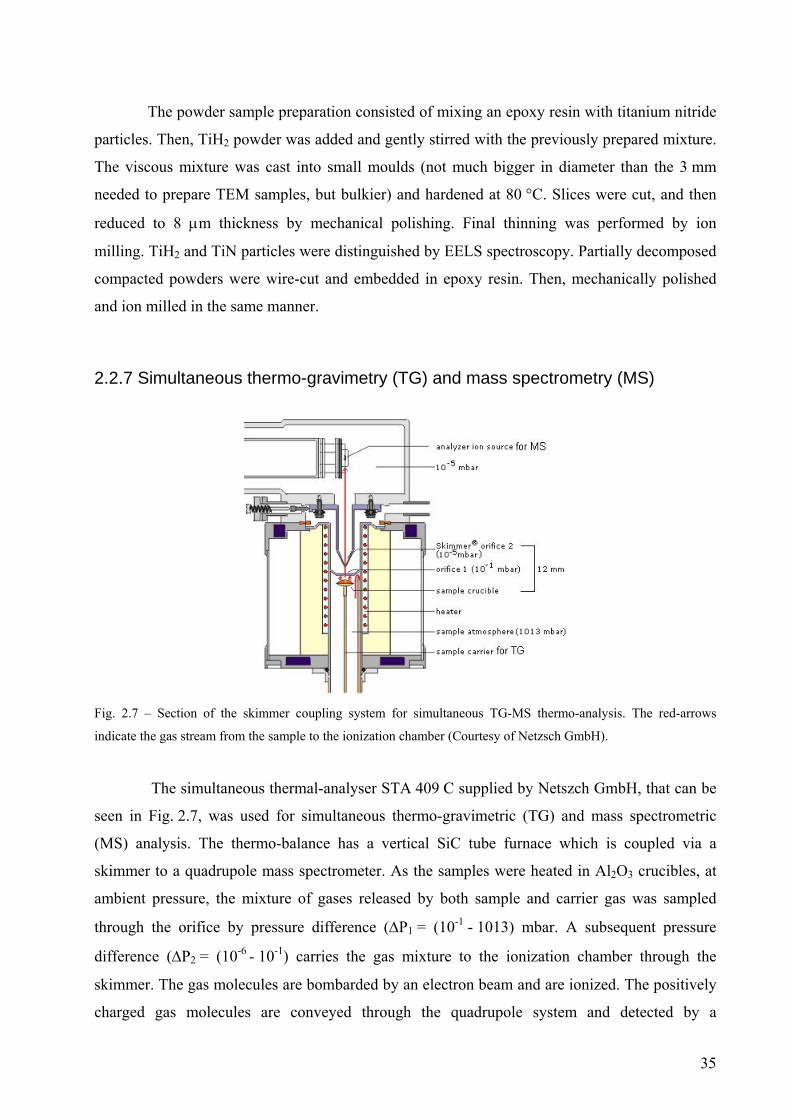
Fig. 2.7 – Section of the skimmer coupling system for simultaneous TG-MS thermo-analysis. The red-arrows
indicate the gas stream from the sample to the ionization chamber (Courtesy of Netzsch GmbH).
The simultaneous thermal-analyser STA 409 C supplied by Netszch GmbH, that can be
seen in Fig. 2.7, was used for simultaneous thermo-gravimetric (TG) and mass spectrometric
(MS) analysis. The thermo-balance has a vertical SiC tube furnace which is coupled via a
skimmer to a quadrupole mass spectrometer. As the samples were heated in Al2O3 crucibles, at
ambient pressure, the mixture of gases released by both sample and carrier gas was sampled
through the orifice by pressure difference (ΔP1 = (10-1 - 1013) mbar. A subsequent pressure
difference (ΔP2 = (10-6 - 10-1) carries the gas mixture to the ionization chamber through the
skimmer. The gas molecules are bombarded by an electron beam and are ionized. The positively
charged gas molecules are conveyed through the quadrupole system and detected by a
35
multichannel analyser. The detected signals are converted into ion currents of a given mass. The
alumina tube furnace was heated up to 1100 °C under flowing Ar in order to passivate any
deposited substances and dry before each series of measurements. Subsequently, the desired
atmospheric condition for the measurements was established and mass spectra corresponding to
the carrier gas (background mass spectra) were acquired during the measurement of the TG
baseline. The background mass spectra were subtracted to the mass spectra acquired for the
sample thus enhancing sensitivity to solid-gas reactions.
The analysis of TiH2, PS and N grades, was performed on 200 mg samples under Ar
atmosphere. For this, the thermo-balance was evacuated and back-filled twice with Ar before the
temperature program was initiated. The analysis of precursor material was performed on 300 mg
samples under flowing synthetic air, which is a dry gas mixture of 20%O2-80%N2. In this case
the balance was also evacuated and back-filled twice with the carrier gas. The precision of the
thermo-balance is 1×10⁻⁴ g. For a sample of 200 mg, the TG curve will have a maximum
instrumental precision of ± 0.05%. As untreated TiH2 loses around 4% mass under Ar flow, a
careful pre-stabilization of the thermo-balance using the corresponding atmosphere was needed.
For this, in every measurement an isothermal step of 20 minutes at 35 °C was applied before the
heating ramp.
2.2.8 Ex-situ angle-dispersive X-ray diffraction (AD-XRD)
X-ray diffraction results from the interaction between X-rays and electrons of atoms.
Depending on the atomic arrangement, interferences between the scattered rays are constructive
when the path difference between two diffracted rays differs by an integral number of
wavelengths. This selective condition is described by Bragg’s law as,
λθ nd hklhkl =sin2
where, λ is the wavelength, dhkl is the d-spacing and θhkl is the Bragg angle, which is half the
angle between incident and reflected beam, and hkl are the Miller indices [Will06, Culli78].
Angle dispersive X-ray diffraction was carried out using a Bruker-AXS D8 Advance
2-circle diffractometer using monochromatic CuKα radiation of 1.54 Å wavelength. θ-2θ scans
were performed on powders samples. The acquired diffractograms were used for phase
36
identification using the search and match routines and the PDF-2-database of the International
Center for Diffraction Data (ICDD-PDF). Lattice parameters of untreated and pre-treated TiH2
were determined by the Rietveld method and the software FullProf [FullPr]. The Rietveld
method is a least square minimization procedure for which, an appropriate model is proposed
that includes the crystal structure, a series of parameters representing instrumental
characteristics, functional behaviour of peak, etc., from which diffracted intensities are
calculated. Then the weighted least square minimization of the parameter χ is carried out using:
∑ =−=i
Minimumcalcyiobsyiwi 2))()((χ (2.1)
with, wi the weight of each observation point, yi(obs) and yi(calc) the observed and calculated
intensities from the model [Will06, McCu98].
2.2.9 In-situ energy-dispersive X-ray diffraction (ED-XRD)
In energy-dispersive X-ray diffraction, polychromatic X-rays, a white beam, are used and
the energy of the diffracted photons is measured at a fixed position 2θ = constant. For a given 2θ
angle, peaks of intensity are detected at particular energies, Ehkl, since the diffracted photon
energies obey Bragg’s law. Therefore, for n = 1
θλν
sin2 hklhkl d
hchchE === (2.2)
Where, h is Planck’s constant and c is the speed of light.
The combination of ED-XRD with the high brilliance of synchrotron radiation is
especially advantageous for kinetic studies. High time resolution is possible using ED-XRD
because the energy of diffracted photons is detected by a multi-channel analyser (MCA) at a
fixed 2θ angle and therefore, the complete diffraction pattern is available at all times. For this
work, in-situ ED-XRD was carried out at the EDDI beamline located at the Berlin synchrotron
radiation facility (BESSY). The schematic layout of the beamline is shown in Fig. 2.8. The
incident beam coming from the wiggler source passes through the slit system S1+S2. It reaches
the goniometer where the sample is positioned. The position of the slit system S3+S4 defines the
37
2θ angle of the diffracted beam and the energy resolution that is acquired by the multichannel
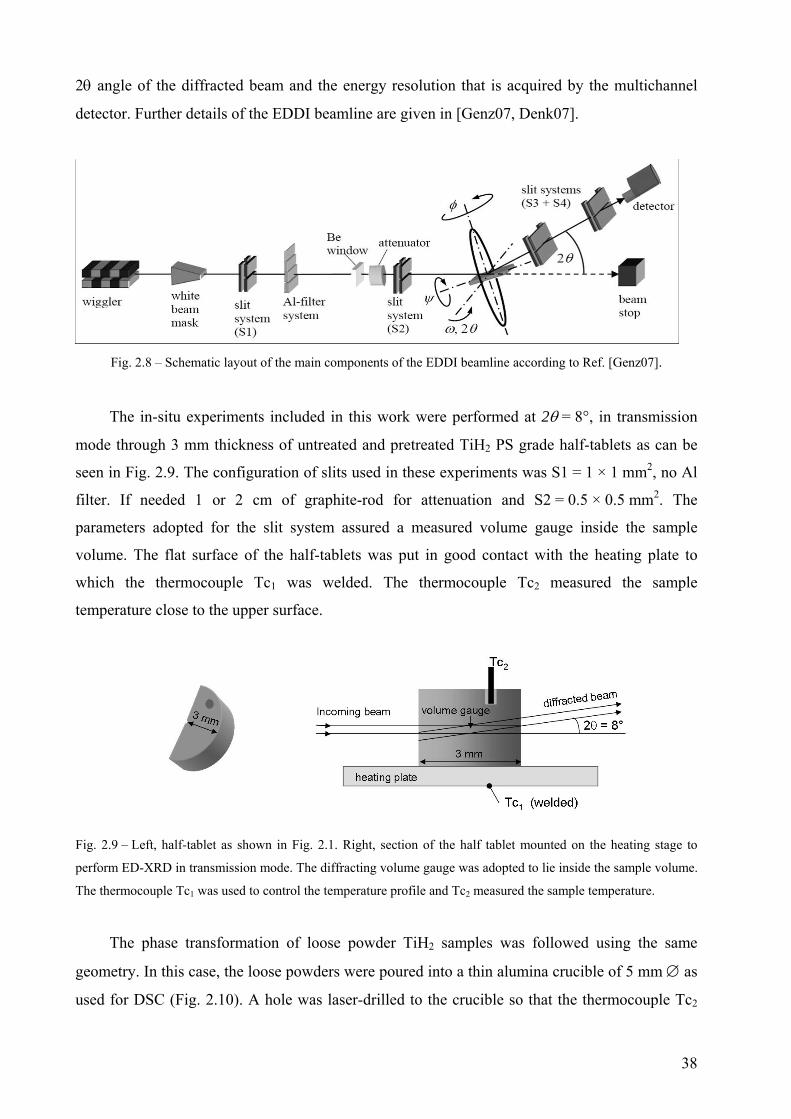
detector. Further details of the EDDI beamline are given in [Genz07, Denk07].
Fig. 2.8 – Schematic layout of the main components of the EDDI beamline according to Ref. [Genz07].
The in-situ experiments included in this work were performed at 2θ = 8°, in transmission
mode through 3 mm thickness of untreated and pretreated TiH2 PS grade half-tablets as can be
seen in Fig. 2.9. The configuration of slits used in these experiments was S1 = 1 × 1 mm2, no Al
filter. If needed 1 or 2 cm of graphite-rod for attenuation and S2 = 0.5 × 0.5 mm2. The
parameters adopted for the slit system assured a measured volume gauge inside the sample
volume. The flat surface of the half-tablets was put in good contact with the heating plate to
which the thermocouple Tc1 was welded. The thermocouple Tc2 measured the sample
temperature close to the upper surface.
Fig. 2.9 – Left, half-tablet as shown in Fig. 2.1. Right, section of the half tablet mounted on the heating stage to
perform ED-XRD in transmission mode. The diffracting volume gauge was adopted to lie inside the sample volume.
The thermocouple Tc1 was used to control the temperature profile and Tc2 measured the sample temperature.
The phase transformation of loose powder TiH2 samples was followed using the same
geometry. In this case, the loose powders were poured into a thin alumina crucible of 5 mm ∅ as
used for DSC (Fig. 2.10). A hole was laser-drilled to the crucible so that the thermocouple Tc2
38
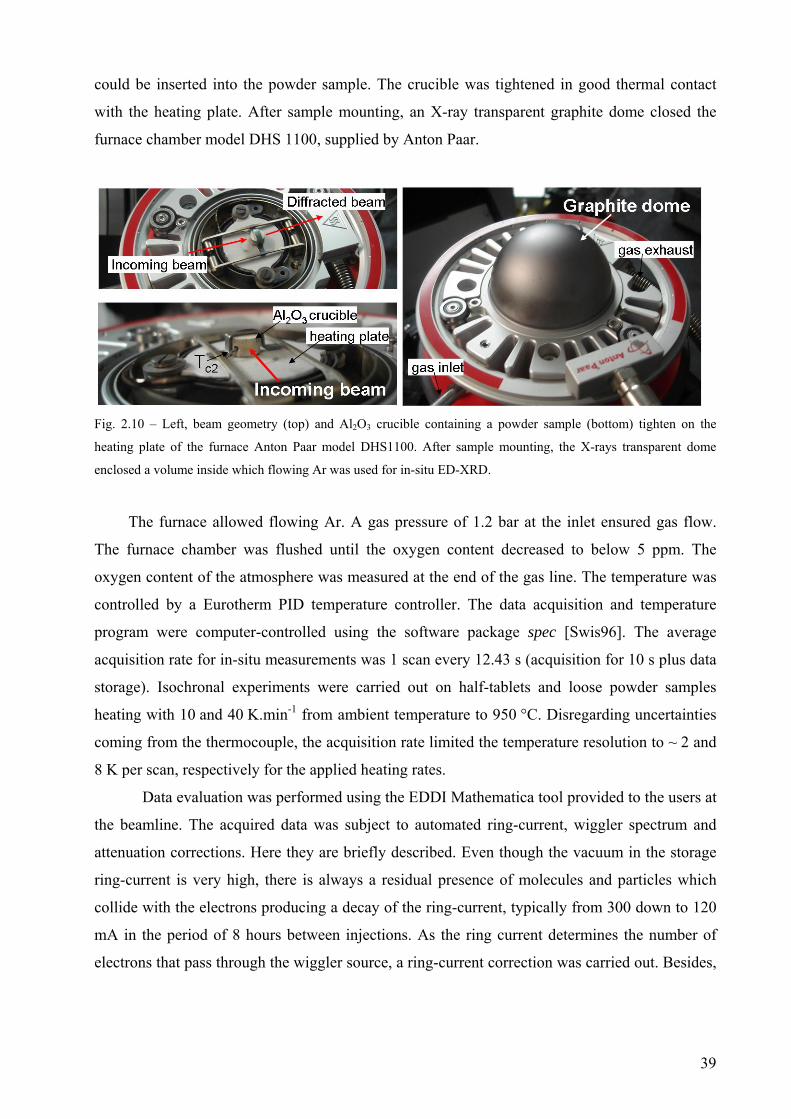
could be inserted into the powder sample. The crucible was tightened in good thermal contact
with the heating plate. After sample mounting, an X-ray transparent graphite dome closed the
furnace chamber model DHS 1100, supplied by Anton Paar.
Fig. 2.10 – Left, beam geometry (top) and Al2O3 crucible containing a powder sample (bottom) tighten on the
heating plate of the furnace Anton Paar model DHS1100. After sample mounting, the X-rays transparent dome
enclosed a volume inside which flowing Ar was used for in-situ ED-XRD.
The furnace allowed flowing Ar. A gas pressure of 1.2 bar at the inlet ensured gas flow.
The furnace chamber was flushed until the oxygen content decreased to below 5 ppm. The
oxygen content of the atmosphere was measured at the end of the gas line. The temperature was
controlled by a Eurotherm PID temperature controller. The data acquisition and temperature
program were computer-controlled using the software package spec [Swis96]. The average
acquisition rate for in-situ measurements was 1 scan every 12.43 s (acquisition for 10 s plus data
storage). Isochronal experiments were carried out on half-tablets and loose powder samples
heating with 10 and 40 K.min-1 from ambient temperature to 950 °C. Disregarding uncertainties
coming from the thermocouple, the acquisition rate limited the temperature resolution to ~ 2 and
8 K per scan, respectively for the applied heating rates.
Data evaluation was performed using the EDDI Mathematica tool provided to the users at
the beamline. The acquired data was subject to automated ring-current, wiggler spectrum and
attenuation corrections. Here they are briefly described. Even though the vacuum in the storage
ring-current is very high, there is always a residual presence of molecules and particles which
collide with the electrons producing a decay of the ring-current, typically from 300 down to 120
mA in the period of 8 hours between injections. As the ring current determines the number of
electrons that pass through the wiggler source, a ring-current correction was carried out. Besides,
39
the wiggler source has a characteristic spectrum of intensities in energies, see ref. [Genz07],
therefore the diffracted intensities were corrected accordingly.
Additionally, the intensity of the incoming beam of X-rays, I, is attenuated by the Ti atoms
according to the Beer-Lambert law
xeII .0 . μ−= (2.3)
where, I0 is the intensity of the incoming beam, μ is the linear absorption coefficient (function of
E for a given atomic number Z) and x is the X-rays path. Therefore, an attenuation correction
was also applied to the acquired spectra. The spectra acquired by the MCA channels (ch) are
converted to the energy scale using a second order polynomial calibration function E(ch) = a + b
· ch + c · ch2 . The coefficients a, b and c were previously determined using known γ-line
positions of the radioactive nuclides 133Ba, 57Co and 241Am as well as by means of the
fluorescence line positions of various elements (W, Au, Pb, Zr, etc.), respectively [Genz07,
Denk07].
After corrections, the diffracted intensities were background subtracted and fitted using
Pseudo-Voigt (which combines Gaussian and Lorentzian contributions to the peak shape) or
Gauss peak-functions. The temperature dependence of peak positions, Emax,hkl, as well as
integrated intensities were obtained from sequential peak-fitting routines for certain peaks of all
the detected phases. The corresponding d-spacings, dhkl, were calculated from equation 2.2.
2.2.10 X-ray tomography
Non-destructive characterization of the solid foam porous structure was performed by
X-ray tomography. The setup was similar to the one used for radioscopy but was equipped with a
computer-controlled rotating table. Both, X-ray source and detector were also supplied by
Hamamatsu, Japan. In this case the micro-focus X-ray source was used at 100 kV, 60 μA, and
spot size 5 μm, and the magnification was set to 5x. 1000 projected radiographs were taken in
one 360° rotation. Cone beam reconstructions were calculated using the software Octopus 8.2
[Octopu]. VGStudioMax 1.2.1 [VGStud] was used for visual examination of the structure and to
extract 3D sections. The quantitative 3D pore analysis was performed with the software Avizo 5
[Avizo].
40
3 Results
3.1 Powder characterization
Al and Si powders were characterized in the as-received condition. TiH2 powder was
characterized in the as-received, or untreated, condition and after oxidation pre-treatment at
480 °C in air for 180 minutes. The physical and chemical properties relevant for this work,
namely, particle size, density and oxygen content, are summarized in Table 3.1.
Table 3.1 - Properties of powders in the as-received condition
Powder D50, μm D90, μm Density, g.cm-3 Oxygen content, wt. %
Aluminium 38.02 75.50 2.73 0.46
Silicon 25.67 49.90 2.33 0.22
TiH2 N grade 14.44 34.16 3.76 1.00 (*)
TiH2 N grade 14.44 34.16 3.76 4.02
TiH2 PS grade 6.15 13.17 3.76 1.37
TiH2 PS grade (**) n.d. n.d. n.d. 7.03
* According to Reference [Matl06]
** Pre-treated at 480 °C for 180 min in air. The term “n.d.” means not determined.
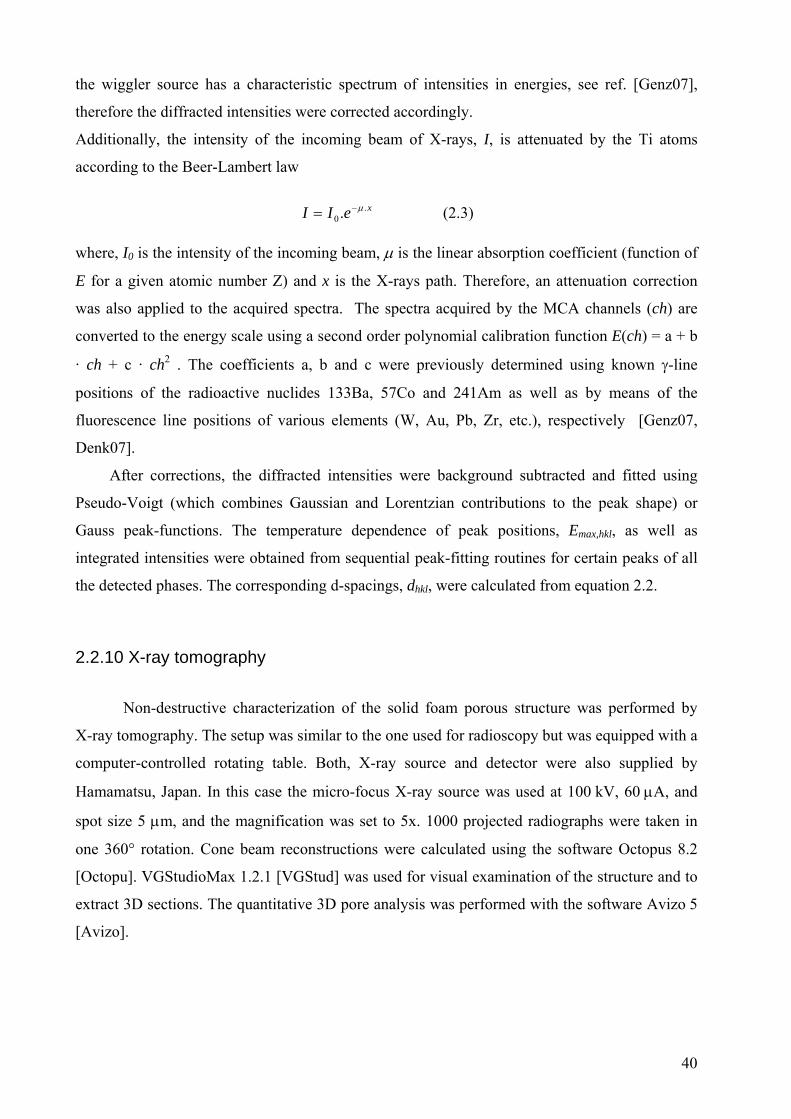
Morphologies of Al and Si powders are shown in Fig. 3.1. Al powders have the irregular
shape, known as “nodular” morphology, typical of air-atomized Al powders [Ünal99]. Si
powders have an angular morphology related to its brittle character and the milling process
which is used to produce it.
20 μm 5 μm
Al Al
41
20 μm 5 μm
SiSi
Fig. 3.1 – SEM images of Al and Si powders. For Si, left: overview and right: single particle detail.
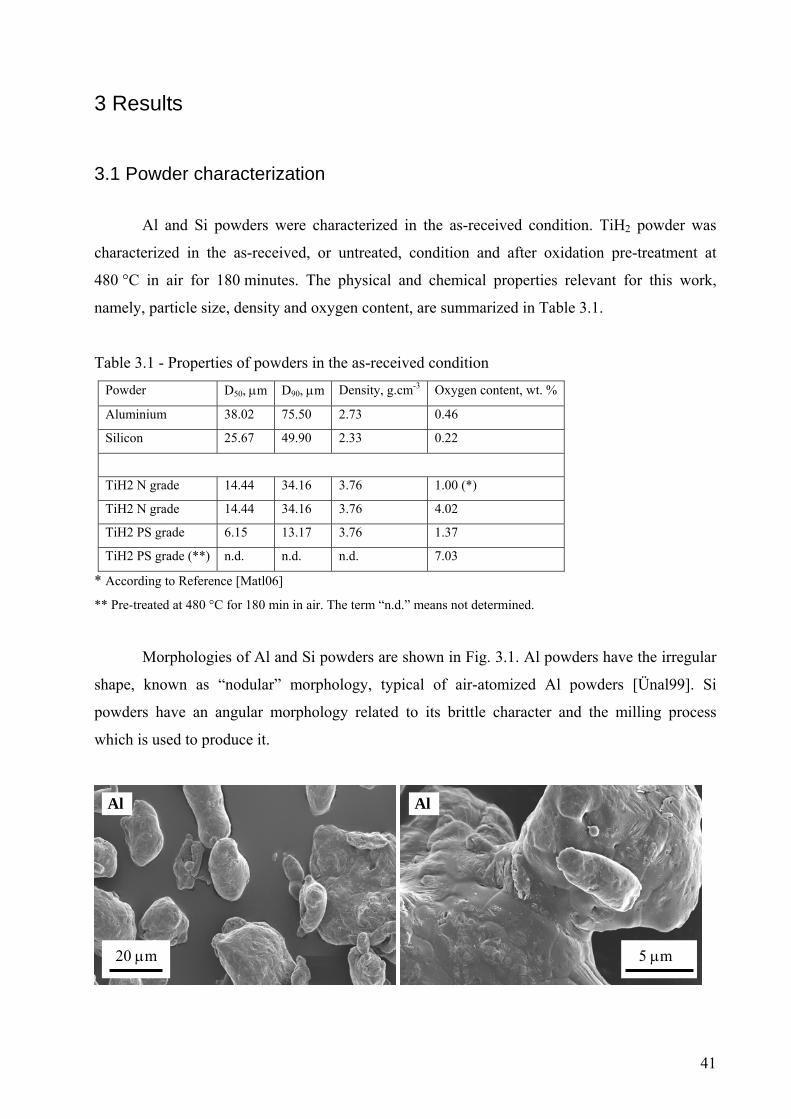
TiH2 is brittle and is prepared by milling after hydrogenation. Some of the powder
surfaces are flat whereas other surfaces show steps. Fig. 3.2 corresponds to TiH2 N grade.
Untreated and pre-treated powders have similar morphology. However, the surfaces of
pre-treated powders are rougher than untreated ones.
20 μm TiH2 N grade 5 μm
untreated
20 μm 5 μm
pre-treated
Fig. 3.2 – SEM images of untreated and pre-treated TiH2 N grade powders.
42
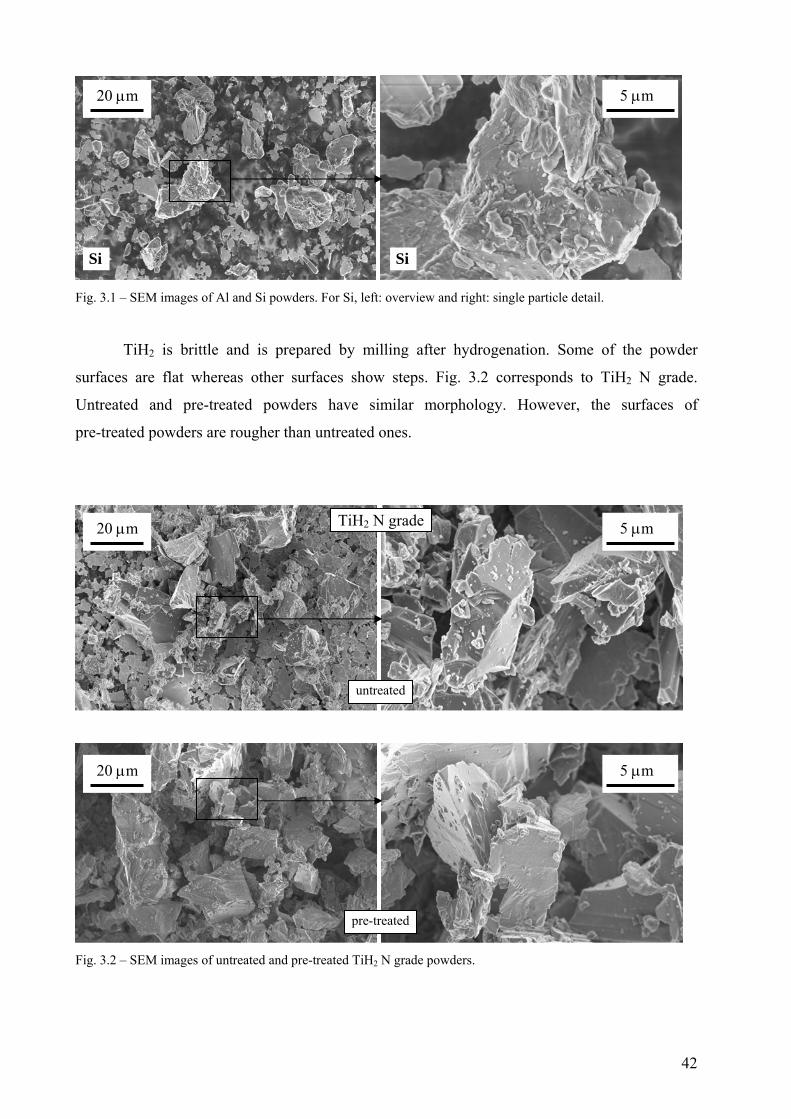
Powders of TiH2 PS grade are finer than those of TiH2 N grade. The images in Fig. 3.3
correspond to particle sections of untreated and pre-treated TiH2 PS grade prepared by focused
ion beam. Untreated TiH2 PS grade also show steps on the surface. In the section of the
pre-treated powder is visible an outer-layer which could be an oxide layer. On the oxidized
surface, the steps on the surface are visible but the topology appears rougher than that of the
untreated powder.
2 μm 0.5 μm TiH2 PS grade
untreated
rough surface
Outer layer
2 μm pre-treated 0.5 μm
Fig. 3.3 – SEM images of sections of untreated and pre-treated TiH2 PS grade powders cut by focused ion beam.
3.2 Powders consolidation under controlled atmosphere
3.2.1 Characterization of foamable precursor materials
From the measured oxygen contents of Al, Si and pre-treated TiH2 powders, an oxygen
content of 0.43 ± 0.07 wt.% for the powder mixture free of TiH2 and 0.45 ± 0.07 wt.% for the
one with TiH2 were calculated. Similarly, the densities 2.67 ± 0.05 g.cm-3 and 2.68 ± 0.06 g.cm-3,
were calculated for the same powder mixtures, respectively. The latter values were adopted as
theoretical full densities for the compacts.
43
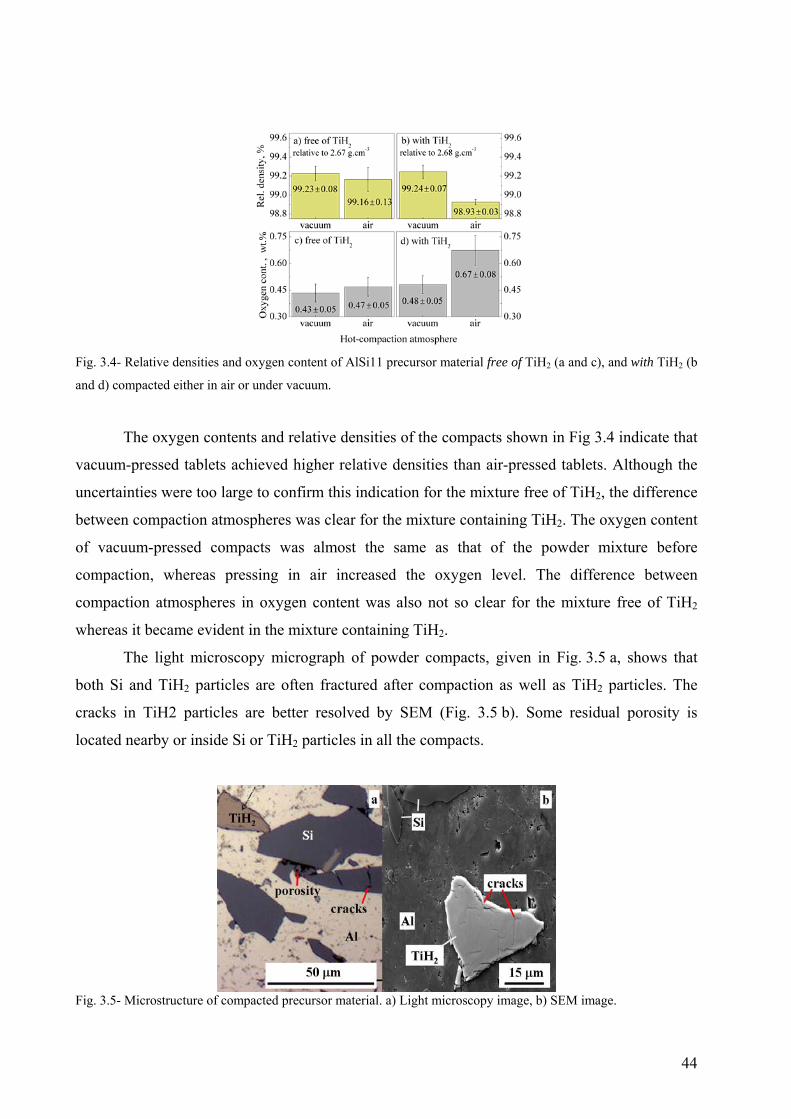
Fig. 3.4- Relative densities and oxygen content of AlSi11 precursor material free of TiH2 (a and c), and with TiH2 (b
and d) compacted either in air or under vacuum.
The oxygen contents and relative densities of the compacts shown in Fig 3.4 indicate that
vacuum-pressed tablets achieved higher relative densities than air-pressed tablets. Although the
uncertainties were too large to confirm this indication for the mixture free of TiH2, the difference
between compaction atmospheres was clear for the mixture containing TiH2. The oxygen content
of vacuum-pressed compacts was almost the same as that of the powder mixture before
compaction, whereas pressing in air increased the oxygen level. The difference between
compaction atmospheres in oxygen content was also not so clear for the mixture free of TiH2
whereas it became evident in the mixture containing TiH2.
The light microscopy micrograph of powder compacts, given in Fig. 3.5 a, shows that
both Si and TiH2 particles are often fractured after compaction as well as TiH2 particles. The
cracks in TiH2 particles are better resolved by SEM (Fig. 3.5 b). Some residual porosity is
located nearby or inside Si or TiH2 particles in all the compacts.
Fig. 3.5- Microstructure of compacted precursor material. a) Light microscopy image, b) SEM image.
44
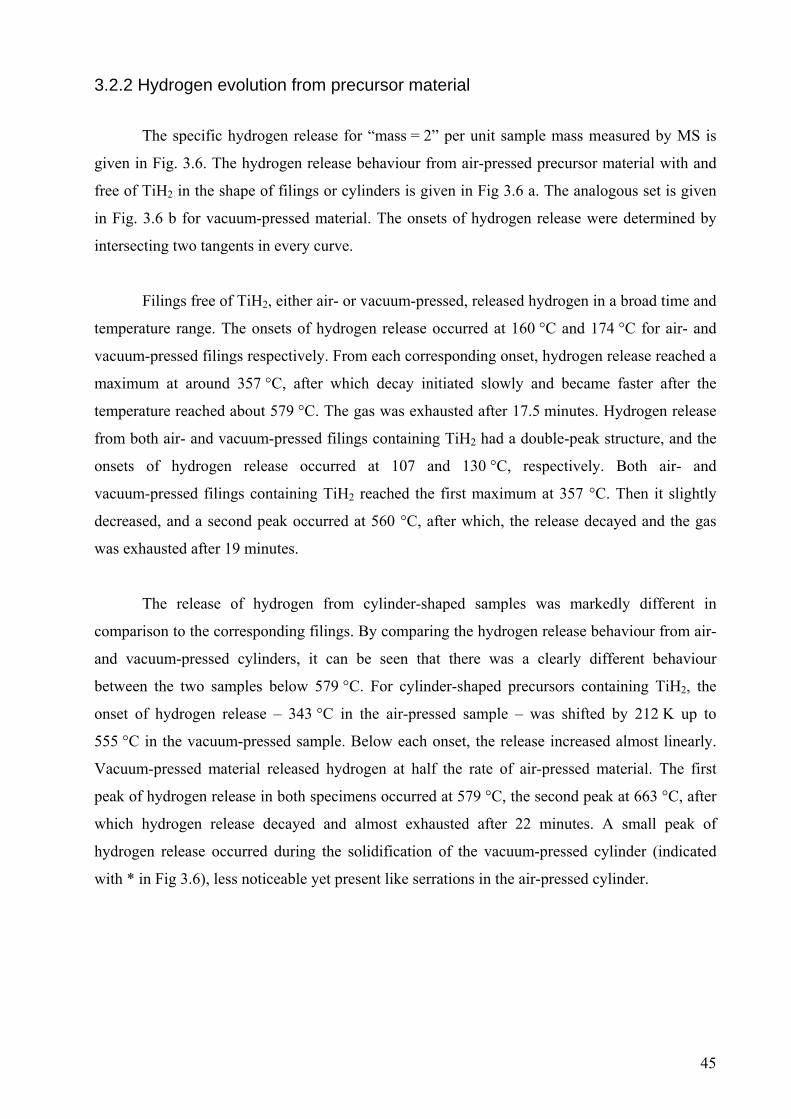
3.2.2 Hydrogen evolution from precursor material
The specific hydrogen release for “mass = 2” per unit sample mass measured by MS is
given in Fig. 3.6. The hydrogen release behaviour from air-pressed precursor material with and
free of TiH2 in the shape of filings or cylinders is given in Fig 3.6 a. The analogous set is given
in Fig. 3.6 b for vacuum-pressed material. The onsets of hydrogen release were determined by
intersecting two tangents in every curve.
Filings free of TiH2, either air- or vacuum-pressed, released hydrogen in a broad time and
temperature range. The onsets of hydrogen release occurred at 160 °C and 174 °C for air- and
vacuum-pressed filings respectively. From each corresponding onset, hydrogen release reached a
maximum at around 357 °C, after which decay initiated slowly and became faster after the
temperature reached about 579 °C. The gas was exhausted after 17.5 minutes. Hydrogen release
from both air- and vacuum-pressed filings containing TiH2 had a double-peak structure, and the
onsets of hydrogen release occurred at 107 and 130 °C, respectively. Both air- and
vacuum-pressed filings containing TiH2 reached the first maximum at 357 °C. Then it slightly
decreased, and a second peak occurred at 560 °C, after which, the release decayed and the gas
was exhausted after 19 minutes.
The release of hydrogen from cylinder-shaped samples was markedly different in
comparison to the corresponding filings. By comparing the hydrogen release behaviour from air-
and vacuum-pressed cylinders, it can be seen that there was a clearly different behaviour
between the two samples below 579 °C. For cylinder-shaped precursors containing TiH2, the
onset of hydrogen release – 343 °C in the air-pressed sample – was shifted by 212 K up to
555 °C in the vacuum-pressed sample. Below each onset, the release increased almost linearly.
Vacuum-pressed material released hydrogen at half the rate of air-pressed material. The first
peak of hydrogen release in both specimens occurred at 579 °C, the second peak at 663 °C, after
which hydrogen release decayed and almost exhausted after 22 minutes. A small peak of
hydrogen release occurred during the solidification of the vacuum-pressed cylinder (indicated
with * in Fig 3.6), less noticeable yet present like serrations in the air-pressed cylinder.
45
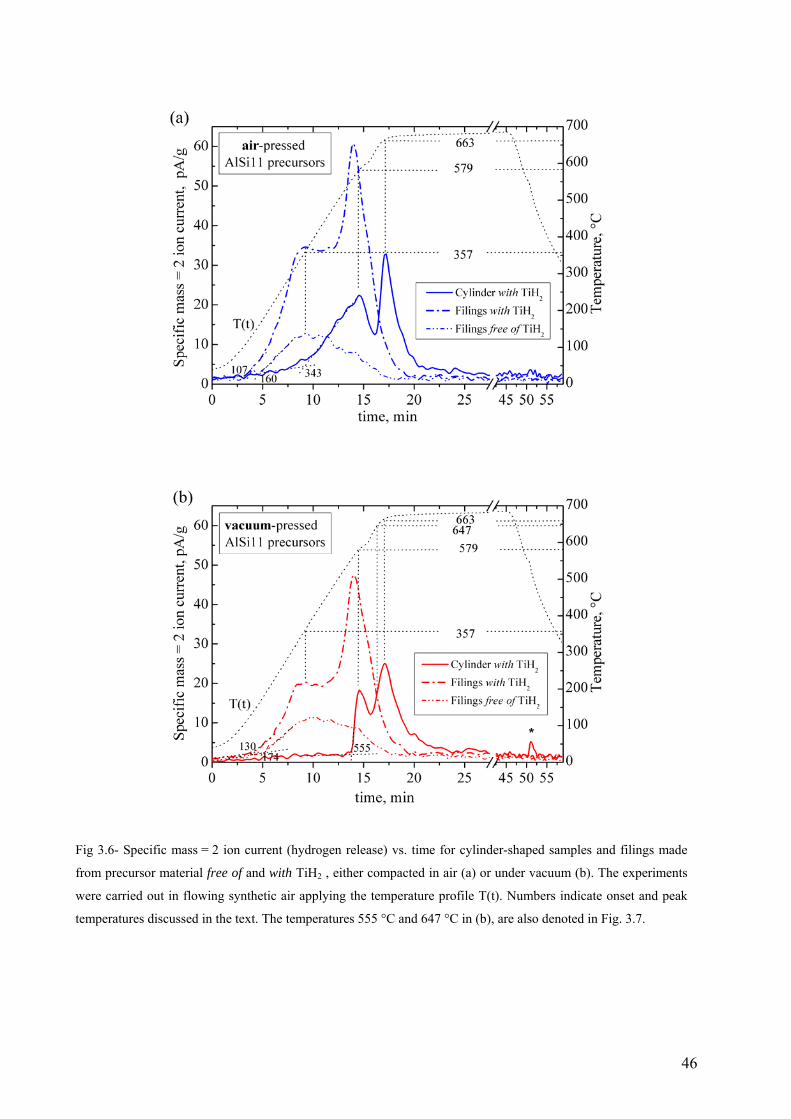
Fig 3.6- Specific mass = 2 ion current (hydrogen release) vs. time for cylinder-shaped samples and filings made
from precursor material free of and with TiH2 , either compacted in air (a) or under vacuum (b). The experiments
were carried out in flowing synthetic air applying the temperature profile T(t). Numbers indicate onset and peak
temperatures discussed in the text. The temperatures 555 °C and 647 °C in (b), are also denoted in Fig. 3.7.
46
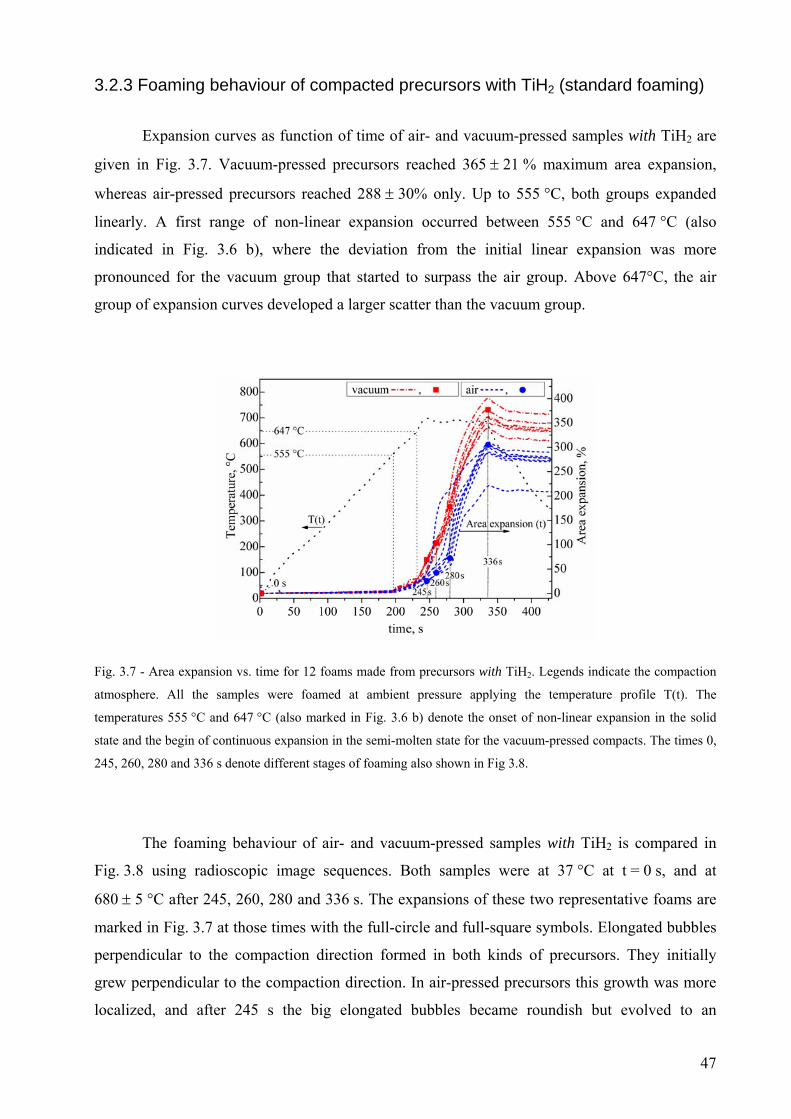
3.2.3 Foaming behaviour of compacted precursors with TiH2 (standard foaming)
Expansion curves as function of time of air- and vacuum-pressed samples with TiH2 are
given in Fig. 3.7. Vacuum-pressed precursors reached 365 ± 21 % maximum area expansion,
whereas air-pressed precursors reached 288 ± 30% only. Up to 555 °C, both groups expanded
linearly. A first range of non-linear expansion occurred between 555 °C and 647 °C (also
indicated in Fig. 3.6 b), where the deviation from the initial linear expansion was more
pronounced for the vacuum group that started to surpass the air group. Above 647°C, the air
group of expansion curves developed a larger scatter than the vacuum group.
Fig. 3.7 - Area expansion vs. time for 12 foams made from precursors with TiH2. Legends indicate the compaction
atmosphere. All the samples were foamed at ambient pressure applying the temperature profile T(t). The
temperatures 555 °C and 647 °C (also marked in Fig. 3.6 b) denote the onset of non-linear expansion in the solid
state and the begin of continuous expansion in the semi-molten state for the vacuum-pressed compacts. The times 0,
245, 260, 280 and 336 s denote different stages of foaming also shown in Fig 3.8.
The foaming behaviour of air- and vacuum-pressed samples with TiH2 is compared in
Fig. 3.8 using radioscopic image sequences. Both samples were at 37 °C at t = 0 s, and at
680 ± 5 °C after 245, 260, 280 and 336 s. The expansions of these two representative foams are
marked in Fig. 3.7 at those times with the full-circle and full-square symbols. Elongated bubbles
perpendicular to the compaction direction formed in both kinds of precursors. They initially
grew perpendicular to the compaction direction. In air-pressed precursors this growth was more
localized, and after 245 s the big elongated bubbles became roundish but evolved to an
47
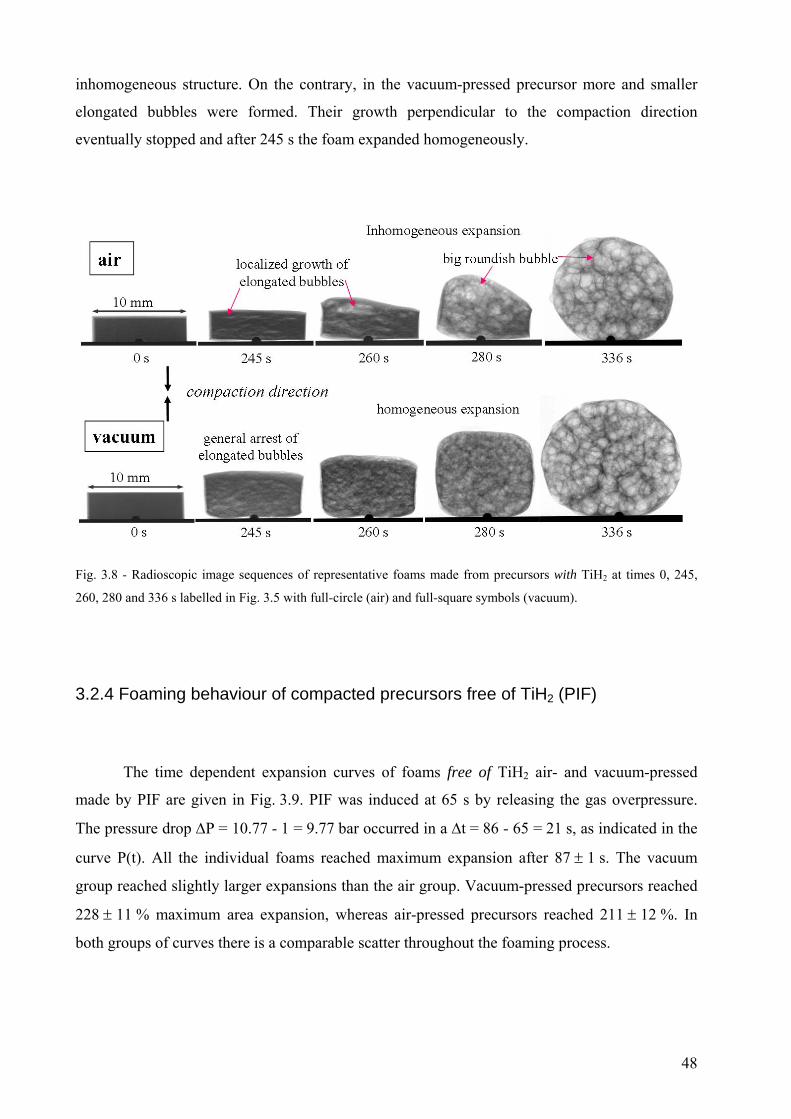
inhomogeneous structure. On the contrary, in the vacuum-pressed precursor more and smaller
elongated bubbles were formed. Their growth perpendicular to the compaction direction
eventually stopped and after 245 s the foam expanded homogeneously.
Fig. 3.8 - Radioscopic image sequences of representative foams made from precursors with TiH2 at times 0, 245,
260, 280 and 336 s labelled in Fig. 3.5 with full-circle (air) and full-square symbols (vacuum).
3.2.4 Foaming behaviour of compacted precursors free of TiH2 (PIF)
The time dependent expansion curves of foams free of TiH2 air- and vacuum-pressed
made by PIF are given in Fig. 3.9. PIF was induced at 65 s by releasing the gas overpressure.
The pressure drop ΔP = 10.77 - 1 = 9.77 bar occurred in a Δt = 86 - 65 = 21 s, as indicated in the
curve P(t). All the individual foams reached maximum expansion after 87 ± 1 s. The vacuum
group reached slightly larger expansions than the air group. Vacuum-pressed precursors reached
228 ± 11 % maximum area expansion, whereas air-pressed precursors reached 211 ± 12 %. In
both groups of curves there is a comparable scatter throughout the foaming process.
48
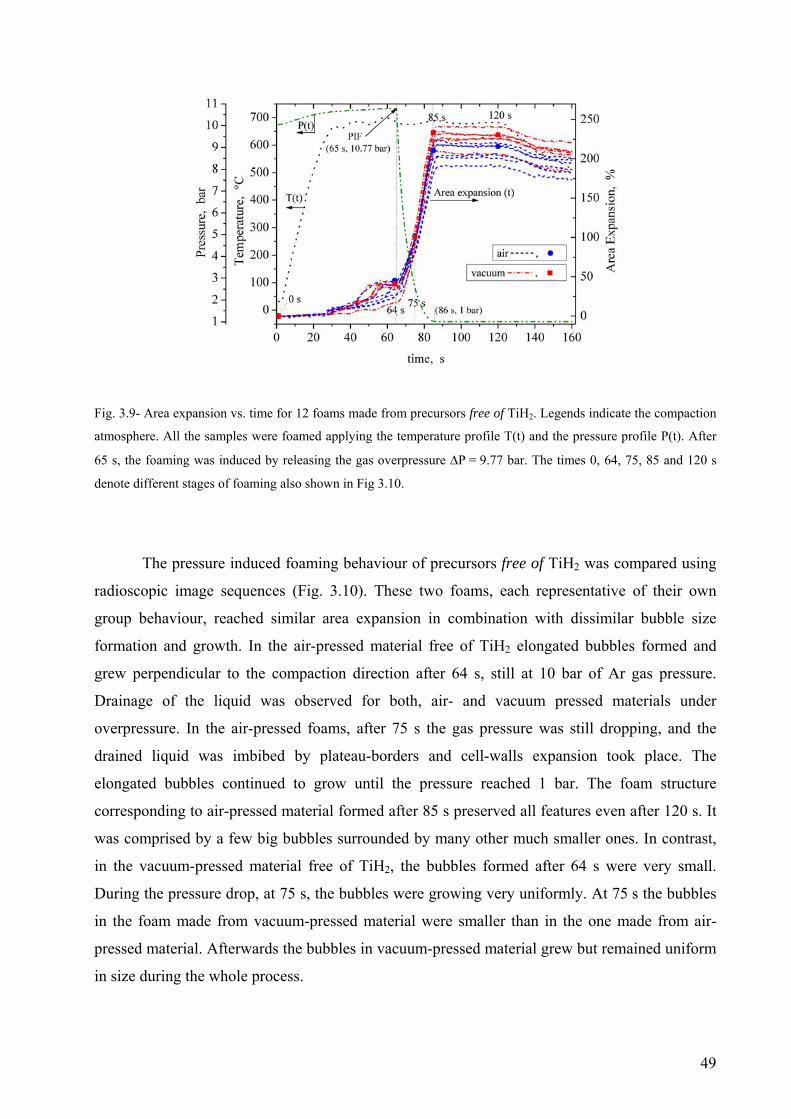
Fig. 3.9- Area expansion vs. time for 12 foams made from precursors free of TiH2. Legends indicate the compaction
atmosphere. All the samples were foamed applying the temperature profile T(t) and the pressure profile P(t). After
65 s, the foaming was induced by releasing the gas overpressure ΔP = 9.77 bar. The times 0, 64, 75, 85 and 120 s
denote different stages of foaming also shown in Fig 3.10.
The pressure induced foaming behaviour of precursors free of TiH2 was compared using
radioscopic image sequences (Fig. 3.10). These two foams, each representative of their own
group behaviour, reached similar area expansion in combination with dissimilar bubble size
formation and growth. In the air-pressed material free of TiH2 elongated bubbles formed and
grew perpendicular to the compaction direction after 64 s, still at 10 bar of Ar gas pressure.
Drainage of the liquid was observed for both, air- and vacuum pressed materials under
overpressure. In the air-pressed foams, after 75 s the gas pressure was still dropping, and the
drained liquid was imbibed by plateau-borders and cell-walls expansion took place. The
elongated bubbles continued to grow until the pressure reached 1 bar. The foam structure
corresponding to air-pressed material formed after 85 s preserved all features even after 120 s. It
was comprised by a few big bubbles surrounded by many other much smaller ones. In contrast,
in the vacuum-pressed material free of TiH2, the bubbles formed after 64 s were very small.
During the pressure drop, at 75 s, the bubbles were growing very uniformly. At 75 s the bubbles
in the foam made from vacuum-pressed material were smaller than in the one made from air-
pressed material. Afterwards the bubbles in vacuum-pressed material grew but remained uniform
in size during the whole process.
49
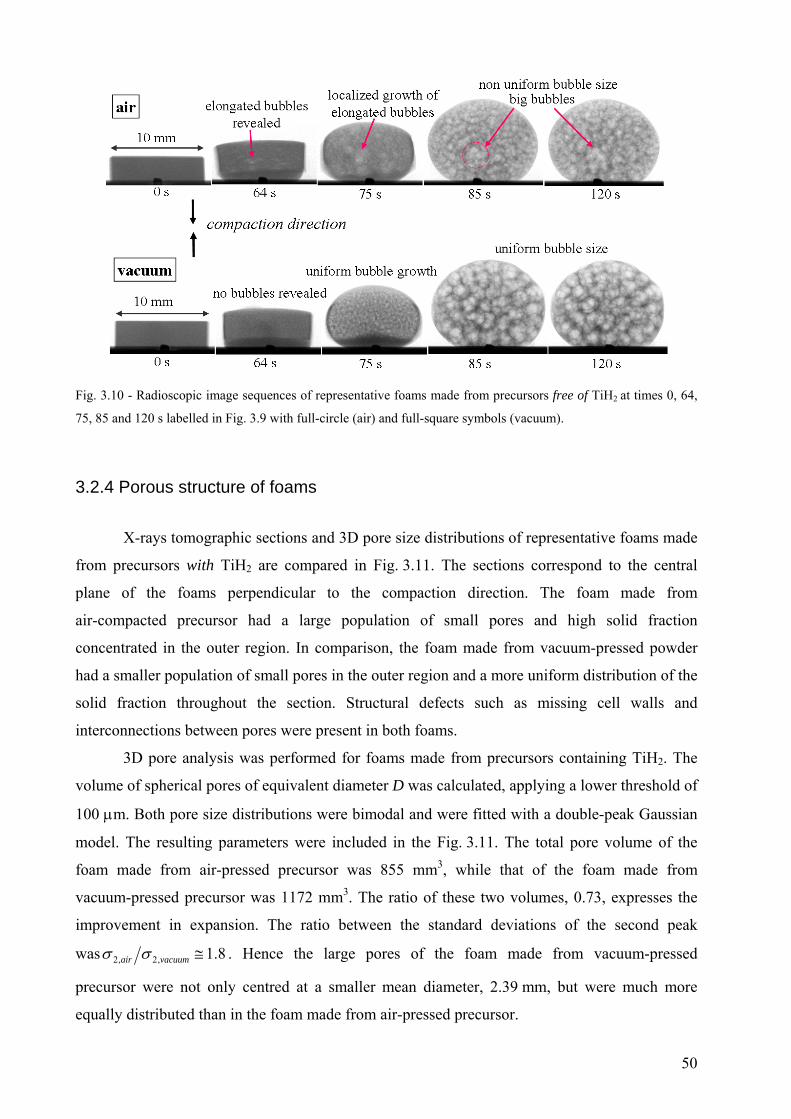
Fig. 3.10 - Radioscopic image sequences of representative foams made from precursors free of TiH2 at times 0, 64,
75, 85 and 120 s labelled in Fig. 3.9 with full-circle (air) and full-square symbols (vacuum).
3.2.4 Porous structure of foams
X-rays tomographic sections and 3D pore size distributions of representative foams made
from precursors with TiH2 are compared in Fig. 3.11. The sections correspond to the central
plane of the foams perpendicular to the compaction direction. The foam made from
air-compacted precursor had a large population of small pores and high solid fraction
concentrated in the outer region. In comparison, the foam made from vacuum-pressed powder
had a smaller population of small pores in the outer region and a more uniform distribution of the
solid fraction throughout the section. Structural defects such as missing cell walls and
interconnections between pores were present in both foams.
3D pore analysis was performed for foams made from precursors containing TiH2. The
volume of spherical pores of equivalent diameter D was calculated, applying a lower threshold of
100 μm. Both pore size distributions were bimodal and were fitted with a double-peak Gaussian
model. The resulting parameters were included in the Fig. 3.11. The total pore volume of the
foam made from air-pressed precursor was 855 mm3, while that of the foam made from
vacuum-pressed precursor was 1172 mm3. The ratio of these two volumes, 0.73, expresses the
improvement in expansion. The ratio between the standard deviations of the second peak
was 8.1,2,2 ≅vacuumair σσ . Hence the large pores of the foam made from vacuum-pressed
precursor were not only centred at a smaller mean diameter, 2.39 mm, but were much more
equally distributed than in the foam made from air-pressed precursor.
50
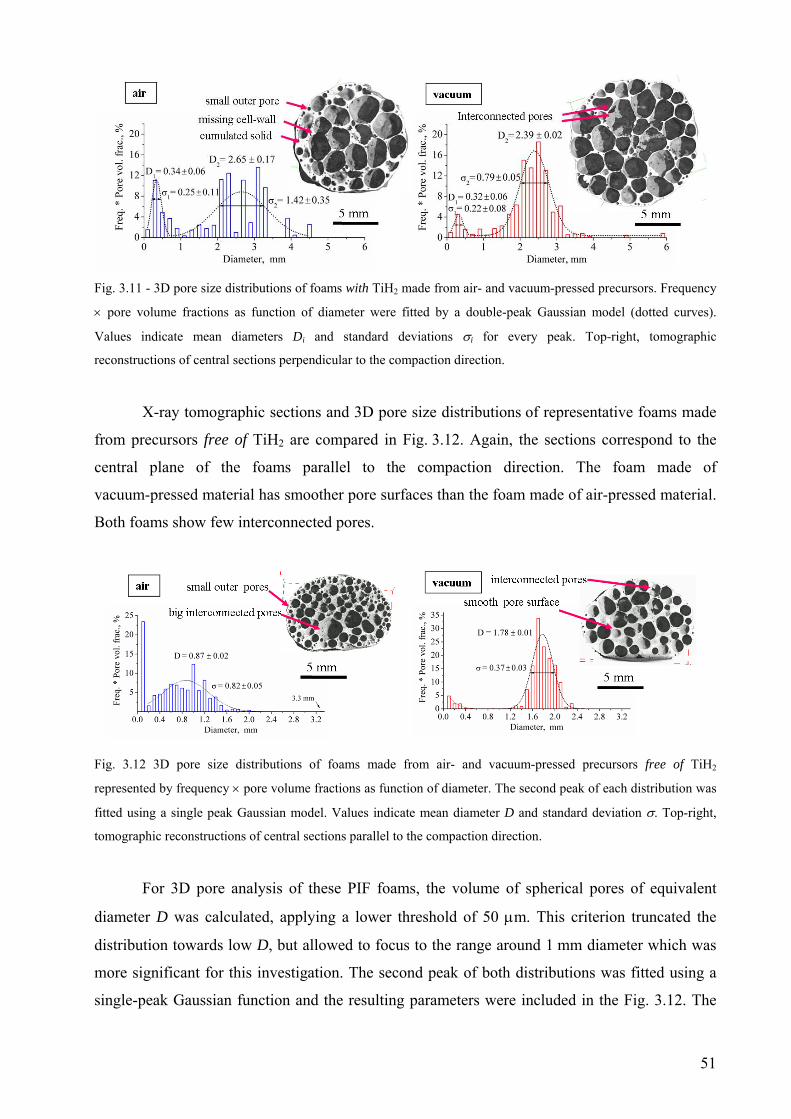
Fig. 3.11 - 3D pore size distributions of foams with TiH2 made from air- and vacuum-pressed precursors. Frequency
× pore volume fractions as function of diameter were fitted by a double-peak Gaussian model (dotted curves).
Values indicate mean diameters Di and standard deviations σi for every peak. Top-right, tomographic
reconstructions of central sections perpendicular to the compaction direction.
X-ray tomographic sections and 3D pore size distributions of representative foams made
from precursors free of TiH2 are compared in Fig. 3.12. Again, the sections correspond to the
central plane of the foams parallel to the compaction direction. The foam made of
vacuum-pressed material has smoother pore surfaces than the foam made of air-pressed material.
Both foams show few interconnected pores.
Fig. 3.12 3D pore size distributions of foams made from air- and vacuum-pressed precursors free of TiH2
represented by frequency × pore volume fractions as function of diameter. The second peak of each distribution was
fitted using a single peak Gaussian model. Values indicate mean diameter D and standard deviation σ. Top-right,
tomographic reconstructions of central sections parallel to the compaction direction.
For 3D pore analysis of these PIF foams, the volume of spherical pores of equivalent
diameter D was calculated, applying a lower threshold of 50 μm. This criterion truncated the
distribution towards low D, but allowed to focus to the range around 1 mm diameter which was
more significant for this investigation. The second peak of both distributions was fitted using a
single-peak Gaussian function and the resulting parameters were included in the Fig. 3.12. The
51
total pore volume of the foam made from air-pressed precursor was 540 mm3. The one of the
foam made from vacuum-pressed precursor was 558 mm3. The ratio of these two volumes is 0.97
which means that these foams had similar densities. But at the same time, there are differences in
their pore size distributions. The foam made from vacuum-pressed precursor had an average pore
sized (Dvac = 1.78 ± 0.01 mm) almost twice as large as the one made from air-pressed material
(Dair = 0.87 ± 0.02 mm), but it also had some big pores ranging from 2.5 to 3.3 mm in diameter.
In PIF foams, the ratio between standard deviations of the fitted peaks was 2.2≅vacuumair σσ ,
which indicates that vacuum-pressed material had more regular distribution of pores.
3.3 Hydrogen evolution from TiH2 followed by TG-MS thermo-analysis
The TG-MS analysis performed on TiH2 was divided into two parts in terms of grade, PS
and N. In order to facilitate a visual comparison, the TG values of all samples at 50 °C were set
to 100 % implying no mass loss. The mass loss between 50 °C and 1100 °C for every
measurement are given in Table 3.2. And the individual MS measurements were multiplied by
the correction factors given in Table C.2, Appendix A where details of the calculation are
included. These factors applied to the MS data reflect changing conditions of the skimmer
coupling system, e.g. pressure variation in the high vacuum part, but they were constant during
individual measurements.
Table 3.2 – Mass loss of all samples determined from TG curves in Fig. 3.13 and 3.14
PS grade N grade Sample
10 K.min-1 40 K.min-1 10 K.min-1 40 K.min-1
untreated loose powder 3.82 3.70 3.71 3.79
cold-pressed untreated powder 3.85 3.73 3.67 3.77
cold-pressed pre-treated powder 2.05 2.04 3.07 3.11
pre-treated loose powder 2.00 2.08 3.18 3.21
3.3.1 TiH2 N grade
The hydrogen evolution and TG from untreated and pre-treated TiH2 N grade powders
during isochronal decomposition under Ar flow are given in Fig. 3.13. a) and b).
52
TiH2 N grade in the untreated and pre-treated conditions reached for a given heating rate
similar TG value at the maximum temperature regardless the compaction condition. The average
mass loss for loose and cold-pressed untreated powders (red and blue TG curves) was 3.69 %
((3.71+3.67)/2 %) heating at 10 K.min-1, whereas it was 3.78 % applying 40 K.min-1. From
pre-treated powders decomposed at 10 K.min-1 the average mass loss (grey and green TG curves)
was ~3.13 %, whereas the average mass loss heating with 40 K.min-1 was 3.16 %.
The onsets of hydrogen release were determined by drawing two intersecting tangents as
shown in the insets of Fig. 3.13 a) and b). The onset of hydrogen release occurred at 397 °C for
untreated loose powders (blue lines) heated at 10 K.min-1. After the onset, two peaks occurred at
499 and 608 °C. The second peak was the main peak and was followed by a shoulder between
676 and 832 °C which indicated a third stage of hydrogen release. After 832 °C temperature, the
last step or tail of decay was completed at 1050 °C. In the cold-pressed (C-P) sample heated at
10 K.min-1 (red lines) the onset of hydrogen release occurred at 344 °C. After that, the first peak
occurred at 437 °C, i.e. it was shifted to lower temperature by 63 K compared with loose
powders, and then had a small shoulder on the right. As heating continued, the main peak
occurred at 616 °C. A fast decay took place till around 700 °C. An inflection point occurred at
740 °C and then decay way completed at 1050 °C.
Pre-treated loose powders (grey lines) heated at 10 K.min-1 had onset of hydrogen release at
487 °C and the main peak at 634 °C. After the main peak, a fast decay took place which slowed
down from 700 °C to 804 °C. From there, the last stage of decay commenced and hydrogen was
exhausted at around 950 °C. Pre-treated C-P powders (green lines) heated at 10 K.min-1 had the
onset of hydrogen release at 406 °C. The onset was followed by two peaks: one at 477 °C and
another at 615 °C, after which, the decay took place until hydrogen was exhausted at 950 °C.
By increasing the heating rate from 10 K.min-1 to 40 K.min-1 (Fig. 3.13 b) the peak
structure of all samples was broadened and smeared. In average, the first onset hydrogen release
was shifted by 40-50 K, the main peak by 90 K and the end of release by 150 K to higher
temperatures.
53
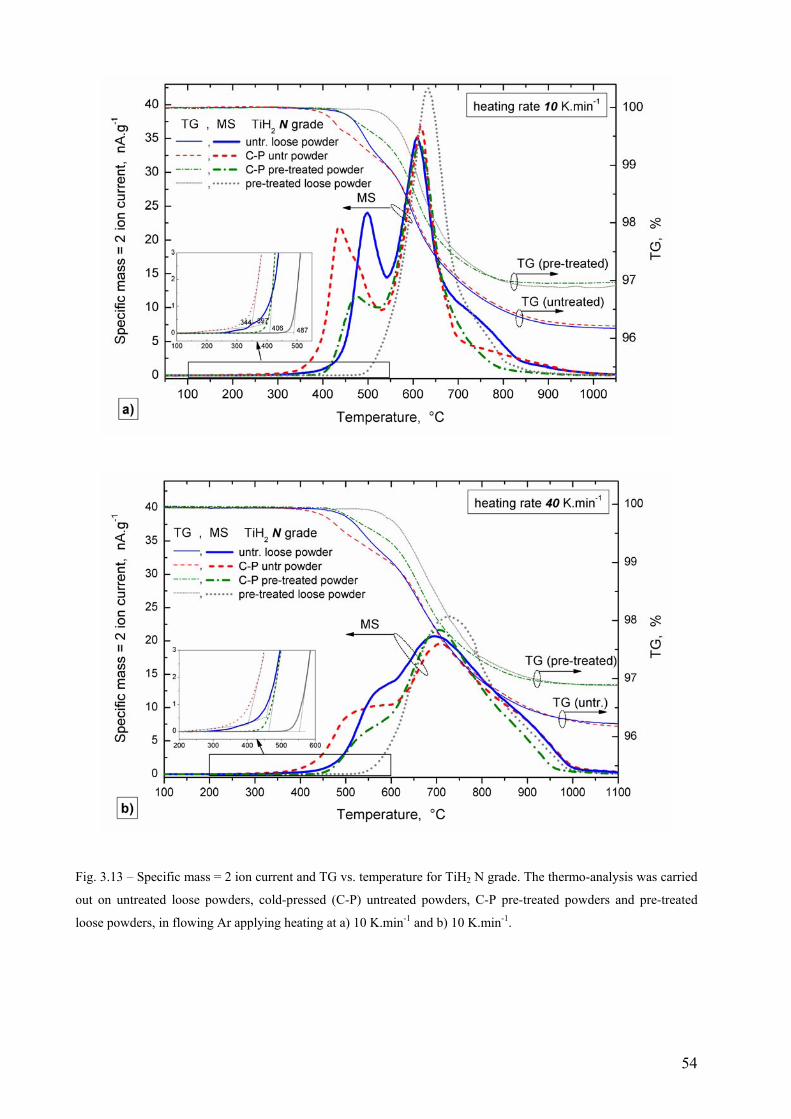
Fig. 3.13 – Specific mass = 2 ion current and TG vs. temperature for TiH2 N grade. The thermo-analysis was carried
out on untreated loose powders, cold-pressed (C-P) untreated powders, C-P pre-treated powders and pre-treated
loose powders, in flowing Ar applying heating at a) 10 K.min-1 and b) 10 K.min-1.
54
3.3.2 TiH2 PS grade
An analogous thermo-analysis was performed for TiH2 PS grade. The hydrogen evolution
and TG from untreated and pre-treated TiH2 PS samples are given in Fig. 3.14 for the two
applied heating rates, a) 10 K.min-1 and b) 40 K.min-1.
The measurements were carried out on four kinds of TiH2 PS grade samples: untreated
loose powders, C-P untreated powders, C-P pre-treated powders and pre-treated loose powders.
For a given heating rate, powders in the untreated and pre-treated conditions reached the same
TG value at the maximum temperature regardless of the compaction condition. MS curves of the
pre-treated powders completed their decay at the maximum temperature, i.e. their hydrogen
content was exhausted. The average mass loss from the pre-treated powders heated at 10 K.min-1
was 2.03 % ((2.05+2.00)/2 %), and when heated at 40 K.min-1 the mass loss was 2.06 %
((2.04+2.08)/2 %). The TG signals of untreated powders decomposed at 10 K.min-1 reached a
mass loss of 3.85 % at 1050 °C, whereas the mass loss heating with 40 K.min-1 was 3.72 % at the
maximum temperature 1100 °C.
The beginning of hydrogen release detected from the four kinds of samples is shown in the
insets of Fig. 3.14 a) and b). Untreated loose powders (blue line) decomposed at 10 K.min-1
started to release hydrogen at 200 °C and a small pre-peak occurred at 330 °C indicated with (*).
In this untreated loose powder sample, the onset of the first peak was determined at 375 °C by
intersecting a straight baseline of the pre-peak and a tangent. After this, three peaks of release
were identified at 439, 486 and 607 °C. An inflection point occurred at 780 °C, after which
hydrogen was exhausted at 1000 °C. C-P untreated powders (red line) heated at 10 K.min-1 also
started to release hydrogen at 200 °C, but the first small peak observed for untreated loose
powders was suppressed. Instead, an increase in the slope was observed in between 280°C and
342 °C. This subtended slope intersecting a tangent was used to determine the onset at 350 °C.
After this, a peak was observed at 420 °C, an inflection point at 465 °C, the main peak at 607 °C,
and an inflection point at 770 °C. Hydrogen was exhausted at around 1000 °C.
55
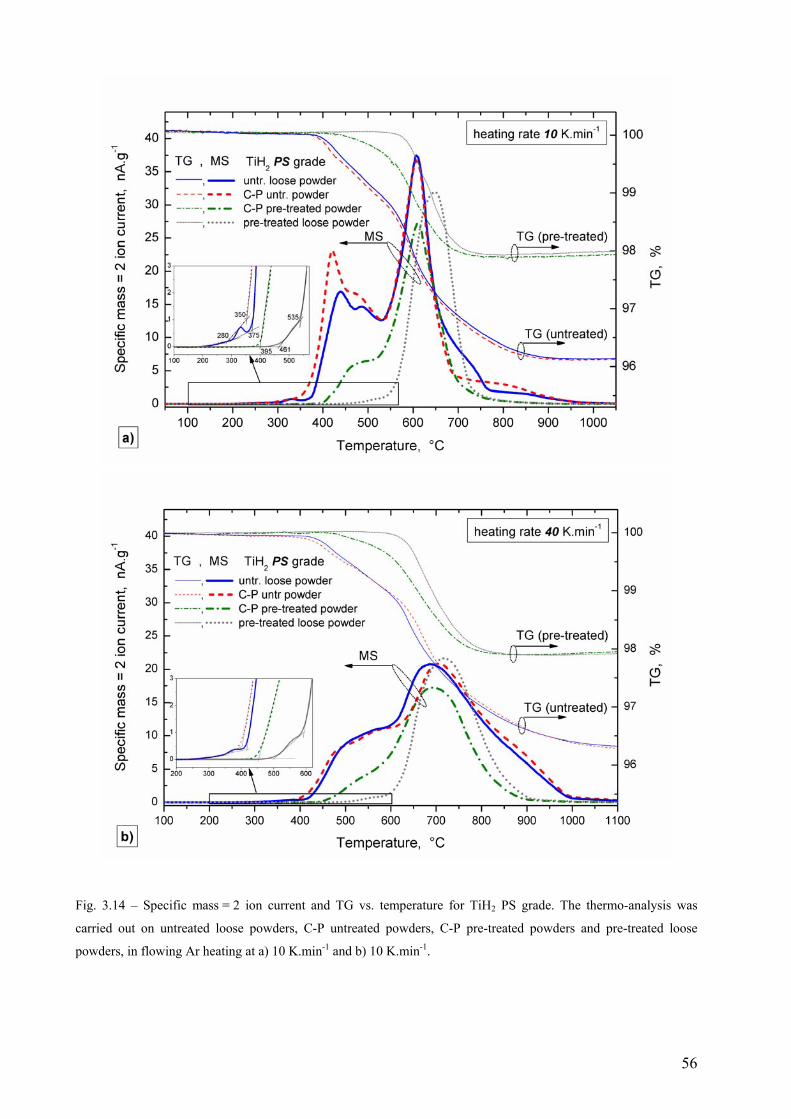
Fig. 3.14 – Specific mass = 2 ion current and TG vs. temperature for TiH2 PS grade. The thermo-analysis was
carried out on untreated loose powders, C-P untreated powders, C-P pre-treated powders and pre-treated loose
powders, in flowing Ar heating at a) 10 K.min-1 and b) 10 K.min-1.
56
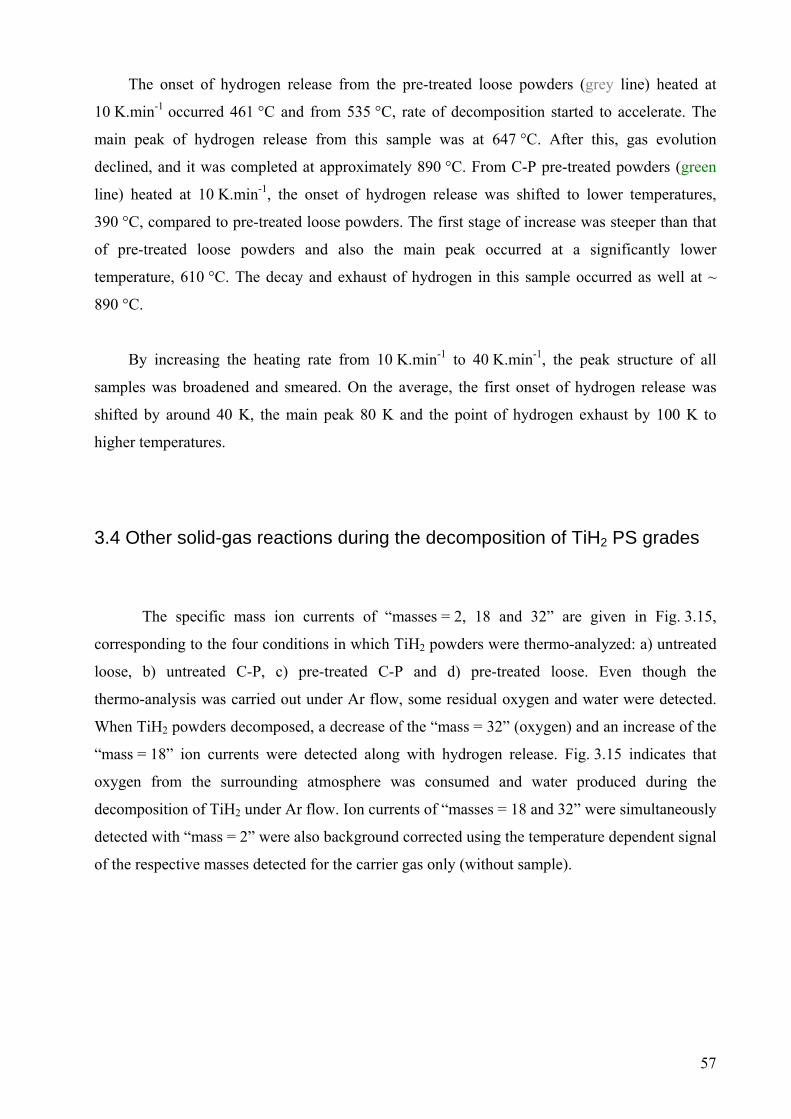
The onset of hydrogen release from the pre-treated loose powders (grey line) heated at
10 K.min-1 occurred 461 °C and from 535 °C, rate of decomposition started to accelerate. The
main peak of hydrogen release from this sample was at 647 °C. After this, gas evolution
declined, and it was completed at approximately 890 °C. From C-P pre-treated powders (green
line) heated at 10 K.min-1, the onset of hydrogen release was shifted to lower temperatures,
390 °C, compared to pre-treated loose powders. The first stage of increase was steeper than that
of pre-treated loose powders and also the main peak occurred at a significantly lower
temperature, 610 °C. The decay and exhaust of hydrogen in this sample occurred as well at ~
890 °C.
By increasing the heating rate from 10 K.min-1 to 40 K.min-1, the peak structure of all
samples was broadened and smeared. On the average, the first onset of hydrogen release was
shifted by around 40 K, the main peak 80 K and the point of hydrogen exhaust by 100 K to
higher temperatures.
3.4 Other solid-gas reactions during the decomposition of TiH2 PS grades
The specific mass ion currents of “masses = 2, 18 and 32” are given in Fig. 3.15,
corresponding to the four conditions in which TiH2 powders were thermo-analyzed: a) untreated
loose, b) untreated C-P, c) pre-treated C-P and d) pre-treated loose. Even though the
thermo-analysis was carried out under Ar flow, some residual oxygen and water were detected.
When TiH2 powders decomposed, a decrease of the “mass = 32” (oxygen) and an increase of the
“mass = 18” ion currents were detected along with hydrogen release. Fig. 3.15 indicates that
oxygen from the surrounding atmosphere was consumed and water produced during the
decomposition of TiH2 under Ar flow. Ion currents of “masses = 18 and 32” were simultaneously
detected with “mass = 2” were also background corrected using the temperature dependent signal
of the respective masses detected for the carrier gas only (without sample).
57
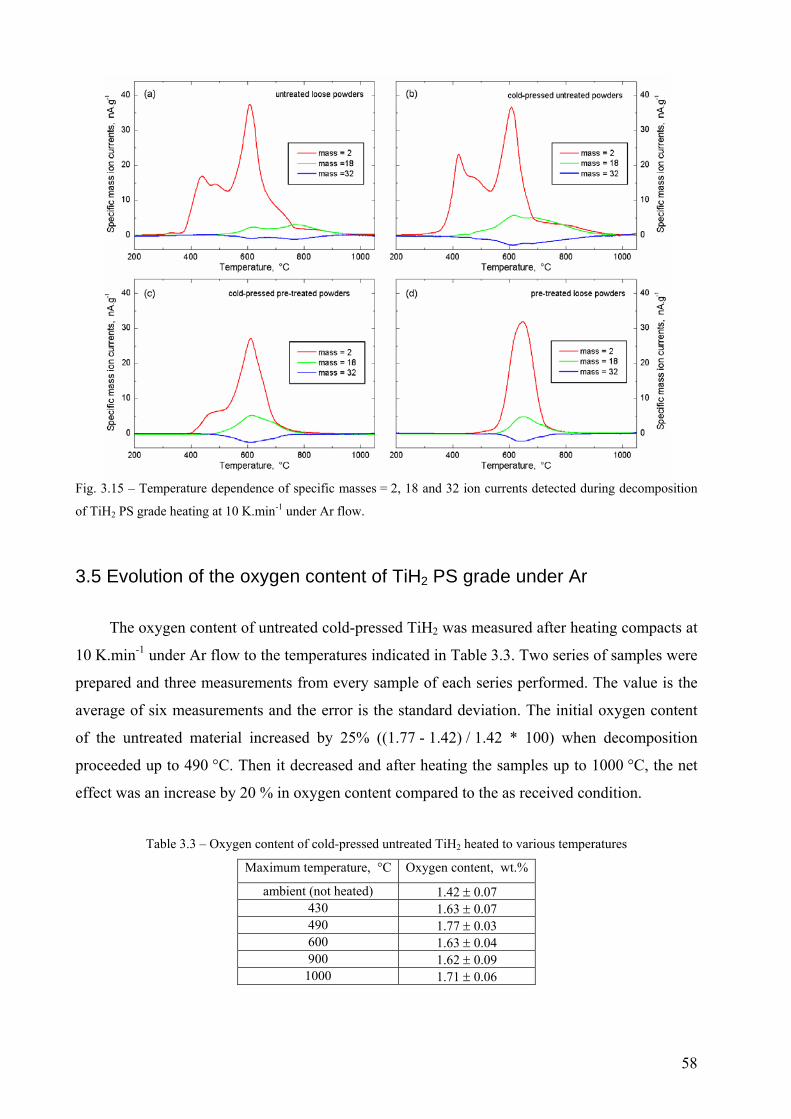
Fig. 3.15 – Temperature dependence of specific masses = 2, 18 and 32 ion currents detected during decomposition
of TiH2 PS grade heating at 10 K.min-1 under Ar flow.
3.5 Evolution of the oxygen content of TiH2 PS grade under Ar
The oxygen content of untreated cold-pressed TiH2 was measured after heating compacts at
10 K.min-1 under Ar flow to the temperatures indicated in Table 3.3. Two series of samples were
prepared and three measurements from every sample of each series performed. The value is the
average of six measurements and the error is the standard deviation. The initial oxygen content
of the untreated material increased by 25% ((1.77 - 1.42) / 1.42 * 100) when decomposition
proceeded up to 490 °C. Then it decreased and after heating the samples up to 1000 °C, the net
effect was an increase by 20 % in oxygen content compared to the as received condition.
Table 3.3 – Oxygen content of cold-pressed untreated TiH2 heated to various temperatures
Maximum temperature, °C Oxygen content, wt.%
ambient (not heated) 1.42 ± 0.07 430 1.63 ± 0.07 490 1.77 ± 0.03 600 1.63 ± 0.04 900 1.62 ± 0.09
1000 1.71 ± 0.06
58
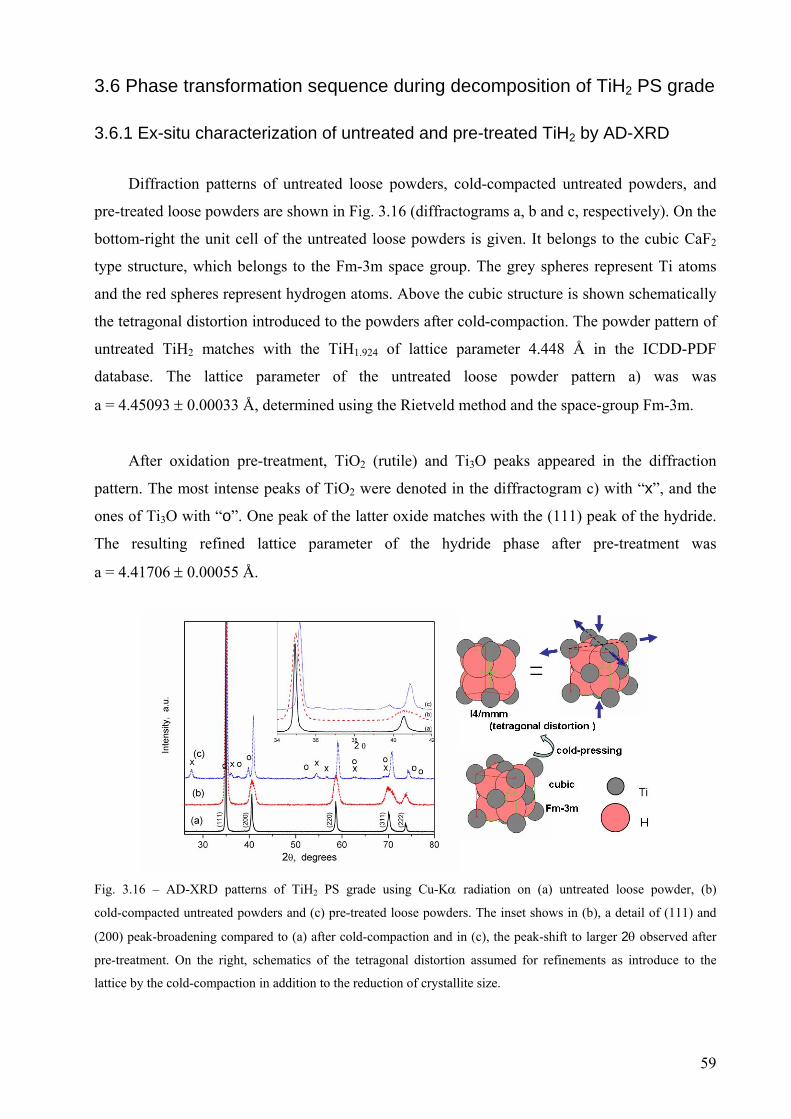
3.6 Phase transformation sequence during decomposition of TiH2 PS grade
3.6.1 Ex-situ characterization of untreated and pre-treated TiH2 by AD-XRD
Diffraction patterns of untreated loose powders, cold-compacted untreated powders, and
pre-treated loose powders are shown in Fig. 3.16 (diffractograms a, b and c, respectively). On the
bottom-right the unit cell of the untreated loose powders is given. It belongs to the cubic CaF2
type structure, which belongs to the Fm-3m space group. The grey spheres represent Ti atoms
and the red spheres represent hydrogen atoms. Above the cubic structure is shown schematically
the tetragonal distortion introduced to the powders after cold-compaction. The powder pattern of
untreated TiH2 matches with the TiH1.924 of lattice parameter 4.448 Å in the ICDD-PDF
database. The lattice parameter of the untreated loose powder pattern a) was was
a = 4.45093 ± 0.00033 Å, determined using the Rietveld method and the space-group Fm-3m.
After oxidation pre-treatment, TiO2 (rutile) and Ti3O peaks appeared in the diffraction
pattern. The most intense peaks of TiO2 were denoted in the diffractogram c) with “x”, and the
ones of Ti3O with “o”. One peak of the latter oxide matches with the (111) peak of the hydride.
The resulting refined lattice parameter of the hydride phase after pre-treatment was
a = 4.41706 ± 0.00055 Å.
Fig. 3.16 – AD-XRD patterns of TiH2 PS grade using Cu-Kα radiation on (a) untreated loose powder, (b)
cold-compacted untreated powders and (c) pre-treated loose powders. The inset shows in (b), a detail of (111) and
(200) peak-broadening compared to (a) after cold-compaction and in (c), the peak-shift to larger 2θ observed after
pre-treatment. On the right, schematics of the tetragonal distortion assumed for refinements as introduce to the
lattice by the cold-compaction in addition to the reduction of crystallite size.
59
After cold-compaction, all TiH2 peaks broadened due to reduction in crystallite size, but the
reflections (200), (220) and (311), did so more markedly than (111) and (222). The preferential
peak broadening could be refined using a body center tetragonal structure of space group
I4/mmm corresponding to the ThH2-type. The structure of this space group is what would result
from distorting the cubic structure in the manner schematically indicated by arrows on the
top-right part of Fig. 3.16. Such a distortion is similar to the cubic-tetragonal transition below
310 K reported by Yakel, but in this case of different nature introduced mechanically [Yake58].
The resulting lattice parameters after refinement were a = 3.1699 ± 0.0026 Å and
c = 4.4098 ± 0.0036 Å. The uncertainty in this case was larger than that obtained from the
refinement of the loose powders, due to the fact that the (200), (220) and (311) reflections were
not really split into two peaks. Thus, during refinement, the differences between calculated and
observed intensities were larger close the calculated peak positions of the tetragonal structure.
The tetragonal I4/mmm space group was, however, more appropriate than the cubic one to refine
the observed preferential peak broadening. Due to the unresolved split of these reflections, the
peak indexation of the cubic structure is maintained in the next sections, just bearing in mind that
the peak broadening is the result of two components, a finer crystallite size and a tetragonally
distorted Ti sub-lattice.
3.6.2 Phase transformation of TiH2 PS grade followed in-situ by ED-XRD
The phase transformation sequence occurring to untreated and pre-treated TiH2 during
isochronal heating under Ar flow is presented in this section. The results obtained from in-situ
ED-XRD measurements are presented as density plots of diffracted intensities (colour-scale),
dispersed in energy (in keV), as a function of time (in minutes) or temperature (in °C). The peaks
of the diffracted intensities followed as function of time or temperature become lines in the
density plots that evolve in intensity and energy. Therefore, every phase transformation sequence
is described here in terms of evolution of diffracted lines with increasing temperature. The
present section is divided into sections 3.6.2.1 for the untreated condition, and 3.6.2.2 for the
pre-treated condition. Every density plot was labelled according to the heating rate applied, a
schematic drawing of one representative particle in the sample and a legend indicating the
condition as given in Table 3.4,
60
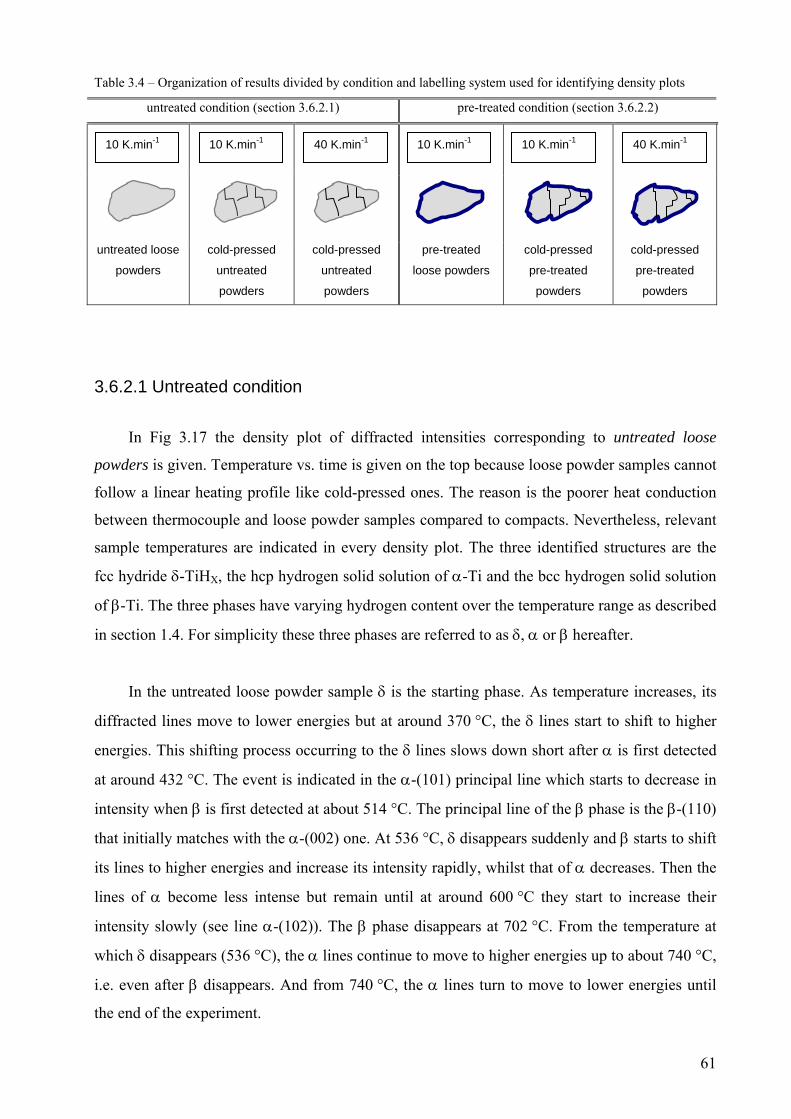
Table 3.4 – Organization of results divided by condition and labelling system used for identifying density plots
untreated condition (section 3.6.2.1) pre-treated condition (section 3.6.2.2)
untreated loose
powders
cold-pressed
untreated
powders
cold-pressed
untreated
powders
pre-treated
loose powders
cold-pressed
pre-treated
powders
cold-pressed
pre-treated
powders
10 K.min-1 10 K.min-1 10 K.min-1 10 K.min-1 40 K.min-1 40 K.min-1
3.6.2.1 Untreated condition
In Fig 3.17 the density plot of diffracted intensities corresponding to untreated loose
powders is given. Temperature vs. time is given on the top because loose powder samples cannot
follow a linear heating profile like cold-pressed ones. The reason is the poorer heat conduction
between thermocouple and loose powder samples compared to compacts. Nevertheless, relevant
sample temperatures are indicated in every density plot. The three identified structures are the
fcc hydride δ-TiHX, the hcp hydrogen solid solution of α-Ti and the bcc hydrogen solid solution
of β-Ti. The three phases have varying hydrogen content over the temperature range as described
in section 1.4. For simplicity these three phases are referred to as δ, α or β hereafter.
In the untreated loose powder sample δ is the starting phase. As temperature increases, its
diffracted lines move to lower energies but at around 370 °C, the δ lines start to shift to higher
energies. This shifting process occurring to the δ lines slows down short after α is first detected
at around 432 °C. The event is indicated in the α-(101) principal line which starts to decrease in
intensity when β is first detected at about 514 °C. The principal line of the β phase is the β-(110)
that initially matches with the α-(002) one. At 536 °C, δ disappears suddenly and β starts to shift
its lines to higher energies and increase its intensity rapidly, whilst that of α decreases. Then the
lines of α become less intense but remain until at around 600 °C they start to increase their
intensity slowly (see line α-(102)). The β phase disappears at 702 °C. From the temperature at
which δ disappears (536 °C), the α lines continue to move to higher energies up to about 740 °C,
i.e. even after β disappears. And from 740 °C, the α lines turn to move to lower energies until
the end of the experiment.
61
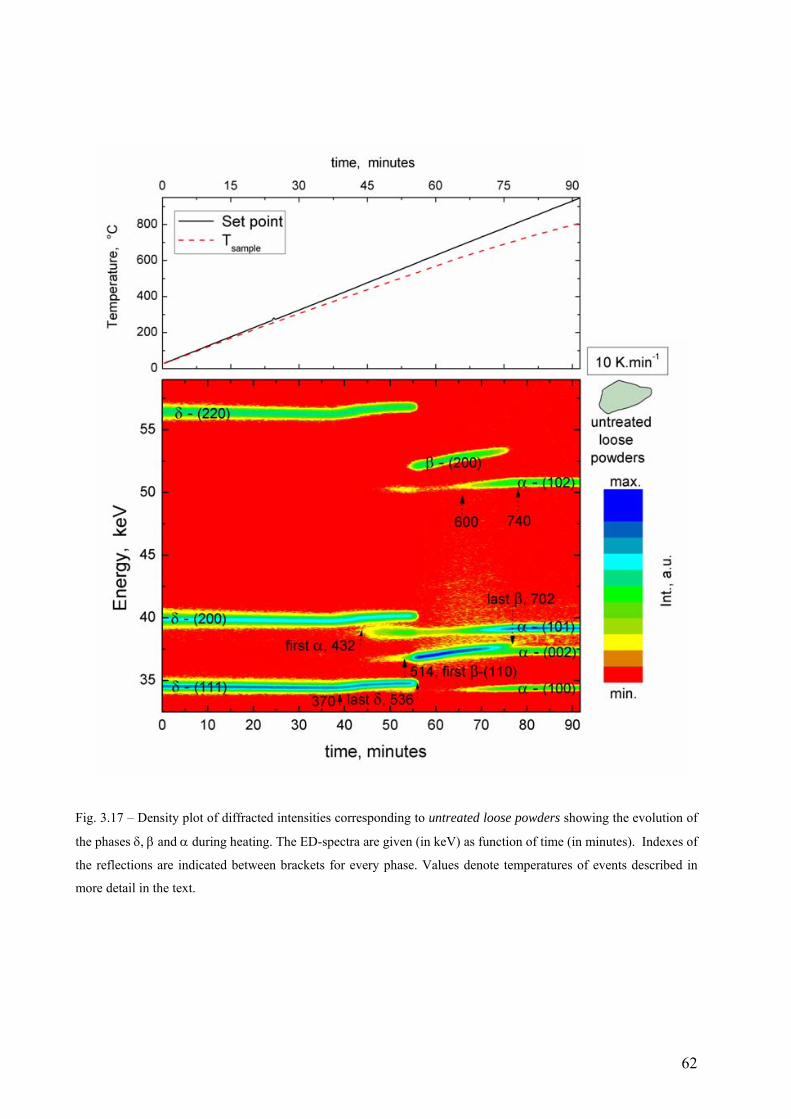
Fig. 3.17 – Density plot of diffracted intensities corresponding to untreated loose powders showing the evolution of
the phases δ, β and α during heating. The ED-spectra are given (in keV) as function of time (in minutes). Indexes of
the reflections are indicated between brackets for every phase. Values denote temperatures of events described in
more detail in the text.
62
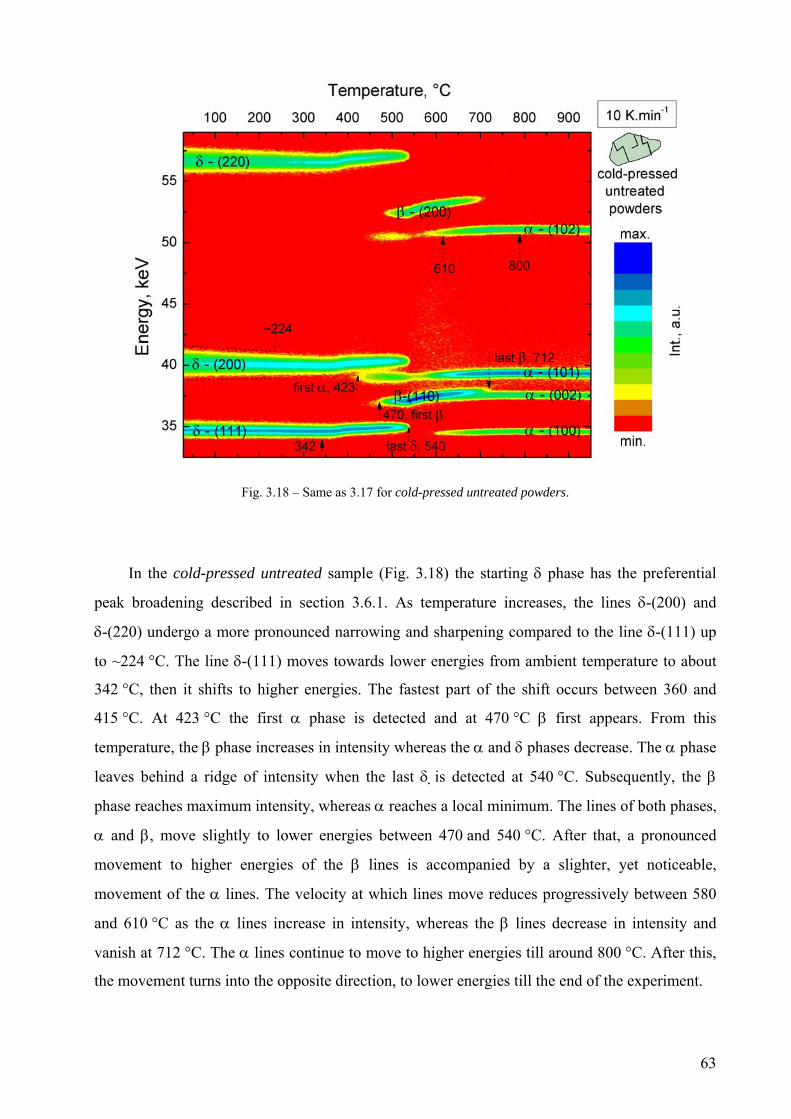
Fig. 3.18 – Same as 3.17 for cold-pressed untreated powders.
In the cold-pressed untreated sample (Fig. 3.18) the starting δ phase has the preferential
peak broadening described in section 3.6.1. As temperature increases, the lines δ-(200) and
δ-(220) undergo a more pronounced narrowing and sharpening compared to the line δ-(111) up
to ~224 °C. The line δ-(111) moves towards lower energies from ambient temperature to about
342 °C, then it shifts to higher energies. The fastest part of the shift occurs between 360 and
415 °C. At 423 °C the first α phase is detected and at 470 °C β first appears. From this
temperature, the β phase increases in intensity whereas the α and δ phases decrease. The α phase
leaves behind a ridge of intensity when the last δ is detected at 540 °C. Subsequently, the β
phase reaches maximum intensity, whereas α reaches a local minimum. The lines of both phases,
α and β, move slightly to lower energies between 470 and 540 °C. After that, a pronounced
movement to higher energies of the β lines is accompanied by a slighter, yet noticeable,
movement of the α lines. The velocity at which lines move reduces progressively between 580
and 610 °C as the α lines increase in intensity, whereas the β lines decrease in intensity and
vanish at 712 °C. The α lines continue to move to higher energies till around 800 °C. After this,
the movement turns into the opposite direction, to lower energies till the end of the experiment.
63
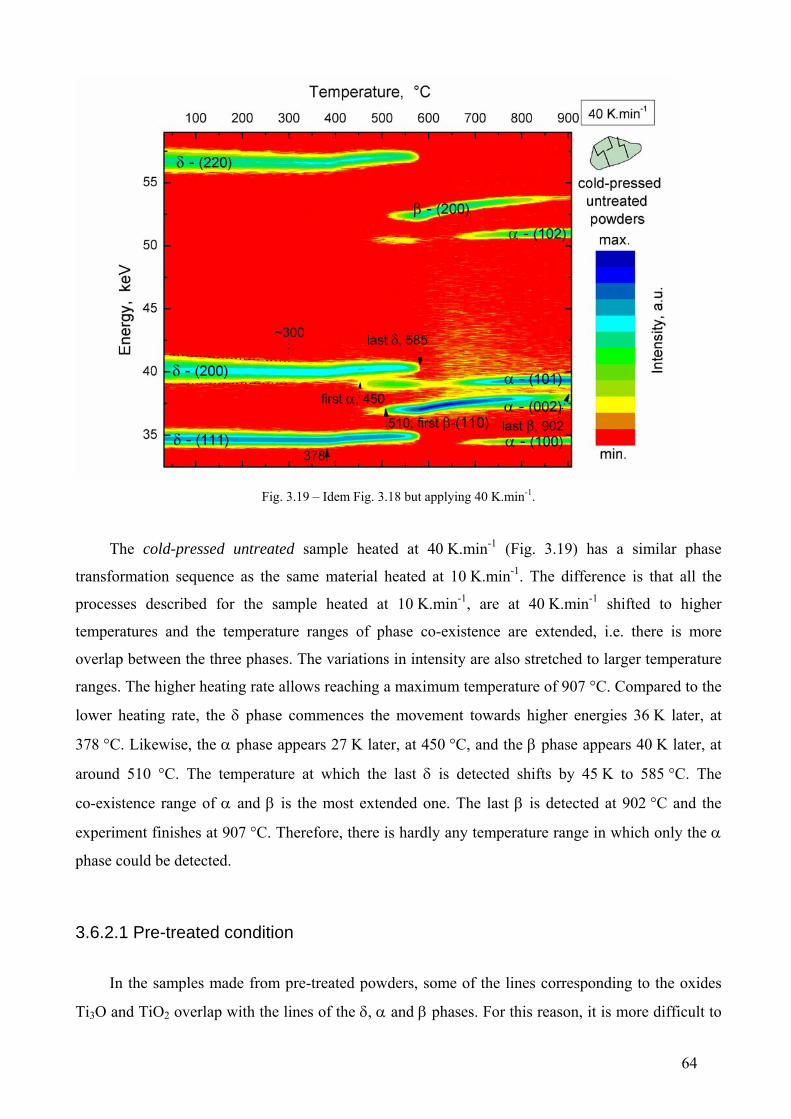
Fig. 3.19 – Idem Fig. 3.18 but applying 40 K.min-1.
The cold-pressed untreated sample heated at 40 K.min-1 (Fig. 3.19) has a similar phase
transformation sequence as the same material heated at 10 K.min-1. The difference is that all the
processes described for the sample heated at 10 K.min-1, are at 40 K.min-1 shifted to higher
temperatures and the temperature ranges of phase co-existence are extended, i.e. there is more
overlap between the three phases. The variations in intensity are also stretched to larger temperature
ranges. The higher heating rate allows reaching a maximum temperature of 907 °C. Compared to the
lower heating rate, the δ phase commences the movement towards higher energies 36 K later, at
378 °C. Likewise, the α phase appears 27 K later, at 450 °C, and the β phase appears 40 K later, at
around 510 °C. The temperature at which the last δ is detected shifts by 45 K to 585 °C. The
co-existence range of α and β is the most extended one. The last β is detected at 902 °C and the
experiment finishes at 907 °C. Therefore, there is hardly any temperature range in which only the α
phase could be detected.
3.6.2.1 Pre-treated condition
In the samples made from pre-treated powders, some of the lines corresponding to the oxides
Ti3O and TiO2 overlap with the lines of the δ, α and β phases. For this reason, it is more difficult to
64
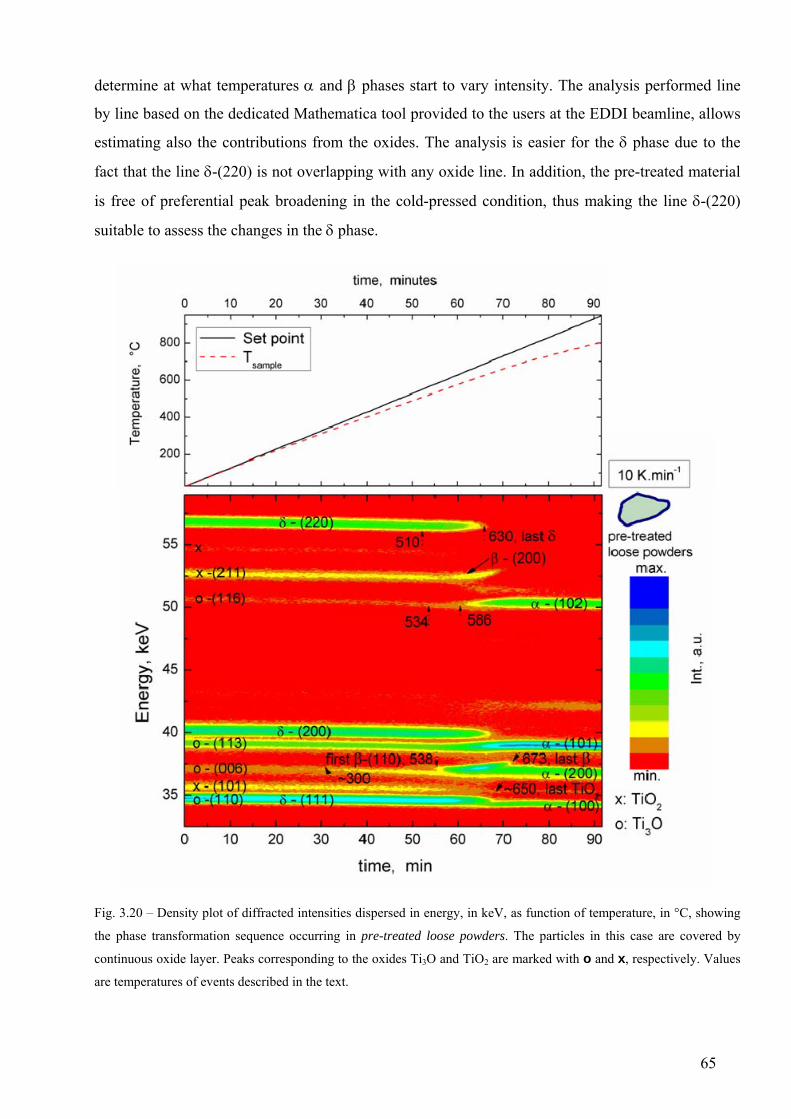
determine at what temperatures α and β phases start to vary intensity. The analysis performed line
by line based on the dedicated Mathematica tool provided to the users at the EDDI beamline, allows
estimating also the contributions from the oxides. The analysis is easier for the δ phase due to the
fact that the line δ-(220) is not overlapping with any oxide line. In addition, the pre-treated material
is free of preferential peak broadening in the cold-pressed condition, thus making the line δ-(220)
suitable to assess the changes in the δ phase.
Fig. 3.20 – Density plot of diffracted intensities dispersed in energy, in keV, as function of temperature, in °C, showing
the phase transformation sequence occurring in pre-treated loose powders. The particles in this case are covered by
continuous oxide layer. Peaks corresponding to the oxides Ti3O and TiO2 are marked with o and x, respectively. Values
are temperatures of events described in the text.
65
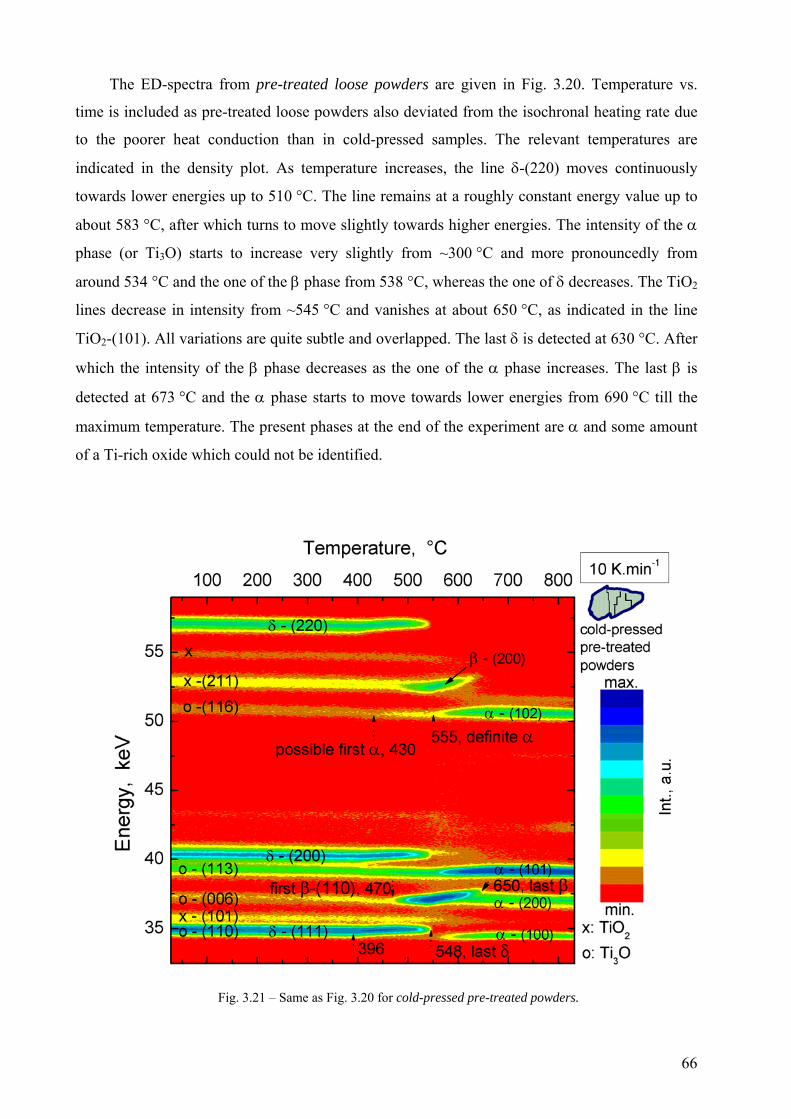
The ED-spectra from pre-treated loose powders are given in Fig. 3.20. Temperature vs.
time is included as pre-treated loose powders also deviated from the isochronal heating rate due
to the poorer heat conduction than in cold-pressed samples. The relevant temperatures are
indicated in the density plot. As temperature increases, the line δ-(220) moves continuously
towards lower energies up to 510 °C. The line remains at a roughly constant energy value up to
about 583 °C, after which turns to move slightly towards higher energies. The intensity of the α
phase (or Ti3O) starts to increase very slightly from ~300 °C and more pronouncedly from
around 534 °C and the one of the β phase from 538 °C, whereas the one of δ decreases. The TiO2
lines decrease in intensity from ~545 °C and vanishes at about 650 °C, as indicated in the line
TiO2-(101). All variations are quite subtle and overlapped. The last δ is detected at 630 °C. After
which the intensity of the β phase decreases as the one of the α phase increases. The last β is
detected at 673 °C and the α phase starts to move towards lower energies from 690 °C till the
maximum temperature. The present phases at the end of the experiment are α and some amount
of a Ti-rich oxide which could not be identified.
Fig. 3.21 – Same as Fig. 3.20 for cold-pressed pre-treated powders.
66
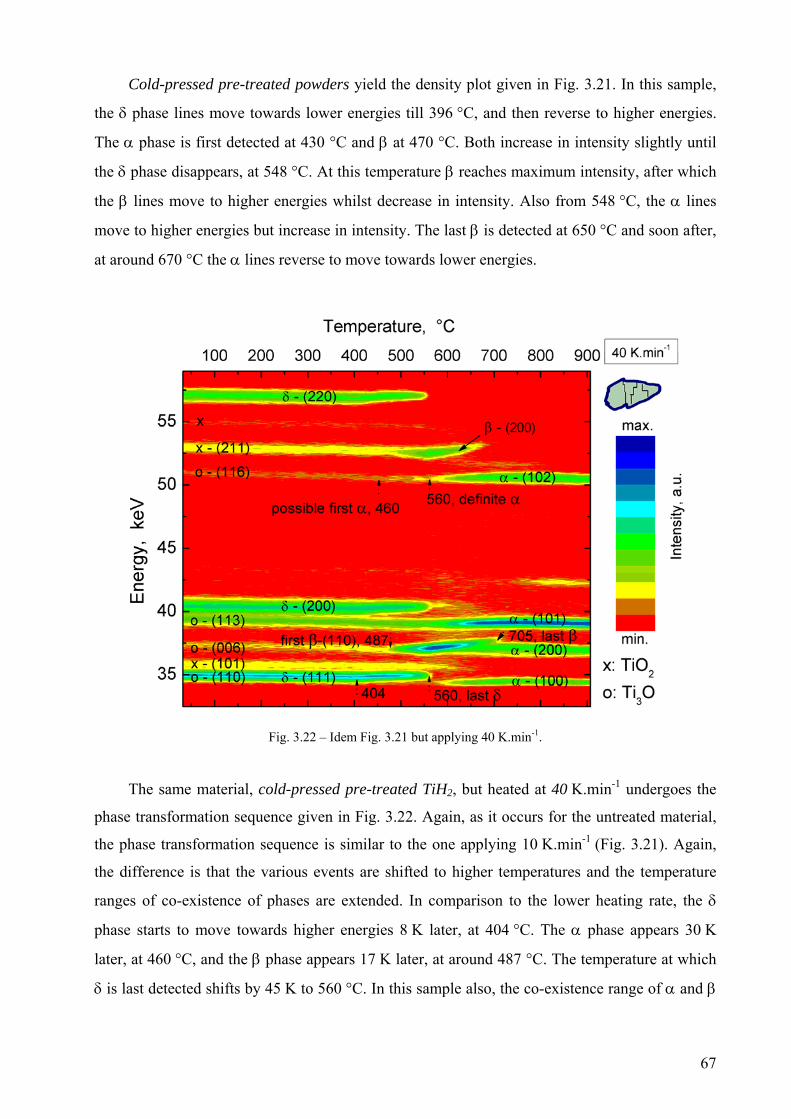
Cold-pressed pre-treated powders yield the density plot given in Fig. 3.21. In this sample,
the δ phase lines move towards lower energies till 396 °C, and then reverse to higher energies.
The α phase is first detected at 430 °C and β at 470 °C. Both increase in intensity slightly until
the δ phase disappears, at 548 °C. At this temperature β reaches maximum intensity, after which
the β lines move to higher energies whilst decrease in intensity. Also from 548 °C, the α lines
move to higher energies but increase in intensity. The last β is detected at 650 °C and soon after,
at around 670 °C the α lines reverse to move towards lower energies.
Fig. 3.22 – Idem Fig. 3.21 but applying 40 K.min-1.
The same material, cold-pressed pre-treated TiH2, but heated at 40 K.min-1 undergoes the
phase transformation sequence given in Fig. 3.22. Again, as it occurs for the untreated material,
the phase transformation sequence is similar to the one applying 10 K.min-1 (Fig. 3.21). Again,
the difference is that the various events are shifted to higher temperatures and the temperature
ranges of co-existence of phases are extended. In comparison to the lower heating rate, the δ
phase starts to move towards higher energies 8 K later, at 404 °C. The α phase appears 30 K
later, at 460 °C, and the β phase appears 17 K later, at around 487 °C. The temperature at which
δ is last detected shifts by 45 K to 560 °C. In this sample also, the co-existence range of α and β
67
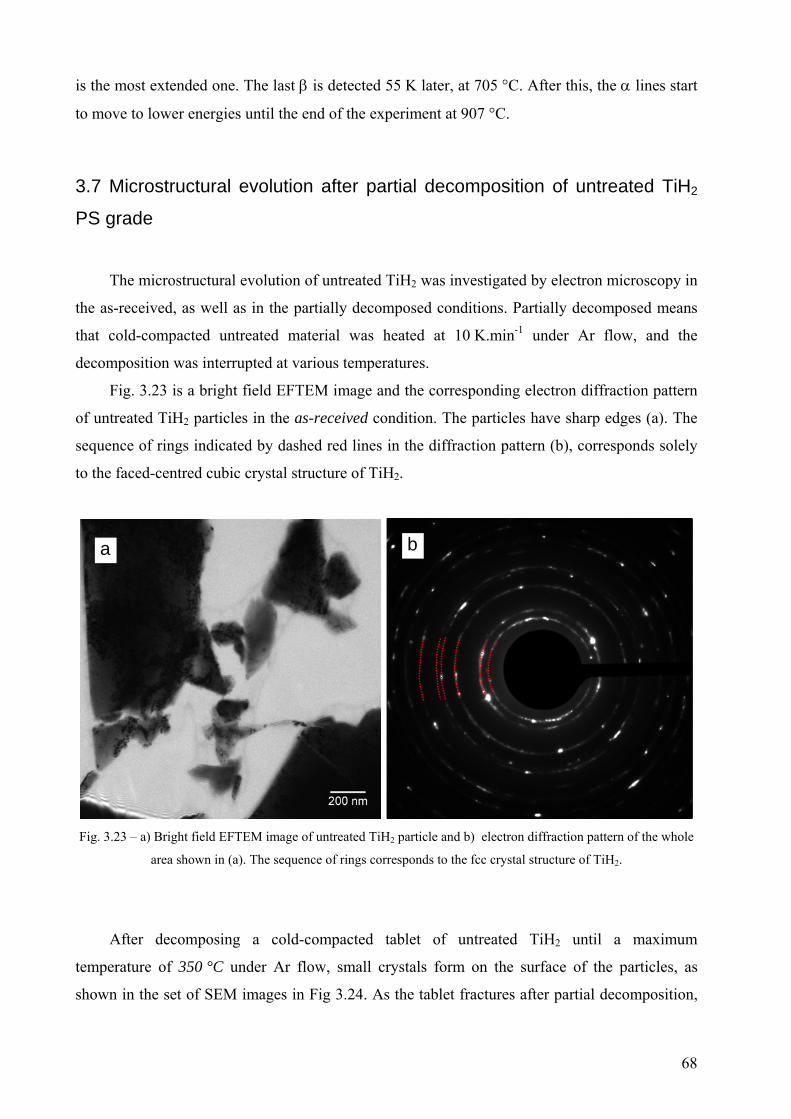
is the most extended one. The last β is detected 55 K later, at 705 °C. After this, the α lines start
to move to lower energies until the end of the experiment at 907 °C.
3.7 Microstructural evolution after partial decomposition of untreated TiH2
PS grade
The microstructural evolution of untreated TiH2 was investigated by electron microscopy in
the as-received, as well as in the partially decomposed conditions. Partially decomposed means
that cold-compacted untreated material was heated at 10 K.min-1 under Ar flow, and the
decomposition was interrupted at various temperatures.
Fig. 3.23 is a bright field EFTEM image and the corresponding electron diffraction pattern
of untreated TiH2 particles in the as-received condition. The particles have sharp edges (a). The
sequence of rings indicated by dashed red lines in the diffraction pattern (b), corresponds solely
to the faced-centred cubic crystal structure of TiH2.
b a
Fig. 3.23 – a) Bright field EFTEM image of untreated TiH2 particle and b) electron diffraction pattern of the whole
area shown in (a). The sequence of rings corresponds to the fcc crystal structure of TiH2.
After decomposing a cold-compacted tablet of untreated TiH2 until a maximum
temperature of 350 °C under Ar flow, small crystals form on the surface of the particles, as
shown in the set of SEM images in Fig 3.24. As the tablet fractures after partial decomposition,
68
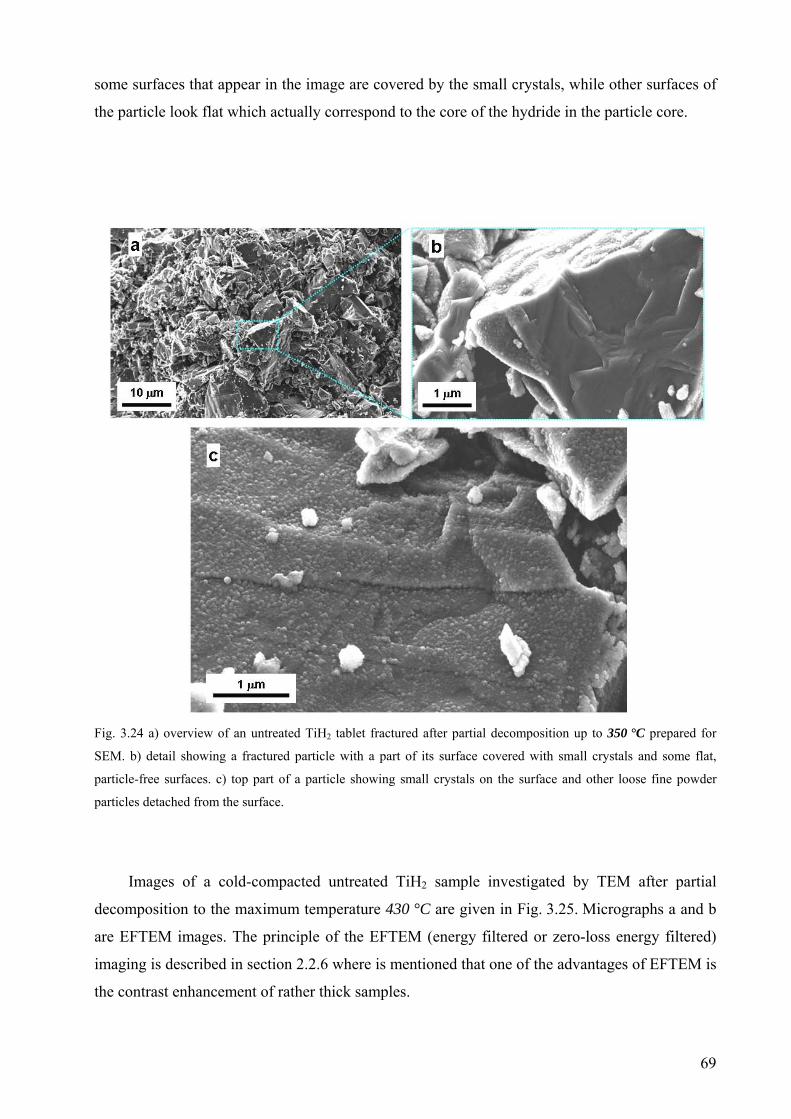
some surfaces that appear in the image are covered by the small crystals, while other surfaces of
the particle look flat which actually correspond to the core of the hydride in the particle core.
Fig. 3.24 a) overview of an untreated TiH2 tablet fractured after partial decomposition up to 350 °C prepared for
SEM. b) detail showing a fractured particle with a part of its surface covered with small crystals and some flat,
particle-free surfaces. c) top part of a particle showing small crystals on the surface and other loose fine powder
particles detached from the surface.
Images of a cold-compacted untreated TiH2 sample investigated by TEM after partial
decomposition to the maximum temperature 430 °C are given in Fig. 3.25. Micrographs a and b
are EFTEM images. The principle of the EFTEM (energy filtered or zero-loss energy filtered)
imaging is described in section 2.2.6 where is mentioned that one of the advantages of EFTEM is
the contrast enhancement of rather thick samples.
69
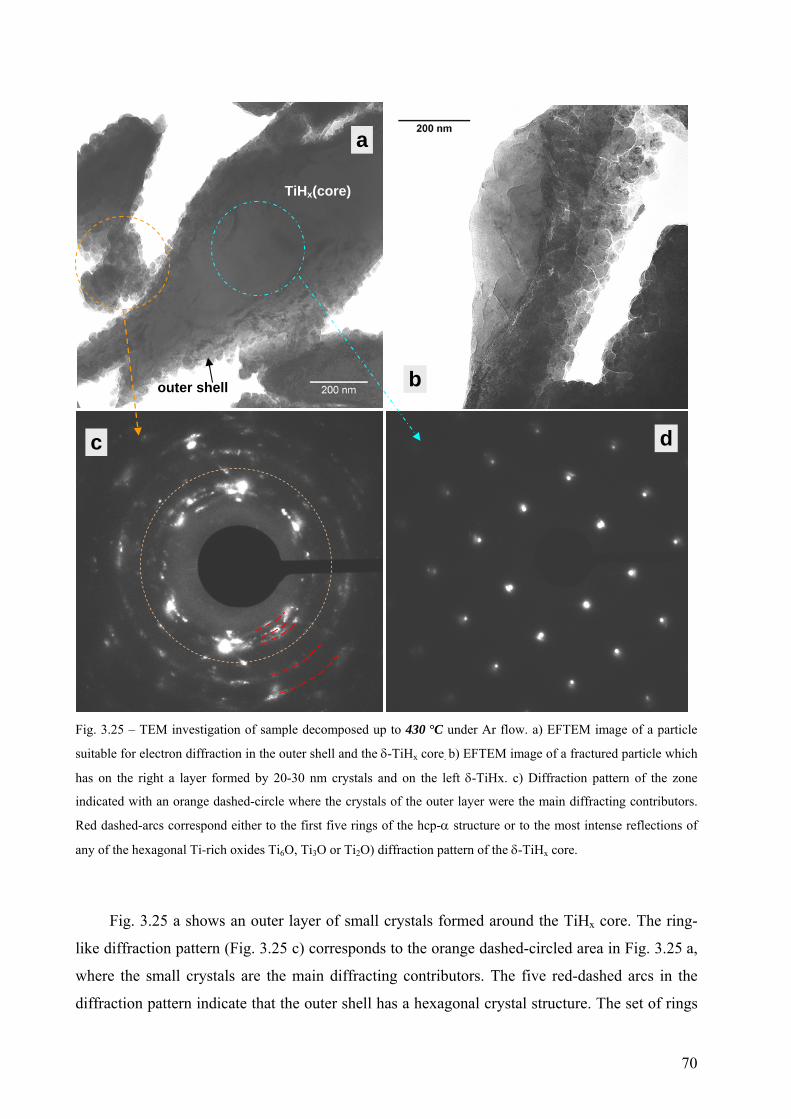
dc
b
TiHx(core)
outer shell
a
Fig. 3.25 – TEM investigation of sample decomposed up to 430 °C under Ar flow. a) EFTEM image of a particle
suitable for electron diffraction in the outer shell and the δ-TiHx core. b) EFTEM image of a fractured particle which
has on the right a layer formed by 20-30 nm crystals and on the left δ-TiHx. c) Diffraction pattern of the zone
indicated with an orange dashed-circle where the crystals of the outer layer were the main diffracting contributors.
Red dashed-arcs correspond either to the first five rings of the hcp-α structure or to the most intense reflections of
any of the hexagonal Ti-rich oxides Ti6O, Ti3O or Ti2O) diffraction pattern of the δ-TiHx core.
Fig. 3.25 a shows an outer layer of small crystals formed around the TiHx core. The ring-
like diffraction pattern (Fig. 3.25 c) corresponds to the orange dashed-circled area in Fig. 3.25 a,
where the small crystals are the main diffracting contributors. The five red-dashed arcs in the
diffraction pattern indicate that the outer shell has a hexagonal crystal structure. The set of rings
70
denoted with dashed red arcs could be the first five reflections of the hcp-α structure or the main
reflections of the Ti-rich oxides Ti6O, Ti3O or Ti2O whose structure are hexagonal or trigonal.
Thus, the arrangement of rings in the diffraction pattern c appears to have lower symmetry that
the hcp structure since there is at least another ring, marked by the orange short-dashed circle,
which neither corresponds to the hcp-α structure nor to the fcc-δ. It could correspond to a
reflection of the oxides Ti6O, Ti3O or Ti2O. Fig. 3.25 d is the diffraction pattern of the cyan dot-
dashed circle area showing the [200] zone-axis of the δ-TiHx core.
Fig. 3.25 b is an EFTEM image of a fractured particle which has on the right side, small
crystals from 20 to 30 nm that form a layer of thickness is ~ 200 nm. However, the estimation of
the outer layer thickness is not precise since the sample was not prepared in cross-section.
Figures 3.26 and 3.27 include a series of tablets partially decomposed by heating them
under Ar to 455, 570, 670 and 800 °C, interrupting, and thereafter investigated by SEM. The
phases were determined by AD-XRD after cooling by using the ICDD-PDF database. Then, each
phase was indicated in these SEM images based on transmission electron diffraction previously
done, and, by comparison to microstructural investigations carried out by Lenning and
co-workers included in the review by Müller [Müll68].
Images of samples heated up to 455 °C and 570 °C are included in Fig. 3.26. The sample
that reached 455 °C preserves powder-like characteristics (Fig. 3.26 a) but the edges of the
particles appear rounded. The effect is visible more clearly in the enlarged image below. This
sample heated up to 455 °C should consist of a δ-core covered by and outer α-shell similar to the
arrangement of phases observed by TEM in Fig.3.25. In addition, two original powder particles
that were fractured during compaction are indicated with dotted orange lines in the top image of
this sample. Such fractured particles could be identified in more that two areas. However, the
intention here is simply to indicate that the powders in the as-received condition become finer
while producing cold-pressed tablets. The second sample, Fig. 3.26 b, was cooled down from
570 °C. This is a temperature in which β was the predominant phase (see Fig. 3.18 in p. 52). But
as β is a high temperature phase that cannot be retained during cooling, the eutectoid reaction
β→ α + δ occurs (see Ti-H phase diagram in Fig. 1.4 in p. 11), leading to this flake-like
eutectoid microstructure, mixture of δ + α distributed over the whole particle.
71
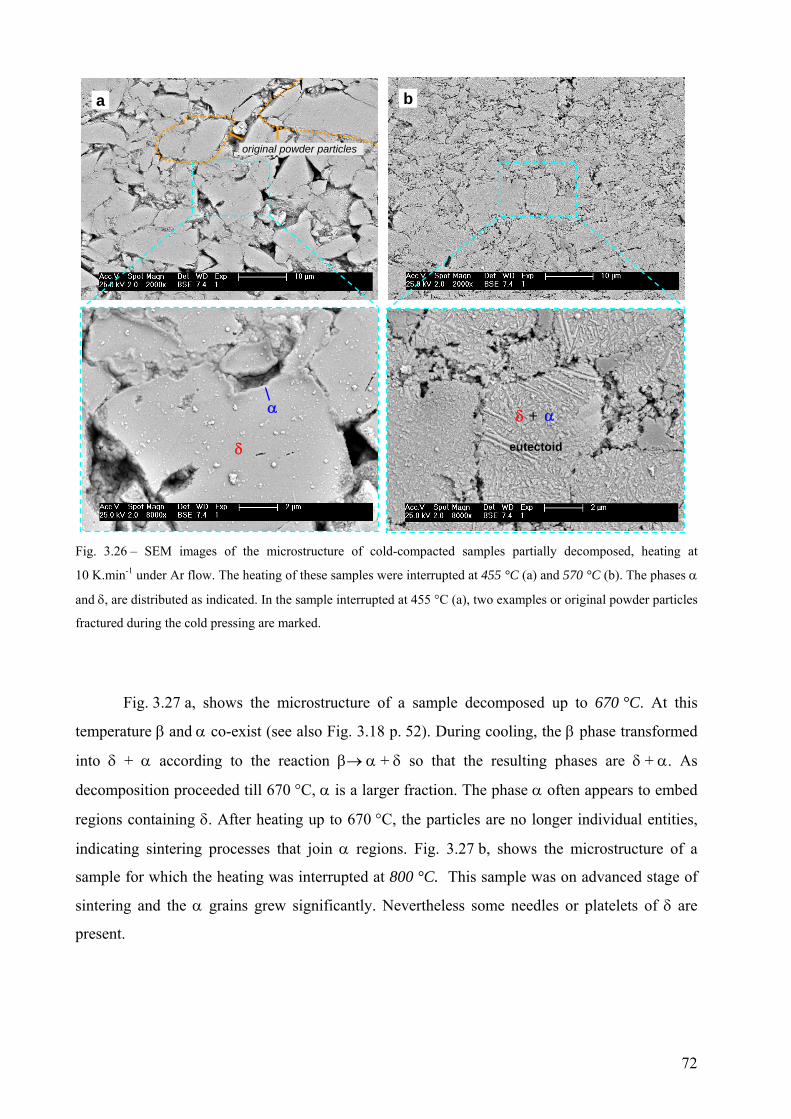
b a
eutectoid
αδ +α
δ
original powder particles
Fig. 3.26 – SEM images of the microstructure of cold-compacted samples partially decomposed, heating at
10 K.min-1 under Ar flow. The heating of these samples were interrupted at 455 °C (a) and 570 °C (b). The phases α
and δ, are distributed as indicated. In the sample interrupted at 455 °C (a), two examples or original powder particles
fractured during the cold pressing are marked.
Fig. 3.27 a, shows the microstructure of a sample decomposed up to 670 °C. At this
temperature β and α co-exist (see also Fig. 3.18 p. 52). During cooling, the β phase transformed
into δ + α according to the reaction β→ α + δ so that the resulting phases are δ + α. As
decomposition proceeded till 670 °C, α is a larger fraction. The phase α often appears to embed
regions containing δ. After heating up to 670 °C, the particles are no longer individual entities,
indicating sintering processes that join α regions. Fig. 3.27 b, shows the microstructure of a
sample for which the heating was interrupted at 800 °C. This sample was on advanced stage of
sintering and the α grains grew significantly. Nevertheless some needles or platelets of δ are
present.
72
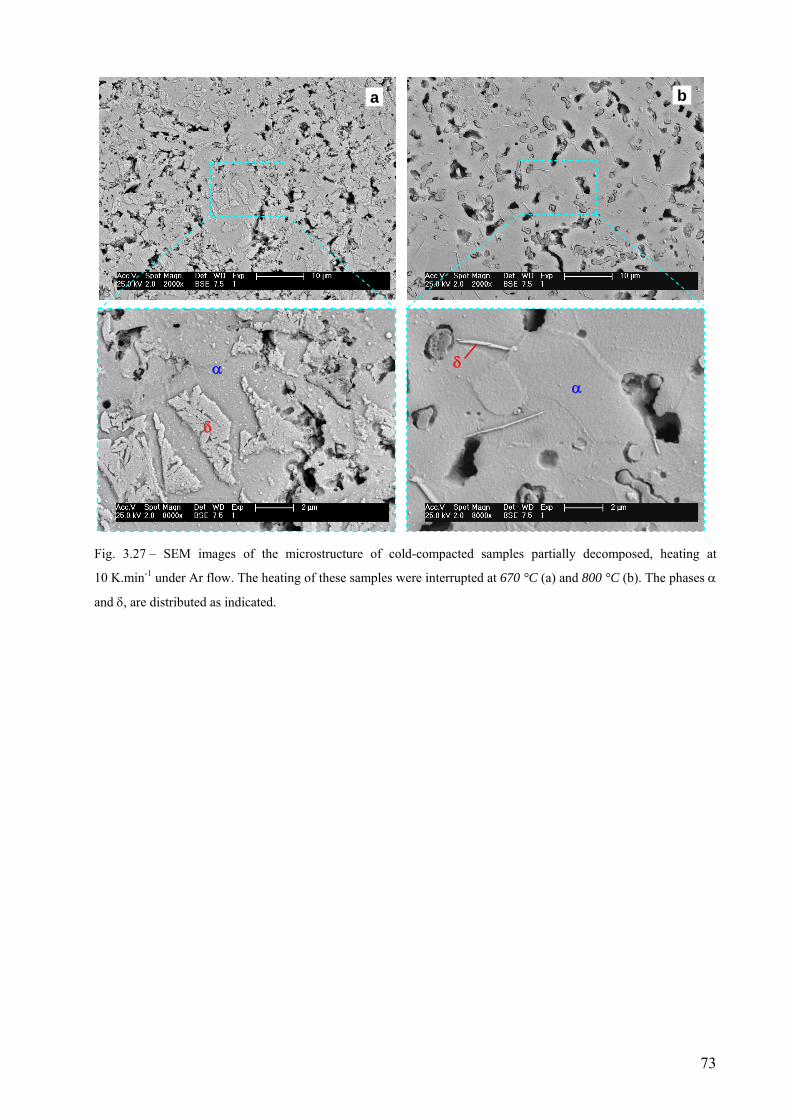
b
α δ
a
α
δ
Fig. 3.27 – SEM images of the microstructure of cold-compacted samples partially decomposed, heating at
10 K.min-1 under Ar flow. The heating of these samples were interrupted at 670 °C (a) and 800 °C (b). The phases α
and δ, are distributed as indicated.
73

74
4. Discussion
4.1 Influence of compaction atmosphere on the foaming behaviour of
AlSi11
Hot-compaction under vacuum was found to be a good strategy to produce AlSi11 foams
of more regular pore size distribution. To describe the reason, the influence of the compaction
atmosphere on the various steps of the PM route is examined. The question arising is how
hot-compaction under vacuum reduces the crack-like pore-initiation mechanism during foaming.
4.1.1 Properties of the powder compacts
It has been shown in Fig. 3.4 that hot-compaction under vacuum increased the relative
density of the precursors compared to the air-pressed ones, and kept the oxygen content almost at
the level of the powder mixture. This is true for both alloys with and free of TiH2. The effect was
subtle for precursor material free of TiH2, but significant for precursor material with TiH2. This
means that the addition of 0.5 wt.% of TiH2 causes the increase in oxygen content of the
air-pressed compacts. This effect, however, can be controlled or reduced by compacting the
powders under vacuum.
The question arises: how could TiH2 promote such a noticeable increase of oxygen
content in the air-compacted precursors containing hydride? A possible answer is water
formation triggered by hydrogen release from TiH2 in the presence of oxygen. It is known that
H2 release from hydrides in the presence of oxygen leads to catalytic formation of water, by
dissociation of adsorbed H2 and O2 molecules to recombine as H2O [Schl92]. It is also known
that water vapour would create a local oxidizing atmosphere for the aluminium powders, as it
would also prevent the dehydration of Al(OH)3 hydroxide which usually covers the alumina
layer that covers the powders Al powders [Wafe81, Pick81, Estr91, Ünal99]. In order to
understand if water could be formed due to the addition of TiH2, it is necessary to consider that
the hydride particles fractured during compaction. One SEM image of a fractured TiH2 particle
was shown in Fig. 3.5 b. Due to particles fracture, hydrogen could be released below 400 °C.
The results from MS of cold-pressed pre-treated TiH2 N grade support the latter statement. It can
be seen in Fig. 3.13 a (inset) that there is hydrogen release below 400 °C. Furthermore, at the
75
heating rate applied for hot-compaction, ~8 K.min-1, hydrogen release could be shifted to an
earlier instant, i.e. a lower temperature. Those MS measurements were carried out under Ar
atmosphere, in which oxygen is present as impurity below 5 ppm, water is produced as shown in
Fig. 3.15. Even if oxygen is present in such a small quantity, water formation was detected as
shown in Fig. 4.2.
The purpose of performing hot-compaction under vacuum was to obtain well
consolidated precursors, in order to reduce growth of crack-like pores formed before melting of
the Al-Si alloy. One way to ensure good consolidation of foamable precursors would be to
hot-press at higher temperatures than 400 °C. The criterion for degassing temperature selection
for traditional Al PM-parts is to surpass the maximum temperature of any further processing step
or the service temperature. Typically degassing temperatures are above 500 °C [Pick81, Estr91,
Stan91]. However, in the preparation of foamable precursors by the PM route, the maximum
hot-compaction temperature is limited by the onset of TiH2 decomposition. If compaction were
performed under vacuum, it may be possible to allow higher temperatures. But hot-compaction
in air at higher temperatures could promote water formation as already mentioned, or direct
further oxidation by reaction with oxygen that may deteriorate the consolidation of Al powders.
In order to understand why, it is necessary to interpret the significance of the properties like
relative density and oxygen in terms of the degree of consolidation.
A high relative density indicates a good consolidation but does not reveal to which extent
the Al particles were metallically bonded. It is essential to achieve good Al-Al bonding because
the consolidation of foamable Al-Si PM-precursors relies on it. The works by Mosler et al. and
Helfen et al. illustrated that there is a spatial correlation between early crack-like pores and Si
particles [Mosl01, Helf05]. Besides, Helfen et al. reported that the bonding strength between Al
and Si is lower than between Al and TiH2 or between Al particles [Helf05]. Si and TiH2 are both
brittle, and so they fracture and host residual porosity inside or in their vicinity (see Fig 3.5).
Strengthening Al/Si or Al/TiH2 bonds would not improve the resistance of the compacted
material to the growth of crack-like pores. The alternative is to strengthen the bonding between
Al particles. Al powder is ductile but the powder particles are covered by a stable oxide layer
which can also react with moisture to form hydroxides. During hot compaction, Al particles are
squeezed and sheared to get metallically bonded by breaking the oxide layer. Compaction under
vacuum then helps removing entrapped gasses, dehydrating oxides and preventing further
oxidation [Pick81, Estr91]. If the oxygen content is kept low, then it can be expected that the
76
oxide layers break into smaller pieces and the metallic bonding between Al particles is achieved
in larger regions compared to compaction in air. In this manner a more consolidated Al matrix
was produced, able to reduce cracking by controlling the growth of crack-like pores formed in
the solid state.
4.1.2 Hydrogen losses to evaluate consolidation, melting sequence, and its
influence on expansion and foaming behaviour
The hydrogen evolution from cylinder-shaped compacted material with TiH2 as shown in
Fig. 3.6 was used to evaluate the effect of the compaction atmosphere on consolidation applying
a temperature profile similar to the one used for foaming. The difference of 212 K
(555 − 343 °C) between onset temperatures, confirmed that compaction under vacuum
significantly improved consolidation. The hydrogen release from filings of material with TiH2
represents to a certain extent the gas available in the precursor material for foaming. Filings of
vacuum- and air-pressed precursor containing TiH2 start to release hydrogen from around 130
and 357 °C, respectively, and both reach a broad peak at 357 °C. These are lower temperatures
than the ones detected for the onset of hydrogen release, 460 °C, from cold-pressed pre-treated
TiH2 N grade heating at the same rate, 40 K.min-1 (Fig. 3.13 b, green curve inset). Looking at the
hydrogen release behaviour from filings free of TiH2 in Fig 3.6, one can infer by comparing to
filings with TiH2 (regardless of the hot-compaction atmosphere) that the hydrogen available in
the compacts containing TiH2 has a significant contribution to the gases coming from the matrix.
It is very likely that hydrogen released before the decomposition of TiH2, originates from the
aluminium powders. This statement is based on two arguments, on the one hand, the Si powders
used were found to be less prone than Al powders to moisture and hydrogen pick-up [Jime07],
and, on the other hand, the hot-compaction temperature was 400 °C but the last reaction in the
dehydration sequence on the surface of Al powders is activated above 500 °C [Estr91].
According to the binary phase diagram, the first liquid should be formed at the eutectic
temperature, 577 °C [Murr99]. It was observed that at 579 °C hydrogen losses decay (after first
peak), as if the formation of liquid partially sealed the paths through which hydrogen could
escape. The same melting sequence applies for both compacts, which is why the two peaks were
observed at the same temperatures. Matijasevic-Lux et al. measured hydrogen evolution from
77
AlSi6Cu4 and von Zeppelin et al. from AlSi7, both containing TiH2 [Matl06, vZep03]. Both
authors reported single peak structures for hydrogen release rather than the double peak structure
observed in this work. This difference is attributed to the lower heating rates (20 K.min-1 and
5 K.min-1, respectively) and the smaller sample sizes (3×3×3 mm3) used by them. After the first
peak has levelled off, hydrogen release approaches a second maximum, as if TiH2 decomposition
becomes dominant in the semi-molten state of the alloy. The second peak at 663 °C is close to
the melting point of Al (660 °C) but could be also cause by the caused by entering into an the
isothermal step of the heating profile which would lead to a reduction in the decomposition rate
of the hydride.
The porous structure is initiated in the solid state and carries a history which cannot be
erased by the melting sequence during foaming, as shown in Figs. 3.7 and 3.8. The better
consolidated vacuum-pressed precursors reached larger expansions than air-pressed ones due to
the significant reduction in hydrogen losses, especially below the eutectic temperature. The
expansion of vacuum-pressed precursors deviated from the initial linear increase at around
555 °C, the temperature at which these cylinder precursors release their first hydrogen (Fig. 3.6).
The more abrupt change in hydrogen release and expansion that occurs at 555 °C for the
vacuum-pressed material, points at a relationship between onset of hydrogen release and
non-linear expansion.
Helfen et al. studied the evolution of the porous structure of AlSi7 foamed with TiH2
using computed tomography [Helf02]. They observed that with the appearance of the liquid, the
crack-like interconnected pore morphology gradually rounded off in order to reduce surface
tension. This is consistent with our observations that above 647 °C expansion could develop
steadily sustained by the decomposition of TiH2 and a large enough fraction of liquid. The
system tended to have more roundish bubbles, but the definite decay of hydrogen release needed
the melting sequence to be completed, i.e. to reach the melting point of Al (second peak at
663 °C in Fig. 3.6). Shorter and more numerous elongated bubbles in the vacuum-pressed
precursors were further evidence for the better consolidation. These compacts permitted the
built-up of higher pressures in smaller pores. The initial growth perpendicular to the compaction
direction was arrested, leading to more efficient, homogeneous and reproducible expansion. The
more regular porous structure obtained after solidification from vacuum-pressed material
(Fig. 3.11) was just consistent with the concept of the limited growth of elongated pores at the
early stages of expansion.
78
The relationship between gas losses, pore initiation, melting sequence and expansion
discussed above is less obvious in the foaming of samples free of TiH2 as they were melted
under overpressure, which is the principle of pressure-induced foaming (PIF). Nevertheless, on
the average vacuum-pressed precursors expanded slightly more than air-pressed ones (Fig. 3.9)
which is an indirect evidence of a better consolidation. Even if the vacuum-pressed precursors
may contain less gas, the better consolidation made sure that the metallic matrix holds the gases
inside and yields a larger expansion. A more direct evidence of better consolidation is the
mechanism of pore initiation shown in Fig. 3.10. In the air-pressed material at 64 s, where the
gas pressure is 10.77 bar of gas pressure, some elongated bubbles are detected. They result in big
bubbles, whereas in the vacuum-pressed material the bubbles nucleated are so small, that they
cannot be seen at that time.
4.1.3 Porous structure of solidified foams
The resulting porous structure of the solid foams is a direct consequence of the foaming
process. In the case of air-compacted precursors with TiH2, shown in Fig. 3.11, the lower onset
temperature and the larger quantity of hydrogen released made expansion more sluggish over the
entire foaming course. After melting, big elongated bubbles formed and maintained their
anisotropic shape, eventually leading to non-uniform expansion. As hydrogen escaped through
the surface, the built-up of pressure in the outer pores was reduced, and so was their ability to
grow after melting. Thus the larger hydrogen losses promoted the accumulation of small pores in
a denser outer region of the resulting solid porous structure.
In the other extreme, the vacuum-pressed material free of TiH2 should have less gas available
due to the degassing performed during compaction, but gas losses are less during foaming due to
better consolidation. Besides, the bubbles nucleated are very small and homogeneously
distributed in the volume also due to better consolidation. Thus, the pressure build-up inside the
nucleated bubbles at overpressure is larger, so that PIF produces larger bubbles but a more
regular distribution in pore size, as shown in Fig. 3.12 compared to the foam made of air-pressed
material free of TiH2.
79
4.2 The decomposition of TiH2 under Ar flow – hydrogen release and phase
transformation sequence
The need for a better understanding of the decomposition process of untreated and
pre-treated TiH2 powders motivated this part of the work. The aim was to clarify whether the
various peaks of hydrogen release that occur during isochronal heating are related to the phase
transformation sequence undergone by the TiH2 particles. Fig 3.4 indicated that the small
addition (0.5 wt.%) of TiH2 was not innocuous and made the powder mixture quite sensitive to
the atmosphere used to prepare foamble hot-compacted material at 400 °C. TiH2 of course
decomposes during foaming, can suffer further decomposition during solidification or during
further heat treatment of metallic foams [Matl06, Mukh09, Seel06]. Since both untreated and pre-
treated TiH2 powders are used to make metal foams, a study of the decomposition in both
conditions is also relevant for applications.
A brief discussion of the methods and data analysis is considered necessary to clarify the
interpretation and reliability of the various experimental techniques used. The mass loss from
untreated and pre-treated TiH2 N and PS grades will be compared. Then the discussion of the
relationship between phase transformation sequence and hydrogen release will be for TiH2 PS. A
more extended part will be dedicated to untreated (loose and cold-pressed) powders, and another
one to pre-treated (loose and cold-pressed) powders.
4.2.1 Methods and data analysis used to study TiH2 decomposition
Thermoanalysis
The whole process of decomposition takes place in various stages. TG-MS curves
indicate various rates of mass loss and a multi-peak structure of hydrogen release (Fig. 3.13 for
TiH2 N grade and Fig. 3.14 for TiH2 PS grade). In principle, the various thermo-analytical
methods provide the same information. For example, the DTG curve should resemble the one of
MS for mass = 2, and the ones of DSC or DTA, provided the decomposition of TiH2 is carried
out under Ar flow [Sest73, Taka95, Kenn02, Mati06a, Lehm08, Bhos03, vZep03]. However, all
instruments have limitations, which sometimes can be overcome by carrying out calibrations and
simultaneous analysis. In Fig. 4.1, the normalized integrated mass = 2 was compared with the
80
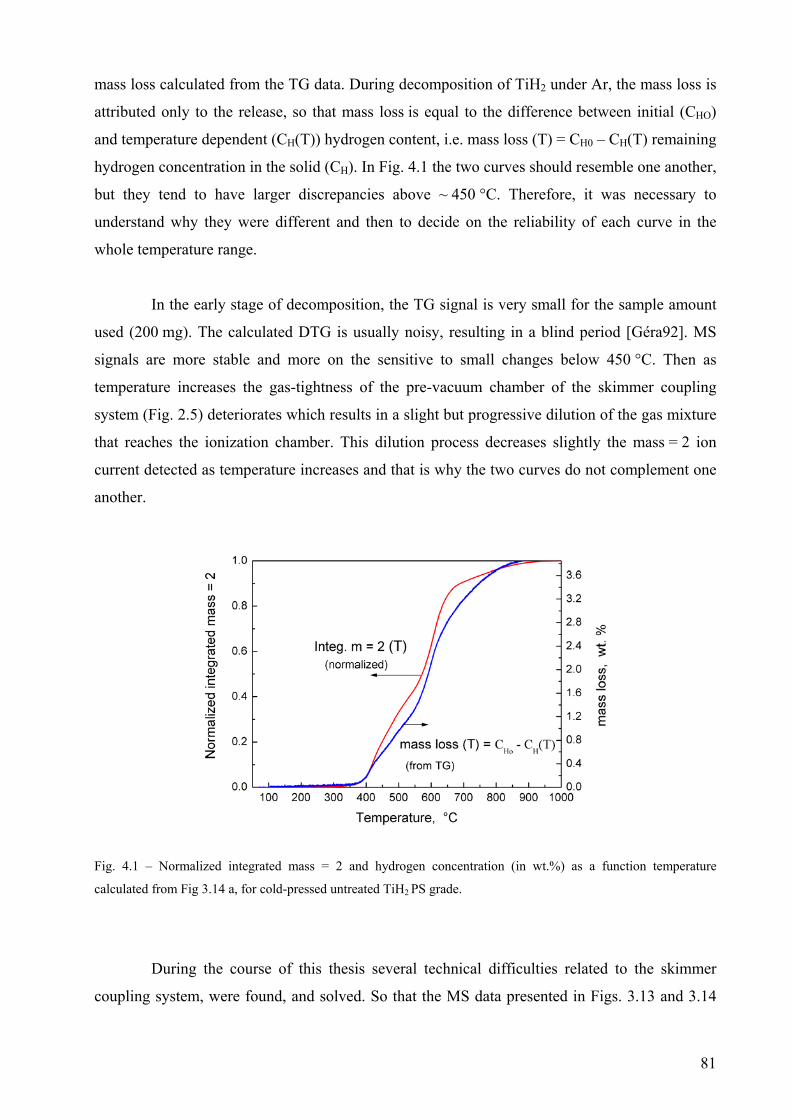
mass loss calculated from the TG data. During decomposition of TiH2 under Ar, the mass loss is
attributed only to the release, so that mass loss is equal to the difference between initial (CHO)
and temperature dependent (CH(T)) hydrogen content, i.e. mass loss (T) = CH0 – CH(T) remaining
hydrogen concentration in the solid (CH). In Fig. 4.1 the two curves should resemble one another,
but they tend to have larger discrepancies above ~ 450 °C. Therefore, it was necessary to
understand why they were different and then to decide on the reliability of each curve in the
whole temperature range.
In the early stage of decomposition, the TG signal is very small for the sample amount
used (200 mg). The calculated DTG is usually noisy, resulting in a blind period [Géra92]. MS
signals are more stable and more on the sensitive to small changes below 450 °C. Then as
temperature increases the gas-tightness of the pre-vacuum chamber of the skimmer coupling
system (Fig. 2.5) deteriorates which results in a slight but progressive dilution of the gas mixture
that reaches the ionization chamber. This dilution process decreases slightly the mass = 2 ion
current detected as temperature increases and that is why the two curves do not complement one
another.
Fig. 4.1 – Normalized integrated mass = 2 and hydrogen concentration (in wt.%) as a function temperature
calculated from Fig 3.14 a, for cold-pressed untreated TiH2 PS grade.
During the course of this thesis several technical difficulties related to the skimmer
coupling system, were found, and solved. So that the MS data presented in Figs. 3.13 and 3.14
81
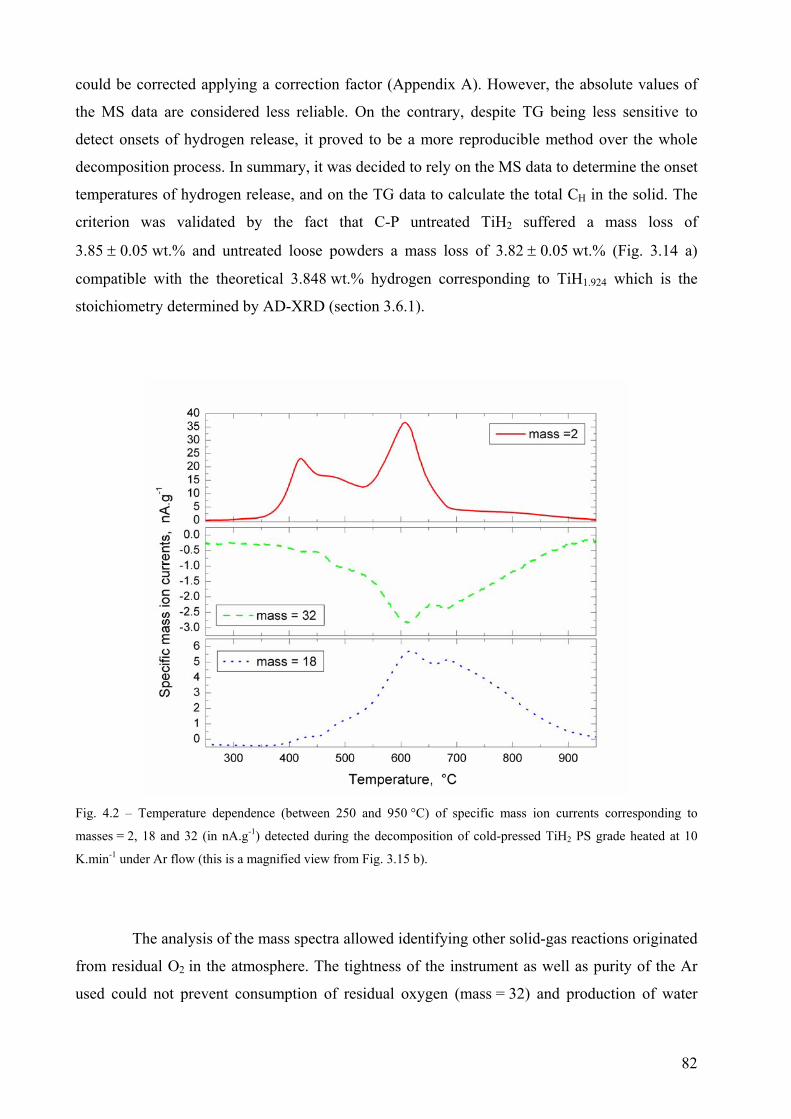
could be corrected applying a correction factor (Appendix A). However, the absolute values of
the MS data are considered less reliable. On the contrary, despite TG being less sensitive to
detect onsets of hydrogen release, it proved to be a more reproducible method over the whole
decomposition process. In summary, it was decided to rely on the MS data to determine the onset
temperatures of hydrogen release, and on the TG data to calculate the total CH in the solid. The
criterion was validated by the fact that C-P untreated TiH2 suffered a mass loss of
3.85 ± 0.05 wt.% and untreated loose powders a mass loss of 3.82 ± 0.05 wt.% (Fig. 3.14 a)
compatible with the theoretical 3.848 wt.% hydrogen corresponding to TiH1.924 which is the
stoichiometry determined by AD-XRD (section 3.6.1).
Fig. 4.2 – Temperature dependence (between 250 and 950 °C) of specific mass ion currents corresponding to
masses = 2, 18 and 32 (in nA.g-1) detected during the decomposition of cold-pressed TiH2 PS grade heated at 10
K.min-1 under Ar flow (this is a magnified view from Fig. 3.15 b).
The analysis of the mass spectra allowed identifying other solid-gas reactions originated
from residual O2 in the atmosphere. The tightness of the instrument as well as purity of the Ar
used could not prevent consumption of residual oxygen (mass = 32) and production of water
82
(mass = 18) on the surfaces of the powders. A rescaling of individual signals from Fig. 3.15 b is
given in Fig. 4.2, where it can be seen that both processes were activated almost from the
beginning of hydrogen release. Water formation can be a product of powder surface oxidation
[Lavr90, Shem93], or catalytic water formation at the surface, i.e. adsorption and dissociation of
O2 molecules to combine with protons H+ to form H2O molecules [Schl92, C&E09]. Ex-situ
measurements of oxygen content from partially decomposed samples of untreated TiH2 at
various temperatures were given in Table 3.2. It was noticed that there is a genuine increase of
oxygen content from 1.42 wt.%, corresponding to untreated condition, up to 1.77 wt.% after
heating to 490 °C. But as the decomposition proceeded beyond that temperature until 1000 °C,
the oxygen content did not increase, rather decreased at intermediate temperatures. This supports
the idea of catalytic water formation, which was valuable evidence to understand how the
addition of TiH2 can increase the oxygen content of foamable precursors. In the study of the
decomposition under Ar flow, however, the moderate oxidation indicates that the main gaseous
product from the samples is hydrogen according to reaction,
)()()( 22 ↑+→ gHsTisTiH (4.1)
In-situ diffraction
The EDDI beamline hosted at the BESSY synchrotron facility, Berlin, is an instrumental
setup to perform ED-XRD studies and is designed to determine accurately peak energy positions
and shifts in energy. In order to determine absolute plane spacing or dhkl values using the relation
(2.2) given in section 2.2.8 further calibration is required. The calibration can be done either
using a standard or knowing a priori the lattice parameters of the material. The latter was the
followed strategy for which, AD-XRD and Rietveld analysis was performed to obtain reliable
lattice parameters of the hydride before the in-situ experiments (section 3.6.1) for both untreated
and pre-treated conditions according to the relation [Cull78],
2
222
21
alkh
dhkl
++= (4.2)
On the other hand, concerning the determination of volume fractions of phases, it may be
useful to mention that the study by Eisenreich et al. is one example in which integrated
83
intensities were calculated from ED-XRD data to perform phase analysis and were combined
with thermo-analysis for kinetics studies of heterogeneous reactions [Einr83, Zcho05, Mala08].
The in-situ ED-XRD presented here were carried out in transmission-mode using high energy
that minimized attenuation effects. This facilitated the estimation of δ, α and β volume fractions
vs. temperature from integrated intensities. The energy range 32–59 keV was selected as it
contains the main reflections of the three phases δ, α and β. The calculation was as follows: in
the mentioned energy range each phase diffracted a certain fraction of the total diffracted
intensity, Ii, with i = δ, α, β, Ti3O, TiO2. The total intensity, ITotal, was the sum of the five phases,
and the volume fraction was simply given by the relation,
Total
ivol I
Iif =)( (4.3)
This calculation was straight-forward for the untreated powders within the detection
limits of ED-XRD. For pre-treated powders the contributions from the oxides made the analysis
more difficult due to the fact that some of the oxide peaks overlap with reflections of the three
phases δ, α or β, and therefore it was difficult to determine changes (as indicated in
Fig. 3.20−3.22) which made the analysis performed on pre-treated TiH2 less reliable than the one
performed on untreated TiH2.
Other in-situ diffraction methods were used in the course of this study. In-situ AD-XRD
was carried out at the KMC-2 beamline at BESSY, Berlin. Those measurements were carried out
in reflection mode. Two examples, one for untreated and another for pre-treated TiH2, were
reported in Appendix D. That beamline offered even better time resolution than the EDDI
beamline. However, the KMC-2 is optimized to run with a photon-energies around 8 keV (close
to CuKα), which required measurements in reflection mode. This geometry allowed in the best
case following the phase transformation sequence from the top layer of particles. The phase
transformation sequence acquired there was very similar to the one followed by Matijasevic and
Zizak for TiH2 N grade mainly differing in temperatures [Mati06a]. The limited penetration
depth remained a source of uncertainty that motivated to search for alternative in-situ diffraction
methods. Additionally, the tightness of the furnace used at KMC-2 could not prevent oxidation
of the material which was of course an undesirable effect.
84
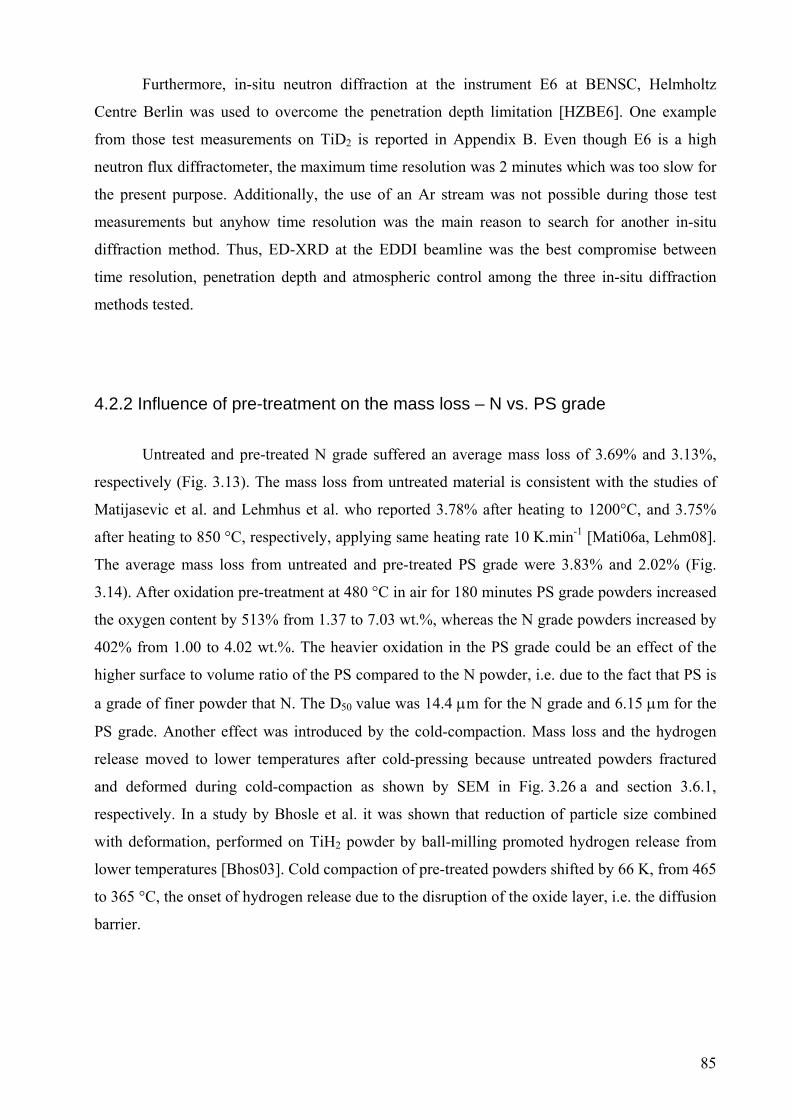
Furthermore, in-situ neutron diffraction at the instrument E6 at BENSC, Helmholtz
Centre Berlin was used to overcome the penetration depth limitation [HZBE6]. One example
from those test measurements on TiD2 is reported in Appendix B. Even though E6 is a high
neutron flux diffractometer, the maximum time resolution was 2 minutes which was too slow for
the present purpose. Additionally, the use of an Ar stream was not possible during those test
measurements but anyhow time resolution was the main reason to search for another in-situ
diffraction method. Thus, ED-XRD at the EDDI beamline was the best compromise between
time resolution, penetration depth and atmospheric control among the three in-situ diffraction
methods tested.
4.2.2 Influence of pre-treatment on the mass loss – N vs. PS grade
Untreated and pre-treated N grade suffered an average mass loss of 3.69% and 3.13%,
respectively (Fig. 3.13). The mass loss from untreated material is consistent with the studies of
Matijasevic et al. and Lehmhus et al. who reported 3.78% after heating to 1200°C, and 3.75%
after heating to 850 °C, respectively, applying same heating rate 10 K.min-1 [Mati06a, Lehm08].
The average mass loss from untreated and pre-treated PS grade were 3.83% and 2.02% (Fig.
3.14). After oxidation pre-treatment at 480 °C in air for 180 minutes PS grade powders increased
the oxygen content by 513% from 1.37 to 7.03 wt.%, whereas the N grade powders increased by
402% from 1.00 to 4.02 wt.%. The heavier oxidation in the PS grade could be an effect of the
higher surface to volume ratio of the PS compared to the N powder, i.e. due to the fact that PS is
a grade of finer powder that N. The D50 value was 14.4 μm for the N grade and 6.15 μm for the
PS grade. Another effect was introduced by the cold-compaction. Mass loss and the hydrogen
release moved to lower temperatures after cold-pressing because untreated powders fractured
and deformed during cold-compaction as shown by SEM in Fig. 3.26 a and section 3.6.1,
respectively. In a study by Bhosle et al. it was shown that reduction of particle size combined
with deformation, performed on TiH2 powder by ball-milling promoted hydrogen release from
lower temperatures [Bhos03]. Cold compaction of pre-treated powders shifted by 66 K, from 465
to 365 °C, the onset of hydrogen release due to the disruption of the oxide layer, i.e. the diffusion
barrier.
85
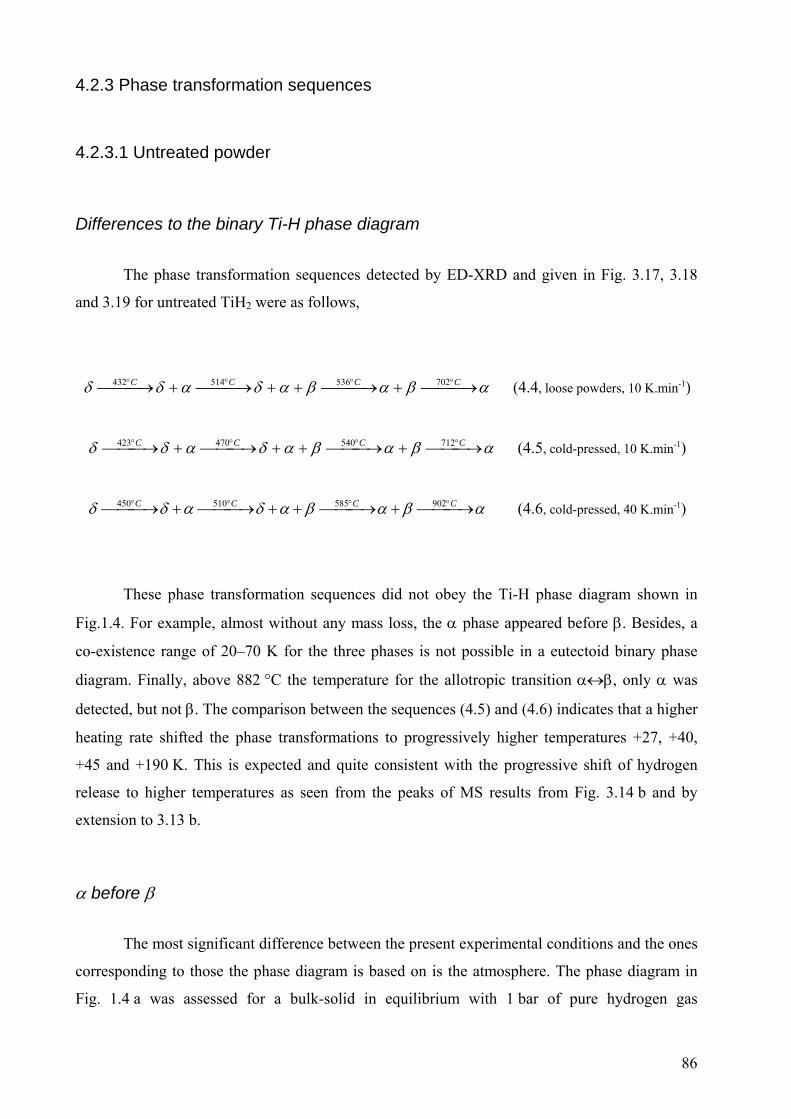
4.2.3 Phase transformation sequences
4.2.3.1 Untreated powder
Differences to the binary Ti-H phase diagram
The phase transformation sequences detected by ED-XRD and given in Fig. 3.17, 3.18
and 3.19 for untreated TiH2 were as follows,
αβαβαδαδδ ⎯⎯ →⎯+⎯⎯ →⎯++⎯⎯ →⎯+⎯⎯ →⎯ °°°° CCCC 702536514432 (4.4, loose powders, 10 K.min-1)
αβαβαδαδδ ⎯⎯ →⎯+⎯⎯ →⎯++⎯⎯ →⎯+⎯⎯ →⎯ °°°° CCCC 712540470423 (4.5, cold-pressed, 10 K.min-1)
αβαβαδαδδ ⎯⎯ →⎯+⎯⎯ →⎯++⎯⎯ →⎯+⎯⎯ →⎯ °°°° CCCC 902585510450 (4.6, cold-pressed, 40 K.min-1)
These phase transformation sequences did not obey the Ti-H phase diagram shown in
Fig.1.4. For example, almost without any mass loss, the α phase appeared before β. Besides, a
co-existence range of 20–70 K for the three phases is not possible in a eutectoid binary phase
diagram. Finally, above 882 °C the temperature for the allotropic transition α↔β, only α was
detected, but not β. The comparison between the sequences (4.5) and (4.6) indicates that a higher
heating rate shifted the phase transformations to progressively higher temperatures +27, +40,
+45 and +190 K. This is expected and quite consistent with the progressive shift of hydrogen
release to higher temperatures as seen from the peaks of MS results from Fig. 3.14 b and by
extension to 3.13 b.
α before β
The most significant difference between the present experimental conditions and the ones
corresponding to those the phase diagram is based on is the atmosphere. The phase diagram in
Fig. 1.4 a was assessed for a bulk-solid in equilibrium with 1 bar of pure hydrogen gas
86
[SanM87]. Schoenfelder and Swisher studied the kinetics of thermal decomposition of TiH2
under vacuum and He flow. They assumed a diffusion-controlled mechanism and proposed a
core-shell model for the decomposition [Scho73, Swis72]. The experimental conditions in the
TG-MS and ED-XRD experiments of this thesis were similar since the initial PH2 and PO2 in the
atmosphere were nearly zero and 5 ppm, respectively. Depending on how efficient the hydrogen
removal by the Ar flow was, the PH2 could have increased, for example inside the tablet, but
eventually was equalized to remain nearly zero. PO2 should have remained constant since it was a
constituent of the carrier gas. This means that before heating there was a steep gradient near the
surface since the CH in the solid was ~3.83 wt.% in contrasts to the surrounding atmosphere.
Later when hydrogen release started, The formation of an α-shell is favoured at the surface
because α has the lowest solubility of hydrogen at any temperature among the three phases,
which is more compatible with the boundary condition that forces PH2 to remain low.
The MS results from Fig. 3.14 show that hydrogen started to be released at ~ 200 °C and
the onsets before the first peak occurred at 350 °C for the cold-pressed sample and at 375 °C for
the loose powders. The α phase was first detected by ED-XRD at ~ 423 °C in cold-pressed
samples and 432 °C in loose powders. But there is evidence that an α layer could have nucleated
before. SEM images from Fig. 3.24 showed crystallites on the surface of partially decomposed
samples heated only up to 350°C, which is a temperature close to the early stage of hydrogen
release. TEM images from a sample partially decomposed up to 430 °C showed that the α phase
was already an outer shell of ~ 150-200 nm thick at that temperature. Additional evidence
supporting the idea that the Ar flow favours the surface nucleation of α is the experiment
described in Appendix B. There it is reported the phase transformation of TiD2 observed in-situ
by neutron diffraction during heating at 10 K.min-1 up to 897 °C in resting Ar. The sequence
observed was and α was not detected, i.e. in the absence of Ar flow
the phase transformation had a more reversible character. This reversible character is most
probably due to the build up of a hydrogen partial pressure in the atmosphere that establishes the
reverse reaction H2↔2H which stops, or at least slows down significantly the decomposition of
the deuteride. On the contrary, the phase transformation of TiD2 followed in-situ by ED-XRD
under Ar flow was very similar to the one observed for TiH2, in the sense that α was detected
before β and α was the final product of decomposition (see Appendix C). Therefore, it could be
stated that the Ar flow plays a significant role favouring the surface nucleation of an α-shell by
imposing a border condition PH2 ~0.
δβδ ⎯⎯ →⎯⎯⎯ →⎯ coolingheating
87
Co-existence of δ + α + β
Lenning et al. demonstrated by thermal analysis that the eutectoid reaction βδα ↔+
occurs at 319 °C upon heating and at 281 °C upon cooling, using heating and cooling rates of
1 K.min-1 [Lenn54]. In fact, the eutectoid temperature 300 °C of the Ti-H phase diagram is the
average of both temperatures ((319+281)/2 = 300) [Müll68]. The Ti-H binary system, indicates
that there should be no co-existence of the three phases δ, α and β. In reality, co-existence of
(δ + α + β) in a temperature range of 20 K for loose powders, and 70 K for cold-pressed powders
was observed. The arrangement of the three phases inside a particle should be compatible with
the lowest CH near to the surface and the maximum in the core, as well as with the solubility of
hydrogen in each phase at any temperature, i.e. . Therefore, this arrangement
would consist of a δ-core, an intermediate β shell and an outer α-shell. The beginning of the
three phase co-existence occurred for cold-pressed powders at 470 °C and was shifted by 54 K to
524 °C for loose powders. The difference could be attributed to the fact that untreated powders
were fractured and deformed during cold-pressing as can be seen in the SEM image in Fig 3.26.
The production of new, fresh surfaces and an increase in total surface area due to deformation
led to earlier hydrogen release compared to loose powders (according to the MS data from
Fig. 3.14 a). Thus, the CH necessary to nucleate β was reached in the particles from the compacts
before it was reached in the loose powders.
δβαHHH SSS <<
The question then arises why the (δ + α + β) co-existence persists for 70 K in the
compacts and for 28 K in the untreated loose powders (see Fig. 3.17). The reason is that there is
a gradient inside the particle and an additional gradient of in the surrounding atmosphere. A
particle inside the volume of the sample, cold-pressed or loose powders, will be exposed to a
higher and for longer time than a particle at the surface. The escape of hydrogen from a
loose powder sample is easier since removal by Ar flow is more efficient, resulting in the shorter
co-existence range. The next question is whether the 20 K of co-existence detected for loose
powders is reflect of a CH gradient inside the particle or is merely an artefact from the
atmosphere. It is possible to clarify the point by following the phase transformation in the
top-layer of particles where the hydrogen removal is most efficient. The experiment was
performed on a cold-pressed sample in the reflection-mode under Ar flow and is reported in
Appendix D. There, three phases δ, α and β co-existed in a narrower range between 465 °C and
2HP
2HP
88
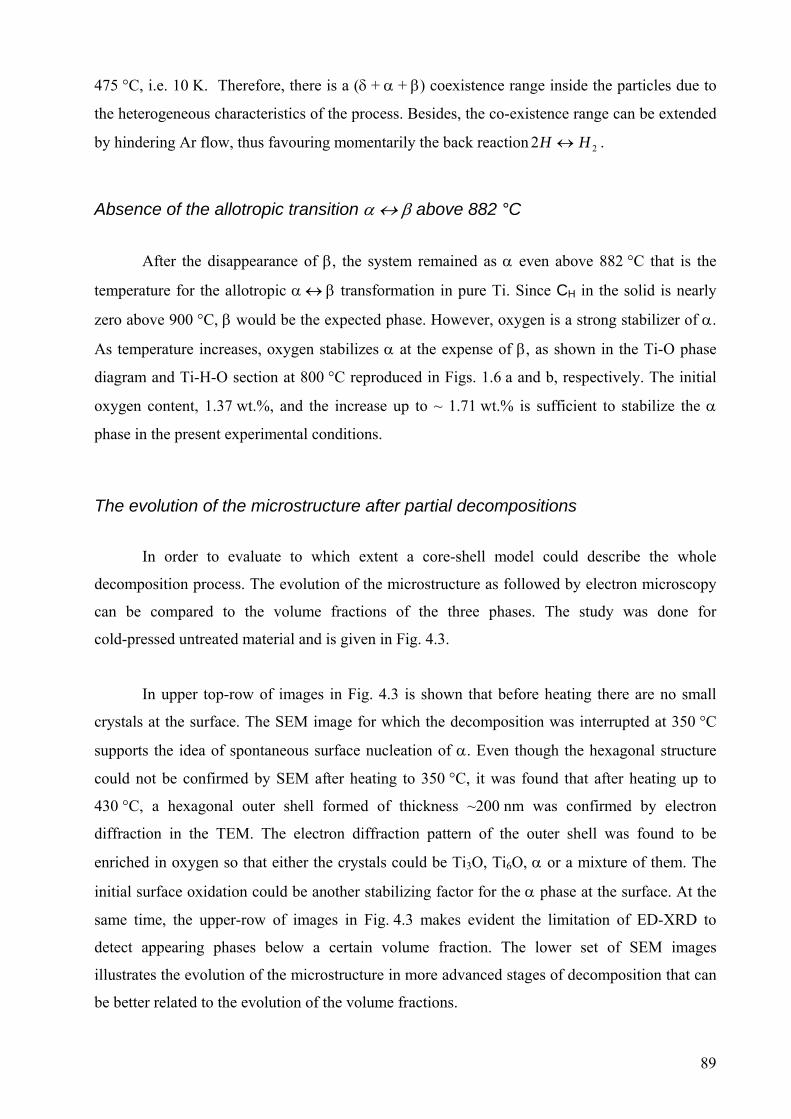
475 °C, i.e. 10 K. Therefore, there is a (δ + α + β) coexistence range inside the particles due to
the heterogeneous characteristics of the process. Besides, the co-existence range can be extended
by hindering Ar flow, thus favouring momentarily the back reaction 22 HH ↔ .
Absence of the allotropic transition α ↔ β above 882 °C
After the disappearance of β, the system remained as α even above 882 °C that is the
temperature for the allotropic α ↔ β transformation in pure Ti. Since CH in the solid is nearly
zero above 900 °C, β would be the expected phase. However, oxygen is a strong stabilizer of α.
As temperature increases, oxygen stabilizes α at the expense of β, as shown in the Ti-O phase
diagram and Ti-H-O section at 800 °C reproduced in Figs. 1.6 a and b, respectively. The initial
oxygen content, 1.37 wt.%, and the increase up to ~ 1.71 wt.% is sufficient to stabilize the α
phase in the present experimental conditions.
The evolution of the microstructure after partial decompositions
In order to evaluate to which extent a core-shell model could describe the whole
decomposition process. The evolution of the microstructure as followed by electron microscopy
can be compared to the volume fractions of the three phases. The study was done for
cold-pressed untreated material and is given in Fig. 4.3.
In upper top-row of images in Fig. 4.3 is shown that before heating there are no small
crystals at the surface. The SEM image for which the decomposition was interrupted at 350 °C
supports the idea of spontaneous surface nucleation of α. Even though the hexagonal structure
could not be confirmed by SEM after heating to 350 °C, it was found that after heating up to
430 °C, a hexagonal outer shell formed of thickness ~200 nm was confirmed by electron
diffraction in the TEM. The electron diffraction pattern of the outer shell was found to be
enriched in oxygen so that either the crystals could be Ti3O, Ti6O, α or a mixture of them. The
initial surface oxidation could be another stabilizing factor for the α phase at the surface. At the
same time, the upper-row of images in Fig. 4.3 makes evident the limitation of ED-XRD to
detect appearing phases below a certain volume fraction. The lower set of SEM images
illustrates the evolution of the microstructure in more advanced stages of decomposition that can
be better related to the evolution of the volume fractions.
89
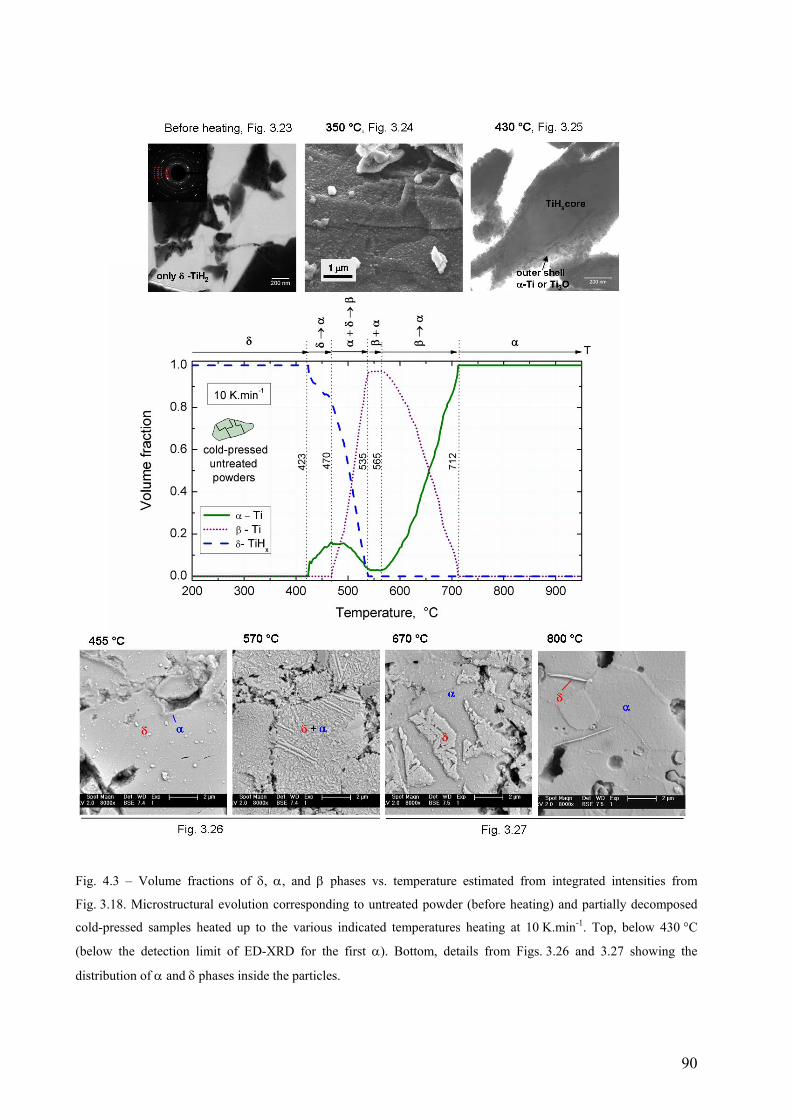
Fig. 4.3 – Volume fractions of δ, α, and β phases vs. temperature estimated from integrated intensities from
Fig. 3.18. Microstructural evolution corresponding to untreated powder (before heating) and partially decomposed
cold-pressed samples heated up to the various indicated temperatures heating at 10 K.min-1. Top, below 430 °C
(below the detection limit of ED-XRD for the first α). Bottom, details from Figs. 3.26 and 3.27 showing the
distribution of α and δ phases inside the particles.
90
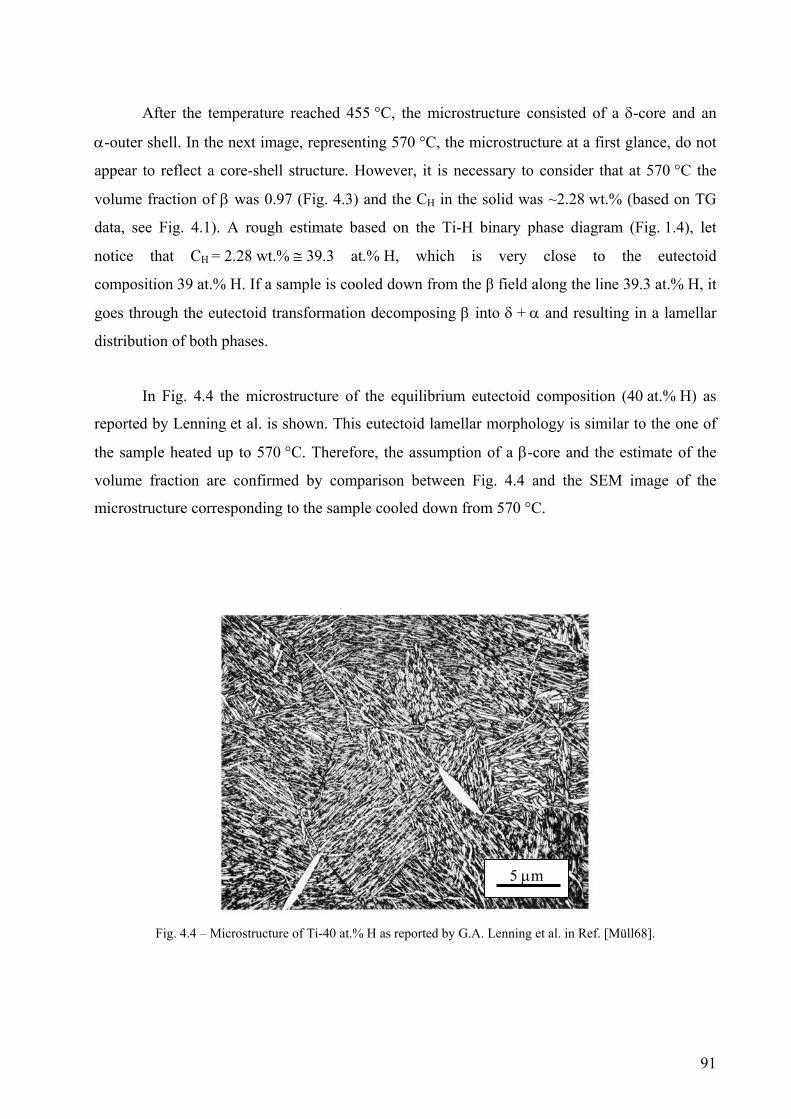
After the temperature reached 455 °C, the microstructure consisted of a δ-core and an
α-outer shell. In the next image, representing 570 °C, the microstructure at a first glance, do not
appear to reflect a core-shell structure. However, it is necessary to consider that at 570 °C the
volume fraction of β was 0.97 (Fig. 4.3) and the CH in the solid was ~2.28 wt.% (based on TG
data, see Fig. 4.1). A rough estimate based on the Ti-H binary phase diagram (Fig. 1.4), let
notice that CH = 2.28 wt.% ≅ 39.3 at.% H, which is very close to the eutectoid
composition 39 at.% H. If a sample is cooled down from the β field along the line 39.3 at.% H, it
goes through the eutectoid transformation decomposing β into δ + α and resulting in a lamellar
distribution of both phases.
In Fig. 4.4 the microstructure of the equilibrium eutectoid composition (40 at.% H) as
reported by Lenning et al. is shown. This eutectoid lamellar morphology is similar to the one of
the sample heated up to 570 °C. Therefore, the assumption of a β-core and the estimate of the
volume fraction are confirmed by comparison between Fig. 4.4 and the SEM image of the
microstructure corresponding to the sample cooled down from 570 °C.
5 μm
Fig. 4.4 – Microstructure of Ti-40 at.% H as reported by G.A. Lenning et al. in Ref. [Müll68].
91
At 670 °C, the volume fraction of α was 0.62 and β was 0.37. Since α is always on the
outside of the particles, it should embed β, just as it appears in the micrograph in Fig. 4.3. At
800 °C, α was the only phase detected by ED-XRD. The δ-needles (or platelets) observed in the
microstructure are most likely the result of the hydride precipitation during cooling. Before
cooling from 800 °C, the CH in the solid was 0.18 wt.%, corresponding to 0.04 at.% since α-Ti
has nearly zero solubility for hydrogen at ambient temperature. Hitherto, the evolution of the
microstructure of cold-pressed samples validates the use of a core-shell model to describe the
whole decomposition process.
One can follow the evolution of the three phases inside a particle more easily using radial
compositional diagrams. Using the volume fractions, these diagrams were directly calculated for
one idealized spherical particle of the loose powder or cold-pressed sample (Fig. 4.5). A particle
of 6 μm diameter is assumed (D50 for PS grade from Table 3.1). In both cases, the outer layer of
α initially grows at the expense of δ. When β precipitates, it grows at the expense of both, the δ-
core and the outer α-shell. As the temperature increases, α recovers and grows at the expense of
the β-core.
The results discussed so far indicate that the hydrogen out-diffusion from untreated TiH2
should be controlled by the outer α-shell, since the diffusion coefficient of hydrogen in α is
lower than in β (Fig 1.3), and α is present during the whole decomposition process. The
evolution in temperature of the core-shell model determined experimentally supports the idea of
an α-barrier as proposed by other groups of authors [Taka95, Mati06a, Mala09]. With increasing
temperatures, the out-diffusion of hydrogen through α should be affected by the thickness of the
α-shell as well as by the solubility of hydrogen in α, which varies in temperature, and hydrogen
concentration gradient defined by the CH in the core together with the PH2 in the surrounding
atmosphere.
92
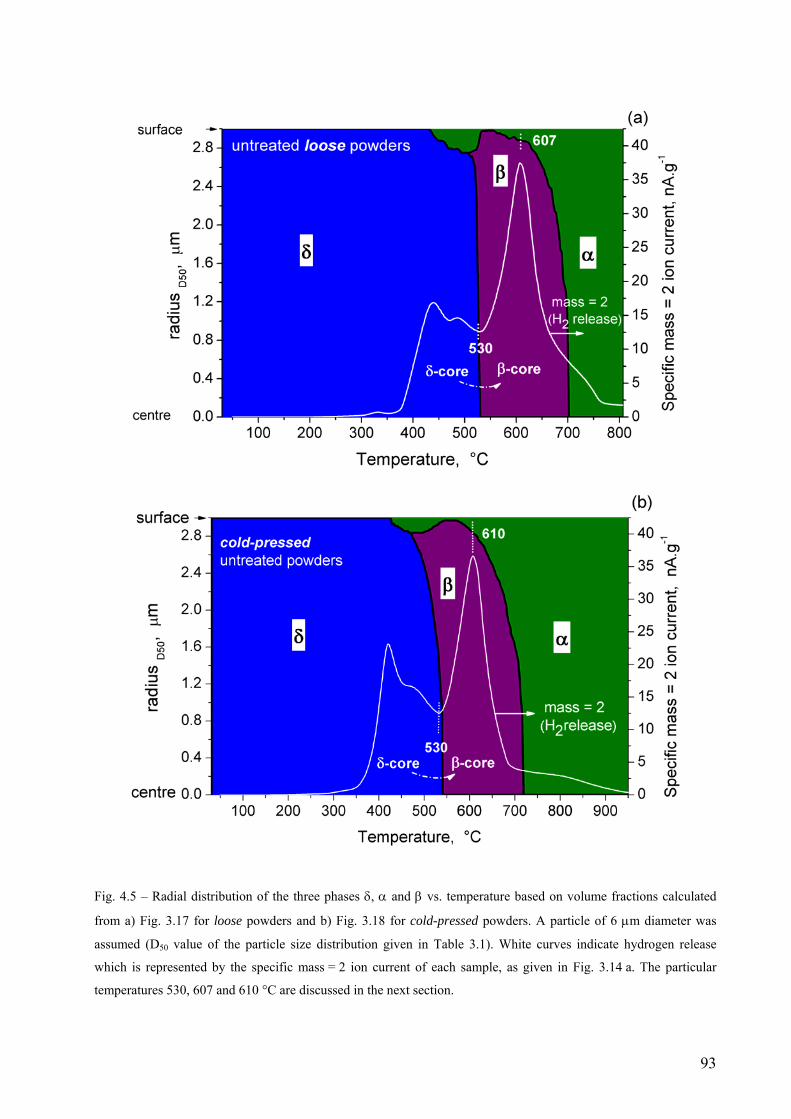
Fig. 4.5 – Radial distribution of the three phases δ, α and β vs. temperature based on volume fractions calculated
from a) Fig. 3.17 for loose powders and b) Fig. 3.18 for cold-pressed powders. A particle of 6 μm diameter was
assumed (D50 value of the particle size distribution given in Table 3.1). White curves indicate hydrogen release
which is represented by the specific mass = 2 ion current of each sample, as given in Fig. 3.14 a. The particular
temperatures 530, 607 and 610 °C are discussed in the next section.
93
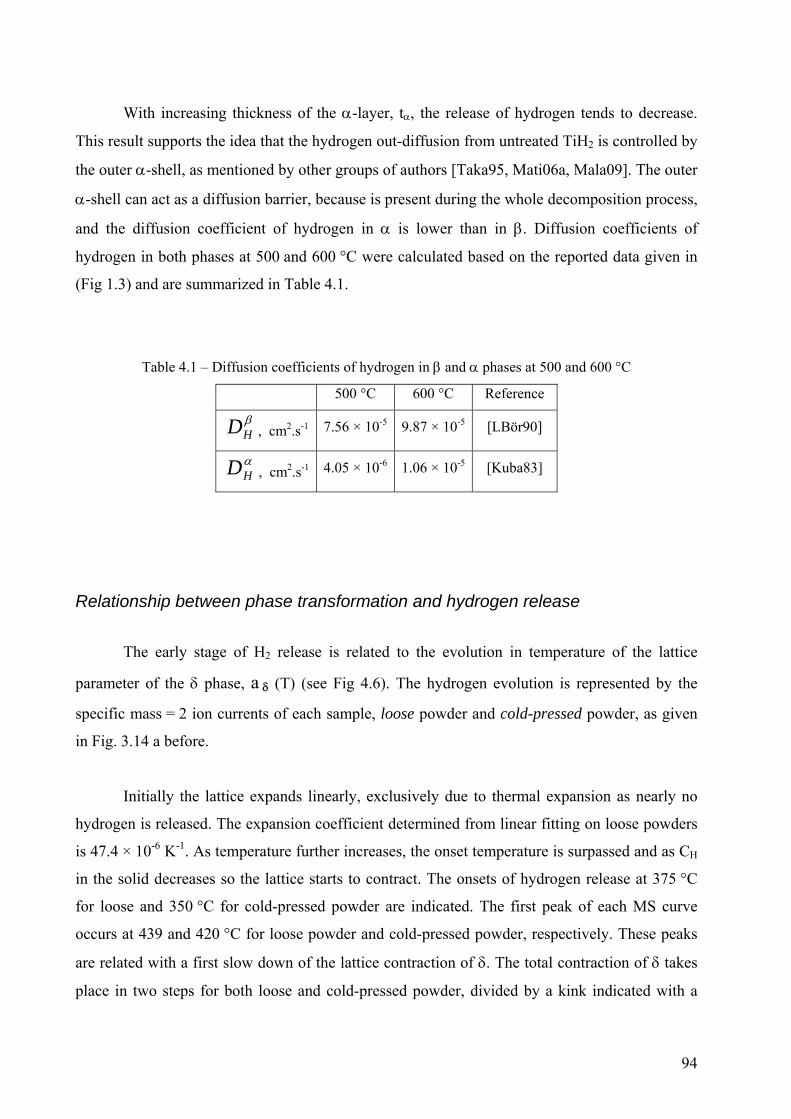
With increasing thickness of the α-layer, tα, the release of hydrogen tends to decrease.
This result supports the idea that the hydrogen out-diffusion from untreated TiH2 is controlled by
the outer α-shell, as mentioned by other groups of authors [Taka95, Mati06a, Mala09]. The outer
α-shell can act as a diffusion barrier, because is present during the whole decomposition process,
and the diffusion coefficient of hydrogen in α is lower than in β. Diffusion coefficients of
hydrogen in both phases at 500 and 600 °C were calculated based on the reported data given in
(Fig 1.3) and are summarized in Table 4.1.
Table 4.1 – Diffusion coefficients of hydrogen in β and α phases at 500 and 600 °C
500 °C 600 °C Reference
βHD , cm2.s-1 7.56 × 10⁻⁵ 9.87 × 10⁻⁵ [LBör90]
αHD , cm2.s-1 4.05 × 10⁻⁶ 1.06 × 10⁻⁵ [Kuba83]
Relationship between phase transformation and hydrogen release
The early stage of H2 release is related to the evolution in temperature of the lattice
parameter of the δ phase, a δ (T) (see Fig 4.6). The hydrogen evolution is represented by the
specific mass = 2 ion currents of each sample, loose powder and cold-pressed powder, as given
in Fig. 3.14 a before.
Initially the lattice expands linearly, exclusively due to thermal expansion as nearly no
hydrogen is released. The expansion coefficient determined from linear fitting on loose powders
is 47.4 × 10⁻⁶ K-1. As temperature further increases, the onset temperature is surpassed and as CH
in the solid decreases so the lattice starts to contract. The onsets of hydrogen release at 375 °C
for loose and 350 °C for cold-pressed powder are indicated. The first peak of each MS curve
occurs at 439 and 420 °C for loose powder and cold-pressed powder, respectively. These peaks
are related with a first slow down of the lattice contraction of δ. The total contraction of δ takes
place in two steps for both loose and cold-pressed powder, divided by a kink indicated with a
94
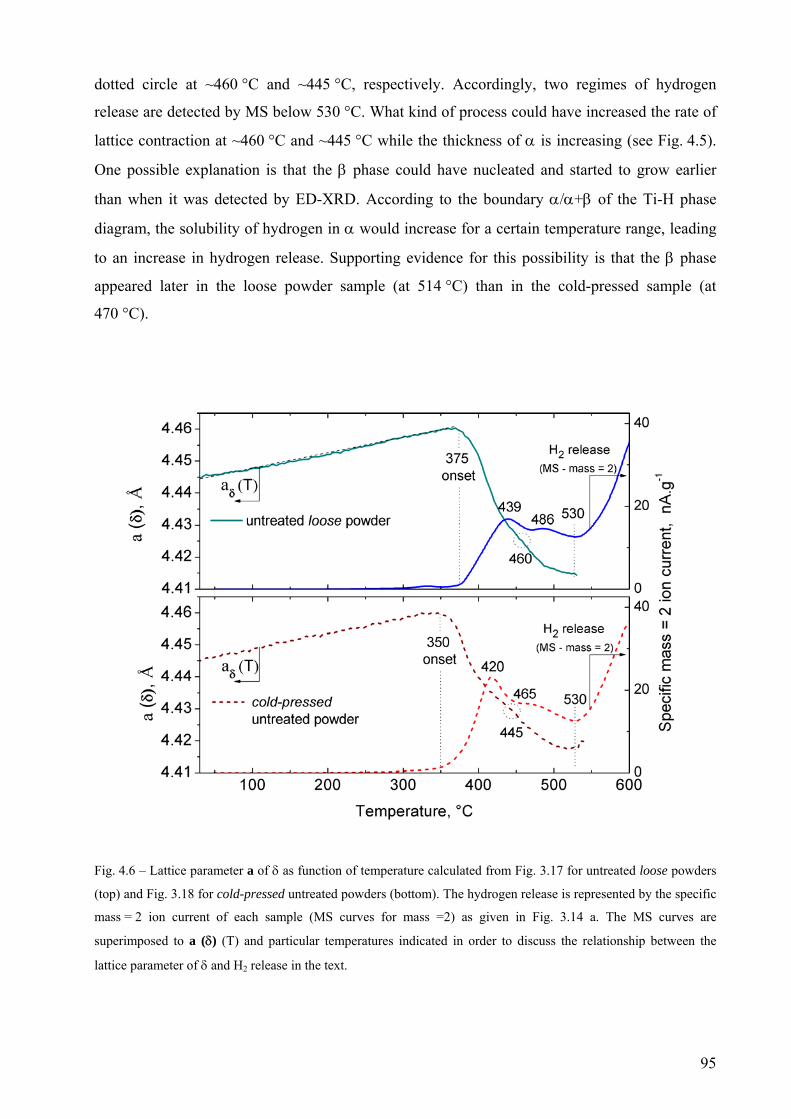
dotted circle at ~460 °C and ~445 °C, respectively. Accordingly, two regimes of hydrogen
release are detected by MS below 530 °C. What kind of process could have increased the rate of
lattice contraction at ~460 °C and ~445 °C while the thickness of α is increasing (see Fig. 4.5).
One possible explanation is that the β phase could have nucleated and started to grow earlier
than when it was detected by ED-XRD. According to the boundary α/α+β of the Ti-H phase
diagram, the solubility of hydrogen in α would increase for a certain temperature range, leading
to an increase in hydrogen release. Supporting evidence for this possibility is that the β phase
appeared later in the loose powder sample (at 514 °C) than in the cold-pressed sample (at
470 °C).
Fig. 4.6 – Lattice parameter a of δ as function of temperature calculated from Fig. 3.17 for untreated loose powders
(top) and Fig. 3.18 for cold-pressed untreated powders (bottom). The hydrogen release is represented by the specific
mass = 2 ion current of each sample (MS curves for mass =2) as given in Fig. 3.14 a. The MS curves are
superimposed to a (δ) (T) and particular temperatures indicated in order to discuss the relationship between the
lattice parameter of δ and H2 release in the text.
95
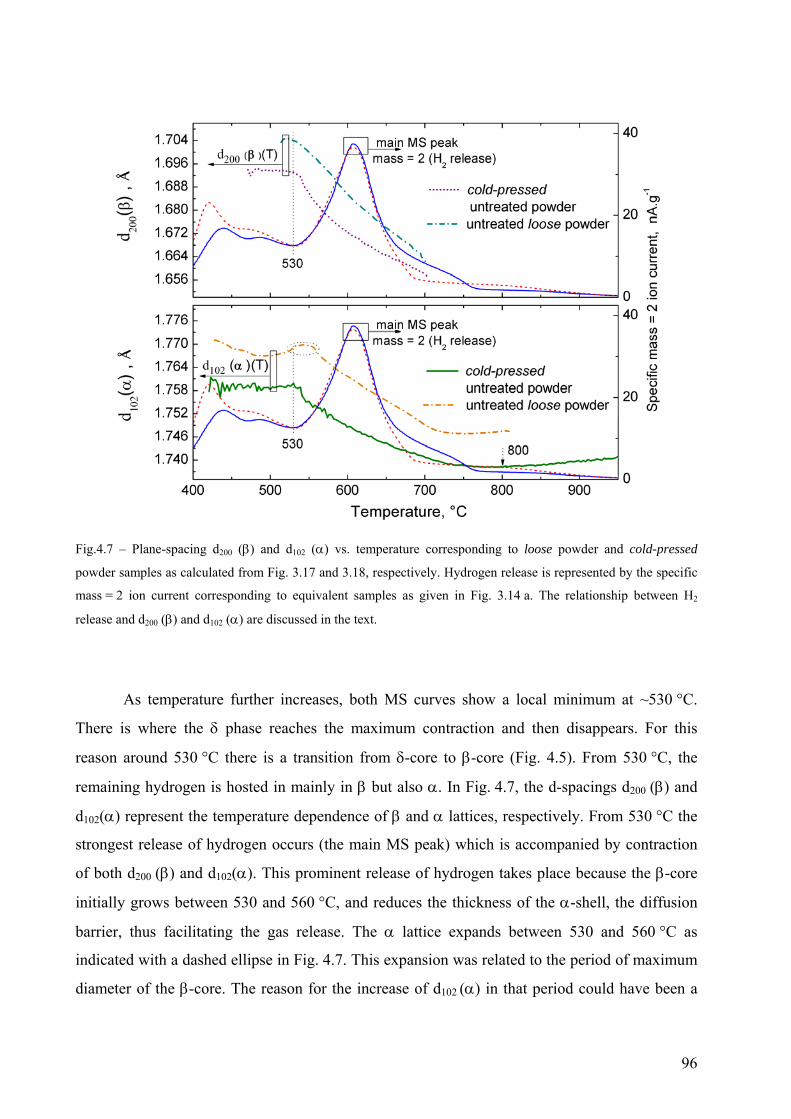
Fig.4.7 – Plane-spacing d200 (β) and d102 (α) vs. temperature corresponding to loose powder and cold-pressed
powder samples as calculated from Fig. 3.17 and 3.18, respectively. Hydrogen release is represented by the specific
mass = 2 ion current corresponding to equivalent samples as given in Fig. 3.14 a. The relationship between H2
release and d200 (β) and d102 (α) are discussed in the text.
As temperature further increases, both MS curves show a local minimum at ~530 °C.
There is where the δ phase reaches the maximum contraction and then disappears. For this
reason around 530 °C there is a transition from δ-core to β-core (Fig. 4.5). From 530 °C, the
remaining hydrogen is hosted in mainly in β but also α. In Fig. 4.7, the d-spacings d200 (β) and
d102(α) represent the temperature dependence of β and α lattices, respectively. From 530 °C the
strongest release of hydrogen occurs (the main MS peak) which is accompanied by contraction
of both d200 (β) and d102(α). This prominent release of hydrogen takes place because the β-core
initially grows between 530 and 560 °C, and reduces the thickness of the α-shell, the diffusion
barrier, thus facilitating the gas release. The α lattice expands between 530 and 560 °C as
indicated with a dashed ellipse in Fig. 4.7. This expansion was related to the period of maximum
diameter of the β-core. The reason for the increase of d102 (α) in that period could have been a
96
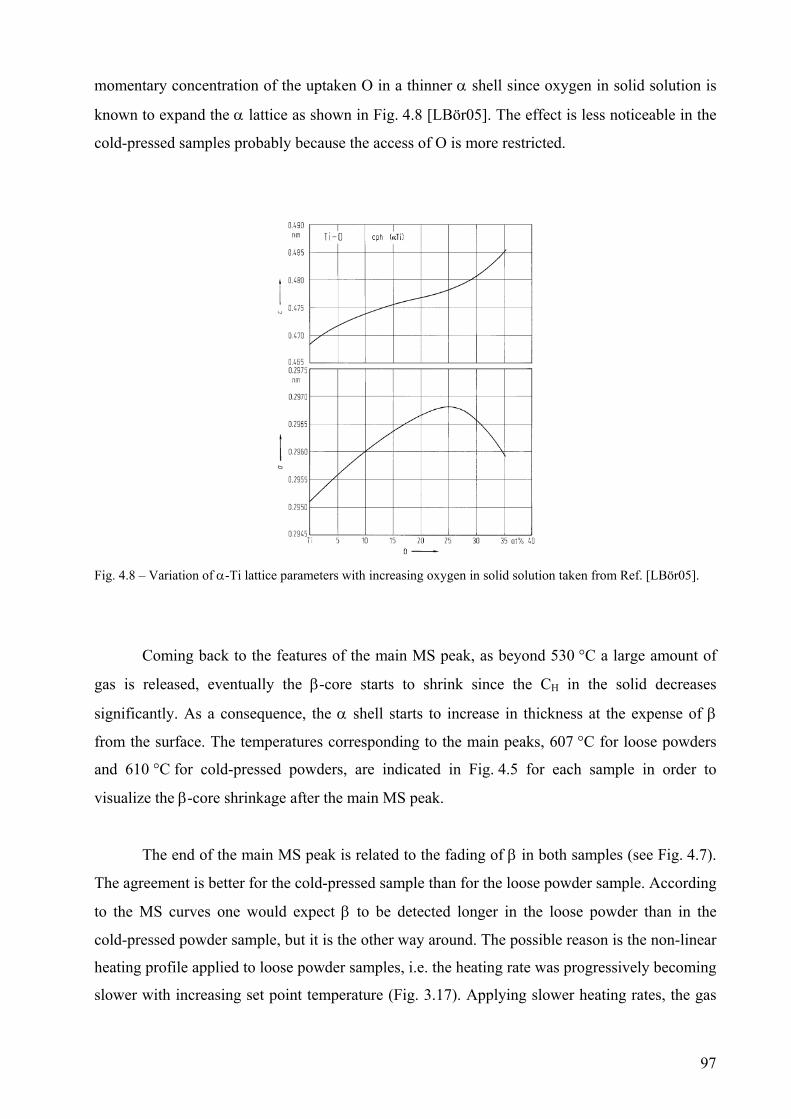
momentary concentration of the uptaken O in a thinner α shell since oxygen in solid solution is
known to expand the α lattice as shown in Fig. 4.8 [LBör05]. The effect is less noticeable in the
cold-pressed samples probably because the access of O is more restricted.
Fig. 4.8 – Variation of α-Ti lattice parameters with increasing oxygen in solid solution taken from Ref. [LBör05].
Coming back to the features of the main MS peak, as beyond 530 °C a large amount of
gas is released, eventually the β-core starts to shrink since the CH in the solid decreases
significantly. As a consequence, the α shell starts to increase in thickness at the expense of β
from the surface. The temperatures corresponding to the main peaks, 607 °C for loose powders
and 610 °C for cold-pressed powders, are indicated in Fig. 4.5 for each sample in order to
visualize the β-core shrinkage after the main MS peak.
The end of the main MS peak is related to the fading of β in both samples (see Fig. 4.7).
The agreement is better for the cold-pressed sample than for the loose powder sample. According
to the MS curves one would expect β to be detected longer in the loose powder than in the
cold-pressed powder sample, but it is the other way around. The possible reason is the non-linear
heating profile applied to loose powder samples, i.e. the heating rate was progressively becoming
slower with increasing set point temperature (Fig. 3.17). Applying slower heating rates, the gas
97
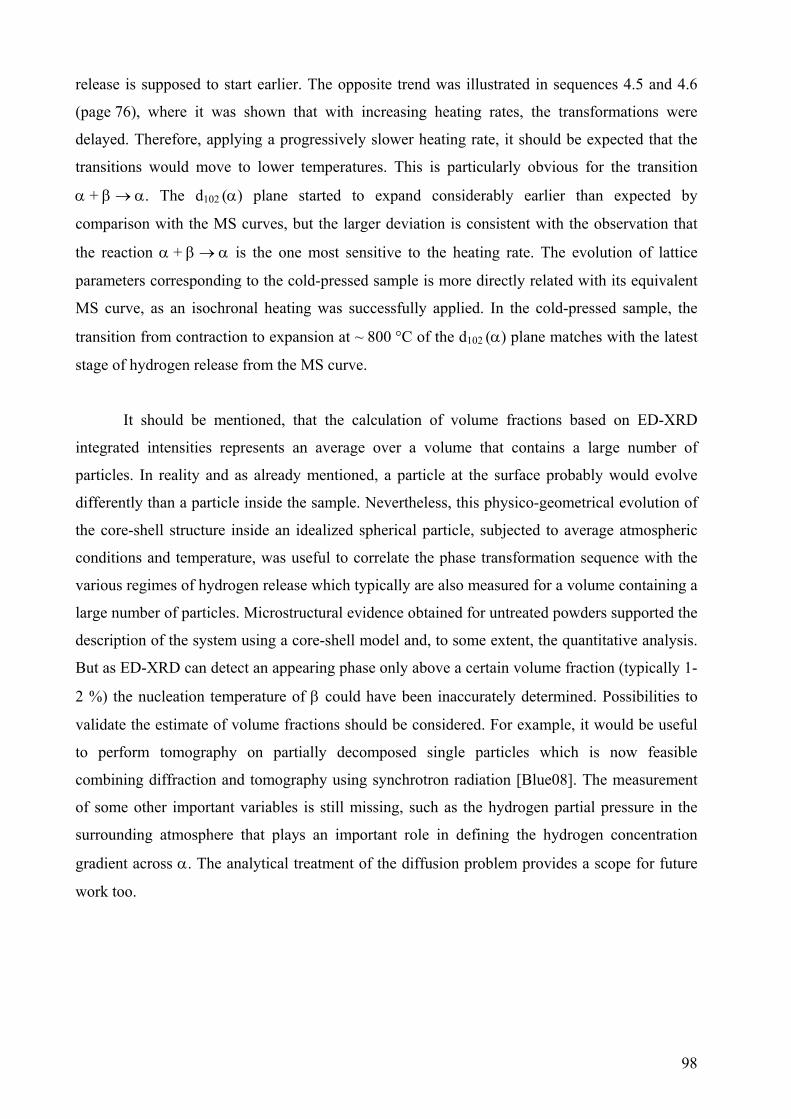
release is supposed to start earlier. The opposite trend was illustrated in sequences 4.5 and 4.6
(page 76), where it was shown that with increasing heating rates, the transformations were
delayed. Therefore, applying a progressively slower heating rate, it should be expected that the
transitions would move to lower temperatures. This is particularly obvious for the transition
α + β → α. The d102 (α) plane started to expand considerably earlier than expected by
comparison with the MS curves, but the larger deviation is consistent with the observation that
the reaction α + β → α is the one most sensitive to the heating rate. The evolution of lattice
parameters corresponding to the cold-pressed sample is more directly related with its equivalent
MS curve, as an isochronal heating was successfully applied. In the cold-pressed sample, the
transition from contraction to expansion at ~ 800 °C of the d102 (α) plane matches with the latest
stage of hydrogen release from the MS curve.
It should be mentioned, that the calculation of volume fractions based on ED-XRD
integrated intensities represents an average over a volume that contains a large number of
particles. In reality and as already mentioned, a particle at the surface probably would evolve
differently than a particle inside the sample. Nevertheless, this physico-geometrical evolution of
the core-shell structure inside an idealized spherical particle, subjected to average atmospheric
conditions and temperature, was useful to correlate the phase transformation sequence with the
various regimes of hydrogen release which typically are also measured for a volume containing a
large number of particles. Microstructural evidence obtained for untreated powders supported the
description of the system using a core-shell model and, to some extent, the quantitative analysis.
But as ED-XRD can detect an appearing phase only above a certain volume fraction (typically 1-
2 %) the nucleation temperature of β could have been inaccurately determined. Possibilities to
validate the estimate of volume fractions should be considered. For example, it would be useful
to perform tomography on partially decomposed single particles which is now feasible
combining diffraction and tomography using synchrotron radiation [Blue08]. The measurement
of some other important variables is still missing, such as the hydrogen partial pressure in the
surrounding atmosphere that plays an important role in defining the hydrogen concentration
gradient across α. The analytical treatment of the diffusion problem provides a scope for future
work too.
98
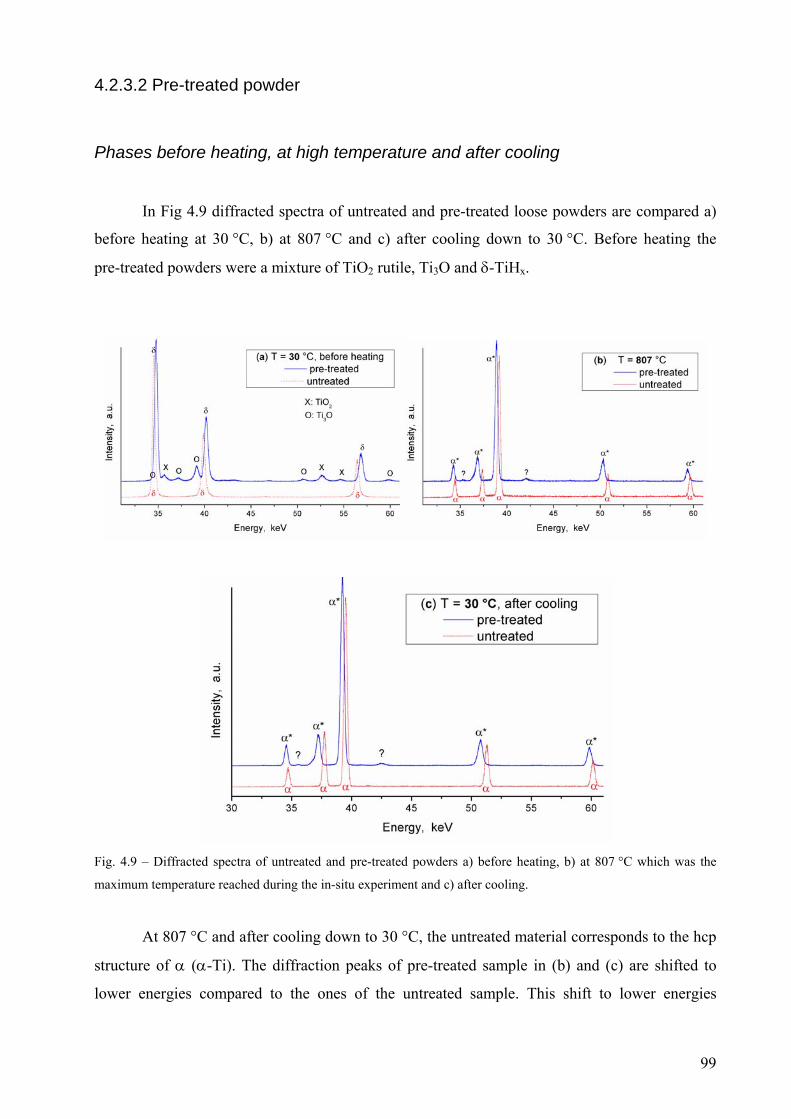
4.2.3.2 Pre-treated powder
Phases before heating, at high temperature and after cooling
In Fig 4.9 diffracted spectra of untreated and pre-treated loose powders are compared a)
before heating at 30 °C, b) at 807 °C and c) after cooling down to 30 °C. Before heating the
pre-treated powders were a mixture of TiO2 rutile, Ti3O and δ-TiHx.
Fig. 4.9 – Diffracted spectra of untreated and pre-treated powders a) before heating, b) at 807 °C which was the
maximum temperature reached during the in-situ experiment and c) after cooling.
At 807 °C and after cooling down to 30 °C, the untreated material corresponds to the hcp
structure of α (α-Ti). The diffraction peaks of pre-treated sample in (b) and (c) are shifted to
lower energies compared to the ones of the untreated sample. This shift to lower energies
99
indicates larger distance between Ti atoms. This expansion of the Ti lattice is attributed to the
larger oxygen content, 7 wt.% in the pre-treated sample, compared to 1.77 wt.% in the untreated
powders. It was shown in Fig. 4.8 that lattice parameters of α increase with increasing oxygen in
solid solution. Additionally, two small peaks marked with (?) were observed at 807 °C and after
cooling. These two peaks could not be attributed to any phase. Apparently they do not
correspond to TiO2 rutile since the reflections at 52.6 and 54.8 keV in (a) are no longer present in
(b) and (c). The unknown peaks cannot correspond to Ti3O either because this oxide is not stable
above 500 °C [LBör05, KubG83].
The main diffracting phase from pre-treated powder at 807 °C and after cooling is also
hexagonal but labelled with α*. The symbol * is used to denote that this phase contains a larger
amount of oxygen than the untreated powders and therefore, larger lattice parameters. After
cooling the α* peaks are also compatible with the main peaks of Ti3O. It is difficult to
distinguish between both structures because the Ti atoms in Ti3O are arranged as an hcp
sub-lattice close to the one of α*. In Ti3O the O atoms are periodically ordered producing
additional reflections of very small relative intensity, whereas in α* the O atoms are randomly
distributed in solid solution (they do not produce additional diffraction peaks) and enlarge the
lattice parameters of pure α-Ti in such way that the α* peaks approach the main peaks of Ti3O.
Crystallographic data as obtained from the ICDD database of both pure α-Ti and Ti3O are given
in Appendix E. Hence, the spectrum of pre-treated powders after cooling could be a solid
solution of oxygen in α, Ti3O or a mixture of both but for the sake of simplicity the phase is
considered one labelled with α* in the whole temperature range.
Evolution of Ti3O and TiO2 oxides during decomposition
A core-shell structure was already formed after oxidation pre-treatment. Then the solid
became a three component system, i.e. Ti-H-O. As the oxides were thermally grown in air, TiO2
rutile, is assumed to form the outer shell. The Ti-rich oxide, Ti3O, form an intermediate shell
between rutile and the δ-core. The pre-treatment applied to untreated TiH2 powder (oxidation at
480 °C for 180 minutes in air described in section 2.1.2) was optimized by Matijasevic et al. who
determined by TEM the core-shell arrangement adopted in this work [Matl06].
100
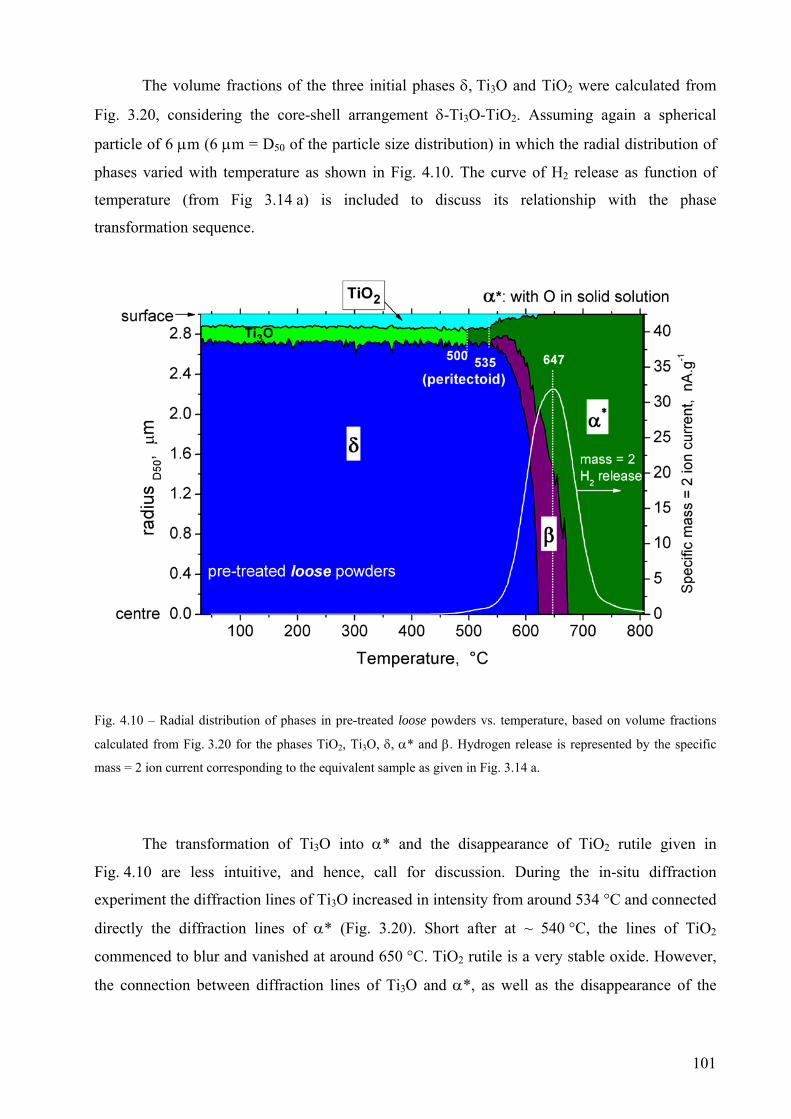
The volume fractions of the three initial phases δ, Ti3O and TiO2 were calculated from
Fig. 3.20, considering the core-shell arrangement δ-Ti3O-TiO2. Assuming again a spherical
particle of 6 μm (6 μm = D50 of the particle size distribution) in which the radial distribution of
phases varied with temperature as shown in Fig. 4.10. The curve of H2 release as function of
temperature (from Fig 3.14 a) is included to discuss its relationship with the phase
transformation sequence.
Fig. 4.10 – Radial distribution of phases in pre-treated loose powders vs. temperature, based on volume fractions
calculated from Fig. 3.20 for the phases TiO2, Ti3O, δ, α* and β. Hydrogen release is represented by the specific
mass = 2 ion current corresponding to the equivalent sample as given in Fig. 3.14 a.
The transformation of Ti3O into α* and the disappearance of TiO2 rutile given in
Fig. 4.10 are less intuitive, and hence, call for discussion. During the in-situ diffraction
experiment the diffraction lines of Ti3O increased in intensity from around 534 °C and connected
directly the diffraction lines of α* (Fig. 3.20). Short after at ~ 540 °C, the lines of TiO2
commenced to blur and vanished at around 650 °C. TiO2 rutile is a very stable oxide. However,
the connection between diffraction lines of Ti3O and α*, as well as the disappearance of the
101
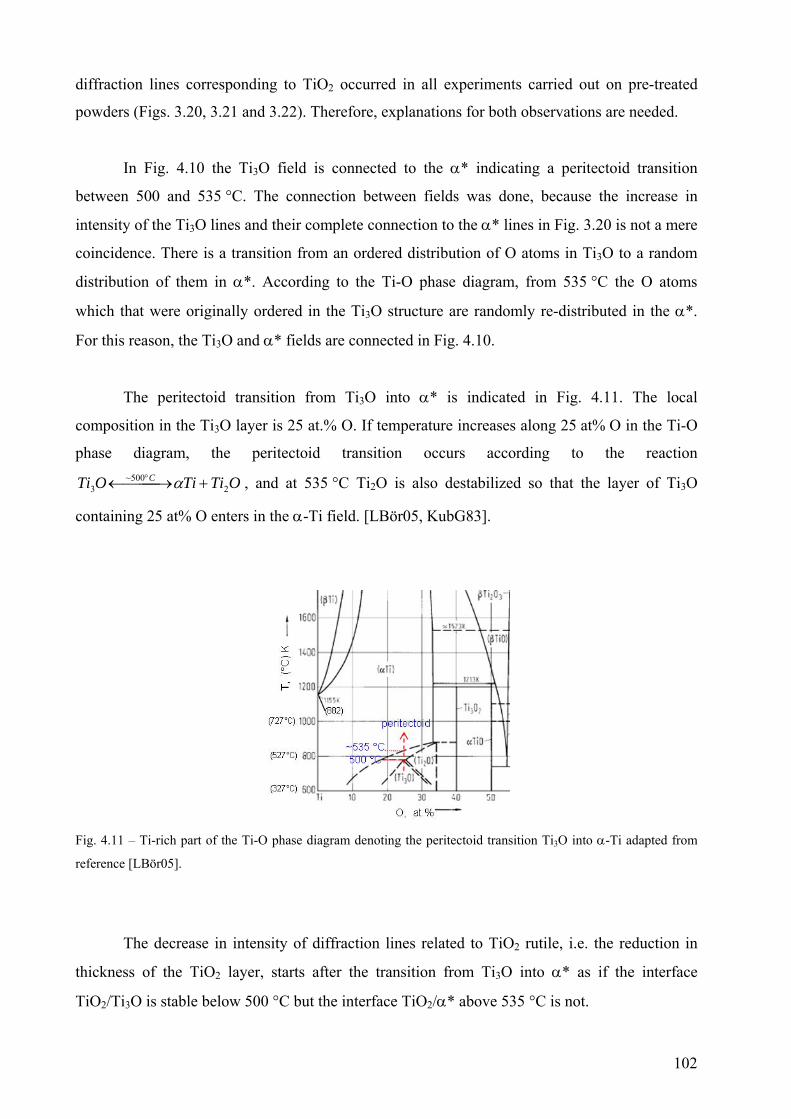
diffraction lines corresponding to TiO2 occurred in all experiments carried out on pre-treated
powders (Figs. 3.20, 3.21 and 3.22). Therefore, explanations for both observations are needed.
In Fig. 4.10 the Ti3O field is connected to the α* indicating a peritectoid transition
between 500 and 535 °C. The connection between fields was done, because the increase in
intensity of the Ti3O lines and their complete connection to the α* lines in Fig. 3.20 is not a mere
coincidence. There is a transition from an ordered distribution of O atoms in Ti3O to a random
distribution of them in α*. According to the Ti-O phase diagram, from 535 °C the O atoms
which that were originally ordered in the Ti3O structure are randomly re-distributed in the α*.
For this reason, the Ti3O and α* fields are connected in Fig. 4.10.
The peritectoid transition from Ti3O into α* is indicated in Fig. 4.11. The local
composition in the Ti3O layer is 25 at.% O. If temperature increases along 25 at% O in the Ti-O
phase diagram, the peritectoid transition occurs according to the reaction
, and at 535 °C Ti2O is also destabilized so that the layer of Ti3O
containing 25 at% O enters in the α-Ti field. [LBör05, KubG83].
OTiTiOTi C2
500~3 +⎯⎯⎯ →← ° α
Fig. 4.11 – Ti-rich part of the Ti-O phase diagram denoting the peritectoid transition Ti3O into α-Ti adapted from
reference [LBör05].
The decrease in intensity of diffraction lines related to TiO2 rutile, i.e. the reduction in
thickness of the TiO2 layer, starts after the transition from Ti3O into α* as if the interface
TiO2/Ti3O is stable below 500 °C but the interface TiO2/α* above 535 °C is not.
102
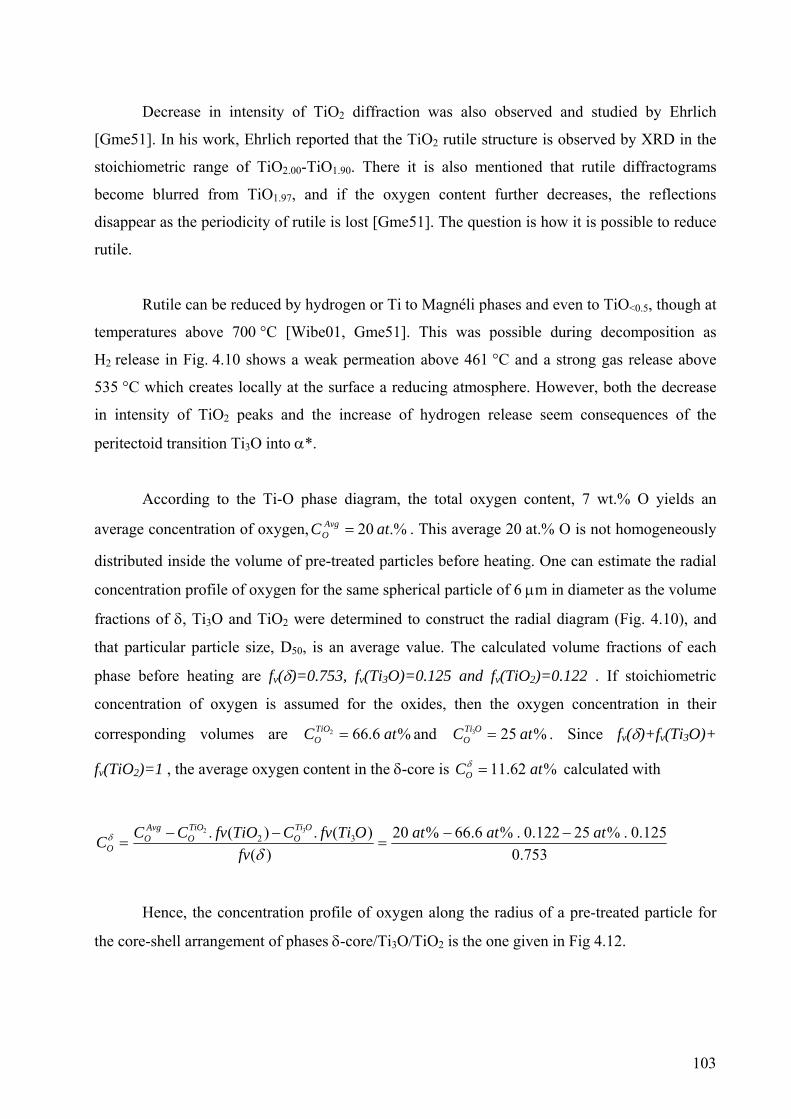
Decrease in intensity of TiO2 diffraction was also observed and studied by Ehrlich
[Gme51]. In his work, Ehrlich reported that the TiO2 rutile structure is observed by XRD in the
stoichiometric range of TiO2.00-TiO1.90. There it is also mentioned that rutile diffractograms
become blurred from TiO1.97, and if the oxygen content further decreases, the reflections
disappear as the periodicity of rutile is lost [Gme51]. The question is how it is possible to reduce
rutile.
Rutile can be reduced by hydrogen or Ti to Magnéli phases and even to TiO<0.5, though at
temperatures above 700 °C [Wibe01, Gme51]. This was possible during decomposition as
H2 release in Fig. 4.10 shows a weak permeation above 461 °C and a strong gas release above
535 °C which creates locally at the surface a reducing atmosphere. However, both the decrease
in intensity of TiO2 peaks and the increase of hydrogen release seem consequences of the
peritectoid transition Ti3O into α*.
According to the Ti-O phase diagram, the total oxygen content, 7 wt.% O yields an
average concentration of oxygen, . This average 20 at.% O is not homogeneously
distributed inside the volume of pre-treated particles before heating. One can estimate the radial
concentration profile of oxygen for the same spherical particle of 6 μm in diameter as the volume
fractions of δ, Ti3O and TiO2 were determined to construct the radial diagram (Fig. 4.10), and
that particular particle size, D50, is an average value. The calculated volume fractions of each
phase before heating are fv(δ)=0.753, fv(Ti3O)=0.125 and fv(TiO2)=0.122 . If stoichiometric
concentration of oxygen is assumed for the oxides, then the oxygen concentration in their
corresponding volumes are and . Since fv(δ)+fv(Ti3O)+
fv(TiO2)=1 , the average oxygen content in the δ-core is calculated with
.%20 atC AvgO =
%6.662 atCTiOO = %253 atC OTi
O =
%62.11 atCO =δ
753.0125.0.%25122.0.%6.66%20
)()(.)(. 32
32 atatatfv
OTifvCTiOfvCCCOTi
OTiOO
AvgO
O−−
=−−
=δ
δ
Hence, the concentration profile of oxygen along the radius of a pre-treated particle for
the core-shell arrangement of phases δ-core/Ti3O/TiO2 is the one given in Fig 4.12.
103
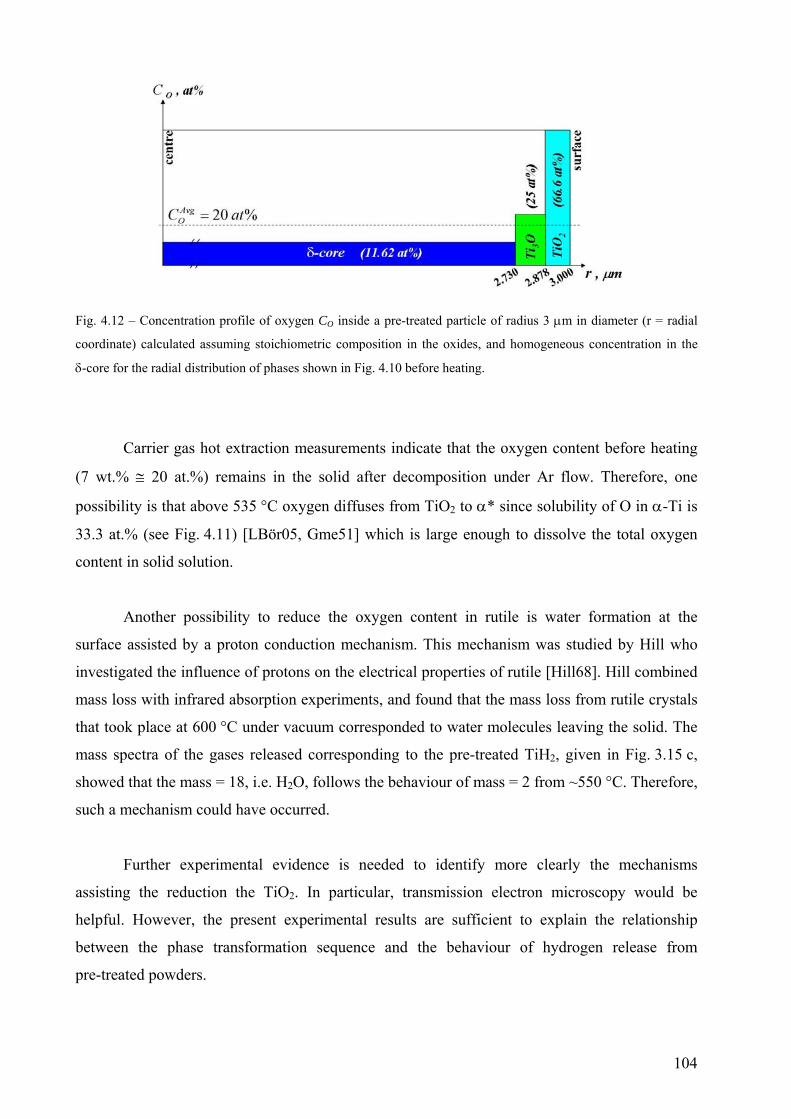
Fig. 4.12 – Concentration profile of oxygen CO inside a pre-treated particle of radius 3 μm in diameter (r = radial
coordinate) calculated assuming stoichiometric composition in the oxides, and homogeneous concentration in the
δ-core for the radial distribution of phases shown in Fig. 4.10 before heating.
Carrier gas hot extraction measurements indicate that the oxygen content before heating
(7 wt.% ≅ 20 at.%) remains in the solid after decomposition under Ar flow. Therefore, one
possibility is that above 535 °C oxygen diffuses from TiO2 to α* since solubility of O in α-Ti is
33.3 at.% (see Fig. 4.11) [LBör05, Gme51] which is large enough to dissolve the total oxygen
content in solid solution.
Another possibility to reduce the oxygen content in rutile is water formation at the
surface assisted by a proton conduction mechanism. This mechanism was studied by Hill who
investigated the influence of protons on the electrical properties of rutile [Hill68]. Hill combined
mass loss with infrared absorption experiments, and found that the mass loss from rutile crystals
that took place at 600 °C under vacuum corresponded to water molecules leaving the solid. The
mass spectra of the gases released corresponding to the pre-treated TiH2, given in Fig. 3.15 c,
showed that the mass = 18, i.e. H2O, follows the behaviour of mass = 2 from ~550 °C. Therefore,
such a mechanism could have occurred.
Further experimental evidence is needed to identify more clearly the mechanisms
assisting the reduction the TiO2. In particular, transmission electron microscopy would be
helpful. However, the present experimental results are sufficient to explain the relationship
between the phase transformation sequence and the behaviour of hydrogen release from
pre-treated powders.
104
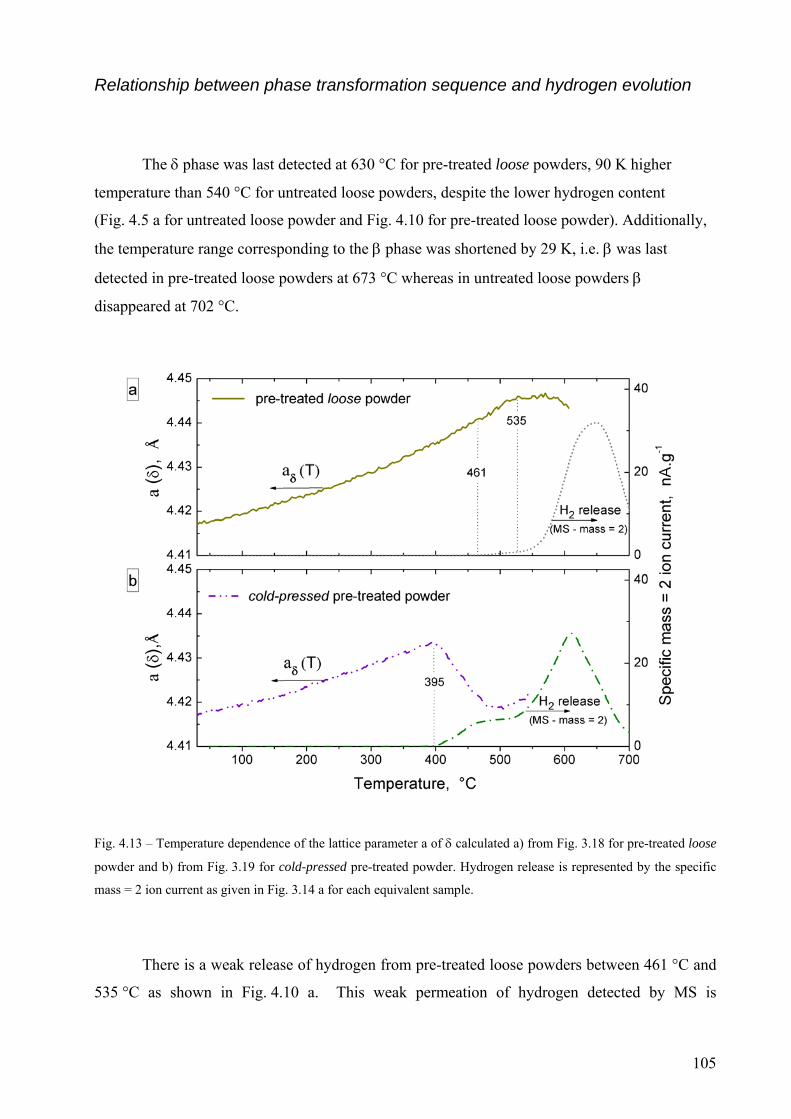
Relationship between phase transformation sequence and hydrogen evolution
The δ phase was last detected at 630 °C for pre-treated loose powders, 90 K higher
temperature than 540 °C for untreated loose powders, despite the lower hydrogen content
(Fig. 4.5 a for untreated loose powder and Fig. 4.10 for pre-treated loose powder). Additionally,
the temperature range corresponding to the β phase was shortened by 29 K, i.e. β was last
detected in pre-treated loose powders at 673 °C whereas in untreated loose powders β
disappeared at 702 °C.
Fig. 4.13 – Temperature dependence of the lattice parameter a of δ calculated a) from Fig. 3.18 for pre-treated loose
powder and b) from Fig. 3.19 for cold-pressed pre-treated powder. Hydrogen release is represented by the specific
mass = 2 ion current as given in Fig. 3.14 a for each equivalent sample.
There is a weak release of hydrogen from pre-treated loose powders between 461 °C and
535 °C as shown in Fig. 4.10 a. This weak permeation of hydrogen detected by MS is
105
corresponded by expansion rather than shrinkage of the δ lattice as shown in Fig 4.13 a, since the
amount of hydrogen released is very small, thermal expansion dominates. Only from ~ 535 °C,
the shrinkage of the hydride lattice becomes noticeable which is a mere consequence of the
reduction in CH as the TiO2 shell starts to become thinner, i.e. as the diffusion barrier starts to
reduce. The temperature 535 °C precedes the main peak which is asymmetric. The peak
asymmetry could be explained by the change of structure and diffusion coefficient of hydrogen
in the diffusion barrier. Before the peak, the out-gassing was controlled by TiO2, whereas after
the hydrogen release it was controlled by α*.
The retardation effect of a thermally grown oxide on the hydrogen out-gassing from pre-
treated TiH2 powders is known [Kenn02, Gerg00, Matl06, Lehm08, Mala09]. However, the
evolution of the oxide layers covering pre-treated TiH2 was never studied before. It has been
commonly assumed that the kinetics of decomposition under Ar is controlled by TiO2 rutile. The
diffusion coefficient of Ti3O is not known, but Yen has shown that TiO2 rutile, as an oxygen rich
oxide, is more effective retarding permeation of hydrogen than Ti rich oxides like Ti3O [Yen99].
Reported diffusion coefficients of hydrogen or tritium in TiO2 rutile were determined at 500 and
600 °C and included in Table 4.2.
Table 4.2 – Diffusion coefficients of hydrogen in α-Ti and TiO2 rutile phases at 500 and 600 °C
500 °C 600 °C Reference
TiHD −α
, cm2.s-1 4.05 × 10⁻⁶ 1.06 × 10⁻⁵ [Kuba83]
2TiOHD , cm2.s-1 2.56 × 10⁻⁷ 7.06 × 10⁻⁷ [Hill68]
On the basis of these diffusion coefficients, one can say that TiO2 is a more efficient
diffusion barrier for hydrogen than α-Ti in agreement with other groups of authors. It was
unknown though, that the diffusion barrier becomes thinner during the decomposition process of
pre-treated powders above the peritectoid transition from Ti3O into α*, and is this process the
one that triggers the strong release of hydrogen from 535 °C.
In the case of cold-pressed pre-treated powders, Fig. 4.13 b, the TiO2 barrier was
disrupted and hydrogen could be released directly through the hydride. In this case, a core-shell
structure such as the one used for the pre-treated loose powders cannot be applied, as there are
106
surfaces covered by TiO2 and others of bare hydride. The onset of hydrogen release from
cold-pressed powders is shifted to lower temperatures by 66 K from 461 to 395 °C compared to
pre-treated loose powder. The behaviour of hydrogen release is qualitatively different between
pre-treated loose and cold-pressed powder as 395 °C is and onset followed by steady hydrogen
release accompanied by lattice contraction of δ rather than the weak gas permeation detected for
loose powders.
107

108
5. Summary and Conclusions
• In the first part of this thesis it was evaluated whether hot-compaction under vacuum is a
good strategy to produce AlSi11 foams with more regularly distributed pore sizes.
For this, AlSi11 foams containing the blowing agent TiH2 and free of blowing agent were
produced both under vacuum and in air and compared in terms of properties of the precursor
material, foaming behaviour, hydrogen evolution, and resulting foam structure (section 4.1).
Hot-compaction under vacuum leads to better consolidation of foamable precursors by
improving the degree of metallic bonding between aluminium particles (section 4.1.1). The
better consolidation retards hydrogen evolution and reduces gas losses especially before melting
(section 4.1.2). Due to better consolidation both kinds of vacuum-pressed precursors, with and
free of TiH2, are more capable to arrest the growth of elongated bubbles perpendicular to the
foaming direction, i.e. the formation of crack-like pores before melting is reduced (Fig. 3.8). As
a result, the foaming of AlSi11 precursors containing TiH2 leads to larger and more
homogeneous foam expansion and ultimately to a more regular pore size. 3D pore analysis
performed on representative foams made from precursor material containing TiH2, shows that
the foam made from vacuum-pressed powders have a 37 % larger volume than the foam made
from air-pressed powders and a pore size distribution about twice as narrow.
Vacuum-pressed precursors free of TiH2 were better consolidated and more degassed.
The combination of both effects on the PIF behaviour of vacuum-pressed precursors is a more
regular bubble size distribution due to a more uniform nucleation of bubbles under overpressure
(Fig. 3.10). The expansion of vacuum-pressed material is slightly larger than air-pressed material
even though less gas is available in the precursors due to gas losses during pressing. PIF foams
made from vacuum-pressed material have larger, but more equally sized pores because the
pressure built-up inside the nucleated bubbles at overpressure is larger. Although some structural
defects, such as interconnections between pores and missing cell-walls are present in all samples,
there is a significant improvement in pore structure of foams made from vacuum-pressed
samples (section 4.1.3).
109
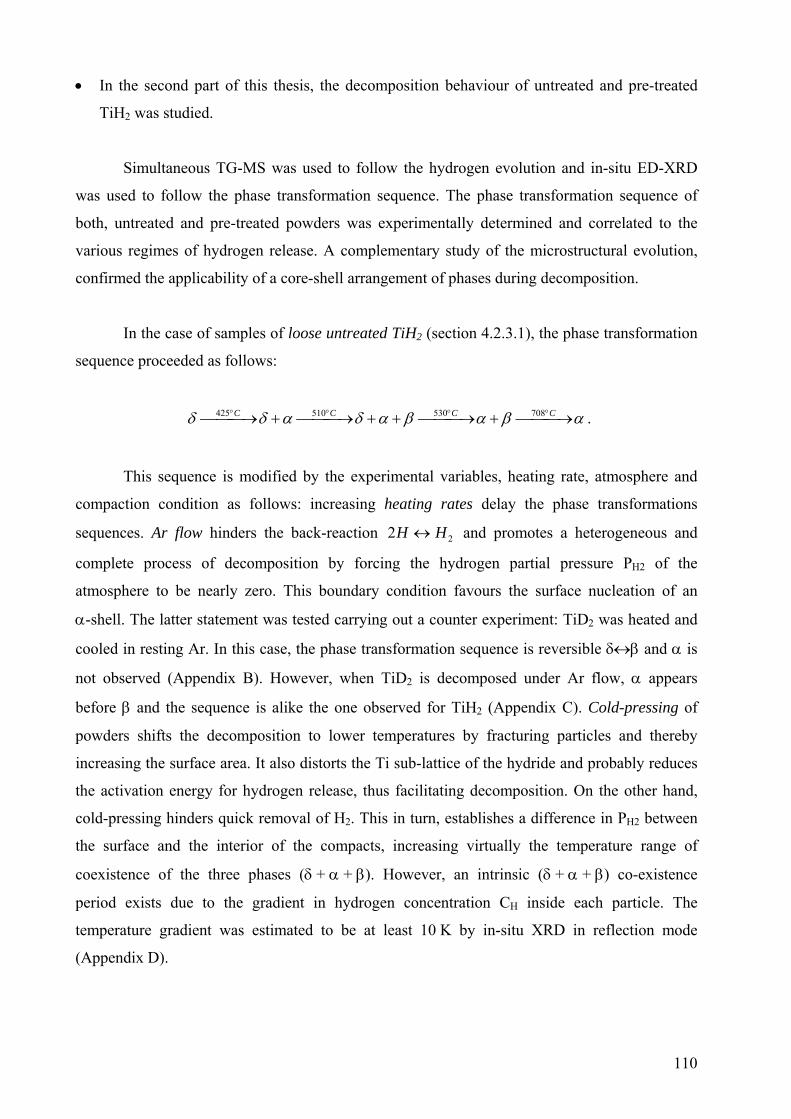
• In the second part of this thesis, the decomposition behaviour of untreated and pre-treated
TiH2 was studied.
Simultaneous TG-MS was used to follow the hydrogen evolution and in-situ ED-XRD
was used to follow the phase transformation sequence. The phase transformation sequence of
both, untreated and pre-treated powders was experimentally determined and correlated to the
various regimes of hydrogen release. A complementary study of the microstructural evolution,
confirmed the applicability of a core-shell arrangement of phases during decomposition.
In the case of samples of loose untreated TiH2 (section 4.2.3.1), the phase transformation
sequence proceeded as follows:
. αβαβαδαδδ ⎯⎯ →⎯+⎯⎯ →⎯++⎯⎯ →⎯+⎯⎯ →⎯ °°°° CCCC 708530510425
This sequence is modified by the experimental variables, heating rate, atmosphere and
compaction condition as follows: increasing heating rates delay the phase transformations
sequences. Ar flow hinders the back-reaction 22 HH ↔ and promotes a heterogeneous and
complete process of decomposition by forcing the hydrogen partial pressure PH2 of the
atmosphere to be nearly zero. This boundary condition favours the surface nucleation of an
α-shell. The latter statement was tested carrying out a counter experiment: TiD2 was heated and
cooled in resting Ar. In this case, the phase transformation sequence is reversible δ↔β and α is
not observed (Appendix B). However, when TiD2 is decomposed under Ar flow, α appears
before β and the sequence is alike the one observed for TiH2 (Appendix C). Cold-pressing of
powders shifts the decomposition to lower temperatures by fracturing particles and thereby
increasing the surface area. It also distorts the Ti sub-lattice of the hydride and probably reduces
the activation energy for hydrogen release, thus facilitating decomposition. On the other hand,
cold-pressing hinders quick removal of H2. This in turn, establishes a difference in PH2 between
the surface and the interior of the compacts, increasing virtually the temperature range of
coexistence of the three phases (δ + α + β). However, an intrinsic (δ + α + β) co-existence
period exists due to the gradient in hydrogen concentration CH inside each particle. The
temperature gradient was estimated to be at least 10 K by in-situ XRD in reflection mode
(Appendix D).
110
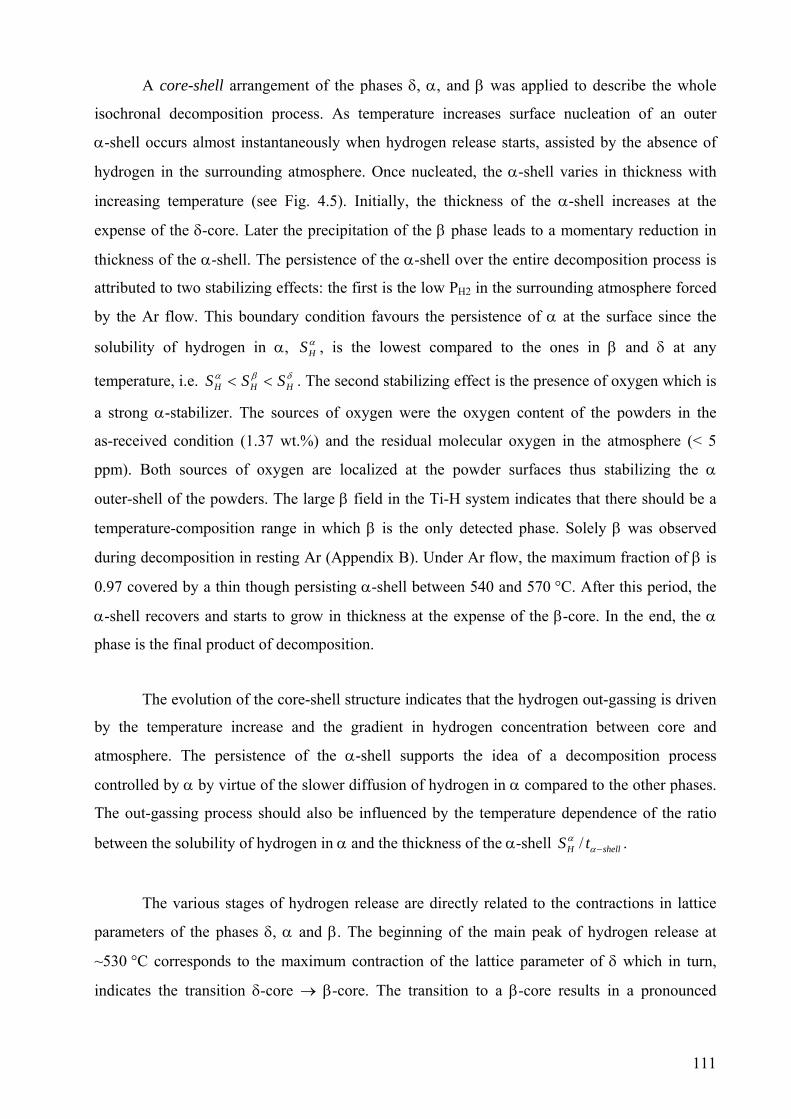
A core-shell arrangement of the phases δ, α, and β was applied to describe the whole
isochronal decomposition process. As temperature increases surface nucleation of an outer
α-shell occurs almost instantaneously when hydrogen release starts, assisted by the absence of
hydrogen in the surrounding atmosphere. Once nucleated, the α-shell varies in thickness with
increasing temperature (see Fig. 4.5). Initially, the thickness of the α-shell increases at the
expense of the δ-core. Later the precipitation of the β phase leads to a momentary reduction in
thickness of the α-shell. The persistence of the α-shell over the entire decomposition process is
attributed to two stabilizing effects: the first is the low PH2 in the surrounding atmosphere forced
by the Ar flow. This boundary condition favours the persistence of α at the surface since the
solubility of hydrogen in α, , is the lowest compared to the ones in β and δ at any
temperature, i.e. . The second stabilizing effect is the presence of oxygen which is
a strong α-stabilizer. The sources of oxygen were the oxygen content of the powders in the
as-received condition (1.37 wt.%) and the residual molecular oxygen in the atmosphere (< 5
ppm). Both sources of oxygen are localized at the powder surfaces thus stabilizing the α
outer-shell of the powders. The large β field in the Ti-H system indicates that there should be a
temperature-composition range in which β is the only detected phase. Solely β was observed
during decomposition in resting Ar (Appendix B). Under Ar flow, the maximum fraction of β is
0.97 covered by a thin though persisting α-shell between 540 and 570 °C. After this period, the
α-shell recovers and starts to grow in thickness at the expense of the β-core. In the end, the α
phase is the final product of decomposition.
αHS
δβαHHH SSS <<
The evolution of the core-shell structure indicates that the hydrogen out-gassing is driven
by the temperature increase and the gradient in hydrogen concentration between core and
atmosphere. The persistence of the α-shell supports the idea of a decomposition process
controlled by α by virtue of the slower diffusion of hydrogen in α compared to the other phases.
The out-gassing process should also be influenced by the temperature dependence of the ratio
between the solubility of hydrogen in α and the thickness of the α-shell . shellH tS −αα /
The various stages of hydrogen release are directly related to the contractions in lattice
parameters of the phases δ, α and β. The beginning of the main peak of hydrogen release at
~530 °C corresponds to the maximum contraction of the lattice parameter of δ which in turn,
indicates the transition δ-core → β-core. The transition to a β-core results in a pronounced
111
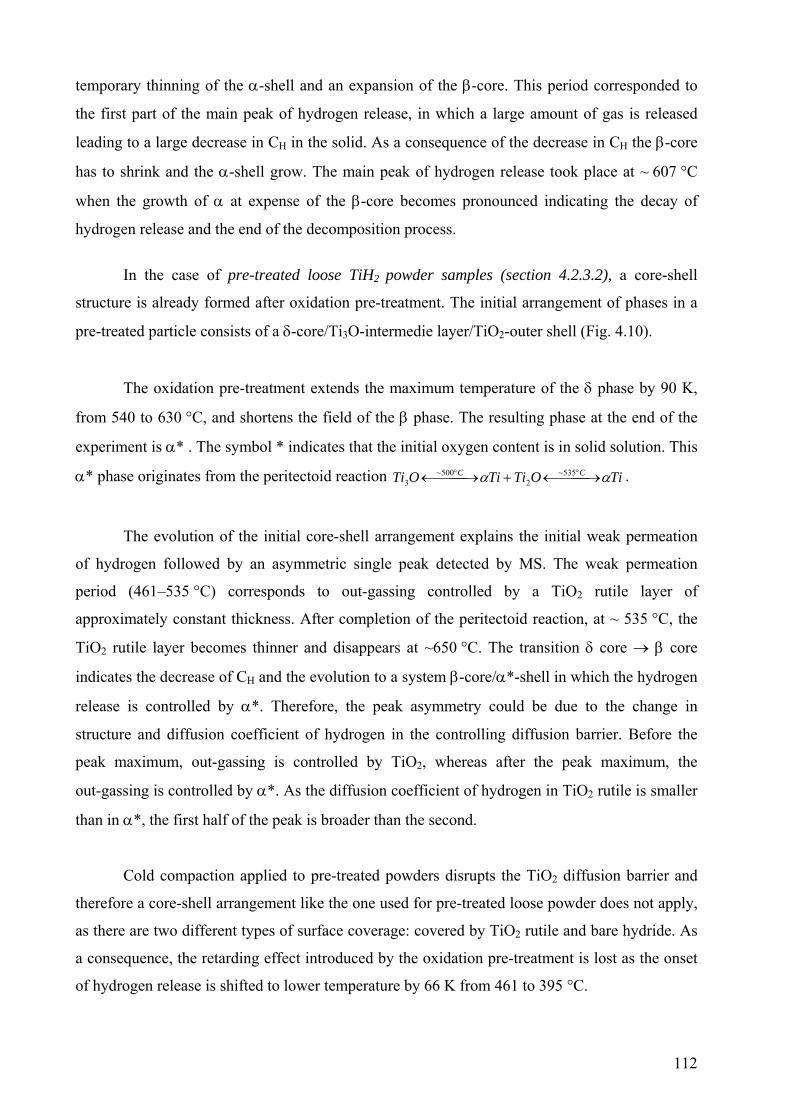
temporary thinning of the α-shell and an expansion of the β-core. This period corresponded to
the first part of the main peak of hydrogen release, in which a large amount of gas is released
leading to a large decrease in CH in the solid. As a consequence of the decrease in CH the β-core
has to shrink and the α-shell grow. The main peak of hydrogen release took place at ~ 607 °C
when the growth of α at expense of the β-core becomes pronounced indicating the decay of
hydrogen release and the end of the decomposition process.
In the case of pre-treated loose TiH2 powder samples (section 4.2.3.2), a core-shell
structure is already formed after oxidation pre-treatment. The initial arrangement of phases in a
pre-treated particle consists of a δ-core/Ti3O-intermedie layer/TiO2-outer shell (Fig. 4.10).
The oxidation pre-treatment extends the maximum temperature of the δ phase by 90 K,
from 540 to 630 °C, and shortens the field of the β phase. The resulting phase at the end of the
experiment is α* . The symbol * indicates that the initial oxygen content is in solid solution. This
α* phase originates from the peritectoid reaction . TiOTiTiOTi CC αα ⎯⎯⎯ →←+⎯⎯⎯ →← °° 535~2
500~3
The evolution of the initial core-shell arrangement explains the initial weak permeation
of hydrogen followed by an asymmetric single peak detected by MS. The weak permeation
period (461–535 °C) corresponds to out-gassing controlled by a TiO2 rutile layer of
approximately constant thickness. After completion of the peritectoid reaction, at ~ 535 °C, the
TiO2 rutile layer becomes thinner and disappears at ~650 °C. The transition δ core → β core
indicates the decrease of CH and the evolution to a system β-core/α*-shell in which the hydrogen
release is controlled by α*. Therefore, the peak asymmetry could be due to the change in
structure and diffusion coefficient of hydrogen in the controlling diffusion barrier. Before the
peak maximum, out-gassing is controlled by TiO2, whereas after the peak maximum, the
out-gassing is controlled by α*. As the diffusion coefficient of hydrogen in TiO2 rutile is smaller
than in α*, the first half of the peak is broader than the second.
Cold compaction applied to pre-treated powders disrupts the TiO2 diffusion barrier and
therefore a core-shell arrangement like the one used for pre-treated loose powder does not apply,
as there are two different types of surface coverage: covered by TiO2 rutile and bare hydride. As
a consequence, the retarding effect introduced by the oxidation pre-treatment is lost as the onset
of hydrogen release is shifted to lower temperature by 66 K from 461 to 395 °C.
112
References
[Ashb00] M.F. Ashby, A.G. Evans, N.A. Fleck, L.J. Gibson, J.W. Hutchinson, H.N.G. Wadley,
Metal Foams: A design guide, Boston: Butterworth-Heinemann (2000).
[Avizo] Konrad-Zuse-Zentrum für Informationstechnik Berlin (ZIB) and Mercury Computer
Systems. Avizo is trademark of Mercury Computer Systems ©2007,
http://www.vsg3d.com/.
[Banh99] J. Banhart, Foam metal: the recipe, Europhysics news (1999) 17.
[Banh01] J. Banhart, Manufacture, characterization and application of cellular metals and metal
foams, Prog. Mater. Sci. 46 (2001) 559.
[Banh01a] J. Banhart, H. Stanzick, L. Helfen, T. Baumbach, Metal foam evolution studied by
synchrotron radioscopy, App. Phys. Lett. 78 (2001) 1152.
[Banh02] J. Banhart, D. Weaire, On the road again: metal foams find favor, Physics Today, July
(2002) 37.
[Banh06] J. Banhart, Metal fomas: production and stability, Adv. Eng. Mater. 8 (2006) 9.
[Banh08] J. Banhart, Gold and gold alloy foams, Gold Bull. 41 (2008) 251.
[Baum00] J. Baumeister, German Patent DE40 18 360, 1990.
[Baum00] F. Baumgärtner, I. Duarte, J. Banhart, Industrialization of powder compact foaming
process, Adv. Eng. Mater. 2 (2000) 168.
[Bhos03] V. Bhosle, E.G. Baburaj, M. Miranova, K. Salama, Dehydrogenation of TiH2, Mater. Sci.
Eng. A, 356 (2003) 190.
[Blue08] P. Bluet, E. Welcomme, E. Dooryhe, J. Susuni, J.-L. Hodeau, Ph. Walter, Probing the
structure of heterogeneous diluted materials by diffraction tomography, Nature Mater. 7
(2008) 468.
[Brya08] J.D. Bryant, D.E. Hunter, J.A. Kallivayalil, M.D. Crowley, Cellular aluminium alloys I:
Structure and Properties of Alcoa aluminium foam, in: J. Hirsch, B. Skrotky and G.
Gottstein (Eds.), Conference proceedings of ICAA 11, DGM & Wiley-VCH, Weinheim,
Germany (2008) 2169.
[Budr01] P. Budrugeac, E. Segal, Some methodological problems concerning nonisothermal
kinetic analysis of heterogeneous solid-gas reactions, Int. J. Chem. Kinet. 33 (2001) 564.
[C&EN09] Making Water Step by Step, Chemical & Engineering News, 16 (2009) 10.
[Cull78] B.D. Cullity, Elements of X-Ray Diffraction. Addison-Wesley Publishing Comp, Inc.,
Reading, (1978), Appendix 3, 501.
[Davi83] G.J. Davies, S. Zhen, Review - Metallic foams: their production, properties and
applications, J. Mater. Sci. 18 (1983) 1899.
113
[Daxn04] T. Daxner, H.J. Böhm, M. Seitzberger, F.G. Rammerstorfer, Modelling of cellular
metals, in: H.P. Degischer and B. Kriszt (Eds.), Handbook of Cellular Metals, Wiley-
VCH, Weinheim, 2002, 245.
[DeMe26] M.A. De Meller, French Patent 615,147, 1926.
[Degi02] H.P. Degischer, A. Kottar, Characterization of cellular metals, in: H.P. Degischer and B.
Kriszt (Eds.), Handbook of Cellular Metals, Wiley-VCH, Weinheim, 2002, 156.
[Denk07] I.A. Denks, Ch. Genzel, Enhancement of energy dispersive residual stress analysis by
consideration of detector electronic effects, Nucl. Instr. Meth. Phys. Res. B, 262 (2007)
87.
[Duar00] I. Duarte, J. Banhart, A study of aluminium foam formation-kinetics and microstructure,
Acta Mater. 48 (2000) 2349.
[Eise83] N. Eisenreich, W. Engel, Difference thermal analysis of crystalline solids by the use of
Energy-Dispersive X-ray diffraction, J. Appl. Cryst. 16 (1983) 259.
[Estr91] J.L. Estrada, J. Duszczyk, B.M. Korevaar, Gas entrapment and evolution in prealloyed
aluminium powders, J. Mater. Sci. 26 (1991) 1431.
[FullPr] http://www.ill.eu/sites/fullprof/php/downloads.html.
[Garc04] F. Garcia-Moreno, M. Fromme, J. Banhart, Real time x-ray radioscopy on metallic foams
using a compact microfocus source, Adv. Eng. Mater. 6 (2004) 416.
[Garc05] F. Garcia-Moreno, J. Banhart, Method for foaming metals without blowing agent,
German Patent DE 102005037305.
[Garc07] F. Garcia-Moreno, J. Banhart, Foaming of blowing agent-free aluminium powder,
Colloids and Surfaces A: Physicochem. Eng. Aspects 309 (2007) 264.
[Genz07] Ch. Genzel, I.A. Denks, J. Gibmeier, M. Klaus, G. Wagener, The materials science
synchrotron beamline EDDI for energy-dispersive diffraction analysis, Nucl. Instr. Meth.
Phys. Res. A, 578 (2007) 23.
[Géra92] N. Gérard, S. Ono, Hydride formation and decomposition kinetics, in: L.Schlapbach
(Ed.), Hydrogen in Intermetallic Compounds II, Springer-Verlag, Berlin Heidelberg New
York, 1992, 165.
[Gerg00] V. Gergely, B. Clyne, The FORMGRIP Process: Foaming of reinforced metals by gas
release in precursors, Adv. Eng. Mater. 2 (2000) 175.
[Gibs97] L.J. Gibson, M.F. Ashby, Cellular solids, Second Edition, Oxford Universsity Press
(1997).
[Gmel51] Meyer RJ, Pietsch EHE. Gmelins Handbuch der Anorganischen Chemie: Titan, Vol. 41.
Verlag Chemie: Weinheim (1951), 213.
[Grun99] W. Gruner, Determination of oxygen in oxides by carrier gas hot extraction analysis with
simultaneous COX detection. J. Analyt. Chem. 365 (1999) 597.
114
[Han98] F. Han, Z. Zhu, J. Gao, W. Song, Effect of oxidation and surface filming on hydrogen
degassing from TiH2, Met. Mater. Trans. B, 29B (1998) 1315.
[Helf02] L. Helfen, T. Baumbach, H. Stanzick, J. Banhart, A. Elmoutaouakkil, P. Cloetens,
Viewing the early stage of metal foam formation by computed tomography using
synchrotron radiation, Adv. Eng. Mater. 4 (2002) 808.
[Helf05] L. Helfen, T. Baumbach, P. Pernot, P. Cloetens, H. Stanzick, K. Schladitz, J. Banhart,
Investigation of pore initiation in metal foams by synchrotron-radiation tomography,
App. Phys. Lett. 86 (2005) 231907.
[Helw08] H.M. Helwig, J. Banhart, H. W. Seeliger, German patent application 102008027 798.3,
2008.
[Helw09] H.M. Helwig, S. Hiller, F. Garcia-Moreno J. BanhartInfluence of compaction conditions
on the foamability of AlSi8Mg4 alloy, Met Mater Trans B, doi: 10.1007/s11663-009-
9264-9, in press
[Hill68] G.J Hill, The effect of hydrogen on the electrical properties of rutile, Brit. J. Appl. Phys.
(J. Phys. D), 1 (1968) 1151.
[HZBE6] http://www.helmholtz-berlin.de/userservice/neutrons/instrumentation/neutron-
instruments/e6_en.html.
[Irre05] A. Irretier, J. Banhart, Lead and lead alloy foams, Acta Mater. 53 (2005) 4903.
[Jime07] C. Jiménez, F. Garcia-Moreno, J. Banhart, G. Zehl, Effect of relative humidity on
pressure-induced foaming (PIF) of aluminium-based precursors, In: L. P. Lefebvre, J.
Banhart, D. Dunand, editors, Proceedings of Porous Metals and Metallic foams, DEStech
Publications (2007) 59.
[Jime09] C. Jiménez, F. Garcia-Moreno, M. Mukherjee, O.Goerke, J. Banhart, Improvement of
Aluminium foaming by powder consolidation under vacuum, Scripta Mater. 61 (2009)
552.
[Kene04] P. Kenesei, Cs. Kadar, Zs. Rajkovits, J. Lendvai. The influence of cell-size distribution
on the plastic deformation in metal foams. Scripta Mater. 50 (2004) 295.
[Kenn02] A.R. Kennedy, The effect of TiH2 heat treatment on gas release and foaming in Al–TiH2
preforms, Scripta Mater. 47 (2002) 763.
[Kenn02b] A.R. Kennedy, Evolution of Foam structure during the heating of extruded Al–Si-TiH2
powders, J. Mater. Sci. Lett. 21 (2002) 1555.
[Kita06] K. Kitazono and Y. Takiguchi, Strain rate sensitivity and energy absorption of Zn–22Al
foams, Scripta Mater. 55 (2006) 501.
[Kita07] K. Kitazono, Y. Kikuchi, E. Sato, K. Kuribayashi, Processing of closed-cell magnesium
foams, Materials science forum 539-43 (2007) 1839.
[Koll08] M. Kolluri, M. Mukherjee, F. Garcia-Moreno, J. Banhart, U. Ramamurty, Fatigue of a
laterally constrained closed cell aluminum foam, Acta Mater. 56 (2008) 1114.
115
[Körn04] C. Körner, M. Hirschmann, V. Brautigam, R.F. Singer, Endogenous particle stabilization
during magnesium integral foam production, Adv. Eng. Mater. 6 (2004) 385.
[Körn05] C. Körner, M. Arnold, R. F. Singer, Metal foam stabilization by oxide network particles,
Mater. Sci. Eng. A, 396 (2005) 28.
[Korn73] I. Kornilov, Effect of oxygen on titanium and its alloys, Metallov, 10 (1973) 2.
[Kuba83] O. Kubaschewski, Diffusion, in Komarek (Ed.), Titanium: physico-chemical properties
of its compounds and alloys, Special issue No. 9, International Atomic Agency, Vienna
(1983) 442.
[KubG83] O. Kubaschewski-von Goldbeck, Phase diagrams, in Komarek (Ed.), Titanium: physico-
chemical proterties of its compounds and alloys, Special issue No. 9, International
Atomic Agency, Vienna (1983) Ti-H p 105 and Ti-O, 129.
[LBör90] H.Matzke, V.V. Rondinella, Diffusion in carbides, nitrides, hydrides and borides,
Landolt-Börnstein, New Series III/33B1 (1990) 50.
[LBör05] Landolt-Börnstein New Series IV/5 MSIT® “O-Ti (Oxygen-Titanium)” (2005)
[Lavr90] V.A. Lavrenko, V.Zh. Shemet, L.A. Petrov, O.A. Teplov, High-temperature oxidation of
titanium-hydride powders, Oxidation of Metals, 33 (1990) 177.
[Lehm04] D. Lehmhus, M. Busse, Potencial new matrix alloys for production of PM aluminium
foams, Adv. Eng. Mater. 6 (2004) 391.
[Lehm04a] D. Lehmhus, G. Rausch, Tailoring TiH2 decomposition kinetics by annealing in various
atmospheres, for Adv. Eng. Mater. 6 (2004) 313.
[Lehm08] D. Lehmhus, Beitrag zur Optimierung der Herstellung der Material-eigenschaften von
Aluminiumschäumen, Dissertation, Universität Bremen (2008).
[Lenn54] G.A.Lenning. C.M. Craighead, R.I. Jaffee, Constitution and mechanical properties of
titanium-hydrogen alloys, Trans. Metall. AIME, 200 (1954) 367.
[Mala09] M.T. Malachevsky, C. D'Ovidio, Thermal evolution of titanium hydride optimized for
aluminium foam fabrication, Scripta Mater. 61 (2009) 190.
[Mark01] A.E. Markaki, T.W. Clyne, The effect of cell wall microstructure on the deformation and
fracture of aluminum-based foams, Acta Mater. 49 (2001) 1677.
[Mati03] B. Matijasevic, J. Banhart, I. Zizak, N. Darowski, G. Schumacher, BESSY Annual
Report (2003) 443
[Mati04] B. Matijasevic, S. Fiechter, I. Zizak, O. Görke, N. Wanderka, P. Schubert-Bischoff, and
J. Banhart. Decomposition behaviour of as-received and oxidised TiH2 powder, In H.
Danninger and R. Ratzi (Eds.), Proceedings PM 2004 Powder Metallurgy World
Congress Vienna, volume 4, European Powder Metallurgy Association, Shrewsbury, UK
(2004) 149.
[Mati06] B. Matijasevic, J. Banhart, Improvement of aluminium foam technology by tailoring of
blowing agent, Scripta Mater. 54 (2006) 503.
116
[Mati06a] B. Matijasevic, Characterization and optimization of blowing agent for making improved
metal foams. PhD Thesis, Technische Universität Berlin (2006).
[Matl06] B. Matijasevic-Lux, J. Banhart, S. Fiechter, O. Görke, N. Wanderka, Modification of
titanium hydride for improved aluminium foam manufacture, Acta Mater. 54 (2006)
1887.
[McCu98] L.B. McCusker, R.B. Von Freele, D.E. Cox, Dlouer, P Scardi, Rietveld refinement
guidelines, J. Appl. Cryst. 32 (1999) 36.
[Mosl01] U. Mosler, A. Müller, H. Baum, U. Martin, H. Oettel, Microstructure of foamable
precursor and foamed aluminium material, in: J. Banhart, M. Ashby and N. Fleck (Eds.),
Cellular Metals and Metal Foaming Technology, MIT-Verlag, Bremen, 2001, 233.
[Motz05] C. Motz, O. Friedl, R. Pippan, Fatigue crack propagation in cellular metals, International
Journal of Fatigue, 27 (2005) 1571.
[Mukh09] M. Mukherjee, Evolution of metal foams during solidification, PhD Thesis, Technische
Universität Berlin (2009).
[Müll68] W.M. Müller, Titanium Hydrides, in: W. M. Müller, J. P. Blackledge, and G. G. Libowitz
(Eds.), Metal hydrides, Academic Press, New York (1968) 336.
[Murr99] J.L. Murray, A.J. MacAllister, Al-Si binary phase diagram. In: H. Baker (Ed.), ASM
Handbook, Vol. 3: Alloy Phase Diagrams, ASM International, Materials Park, Ohio,
1999, 85
[Octopu] Gehnt University. Octopus – CT reconstruction software. http://www.xraylab.com/
[Pick81] J.R. Pickens, Review - aluminium powder metallurgy technology for high-strength
applications, J. Mater. Sci. 16 (1981) 1437.
[Rako04] J.F. Rakow, A.M. Waas. Size effects and the sheer response of aluminium foam. Mech
Mater, 37 (2004) 69.
[Rama2004] U. Ramamurty, A. Paul, Variability in mechanical properties of metal foams, Acta Mater.
52 (2004) 869.
[SanM87] A. San Martin, F.D. Manchester, The H–Ti (hydrogen–titanium) system, Bull Alloy
Phase Diag. 8 (1987) 30.
[Schl92] L. Schlapbach, Surface properties and activation, in: L.Schlapbach (Ed.), Hydrogen in
Intermetallic Compounds II, Springer-Verlag, Berlin Heidelberg New York, 1992, 17.
[Scho73] C.W. Schoenfelder and J.H. Swisher, Kinetics of thermal decomposition of TiH2, J. Vac.
Sci. Technol. 10(1973) 862.
[Seel03] H.-W. Seeliger. Aluminium foam sandwich (AFS)—ready for market introduction. In: J.
Banhart, NA. Fleck, A. Mortensen (Eds.), Cellular metals—manufacture, properties,
applications. MIT-Verlag, Berlin, 2003, 5.
[Seel06] H.-W. Seeliger, private communication.
117
[Sest73] J. Sestak, V.Satava, W. Wendlandt, The study of heterogeneous processes by thermal
analysis, Review, Thermochimica Acta 7 (1973) 333.
[Shem92] V.Zh. Shemet, A.P. Pomytkin, V.A. Lavrenko and V. Zh. Ratushnaya, Decomposition of
metal hydrides in low temperatures and in high-temperature oxidation, Int. J. Hydrogen
Energy, 18 (1993) 511.
[Solo08] E. Solórzano, Espumas de Aluminio: Proceso de Espumado, Estructura Celular y
Propiedades, PhD Thesis, Universidad de Valladolid, 2008.
[Song08] H.-W. Song, Q.-J. He, J.-J. Xie, A. Tobota, Fracture mechanisms and size effects of
brittle metallic foams: In situ compression tests inside SEM, Compos. Sci. Tech. 68
(2008) 2441.
[Stan91] G. Staniek, K. Wafer, Chemical surface treatment of aluminium powder alloys,
Aluminium, 67 (1991) 160.
[Swis72] J.H. Swisher, Diffusion model for the thermal decomposition of TiH2, Sandia
Laboratories Report No. SCL-RR-720059, 1972.
[Swis96] G. Swislow, spec. Certified Scientific Software, Cambridge, MA,USA, 1996.
[Taka95] A. Takasaki, Y. Furuya, K. Ojima, Y. Taneda, Hydride dissociation and hydrogen
evolution behaviour of electrochemically charged pure titanium, J. Alloys Comp. 224
(1995) 269.
[Ünal99] Ünal J.A., Leon D.D., Gurganus T.B., and Hildeman G.J., Production of Aluminium and
Aluminium-Alloy powder. In: Y. Trudel, Editor of Introduction to Metal Metal Powder
and Characterization. In: ASM Handbook, Vol. 7, Powder Metallurgy, ASM
International, Materials Park, Ohio, 1999, 342.
[VGStud] http://www.volumegraphics.com/products/vgstudiomax/
[vZep03] F. von Zeppelin, M. Hirscher, H. Stanzick, J. Banhart, Desorption of hydrogen from
blowing agents used for foaming metals, Compos. Sci. Tech. 63 (2003) 2293. http://www.volumegraphics.com/products/vgstudiomax/
[Wang95] W.-E. Wang, Thermodynamic evaluation of the titanium-hydrogen system, J. Alloys
Comp. 238 (1996) 6.
[Wang99] X. Wang, T.J. Lu, Optimized acoustic properties of cellular solids. J. Acous. Soc. Ame.
106 (1999) 756.
[Wibe01] E. Wiberg, N. Wiberg, A.F. Holleman, Inorganic Chemistry, Academic Press, (2001)
1331.
[Will06] G. Will, Powder Diffraction, Springer-Verlag Berlin Heidelberg, (2006).
[Yake58] H.L. Yakel, Thermocrystallography of higher hydrides of titanium and zirconium, Acta
Cryst. 11 (1958) 46.
[Yen99] S.K. Yen, Retardation effects of thermally grown oxide films on the hydrogen
embrittlement of commercial pure titanium, Corr. Sci. 41 (1999) 2031.
118
[Wafe87] K. Wafers, C. Misra, Oxides and hydroxides of aluminum, Alcoa Tech. Paper No.19
(1987) 37.
[Wafe81] K. Wafers, Properties and characterization of surface oxides on aluminium alloys,
Aluminium 57 (1981) 722.
[Zhao04] C.Y. Zhao, T.J. Lu, H.P. Hodson, Thermal radiation in ultralight metal foams with open
cells, Int. J. Heat Mass Transf. 47 (2004) 2927.
[Zhao05] C.Y. Zhao, T.J. Lu, H.P. Hodson, Natural convection in metal foams with open cells, Int.
J. Heat Mass Transf. 48 (2005) 2452.
[Zsch05] H.R. Zschommler Sandim, B.Vieira Morante, P. Atsushi Suzuki, Kinetics of thermal
decomposition of titanium hydride powder using in situ high-temperature X-ray
diffraction (HTXRD), Mater. Res. 8 (2005) 293.
119

120
Appendix A – Calculation of correction factors for mass
spectrometry (MS) data
In the decomposition of TiH2 under Ar flow, the main reaction is TiH2 → Ti (s) + H2 (g). If
the hydride would be perfectly stoichiometric, i.e., the ratio H/Ti = 2, and the thermo-balance
used for TG would be perfect, the measured mass loss by TG during complete decomposition
would be 4%. Besides, the DTG signal would resemble the MS curve and the integrated specific
mass = 2 ion current, i.e. “mass = 2” ion current per unit sample mass, should have an area
directly proportional to the mass loss.
However, neither TiH2 N and PS grades are stoichiometric nor the thermo-balance is
perfect. For example, for the same heating profile, untreated loose powder and cold-pressed
tablets of PS grade lost similar mass (measurements 1 and 2), but the integrated mass = 2 ion
currents are not so close. The ratio between measurements 1 and 2 for mass loss is ~0.99
(3.82/3.85), whereas the ratio for the integrated specific mass = 2 is 1.48 (4.44/2.99). TG-MS
analysis was repeated four times on untreated PS loose powder samples and three times on
tablets in different periods of this PhD thesis. For a given sample and condition the scatter in
mass loss was ±0.1% whereas the one for the integrated specific mass = 2 ion current 50%.
Despite the large scatter in absolute values, the MS data was very reproducible in terms of
behaviour, and more sensitive than TG for detecting onsets of hydrogen release. Therefore, the
MS data could not be disregarded. Changing conditions at the skimmer coupling system were the
origin of such large scatter in the MS runs, e.g. pressure variation in the high vacuum part.
Therefore, each individual MS measurement was multiplied by the correction factors given
in Table A.1. These factors were constant during individual measurements. In order to calculate
them, measurement 13 was adopted as standard (below, it is explained why). Additionally, it was
decided to rely on the mass loss of individual measurements because that was a more
reproducible quantity in absolute value since the performance of the thermo-balance is not
related to the condition of the skimmer system. Towards the end of this thesis, the applicability
of this correction was validated as various limitations at the skimmer system were better
understood and improved. Besides, it was noticed that the differences in absolute values of the
MS signals were significantly reduced when individual measurements were shorter in time. Short
measurements allowed running of complete series in the same day. It was thus possible to obtain
the series for TiH2 N grade decomposed at 40 K.min-1 in the same day. In this series, the four
121
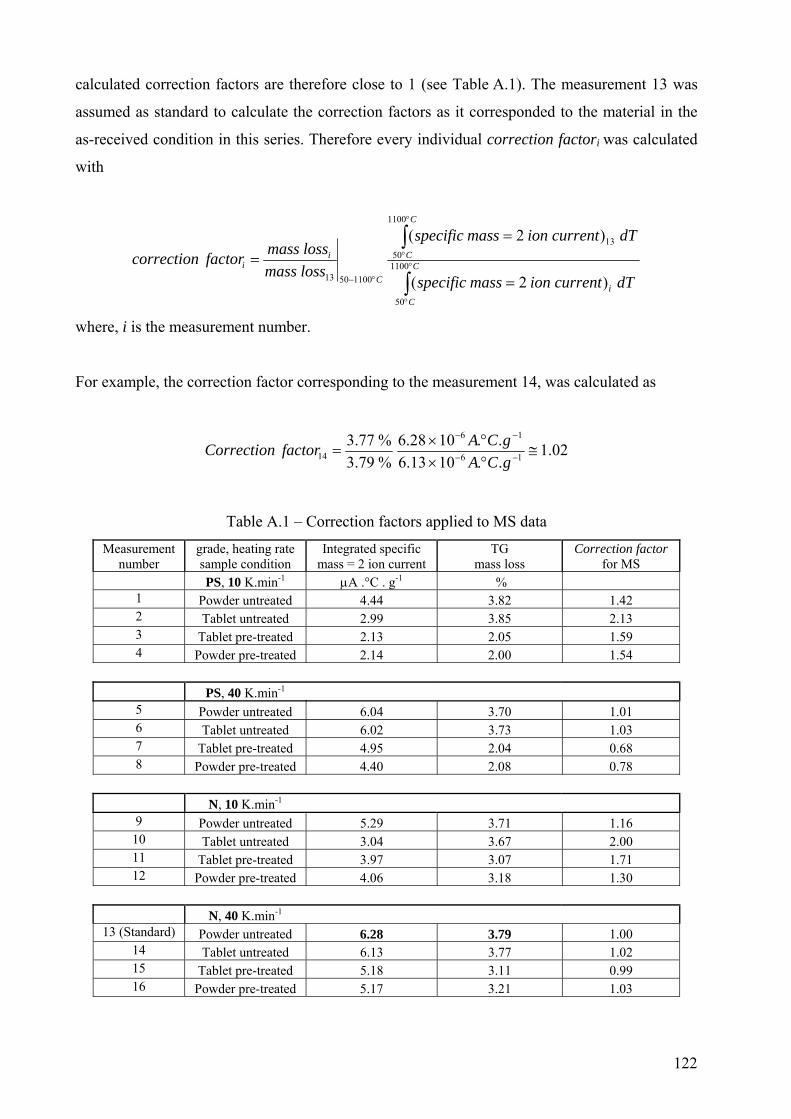
calculated correction factors are therefore close to 1 (see Table A.1). The measurement 13 was
assumed as standard to calculate the correction factors as it corresponded to the material in the
as-received condition in this series. Therefore every individual correction factori was calculated
with
dTcurrentionmassspecific
dTcurrentionmassspecific
lossmasslossmassfactorcorrection
i
C
C
C
C
C
ii
)2(
)2(
1100
50
13
1100
50
11005013 ∫
∫°
°
°
°
°− =
==
where, i is the measurement number.
For example, the correction factor corresponding to the measurement 14, was calculated as
02.1..1013.6..1028.6
%79.3%77.3
16
16
14 ≅°×°×
= −−
−−
gCAgCAfactorCorrection
Table A.1 – Correction factors applied to MS data
Measurement number
grade, heating rate sample condition
Integrated specific mass = 2 ion current
TG mass loss
Correction factor for MS
PS, 10 K.min-1 μA .°C . g-1 % 1 Powder untreated 4.44 3.82 1.42 2 Tablet untreated 2.99 3.85 2.13 3 Tablet pre-treated 2.13 2.05 1.59 4 Powder pre-treated 2.14 2.00 1.54 PS, 40 K.min-1
5 Powder untreated 6.04 3.70 1.01 6 Tablet untreated 6.02 3.73 1.03 7 Tablet pre-treated 4.95 2.04 0.68 8 Powder pre-treated 4.40 2.08 0.78 N, 10 K.min-1
9 Powder untreated 5.29 3.71 1.16 10 Tablet untreated 3.04 3.67 2.00 11 Tablet pre-treated 3.97 3.07 1.71 12 Powder pre-treated 4.06 3.18 1.30
N, 40 K.min-1
13 (Standard) Powder untreated 6.28 3.79 1.00 14 Tablet untreated 6.13 3.77 1.02 15 Tablet pre-treated 5.18 3.11 0.99 16 Powder pre-treated 5.17 3.21 1.03
122
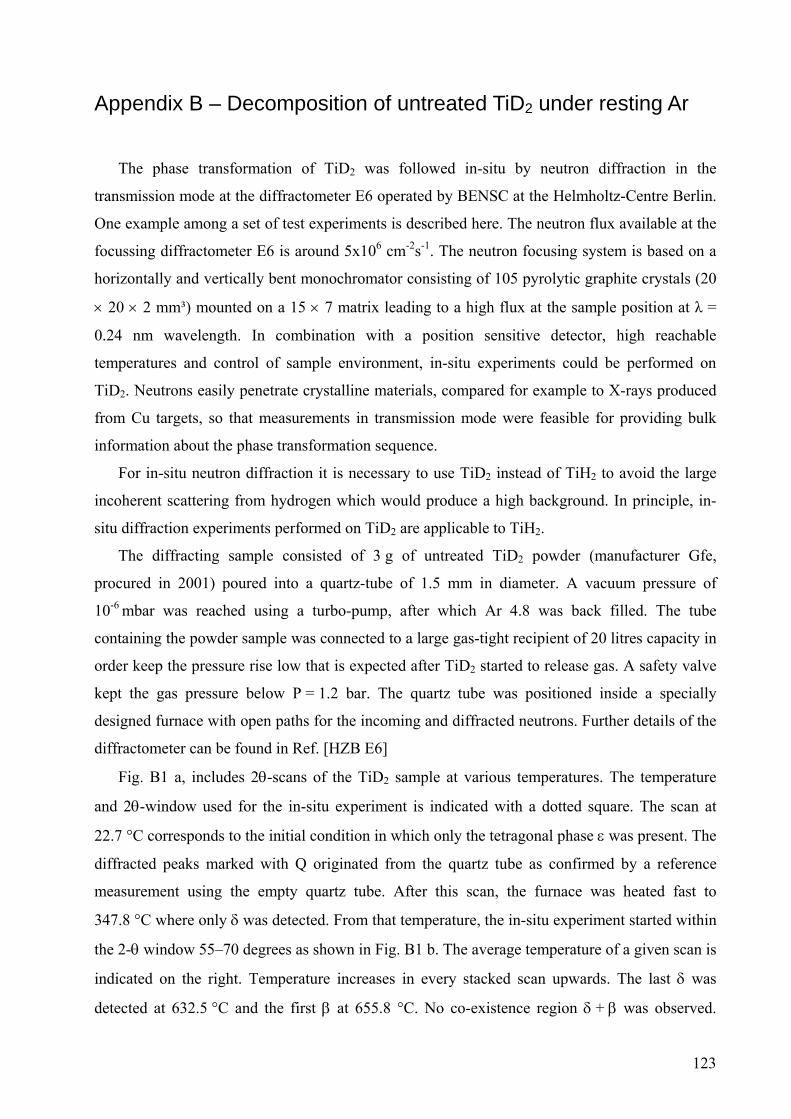
Appendix B – Decomposition of untreated TiD2 under resting Ar
The phase transformation of TiD2 was followed in-situ by neutron diffraction in the
transmission mode at the diffractometer E6 operated by BENSC at the Helmholtz-Centre Berlin.
One example among a set of test experiments is described here. The neutron flux available at the
focussing diffractometer E6 is around 5x106 cm-2s-1. The neutron focusing system is based on a
horizontally and vertically bent monochromator consisting of 105 pyrolytic graphite crystals (20
× 20 × 2 mm³) mounted on a 15 × 7 matrix leading to a high flux at the sample position at λ =
0.24 nm wavelength. In combination with a position sensitive detector, high reachable
temperatures and control of sample environment, in-situ experiments could be performed on
TiD2. Neutrons easily penetrate crystalline materials, compared for example to X-rays produced
from Cu targets, so that measurements in transmission mode were feasible for providing bulk
information about the phase transformation sequence.
For in-situ neutron diffraction it is necessary to use TiD2 instead of TiH2 to avoid the large
incoherent scattering from hydrogen which would produce a high background. In principle, in-
situ diffraction experiments performed on TiD2 are applicable to TiH2.
The diffracting sample consisted of 3 g of untreated TiD2 powder (manufacturer Gfe,
procured in 2001) poured into a quartz-tube of 1.5 mm in diameter. A vacuum pressure of
10-6 mbar was reached using a turbo-pump, after which Ar 4.8 was back filled. The tube
containing the powder sample was connected to a large gas-tight recipient of 20 litres capacity in
order keep the pressure rise low that is expected after TiD2 started to release gas. A safety valve
kept the gas pressure below P = 1.2 bar. The quartz tube was positioned inside a specially
designed furnace with open paths for the incoming and diffracted neutrons. Further details of the
diffractometer can be found in Ref. [HZB E6]
Fig. B1 a, includes 2θ-scans of the TiD2 sample at various temperatures. The temperature
and 2θ-window used for the in-situ experiment is indicated with a dotted square. The scan at
22.7 °C corresponds to the initial condition in which only the tetragonal phase ε was present. The
diffracted peaks marked with Q originated from the quartz tube as confirmed by a reference
measurement using the empty quartz tube. After this scan, the furnace was heated fast to
347.8 °C where only δ was detected. From that temperature, the in-situ experiment started within
the 2-θ window 55–70 degrees as shown in Fig. B1 b. The average temperature of a given scan is
indicated on the right. Temperature increases in every stacked scan upwards. The last δ was
detected at 632.5 °C and the first β at 655.8 °C. No co-existence region δ + β was observed.
123
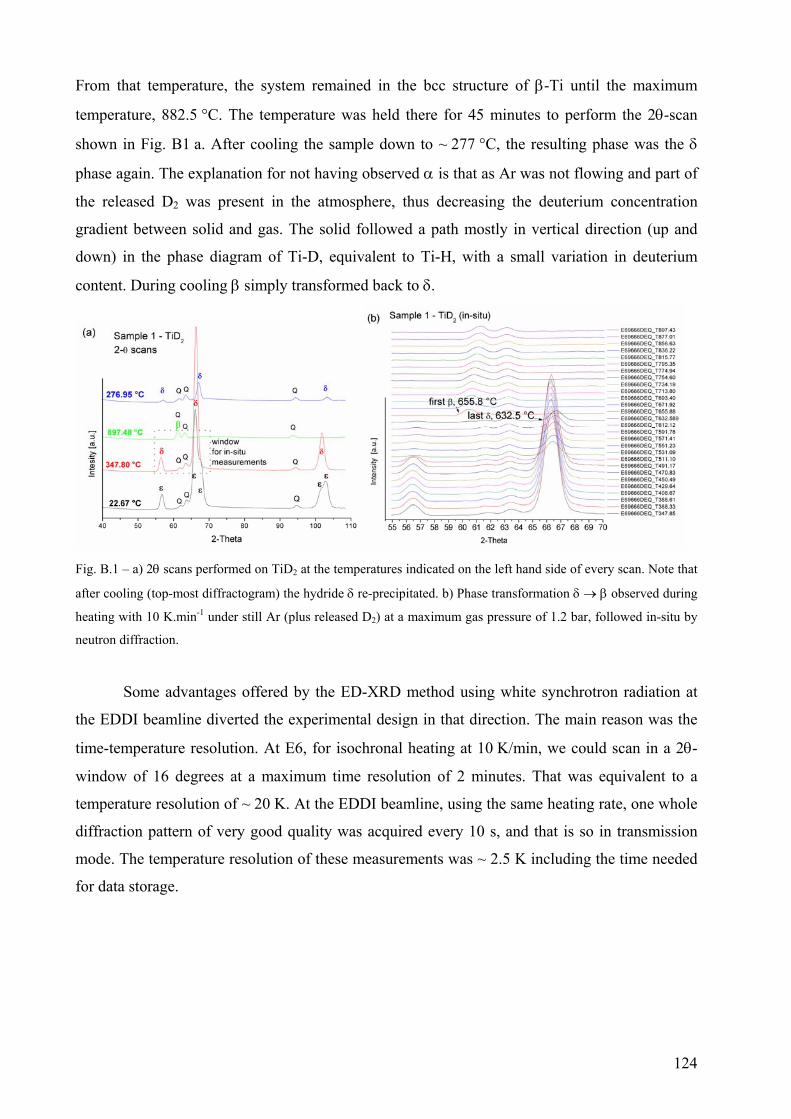
From that temperature, the system remained in the bcc structure of β-Ti until the maximum
temperature, 882.5 °C. The temperature was held there for 45 minutes to perform the 2θ-scan
shown in Fig. B1 a. After cooling the sample down to ~ 277 °C, the resulting phase was the δ
phase again. The explanation for not having observed α is that as Ar was not flowing and part of
the released D2 was present in the atmosphere, thus decreasing the deuterium concentration
gradient between solid and gas. The solid followed a path mostly in vertical direction (up and
down) in the phase diagram of Ti-D, equivalent to Ti-H, with a small variation in deuterium
content. During cooling β simply transformed back to δ.
Fig. B.1 – a) 2θ scans performed on TiD2 at the temperatures indicated on the left hand side of every scan. Note that
after cooling (top-most diffractogram) the hydride δ re-precipitated. b) Phase transformation δ → β observed during
heating with 10 K.min-1 under still Ar (plus released D2) at a maximum gas pressure of 1.2 bar, followed in-situ by
neutron diffraction.
Some advantages offered by the ED-XRD method using white synchrotron radiation at
the EDDI beamline diverted the experimental design in that direction. The main reason was the
time-temperature resolution. At E6, for isochronal heating at 10 K/min, we could scan in a 2θ-
window of 16 degrees at a maximum time resolution of 2 minutes. That was equivalent to a
temperature resolution of ~ 20 K. At the EDDI beamline, using the same heating rate, one whole
diffraction pattern of very good quality was acquired every 10 s, and that is so in transmission
mode. The temperature resolution of these measurements was ~ 2.5 K including the time needed
for data storage.
124
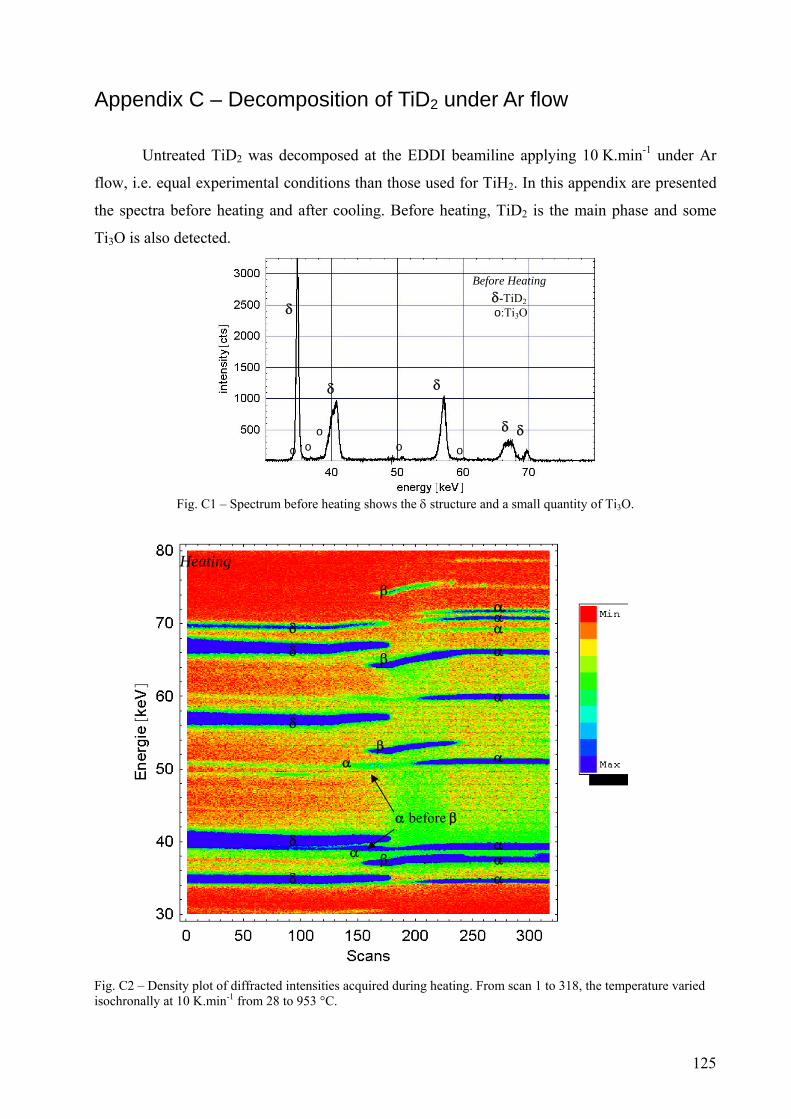
Appendix C – Decomposition of TiD2 under Ar flow
Untreated TiD2 was decomposed at the EDDI beamiline applying 10 K.min-1 under Ar
flow, i.e. equal experimental conditions than those used for TiH2. In this appendix are presented
the spectra before heating and after cooling. Before heating, TiD2 is the main phase and some
Ti3O is also detected.
Before Heating δ-TiD2
δ o:Ti3O
δ δ
δ δ o o o o o
Fig. C1 – Spectrum before heating shows the δ structure and a small quantity of Ti3O.
Heating
βα
Fig. C2 – Density plot of diffracted intensities acquired during heating. From scan 1 to 318, the temperature varied isochronally at 10 K.min-1 from 28 to 953 °C.
δ
δ ααβ
δ αβ
β β
αβ
δ β
ααβ
α before β δ
β α ααβ
αβ
β
125
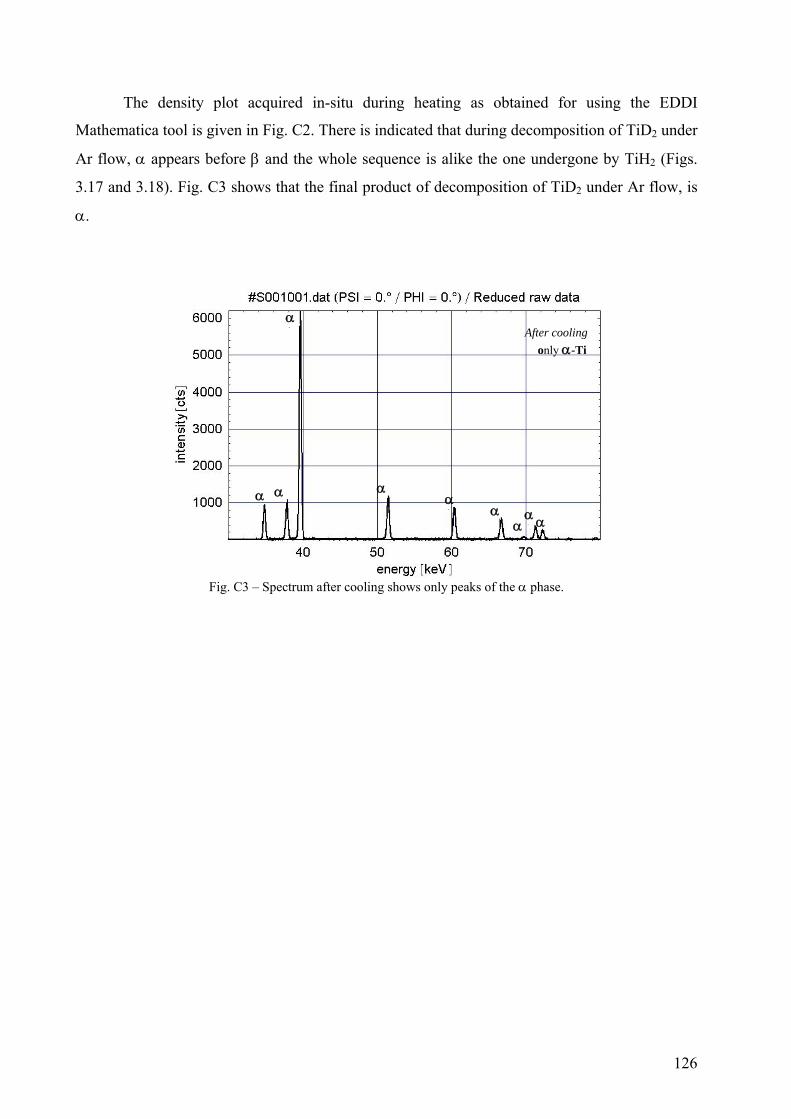
The density plot acquired in-situ during heating as obtained for using the EDDI
Mathematica tool is given in Fig. C2. There is indicated that during decomposition of TiD2 under
Ar flow, α appears before β and the whole sequence is alike the one undergone by TiH2 (Figs.
3.17 and 3.18). Fig. C3 shows that the final product of decomposition of TiD2 under Ar flow, is
α.
αAfter cooling β
only α-Ti
ααα αβ
αβ
αβ
β
ααββ
ββ
Fig. C3 – Spectrum after cooling shows only peaks of the α phase.
126
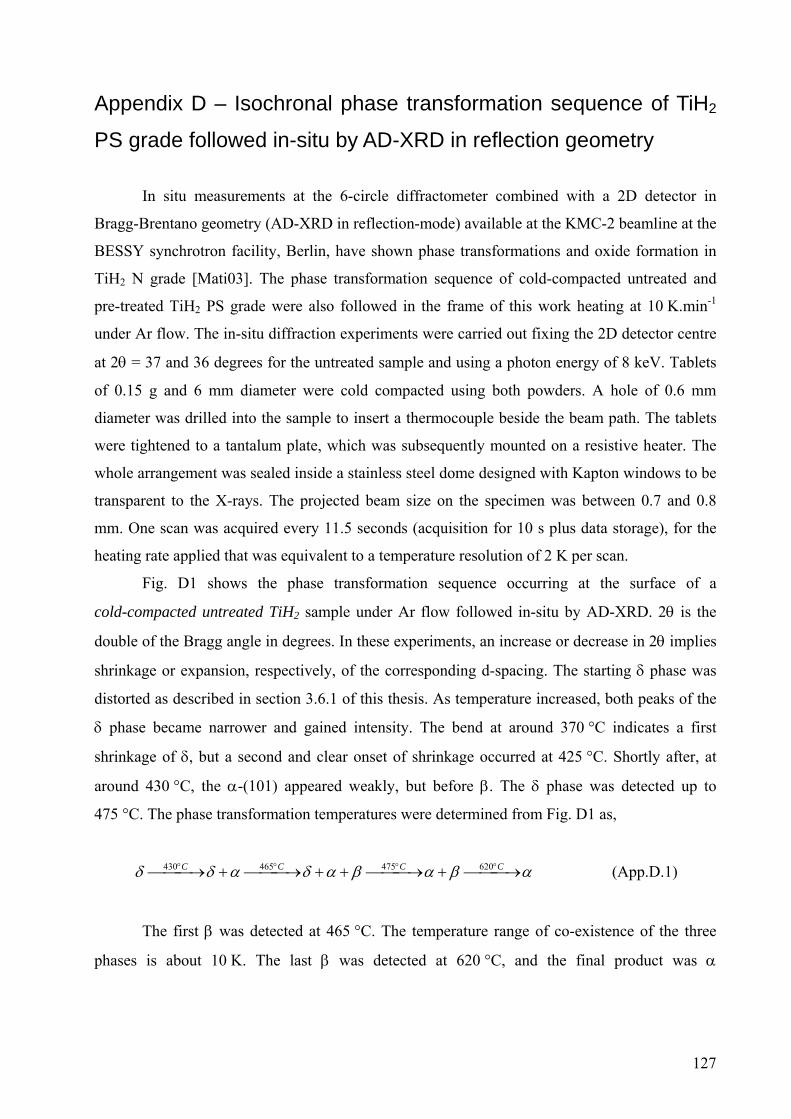
Appendix D – Isochronal phase transformation sequence of TiH2
PS grade followed in-situ by AD-XRD in reflection geometry
In situ measurements at the 6-circle diffractometer combined with a 2D detector in
Bragg-Brentano geometry (AD-XRD in reflection-mode) available at the KMC-2 beamline at the
BESSY synchrotron facility, Berlin, have shown phase transformations and oxide formation in
TiH2 N grade [Mati03]. The phase transformation sequence of cold-compacted untreated and
pre-treated TiH2 PS grade were also followed in the frame of this work heating at 10 K.min-1
under Ar flow. The in-situ diffraction experiments were carried out fixing the 2D detector centre
at 2θ = 37 and 36 degrees for the untreated sample and using a photon energy of 8 keV. Tablets
of 0.15 g and 6 mm diameter were cold compacted using both powders. A hole of 0.6 mm
diameter was drilled into the sample to insert a thermocouple beside the beam path. The tablets
were tightened to a tantalum plate, which was subsequently mounted on a resistive heater. The
whole arrangement was sealed inside a stainless steel dome designed with Kapton windows to be
transparent to the X-rays. The projected beam size on the specimen was between 0.7 and 0.8
mm. One scan was acquired every 11.5 seconds (acquisition for 10 s plus data storage), for the
heating rate applied that was equivalent to a temperature resolution of 2 K per scan.
Fig. D1 shows the phase transformation sequence occurring at the surface of a
cold-compacted untreated TiH2 sample under Ar flow followed in-situ by AD-XRD. 2θ is the
double of the Bragg angle in degrees. In these experiments, an increase or decrease in 2θ implies
shrinkage or expansion, respectively, of the corresponding d-spacing. The starting δ phase was
distorted as described in section 3.6.1 of this thesis. As temperature increased, both peaks of the
δ phase became narrower and gained intensity. The bend at around 370 °C indicates a first
shrinkage of δ, but a second and clear onset of shrinkage occurred at 425 °C. Shortly after, at
around 430 °C, the α-(101) appeared weakly, but before β. The δ phase was detected up to
475 °C. The phase transformation temperatures were determined from Fig. D1 as,
αβαβαδαδδ ⎯⎯ →⎯+⎯⎯ →⎯++⎯⎯ →⎯+⎯⎯ →⎯ °°°° CCCC 620475465430 (App.D.1)
The first β was detected at 465 °C. The temperature range of co-existence of the three
phases is about 10 K. The last β was detected at 620 °C, and the final product was α
127
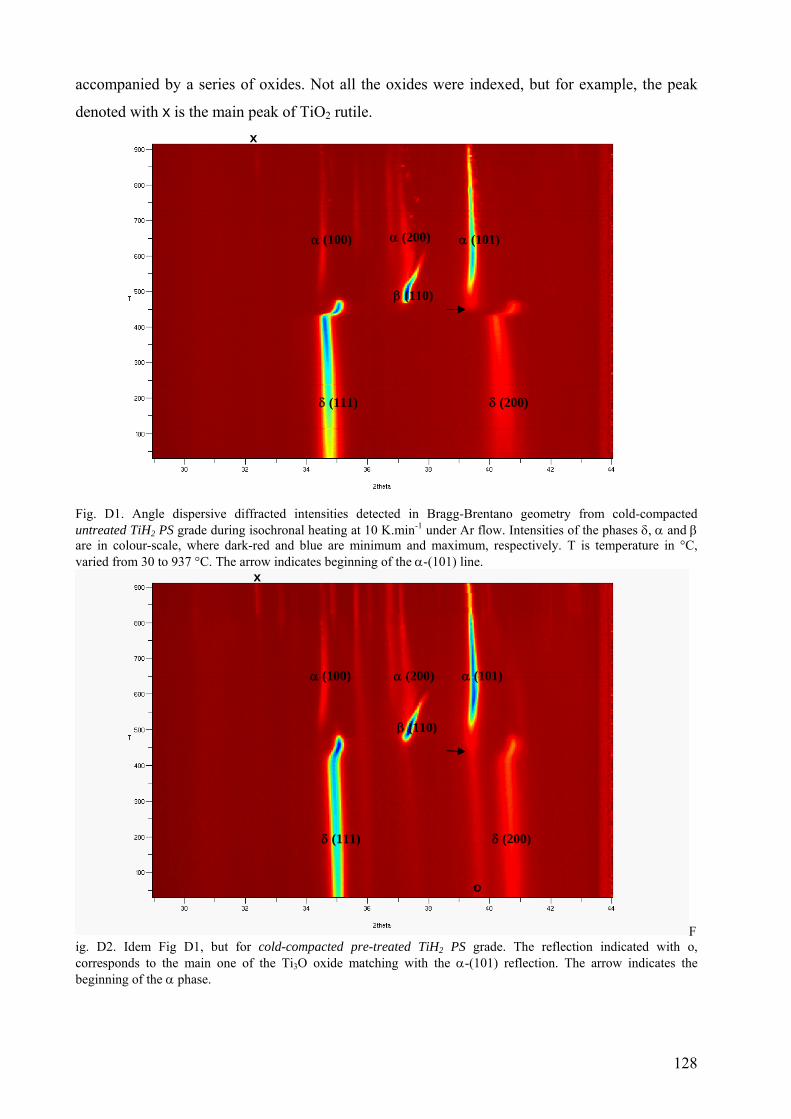
accompanied by a series of oxides. Not all the oxides were indexed, but for example, the peak
denoted with x is the main peak of TiO2 rutile.
Fig. D1. Angle dispersive diffracted intensities detected in Bragg-Brentano geometry from cold-compacted untreated TiH2 PS grade during hronal heating at 10 K.min-1 under Ar flow. Intensities of the phases δ, α and β are in colour-scale, where dark-red and blue are minimum and maximum, respectively. T is temperature in °C, varied from 30 to 937 °C. The arrow indicates beginning of the α-(101) line.
isoc
Fig. D2. Idem Fig D1, but for cold-compacted pre-treated TiH2 PS grade. The reflection indicated with o, correspobeginning
δ (111)
α (100)
x
δ (111)
α (200) α (101)
(110) β
δ (200)
α (100)
x
α (200) α (101)
(110) β
δ (200)
o
nds to the main one of the Ti3O oxide matching with the α-(101) reflection. The arrow indicates the of the α phase.
128
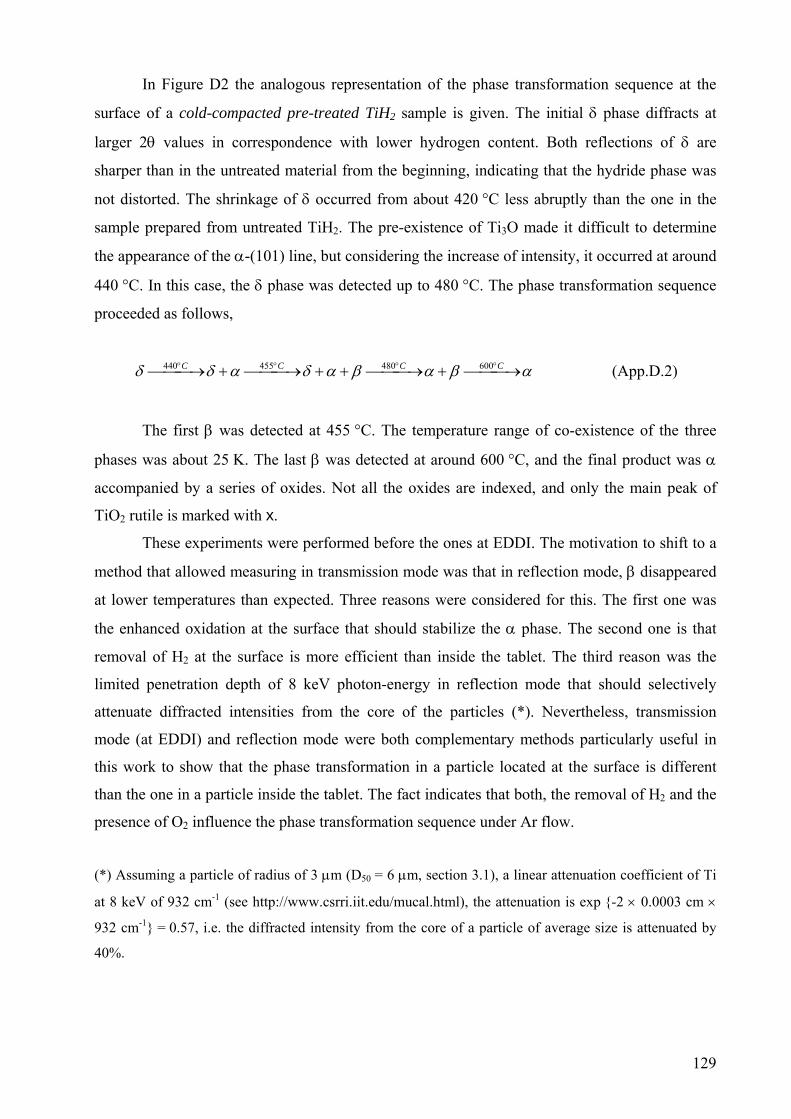
In Figure D2 the analogous representation of the phase transformation sequence at the
surface of a cold-compacted pre-treated TiH2 sample is given. The initial δ phase diffracts at
larger 2θ values in correspondence with lower hydrogen content. Both reflections of δ are
sharper than in the untreated material from the beginning, indicating that the hydride phase was
not distorted. The shrinkage of δ occurred from about 420 °C less abruptly than the one in the
sample prepared from untreated TiH2. The pre-existence of Ti3O made it difficult to determine
the appearance of the α-(101) line, but considering the increase of intensity, it occurred at around
440 °C. In this case, the δ phase was detected up to 480 °C. The phase transformation sequence
proceeded as follows,
last β was detected at around 600 °C, and the final product was α
ccomp
e surface is different
an the one in a particle inside the tablet. The fact indicates that both, the removal of H2 and the
V of 932 cm-1 (see http://www.csrri.iit.edu/mucal.html), the attenuation is exp {-2 × 0.0003 cm ×
32 cm-1} = 0.57, i.e. the diffracted intensity from the core of a particle of average size is attenuated by
40%.
αβαβαδαδδ ⎯⎯ →⎯+⎯⎯ →⎯++⎯⎯ →⎯+⎯⎯ →⎯ °°°° CCCC 600480455440 (App.D.2)
The first β was detected at 455 °C. The temperature range of co-existence of the three
phases was about 25 K. The
a anied by a series of oxides. Not all the oxides are indexed, and only the main peak of
TiO2 rutile is marked with x.
These experiments were performed before the ones at EDDI. The motivation to shift to a
method that allowed measuring in transmission mode was that in reflection mode, β disappeared
at lower temperatures than expected. Three reasons were considered for this. The first one was
the enhanced oxidation at the surface that should stabilize the α phase. The second one is that
removal of H2 at the surface is more efficient than inside the tablet. The third reason was the
limited penetration depth of 8 keV photon-energy in reflection mode that should selectively
attenuate diffracted intensities from the core of the particles (*). Nevertheless, transmission
mode (at EDDI) and reflection mode were both complementary methods particularly useful in
this work to show that the phase transformation in a particle located at th
th
presence of O2 influence the phase transformation sequence under Ar flow.
(*) Assuming a particle of radius of 3 μm (D50 = 6 μm, section 3.1), a linear attenuation coefficient of Ti
at 8 ke
9
129
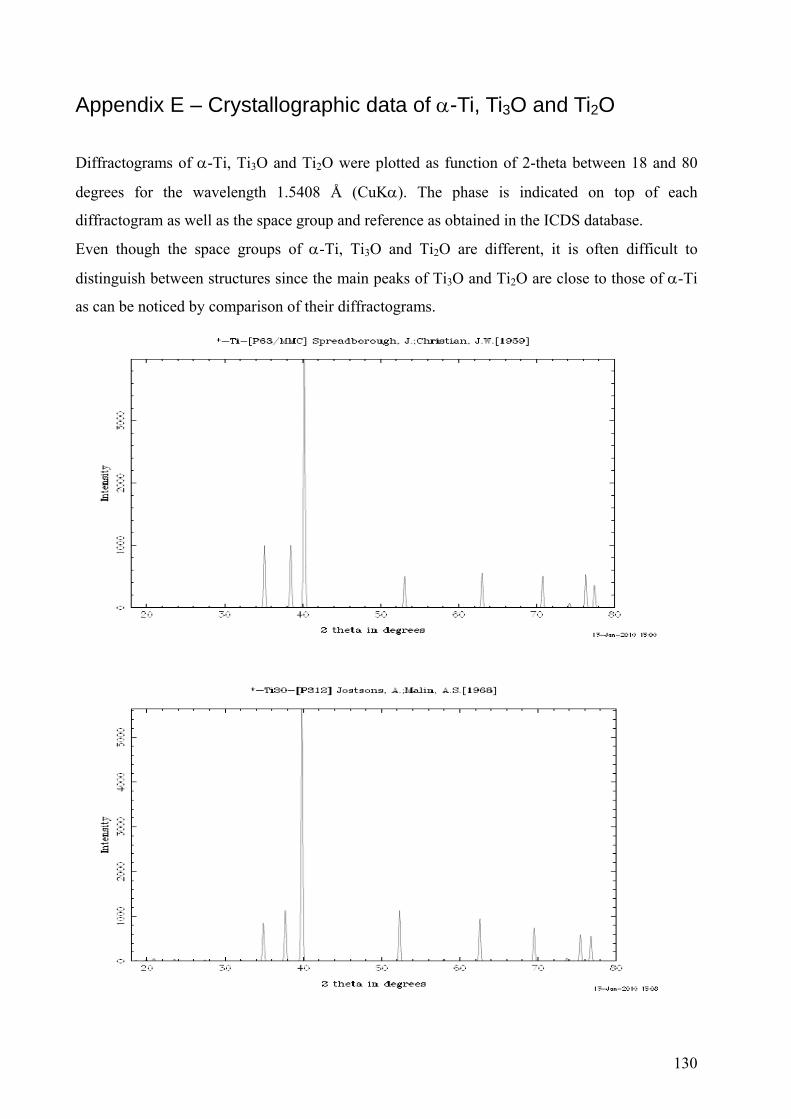
Appendix E – Crystallographic data of α-Ti, Ti3O and Ti2O
Diffractograms of α-Ti, Ti3O and Ti2O were plotted as function of 2-theta between 18 and 80
degrees for the wavelength 1.5408 Å (CuKα). The phase is indicated on top of each
diffractogram as well as the space group and reference as obtained in the ICDS database.
Even though the space groups of α-Ti, Ti3O and Ti2O are different, it is often difficult to
distinguish between structures since the main peaks of Ti3O and Ti2O are close to those of α-Ti
as can be noticed by comparison of their diffractograms.
130
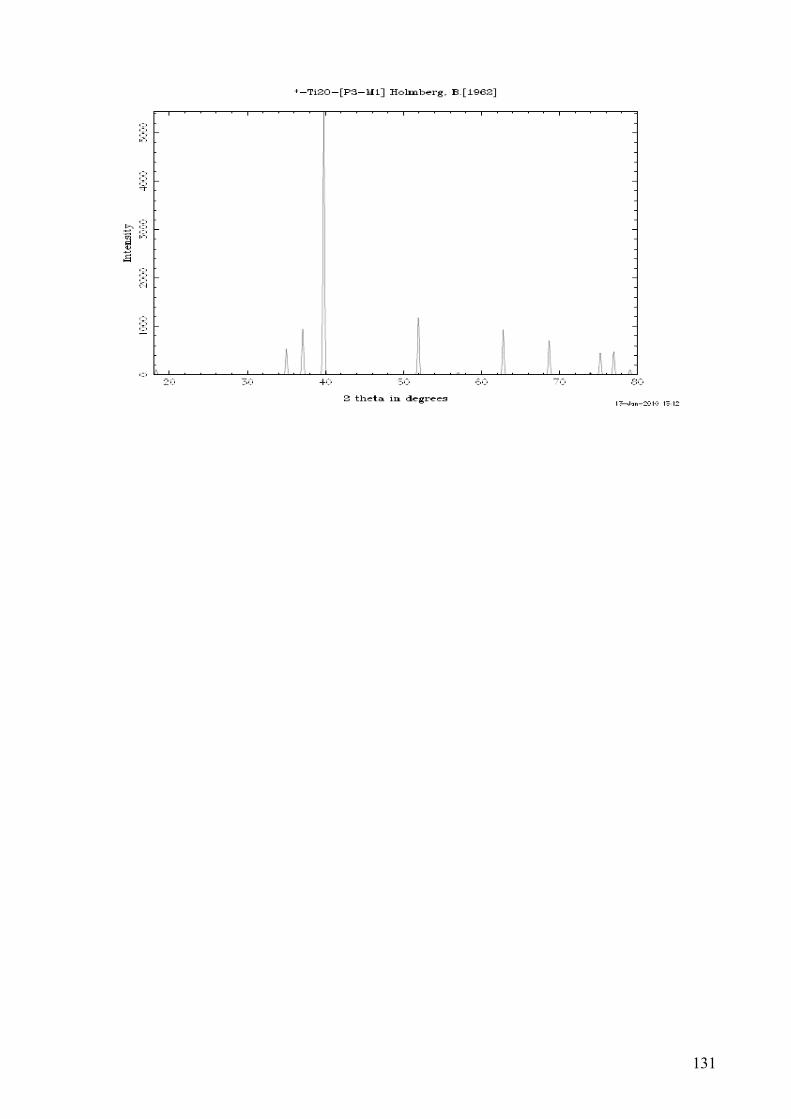
131