Embed Size (px)
Citation preview

Characterization and Molecular Profiling of PSEN1Familial Alzheimer’s Disease iPSC-Derived NeuralProgenitorsAndrew A. Sproul1*, Samson Jacob1, Deborah Pre2, Soong Ho Kim3, Michael W. Nestor1,
Miriam Navarro-Sobrino4, Ismael Santa-Maria2, Matthew Zimmer1, Soline Aubry2, John W. Steele3,
David J. Kahler1, Alex Dranovsky4, Ottavio Arancio2, John F. Crary2, Sam Gandy3,5, Scott A. Noggle1*
1 The New York Stem Cell Foundation, New York, New York, United States of America, 2 Department of Pathology & Cell Biology and the Taub Institute for Research on
Alzheimer’s Disease and the Aging Brain, Columbia University, New York, New York, United States of America, 3 Departments of Neurology and Psychiatry and the
Alzheimer’s Disease Research Center, Icahn School of Medicine at Mount Sinai, New York, New York, United States of America, 4 Department of Psychiatry, Columbia
University, New York, New York, United States of America, 5 James J Peters Veterans Administration Medical Center, Bronx, New York, United States of America
Abstract
Presenilin 1 (PSEN1) encodes the catalytic subunit of c-secretase, and PSEN1 mutations are the most common cause of earlyonset familial Alzheimer’s disease (FAD). In order to elucidate pathways downstream of PSEN1, we characterized neuralprogenitor cells (NPCs) derived from FAD mutant PSEN1 subjects. Thus, we generated induced pluripotent stem cells (iPSCs)from affected and unaffected individuals from two families carrying PSEN1 mutations. PSEN1 mutant fibroblasts, and NPCsproduced greater ratios of Ab42 to Ab40 relative to their control counterparts, with the elevated ratio even more apparentin PSEN1 NPCs than in fibroblasts. Molecular profiling identified 14 genes differentially-regulated in PSEN1 NPCs relative tocontrol NPCs. Five of these targets showed differential expression in late onset AD/Intermediate AD pathology brains.Therefore, in our PSEN1 iPSC model, we have reconstituted an essential feature in the molecular pathogenesis of FAD,increased generation of Ab42/40, and have characterized novel expression changes.
Citation: Sproul AA, Jacob S, Pre D, Kim SH, Nestor MW, et al. (2014) Characterization and Molecular Profiling of PSEN1 Familial Alzheimer’s Disease iPSC-DerivedNeural Progenitors. PLoS ONE 9(1): e84547. doi:10.1371/journal.pone.0084547
Editor: David R. Borchelt, University of Florida, United States of America
Received August 10, 2013; Accepted November 15, 2013; Published January 8, 2014
Copyright: � 2014 Sproul et al. This is an open-access article distributed under the terms of the Creative Commons Attribution License, which permitsunrestricted use, distribution, and reproduction in any medium, provided the original author and source are credited.
Funding: This work is generously supported by grants to Scott Noggle by Charles Evans Foundation, Alzheimer9s Drug Discovery Foundation, and NYCommunity Trust. Scott Noggle and Sam Gandy are jointly supported by National Institutes of Health (NIH) grants R21AG042965 and 1U01AG046170-01, and theCure Alzheimer’s Fund. Ottavio Arancio is supported by NIH grant NS049442. Alex Dranovsky is supported by NIH grant R01MH091844. Soong Ho Kim issupported by the BrightFocus Foundation. The authors express their sincerest gratitude to the patients and staff of the Taub Institute for Research on Alzheimer’sDisease & the Aging Brain at Columbia University (P50AG08702, RO1AG037212, P01AG07232). The funders had no role in study design, data collection andanalysis, decision to publish, or preparation of the manuscript.
Competing Interests: The authors have declared that no competing interests exist.
* E-mail: [email protected] (AAS); [email protected] (SAN)
Introduction
Although the majority of Alzheimer’s disease (AD) cases are late
onset and likely result from a mixture of genetic predisposition and
environmental factors, there are autosomal dominant genetic
forms of the disease that affect patients at much earlier ages (FAD).
Known familial early-onset genes include mutations in amyloid
precursor protein (APP), presenilin-1 (PSEN/PS1), and presenilin-2
(PSEN2/PS2)[1]. PSEN1 mutations are responsible for the most
common form of inherited AD and are 100% penetrant [1–3].
The most prevalent theory for the underlying cause of AD is the
‘‘amyloid hypothesis’’, in which toxic oligomerogenic forms of Ab,
a cleavage product of APP, accumulate and cause neuronal
dysfunction and cell death [4]. PS1/PS2 are key components of
the c-secretase complex that mediates one of the two APP cleavage
events, and mutations in PS1 increase the relative ratios of the
more oligomerogenic Ab species (i.e. Ab42) to less oligomerogenic
species (Ab40).
Most investigation of the molecular phenotypes caused by the
PSEN1 mutations has focused on this microheterogeneous
cleavage at the carboxy terminus of Ab. This qualitative change
is believed to be associated with hypomorphism in processivity [5]
and has implications for misprocessing of multiple substrates other
than APP [6]. Further, the magnitude of the mutant PSEN1-
associated perturbations of Ab42:Ab40 varies widely, and, in some
mutations (e.g., PSEN1 L271V in the Tas-1 family;[7]) alterations
in the Ab42:Ab40 ratio have been either minimal or difficult to
demonstrate. This raises the possibility that PS1 could have
physiological or pathological effects independent of its effects on
APP processing. This is an important issue to investigate
thoroughly since PSEN1 mutations are present in virtually all of
the cell- and mouse-based models used to develop hypotheses and
treatments for common, sporadic AD. However, in common,
sporadic AD, no PSEN1 mutation is present. Indeed, PSEN1-
mutation-related AD is conceived as a disease of Ab anabolism
while at least some forms of common, sporadic AD (i.e., that
linked to APOE4;[8]) are conceived as a disease of Ab catabolism.
Other genes linked to common, sporadic AD (e.g., CR1) appear to
act via the immune response and may modulate cerebral
amyloidosis in unexpected ways [9].
Recently several groups have generated human iPSC or
transdifferentiation models of AD, with studies primarily focused
PLOS ONE | www.plosone.org 1 January 2014 | Volume 9 | Issue 1 | e84547

on FAD neurons [10–13]. None of these studies addressed
whether there are any differences between AD and control NPCs
prior to neuronal differentiation. NPCs are a potentially relevant
system to study aspects of disease on neuronal differentiation.
Some FAD mouse models demonstrate deficits in neurogenesis as
the animals age, and NPCs taken from AD brains of recently
deceased patients have decreased neurogenic potential in com-
parison to those from similarly aged healthy controls [14,15].
Newly born adult neurons in mouse models of AD have also been
reported to have significantly decreased viability relative to control
mice [16]. In addition, the brains of early-onset Alzheimer’s
patients might have developmental alterations that could affect the
progression of the disease. This possibility has been recently
speculated in response to a report that young adults from the
Colombian FAD kindred (PS1 E280A) have changes in grey
matter and synaptic function potentially prior to formation of Abplaques [17](http://dx.doi.org/10.1016/S1474-4422(12)70256-9).
NPCs are also a more homogenous population that might reduce
the experimental variability of mature neurons produced by
current neuronal differentiation protocols, and thus could be a
better system to identify novel molecules potentially important for
early events in AD. We used gene expression profiling (GEP) of
this population to identify novel candidate genes and confirmed
hits in brains from common, sporadic AD with advanced or
intermediate pathology by qPCR and by comparison to published
transcriptomes of laser captured microdissected (LCM) cortical
neurons from brains with AD pathology.
Results
Generation of iPSC LinesIn order to create PSEN1 mutant and wild-type control iPSC
lines, established fibroblast lines were obtained from the cell bank
repository at the Coriell Institute (Camden, NJ). Non-EBV
transformed fibroblast lines were selected from the ‘‘Canadian’’
(FAD1, A246E PS1 mutation) and the ‘‘Italian’’ (FAD4, M146L
PS1 mutation) EOFAD kindreds. Heterozygosity in the PSEN1
locus was confirmed in AD patients for fibroblasts (data not shown)
and subsequently derived iPSCs via sequencing (Fig 1A). Fibro-
blast lines were reprogrammed using four high-titer retroviral
constructs prepared by the Harvard Gene Therapy Core Facility
that encoded human Oct4, KLF4, SOX2 and c-Myc, respectively
[18]. iPSC colonies were initially selected by morphology,
passaged several times to remove transformed cells, and expanded
before characterization.
Characterization of iPSCsAfter iPSCs were expanded to multi-well format, they were
characterized using a variety of quality control assays. Initial
characterization included the presence of alkaline-phosphatase
(AP) enzymatic activity, immunostaining for pluripotency markers,
and qPCR for both endogenous pluripotent markers and viral
transgene silencing. An example of initial characterization of one
line (7768C) is shown in Fig S1. Cell lines with insufficient
transgene silencing were not further analyzed.
Selection and Further Characterization of Core Set ofiPSC Lines
We selected 8 iPSC lines, including one unrelated control iPSC
line 11C [19] to serve as a core set for the majority of our
experiments (Table 1, Fig S1,S2). All data utilizing the core set
shows the same order of cell lines as in Table 1. The best transgene
shutoff and endogenous expression of stem cell genes were used as
the main criteria in clone selection. In addition, core set candidates
were also karyotyped (e.g. Fig S1C) and fingerprinted (Cell Line
Genetics; data not shown) to ensure that they matched the
parental fibroblast line. Unfortunately, five iPSC clones from two
patients from the FAD1 family harbored chromosomal mutations
of various types (data not shown). Since we were unable to obtain a
karyotypically normal iPSC line from the FAD1 family, we
decided to use clone 6842A that had a balanced translocation,
t(17(q22.3),19(q13.4)). Many individuals harbor balanced translo-
cations without issue [20]. In addition, for one FAD4 control
individual (7889) and one FAD4 AD patient (8446), we selected
two clones for further study, in order to test for the possible effects
of random transgene insertion. Determination that iPSC clones
from each patient were independent as defined by different viral
integration sites was determined by Southern blotting (Fig S2).
Integration events were analyzed for two different transgenes:
Oct4 and Klf4.
In vitro pluripotency of core lines was demonstrated by
undirected differentiation of iPSCs into embryoid bodies and
subsequent immunostaining of frozen sections for germ-layer
specific markers for each of the three developmental germ layers
(Fig S2). For cell line 7768C, we also established in vivo
pluripotency via subcutaneous injection of undifferentiated iPSCs
within a matrigel matrix into the dorsal flank of NSG immune-
compromised mice (Jackson Laboratory). As shown in Fig S1, the
ability to form three germ layers was assessed using hematoxylin
and eosin (H&E) staining of paraffin-embedded sections of
resulting teratomas. Observed tissues include: glandular epithelia,
indicating the presence of endoderm; bone and cartilage,
indicating differentiation of mesoderm lineages; and neural
epithelia, including areas with retinal pigmented epithelium,
indicating competence of differentiation towards ectodermal
lineages.
Analysis of APOE GenotypeAPOE isotype is the most common identified risk factor
associated with late-onset AD and could potentially influence
observed phenotypes [1]. APOE genotype was determined by
standard restriction fragment length polymorphism method [21]. 7
of 8 lines in our core set are APOE e3/e3, the reference genotype
(Table 1). One line, 7768C is APOE e3/e4, and thus harbors both
one PS1 A246E early-onset familial AD deterministic allele and
one late-onset AD risk allele.
Neuronal Differentiation of iPSC LinesIn order to investigate PSEN1 and control NPCs, we
differentiated cells by a monolayer method and analyzed cells at
different time points during this process. As shown in Fig 1B in
cartoon form, iPSCs were plated as single cells, allowed to recover,
and subsequently neuralized by inhibition of both branches of
TGFb signaling pathways (dual-SMAD inhibition, also see Fig
S6)[22]. Inhibition of TGFb pathways is sufficient to induce
anterior neural fates from pluripotent cells [23]. To look at a
mixture of mostly NPCs and a minority of early-born neurons, we
assessed our cell lines at Day 14 post dual-SMAD inhibition.
There was a significant difference in the amount of CD56+(NCAM) PSEN1 cells as compared to control cells as measured by
flow cytometry (FCM) of live cells as determined by forward
scatter plot (26% vs. 15%, p = 0.02, Student’s t-Test, Fig 1C).
Although CD56+ expression is often used to identify neuronal
populations by FCM, it is also expressed in some nestin-positive
progenitors [24]. At day 14 of neuronal differentiation there were
no NeuN+ cells, a more mature neuronal marker (data not shown).
However, there were small patches of Tuj1+ cells with more
PSEN1 Alzheimer Disease NPC Model
PLOS ONE | www.plosone.org 2 January 2014 | Volume 9 | Issue 1 | e84547

complex neurite morphology, which appeared to be more
prevalent on average in PSEN1 cells (Fig S1).
The largest proportion of cells at this time point was nestin-
positive NPCs (Fig 1D, E). PSEN1 lines had a small but statistically
significant increase in the percentage of nestin-positive cells
compared to control lines (79% vs. 71%, p = 0.012, Student’s
t-Test). A significant proportion of cells were in cell cycle as
measured by Ki67 staining (Fig 1F, G; average for 8 lines: 33%),
which was not statistically different between PSEN1 genotypes.
Figure 1. iPSC Characterization and Neuronal Differentiation. A. Sequencing of core set iPSCs for PSEN1 mutations in exon 5 (M146L) andexon 8 (A246E) respectively. * marks site of the mutations. B. Cartoon of neuronal differentiation scheme, showing timing and changes into differentmedias as described in Fig S6. C. All 8 core lines were neuronally differentiated for 14 days and were analyzed by flow cytometry for the expression ofCD56 (NCAM). The aggregate result of three independent experiments is shown. PSEN1 cells have a small but statistically significant increase inNCAM+ surface expression (control vs. PSEN1, n = 12 for each genotype, p = 0.02, Student’s t-Test, error bars reflect SEM). D. Representativeimmunostaining for the neural progenitor marker nestin in iPSC line 8446B. Nestin is in green, DNA is in blue. E. Quantification of nestin staining foraggregate data from two independent experiment, with 3 biological replicates for the 8 core lines in each experiment. For control vs. PSEN1, n = 8 foreach genotype, p = 0.02 (Student’s t-Test, error bars reflect SEM). F. Representative immunostaining for the cell cycle marker Ki67 in cell line 7889O.ki67 is in green, DNA is in blue. G. Quantification of ki67 staining for aggregate data from three independent experiments, with 3 biological replicatesfor the 8 core lines in each experiment. See also Fig S1.doi:10.1371/journal.pone.0084547.g001
PSEN1 Alzheimer Disease NPC Model
PLOS ONE | www.plosone.org 3 January 2014 | Volume 9 | Issue 1 | e84547

NPCs Have the Capacity to Make Electrically-ActiveNeurons
We wished to establish that our NPCs were capable of making
mature neurons that had electrical signaling properties similar to
primary neurons. Thus, we recorded electrophysiogical properties
from 375 cells that had been neuronally differentiated 35 to 55
days from control iPSC line 7889O and 87 cells from PS1 iPSC
line 8446B. Cells differentiated into mature neurons as shown by
the presence of fast inward currents due to the Na+ channels
opening after depolarization with a series of 10 mV voltage steps
from 290 mV (Fig 2A) and their ability to produce action
potentials upon stimulation with a depolarizing current, as shown
for 7889O (Fig 2B,C) and 8446B (Fig 2D).
As further evidence of maturation, 7889O cells exhibited a
single action potential following depolarizing current injection at
45 days, while at 55 days they responded with a repetitive AP
firing pattern and a rebound action potential after a hyperpolar-
izing current pulse (Fig 2C). A similar evolution was observed with
8446B cells, as shown by the presence of multiple action potentials
in Fig 3D. Both inward currents and action potentials were
blocked by perfusion with 1 mM tetrodotoxin (TTX, Fig 2A,B),
indicating that the currents were due to activation of Na+
channels. Furthermore, the K+ channel blocker tetraethylammo-
nium (TEA) cancelled the long lasting outward current after the
fast inward current, suggesting the presence of K+ channels. At
Day 55, 60% of cells were capable of firing trains of action
potentials, and 13% had ‘‘rebound’’ action potentials at the end of
hyperpolarizing current injections (Fig 2B,C).
We also assessed electrical activity by looking at Ca2+ activity.
Ca2+ transients are used by neurons to regulate cellular
homeostasis by modulating activity-dependent gene expression,
controlling neurotransmitter release, and regulating membrane
excitability [25]. Therefore, we asked whether our neurons
displayed normal Ca2+ transients that were sensitive to TTX.
To measure cytosolic Ca2+, we preloaded neuronally differentiated
(45 days) iPSC line 7889O with Fluo-4NW and recorded
spontaneous Ca2+ spikes during a two-minute interval (Fig 2E).
We selected a 500 mM-by-500 mM imaging area in each dish of
cells (N = 5 dishes), which yielded an average of 34.5 cells per
imaging window. Of these cells, 13.2 cells, or approximately 40%
rendered measureable Ca2+ spikes. We observed a spike frequency
of about 0.8 Hz, with an average inter-event interval of 0.045 Hz,
approximating what has been observed in both cultured cortical
neurons and neurons derived from human iPSCs [26]. After
application of 1 uM TTX for 5 minutes, the number of cells that
displayed measurable spontaneous Ca2+ activity decreased to
about 19%, and of those, only a few demonstrated at least one
event during the 2-minute imaging time-window. Of the few cells
that did show a Ca2+ transient, the kinetics were generally slower,
again mirroring what has been observed in cultured cortical
neurons [27].
Ab ProductionAfter establishing the authenticity of our functional NPC model,
we next wished to investigate protein processing associated with
PS1 function and dysfunction. According to the amyloid
hypothesis, oligomerized Abpeptides are responsible for aberrant
synaptic plasticity and cellular toxicity [4]. Fibroblasts from PSEN1
mutant patients have been observed to produce an increased ratio
of Ab42/Ab40, thus enhancing the relative levels of the more
oligomerogenic Ab peptide [28,29]. In congruence with these
earlier studies, we also observed an increase in the ratio of Ab42/
Ab40 secreted by human fibroblasts via analysis of conditioned
media by ELISA (data not shown and Fig 3B). We then looked at
Abproduction in NPCs/early neurons (14-day differentiation)
where this parameter has not been previously assessed. The Ab42/
Ab40 ratio was also increased in conditioned media from PSEN1
NPCs and early neurons as compared to control lines (Fig 3A).
Ab42/Ab40 ratio between PSEN1 and control cells appeared to
increase in magnitude following neuronal differentiation (Fig 3B),
similar to what has been reported for transdifferentiated PSEN1
neurons [12]. The amount of total Ab produced from control and
PSEN1 fibroblasts or NPCs were statistically equivalent (Fig 3C),
indicating that APP processing is altered in PSEN1 cells in terms of
quality rather than quantity. Many mutant PS1 proteins have been
shown to be hypomorphic [30]; i.e., the total number of moles of
both Abspecies generated per mole of APP catabolized. Similar to
what has been found in numerous studies in other cell types [31], a
c-secretase inhibitor (10 mM DAPT) was sufficient to block
Abproduction in both control and PS1 cells (Fig S3).
Gene Expression Profiling (GEP) Comparison for ControlVersus PS1 NPCs
Having established that we could successfully model the
molecular pathology of FAD in our PSEN1 NPCs, we further
defined their gene expression via global gene expression studies.
The purpose of this approach was threefold: 1) Further
characterization of PSEN1 NPCs, including additional analysis of
their neurogenic potential; 2) Identification of molecules that
might have a developmental and/or amyloid-independent role in
the pathogenesis of FAD; 3) Attempt to find molecules that might
also be misregulated in late-onset AD. Thus, we performed GEP
experiments on both undifferentiated and 14-day neuronally
differentiated control and PSEN1 NPCs using the Illumina
HumanHT-12-14 BeadChip platform. The results were analyzed
using Genome Studio software, and genes were considered
differentially expressed if DiffScores were greater than 13 or less
than -13 (p = 0.05).
For undifferentiated iPSCs, six lines were used: 7889O, 11C,
6842A, 8446B, 7671C, and 7768C (representing all six patients in
our core set; 1 sample per line). There was only one differentially
expressed gene between 3 control and 3 PSEN1 lines, NLRP2.
However, after neuronal differentiation into NPCs there was a
significant increase in gene expression differences. RNA from all 8
core lines was amplified and run in triplicate. 22 of 24 samples
were independent biological replicates, while 2 were technical
replicates. Control and PS1 cells did not segregate by genotype
(Fig 4A) and when 4 control lines were compared to 4 PSEN1 lines,
the majority of genes have overall similar expression as shown by
scatter plot (Fig 4B, correlation coefficient 0.94). Importantly,
Table 1. Core set of iPSC Lines.
Line Family Sex Age PSEN1 APOE
7889O FAD4 M 18 WT e3/3
7889B " " " " "
11C N/A M 36 WT e3/e3
6842A FAD1 M 75 WT e3/e3
8446B FAD4 M 38 M146L e3/e3
8446D " " " " "
7671C FAD1 M 44 A246E e3/e3
7768C FAD1 F 31 A246E e3/e4
See also Fig S2.doi:10.1371/journal.pone.0084547.t001
PSEN1 Alzheimer Disease NPC Model
PLOS ONE | www.plosone.org 4 January 2014 | Volume 9 | Issue 1 | e84547

Figure 2. Action potentials and normal spontaneous Ca2+ transients are present in neurons differentiated from control line 7889Oand 8446. A. Representative traces in voltage clamp mode showing fast inward currents followed by long-lasting outward currents. Voltage 10 mVsteps are shown in the upper panel. The inset shows an enlarged view of the inward current. (7899O, day 55). Inward sodium currents and potassiumcurrents were observed on 13 out of the 22 cells analyzed at this time-point. The average Resting Membrane Potential (RMP) was equal to245.94 mV62.77 (standard error, s.e.; n = 17). Following initial recording cells were perfused with 1 mM TTX (tetrodotoxin) to block sodium currents,and subsequently with 10 mM TEA (tetraethylammonium) to block potassium currents. B. Representative action potentials in response to stepcurrent injections of 20 pA (lower panel) in current clamp mode (7889O, day 45). The average RMP was equal to 237.93 mV66.16 (n = 13). Actionpotentials were observed on 4 out of 10 cells analyzed at this time point. Following initial recording the action potential was blocked by perfusingcells with 1 mM TTX. C. Representative action potentials in response to step current injections of 20 pA as in B in current clamp mode (7889O, day 55).They show trains of action potentials upon depolarizing current injection and ‘‘rebound’’ action potentials at the end of hyperpolarizing currentinjections. Action potentials were observed on 13 out of the 22 cells recorded at this timepoint. Out of them, 3 had a rebound action potential like
PSEN1 Alzheimer Disease NPC Model
PLOS ONE | www.plosone.org 5 January 2014 | Volume 9 | Issue 1 | e84547

FAD1 and FAD4 family members also did not segregate by family.
This suggests that related controls might not be more beneficial
than unrelated controls, although sibling or parental controls
might prove more advantageous than the more distant relation-
ships used in this study.
Despite the overall similarity in expression between control and
PSEN1 cells, and the lack of clustering by genotype, utilizing the
DiffScore parameters described above, there were 206 upregulated
genes and 142 downregulated genes in PSEN1 cells relative to
control NPC cultures (Fig 4C). We used DAVID Functional
Annotation on each list to identify relevant gene ontology (GO)
terms (Table S1) [32,33]. Using a threshold minimum of 10 genes
per GO term, we were able to identify 9 GO terms associated with
upregulated genes and 20 GO terms associated with downregu-
lated genes. While some of these terms have overlapping functions,
some striking examples include an increase in genes associated
with inhibition of gene transcription and a downregulation of
apoptosis-related genes (with a notable exception, BIK). Impor-
tantly, GO categories associated with neuronal function did not
appear at this threshold of analysis. Utilizing the DAVID
Functional Clustering Tool with parameters allowing smaller sets
of genes, we were able to detect several neuronal GO term
categories with 4–5 overlapping genes: GFRA3, ISL1, DLX1,
SEMA3B, and ERBB3. Thus, while this supports a subtle increase
in neurogenic potential for PSEN1 NPCs, which would be
consistent with our observation of a small increase in CD56+surface expression (Fig 2C), the overall lack of substantial neuronal
GO categories suggests that gene expression differences between
PSEN1 and control NPCs are not skewed by the minority of early-
born neurons present at day 14 of differentiation.
qPCR Validation of PSEN1 NPC Differentially-RegulatedGenes
We postulated that most positively and negatively regulated
genes in our GEP experiments would be the most potentially
relevant to AD. There were 34 upregulated genes (.3-fold
increase, Diff Score .13) and 6 downregulated genes (.3-fold
elevation in controls, Diff Score ,213) that were attractive
candidates for further validation. We further pruned the
upregulated list to 23 genes by eliminating 11 genes that were
not expressed in control NPCs at statistically detectable levels.
This reduced the potential of a rare minority cell type skewing the
data.
We analyzed the remaining 29 genes in two independent
differentiation experiments utilizing our 8 core cell lines in
biological triplicates for each experiment (Table S2). The average
expression of each of the four controls lines (n = 8, 2 experiments
combined) was compared against the average expression of the
four PSEN1 lines (n = 8, 2 experiments combined). Ten upregu-
lated genes (ASB9, BIK, C7orf16, NDP, NLRP2, PLP1, SLC45A2,
TBX2, TUBB4, ZNF300) and four downregulated genes (ADM2,
FLJ35024, MT2A, PTGS2) were validated by this method
(Student’s t-Test p,0.05). Four additional genes showed an
upregulation trend in PSEN1 NPCs (ABCC2, ECEL1, EGFL8,
FSTL5, SMOC1). We then looked at the expression of three targets
in more detail: NLRP2, ASB9 and NDP.
NLRP2, ASB9, and NDP Expression in NPCsNLRP2 (NALP2) was the only gene differentially regulated in
undifferentiated iPSC GEPs. It is also one of the 10 PSEN1
upregulated genes found in our NPC analysis. NLRP2 is a
component of the inflammasome, a protein complex that activates
pro-inflammatory caspases such as caspase-1 [34,35]. As inflam-
mation has been argued to play a critical role in AD [36], it is
intriguing that a major modulator of inflammatory signaling might
be different in FAD patients from birth. This becomes particularly
interesting in the recent report where crossing of an FAD mouse
model with either NLRP3 or caspase-1 null animals caused
decreased Ab accumulation and significant attenuation of synaptic
and memory deficits [37].
We first confirmed that NLRP2 expression was upregulated in
undifferentiated PSEN1 cells. As shown in Fig 5A, NLRP2 was
expressed at much higher levels in the 4 PSEN1 iPSC lines as well
as control iPSC line 6842A (average 15-fold higher for those 5
lines compared to the other 3 control lines). Similar results were
confirmed in PSEN1 NPCs and 6842A at the mRNA and protein
levels (Fig 5B,C). Interestingly, NLRP2 is located on chromosome
19 at the breakpoint of the balanced translocation (q13.42) present
in iPSC line 6842A.
ASB9 is a broadly expressed E3-ligase that targets creatine
kinase B (CKB) and ubiquitous mitochondrial creatine kinase for
degradation, and stable overexpression of ASB9 reduces mito-
chondrial membrane potential and affects mitochondrial mor-
phology [38,39]. CK activity has been shown to be lower in AD
brains, and creatine has shown to be neuroprotective and is in
clinical trials for multiple neurodegenerative diseases [40]. We
confirmed ASB9 is upregulated over 2.4-fold in PS1 NPCs
(Fig 5D). We were not able to detect ASB9 protein in our cells by
immunostaining or Western blot (data not shown). It is perhaps
not surprising that it might be expressed at low levels due to its
deleterious effects on mitochondrial function.
Mutations in Norrie Disease Pseudoglioma (NDP, protein called
Norrin) are responsible for Norrie disease, an X-linked recessive
disorder, as well as several other rare eye disorders [45]. The
primary manifestation of Norrie Disease is blindness and, in many
cases, progressive hearing loss. In addition, in 30% or more of
patients, mental retardation is also present, suggesting an
important CNS role for NDP. Thus, NDP became an interesting
target for further study, particularly in light of the hypothesis that
FAD might have a developmental component. We confirmed by
qPCR that NDP is in fact upregulated in PSEN1 NPCs (Fig 5E).
The aggregated data from three independent experiments
indicated that NDP was upregulated 5.5 fold in PSEN1 NPCs
(p = 0.0002, Student’s t-Test).
Examination of PSEN1 NPC Differentially-RegulatedGenes in Late Onset AD Brains
We next assessed if the differentially-expressed genes in PSEN1
NPCs could be reflected in brains from AD patients. We only
analyzed late-onset AD brains as we were unable obtain brain
tissue from FAD individuals. In addition, while our iPSC-derived
NPCs may more closely resemble embryonic NPCs or adult NPCs
the one shown on the inset of this panel. D. Representative action potentials in response to step current injections of 20 pA from 8446B, day 55.Trains of action potentials upon depolarizing current injection and ‘‘rebound’’ action potentials at the end of hyperpolarizing current injections arevisible. Action potentials from 8446 cell line were observed on 8 out of the 15 cells recorded at this timepoint. E. (A) Image of 7889O loaded with Fluo-4NW (green) and stained for MAP2 (red) after Ca2+ transients have been recorded. (B) Representative spontaneous Ca2+ spikes recorded from 7889Oneurons before and after application of TTX (N = 54 for control, N = 22 for TTX). Spiking frequency was significantly slower after application of TTX andthe kinetics of each individual spike was slower, suggesting that 7889O cells display normal neuronal Ca2+ transients.doi:10.1371/journal.pone.0084547.g002
PSEN1 Alzheimer Disease NPC Model
PLOS ONE | www.plosone.org 6 January 2014 | Volume 9 | Issue 1 | e84547

Figure 3. Ab42/Ab40 Ratio is Elevated in PSEN1 Cells. All assaysdetected Ab1-40 and 1-42 using ELISA (Wako) on conditioned mediafrom the cell type indicated. Ratios were normalized against the firstcontrol line listed on each panel. Statistical significance was determinedvia Student’s t-Test, error bars reflect SEM. Each n equals an individualcell line (averaged biological triplicates) in 1 independent experiment.A. Ab42/Ab40 ratio is increased in day 14 differentiated NPCs/earlyneurons. Control and PSEN1 NPCs were generated from the core set ofiPSC lines, and one of three independent experiments is shown. Forcontrol compared to PSEN1 NPCs (n = 4 for each genotype), p = 0.003.B–C. Aggregate data is shown from 3 independent fibroblast and 3independent NPCs/early neuron experiments. N = 7 for each fibroblastgenotype data point, and n = 12 for each NPC/early neuron genotypedata point. B. Ab 42/40 ratios are shown for both control and PSEN1fibroblasts and NPCs. For control fibroblasts vs. PSEN1 fibroblast,p = 0.001; for control NPCs vs. PSEN1 NPCs, p = 0.000005; for PSEN1fibroblasts vs. PSEN1 NPCs, p = 0.036. C. Total Ablevels (Ab40 + Ab42) arestatistically similar between control and PSEN1 fibroblasts and NPCs/early neurons. See also Figure S3.doi:10.1371/journal.pone.0084547.g003
Figure 4. Gene Expression Profiling of Control vs. PS1 NPCs/Early Neurons. All 8 core iPSC lines were differentiated for 14 days intriplicate wells, lysed for RNA, amplified to generate cRNA, and ran onthe Illumina HumanHT-12-14 BeadChip platform. A. Clustering of 8 corelines by correlation. UR stands for unrelated control. B. Scatter plot(log scale) of the correlation of gene expression between 4 control linesand 4 PSEN1 lines. The red lines indicate a 3-fold expression difference.C. Chart indicating the number of upregulated (shown in blue) anddownregulated (shown in yellow) genes for each threshold of analysis.‘‘DiffScore’’ refers to genes with a Diff Score of .13 (upregulated) or,13 (downregulated), which indicate a change in expression with apValue of p#0.05, without regard to the relative fold change. Criteriafor fold change categories include the listed fold change as well asstatistical significance. See also Table S1.doi:10.1371/journal.pone.0084547.g004
PSEN1 Alzheimer Disease NPC Model
PLOS ONE | www.plosone.org 7 January 2014 | Volume 9 | Issue 1 | e84547

rather than mature neurons, we hypothesized that some of our
NPC hits might be altered in late-onset AD neuronal populations.
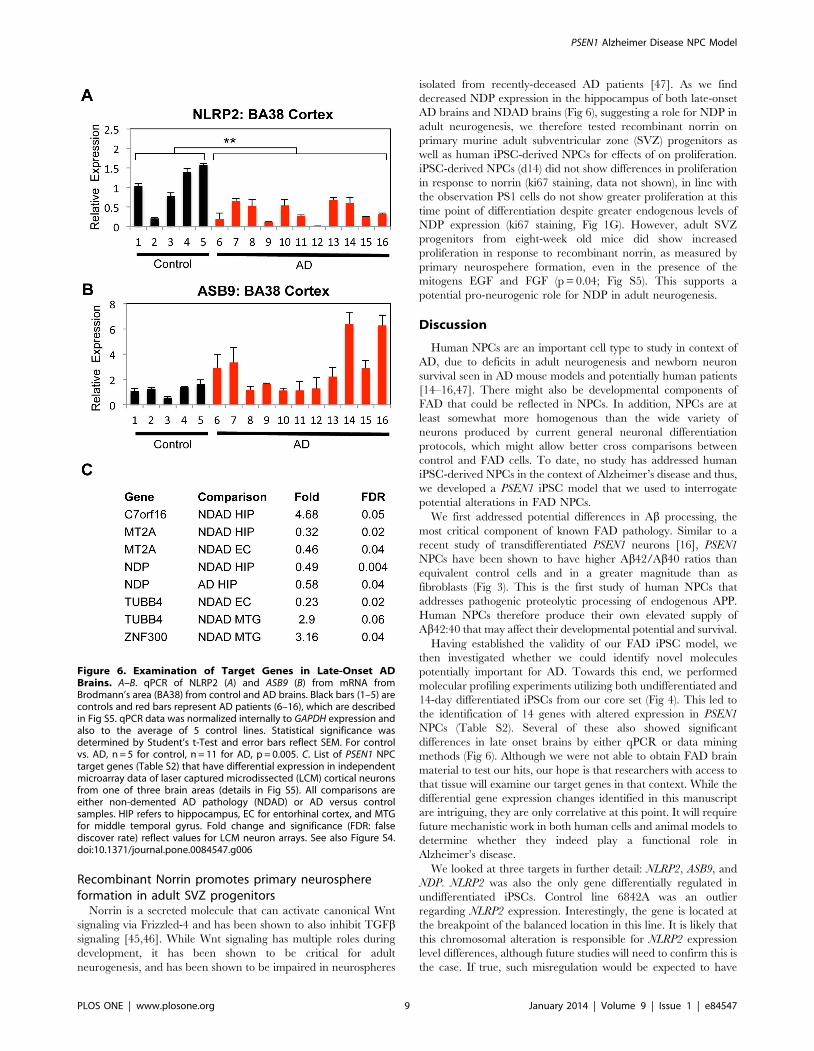
The first approach was to analyze NLRP2, ASB9, and NDP
expression in AD brains by qPCR. mRNA isolated from
Broadmann Area 38 (BA38, temporal pole) of 11 AD and 5
control patients was converted to cDNA and analyzed by qPCR
for NLRP2, ASB9 and NDP. The temporal lobe (including the
temporal pole) is vulnerable in Alzheimer’s disease, particularly in
intermediate stages of the disease [41]. Interestingly, NLRP2
expression was found to be statistically reduced in BA38 of AD
patients, the opposite of our NPC results (38% of levels of controls,
p = 0.005, Student’s t-Test, Fig 6A). ASB9 was elevated in BA38 of
some AD individuals, but was only a trend when looking at all 11
AD patients compared to controls (Fig 6B). NDP expression was
similar between control and AD patients by qPCR, but
intriguingly was present in some neurofibrillary tangles in AD
forebrains (Fig S4).
To further confirm the authenticity of hits, we analyzed
publically available GEPs from laser capture microdissected
(LCM) cortical neurons from control subjects or from patients
with moderate or severe AD pathology [42,43]. Some individuals
displayed intermediate pathology individuals but without sufficient
clinical criteria to be labeled as having AD; these cases were
designated ‘‘non-demented individuals demonstrating AD pathol-
ogy’’ (NDAD). We used our list of 14 differentially expressed genes
to interrogate GEPs of hippocampus, entorhinal cortex (EC), and
the middle temporal gyrus (MTG) from NDAD individuals and
hippocampus from AD patients. Gene expression from these
regions had already been compared to brain regions from age-
matched control patients (Fig S6), and thus one could determine
whether the genes misregulated in mutant PSEN1 NPCs were
similarly misregulated in early stages of AD pathology in
vulnerable brain areas.
Five target genes had statistically altered expression in AD/AD
pathology brains (Fig 6C). C7orf16 (PPP1R17) and ZNF300, which
are elevated in PSEN1 NPCs, were also found to be more highly
expressed in NDAD hippocampi and NDAD MTG respectively.
One caveat is that C7orf16 was expressed at very low levels. MT2A,
which has reduced expression in PSEN1 NPCs, was also expressed
at significantly lower levels in NDAD hippocampi and EC.
Interestingly, two other metallothionein proteins, MT1A and
MT1F, were also significantly reduced in our GEP of PSEN1
NPCs. Some studies report that MTs may attenuate Ab toxicity
[44]. On the other hand, NDP, which is elevated in PSEN1 NPCs,
is significantly lower in both NDAD and AD hippocampi. The
situation with TUBB4 (elevated in PSEN1 NPCs) is more complex,
as it is lower in NDAD EC, but increased as a trend in NDAD
MTG. There was a trend toward upregulation of ASB9, although
this did not reach statistical significance. While NLRP2 itself was
not differentially regulated in the brain regions analyzed, its
homologue NLRP1 was downregulated in MTG of brains
designated NDAD (37%, p = 0.00005). Overall, our data support
the hypothesis that at least some of our hits of genes differentially
regulated in FAD NPCs are also differentially regulated in AD
brains.
Figure 5. Validation of Target Genes in PSEN1 NPCs. All qPCR data was normalized internally to GAPDH expression and also to cell line 7889O.Statistical significance was determined by Student’s t-Test and error bars reflect SEM. A–B. NLRP2 mRNA expression was assessed in undifferentiatediPSCs (control vs. PSEN1, n = 4 for each genotype, p = 0.016) and NPCs (control vs.PSEN1, n = 4 for each genotype, p = 0.03). C. Western blot analysis ofNLRP2 protein expression in NPCs. a-Tubulin was used as a loading control D. Representative experiment showing ASB9 mRNA expression in NPCs.For control vs. PSEN1, n = 4 for each genotype, p = 0.03. E. Representative experiment showing NDP mRNA expression in NPCs. For control vs. PSEN1,n = 4 for each genotype, p = 0.005. See also Table S2.doi:10.1371/journal.pone.0084547.g005
PSEN1 Alzheimer Disease NPC Model
PLOS ONE | www.plosone.org 8 January 2014 | Volume 9 | Issue 1 | e84547
Recombinant Norrin promotes primary neurosphereformation in adult SVZ progenitors
Norrin is a secreted molecule that can activate canonical Wnt
signaling via Frizzled-4 and has been shown to also inhibit TGFbsignaling [45,46]. While Wnt signaling has multiple roles during
development, it has been shown to be critical for adult
neurogenesis, and has been shown to be impaired in neurospheres
isolated from recently-deceased AD patients [47]. As we find
decreased NDP expression in the hippocampus of both late-onset
AD brains and NDAD brains (Fig 6), suggesting a role for NDP in
adult neurogenesis, we therefore tested recombinant norrin on
primary murine adult subventricular zone (SVZ) progenitors as
well as human iPSC-derived NPCs for effects of on proliferation.
iPSC-derived NPCs (d14) did not show differences in proliferation
in response to norrin (ki67 staining, data not shown), in line with
the observation PS1 cells do not show greater proliferation at this
time point of differentiation despite greater endogenous levels of
NDP expression (ki67 staining, Fig 1G). However, adult SVZ
progenitors from eight-week old mice did show increased
proliferation in response to recombinant norrin, as measured by
primary neurospehere formation, even in the presence of the
mitogens EGF and FGF (p = 0.04; Fig S5). This supports a
potential pro-neurogenic role for NDP in adult neurogenesis.
Discussion
Human NPCs are an important cell type to study in context of
AD, due to deficits in adult neurogenesis and newborn neuron
survival seen in AD mouse models and potentially human patients
[14–16,47]. There might also be developmental components of
FAD that could be reflected in NPCs. In addition, NPCs are at
least somewhat more homogenous than the wide variety of
neurons produced by current general neuronal differentiation
protocols, which might allow better cross comparisons between
control and FAD cells. To date, no study has addressed human
iPSC-derived NPCs in the context of Alzheimer’s disease and thus,
we developed a PSEN1 iPSC model that we used to interrogate
potential alterations in FAD NPCs.
We first addressed potential differences in Ab processing, the
most critical component of known FAD pathology. Similar to a
recent study of transdifferentiated PSEN1 neurons [16], PSEN1
NPCs have been shown to have higher Ab42/Ab40 ratios than
equivalent control cells and in a greater magnitude than as
fibroblasts (Fig 3). This is the first study of human NPCs that
addresses pathogenic proteolytic processing of endogenous APP.
Human NPCs therefore produce their own elevated supply of
Ab42:40 that may affect their developmental potential and survival.
Having established the validity of our FAD iPSC model, we
then investigated whether we could identify novel molecules
potentially important for AD. Towards this end, we performed
molecular profiling experiments utilizing both undifferentiated and
14-day differentiated iPSCs from our core set (Fig 4). This led to
the identification of 14 genes with altered expression in PSEN1
NPCs (Table S2). Several of these also showed significant
differences in late onset brains by either qPCR or data mining
methods (Fig 6). Although we were not able to obtain FAD brain
material to test our hits, our hope is that researchers with access to
that tissue will examine our target genes in that context. While the
differential gene expression changes identified in this manuscript
are intriguing, they are only correlative at this point. It will require
future mechanistic work in both human cells and animal models to
determine whether they indeed play a functional role in
Alzheimer’s disease.
We looked at three targets in further detail: NLRP2, ASB9, and
NDP. NLRP2 was also the only gene differentially regulated in
undifferentiated iPSCs. Control line 6842A was an outlier
regarding NLRP2 expression. Interestingly, the gene is located at
the breakpoint of the balanced location in this line. It is likely that
this chromosomal alteration is responsible for NLRP2 expression
level differences, although future studies will need to confirm this is
the case. If true, such misregulation would be expected to have
Figure 6. Examination of Target Genes in Late-Onset ADBrains. A–B. qPCR of NLRP2 (A) and ASB9 (B) from mRNA fromBrodmann’s area (BA38) from control and AD brains. Black bars (1–5) arecontrols and red bars represent AD patients (6–16), which are describedin Fig S5. qPCR data was normalized internally to GAPDH expression andalso to the average of 5 control lines. Statistical significance wasdetermined by Student’s t-Test and error bars reflect SEM. For controlvs. AD, n = 5 for control, n = 11 for AD, p = 0.005. C. List of PSEN1 NPCtarget genes (Table S2) that have differential expression in independentmicroarray data of laser captured microdissected (LCM) cortical neuronsfrom one of three brain areas (details in Fig S5). All comparisons areeither non-demented AD pathology (NDAD) or AD versus controlsamples. HIP refers to hippocampus, EC for entorhinal cortex, and MTGfor middle temporal gyrus. Fold change and significance (FDR: falsediscover rate) reflect values for LCM neuron arrays. See also Figure S4.doi:10.1371/journal.pone.0084547.g006
PSEN1 Alzheimer Disease NPC Model
PLOS ONE | www.plosone.org 9 January 2014 | Volume 9 | Issue 1 | e84547

consequences for this balanced translocation. It is intriguing that
NLRP2 expression was decreased in late onset AD brains. One
possibility is that the cells that express NLRP2 at high levels (and
thus would be predicted to have an increased pro-inflammatory
response) might be more vulnerable in AD. On the other hand,
ASB9, and E3-ligase (which inhibits mitochondrial function; [39])
was shown to be upregulated in brains from some late onset AD
patients.
NDP is a particularly interesting target in the context of the
proposal that FAD might have developmental consequences, in
that 30% of patients with Norrie Disease, a disorder caused by
mutation of NDP, have CNS deficits [45]. In addition, promotion
of Wnt signaling and inhibition of TGFb signaling by norrin
should enhance adult neurogenesis by driving proliferation/
NeuroD1 expression, and inhibiting astrocyte fate respectively
[48,49]. Thus the reduction of NDP in the hippocampus of late
onset AD brains would be predicted to decrease neurogenic
potential. Future studies incorporating gain and loss of function of
NDP should help clarify NDP’s potential role in neurogenesis and
Alzheimer disease.
Materials and Methods
See Figure S6 for extended material and methods.
Cell LinesFibroblast 11 and 11C have been previously published [19]. All
other fibroblasts were obtained from the Coriell Institute
(Camden, NJ), and were reprogrammed to iPSCs in this study
(see Figure S6 for details).
Molecular BiologyGenomic DNA was prepared using the DNA Mini Kit, and
RNA with the RNeasy Mini Kit, as per the manufacturer’s
instructions (Qiagen). qPCR was carried out on a Stratagene
MX3000P QPCR machine (Agilent technologies) utilizing 40
cycles. cRNA for was amplified using the Illumina TotalPrep RNA
Amplification Kit (Ambion) and ran on an Illumina HT_12_v4
BeadChip Array (Ilumina), as per the manufacturer’s instructions.
Oligos are found in Fig S6.
Protein AnalysisImmunostaining was performed as has been described before
[50]. Hoescht 33342 (Sigma) were used to visualize DNA. The
following antibodies were used: OCT4 (Stemgent), SSEA4, Nanog
(R&D Systems), Tra-160, Ki67, MAP2, Nestin, NeuN (Millipore),
Tuj1 (Covance), NLRP2 (Santa Cruz), and NDP (Abnova).
Quantification of immunostaining was done on the Celigo 200-
BFFL Machine (Brooks Automation).
Ab AssaysFibroblasts were split at 100,000 cells/6 well-well, and allowed
to condition for 3 days before collection of conditioned media for
analysis. Neuronal cultures were also conditioned for 3 days prior
to collection of conditioned media at day 14. To quantify Ablevels, human/rat Ab 1–40 and 1–42 ELISA kits (Wako) were
used according to the manufacturer’s instructions. Duplicate
assays were averaged for each biological replicate. There were 3
biological replicates for each line in each experiment (three
independent-experiments per cell type). Assays were performed
blindly.
Human Brain Tissue AnalysisDe-identified fresh frozen human autopsy brain tissue was
obtained from the New York Brain Bank at Columbia University
Medical Center (New York, NY). Neuropathological examination
was per standardized protocols [51,52].
Supporting Information
Figure S1 Related to Figure 1: Additional characteriza-tion of 7768C and neuronal differentiation.(PDF)
Figure S2 Related to Table 1: Characterization of CoreLines.
(PDF)
Figure S3 Related to Figure 3: DapT Blocks total Abproduction.(PDF)
Figure S4 Related to Figure 6: NDP Protein Is Ex-pressed in Late-Onset AD Brains.(PDF)
Figure S5 Related to Figure 6: Recombinant Norrinprotein induces proliferation in adult SVZ neuralprogenitor cells (NPCs).(PDF)
Figure S6 Extended material and Methods.(PDF)
Table S1 Related to Figure 1: GO Terms associatedwith differentially regulated genes as determined byDAVID Functional Annotation.(DOCX)
Table S2 qPCR Validation of Gene Expression Profilehits.(DOCX)
Acknowledgments
We would like to thank Dung-Fang Lee, Gist Croft, and Mackenzie
Amoroso for advice with Southern blotting. Fibroblast line 11 and control
IPSC lines 11C were generously provided by Kevin Eggan and Project
ALS[19]. We would also like to thank Aya Haggiagi for her technical
assistance with APOE genotyping. We are very appreciative of Haiqing
Hua for developing and standardizing qPCR primers and reactions for
expression of endogenous and viral pluripotency markers. Giuseppe Maria
de Peppo and Daniel Paull were gave helpful advice regarding gene
expression analysis. Abulaziz Alasaffar provided excellent assistance
utilizing Matlab for our calcium studies. Michael Shelanski gave helpful
suggestions about utilizing publically available AD and NDAD array data.
We appreciate helpful feedback on this work by Kevin Eggan.
Author Contributions
Conceived and designed the experiments: AAS SJ DP SHK MWN MNS
AD DJK JFC OA SG SAN. Performed the experiments: AAS SJ DP SHK
MWN MNS ISM MZ JWS DJK. Analyzed the data: AAS SJ DP SHK
MWN MNS ISM MZ SA DJK. Contributed reagents/materials/analysis
tools: SA AD. Wrote the paper: AAS DP MWN SG SAN.
References
1. Ballard C, Gauthier S, Corbett A, Brayne C, Aarsland D, et al. (2011)
Alzheimer’s disease. The Lancet 377: 1019–1031. doi:10.1016/S0140-
6736(10)61349-9.
2. Bekris LM, Yu CE, Bird TD, Tsuang DW (2010) Review Article: Genetics of
Alzheimer Disease. Journal of Geriatric Psychiatry and Neurology 23: 213–227.
doi:10.1177/0891988710383571.
PSEN1 Alzheimer Disease NPC Model
PLOS ONE | www.plosone.org 10 January 2014 | Volume 9 | Issue 1 | e84547

3. Elder GA, Gama Sosa MA, Gasperi R, Dickstein DL, Hof PR (2010) Presenilin
transgenic mice as models of Alzheimer’s disease. Brain Struct Funct 214: 127–143. doi:10.1007/s00429-009-0227-3.
4. Karran E, Mercken M, De Strooper B (2011) The amyloid cascade hypothesis
for Alzheimer’s disease: an appraisal for the development of therapeutics. NaturePublishing Group 10: 698–712. doi:10.1038/nrd3505.
5. Quintero-Monzon O, Martin MM, Fernandez MA, Cappello CA, Krzysiak AJ,et al. (2011) Dissociation between the processivity and total activity of c-
secretase: implications for the mechanism of Alzheimer’s disease-causing
presenilin mutations. Biochemistry 50: 9023–9035. doi:10.1021/bi2007146.6. Hata S, Fujishige S, Araki Y, Kato N, Araseki M, et al. (2009) Alcadein
cleavages by amyloid beta-precursor protein (APP) alpha- and gamma-secretasesgenerate small peptides, p3-Alcs, indicating Alzheimer disease-related gamma-
secretase dysfunction. Journal of Biological Chemistry 284: 36024–36033.doi:10.1074/jbc.M109.057497.
7. Kwok JBJ, Halliday GM, Brooks WS, Dolios G, Laudon H, et al. (2003)
Presenilin-1 mutation L271V results in altered exon 8 splicing and Alzheimer’sdisease with non-cored plaques and no neuritic dystrophy. J Biol Chem 278:
6748–6754. doi:10.1074/jbc.M211827200.8. Castellano JM, Deane R, Gottesdiener AJ, Verghese PB, Stewart FR, et al.
(2012) Low-density lipoprotein receptor overexpression enhances the rate of
brain-to-blood Ab clearance in a mouse model of b-amyloidosis. Proc Natl AcadSci USA 109: 15502–15507. doi:10.1073/pnas.1206446109.
9. Thambisetty M, An Y, Nalls M, Sojkova J, Swaminathan S, et al. (2013) Effect ofcomplement CR1 on brain amyloid burden during aging and its modification by
APOE genotype. Biol Psychiatry 73: 422–428. doi:10.1016/j.biopsych.2012.08.015.
10. Kondo T, Asai M, Tsukita K, Kutoku Y, Ohsawa Y, et al. (2013) Modeling
Alzheimer’s disease with iPSCs reveals stress phenotypes associated withintracellular Ab and differential drug responsiveness. Cell Stem Cell 12: 487–
496. doi:10.1016/j.stem.2013.01.009.11. Israel MA, Yuan SH, Bardy C, Reyna SM, Mu Y, et al. (2012) Probing sporadic
and familial Alzheimer’s disease using induced pluripotent stem cells. Nature
482: 216–220. doi:10.1038/nature10821.12. Qiang L, Fujita R, Yamashita T, Angulo S, Rhinn H, et al. (2011) Directed
conversion of Alzheimer’s disease patient skin fibroblasts into functional neurons.Cell 146: 359–371. doi:10.1016/j.cell.2011.07.007.
13. Yagi T, Ito D, Okada Y, Akamatsu W, Nihei Y, et al. (2011) Modeling familialAlzheimer’s disease with induced pluripotent stem cells. Hum Mol Genet.
doi:10.1093/hmg/ddr394.
14. Lazarov O, Marr RA (2010) Neurogenesis and Alzheimer’s disease: at thecrossroads. Exp Neurol 223: 267–281. doi:10.1016/j.expneurol.2009.08.009.
15. Mu Y, Gage FH (2011) Adult hippocampal neurogenesis and its role inAlzheimer’s disease. Mol Neurodegener 6: 85. doi:10.1186/1750-1326-6-85.
16. Verret L, Jankowsky JL, Xu GM, Borchelt DR, Rampon C (2007) Alzheimer’s-
type amyloidosis in transgenic mice impairs survival of newborn neurons derivedfrom adult hippocampal neurogenesis. J Neurosci 27: 6771–6780. doi:10.1523/
JNEUROSCI.5564-06.2007.17. Reiman EM, Quiroz YT, Fleisher AS, Chen K, Velez-Pardo C, et al. (2012)
Brain imaging and fluid biomarker analysis in young adults at genetic risk forautosomal dominant Alzheimer’s disease in the presenilin 1 E280A kindred: a
case-control study. Lancet Neurol 11: 1048–1056. doi:10.1016/S1474-
4422(12)70228-4.18. Dimos JT, Rodolfa KT, Niakan KK, Weisenthal LM, Mitsumoto H, et al.
(2008) Induced pluripotent stem cells generated from patients with ALS can bedifferentiated into motor neurons. Science 321: 1218–1221. doi:10.1126/
science.1158799.
19. Bock C, Kiskinis E, Verstappen G, Gu H, Boulting G, et al. (2011) ReferenceMaps of human ES and iPS cell variation enable high-throughput character-
ization of pluripotent cell lines. Cell 144: 439–452. doi:10.1016/j.cell.2010.12.032.
20. Nielsen J, Rasmussen K (1976) Autosomal reciprocal translocations and 13/14
translocations: a population study. Clin Genet 10: 161–177.21. Santa-Maria I, Haggiagi A, Liu X, Wasserscheid J, Nelson PT, et al. (2012) The
MAPT H1 haplotype is associated with tangle-predominant dementia. ActaNeuropathologica 124: 693–704. doi:10.1007/s00401-012-1017-1.
22. Chambers SM, Fasano CA, Papapetrou EP, Tomishima M, Sadelain M, et al.(2009) Highly efficient neural conversion of human ES and iPS cells by dual
inhibition of SMAD signaling. Nat Biotechnol 27: 275–280. doi:10.1038/
nbt.1529.23. Ozair MZ, Noggle S, Warmflash A, Krzyspiak JE, Brivanlou AH (2012)
SMAD7 Directly Converts Human Embryonic Stem Cells to Telencephalic Fateby a Default Mechanism. Stem Cells. doi:10.1002/stem.1246.
24. Pruszak J, Sonntag K-C, Aung MH, Sanchez-Pernaute R, Isacson O (2007)
Markers and methods for cell sorting of human embryonic stem cell-derivedneural cell populations. Stem Cells 25: 2257–2268. doi:10.1634/stemcells.2006-
0744.25. Bezprozvanny I, Mattson MP (2008) Neuronal calcium mishandling and the
pathogenesis of Alzheimer’s disease. Trends Neurosci 31: 454–463.doi:10.1016/j.tins.2008.06.005.
26. Marchetto MCN, Carromeu C, Acab A, Yu D, Yeo GW, et al. (2010) A model
for neural development and treatment of Rett syndrome using human inducedpluripotent stem cells. Cell 143: 527–539. doi:10.1016/j.cell.2010.10.016.
27. Murphy TH, Blatter LA, Wier WG, Baraban JM (1992) Spontaneous
synchronous synaptic calcium transients in cultured cortical neurons.
J Neurosci 12: 4834–4845.
28. Duff K, Eckman C, Zehr C, Yu X, Prada CM, et al. (1996) Increased amyloid-
beta42(43) in brains of mice expressing mutant presenilin 1. Nature 383: 710–
713. doi:10.1038/383710a0.
29. Scheuner D, Eckman C, Jensen M, Song X, Citron M, et al. (1996) Secreted
amyloid beta-protein similar to that in the senile plaques of Alzheimer‘‘s disease
is increased in vivo by the presenilin 1 and 2 and APP mutations linked to
familial Alzheimer’’s disease. Nat Med 2: 864–870.
30. Bentahir M, Nyabi O, Verhamme J, Tolia A, Horre K, et al. (2006) Presenilin
clinical mutations can affect gamma-secretase activity by different mechanisms.
J Neurochem 96: 732–742. doi:10.1111/j.1471-4159.2005.03578.x.
31. Imbimbo BP, Giardina GAM (2011) c-secretase inhibitors and modulators for
the treatment of Alzheimer’s disease: disappointments and hopes. Curr Top
Med Chem 11: 1555–1570.
32. Huang DW, Sherman BT, Lempicki RA (2009) Bioinformatics enrichment
tools: paths toward the comprehensive functional analysis of large gene lists.
Nucleic Acids Res 37: 1–13. doi:10.1093/nar/gkn923.
33. Huang DW, Sherman BT, Lempicki RA (2009) Systematic and integrative
analysis of large gene lists using DAVID bioinformatics resources. Nat Protoc 4:
44–57. doi:10.1038/nprot.2008.211.
34. Bruey JM, Bruey-Sedano N, Newman R, Chandler S, Stehlik C, et al. (2004)
PAN1/NALP2/PYPAF2, an inducible inflammatory mediator that regulates
NF-kappaB and caspase-1 activation in macrophages. J Biol Chem 279: 51897–
51907. doi:10.1074/jbc.M406741200.
35. Dagenais M, Skeldon A, Saleh M (2012) The inflammasome: in memory of Dr.
Jurg Tschopp. 8 pp. doi:10.1038/cdd.2011.159.
36. Rubio-Perez JM, Morillas-Ruiz JM (2012) A review: inflammatory process in
Alzheimer’s disease, role of cytokines. ScientificWorldJournal 2012: 756357.
doi:10.1100/2012/756357.
37. Heneka MT, Kummer MP, Stutz A, Delekate A, Schwartz S, et al. (2012)
NLRP3 is activated in Alzheimer’s disease and contributes to pathology in APP/
PS1 mice. Nature. doi:10.1038/nature11729.
38. Debrincat MA, Zhang J-G, Willson TA, Silke J, Connolly LM, et al. (2007)
Ankyrin repeat and suppressors of cytokine signaling box protein asb-9 targets
creatine kinase B for degradation. J Biol Chem 282: 4728–4737. doi:10.1074/
jbc.M609164200.
39. Kwon S, Kim D, Rhee JW, Park J-A, Kim D-W, et al. (2010) ASB9 interacts
with ubiquitous mitochondrial creatine kinase and inhibits mitochondrial
function. BMC Biol 8: 23. doi:10.1186/1741-7007-8-23.
40. Beal MF (2011) Neuroprotective effects of creatine. Amino Acids 40: 1305–1313.
doi:10.1007/s00726-011-0851-0.
41. Arnold SE, Hyman BT, Van Hoesen GW (1994) Neuropathologic changes of
the temporal pole in Alzheimer‘‘s disease and Pick’’s disease. Arch Neurol 51:
145–150.
42. Liang WS, Dunckley T, Beach TG, Grover A, Mastroeni D, et al. (2008) Altered
neuronal gene expression in brain regions differentially affected by Alzheimer’s
disease: a reference data set. Physiol Genomics 33: 240–256. doi:10.1152/
physiolgenomics.00242.2007.
43. Liang WS, Dunckley T, Beach TG, Grover A, Mastroeni D, et al. (2010)
Neuronal gene expression in non-demented individuals with intermediate
Alzheimer’s Disease neuropathology. Neurobiol Aging 31: 549–566.
doi:10.1016/j.neurobiolaging.2008.05.013.
44. Kim J-H, Nam Y-P, Jeon S-M, Han H-S, Suk K (2012) Amyloid neurotoxicity is
attenuated by metallothionein: dual mechanisms at work. J Neurochem 121:
751–762. doi:10.1111/j.1471-4159.2012.07725.x.
45. Braunger BM, Tamm ER (2012) The different functions of Norrin. Adv Exp
Med Biol 723: 679–683. doi:10.1007/978-1-4614-0631-0_86.
46. Xu Q, Wang Y, Dabdoub A, Smallwood PM, Williams J, et al. (2004) Vascular
development in the retina and inner ear: control by Norrin and Frizzled-4, a
high-affinity ligand-receptor pair. Cell 116: 883–895.
47. He P, Shen Y (2009) Interruption of beta-catenin signaling reduces neurogenesis
in Alzheimer’s disease. J Neurosci 29: 6545–6557. doi:10.1523/JNEUROSCI.
0421-09.2009.
48. Lim DA, Tramontin AD, Trevejo JM, Herrera DG, Garcıa-Verdugo JM, et al.
(2000) Noggin antagonizes BMP signaling to create a niche for adult
neurogenesis. Neuron 28: 713–726.
49. Kuwabara T, Hsieh J, Muotri A, Yeo G, Warashina M, et al. (2009) Wnt-
mediated activation of NeuroD1 and retro-elements during adult neurogenesis.
Nat Neurosci 12: 1097–1105. doi:10.1038/nn.2360.
50. Sproul AA, Xu Z, Wilhelm M, Gire S, Greene LA (2009) Cbl negatively
regulates JNK activation and cell death. Cell Res 19: 950–961. doi:10.1038/
cr.2009.74.
51. Vonsattel J-PG, Amaya MDP, Cortes EP, Mancevska K, Keller CE (2008)
Twenty-first century brain banking: practical prerequisites and lessons from the
past: the experience of New York Brain Bank, Taub Institute, Columbia
University. Cell Tissue Bank 9: 247–258. doi:10.1007/s10561-008-9079-y.
52. Vonsattel J-PG, Del Amaya MP, Keller CE (2008) Twenty-first century brain
banking. Processing brains for research: the Columbia University methods. Acta
Neuropathologica 115: 509–532. doi:10.1007/s00401-007-0311-9.
PSEN1 Alzheimer Disease NPC Model
PLOS ONE | www.plosone.org 11 January 2014 | Volume 9 | Issue 1 | e84547