Embed Size (px)
Citation preview
1Jan 23, 2014Journal of Emerging Investigators
Journal ofEmerging Investigators
Received: Aug 20, 2013; Accepted: Nov 25, 2013; Published: Jan 23, 2014
Copyright: (C) 2014 Palermo et al. All JEI articles are distributed under the attriution non-comercial, no derivative license (http://creativecommons.org/licenses/by-nc-nd/3.0/). This means that anyone is free to share, copy and distribute an unaltered article for non-commercial purposes provided the original author and source is credited.
IntroductionThe Lake Champlain Basin, found within Vermont,
New York, and southern Quebec, covers 8,234 square
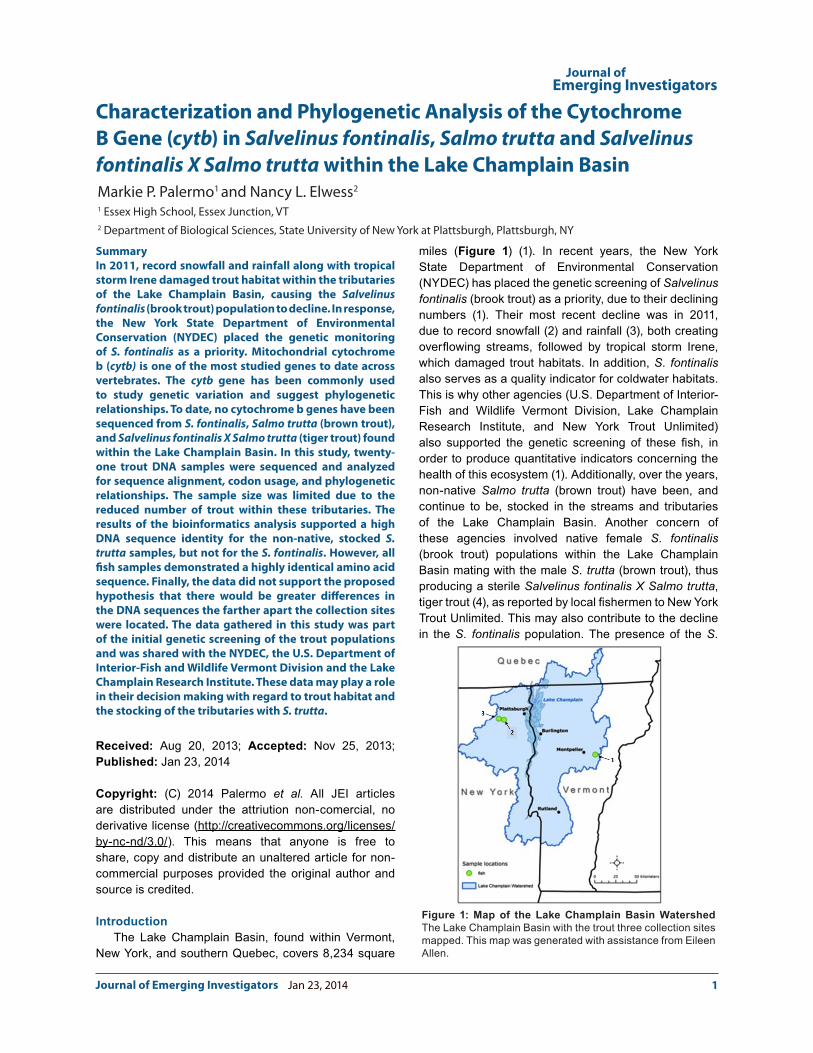
miles (Figure 1) (1). In recent years, the New York State Department of Environmental Conservation (NYDEC) has placed the genetic screening of Salvelinus fontinalis (brook trout) as a priority, due to their declining numbers (1). Their most recent decline was in 2011, due to record snowfall (2) and rainfall (3), both creating overflowing streams, followed by tropical storm Irene, which damaged trout habitats. In addition, S. fontinalis also serves as a quality indicator for coldwater habitats. This is why other agencies (U.S. Department of Interior-Fish and Wildlife Vermont Division, Lake Champlain Research Institute, and New York Trout Unlimited) also supported the genetic screening of these fish, in order to produce quantitative indicators concerning the health of this ecosystem (1). Additionally, over the years, non-native Salmo trutta (brown trout) have been, and continue to be, stocked in the streams and tributaries of the Lake Champlain Basin. Another concern of these agencies involved native female S. fontinalis (brook trout) populations within the Lake Champlain Basin mating with the male S. trutta (brown trout), thus producing a sterile Salvelinus fontinalis X Salmo trutta, tiger trout (4), as reported by local fishermen to New York Trout Unlimited. This may also contribute to the decline in the S. fontinalis population. The presence of the S.
Characterization and Phylogenetic Analysis of the Cytochrome B Gene (cytb) in Salvelinus fontinalis, Salmo trutta and Salvelinus fontinalis X Salmo trutta within the Lake Champlain Basin
SummaryIn 2011, record snowfall and rainfall along with tropical storm Irene damaged trout habitat within the tributaries of the Lake Champlain Basin, causing the Salvelinus fontinalis (brook trout) population to decline. In response, the New York State Department of Environmental Conservation (NYDEC) placed the genetic monitoring of S. fontinalis as a priority. Mitochondrial cytochrome b (cytb) is one of the most studied genes to date across vertebrates. The cytb gene has been commonly used to study genetic variation and suggest phylogenetic relationships. To date, no cytochrome b genes have been sequenced from S. fontinalis, Salmo trutta (brown trout), and Salvelinus fontinalis X Salmo trutta (tiger trout) found within the Lake Champlain Basin. In this study, twenty-one trout DNA samples were sequenced and analyzed for sequence alignment, codon usage, and phylogenetic relationships. The sample size was limited due to the reduced number of trout within these tributaries. The results of the bioinformatics analysis supported a high DNA sequence identity for the non-native, stocked S. trutta samples, but not for the S. fontinalis. However, all fish samples demonstrated a highly identical amino acid sequence. Finally, the data did not support the proposed hypothesis that there would be greater differences in the DNA sequences the farther apart the collection sites were located. The data gathered in this study was part of the initial genetic screening of the trout populations and was shared with the NYDEC, the U.S. Department of Interior-Fish and Wildlife Vermont Division and the Lake Champlain Research Institute. These data may play a role in their decision making with regard to trout habitat and the stocking of the tributaries with S. trutta.
Markie P. Palermo1 and Nancy L. Elwess2
1 Essex High School, Essex Junction, VT2 Department of Biological Sciences, State University of New York at Plattsburgh, Plattsburgh, NY
Figure 1: Map of the Lake Champlain Basin Watershed The Lake Champlain Basin with the trout three collection sites mapped. This map was generated with assistance from Eileen Allen.
2Jan 23, 2014Journal of Emerging Investigators
Journal ofEmerging Investigators
fontinalis X S. trutta (tiger trout) within the Lake Champlain Basin was supported when the collected trout samples were tested using a variety of genetic markers (5). Since the NYDEC placed such a priority on the genetic screening of S. fontinalis, we felt it was necessary to continue with the DNA testing of these trout samples, this time using the cytochrome b gene (cytb). The farthest collection sites were just over 100 miles apart. Even with the stocking of the non-native S. trutta, we hypothesized that there would be genetic diversity within these trout given the populations are separated by large distances. Results from this research may contribute to
planning decisions and protection of trout habitat that will contribute to a healthy economy, since fishing within the Lake Champlain Basin contributes heavily to the local economy.
Genes within mitochondrial DNA (mtDNA) are attractive genetic markers for DNA analysis and determination of phylogenies of species due to their rapid evolutionary rates compared to those found in nuclear DNA (6). The mtDNA is also only inherited on the maternal side. Within the many mtDNA protein coding genes, cytb has been commonly used to examine genetic variation (7) and inferring phylogenetic relationships (8, 9, 10, 11).
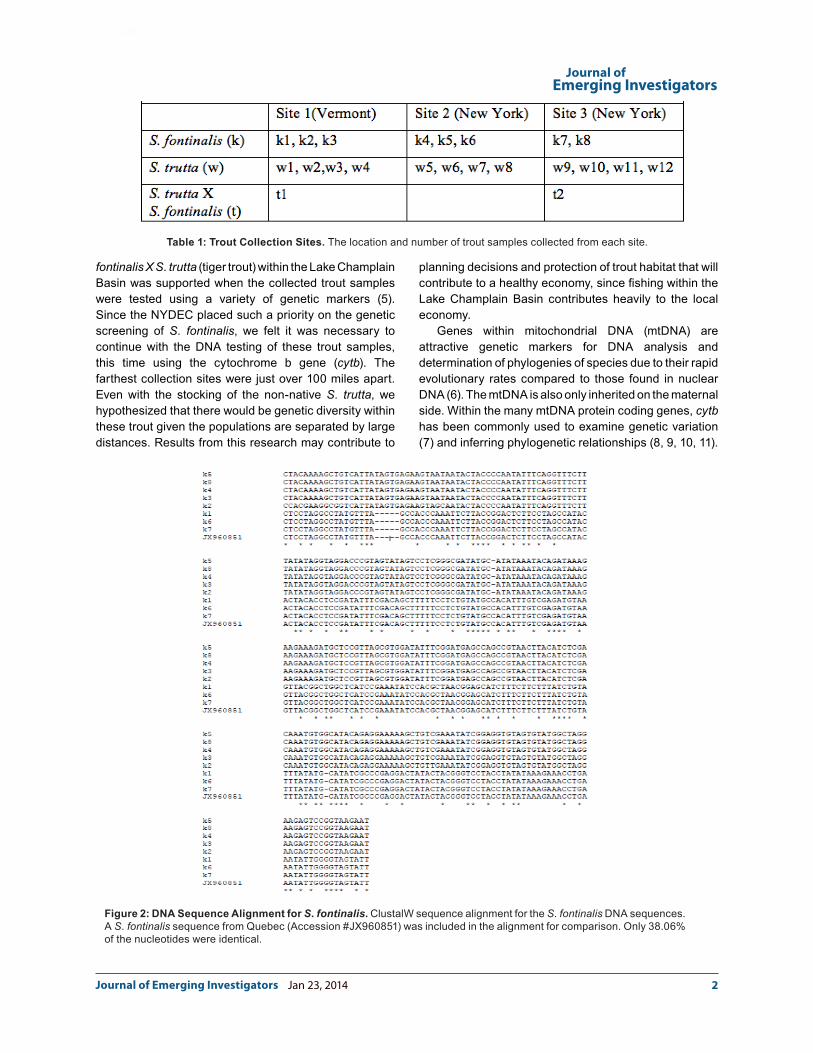
Figure 2: DNA Sequence Alignment for S. fontinalis. ClustalW sequence alignment for the S. fontinalis DNA sequences. A S. fontinalis sequence from Quebec (Accession #JX960851) was included in the alignment for comparison. Only 38.06% of the nucleotides were identical.
Table 1: Trout Collection Sites. The location and number of trout samples collected from each site.
3Jan 23, 2014Journal of Emerging Investigators
Journal ofEmerging Investigators
In particular, the evolutionary rate of the cytb gene is fitting for examining events that occurred within the past 20 million years, such as the evolution of the trout (2). The cytb gene is one of most well studied mitochondrial genes in regard to the structure and function of its protein (12). This gene has both rapidly and slowly evolving codon positions, as well as more conservative regions (13). The cytb gene has been extensively used for phylogenetic studies among vertebrate taxa (14, 15) and in particular fish taxa (16, 17, 18, 19). It should be noted that most of these studies used universal PCR primers (20), which produce only a partial gene product. We used this gene for the characterization and phylogenetic analysis from S. fontinalis, S. trutta, and S. trutta X S. fontinalis within the Lake Champlain Basin. Since we had several S. trutta X S. fontinalis (tiger) samples, we included them in this study to determine if their cytb gene matched with the cytb gene of S. fontinalis, since this hybrid’s mitochondrial DNA comes from the female S. fontinalis.
This study represents the first description of the cytb gene in S. fontinalis and S. trutta found within the
Lake Champlain Basin. This is an important community issue because fishing has a significant economic impact within this geographical region. To date, there are only 20 S. fontinalis and 42 S. trutta partial and full DNA sequences for the cytochrome B gene within the National Center for Biotechnology Information (NCBI) database. None of these registered sequences are from trout found within the Lake Champlain Basin. Our goal is to expand the trout sequences found within the NCBI database to include, for the first time, sequences from trout found within the Lake Champlain Basin. Finally, our hypothesis is that the greater the distance apart of the trout sampled, the greater the differences in their DNA sequences. The DNA sequences allowed us to test this hypothesis however, our findings did not support such sequence divergence for the trout populations within the Lake Champlain Basin.
Results Pattern of Sequence Variation
A data set of eight S. fontinalis, nine S. trutta and two S. trutta X S. fontinalis partial cytochrome B sequences
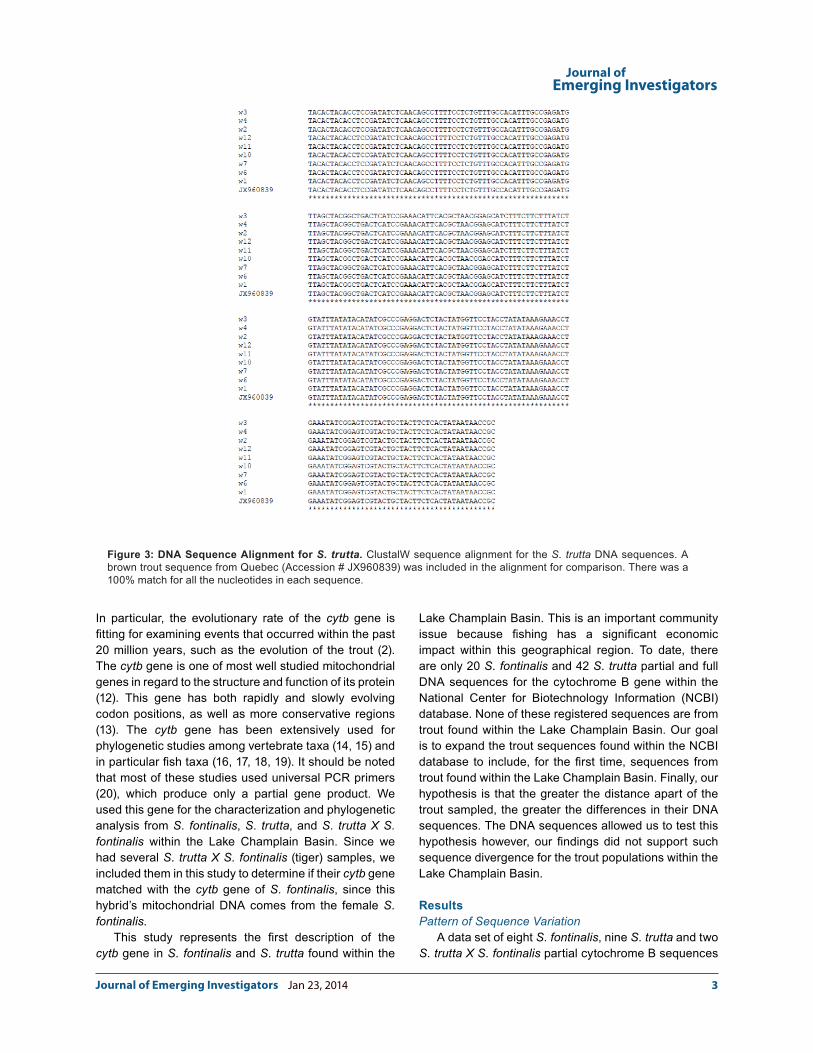
Figure 3: DNA Sequence Alignment for S. trutta. ClustalW sequence alignment for the S. trutta DNA sequences. A brown trout sequence from Quebec (Accession # JX960839) was included in the alignment for comparison. There was a 100% match for all the nucleotides in each sequence.
4Jan 23, 2014Journal of Emerging Investigators
Journal ofEmerging Investigators
were analyzed (Table 1; Figures 2 and 3). When the 257 corresponding bases of the S. fontinalis DNA sequences were compared through CLUSTALW, only 38.06% were identical (Figure 2). A S. fontinalis sequence from Quebec (Accession #JX960851) was included in the analysis, since it was the closest S. fontinalis sample registered in the NCBI database to the Lake Champlain Basin collected for this study. When a direct comparison of the S. fontinalis (k) sequences k2, k3, k4, k5, and k8 were made, they were 97.38% identical (data not shown). Also, when the S. fontinalis sequences k1, k6, k7, and the Quebec sequences were compared through CLUSTALW, the sequences were 100% identical (data not shown). The sequences fell clearly into two separate groups (Figure 2). Additionally, the two S. trutta X S. fontinalis samples were a 100% match to the k1, k2, k7 and Quebec sequences (data not shown).
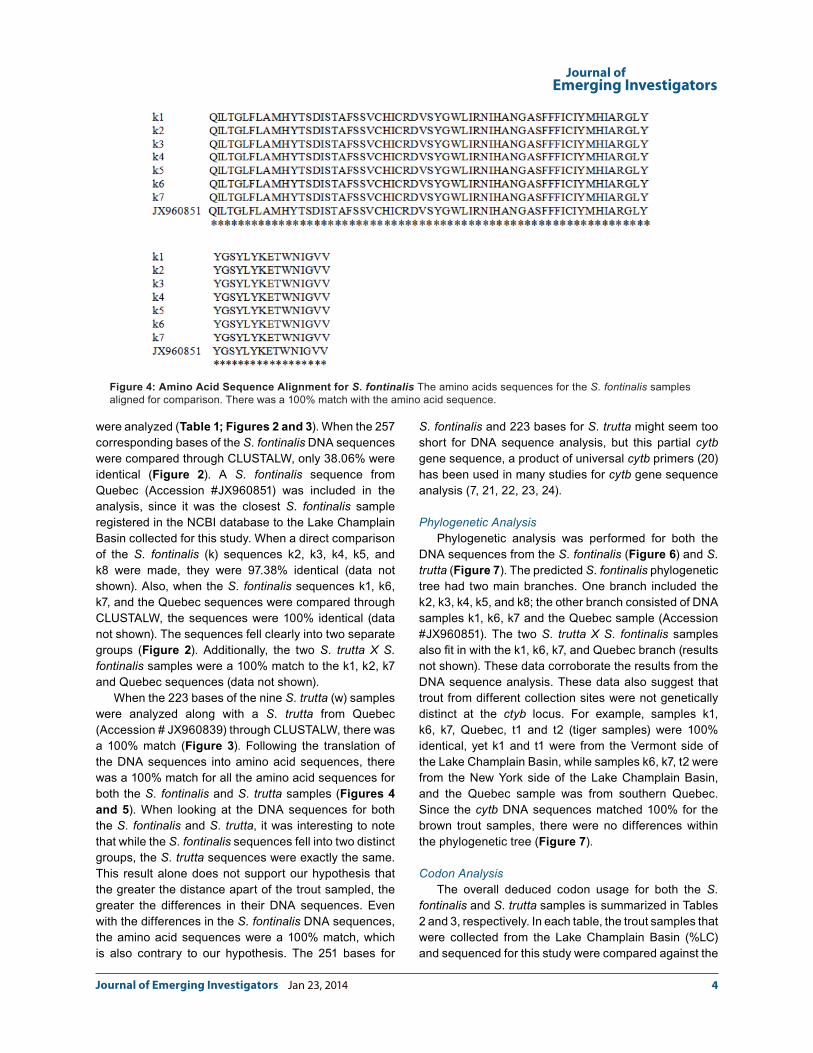
When the 223 bases of the nine S. trutta (w) samples were analyzed along with a S. trutta from Quebec (Accession # JX960839) through CLUSTALW, there was a 100% match (Figure 3). Following the translation of the DNA sequences into amino acid sequences, there was a 100% match for all the amino acid sequences for both the S. fontinalis and S. trutta samples (Figures 4 and 5). When looking at the DNA sequences for both the S. fontinalis and S. trutta, it was interesting to note that while the S. fontinalis sequences fell into two distinct groups, the S. trutta sequences were exactly the same. This result alone does not support our hypothesis that the greater the distance apart of the trout sampled, the greater the differences in their DNA sequences. Even with the differences in the S. fontinalis DNA sequences, the amino acid sequences were a 100% match, which is also contrary to our hypothesis. The 251 bases for
S. fontinalis and 223 bases for S. trutta might seem too short for DNA sequence analysis, but this partial cytb gene sequence, a product of universal cytb primers (20) has been used in many studies for cytb gene sequence analysis (7, 21, 22, 23, 24).
Phylogenetic Analysis Phylogenetic analysis was performed for both the
DNA sequences from the S. fontinalis (Figure 6) and S. trutta (Figure 7). The predicted S. fontinalis phylogenetic tree had two main branches. One branch included the k2, k3, k4, k5, and k8; the other branch consisted of DNA samples k1, k6, k7 and the Quebec sample (Accession #JX960851). The two S. trutta X S. fontinalis samples also fit in with the k1, k6, k7, and Quebec branch (results not shown). These data corroborate the results from the DNA sequence analysis. These data also suggest that trout from different collection sites were not genetically distinct at the ctyb locus. For example, samples k1, k6, k7, Quebec, t1 and t2 (tiger samples) were 100% identical, yet k1 and t1 were from the Vermont side of the Lake Champlain Basin, while samples k6, k7, t2 were from the New York side of the Lake Champlain Basin, and the Quebec sample was from southern Quebec. Since the cytb DNA sequences matched 100% for the brown trout samples, there were no differences within the phylogenetic tree (Figure 7).
Codon AnalysisThe overall deduced codon usage for both the S.
fontinalis and S. trutta samples is summarized in Tables 2 and 3, respectively. In each table, the trout samples that were collected from the Lake Champlain Basin (%LC) and sequenced for this study were compared against the
Figure 4: Amino Acid Sequence Alignment for S. fontinalis The amino acids sequences for the S. fontinalis samples aligned for comparison. There was a 100% match with the amino acid sequence.
5Jan 23, 2014Journal of Emerging Investigators
Journal ofEmerging Investigators
trout sequences retrieved from the NCBI database (%D). The NCBI database included 20 partial and complete sequences for S. fontinalis and 42 partial and complete sequences for S. trutta. We hypothesized that due to the low number of sequences within the NCBI database, it would be of interest to compare our S. fontinalis and S. trutta against them. In Table 2, there were many codon usage differences between S. fontinalis sequences in the database (%D) and those from the Lake Champlain Basin
samples (%LC). For example, the database samples (%D) showed a more frequent usage of TGA for the amino acid Trp (84.70%) while the Lake Champlain Basin samples (%LC) showed a consistent usage of the TGG codon (100%). Also, for the amino acid Glu, in the %D samples there was 100% usage of the GAA sequence, while the %LC samples also had a higher frequency of usage of the GAA sequence, but only at a 55.88% frequency. The Lake Champlain Basin samples also showed an overall 58.3% A+T composition compared to the DNA sequences retrieved from the NCBI database, which had an overall 54.19% A+T composition (data not shown). In contrast, the codon usage in the S. trutta samples (Table 3) was similar between the database samples and the Lake Champlain Basin samples. The only exceptions were with codons for amino acids Pro, Asp and Arg. The %LC samples had 100% usage of CCA (Pro), GAT (Asp) and CGA (Arg) compared to the %D samples at 37.2% (CCA), 43.4% (GAT), and 59.6% (CGA) for the same amino acids. The Lake Champlain Basin brown trout samples also showed a 56.8% A+T composition within the codon usage compared to the 53.9% A+T% for the NCBI database samples (data not shown).
DiscussionTo date, no cytochrome B gene has been
characterized from S. fontinalis or S. trutta found within the Lake Champlain Basin. Here, a bioinformatics approach was taken to analyze samples collected from the New York and Vermont sides of the Lake Champlain Basin. The nucleotide sequences of the S. fontinalis were aligned to determine their phylogenetic relationships.
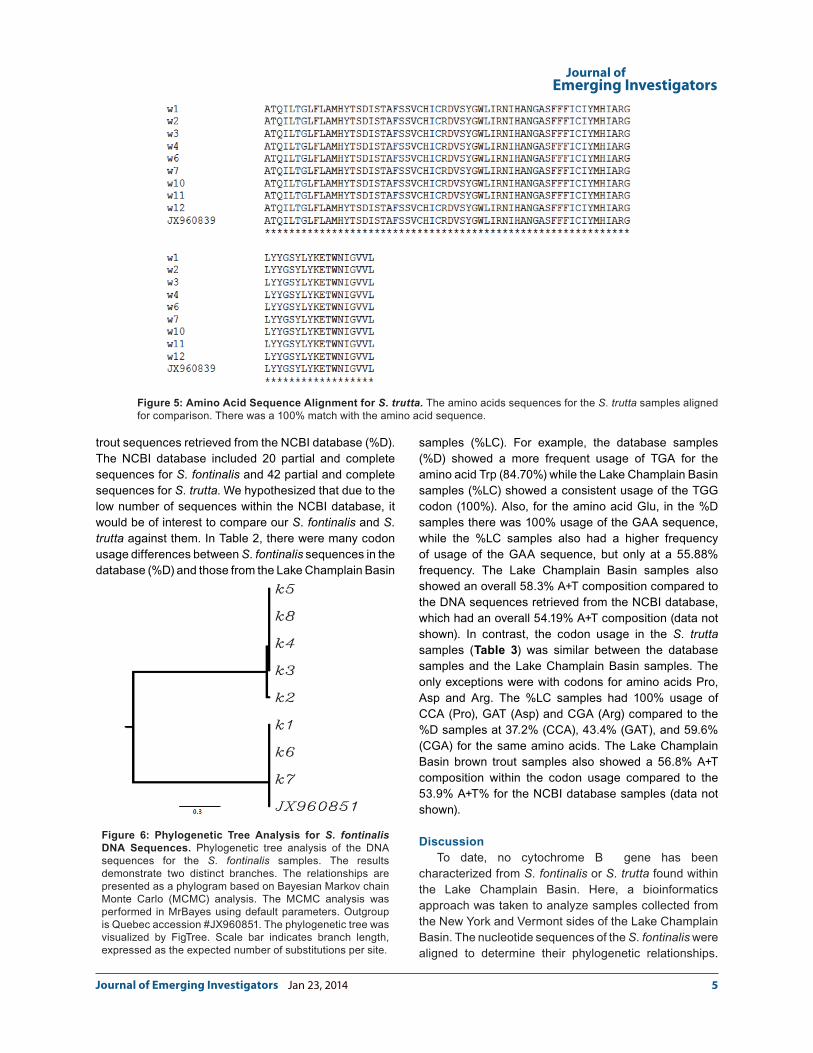
Figure 5: Amino Acid Sequence Alignment for S. trutta. The amino acids sequences for the S. trutta samples aligned for comparison. There was a 100% match with the amino acid sequence.
Figure 6: Phylogenetic Tree Analysis for S. fontinalis DNA Sequences. Phylogenetic tree analysis of the DNA sequences for the S. fontinalis samples. The results demonstrate two distinct branches. The relationships are presented as a phylogram based on Bayesian Markov chain Monte Carlo (MCMC) analysis. The MCMC analysis was performed in MrBayes using default parameters. Outgroup is Quebec accession #JX960851. The phylogenetic tree was visualized by FigTree. Scale bar indicates branch length, expressed as the expected number of substitutions per site.
6Jan 23, 2014Journal of Emerging Investigators
Journal ofEmerging Investigators
Results showed that the S. fontinalis DNA sequences fell into two distinct sequence patterns (Figure 6). Overall, there was only a 38.06% identical DNA match (Figure 2). However, when the two distinct sequence groups (k2, k3, k4, k5, k8 & k1, k6, k7, Quebec) were compared, their sequences had a 97.38% and 100% match, respectively. This alone dismissed the hypothesis that the farther apart the collection sites are, the greater differences within the DNA sequences. For example, sample k1 was from the Vermont side of the Lake Champlain Basin, while
sample k7 was from the New York side of the basin, yet they still had a 100% DNA match despite the 100+ mile difference in distance between collection sites. Despite the DNA sequence differences, there was a 100% match for the amino acid sequences in both the S. fontinalis and S. trutta samples (Figure 4 and 5). It was most surprising how many differences there were in codon usage for the S. fontinalis samples already found in the NCBI database versus the samples collected for this study, particularly with the amino acids Glu, Tyr and Trp (Table 2). The codon usage for the S. trutta samples did not show as many differences. However, any differences observed were in the amino acids Pro, Arg, Asp. In this study, the S. trutta samples from the Lake Champlain Basin had a 100% match for one specific codon with each of the mentioned amino acids (Table 3). The DNA diversity of the S. fontinalis sequences, genetic distance and phylogenetic relationship data failed to show any distinct association with similar geographic location. Genetic differences within the S. trutta samples were not found in this study. Could the 100% match in the S. trutta samples be due to the stocking of the streams with this non-native species? Both New York and Vermont have long histories (decades) of stocking the Lake Champlain Basin with the non-native S. trutta from fish hatcheries within each state. Part of the argument for the stocking was to assist the fishing industry within the Lake Champlain Basin, since this contributes heavily to the local economy. Annually, there are over 40 different fishing tournaments within the basin. However, the Lake Champlain Basin is relatively young, being only 13,000 yrs old at best (25), perhaps not allowing enough time for genetic diversity to occur. Since this study did not resolve the phylogenetic relationships among the S. trutta samples, perhaps further studies are required based on more mtDNA or nuclear DNA genes. While
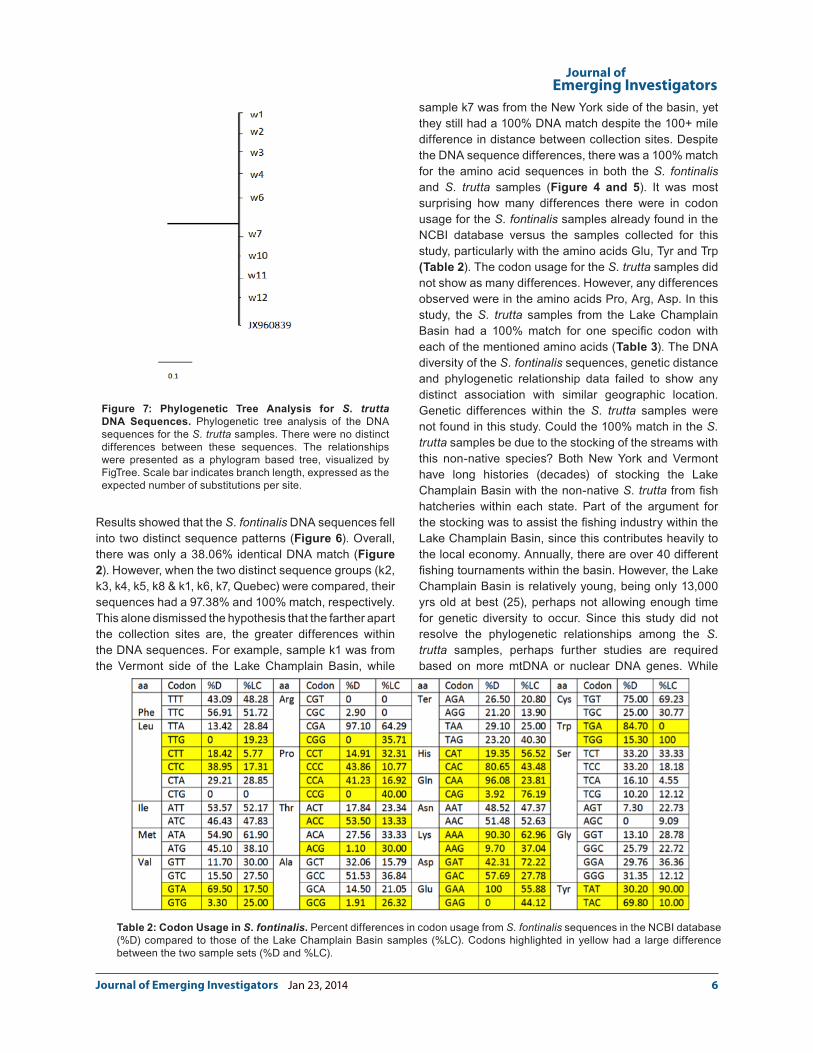
Figure 7: Phylogenetic Tree Analysis for S. trutta DNA Sequences. Phylogenetic tree analysis of the DNA sequences for the S. trutta samples. There were no distinct differences between these sequences. The relationships were presented as a phylogram based tree, visualized by FigTree. Scale bar indicates branch length, expressed as the expected number of substitutions per site.
Table 2: Codon Usage in S. fontinalis. Percent differences in codon usage from S. fontinalis sequences in the NCBI database (%D) compared to those of the Lake Champlain Basin samples (%LC). Codons highlighted in yellow had a large difference between the two sample sets (%D and %LC).

7Jan 23, 2014Journal of Emerging Investigators
Journal ofEmerging Investigators
mtDNA has been extremely useful in the study of genetic diversity, it should be noted that mtDNA is only inherited on the maternal side. Therefore, studying nuclear DNA might prove to be more useful for this kind of study. Still, in this study, the mtDNA did support that the tiger trout samples were due to a female S. fontinalis (brook trout) mating with a male S. trutta (brown trout), thus producing the S. fontinalis X S. trutta. While the number of samples for this study was limited due to habitat destruction and declining S. fontinalis populations, this study initiated genetic monitoring of the trout population, which was a priority for the New York State Department of Environmental Conservation. It also supported that S. fontinalis and S. trutta mate and produce sterile hybrids. In addition to the habitat destruction, which could be lowering the S. fontinalis population, an increased amount of phosphorus is getting into the basin and having a detrimental impact on the environment. Since 2002, Vermont alone has spent over $100 million in combined state and federal money with little improvements in water quality (26). The findings from this study were shared with the NYDEC, Lake Champlain Research Institute and the U.S. Department of Interior-Fish and Wildlife Vermont Division. These data may play a role in their decision-making with regards to trout habitat and the stocking of the tributaries with S. trutta.
Finally, the DNA sequences from this study will be submitted to the NCBI database, which will greatly enhance this database. Currently, only 20 Salvelinus fontinalis and 42 Salmo trutta partial and full DNA sequences for the cytochrome b gene are available, none of which are from the Lake Champlain Basin.
MethodsSample Collection and DNA Sequencing
Protocols were followed as described previously (5). To summarize, S. fontinalis, S. trutta and S. fontinalis X S. trutta were caught and released in True Brook in Saranac, New York and Great Brook in Plainfield, Vermont by electroshocking the water (Figure 1 and Table 1). The trout, N = 22 (Table 1), were scooped up in nets, small fin clippings were taken from the caudal fin or adipose fin and samples were put in sterile collection tubes. The collected fish were initially identified as S. trutta, S. fontinalis, and S. fontinalis X S. trutta. Gloves were worn when handling each fish. DNA was isolated following the Animal Tissue Spin Column Protocol from DNeasy® Blood and Tissue protocol from Qiagen. The isolated genomic DNA went through polymerase chain reactions (PCR) using PuReTaq Ready-To-Go PCR beads, 200-400 ng of DNA, and 2 µM of forward and reverse primers (Forward: 5’AAAA AGCTTCCATCCAACATCTCAGC3’, Reverse: 5’AAACTGCAGCCCCTCAGAAT GATATT3’). The thermal cycler was programmed for 35 cycles of 94oC for 30 sec, 56oC for 30 sec, and 72oC for one minute. After PCR, 4 µl of 5x loading dye was mixed with 20µl of each DNA sample and loaded into a 1.25% agarose gel containing ethidium bromide. Following DNA gel electrophoresis, each gel was visualized and photographed using a gel documentation system. Samples were excised from the gel and cleaned using Qiagen’s QIAquick Gel Extraction kit. Additionally, samples were sequenced using the Sanger method and analyzed through a sequence alignment program which produced phylogenetic trees. Several samples (w5, w8) were removed from this study due to trout
Table 3: Codon Usage in S. trutta. Percent differences in codon usage from S. trutta sequences in the NCBI database (%D) compared to those of the Lake Champlain Basin samples (%LC). Codons highlighted in yellow had a large difference between the two sample sets (%D and %LC).

8Jan 23, 2014Journal of Emerging Investigators
Journal ofEmerging Investigators
misidentification. Additionally, sample w9 was also removed due to sample size and damage.
The electroshocking and collection of sample clippings were performed by and under the permits of wildlife biologist Madeleine Lyttle (US Department of Fish and Wildlife) and Dr. Timothy Mihuc, Director of the Lake Champlain Research Institute, who provided the samples.
Sequence Alignment and Data AnalysisThis data set was composed of partial cytb gene
sequences from 21 sequences. All DNA sequences were viewed through 4Peaks (27). The following software programs were used for analysis: BLAST (28), CLUSTALW (29), Phylogenetic Tree Analysis, Translation (30), and Codon Analysis (31). Several sequences were excluded from this study because they were not from brook, brown or tiger trout, but were determined to be from rainbow trout.
Sequences EmployedIn addition to the cytb samples that were sequenced
from the collected brook, tiger, and brown trout samples, cytb sequences were also retrieved from the National Center for Biotechnology Information (NCBI) database. All 20 of the brook trout cytb sequences found in the NCBI database were collected, their accession numbers were: D58399; AB291985; KC344819 KC344820; JX960851; JX960852; HQ167699; DQ451369; DQ451367; DQ451365; DQ451363; DQ451361; DQ451359; DQ451368; DQ451366; DQ451364; DQ451362; DQ451360; AB291985; NC_000860; AF154850 . Also, 20 brown trout cytb sequences were retrieved from the NCBI database, the accession numbers were: D58400; JX960839; JX960837; JX960835; JX960836; JN007726; U63889; AF172396; U63892; U63890; U63888; JN007724; HQ167696; FJ608999; FJ608997; FJ608995; FJ608993; FJ608991; FJ608989; FJ608987. These sequences were used for comparative analysis with the sequences from this study.
Editor’s NoteHigher resolution images are available online at:
http://www.emerginginvestigators.org
AcknowledgementsA heartfelt thanks to wildlife biologist Madeleine Lyttle
(US Department of Fish and Wildlife) and Dr. Timothy Mihuc, Director of the Lake Champlain Research Institute, who provided the samples. Ms. Lyttle provided the fin clippings from trout on the Vermont side of the Lake Champlain Basin, while Dr. Mihuc provided fin clippings from trout on the New York side of the Lake
Champlain Basin. Funding for this project came from Dr. Elwess’ Sigma Xi research grant.
References1. Lake Champlain Basin (2007). Lake Champlain
Basin-Comprehensive Wildlife Conservation Strategy for New York. Retrieved May 4, 2013, 2013 from: http://www.dec.ny.gov/docs/wildlife_pdf/lkchamplaintxt.pdf
2. USA Today. Storm sets blizzard of Vermont Snow Records, March 8th, 2011. Retrieved from http://www.usatoday.com/weather/storms/winter/2011-03-08-vermont-snow-records_N.htm.
3. Burlington Free Press. Record rains prolong Vermont flood agony, retrieved from http://www.bur l ingtonfreepress.com/ar t ic le/20110517/NEWS02/110516022/Record-rains-prolong-Vermont-flood-agony
4. Harris, L. (2007) Beautiful Bastards. Field and Stream, Retrieved from http://www.fieldandstream.com/photos/gallery/kentucky/2007/03/beautiful-bastards-check-out-these-tiger-trout-photos
5. Palermo, M., Latourelle, S., Elwess, N.L. (2012). Genetic Analysis of the Brown, Brook, and Tiger Trout Populations in the Lake Champlain Basin. The Journal of Experimental Secondary Science 2 (1): 23-26.
6. Saccone, C., Gissi, C., Lanave, C., Larizza, A., Pesole, G., Reyes A. (2000) Evolution of the mitochondrial genetic system: an over-view. Gene 261: 153-159
7. McVeigh, H.P. and Davidson, W.S. (1991). A Salmonid phylogeny inferred from mitochondrial cytochrome b gene sequences. Journal of Fish Biology 39 (Supplement A): 277-282.
8. Bajpai, N. and Tewari, R.R. (2010). Mitochondrial DNA sequence-based phylogenetic relationship among flesh flies of the genus Sarocophago. Journal of Genetics 89 (1): 51-54.
9. Irwin, D. M., Kocher, T. D., Wilson A. C. (1991) Evolution of the cytochrome b gene of mammals. Journal of Molecular Evolution 32:128-144
10. Johns, G. C., Avise J. C. (1998) A comparative summary of genetic distances in the vertebrates from the mitochondrial cytochrome b gene. Molecular Biology and Evolution 15: 1481-1490
11. Callejas, C., Ochando, M. D. (2000) Recent radiation of Iberian barbell fish (Teleostei, Cyprinidae) inferred from cytochrome b genes. Journal of Heredity 91:283-288
12. Esposti, M.D.,DeVries, S., Crimi, A. et al (1993). Mitochondrial cytochrome b: evolution and structure of the protein. Biochimica et Biophysica Acta 1143:243-271.
13. Kumazawa, Y., Nishida, M. (2000). Molecular phylogeny of Osteoglossoids: a new model for
9Jan 23, 2014Journal of Emerging Investigators
Journal ofEmerging Investigators
Gondwanian origin and plate tectonic transportation of the Asian arowana. Molecular Biology and Evolution 17(2):1869-1878
14. Moore, W.S., DeFilippis, V. (1997). The window of taxonomic resolution for phylogenies based on mitochondrial cytochrome b In: Mindell DP Avian molecular evolution and systematic. Academic Press, New York, pp. 83-120.
15. Nunn, G.B, Stanley, S.E. (1998). Body size effects and rates of cytochrome b evolution in tube-nosed seabirds. Molecular Biology and Evolution 15(10):1360-1371
16. Orti, G., Meyer, A. (1996). Molecular evolution of ependymin and the phylogenetic resolution of early divergences among teleost fishes. Molecular Biology and Evolution 13(4):556-573.
17. Orti, G., Meyer, A. (1997). The radiation of characiform fishes and the limits of resolution of mitochondrial ribosomal DNA sequences. Systematic Biology 46(1):75-100.
18. Martin, A.P., Bermingham, E. (1998). Systematics and evolution of lower Central American cichlids inferred from analysis of cytochrome b gene sequence. Molecular Phylogenetics and Evolution 9:192-203.
19. Loverjoy, N.R., deAraújo, M.L.G., (2000). Molecular systematics, biogeography, and population structure of Neotropical freshwater needle-fishes of the genus Potamorrhaphis. Molecular Ecology 9(3):259-268.
20. Kocher, T.D., Thomas, W.K., Meyer, A., Edwards, S.V., Paabo, S., Villablanca, F.X. and Wilson, A.C. (1989). Dymanics of Mitochondrial DNA evolution in animals: Amplification and sequencing with conserved primer. Proceedings of the National Academy of Sciences USA, 86: 6196-6200.
21. Irwin, D.M., Kocher, T.D., and Wilson, A.C. (1991). Evolution of the Cytochrome b gene in mammals. Journal of Molecular Evolution 32: 128-144.
22. Groves, P., and Shields, G.F. (1996). Phylogenetics of the Caprinae on cytochrome b sequence. Molecular Phylogenetics and Evolution 5(5): 467-476.
23. Durand, J.D., Tsigenopoulos, C.S., Unlu, E. and Berrebi, P. (2002). Phylogeny and biography of the family Cyprinidae in the Middle East inferred from cytochrome b DNA: Evolutionary significance of this region. Molecluar Phylogenetics and Evolution 22(1): 91-100.
24. Barat, A, Shahnawaz, A., Jyoti, S. and Sivaraman, G.K. (2012). Phylogenetic analysis of fishes of the subfamily Schizothoracinae (Teleostei: Cyprinidae) from Indian Himalayas using cytochrome b gene. Indian Journal of Fisheries 59(1): 43-47.
25. Lake Champlain Land Trust. Lake Champlain Facts. Retrieved November 15th, 2013: http://www.lclt.org/about-lake-champlain/lake-champlain-facts/
26. Lake Champlain Basin Program (2012). State of the Lake. Retrieved November 15th, 2013: http://sol.lcbp.org/introduction_what-is-state-of-lake-report.html
27. Griekspoor, Alexander, and Tom Groothuis. 4Peaks. Computer software. Vers. 1.7.2. N.p., 2006. Web.
28. BLAST. Standard Nucleotide BLAST. Computer software. BLAST. National Library of Medicine, n.d. Web. 5 Jan., 9 Mar., 24 Mar. 2013. <http://blast.ncbi.nlm.nih.gov/Blast.cgi?PROGRAM=blastn>.
29. GenomeNet. CLUSTALW. Computer software. Multiple Sequence Alignment. Kyoto University Bioinformatics Center, Sept. 1991. Web. 5 Jan., 9 Feb., 9 Mar., 24 Mar., 20 April, 4 May 2013. <http://www.genome.jp/tools/clustalw/>.
30. ExPASy. Translate. Computer software. ExPASy: Bioinformatics Resource Portal. SIB Swiss Institute of Bioinformatics, June 2011. Web. 8 Dec. 2012, 5 Jan., 9 Feb., 24 Mar. 2013. <http://web.expasy.org/translate/>.
31. Stothard, P. (2000) The Sequence Manipulation Suite (Codon Usage): Java Script programs for analyzing and formatting protein and DNA sequences. Biotechniques 28: 1102-1104. <http://www.bioinformatics.org/sms2/codon_usage.html>.