Embed Size (px)
Citation preview
Delft University of TechnologyMaster’s Thesis in Telecommunications and Sensing Systems
Characterization of Human Blockage in60 GHz Communication
Rizqi Hersyandika


Characterization of Human Blockage in 60 GHz
Communication
Master’s Thesis in Telecommunications and Sensing Systems
Embedded Software SectionFaculty of Electrical Engineering, Mathematics and Computer Science
Delft University of TechnologyMekelweg 4, 2628 CD Delft, The Netherlands
Rizqi [email protected]
18th November 2016

AuthorRizqi Hersyandika ([email protected])
TitleCharacterization of Human Blockage in 60 GHz Communication
MSc presentation18th November 2016
Graduation Committeeprof. dr.ir. K. Langendoen (chair) Delft University of Technologydr. ir. R. Venkatesha Prasad Delft University of TechnologyDr. Claudia Hauff Delft University of Technology
Abstract
The massive availability of bandwidth in the millimeter wave (mmWave)frequency band has the potential to address the challenges posed by the un-precedented increase in the mobile data traffic. Therefore, mmWave wirelessaccess is being seen as a promising candidate for multi-Gbps wireless accessin the next generation (i.e., 5G) of wireless communications. In particular,60 GHz frequency band with 9 GHz of unlicensed bandwidth (57–66 GHz) isbeing considered for the next generation of Wireless Local Area Networks(WLANs) for high data rate indoor communications. Although the 60 GHzband provides very high data rates, its signal propagation properties arequite different from the 2.4/5 GHz bands. The high free-space path lossin 60 GHz band requires directional antennas to compensate for this highpath loss. Further, the small wavelengths in 60 GHz frequency band makes60 GHz links highly susceptible to blockage due to its inability to penetratethe obstacles. For example, human shadowing overwhelmingly attenuatesthe received signal power and results in frequent blockages. In this thesis,we experimentally evaluate the impact of human blockage on the perform-ance (link quality, data rate) of Commercial Off-The Shelf (COTS) 60 GHzdevices.
To identify the blockages due to the human activities, we propose a react-ive blockage characterization algorithm based on the observation of signalquality degradation time; and signal quality recovery time. Based on this,we categorized the blockage into: (i) short-term and (ii) long-term block-age. Our measurement results indicate that different actions are required tocircumvent the link disruption caused by the long-term and the short-termhuman blockages. We show that in case of a long-term blockage, connectingto an alternate access point (AP) or searching for an alternate path helpsin maintaining the link quality. On the other hand, in case of short-termblockage it is not advantageous to look for alternate APs or paths due to itstransient nature. We also show that the incorrect detection of a blockagetype aggravates the throughput performance degradation. Furthermore, wederive an important trade-off relation between the decision time and theaccuracy of blockage-type detection, and show that by using an appropri-ate decision threshold, correct action can be executed with high detectionaccuracy.

iv

Preface
What makes 60 GHz communication topic interesting is its propagation char-acteristic that makes the communication has to be performed in a highly dir-ectional manner. Human activities play a role in the performance of 60 GHzcommunication as the link blockages due to human body significantly de-grade the link quality performance. The practical solution for minimizingthe human blockage impact on the link quality performance is a challengingwork. During this thesis project, I have learnt some theoretical knowledgeabout 60 GHz communication. Experimenting with a commercial 60 GHzdevice as well as the real human blockage make this work more interest-ing. I believe the results of this thesis can provide a practical approach toaddressing the human blockage issue in 60 GHz communication.
First of all, I would like to thank my daily supervisor, ir. Kishor Chandra,for his guidance during this thesis project. He was always helping me to solveany technical problem and giving me the moral support. Secondly, I wantto thank my supervisor, dr. RangaRao Venkatesha Prasad, for his insightand advice so that I can improve the quality of this work. My thanks alsogo to Prof. dr. Koen Langendoen for admitting me to this extraordinaryEmbedded Software group and giving me some important feedback. I alsowant to thank Dr. Claudia Hauff for being a committee member of mythesis. Special thanks go to my beloved wife Renya Tatiana Inaya, mydaughter Athalesha Fidrizna, my parents, and family for the support theyhave given me. Finally, I would like to thank my friends and everybody whowas involved in this work.
Rizqi Hersyandika
Delft, The Netherlands18th November 2016
v

vi
Contents
Preface v
1 Introduction 1
1.1 Problem Description . . . . . . . . . . . . . . . . . . . . . . . 3
1.2 Contribution . . . . . . . . . . . . . . . . . . . . . . . . . . . 3
1.3 Thesis Organization . . . . . . . . . . . . . . . . . . . . . . . 5
2 Background and Related Work 7
2.1 Propagation Characteristic of 60 GHz . . . . . . . . . . . . . 7
2.2 IEEE 802.11ad Standard . . . . . . . . . . . . . . . . . . . . . 9
2.2.1 Beamforming Training . . . . . . . . . . . . . . . . . . 10
2.3 Link Blockage in 60 GHz . . . . . . . . . . . . . . . . . . . . . 12
2.4 60 GHz Experimental Related Work . . . . . . . . . . . . . . 14
3 Link Blockage Effect Measurements 17
3.1 Measurement Methodology . . . . . . . . . . . . . . . . . . . 17
3.1.1 Hardware . . . . . . . . . . . . . . . . . . . . . . . . . 18
3.1.2 Signal Quality Measurement . . . . . . . . . . . . . . 19
3.1.3 Throughput Measurement . . . . . . . . . . . . . . . . 20
3.2 Preliminary Measurements . . . . . . . . . . . . . . . . . . . . 21
3.2.1 Association Time . . . . . . . . . . . . . . . . . . . . . 21
3.2.2 Beam Re-alignment Time . . . . . . . . . . . . . . . . 22
3.2.3 Directional Coverage . . . . . . . . . . . . . . . . . . . 22
3.2.4 Maximum Range . . . . . . . . . . . . . . . . . . . . . 23
3.2.5 Co-channel Interference . . . . . . . . . . . . . . . . . 24
3.3 Human Blockage Effect Measurement . . . . . . . . . . . . . 26
3.3.1 Scenario 1. Transient Blockage . . . . . . . . . . . . . 26
3.3.2 Scenario 2. Permanent Blockage With Only LOS Path 28
3.3.3 Scenario 3. Permanent Blockage With AlternativeNLOS Path . . . . . . . . . . . . . . . . . . . . . . . . 30
3.3.4 TCP and UDP Throughput . . . . . . . . . . . . . . . 32
vii
4 Human Blockage Characterization 354.1 Signal Quality Analysis . . . . . . . . . . . . . . . . . . . . . 354.2 Characterizing Blockage . . . . . . . . . . . . . . . . . . . . . 374.3 Blockage Solution . . . . . . . . . . . . . . . . . . . . . . . . . 40
4.3.1 Handover in Wireless Docking System . . . . . . . . . 404.3.2 Handover Performance . . . . . . . . . . . . . . . . . . 41
5 Evaluation 435.1 Disruption Time due to Blockage . . . . . . . . . . . . . . . . 43
5.1.1 Outage Duration of Short-term Blockage . . . . . . . . 435.1.2 Outage Duration of Long-term Blockage . . . . . . . . 44
5.2 Detection Accuracy . . . . . . . . . . . . . . . . . . . . . . . . 455.3 Optimum Decision Time . . . . . . . . . . . . . . . . . . . . . 485.4 Detection Accuracy vs Distance . . . . . . . . . . . . . . . . . 50
6 Conclusion 536.1 Future Work . . . . . . . . . . . . . . . . . . . . . . . . . . . 54
A IEEE 802.11ad MCS 61
B 60 GHz Experimental: Comparative Review 63
viii
Chapter 1
Introduction
The rapid proliferation of mobile devices and unprecedented increase in theuse of bandwidth-hungry applications have resulted in a massive growth inmobile data traffic. It is expected that by the year 2020, the total data trafficwill reach 1000 times that of the year 2010. Although many advanced tech-niques such as Multiple Input Multiple Output (MIMO), channel bondingand frame aggregation have been proposed to enhance the data rates of theexisting communication systems operating below 6 GHz (WiFi, LTE, etc.),the amount of available spectrum in the sub-6 GHz band is not sufficient tofulfill the desired growth in the network capacity.
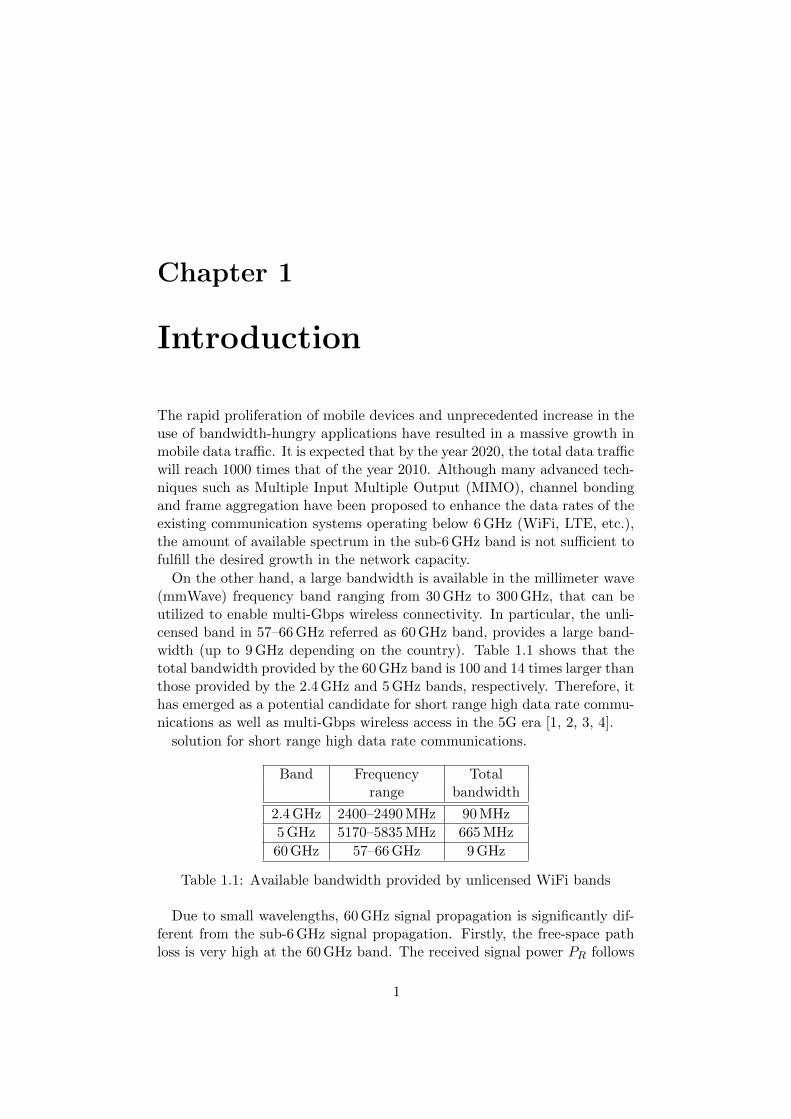
On the other hand, a large bandwidth is available in the millimeter wave(mmWave) frequency band ranging from 30 GHz to 300 GHz, that can beutilized to enable multi-Gbps wireless connectivity. In particular, the unli-censed band in 57–66 GHz referred as 60 GHz band, provides a large band-width (up to 9 GHz depending on the country). Table 1.1 shows that thetotal bandwidth provided by the 60 GHz band is 100 and 14 times larger thanthose provided by the 2.4 GHz and 5 GHz bands, respectively. Therefore, ithas emerged as a potential candidate for short range high data rate commu-nications as well as multi-Gbps wireless access in the 5G era [1, 2, 3, 4].
solution for short range high data rate communications.
Band Frequency Totalrange bandwidth
2.4 GHz 2400–2490 MHz 90 MHz
5 GHz 5170–5835 MHz 665 MHz
60 GHz 57–66 GHz 9 GHz
Table 1.1: Available bandwidth provided by unlicensed WiFi bands
Due to small wavelengths, 60 GHz signal propagation is significantly dif-ferent from the sub-6 GHz signal propagation. Firstly, the free-space pathloss is very high at the 60 GHz band. The received signal power PR follows
1

Friis transmission equation as shown below.
PR = PTGTGR
(λ
4πR
)2
(1.1)
PT , GT , GR, λ and R represent the transmit power, transmitter gain, re-ceiver gain, wavelength, and the distance between transmitter and receiver,respectively. Since PR is proportional to λ2 and frequency f = c/λ, thenPR is inversely proportional to f2. Comparing PR in a 60 GHz system withthose in both conventional 2.4 and 5 GHz systems, the 60 GHz link suffers27.96 dB and 21.58 dB higher path loss than 2.4 GHz and 5 GHz. Secondly,60 GHz signals are very susceptible to blockage from obstacles such as hu-mans.
Figure 1.1: 60-GHz WPAN application
Fortunately, due to the smaller wavelengths in mmWave bands, antennaelements can be closely packed to form high-gain directional antenna arraysthat can compensate for the high path loss. This compact size antenna arraymakes it easy to implement a 60 GHz radio chipset in our personal devicessuch as laptops and smartphones as well as other appliances such as TV, pro-jector, portable data storage or wireless router. Figure 1.1 shows an exampleof the 60 GHz application for Wireless Personal Area Network (WPAN).Multi-Gbps data rate provided by 60 GHz communication enables wirelesshigh definition video streaming, high-rate file transfer between devices andhigh-speed internet.
To leverage the available bandwidth in the 60 GHz band, several 60 GHzstandardization efforts such as IEEE 802.11ad [5], IEEE 802.15.3c [6], andECMA-387 [7] have been completed that provide Physical (PHY) and Me-dium Access Control (MAC) layer specifications. Among those standards,IEEE 802.11ad is the most widely used by the current 60 GHz devices be-cause of its backward compatibility with the legacy WiFi standard (IEEE
2
802.11b/g/n/ac). The IEEE 802.11ad standard supports a maximum datarate of 6.756 Gbps, which is more than 10–20 times the data rate supportedby the current IEEE 802.11n/ac.
1.1 Problem Description
The small wavelength and the usage of narrow beams in 60 GHz commu-nication make it vulnerable to blockage, especially the blockage due to thehuman body. Several measurement studies have reported that human block-age can attenuate the signal power by 20–36 dB[8, 9, 10].
The effect of human blockage on a 60 GHz link depends on various humanactivities. For example, a transient blockage resulting from a human walkingacross the link causes a temporary link disruption. On the other hand, apermanent blockage caused by a person standing in between the link for along duration might cause long-term link disruption. Hence, the primaryobjective of this thesis is to characterize and categorize the human blockagein 60 GHz links based on human activity and its effect on the link qualityperformance. By characterizing the blockage, a a 60 GHz device can identifythe blockage type and determine an action that has to be taken to circumventthe blockage.
The permanent human blockage might cause a long-term link disruption.In IEEE 802.11ad, there are several mechanisms for addressing the long-term blockage issue such as relay and Fast Session Transfer (FST). However,most of the current 60 GHz devices that are available in the market haveneither the relay nor FST mechanism ability. Therefore, in this thesis, wetry to solve the long-term blockage issue by using another approach, whichis handover between 60 GHz access points.
1.2 Contribution
The main contributions of this thesis are summarized as follows:
1. We provide a comprehensive review of 60 GHz experimental studiesby considering various factors such as hardware used, environment,parameters measured and issues solved.
2. We conducted extensive measurements to characterize the effects ofhuman blockage on 60 GHz links using a Commercial Off-The-Shelf(COTS) 60 GHz device based on the IEEE 802.11ad standard. Tostudy the properties of our 60 GHz device, several experiments tomeasure the association time, directional coverage, and the maximumcommunication range are conducted. Furthermore, we also presentexperimental studies regarding other 60 GHz related issues such as
3

the effect of misalignment on directional 60 GHz links and co-channelinterference.
3. We propose a human blockage characterization method to distinguishbetween a temporary and permanent human blockage in both Line-of-Sight (LOS) and Non-Line-of-Sight (NLOS) environments. The block-age characterization is based on the changes in the signal quality per-formance. It enables a 60 GHz station (STA) to determine the furtheraction that has to be taken for minimizing the link disruption perioddue to the blockage.
Monitor signalquality changes
Type ofblockage?
Handover to analternative AP
Keep theconnection with
current AP
long-term
short-term
Figure 1.2: Dealing with 60 GHz link blockage
Based on the duration of link disruption, the human blockage canbe categorized into two types: short-term and long-term blockage.Figure 1.2 describes how a 60 GHz station has to react following eachblockage type. In the case of short-term blockage, the station waitsuntil the signal quality recovers by maintaining the connection withthe current Access Point (AP). On the other hand, in the case of long-term blockage, maintaining the connection with the current AP resultsin a long-period link disruption, hence an alternate AP (if available)is selected.
4. We propose a handover mechanism between 60 GHz APs to overcomethe long-period link disruption due to the long-term blockage. It en-ables a STA to immediately look for and switch to an alternative APin case the primary link is obstructed. We design our handover processbased on the hard handover principle.
5. We evaluate our blockage characterization method in terms of theaccuracy of blockage-type detection and the link downtime resulting
4
from each blockage type. We found a trade-off between the decisionwaiting time and the detection accuracy. The optimum decision timeis then obtained so that the waiting time can be minimized while thehigh detection accuracy can be kept high.
1.3 Thesis Organization
The rest of this thesis is organized as follows. In Chapter 2, the back-ground information about 60 GHz communication and the related work areprovided. In Chapter 3, we explain about our measurement setup and showthe measurement results of human blockage effect on 60 GHz link. Followingthat, the blockage characterization method is explained in Chapter 4. Theperformance of blockage characterization is evaluated in Chapter 5. Finally,we conclude with general remarks and future work in Chapter 6.
5

6
Chapter 2
Background and RelatedWork
In this chapter, we provide background information and research work re-lated to 60 GHz communication. Firstly, the propagation characteristic in60 GHz band is described. In this band, the signal suffers higher path losscompared to that in the lower band so that the communication in the60 GHz band needs to be highly directional. Secondly, a standardizationeffort in 60 GHz communication, IEEE 802.11ad, is explained. This stand-ard provides the information about channelization in 60 GHz band, PHYand MAC layer specifications, and a mechanism called beamforming train-ing that is used to establish a directional communication. Following that,the link blockage issue in 60 GHz and how the current 60 GHz standard candeal with the blockage are discussed. Finally, a comprehensive review of the60 GHz experimental studies by considering various factors such as hardwareused, environment, parameters measured and issues solved is provided.
2.1 Propagation Characteristic of 60 GHz
Millimeter Wave (mmWave) band ranges from 30–300 GHz. In this band,the propagation suffers higher attenuation due to atmospheric gases, in-cluding oxygen and water/rain absorptions, when compared to the lowerfrequency band. For the frequency below 100 GHz, total atmospheric gasesattenuation reaches its peak (around 15 dB/km) at 60 GHz[11] as indicatedby the green rectangle in Figure 2.1. Therefore, this attenuation character-istic theoretically limits the usage of 60 GHz frequency band for long-rangecommunication.
Small wavelengths in 60 GHz band results in the two following propaga-tion issues: high free-space path loss and high penetration loss. The lattermakes the signal difficult to penetrate into an obstacle, including the humanbody, as discussed further in Section 2.3. As shown in Equation 1.1, the re-
7
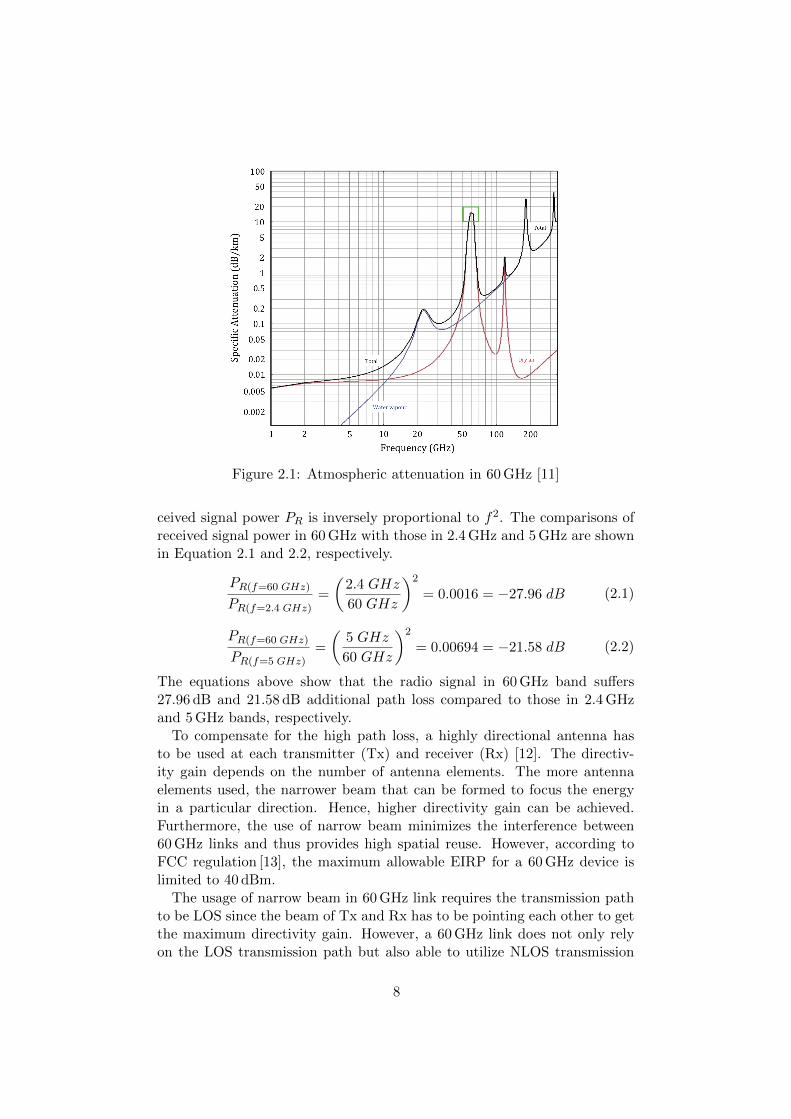
Figure 2.1: Atmospheric attenuation in 60 GHz [11]
ceived signal power PR is inversely proportional to f2. The comparisons ofreceived signal power in 60 GHz with those in 2.4 GHz and 5 GHz are shownin Equation 2.1 and 2.2, respectively.
PR(f=60 GHz)
PR(f=2.4 GHz)=
(2.4 GHz
60 GHz
)2
= 0.0016 = −27.96 dB (2.1)
PR(f=60 GHz)
PR(f=5 GHz)=
(5 GHz
60 GHz
)2
= 0.00694 = −21.58 dB (2.2)
The equations above show that the radio signal in 60 GHz band suffers27.96 dB and 21.58 dB additional path loss compared to those in 2.4 GHzand 5 GHz bands, respectively.
To compensate for the high path loss, a highly directional antenna hasto be used at each transmitter (Tx) and receiver (Rx) [12]. The directiv-ity gain depends on the number of antenna elements. The more antennaelements used, the narrower beam that can be formed to focus the energyin a particular direction. Hence, higher directivity gain can be achieved.Furthermore, the use of narrow beam minimizes the interference between60 GHz links and thus provides high spatial reuse. However, according toFCC regulation [13], the maximum allowable EIRP for a 60 GHz device islimited to 40 dBm.
The usage of narrow beam in 60 GHz link requires the transmission pathto be LOS since the beam of Tx and Rx has to be pointing each other to getthe maximum directivity gain. However, a 60 GHz link does not only relyon the LOS transmission path but also able to utilize NLOS transmission
8
path from the reflected signal. The first-order and second-order reflectedsignal reduce the received signal power by approximately 10 dB and 20 dB,respectively [14]. Therefore, the reflected signal, especially the first-orderreflection, is potential to become an alternative transmission path in casethe LOS path is unavailable.
2.2 IEEE 802.11ad Standard
To leverage the available bandwidth in 60 GHz band, several 60 GHz stand-ardization efforts such as IEEE 802.11ad, IEEE 802.15.3c, and ECMA-387have been completed. IEEE 802.11ad [5] and IEEE 802.15.3c [6] are thetask groups under IEEE formulating the standardization of PHY/MAC for60 GHz Wireless Local Access Networks (WLANs) and Wireless PersonalAccess Networks (WPANs), respectively. However, IEEE 802.15.3c taskgroup was hibernated in November 2009 [15]. Meanwhile, ECMA-387 [7]provides PHY, MAC and HDMI Protocol Adaptation Layer (PAL) standardfor 60 GHz wireless networks. The comparison of PHY, MAC and networkarchitecture between those three standards are discussed by K. Chandra etal. [16], in which IEEE 802.11ad is more favored to lead the 60 GHz com-munication because of its backward compatibility with the previous WiFistandard (IEEE 802.11 b/g/n/ac).
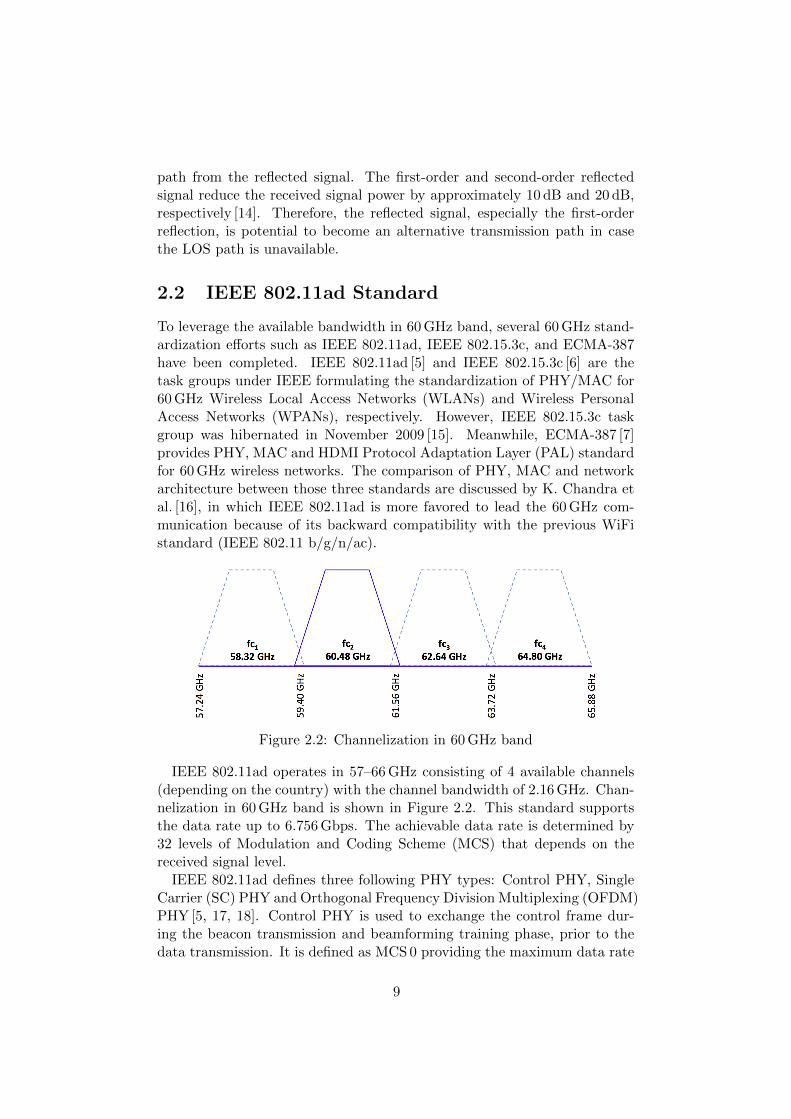
Figure 2.2: Channelization in 60 GHz band
IEEE 802.11ad operates in 57–66 GHz consisting of 4 available channels(depending on the country) with the channel bandwidth of 2.16 GHz. Chan-nelization in 60 GHz band is shown in Figure 2.2. This standard supportsthe data rate up to 6.756 Gbps. The achievable data rate is determined by32 levels of Modulation and Coding Scheme (MCS) that depends on thereceived signal level.
IEEE 802.11ad defines three following PHY types: Control PHY, SingleCarrier (SC) PHY and Orthogonal Frequency Division Multiplexing (OFDM)PHY [5, 17, 18]. Control PHY is used to exchange the control frame dur-ing the beacon transmission and beamforming training phase, prior to thedata transmission. It is defined as MCS 0 providing the maximum data rate
9

of 27.5 Mbps. SC PHY is used for the data transmission and is designedfor low-complexity and low-power transceivers. MCS 1–12 and MCS 25–31represent the SC PHY and low-power SC PHY, respectively, providing thedata rate from 385 Mbps to 4.62 Gbps. Meanwhile, OFDM PHY is used forhigher data rate performance. It is represented by MCS 13–24 providing thedata rate from 693 Mbps to 6.756 Gbps. The modulation type, code rate,achievable data rate and the required receiver sensitivity for all MCS indexesare shown in Appendix A.
2.2.1 Beamforming Training
As explained previously in Section 2.1, to compensate for the high path lossin 60 GHz frequency band, the transmission has to be highly directional. Thebeam of Tx and Rx have to be aligned precisely to achieve high directionalgain. In IEEE 802.11ad, the mechanism used for aligning the communicatingstation's beam is called beamforming training. Through this mechanism, a60 GHz station (STA) determines its best beam to be used for the datatransmission with its pairing STA, and vice versa. Beamforming trainingconsists of two phases: Sector Level Sweep (SLS) and an optional BeamRefinement Protocol (BRP).
Figure 2.3: Beamforming phase during a Beacon Interval
Sector Level Sweep (SLS)
SLS is the initial phase in beamforming training with the purpose of find-ing the best transmitting and receiving sector of two communicating STAs.The communicating STAs exchange the Sector Sweep (SSW) frames overdifferent antenna sectors. SLS phase occurs within Beacon Header Interval(BHI) in a Beacon Interval (BI) as described in Figure 2.3. During SLSphase, Control PHY is used.
SLS consists of two main steps: Initiator Sector Sweep (ISS) and Respon-der Sector Sweep (RSS). An initiator is a STA that initiates the beamform-ing training by transmitting SSW frames while a responder is a STA thatreceives the SSW frames transmitted by the initiator. Both initiator and
10
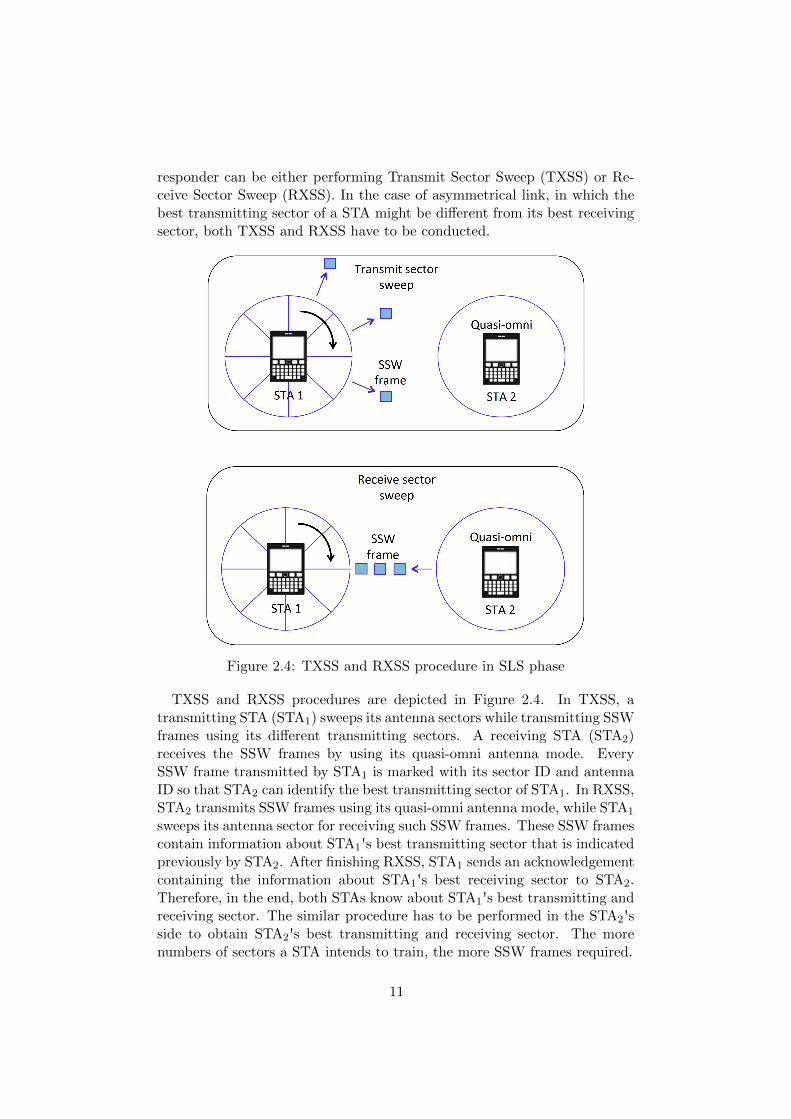
responder can be either performing Transmit Sector Sweep (TXSS) or Re-ceive Sector Sweep (RXSS). In the case of asymmetrical link, in which thebest transmitting sector of a STA might be different from its best receivingsector, both TXSS and RXSS have to be conducted.
Figure 2.4: TXSS and RXSS procedure in SLS phase
TXSS and RXSS procedures are depicted in Figure 2.4. In TXSS, atransmitting STA (STA1) sweeps its antenna sectors while transmitting SSWframes using its different transmitting sectors. A receiving STA (STA2)receives the SSW frames by using its quasi-omni antenna mode. EverySSW frame transmitted by STA1 is marked with its sector ID and antennaID so that STA2 can identify the best transmitting sector of STA1. In RXSS,STA2 transmits SSW frames using its quasi-omni antenna mode, while STA1
sweeps its antenna sector for receiving such SSW frames. These SSW framescontain information about STA1's best transmitting sector that is indicatedpreviously by STA2. After finishing RXSS, STA1 sends an acknowledgementcontaining the information about STA1's best receiving sector to STA2.Therefore, in the end, both STAs know about STA1's best transmitting andreceiving sector. The similar procedure has to be performed in the STA2'sside to obtain STA2's best transmitting and receiving sector. The morenumbers of sectors a STA intends to train, the more SSW frames required.
11
Beam Refinement Protocol (BRP)
BRP is an optional phase in beamforming training that aims to improve theTx and Rx antenna configuration by iteratively refining Antenna WeightVectors (AWV) of the transmitting and receiving sectors at both commu-nicating STAs. It can also be used to train the receiving STA's antennasector in case it has not been done in the previous SLS phase. BRP phasetakes place within Data Transmission Interval (DTI) as described in Figure2.3.
BRP consists of these following subphases: BRP setup, Multiple sector IDDetection (MID), Beam Combining (BC) and beam refinement transaction.BRP setup is used to request the execution of MID or BC subphase. In MIDsubphase, a transmitting STA uses quasi-omni mode while the receiving STAsweeps its Rx AWV configuration. This procedure is similar with RXSS inSLS phase. In BC subphase, both transmitting and receiving STAs test theirmultiple Tx AWVs and Rx AWVs to find the best combination of Tx AWVand Rx AWV among them. Lastly, beam refinement transaction subphaseis used to exchange the beam refinement request and response.
2.3 Link Blockage in 60 GHz
Link disruption in 60 GHz communication is caused by two factors: beammisalignment and link blockage. Beam misalignment can be caused by theuser movement such as rotation or displacement. Meanwhile, in link block-age, the beam is blocked by an obstacle leading to the degradation of linkquality. Both factors make the beam pair between two communicating STAsbecomes no longer supporting the communication.
Several studies have been performed in distinguishing the causes of linkoutage in 60 GHz communication. Tsang et al. [19] distinguish between thelink outage due to the device mobility and the human blockage without anyexternal aid from GPS or sensor. They make use the rate of signal powerdrop and the validity of beam selection. Meanwhile, Doff et al. [20] employthe motion sensor to determine the cause of beam errors and predict thebeam selection for the next transmission based on the user's motion.
As mentioned in Section 2.1, the small wavelength in 60 GHz band resultsin high penetration loss that makes the signal difficult to penetrate into anobstacle such as the wall, furniture and the human body. The human bodypotentially causes a shadowing effect in 60 GHz LOS transmission path. Itcauses an additional 20–36 dB attenuation [8, 9, 10] and thus significantly re-duces the received signal power. The obstruction duration caused by humanbody blockage ranges from 370–820 ms [10]. Several studies in modelling thehuman body blockage in a 60 GHz link are performed [21, 22, 23, 24]. Forexample, Gustafson et al. [23] uses a phantom filled with water to model thehuman body blockage as it has similar shadowing and reflection properties
12
to the real human body.To respond the link blockage, a STA can perform either proactive or
reactive action. In the proactive method, the STA continuously monitorsthe link, predicts when the blockage will occur and takes an action before thelink quality decreases due to the blockage. Usually, this method requires anexternal aid such as sensor or camera. Oguma et al. [25] uses RGB-D camerasfor predicting the position, velocity, and direction of moving pedestrians sothat the STA can switch to another AP before the pedestrians block theLOS path. On the other hand, in the reactive method, the action is onlytaken immediately after the link quality degradation due to the blockage isdetected. In this case, the signal has already been attenuated due to theobstruction. However, no additional aid is required in this method.
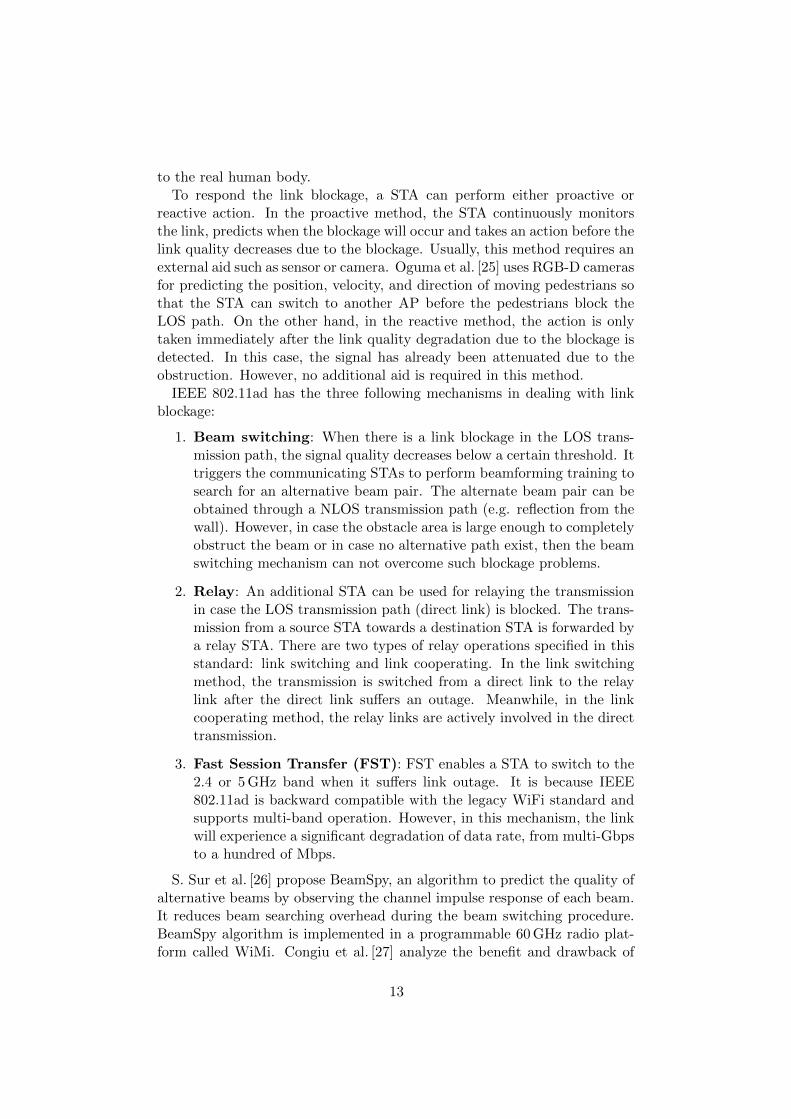
IEEE 802.11ad has the three following mechanisms in dealing with linkblockage:
1. Beam switching: When there is a link blockage in the LOS trans-mission path, the signal quality decreases below a certain threshold. Ittriggers the communicating STAs to perform beamforming training tosearch for an alternative beam pair. The alternate beam pair can beobtained through a NLOS transmission path (e.g. reflection from thewall). However, in case the obstacle area is large enough to completelyobstruct the beam or in case no alternative path exist, then the beamswitching mechanism can not overcome such blockage problems.
2. Relay: An additional STA can be used for relaying the transmissionin case the LOS transmission path (direct link) is blocked. The trans-mission from a source STA towards a destination STA is forwarded bya relay STA. There are two types of relay operations specified in thisstandard: link switching and link cooperating. In the link switchingmethod, the transmission is switched from a direct link to the relaylink after the direct link suffers an outage. Meanwhile, in the linkcooperating method, the relay links are actively involved in the directtransmission.
3. Fast Session Transfer (FST): FST enables a STA to switch to the2.4 or 5 GHz band when it suffers link outage. It is because IEEE802.11ad is backward compatible with the legacy WiFi standard andsupports multi-band operation. However, in this mechanism, the linkwill experience a significant degradation of data rate, from multi-Gbpsto a hundred of Mbps.
S. Sur et al. [26] propose BeamSpy, an algorithm to predict the quality ofalternative beams by observing the channel impulse response of each beam.It reduces beam searching overhead during the beam switching procedure.BeamSpy algorithm is implemented in a programmable 60 GHz radio plat-form called WiMi. Congiu et al. [27] analyze the benefit and drawback of
13
using a relay and FST mechanism. Relay option is preferred for a networkwith high traffic and low beam training overhead while the FST option ismore suitable for a network with low traffic and low blockage probability.
2.4 60 GHz Experimental Related Work
We provide a comprehensive review of 60 GHz experimental studies con-cerning the hardware used, environment, parameters measured and issuessolved. We categorize the hardware used into two types: COTS and cus-tomized hardware. The COTS hardwares commonly used for the experimentare wireless docking stations with the 60 GHz radio chipset manufacturedby Wilocty. Meanwhile, for the customized hardware, the setup mainly con-sists of a signal generator, 60 GHz transceiver, and the directional antenna.The additional receiver or signal analyzer might be used to observe someparameters. The parameters measured are the received signal quality, PHYlink rate, application layer throughput, frame level as well as the latency.
Most of the experiments are conducted in indoor environments such ashome, office and the data center. Meanwhile, only a few of them discussabout the feasibility of 60 GHz application in the outdoor environment.Several issues discussed are the communication range, deafness effect, in-terference, human blockage, user movement and the beamforming overhead.The detailed review of 60 GHz experimental studies is shown in AppendixB.
Saha et al. [29] analyze signal quality and throughput performance againstthe distance and height diversity in the indoor environment using COTS60 GHz device. Besides that, the effect of human blockage and channel in-terference are also investigated. Nitsche et al. [30] observe frame level, beampattern, reflections, and interference. They use two different COTS 60 GHzsystems: (i) Wireless Docking System (WiGig) and (ii) WirelessHD. An ad-ditional receiver is used to measure the received signal power over the air andto analyze the frame. The frame loss and retransmission monitored indicatesthe interference between two systems. The inter-system interference occursbecause WiHD system does not use CSMA/CA and thus blindly transmitsdata causing collision to WiGig system. Ansari et al. [31] perform an experi-mental study of the throughput and BER performance for the indoor 60 GHznetwork. They experimented with the three different customized 60 GHztransceivers: Hittite Microwave HMC6000/1 with on-chip antenna provid-ing 38 dB gain, SiversIMA FC1005V/00 and HXI GigaLink 6651. The lasttwo setups are equipped with two types of horn antenna providing 10 dBi and25 dBi gain. The results show that BER increases when higher sub-carriermodulation is used. It is because high sub-carrier modulation requires ahigh Signal-to-Noise Ratio (SNR). Loch et al. [32] study the effect of deaf-ness due to the directionality in mm-wave networks. The author uses two
14
pairs of Wireless Docking System to recreate the deafness scenario betweentwo 60 GHz links. Ostinato program is used for generating data streams andWireshark is utilized for the delay jitter measurement. The results show thatas the level of frame aggregation increases, the throughput fairness betweentwo 60 GHz links can be achieved. It is because the less number of packetsmakes the collision occurs less frequently despite the deafness.
Maltsev et al. [14] perform an experimental investigation of 60 GHz WLANsin the office environment (conference room and cubicle) without the presenceof human activity. The results show that the first-order and second-orderreflected signal reduce the received signal power by approximately 10 dB and20 dB, respectively and thus can still provide sufficient SNR for the commu-nication. Halperin et al. [33] propose wireless flyways mechanism by addingextra capacity using the 60 GHz wireless network to alleviate the oversub-scribed link in the data center. To that end, they use customized 60 GHzHXI radios that are placed on top of the server racks. They investigate thethroughput stability, interference and security of the 60 GHz network usageinside the data center. The separation distance between two parallel linksusing the same frequency should be sufficient to avoid co-channel interfer-ence. In addition, the usage of different channels in each link and highlydirective antenna can reduce the separation distance. Still related to the60 GHz application in the data center, Zhu et al. [34] propose Angora, whichis a static 60 GHz wireless link connecting server racks for providing controltraffic in the data center. The results confirm that the angular separationplays an important role for minimizing the interference between two 60 GHzlinks, in which larger angular separation results in lower throughput loss.
For the outdoor environment, Y. Zhu et al. [35] investigate the feasibilityof 60 GHz picocell implementation in an urban environment. The meas-urements are performed using both COTS and customized 60 GHz devices.Range, user motion, blockage, and interference are observed. In this work,the authors dispel common myths about the feasibility of 60-GHz picocellsuch as the range limitation in the outdoor environment and the difficultyin achieving robust communication due to user mobility and link blockage.Simic et al. [36] investigate the beam steering requirement in the mm-waveurban outdoor environment (residential and commercial urban area) thatconsists of a heterogeneous mix of building materials. The various locationsare chosen in order to observe both LOS and NLOS transmission paths.The results show that 10° misalignment degrades the achievable data rateby 20–100 %. Therefore, the beam steering between Tx and Rx is requiredto overcome this beam misalignment issue.
In this thesis, we investigate the effect of human blockage in 60 GHz linkand propose a method for characterizing the blockage based on the ob-servation of the signal quality degradation and the signal quality recovery.The blockage characterization aims to reduce the link disruption effect dueto each blockage type. To that end, we perform experimental measure-
15
ments using COTS 60 GHz wireless docking station equipped with Intel-manufactured 60 GHz radio chipset. The experiments are conducted in in-door environments with LOS and NLOS scenarios. The normalized signalquality and link throughput performance are measured.
16
Chapter 3
Link Blockage EffectMeasurements
In this chapter, we provide measurement results using the Dell devices(laptops and docking station) that are equipped with the 60 GHz IEEE802.11ad chipsets. Our measurement results consists of: (i) preliminarymeasurements to characterize the communication range, directional cover-age patterns, connection establishment time, effect of misalignment on thelink quality and beam re-alignment time of the devices used; (ii) effects ofco-channel interference on the link performance when two links are operatingin a close proximity; and (iii) effect of human shadowing on the link per-formance considering temporary and permanent human blockages. For thepreliminary and the co-channel interference measurements, we only considerLOS scenarios while the human blockage measurement were conducted whenboth the LOS and NLOS paths were available. We used the received signalquality and link throughput as the parameters to discuss the measurementresults.
3.1 Measurement Methodology
The measurements were conducted in a hall with the dimension of 9 x 5 x 4 m,where no reflection and only LOS transmission path between two commu-nicating devices were expected. However, since we can not control the beamdirection and the beam switching process, there is a possibility that thedevices will establish a NLOS transmission path as a result of the signalreflected-off the wall. We performed the measurement with the separationdistance between the two devices (d) of 3 and 7 m to observe the effect ofthe distance variation on the link quality degradation. The human blockagewas introduced in the middle of the distance between the two devices (d) ata height of 1.2 m. To observe the link quality degradation, we measured twofollowing parameters: (1) Normalized signal quality and (2) Throughput.
17

3.1.1 Hardware
To create a 60 GHz network, we use a COTS 60 GHz wireless docking systemconsisting of a pair of Dell WLD15 wireless docking station and Dell LatitudeE7450 laptop as shown in Figure 3.1. The docking station and the laptopact as the Access Point (AP) and the wireless station (STA), respectively.These devices can establish a point-to-point wireless connection in which onelaptop can only connect to one docking station at a time, and vice versa. Thewireless docking stations are designed to reduce the wire usage and increasethe user mobility when connecting the laptop to multiple devices such as themonitor, portable data storage, and router. This wireless docking stationenables the wired connection to display monitor (via HDMI, miniDP or VGAport), portable data storage (via USB 2.0 or USB 3.0 port) and Ethernetrouter/switch (via Gigabit Ethernet port).
Figure 3.1: COTS 60 GHz wireless docking system
The docking station and laptop are equipped with Intel Wireless GigabitSink W13100 dock module [37] and Intel Tri-Band Wireless-AC 17265 radiochipset [38], respectively. It supports three channels in the 60 GHz band withthe following center frequencies (fc): 58.32 GHz, 60.48 GHz, and 62.64 GHz.For the experiment, we use the third channel. Its beamforming and rateadaptation mechanism are based on the IEEE 802.11ad standard. It usesControl PHY (MCS 0) to exchange the control frame and Single CarrierPHY (MCS 1-12) for the data transmission supporting the data rate of 385–4620 Mbps, as indicated in Table A.1. By default, this system automaticallyperform beam switching to find an alternative beam (transmission path) ifit detects the signal quality degradation.
Limitations
This wireless docking system does not enable the user to access the lowerlayer (PHY and MAC) information. It comes with an Application Pro-gramming Interface (API) providing very limited information about the linkquality parameters. Unlike the other wireless docking system whose radio
18
chipset is manufactured by Wilocty [29, 30, 35], the Intel-manufactured wire-less docking system does not provide PHY data rate information. Instead,the only information about the link quality is represented by the normal-ized signal quality parameter in the scale of 0 to 10. Moreover, the GigabitEthernet port available in the AP limits the data rate to 1 Gbps. Therefore,it becomes a bottleneck when measuring the actual link rate since a multi-Gbps data rate provided by the 60 GHz connection can not be achieved.Moreover, our 60 GHz wireless docking system does not support the relayand FST mechanism.
3.1.2 Signal Quality Measurement
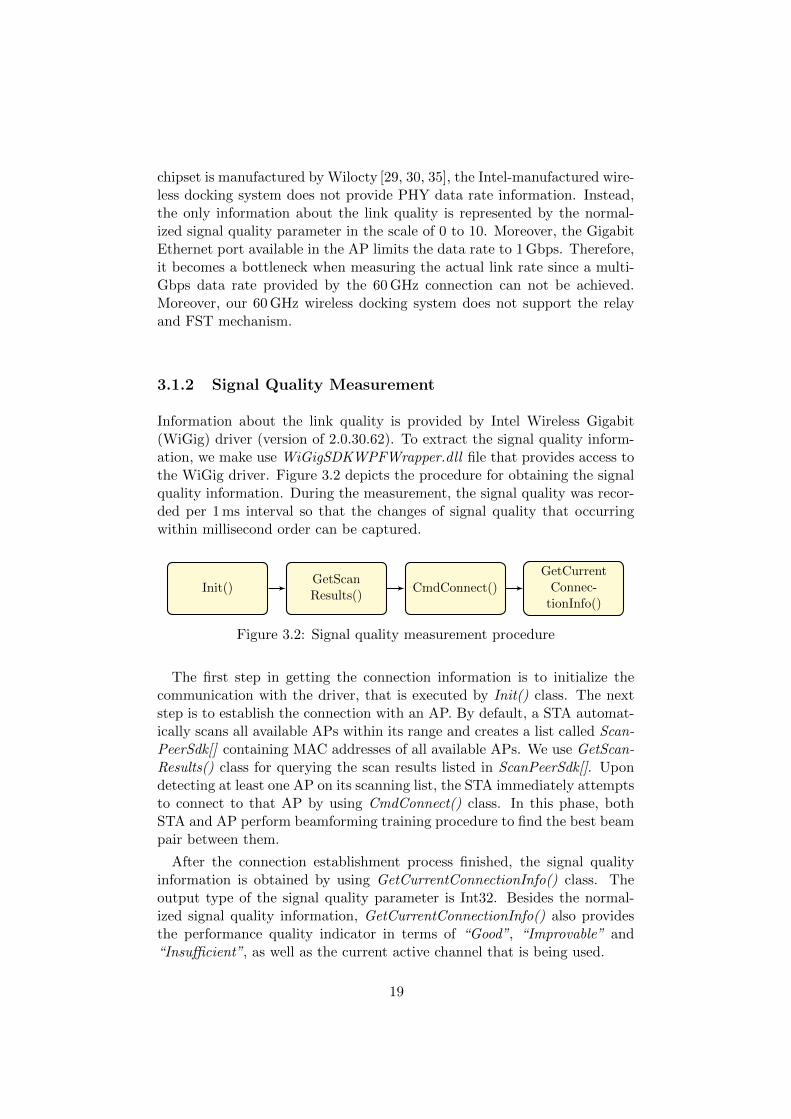
Information about the link quality is provided by Intel Wireless Gigabit(WiGig) driver (version of 2.0.30.62). To extract the signal quality inform-ation, we make use WiGigSDKWPFWrapper.dll file that provides access tothe WiGig driver. Figure 3.2 depicts the procedure for obtaining the signalquality information. During the measurement, the signal quality was recor-ded per 1 ms interval so that the changes of signal quality that occurringwithin millisecond order can be captured.
Init()GetScanResults()
CmdConnect()
GetCurrentConnec-
tionInfo()
Figure 3.2: Signal quality measurement procedure
The first step in getting the connection information is to initialize thecommunication with the driver, that is executed by Init() class. The nextstep is to establish the connection with an AP. By default, a STA automat-ically scans all available APs within its range and creates a list called Scan-PeerSdk[] containing MAC addresses of all available APs. We use GetScan-Results() class for querying the scan results listed in ScanPeerSdk[]. Upondetecting at least one AP on its scanning list, the STA immediately attemptsto connect to that AP by using CmdConnect() class. In this phase, bothSTA and AP perform beamforming training procedure to find the best beampair between them.
After the connection establishment process finished, the signal qualityinformation is obtained by using GetCurrentConnectionInfo() class. Theoutput type of the signal quality parameter is Int32. Besides the normal-ized signal quality information, GetCurrentConnectionInfo() also providesthe performance quality indicator in terms of “Good”, “Improvable” and“Insufficient”, as well as the current active channel that is being used.
19

3.1.3 Throughput Measurement
Throughput refers to the amount of data (in bits or Bytes) delivered throughthe network for a given amount of time. To measure the throughput, weuse TCP traffic that is generated and measured by Iperf3 (version 3.1.3) [39].Figure 3.3 depicts the throughput measurement setup between STA and AP.An additional laptop (Macbook Air OS X 10.9.4) generating and sendingthe TCP traffic is connected to the docking station via Gigabit Ethernetinterface. The docking station uses Realtek USB GBE Family Controllerdriver version 7.6.1009.2013.
Figure 3.3: Throughput measurement setup
A static IP address is assigned in each laptop for enabling the IP commu-nication between the server and client. In our configuration, the laptopconnected to the docking station through the 60-GHz link (IP address:192.168.0.20) becomes the Iperf3 client while the additional laptop attachedto the docking station via Gigabit Ethernet interface (IP address: 192.168.0.10)becomes the Iperf3 server. Most of the configuration parameters are set inthe Iperf3 client side. The following example command is used for runningIperf3 on the client side:
i p e r f 3 −c 1 9 2 . 1 6 8 . 0 . 1 0 −b 1000m −w 3728270 −t 30 − i 0 . 1 −R
192.168.0.10 refers to the server's IP address. “-b 1000m -w 3728270” in-dicate the maximum bandwidth of 1 Gbps and the TCP window size of3728270 Bytes, respectively. The measurement duration is 30 s with the re-porting interval of 100 ms as indicated by “-t 30 -i 0.1” command. Normally,the client becomes the traffic sender, and the server becomes the receiver.However, we use the reverse mode, indicated by “-R” command, so that theserver sends the traffic to the client. Therefore, in this case, the dockingstation becomes a Tx while the laptop becomes an Rx.
Bandwidth 1 GbpsMaximum Segment Size 1460 Bytes (default)TCP Window Size 3728270 Bytes
Table 3.1: TCP throughput measurement parameter
20

The parameters used in the TCP throughput measurement are shown inTable 3.1. Maximum Segment Size (MSS) indicates the maximum payload ina single TCP segment, excluding the IP header (20 Bytes) and TCP header(20 Bytes). For this measurement, we use the default MSS of 1460 Bytes.Meanwhile, TCP window size indicates the maximum data that can be sentby the sender before the receiver acknowledges it. In other words, it indicatesthe maximum buffer size at the receiver. Setting this parameter too smallreduces the maximum achievable throughput. Therefore, we set the TCPwindow size as large as possible in which 3728270 Bytes is the maximumTCP window size supported by the system.
3.2 Preliminary Measurements
3.2.1 Association Time
Association time is the time required by a STA and an AP to establish a60 GHz connection. It also refers to the duration of when the STA initiatesthe CmdConnect() command until the best beam pair between STA andAP is obtained. Initially, when the STA is not connected yet to the AP, themeasured signal quality equals to 0. After running the CmdConnect() com-mand, the association process begins. It involves the beamforming trainingprocess as explained in Section 2.2.1. During the association process, thesignal quality equals to 1. After the best beam pair between the STA andAP has been aligned, the connection is established, indicated by the risingof signal quality from 1 to a certain higher value.
0 100 200 300 4000
2
4
6
8
10
Time (ms)
No
rma
lize
d s
ign
al q
ua
lity
Figure 3.4: Association time
0 20 40 600
2
4
6
8
10
Time (ms)
No
rma
lize
d s
ign
al q
ua
lity
Figure 3.5: Beam re-alignment time
An example of signal quality snapshot during the association process isdepicted in Figure 3.4. In this measurement, the position of STA is LOSwith AP, and the distance between them is 3 m. The measurement resultsshow that the average association time is 146.8 ms.
21

3.2.2 Beam Re-alignment Time
Beam re-alignment time is defined as the time required by a STA and anAP to re-align their beam in case the beam misalignment occurs. The beammisalignment occurs if either STA or AP is rotated. As soon as STA andAP detect the link quality degradation due to the beam misalignment, theytry to re-align their beam by performing the beamforming training.
To measure the beam re-alignment duration due to the rotation, the dock-ing station was rotated by 60°, while the laptop position is kept fixed. Thechanges of signal quality and the timestamp in ms were recorded. The beamre-alignment time is indicated since the signal quality starts dropping to 1as a result of beam misalignment until it reaches a certain higher value againfollowing the beamforming training process. Figure 3.5 describes an exampleof signal quality snapshot during the re-alignment time. The average beamre-alignment time is 7.65 ms.
3.2.3 Directional Coverage
During our initial investigation, we found that the 60 GHz antenna array ofthe laptop is located on the top left laptop's lid since it is the most sensitivearea affected by the blockage. Meanwhile, for the docking station, the frontside of the dock becomes the area transmitting the strongest signal power.
To measure the directional coverage of the docking station, we rotate thedocking station by 360° while keeping the laptop position fixed. The signalquality is recorded for every 10° rotation angle interval. The same thingalso applied for the laptop's directional coverage measurement. The meas-urement was conducted in an LOS environment with the distance betweenthe docking station and laptop of 4 m. There is no traffic presence duringthis measurement.
5 10
30
210
60
240
90270
120
300
150
330
180
0
(a) Docking station
5 10
30
210
60
240
90270
120
300
150
330
180
0
(b) Laptop
Figure 3.6: Directional coverage measurement results
Figure 3.6 (a) and (b) show the directional coverage results of the docking
22
station and the laptop, respectively. The results show that both antennaarrays of the docking station and laptop only support 180° coverage, espe-cially in the front area of the devices. It is indicated by the high signalquality monitored within -90° to 90° angle. In Figure 3.6(b), the laptop'sdirectional coverage seems bit asymmetric because the antenna array of thelaptop is located on the top left of laptop's lid.
3.2.4 Maximum Range
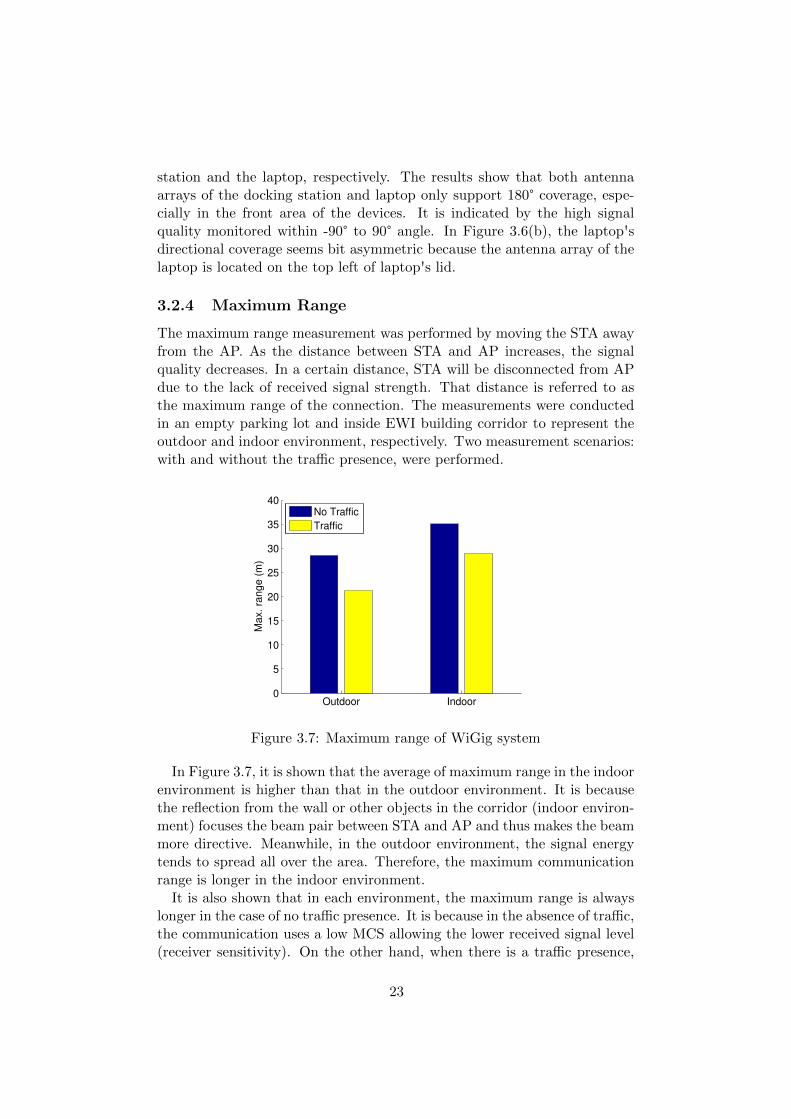
The maximum range measurement was performed by moving the STA awayfrom the AP. As the distance between STA and AP increases, the signalquality decreases. In a certain distance, STA will be disconnected from APdue to the lack of received signal strength. That distance is referred to asthe maximum range of the connection. The measurements were conductedin an empty parking lot and inside EWI building corridor to represent theoutdoor and indoor environment, respectively. Two measurement scenarios:with and without the traffic presence, were performed.
Outdoor Indoor0
5
10
15
20
25
30
35
40
Ma
x.
ran
ge
(m
)
No Traffic
Traffic
Figure 3.7: Maximum range of WiGig system
In Figure 3.7, it is shown that the average of maximum range in the indoorenvironment is higher than that in the outdoor environment. It is becausethe reflection from the wall or other objects in the corridor (indoor environ-ment) focuses the beam pair between STA and AP and thus makes the beammore directive. Meanwhile, in the outdoor environment, the signal energytends to spread all over the area. Therefore, the maximum communicationrange is longer in the indoor environment.
It is also shown that in each environment, the maximum range is alwayslonger in the case of no traffic presence. It is because in the absence of traffic,the communication uses a low MCS allowing the lower received signal level(receiver sensitivity). On the other hand, when there is a traffic presence,
23
higher MCS is used. The higher MCS requires higher receiver sensitivitythat makes the connection easier to be disrupted whenever the receivedsignal level requirement can not be achieved. Consequently, with the samereceived signal value at a certain distance, the presence of traffic in thenetwork shorten the maximum range.
3.2.5 Co-channel Interference
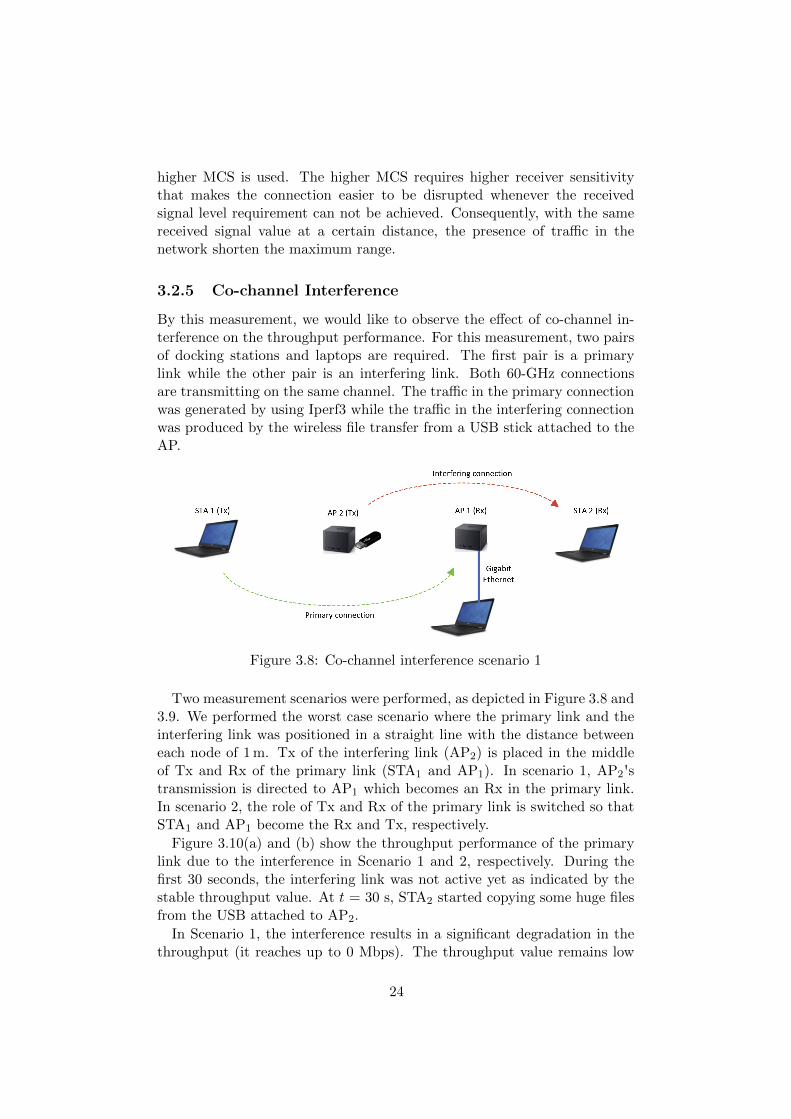
By this measurement, we would like to observe the effect of co-channel in-terference on the throughput performance. For this measurement, two pairsof docking stations and laptops are required. The first pair is a primarylink while the other pair is an interfering link. Both 60-GHz connectionsare transmitting on the same channel. The traffic in the primary connectionwas generated by using Iperf3 while the traffic in the interfering connectionwas produced by the wireless file transfer from a USB stick attached to theAP.
Figure 3.8: Co-channel interference scenario 1
Two measurement scenarios were performed, as depicted in Figure 3.8 and3.9. We performed the worst case scenario where the primary link and theinterfering link was positioned in a straight line with the distance betweeneach node of 1 m. Tx of the interfering link (AP2) is placed in the middleof Tx and Rx of the primary link (STA1 and AP1). In scenario 1, AP2'stransmission is directed to AP1 which becomes an Rx in the primary link.In scenario 2, the role of Tx and Rx of the primary link is switched so thatSTA1 and AP1 become the Rx and Tx, respectively.
Figure 3.10(a) and (b) show the throughput performance of the primarylink due to the interference in Scenario 1 and 2, respectively. During thefirst 30 seconds, the interfering link was not active yet as indicated by thestable throughput value. At t = 30 s, STA2 started copying some huge filesfrom the USB attached to AP2.
In Scenario 1, the interference results in a significant degradation in thethroughput (it reaches up to 0 Mbps). The throughput value remains low
24

Figure 3.9: Co-channel interference scenario 2
for most of the time and can not recover to 900 Mbps as it before theinterference was introduced. It is because AP2 transmits in the oppositedirection of STA1 so that STA1 can not hear the transmission between AP2
and STA2. It causes packet collisions at AP1. The collision keeps occurringas both Tx in the primary and interfering link (STA1 and AP2) can not heareach other's transmission. This deafness effect is a result of the directionalcommunication in 60 GHz.
0 20 40 60 800
200
400
600
800
1000
Time (s)
Th
rou
gh
pu
t (M
bp
s)
(a) Scenario 1
0 20 40 60 800
200
400
600
800
1000
Time (s)
Th
rou
gh
pu
t (M
bp
s)
(b) Scenario 2
Figure 3.10: Throughput performance due to co-channel interference
Meanwhile, in Scenario 2, the throughput degradation is not as significantas that in Scenario 1. The throughput fluctuates, but 900 Mbps throughputcan still be achieved in some period during the moment of interference. Itis because AP2 transmits in the direction of STA1 (Tx) so that STA1 canhear the transmission of interfering link. Therefore, in this scenario, packetcollision occurs less frequently if compared to that in Scenario 1. BothTx in the primary and interfering links contend for the channel access. InIEEE 802.11ad, the channel contention during the data transmission intervaloccurs on Contention Based Access Period (CBAP). When using different
25
channels, no throughput degradation was observed.
3.3 Human Blockage Effect Measurement
We performed three following measurement scenarios to represent the bothtransient and permanent blockage caused by the human activities in LOSand NLOS 60 GHz environments.
3.3.1 Scenario 1. Transient Blockage
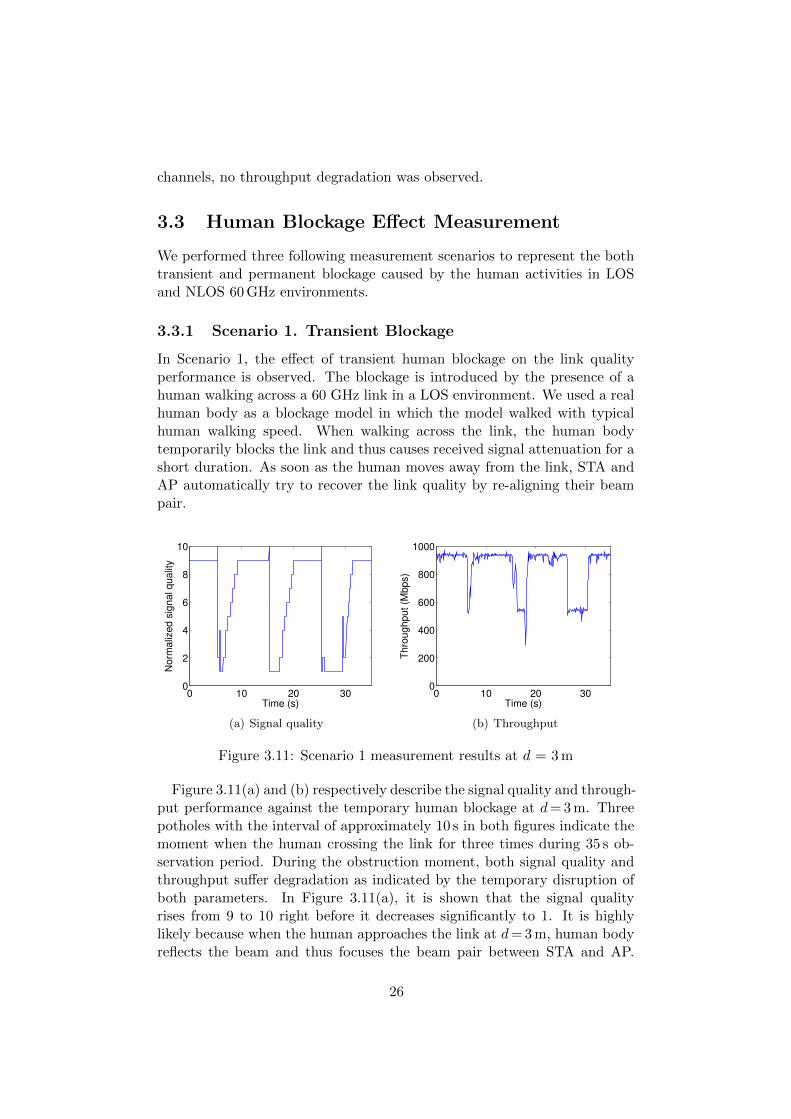
In Scenario 1, the effect of transient human blockage on the link qualityperformance is observed. The blockage is introduced by the presence of ahuman walking across a 60 GHz link in a LOS environment. We used a realhuman body as a blockage model in which the model walked with typicalhuman walking speed. When walking across the link, the human bodytemporarily blocks the link and thus causes received signal attenuation for ashort duration. As soon as the human moves away from the link, STA andAP automatically try to recover the link quality by re-aligning their beampair.
0 10 20 300
2
4
6
8
10
Time (s)
No
rma
lize
d s
ign
al q
ua
lity
(a) Signal quality
0 10 20 300
200
400
600
800
1000
Time (s)
Th
rou
gh
pu
t (M
bp
s)
(b) Throughput
Figure 3.11: Scenario 1 measurement results at d = 3 m
Figure 3.11(a) and (b) respectively describe the signal quality and through-put performance against the temporary human blockage at d= 3 m. Threepotholes with the interval of approximately 10 s in both figures indicate themoment when the human crossing the link for three times during 35 s ob-servation period. During the obstruction moment, both signal quality andthroughput suffer degradation as indicated by the temporary disruption ofboth parameters. In Figure 3.11(a), it is shown that the signal qualityrises from 9 to 10 right before it decreases significantly to 1. It is highlylikely because when the human approaches the link at d= 3 m, human bodyreflects the beam and thus focuses the beam pair between STA and AP.
26
0 10 20 300
2
4
6
8
10
Time (s)
No
rma
lize
d s
ign
al q
ua
lity
(a) Signal quality
0 10 20 300
200
400
600
800
1000
Time (s)
Th
rou
gh
pu
t (M
bp
s)
(b) Throughput
Figure 3.12: Scenario 1 measurement results at d = 7 m
Hence, the beam becomes more directive so that the received signal qualityincreases from 9 to 10 for a short period before it falls to 1 as the humanbody completely blocks the beam. After the human moves away from thelink, the signal quality recovers from 1 to 9 within a few second. Duringthe disruption moment, the throughput also decreases from above 900 Mbpsto approximately 500 Mbps and returns to above 900 Mbps after the humanmoves away from the LOS path.
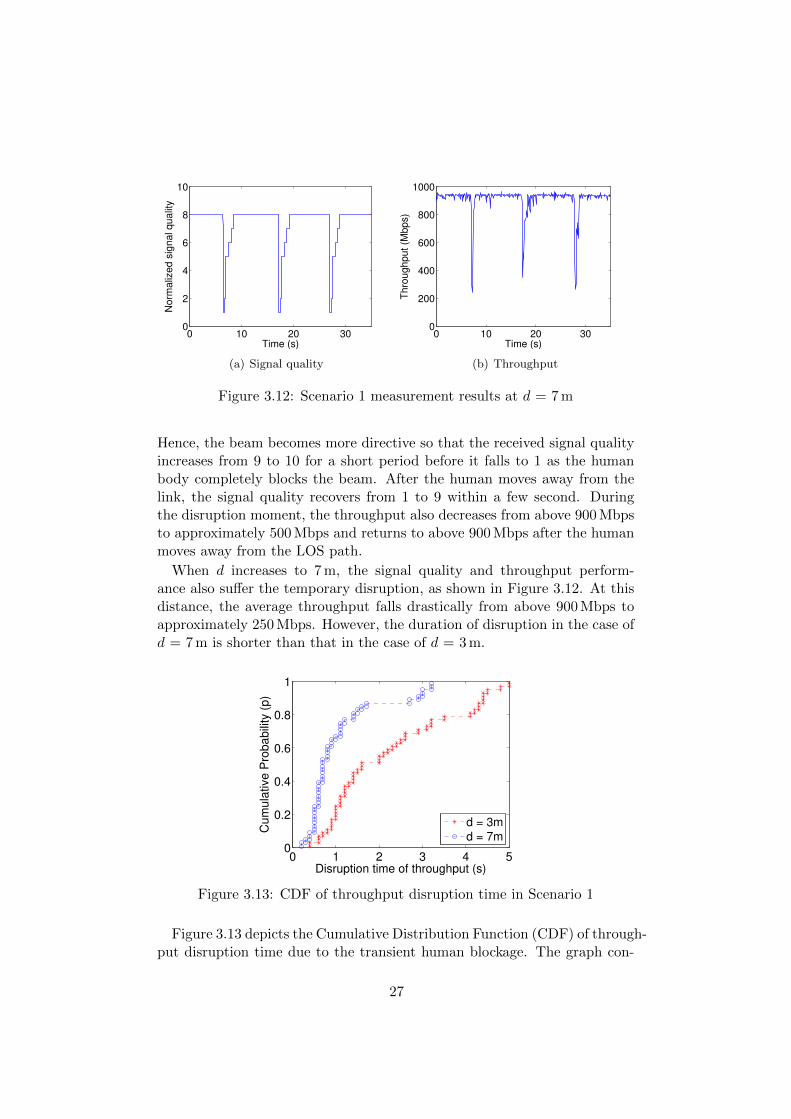
When d increases to 7 m, the signal quality and throughput perform-ance also suffer the temporary disruption, as shown in Figure 3.12. At thisdistance, the average throughput falls drastically from above 900 Mbps toapproximately 250 Mbps. However, the duration of disruption in the case ofd = 7 m is shorter than that in the case of d = 3 m.
0 1 2 3 4 50
0.2
0.4
0.6
0.8
1
Disruption time of throughput (s)
Cum
ula
tive P
robabili
ty (
p)
d = 3m
d = 7m
Figure 3.13: CDF of throughput disruption time in Scenario 1
Figure 3.13 depicts the Cumulative Distribution Function (CDF) of through-put disruption time due to the transient human blockage. The graph con-
27
firms that the closer the distance between two communicating STAs, thelonger the average shadowing duration due to the human body. Note thatthe obstacle is presented in the middle of the distance between two STAand AP. Shortening the distance between STA and AP makes the distancebetween STA/AP and the obstacle closer. At the closer distance, the beam-width of STA/AP is not wide enough if compared to the area of the humanbody as an obstacle. It also limits the searching space when two commu-nicating STAs try to perform beam switching. Hence, it prolongs the timeto recover. Besides, the shadowing duration of a blockage event also de-pends on the velocity and size of the blockers [19]. The average throughputdisruption time in case of d = 3 m and d = 7 m are 2.166 s and 1.036 s,respectively. Due to the short-period link disruption, the blockage in thisscenario is categorized as short-time blockage.
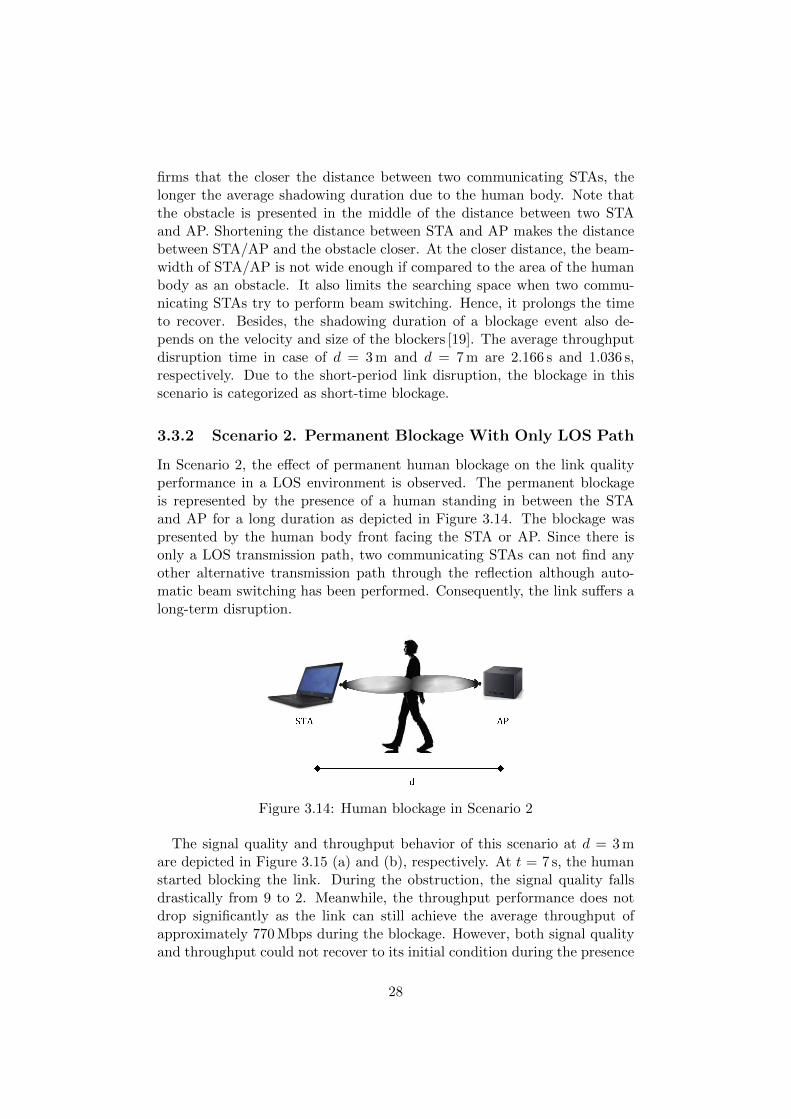
3.3.2 Scenario 2. Permanent Blockage With Only LOS Path
In Scenario 2, the effect of permanent human blockage on the link qualityperformance in a LOS environment is observed. The permanent blockageis represented by the presence of a human standing in between the STAand AP for a long duration as depicted in Figure 3.14. The blockage waspresented by the human body front facing the STA or AP. Since there isonly a LOS transmission path, two communicating STAs can not find anyother alternative transmission path through the reflection although auto-matic beam switching has been performed. Consequently, the link suffers along-term disruption.
Figure 3.14: Human blockage in Scenario 2
The signal quality and throughput behavior of this scenario at d = 3 mare depicted in Figure 3.15 (a) and (b), respectively. At t = 7 s, the humanstarted blocking the link. During the obstruction, the signal quality fallsdrastically from 9 to 2. Meanwhile, the throughput performance does notdrop significantly as the link can still achieve the average throughput ofapproximately 770 Mbps during the blockage. However, both signal qualityand throughput could not recover to its initial condition during the presence
28
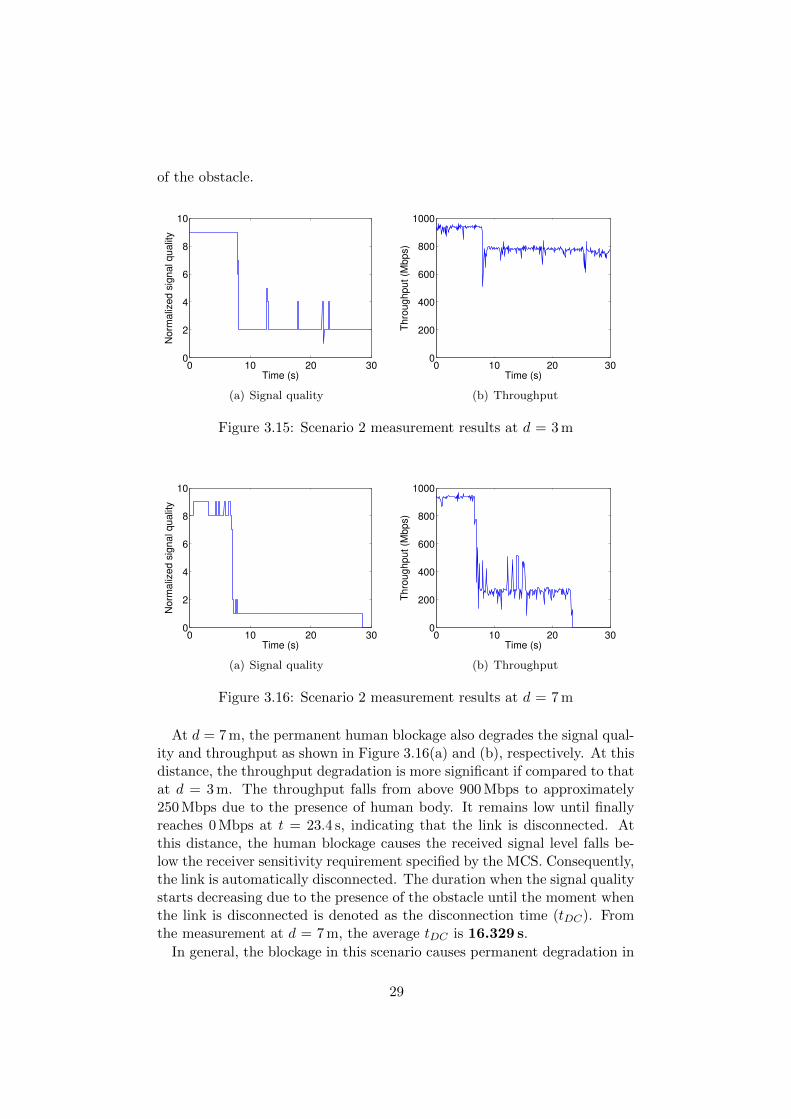
of the obstacle.
0 10 20 300
2
4
6
8
10
Time (s)
No
rma
lize
d s
ign
al q
ua
lity
(a) Signal quality
0 10 20 300
200
400
600
800
1000
Time (s)
Th
rou
gh
pu
t (M
bp
s)
(b) Throughput
Figure 3.15: Scenario 2 measurement results at d = 3 m
0 10 20 300
2
4
6
8
10
Time (s)
No
rma
lize
d s
ign
al q
ua
lity
(a) Signal quality
0 10 20 300
200
400
600
800
1000
Time (s)
Th
rou
gh
pu
t (M
bp
s)
(b) Throughput
Figure 3.16: Scenario 2 measurement results at d = 7 m
At d = 7 m, the permanent human blockage also degrades the signal qual-ity and throughput as shown in Figure 3.16(a) and (b), respectively. At thisdistance, the throughput degradation is more significant if compared to thatat d = 3 m. The throughput falls from above 900 Mbps to approximately250 Mbps due to the presence of human body. It remains low until finallyreaches 0 Mbps at t = 23.4 s, indicating that the link is disconnected. Atthis distance, the human blockage causes the received signal level falls be-low the receiver sensitivity requirement specified by the MCS. Consequently,the link is automatically disconnected. The duration when the signal qualitystarts decreasing due to the presence of the obstacle until the moment whenthe link is disconnected is denoted as the disconnection time (tDC). Fromthe measurement at d = 7 m, the average tDC is 16.329 s.
In general, the blockage in this scenario causes permanent degradation in
29

both signal quality and throughput performances. As the distance increases,this type of blockage can potentially break the link due to the received signalpower insufficiency. Therefore, the blockage in this scenario is categorizedas a long-term blockage.
3.3.3 Scenario 3. Permanent Blockage With Alternative NLOSPath
Besides LOS environment, we also observed the effect of permanent humanblockage on the link quality performance in an NLOS link environment. Themeasurement scenario is depicted in Figure 3.17. STA and AP were placedin the distance of 1 m away from the wall. The wall acting as a reflector willreflect the beam to create an alternative NLOS transmission path in casethe LOS transmission path is blocked.
Figure 3.17: Human blockage in Scenario 3
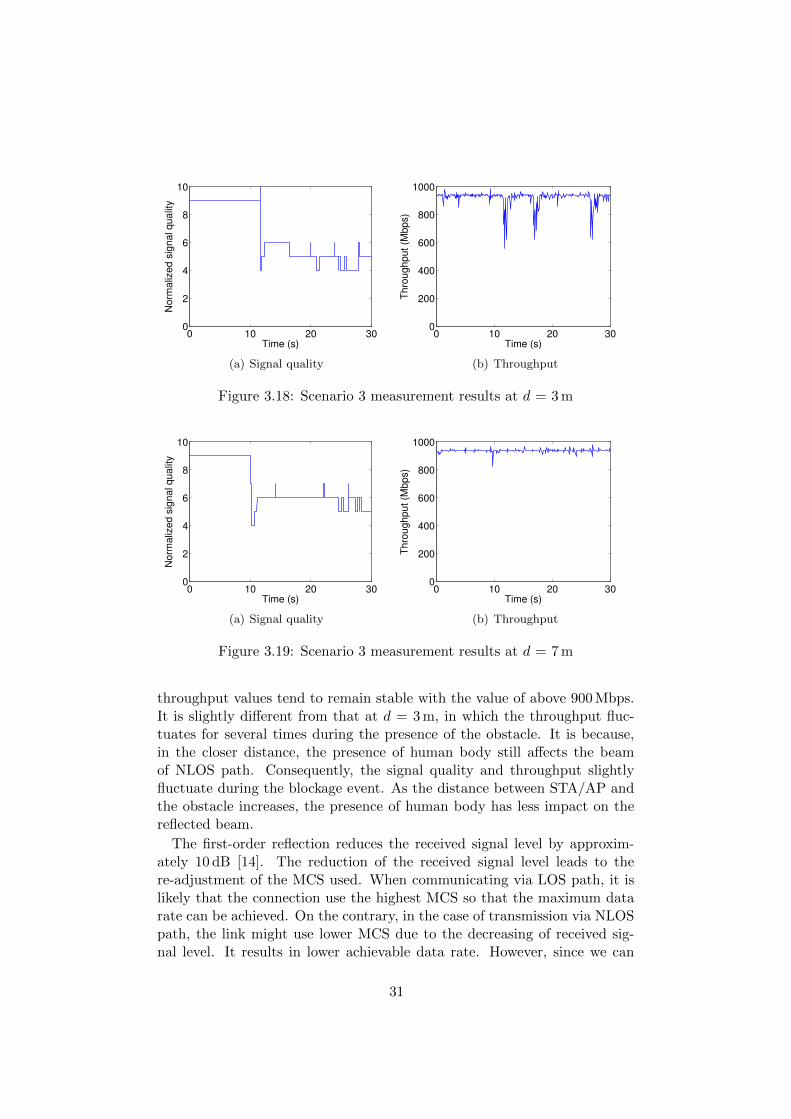
Figure 3.18(a) and (b) respectively show the signal quality and throughputbehavior of this scenario at d = 3 m. Following the presence of human body,the signal quality only decreases from 9 to 4 and fluctuates between 4 and 6.However, the throughput performance is not highly affected by the blockage.As shown in Figure 3.18(b), the average throughput is above 900 Mbps formost of the time during the blockage. It decreases to 600–700 Mbps withinshort duration for several times. When human body obstructs the LOStransmission path, STA and AP automatically perform beam switching andtake advantage of the signal reflected from the wall to establish an alternativeNLOS transmission path. Therefore, the signal quality does not decreasessignificantly and the throughput can recover faster in comparison to that inScenario 2.
The signal quality and throughput behavior at d = 7 m are shown in Fig-ure 3.19(a) and (b), respectively. At this distance, the throughput disruptiondue to the presence of the human body is shorter and less significant whencompared to that at d = 3 m. Moreover, during the blockage event, the
30
0 10 20 300
2
4
6
8
10
Time (s)
No
rma
lize
d s
ign
al q
ua
lity
(a) Signal quality
0 10 20 300
200
400
600
800
1000
Time (s)
Th
rou
gh
pu
t (M
bp
s)
(b) Throughput
Figure 3.18: Scenario 3 measurement results at d = 3 m
0 10 20 300
2
4
6
8
10
Time (s)
No
rma
lize
d s
ign
al q
ua
lity
(a) Signal quality
0 10 20 300
200
400
600
800
1000
Time (s)
Th
rou
gh
pu
t (M
bp
s)
(b) Throughput
Figure 3.19: Scenario 3 measurement results at d = 7 m
throughput values tend to remain stable with the value of above 900 Mbps.It is slightly different from that at d = 3 m, in which the throughput fluc-tuates for several times during the presence of the obstacle. It is because,in the closer distance, the presence of human body still affects the beamof NLOS path. Consequently, the signal quality and throughput slightlyfluctuate during the blockage event. As the distance between STA/AP andthe obstacle increases, the presence of human body has less impact on thereflected beam.
The first-order reflection reduces the received signal level by approxim-ately 10 dB [14]. The reduction of the received signal level leads to there-adjustment of the MCS used. When communicating via LOS path, it islikely that the connection use the highest MCS so that the maximum datarate can be achieved. On the contrary, in the case of transmission via NLOSpath, the link might use lower MCS due to the decreasing of received sig-nal level. It results in lower achievable data rate. However, since we can
31
only observe the data rate up to 1 Gbps, the differences between throughputperformance in LOS and NLOS transmission path can not be observed.
When the human body obstructs the LOS link, the communicating STAstry to re-adjust their beam pair for achieving higher signal quality. Thanksto the reflector, the communicating STAs can find an alternative beam pairthrough the reflected signal path. Although the signal quality decreases fora long period, the throughput performance can still be maintained. Sincethe disruption of throughput performance only occurs within a short period,the blockage in this scenario is categorized into the short-term blockage.
3.3.4 TCP and UDP Throughput
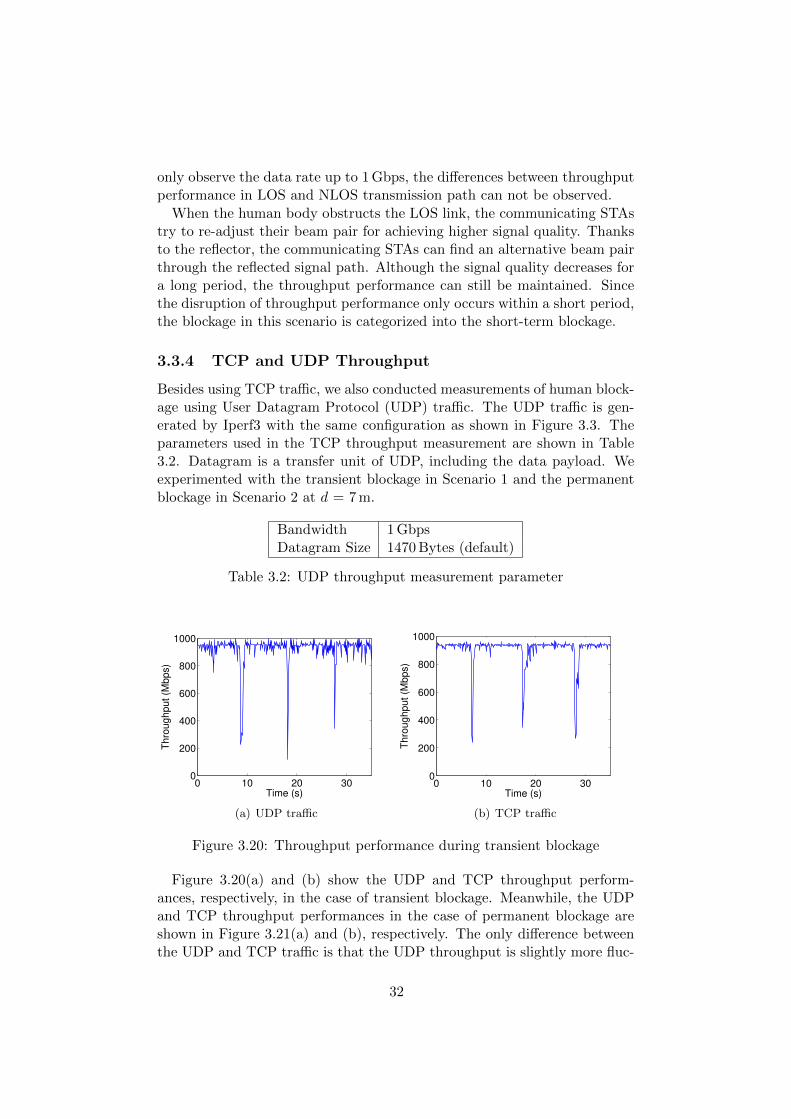
Besides using TCP traffic, we also conducted measurements of human block-age using User Datagram Protocol (UDP) traffic. The UDP traffic is gen-erated by Iperf3 with the same configuration as shown in Figure 3.3. Theparameters used in the TCP throughput measurement are shown in Table3.2. Datagram is a transfer unit of UDP, including the data payload. Weexperimented with the transient blockage in Scenario 1 and the permanentblockage in Scenario 2 at d = 7 m.
Bandwidth 1 GbpsDatagram Size 1470 Bytes (default)
Table 3.2: UDP throughput measurement parameter
0 10 20 300
200
400
600
800
1000
Time (s)
Th
rou
gh
pu
t (M
bp
s)
(a) UDP traffic
0 10 20 300
200
400
600
800
1000
Time (s)
Th
rou
gh
pu
t (M
bp
s)
(b) TCP traffic
Figure 3.20: Throughput performance during transient blockage
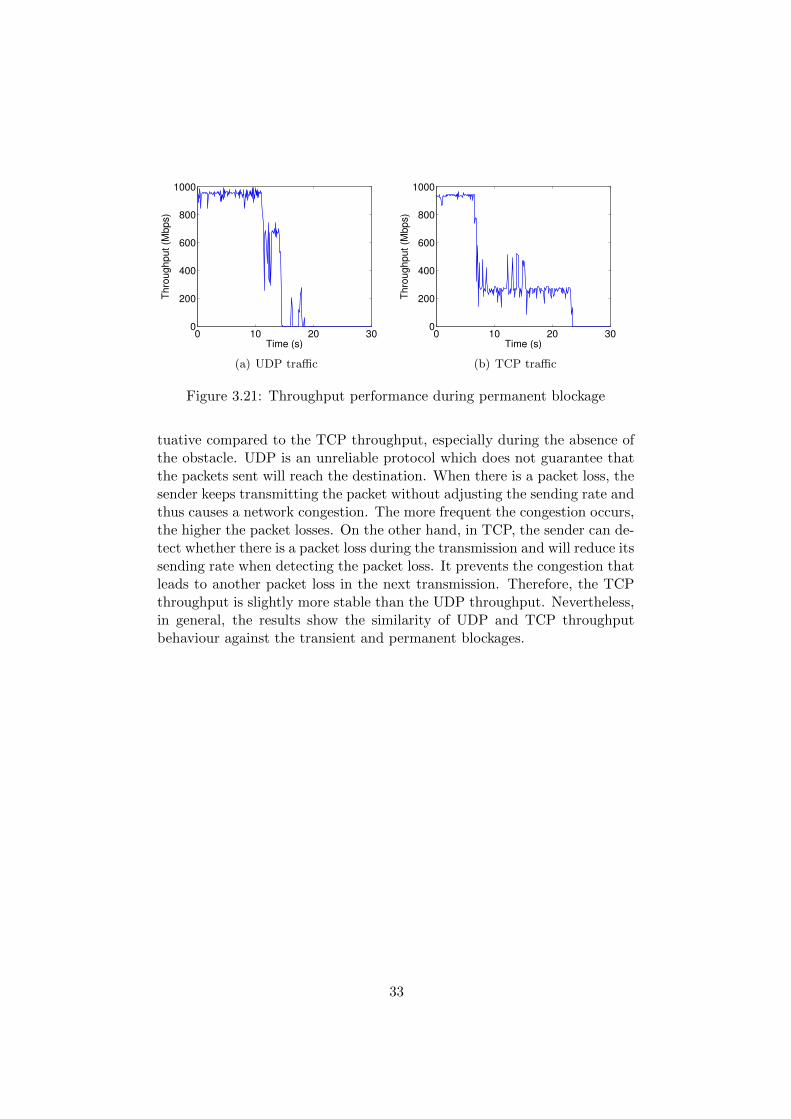
Figure 3.20(a) and (b) show the UDP and TCP throughput perform-ances, respectively, in the case of transient blockage. Meanwhile, the UDPand TCP throughput performances in the case of permanent blockage areshown in Figure 3.21(a) and (b), respectively. The only difference betweenthe UDP and TCP traffic is that the UDP throughput is slightly more fluc-
32
0 10 20 300
200
400
600
800
1000
Time (s)
Th
rou
gh
pu
t (M
bp
s)
(a) UDP traffic
0 10 20 300
200
400
600
800
1000
Time (s)
Th
rou
gh
pu
t (M
bp
s)
(b) TCP traffic
Figure 3.21: Throughput performance during permanent blockage
tuative compared to the TCP throughput, especially during the absence ofthe obstacle. UDP is an unreliable protocol which does not guarantee thatthe packets sent will reach the destination. When there is a packet loss, thesender keeps transmitting the packet without adjusting the sending rate andthus causes a network congestion. The more frequent the congestion occurs,the higher the packet losses. On the other hand, in TCP, the sender can de-tect whether there is a packet loss during the transmission and will reduce itssending rate when detecting the packet loss. It prevents the congestion thatleads to another packet loss in the next transmission. Therefore, the TCPthroughput is slightly more stable than the UDP throughput. Nevertheless,in general, the results show the similarity of UDP and TCP throughputbehaviour against the transient and permanent blockages.
33

34
Chapter 4
Human BlockageCharacterization
In Chapter 3, we observed that the each blockage type differently affectsthe link performance. Therefore, each blockage type must be treated differ-ently to minimize the duration of link disruption during the blockage event.Based on the link disruption duration, we categorize the blockage into twocategories: (i) short-term blockage and (ii) long-term blockage. Ashort-term blockage can be caused by either the temporary blockage due tohuman crossing the link (Scenario 1) or when the communicating STAs canfind an alternative NLOS transmission path following the permanent block-age (Scenario 3). Those conditions lead to the temporary link disruption.On the other hand, a long-term blockage is caused by the permanent humanblockage in a LOS environment (Scenario 2). In this case, the communicat-ing STAs can not establish any alternative transmission path following theblockage event and thus cause a long-term link disruption.
In this chapter, the blockage characterization method which is based onthe changes of signal quality parameter is explained. We design a react-ive algorithm for characterizing the blockage and implement it in a COTS60 GHz device. Following that, we define the appropriate action to be takenin each scenario to circumvent the link outage due to blockages. A handovermechanism between the 60 GHz access points is proposed to overcome thelong-period link disruption due to the long-term blockage.
4.1 Signal Quality Analysis
To characterize the blockage, we analyze the changes in the signal qualityparameter during a blockage event. Figure 4.1 depicts the example of signalquality behavior when a transient blockage in Scenario 1 occurs. Upon thepresence of an obstacle in between the link, the signal quality immediatelydecreases to a certain level. The degradation of signal quality unit is denoted
35

as ∆SQD and the time required for the signal quality to decrease as muchas ∆SQD is denoted as the drop time (tD). In Figure 4.1, the signal qualityfalls from 10 to 1 within the duration of 105 ms, thus ∆SQD = 9 and tD =105 ms.
0 2 4 6 8 100
1
2
3
4
5
6
7
8
9
10
Time (s)
No
rma
lize
d s
ign
al q
ua
lity
tD ∆SQ
R
∆SQD
tR
Figure 4.1: Signal quality drop and recovery in transient blockage
The signal quality remains low during the presence of human body. Assoon as the human moves away from the transmission path, the communic-ating STAs recover the link quality by aligning their best beam pair amongthem. The increasing of signal quality indicates that the link is successfullyrecovered. ∆SQR is defined as how large the signal quality can improveafter the blockage event. Time required for achieving ∆SQR is denoted asthe recovery time (tR). In Figure 4.1, it is shown that the signal qualitygradually increases from 1 to 7 within 3.789 s, thus ∆SQR = 6 and tR =3.789 s.
d = 3 m d = 7 m
tD 197.11 ms 140.65 msScenario 1 tDmax 838 ms 513 ms
tR 3.826 s 1.648 stRmax 5.726 s 2.434 s
Scenario 2 tD 232.8 ms 298.13 mstDmax 748 ms 952 ms
Scenario 3 tD 267.65 ms 411.27 mstDmax 707 ms 784 ms
Table 4.1: tD and tR for all blockage scenarios
Table 4.1 shows the average tD and tR, denoted as tD and tR, repsectively,
36

for all blockage scenarios. We define the minimum ∆SQR = 6 so that tRbecomes the time required for the signal quality to recover by at least 6units. The larger the ∆SQR that the system intends to achieve, the longertR will be. The table only displays tR for the blockage in Scenaro 1 as it isthe only scenario that enables the signal quality to recover.
In Scenario 1, tD and tR are not symmetrical, in which tR is longer thantD. It is because of the re-beamforming process. During the recovery phase,both communicating STAs try to re-align their beam pair by performingbeamforming training. However, since there is a traffic presence, the beam-forming training is conducted within Service Period (SP) in Data Transmis-sion Interval (DTI). It makes the beamforming training process longer thanthe one conducted within Beacon Header Interval (BHI).
The maximum threshold of tD and tR are denoted as tDthand tRth
, re-spectively, indicating how long a STA has to wait for the signal quality todrop and recover, respectively. Therefore, the total decision time requiredby a STA to determine the blockage type equals to tDth
+ tRth.
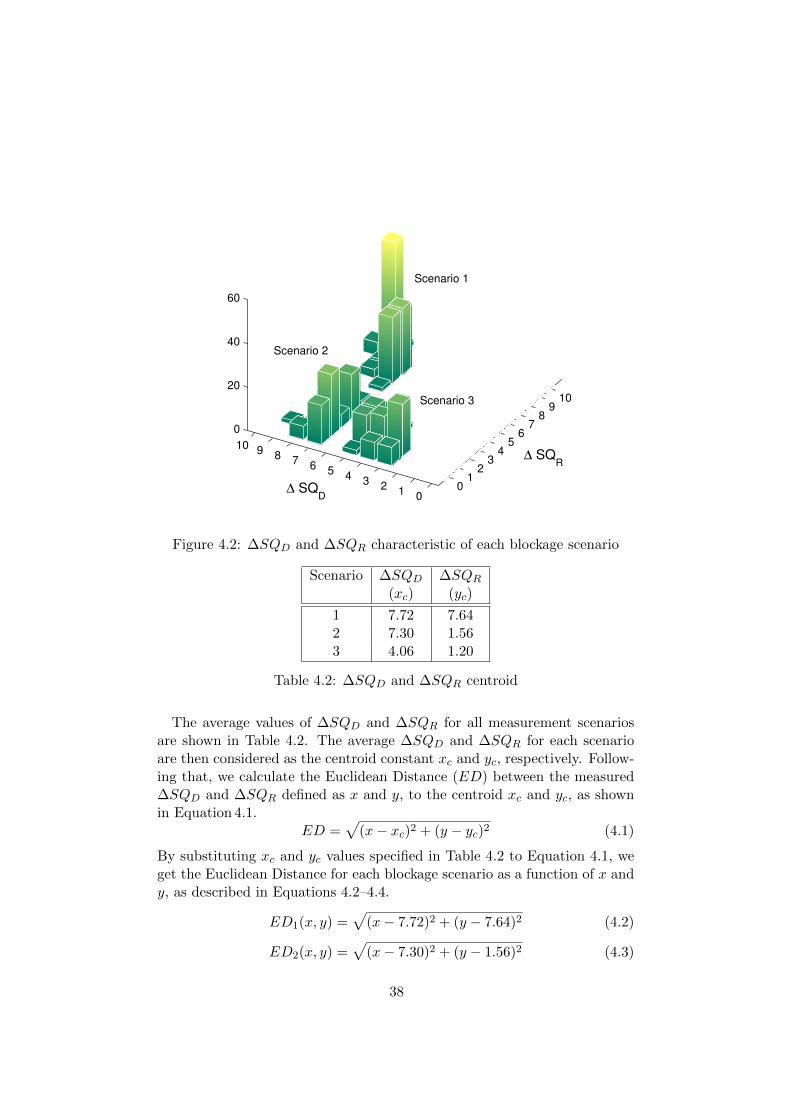
4.2 Characterizing Blockage
Characterization of the blockage type is based on the ∆SQD and ∆SQR
parameters. As explained earlier in Section 4.1, ∆SQD indicates how signi-ficant the signal quality falls following the presence of an obstacle. In casethe blockage occurs in a LOS environment, the signal quality falls drastic-ally since the communicating STAs can not find any backup link upon thepresence of the obstacle. Consequently, the ∆SQD is large in the LOSenvironment. On the contrary, in case the blockage occurs in a NLOS envir-onment, the communicating STAs immediately re-align their beam to findan alternative transmission path through the NLOS transmission path (ifavailable) following the blockage event. Therefore, in this environment, the∆SQD is not as significant as that in the LOS environment.
Meanwhile, ∆SQR indicates how much the signal quality can rise againafter the blockage event. In the case of temporary human blockage, the∆SQR is relatively large since the signal quality can increase to the initialcondition as soon as the obstacle moves away. On the contrary, in the caseof permanent human blockage, the signal quality tends to stay low duringthe presence of the obstacle. Hence, the ∆SQR is relatively small.
Figure 4.2 depicts the characteristic of ∆SQD and ∆SQR taken from 100measurement samples for each blockage scenario at d = 7 m. For this meas-urement, we use tDth
= 1 s and tRth= 3 s. Based on Figure 4.2, it can be
inferred that each blockage type has unique ∆SQD and ∆SQR character-istic. For example, the blockage in Scenario 1 is indicated by a large ∆SQD
and ∆SQR, while the blockage in Scenario 2 is indicated by a large ∆SQD
and a small ∆SQR.
37
0 1
2 3
4 5
6 7
8 9
10
0 1
2 3
4 5
6 7
8 9
10
0
20
40
60
∆ SQR
∆ SQD
Scenario 1
Scenario 2
Scenario 3
Figure 4.2: ∆SQD and ∆SQR characteristic of each blockage scenario
Scenario ∆SQD ∆SQR
(xc) (yc)
1 7.72 7.642 7.30 1.563 4.06 1.20
Table 4.2: ∆SQD and ∆SQR centroid
The average values of ∆SQD and ∆SQR for all measurement scenariosare shown in Table 4.2. The average ∆SQD and ∆SQR for each scenarioare then considered as the centroid constant xc and yc, respectively. Follow-ing that, we calculate the Euclidean Distance (ED) between the measured∆SQD and ∆SQR defined as x and y, to the centroid xc and yc, as shownin Equation 4.1.
ED =√
(x− xc)2 + (y − yc)2 (4.1)
By substituting xc and yc values specified in Table 4.2 to Equation 4.1, weget the Euclidean Distance for each blockage scenario as a function of x andy, as described in Equations 4.2–4.4.
ED1(x, y) =√
(x− 7.72)2 + (y − 7.64)2 (4.2)
ED2(x, y) =√
(x− 7.30)2 + (y − 1.56)2 (4.3)
38
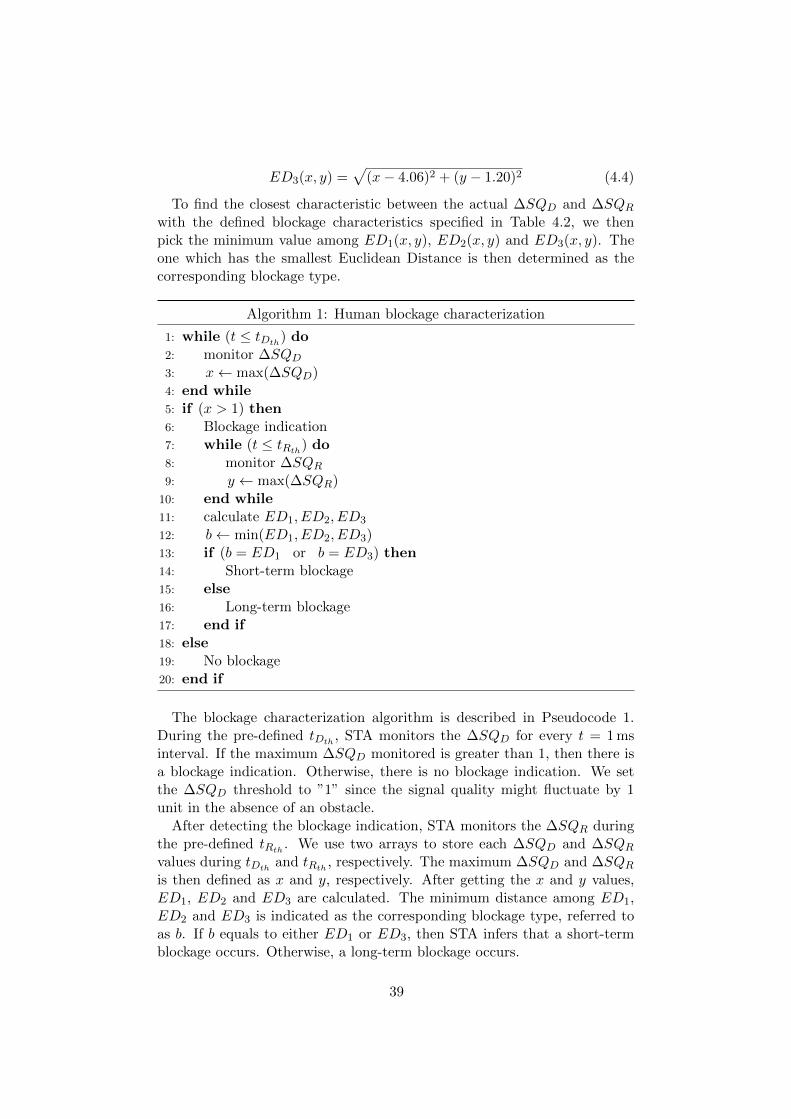
ED3(x, y) =√
(x− 4.06)2 + (y − 1.20)2 (4.4)
To find the closest characteristic between the actual ∆SQD and ∆SQR
with the defined blockage characteristics specified in Table 4.2, we thenpick the minimum value among ED1(x, y), ED2(x, y) and ED3(x, y). Theone which has the smallest Euclidean Distance is then determined as thecorresponding blockage type.
Algorithm 1: Human blockage characterization
1: while (t ≤ tDth) do
2: monitor ∆SQD
3: x← max(∆SQD)4: end while5: if (x > 1) then6: Blockage indication7: while (t ≤ tRth
) do8: monitor ∆SQR
9: y ← max(∆SQR)10: end while11: calculate ED1, ED2, ED3
12: b← min(ED1, ED2, ED3)13: if (b = ED1 or b = ED3) then14: Short-term blockage15: else16: Long-term blockage17: end if18: else19: No blockage20: end if
The blockage characterization algorithm is described in Pseudocode 1.During the pre-defined tDth
, STA monitors the ∆SQD for every t = 1 msinterval. If the maximum ∆SQD monitored is greater than 1, then there isa blockage indication. Otherwise, there is no blockage indication. We setthe ∆SQD threshold to ”1” since the signal quality might fluctuate by 1unit in the absence of an obstacle.
After detecting the blockage indication, STA monitors the ∆SQR duringthe pre-defined tRth
. We use two arrays to store each ∆SQD and ∆SQR
values during tDthand tRth
, respectively. The maximum ∆SQD and ∆SQR
is then defined as x and y, respectively. After getting the x and y values,ED1, ED2 and ED3 are calculated. The minimum distance among ED1,ED2 and ED3 is indicated as the corresponding blockage type, referred toas b. If b equals to either ED1 or ED3, then STA infers that a short-termblockage occurs. Otherwise, a long-term blockage occurs.
39

4.3 Blockage Solution
After determining the blockage type, a further action has to be taken forovercoming such blockage. The effective solution has to be determined sothat the duration of link disruption can be minimized. As described in Fig-ure 1.2, in the case of short-term blockage, STA has to keep the connectionwith the current AP and wait until the signal quality recovers. The relayor handover solution is not suitable for solving the short-term blockage asit causes unnecessary delay during the handover process.
On the other hand, in the case of long-term blockage, STA has to per-form handover to another AP so that the long-period link disruption can beavoided. Maintaining the connection with the current AP causes perman-ent throughput degradation. Although the handover solution will introducesome delay, this solution is considered to be better than maintaining theconnection with the current AP, regarding throughput performance.
We choose the handover approach because our wireless docking systemdoes not support the relay or FST mechanism. Moreover, since the commu-nication range of 60 GHz is short, it is likely that multiple APs are placedwithin a few meters in an environment. Therefore, the handover betweenAPs is feasible for resolving the long-term blockage.
4.3.1 Handover in Wireless Docking System
In the cellular communication system, the term handover refers to switchingthe connection of Mobile Station (MS) from one Base Station (BS) to an-other BS. Usually, the handover in the cellular system is resulting from theuser mobility. In general, there are three types of handover in mobile com-munication: hard handover, soft handover, and softer handover [40]. In thehard handover or so-called ”Break Before Make” mechanism, a MS releasesthe connection with the existing BS before making a new connection withanother BS. Meanwhile, in soft handover and softer handover, a MS has es-tablished a new connection with another BS before releasing the connectionwith the current BS. Thus, it is known as ”Make Before Break” mechanism.
In this work, we use the hard handover principle since the STA can notestablish more than one connection at a time. It involves the three followingphases: (1) Disassociation with the current AP, (2) Finding the availablealternative AP and (3) Association with the new AP. After detecting along-term blockage, the STA is forced to disconnect from the current orprimary AP. The disassociation process takes some time to complete. Oncethe STA is disconnected from the primary AP, it immediately scans allavailable APs. Upon detecting at least one alternative AP on its scanninglist, the STA immediately attempts to associate with such AP. After a newconnection has been established, the STA will be able to send/receive thetraffic to/from the connected AP.
40
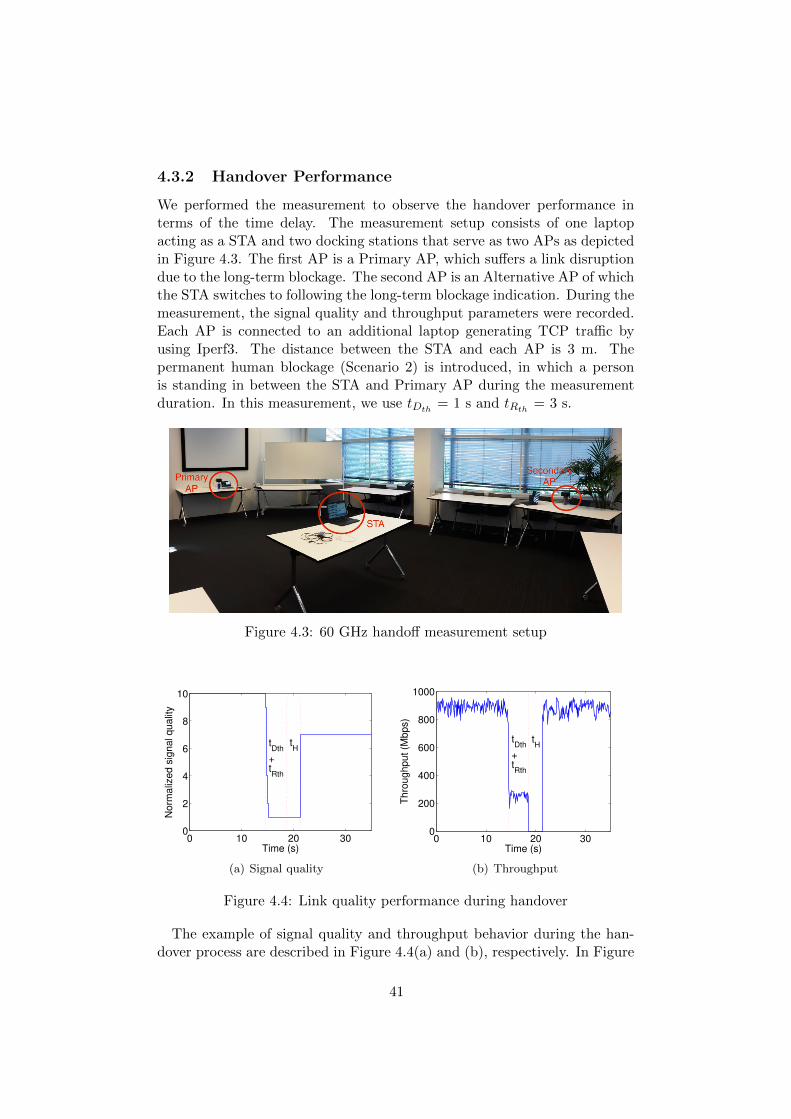
4.3.2 Handover Performance
We performed the measurement to observe the handover performance interms of the time delay. The measurement setup consists of one laptopacting as a STA and two docking stations that serve as two APs as depictedin Figure 4.3. The first AP is a Primary AP, which suffers a link disruptiondue to the long-term blockage. The second AP is an Alternative AP of whichthe STA switches to following the long-term blockage indication. During themeasurement, the signal quality and throughput parameters were recorded.Each AP is connected to an additional laptop generating TCP traffic byusing Iperf3. The distance between the STA and each AP is 3 m. Thepermanent human blockage (Scenario 2) is introduced, in which a personis standing in between the STA and Primary AP during the measurementduration. In this measurement, we use tDth
= 1 s and tRth= 3 s.
Figure 4.3: 60 GHz handoff measurement setup
0 10 20 300
2
4
6
8
10
Time (s)
No
rma
lize
d s
ign
al q
ua
lity
tDth
+tRth
tH
(a) Signal quality
0 10 20 300
200
400
600
800
1000
Time (s)
Th
rou
gh
pu
t (M
bp
s)
tDth
+tRth
tH
(b) Throughput
Figure 4.4: Link quality performance during handover
The example of signal quality and throughput behavior during the han-dover process are described in Figure 4.4(a) and (b), respectively. In Figure
41
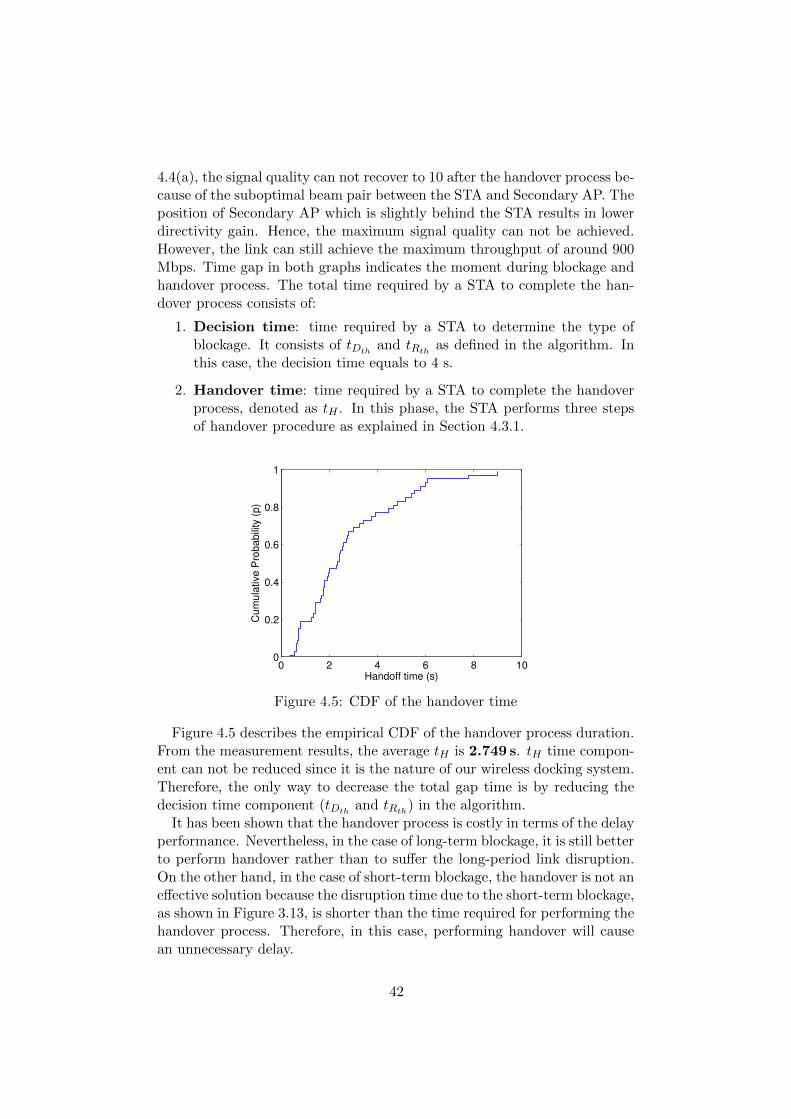
4.4(a), the signal quality can not recover to 10 after the handover process be-cause of the suboptimal beam pair between the STA and Secondary AP. Theposition of Secondary AP which is slightly behind the STA results in lowerdirectivity gain. Hence, the maximum signal quality can not be achieved.However, the link can still achieve the maximum throughput of around 900Mbps. Time gap in both graphs indicates the moment during blockage andhandover process. The total time required by a STA to complete the han-dover process consists of:
1. Decision time: time required by a STA to determine the type ofblockage. It consists of tDth
and tRthas defined in the algorithm. In
this case, the decision time equals to 4 s.
2. Handover time: time required by a STA to complete the handoverprocess, denoted as tH . In this phase, the STA performs three stepsof handover procedure as explained in Section 4.3.1.
0 2 4 6 8 100
0.2
0.4
0.6
0.8
1
Handoff time (s)
Cum
ula
tive P
robabili
ty (
p)
Figure 4.5: CDF of the handover time
Figure 4.5 describes the empirical CDF of the handover process duration.From the measurement results, the average tH is 2.749 s. tH time compon-ent can not be reduced since it is the nature of our wireless docking system.Therefore, the only way to decrease the total gap time is by reducing thedecision time component (tDth
and tRth) in the algorithm.
It has been shown that the handover process is costly in terms of the delayperformance. Nevertheless, in the case of long-term blockage, it is still betterto perform handover rather than to suffer the long-period link disruption.On the other hand, in the case of short-term blockage, the handover is not aneffective solution because the disruption time due to the short-term blockage,as shown in Figure 3.13, is shorter than the time required for performing thehandover process. Therefore, in this case, performing handover will causean unnecessary delay.
42

Chapter 5
Evaluation
In this chapter, the duration of link disruption due to the human blockage isevaluated. Detecting the correct blockage type is crucial since the incorrectblockage detection leads to the longer disruption period. We evaluate thedetection accuracy of the system through the measurement. Based on theduration of link disruption and the accuracy of blockage-type detection, theoptimum decision time to identify the blockage type is obtained. Followingthat, the optimum decision time is applied to the algorithm and used toevaluate the detection accuracy against various Tx–Rx distances.
5.1 Disruption Time due to Blockage
Based on the observation of throughput performance during the blockageevents, we derive the mathematical equation to determine the disruptiontime due to each blockage type. In the calculation, we assume that thethroughput equals to 0 Mbps during the disruption period. Therefore, theterm ”outage duration” is used to represent the moment during link disrup-tion. We evaluate the link outage duration resulting from both short-termand long-term blockage.
5.1.1 Outage Duration of Short-term Blockage
In the transient blockage (Scenario 1), the communicating STAs try to re-cover the link quality within tRth
. Note that this blockage is characterized bya large ∆SQR. Long tRth
gives the STA enough time to observe such large∆SQR so that the short-time blockage can be detected correctly. Therefore,the outage duration when the STA correctly detects the short-term blockage(tOC(STB)
) equals to tRth, as indicated in Equation 5.1 and Figure 5.1.
tOC(STB)= tRth
(5.1)
tOF (STB)= tRth
+ tH (5.2)
43
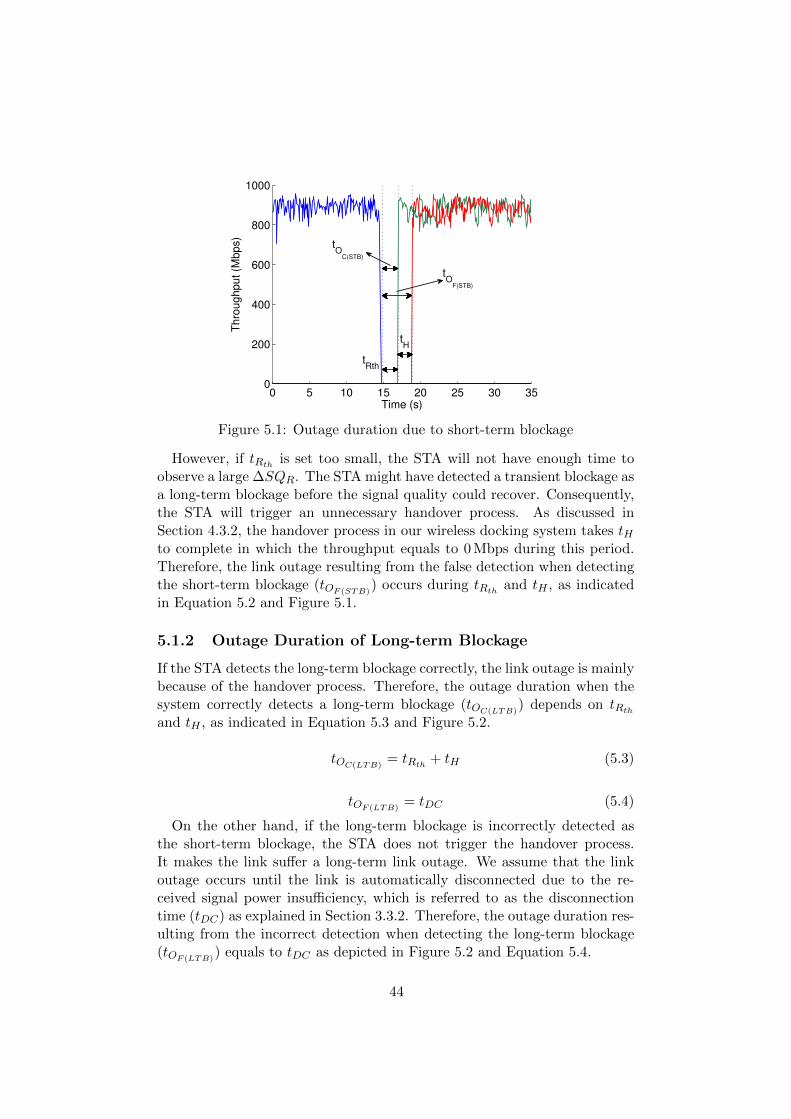
0 5 10 15 20 25 30 350
200
400
600
800
1000
Time (s)
Th
rou
gh
pu
t (M
bp
s)
tO
F(STB)
tO
C(STB)
tH
tRth
Figure 5.1: Outage duration due to short-term blockage
However, if tRthis set too small, the STA will not have enough time to
observe a large ∆SQR. The STA might have detected a transient blockage asa long-term blockage before the signal quality could recover. Consequently,the STA will trigger an unnecessary handover process. As discussed inSection 4.3.2, the handover process in our wireless docking system takes tHto complete in which the throughput equals to 0 Mbps during this period.Therefore, the link outage resulting from the false detection when detectingthe short-term blockage (tOF (STB)
) occurs during tRthand tH , as indicated
in Equation 5.2 and Figure 5.1.
5.1.2 Outage Duration of Long-term Blockage
If the STA detects the long-term blockage correctly, the link outage is mainlybecause of the handover process. Therefore, the outage duration when thesystem correctly detects a long-term blockage (tOC(LTB)
) depends on tRth
and tH , as indicated in Equation 5.3 and Figure 5.2.
tOC(LTB)= tRth
+ tH (5.3)
tOF (LTB)= tDC (5.4)
On the other hand, if the long-term blockage is incorrectly detected asthe short-term blockage, the STA does not trigger the handover process.It makes the link suffer a long-term link outage. We assume that the linkoutage occurs until the link is automatically disconnected due to the re-ceived signal power insufficiency, which is referred to as the disconnectiontime (tDC) as explained in Section 3.3.2. Therefore, the outage duration res-ulting from the incorrect detection when detecting the long-term blockage(tOF (LTB)
) equals to tDC as depicted in Figure 5.2 and Equation 5.4.
44
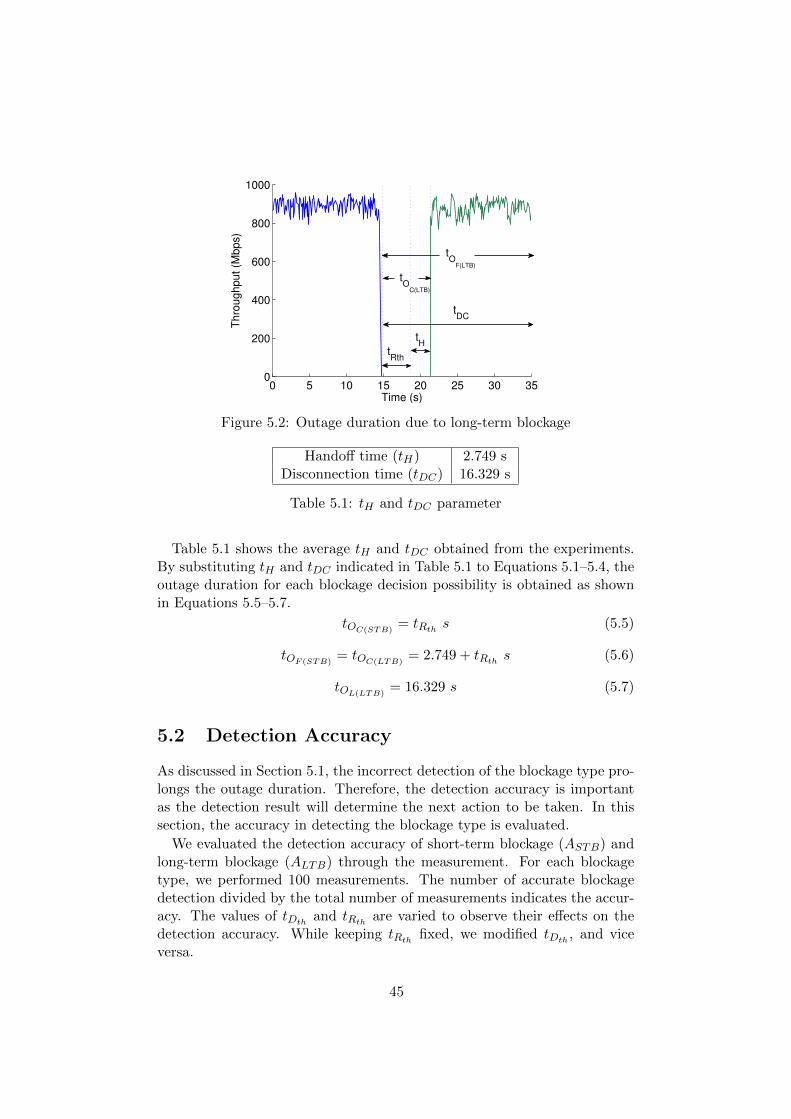
0 5 10 15 20 25 30 350
200
400
600
800
1000
Time (s)
Th
rou
gh
pu
t (M
bp
s)
tH
tDC
tRth
tO
F(LTB)
tO
C(LTB)
Figure 5.2: Outage duration due to long-term blockage
Handoff time (tH) 2.749 sDisconnection time (tDC) 16.329 s
Table 5.1: tH and tDC parameter
Table 5.1 shows the average tH and tDC obtained from the experiments.By substituting tH and tDC indicated in Table 5.1 to Equations 5.1–5.4, theoutage duration for each blockage decision possibility is obtained as shownin Equations 5.5–5.7.
tOC(STB)= tRth
s (5.5)
tOF (STB)= tOC(LTB)
= 2.749 + tRths (5.6)
tOL(LTB)= 16.329 s (5.7)
5.2 Detection Accuracy
As discussed in Section 5.1, the incorrect detection of the blockage type pro-longs the outage duration. Therefore, the detection accuracy is importantas the detection result will determine the next action to be taken. In thissection, the accuracy in detecting the blockage type is evaluated.
We evaluated the detection accuracy of short-term blockage (ASTB) andlong-term blockage (ALTB) through the measurement. For each blockagetype, we performed 100 measurements. The number of accurate blockagedetection divided by the total number of measurements indicates the accur-acy. The values of tDth
and tRthare varied to observe their effects on the
detection accuracy. While keeping tRthfixed, we modified tDth
, and viceversa.
45
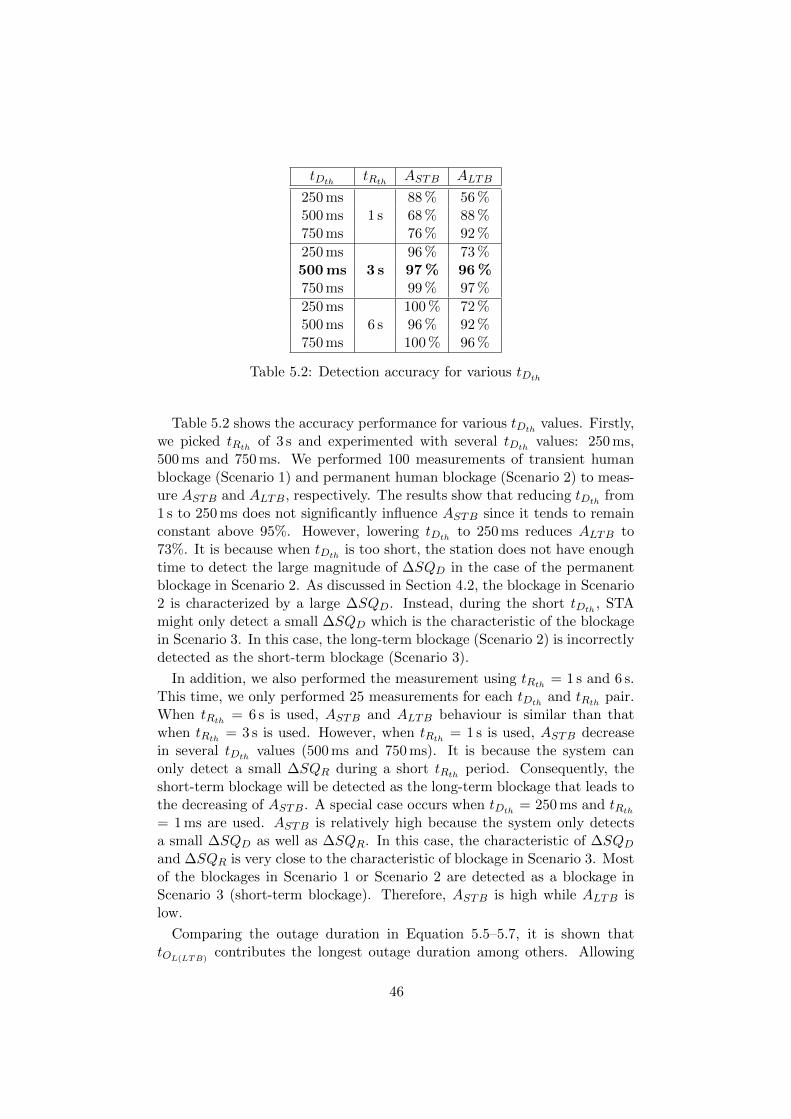
tDthtRth
ASTB ALTB
250 ms 88 % 56 %500 ms 1 s 68 % 88 %750 ms 76 % 92 %
250 ms 96 % 73 %500 ms 3 s 97 % 96 %750 ms 99 % 97 %
250 ms 100 % 72 %500 ms 6 s 96 % 92 %750 ms 100 % 96 %
Table 5.2: Detection accuracy for various tDth
Table 5.2 shows the accuracy performance for various tDthvalues. Firstly,
we picked tRthof 3 s and experimented with several tDth
values: 250 ms,500 ms and 750 ms. We performed 100 measurements of transient humanblockage (Scenario 1) and permanent human blockage (Scenario 2) to meas-ure ASTB and ALTB, respectively. The results show that reducing tDth
from1 s to 250 ms does not significantly influence ASTB since it tends to remainconstant above 95%. However, lowering tDth
to 250 ms reduces ALTB to73%. It is because when tDth
is too short, the station does not have enoughtime to detect the large magnitude of ∆SQD in the case of the permanentblockage in Scenario 2. As discussed in Section 4.2, the blockage in Scenario2 is characterized by a large ∆SQD. Instead, during the short tDth
, STAmight only detect a small ∆SQD which is the characteristic of the blockagein Scenario 3. In this case, the long-term blockage (Scenario 2) is incorrectlydetected as the short-term blockage (Scenario 3).
In addition, we also performed the measurement using tRth= 1 s and 6 s.
This time, we only performed 25 measurements for each tDthand tRth
pair.When tRth
= 6 s is used, ASTB and ALTB behaviour is similar than thatwhen tRth
= 3 s is used. However, when tRth= 1 s is used, ASTB decrease
in several tDthvalues (500 ms and 750 ms). It is because the system can
only detect a small ∆SQR during a short tRthperiod. Consequently, the
short-term blockage will be detected as the long-term blockage that leads tothe decreasing of ASTB. A special case occurs when tDth
= 250 ms and tRth
= 1 ms are used. ASTB is relatively high because the system only detectsa small ∆SQD as well as ∆SQR. In this case, the characteristic of ∆SQD
and ∆SQR is very close to the characteristic of blockage in Scenario 3. Mostof the blockages in Scenario 1 or Scenario 2 are detected as a blockage inScenario 3 (short-term blockage). Therefore, ASTB is high while ALTB islow.
Comparing the outage duration in Equation 5.5–5.7, it is shown thattOL(LTB)
contributes the longest outage duration among others. Allowing
46
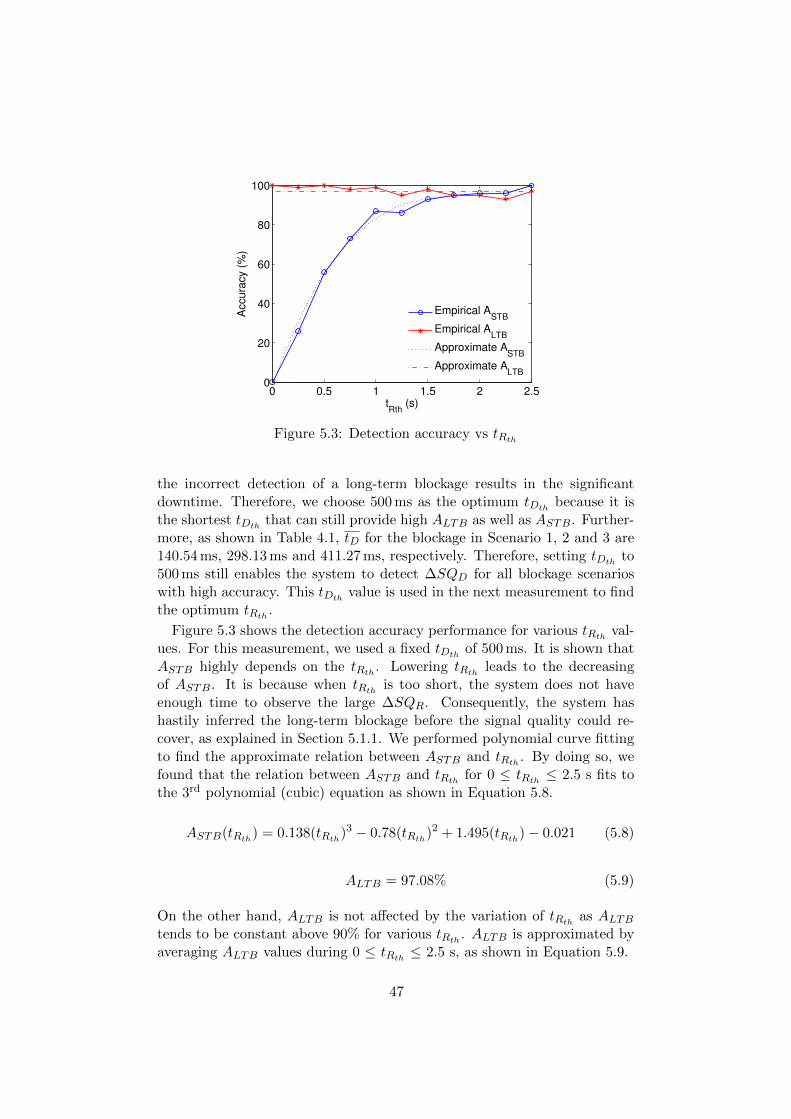
0 0.5 1 1.5 2 2.50
20
40
60
80
100
tRth
(s)
Accu
racy (
%)
Empirical ASTB
Empirical ALTB
Approximate ASTB
Approximate ALTB
Figure 5.3: Detection accuracy vs tRth
the incorrect detection of a long-term blockage results in the significantdowntime. Therefore, we choose 500 ms as the optimum tDth
because it isthe shortest tDth
that can still provide high ALTB as well as ASTB. Further-more, as shown in Table 4.1, tD for the blockage in Scenario 1, 2 and 3 are140.54 ms, 298.13 ms and 411.27 ms, respectively. Therefore, setting tDth
to500 ms still enables the system to detect ∆SQD for all blockage scenarioswith high accuracy. This tDth
value is used in the next measurement to findthe optimum tRth
.
Figure 5.3 shows the detection accuracy performance for various tRthval-
ues. For this measurement, we used a fixed tDthof 500 ms. It is shown that
ASTB highly depends on the tRth. Lowering tRth
leads to the decreasingof ASTB. It is because when tRth
is too short, the system does not haveenough time to observe the large ∆SQR. Consequently, the system hashastily inferred the long-term blockage before the signal quality could re-cover, as explained in Section 5.1.1. We performed polynomial curve fittingto find the approximate relation between ASTB and tRth
. By doing so, wefound that the relation between ASTB and tRth
for 0 ≤ tRth≤ 2.5 s fits to
the 3rd polynomial (cubic) equation as shown in Equation 5.8.
ASTB(tRth) = 0.138(tRth
)3 − 0.78(tRth)2 + 1.495(tRth
)− 0.021 (5.8)
ALTB = 97.08% (5.9)
On the other hand, ALTB is not affected by the variation of tRthas ALTB
tends to be constant above 90% for various tRth. ALTB is approximated by
averaging ALTB values during 0 ≤ tRth≤ 2.5 s, as shown in Equation 5.9.
47

5.3 Optimum Decision Time
The total decision time consists of tDthand tRth
components, in which tRth
contributes the most significant waiting time. As shown in Figure 5.3, thehigher the tRth
, the higher accuracy of blockage detection, especially theshort-term blockage. Lowering the tRth
results in the low detection accuracy,especially ASTB. However, increasing tRth
makes the waiting time longer.Therefore, there is a trade-off between the decision time and the detectionaccuracy. Choosing an optimum tRth
value is critical so that the waiting timecan be minimized while the high detection accuracy can still be maintained.In this section, the optimum tRth
is obtained by calculating the total outageduration due to the blockage.
The total outage duration (tOtot) in a blockage event is formulated inEquation 5.10. It is determined by the probability that the short-termand long-term blockage will occur (pSTB and pLTB), the accuracy in de-tecting each blockage type (ASTB and ALTB) and the outage duration ofeach blockage type (tOC(STB)
, tOF (STB), tOC(LTB)
and tOF (LTB)). Since there
are only two possible decisions: short-term and long-term blockage, thenpLTB = 1− pSTB.
tOtot = pSTB(ASTB.tOC(STB)+ (1−ASTB).tOF (STB)
)+
pLTB(ALTB.tOC(LTB)+ (1−ALTB).tOF (LTB)
)(5.10)
By subsituting pLTB = 1 - pSTB, tOC(STB), tOF (STB)
, tOC(LTB), tOF (LTB)
,ASTB and ALTB from Equation 5.5–5.9, respectively, to Equation 5.10, wewill get tOtot as a function of tRth
and pSTB, as shown in Equation 5.11.
tOtot(tRth, pSTB) = pSTB(−0.138.tRth
4 + 0.628.tRth
3 − 0.636.tRth
2
+
(0.971
pSTB− 1.596
)tRth
+3.146
pSTB− 0.374) s
(5.11)
Figure 5.4 displays the relation between tOtot and tRthfor several pSTB
values. For the same tRth, the lower pSTB (higher pLTB) results in the longer
outage duration. It is because the outage duration due to the long-termblockage (tOC(LTB)
and tOF (LTB)) are higher than that due to the short-time
blockage (tOC(STB)and tOF (STB)
). Therefore, if the long-term blockage occursmore frequently, the total outage duration will be longer.
From the graph, the optimum tRthfor each pSTB is achieved at the min-
imum tOtot . Increasing or decreasing the tRthabove or under its optimum
value might result in the longer outage duration. To find the optimum tRth,
we differentiate tOtot in Equation 5.11 with respect to tRth. The optimum
tRthis obtained when
dtOtotdtRth
= 0 as shown in Equation 5.12.
48

0 0.5 1 1.5 2 2.50
1
2
3
4
5
6
7
8
tR
th
(s)
t Oto
t (s)
pSTB
=100%
pSTB
=75%
pSTB
=50%
pSTB
=25%
pSTB
=0%
Figure 5.4: tOtot and tRthrelation
dtOtot
dtRth
= pSTB(−0.552.tRth
3 + 1.884.tRth
2 − 1.272.tRth+
0.971
pSTB− 1.596) = 0
(5.12)
0 20 40 60 80 1000
200
400
600
800
1000
pSTB
(%)
Op
tim
um
t R
th (
ms)
Figure 5.5: Optimum tRthfor different pSTB
By solving Equation 5.12, the optimum tRthfor various pSTB values are
obtained. Figure 5.5 depicts the optimum tRthvalue for all pSTB. In the
environment where the probability of short-term blockage is relatively small(pSTB ≤ 23%), setting tRth
to 0 s minimizes the outage duration. As pSTB
49
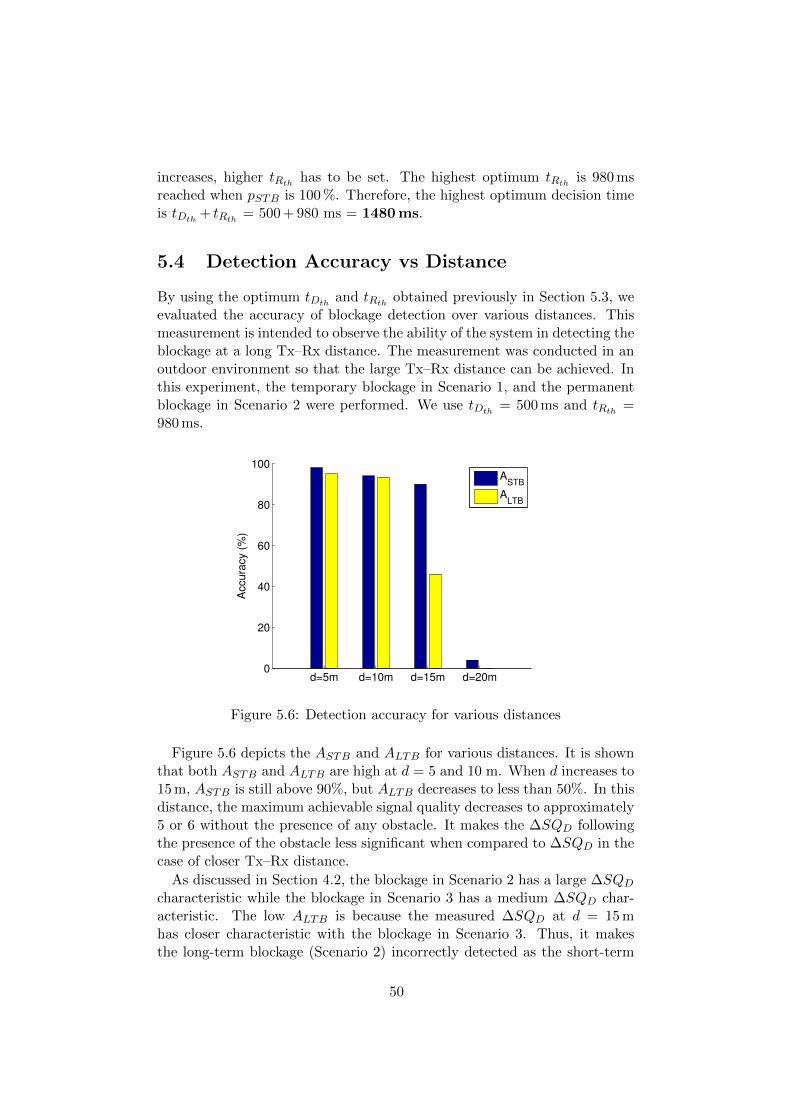
increases, higher tRthhas to be set. The highest optimum tRth
is 980 msreached when pSTB is 100 %. Therefore, the highest optimum decision timeis tDth
+ tRth= 500 + 980 ms = 1480 ms.
5.4 Detection Accuracy vs Distance
By using the optimum tDthand tRth
obtained previously in Section 5.3, weevaluated the accuracy of blockage detection over various distances. Thismeasurement is intended to observe the ability of the system in detecting theblockage at a long Tx–Rx distance. The measurement was conducted in anoutdoor environment so that the large Tx–Rx distance can be achieved. Inthis experiment, the temporary blockage in Scenario 1, and the permanentblockage in Scenario 2 were performed. We use tDth
= 500 ms and tRth=
980 ms.
d=5m d=10m d=15m d=20m0
20
40
60
80
100
Accu
racy (
%)
ASTB
ALTB
Figure 5.6: Detection accuracy for various distances
Figure 5.6 depicts the ASTB and ALTB for various distances. It is shownthat both ASTB and ALTB are high at d = 5 and 10 m. When d increases to15 m, ASTB is still above 90%, but ALTB decreases to less than 50%. In thisdistance, the maximum achievable signal quality decreases to approximately5 or 6 without the presence of any obstacle. It makes the ∆SQD followingthe presence of the obstacle less significant when compared to ∆SQD in thecase of closer Tx–Rx distance.
As discussed in Section 4.2, the blockage in Scenario 2 has a large ∆SQD
characteristic while the blockage in Scenario 3 has a medium ∆SQD char-acteristic. The low ALTB is because the measured ∆SQD at d = 15 mhas closer characteristic with the blockage in Scenario 3. Thus, it makesthe long-term blockage (Scenario 2) incorrectly detected as the short-term
50

blockage (Scenario 3).In the further distance (d = 20 m), both ASTB and ALTB decrease to less
than 5%. In this distance, the maximum achievable signal quality decreasesto approximately 2, in the absence of an obstacle. The presence of the humanbody causes the signal quality decreases to 1, so that most of the time,∆SQD is only 1 unit. Since the algorithm ignores the blockage detectionfor ∆SQD ≤ 1 as explained in Section 4.2, most of the blockages are notdetected by the system. This misdetection results in very low accuracy indetecting both blockage types.
Based on the results above, it can be concluded that the algorithm can de-tect all blockage types with the high accuracy at Tx–Rx distance up to 10 m,which is the typical operational distance for this wireless docking system.
51

52

Chapter 6
Conclusion
The 60 GHz band has emerged as a potential candidate to fulfill the de-sired network capacity growth as it provides large contiguous bandwidth.However, the communication in 60 GHz band suffers from higher path losscompared to that in sub-6 GHz bands. To compensate the high path loss,a highly directional antenna has to be used. The usage of a highly direc-tional antenna and the small wavelength in 60 GHz communication make itvulnerable to human body blockage. Human activities in a 60 GHz link en-vironment might disrupt the link and thus cause a link quality degradation.
Various human activities result in different effects on the 60 GHz link per-formance. Therefore, blockage characterization is necessary so that eachblockage type can be treated differently to minimize the effect of link dis-ruption. This thesis provides a human blockage characterization methodthat can distinguish between a temporary and permanent human blockagein both LOS and NLOS environments. The blockage characterization de-termines the action has to be taken to circumvent the blockage.
We categorize the human blockage into two types: short-term and long-term blockage, based on the duration of the link disruption. In the case ofshort-term blockage, the station has to keep the connection with the currentAP. On the contrary, in the case of long-term blockage, maintaining the con-nection with the current AP causes long-period link disruption. To preventthis, we propose a handover mechanism between APs that is triggered follow-ing the long-term blockage indication. Our results show that the handovercan maintain the continuity of transmission and avoid the long-term linkdisruption, although there is some interruption delay during that process.
The duration of a link disruption depends on the detection accuracy andthe probability of blockage type. Incorrect detection of a blockage typeaggravates the link disruption. Therefore, the accuracy in detecting thecorrect blockage type is important. Nevertheless, there is a trade-off betweenthe detection accuracy and the decision waiting time. The decision time hasto be as small as possible so that the station can immediately take an action
53

to overcome the blockage. However, reducing the decision time results inpoor detection accuracy. Therefore, choosing the optimum decision timeis crucial in order to minimize the waiting time while maintaining highdetection accuracy. In an environment where the likelihood of short-termblockage is small, lowering the decision time minimizes the total link outageduration.
We also evaluated the effect of various Tx–Rx distances on the detectionaccuracy. Our results show that the system can obtain high accuracy indetecting both blockage types for the Tx–Rx distance up to 10 m, which isa typical operational distance of our device.
Besides minimizing the outage duration due to the blockage, this block-age characterization method can also be used for other purposes such asobserving how frequent a certain human blockage type occurs in an area,as well as discovering the alternative transmission paths in an environment.Such information is useful to determine the optimal placement of a 60 GHzAP or the relay stations when implementing a 60 GHz network in an envir-onment.
6.1 Future Work
Experimental studies on 60 GHz communication is still in its infancy. Wehave provided a first step to determine the characteristic of human blockageby using COTS 60 GHz devices. However, several hardware restrictionslimit our measurements. Firstly, the signal quality is represented in a verylimited resolution that complicates interpretation. Secondly, the throughputperformance measurement is also limited up to 1 Gbps due to the limitationof the Gigabit Ethernet port used. It becomes a bottleneck when measuringmulti-Gbps data rate provided by the 60 GHz connection.
Due to the time constraints, only the blockage effect caused by a singleperson was measured in this work. However, the number of persons blockingthe link might affect the duration of link disruption. Therefore, observingthe blockage effect due to multiple persons blocking the link simultaneouslycan be a future work.
54

Bibliography
[1] Kishor Chandra, Zizheng Cao, TM Bruintjes, R Venkatesha Prasad,G Karagiannis, Eduward Tangdiongga, HPA van den Boom, and ABJKokkeler. mcran: A radio access network architecture for 5g indoorcommunications. In In IEEE ICC 2015 - Workshop on Fiber-WirelessIntegrated Technologies, Systems and Networks (ICC’15 - Workshops09)., 2015.
[2] Kishor Chandra, R Venkatesha Prasad, and Ignas Niemegeers. Anarchitectural framework for 5g indoor communications. In 2015 Inter-national Wireless Communications and Mobile Computing Conference(IWCMC), pages 1144–1149. IEEE, 2015.
[3] Kishor Chandra and R Venkatesha Prasad. Directional mac protocolsfor 60 ghz millimeter wave wlans. In Wireless Network Performance En-hancement via Directional Antennas: Models, Protocols, and Systems,pages 169–187. CRC Press, 2015.
[4] Jeroen Hoebeke, Gerry Holderbeke, Ingrid Moerman, Martin Jac-obsson, Venkatesha Prasad, N Cempaka Wangi, Ignas Niemegeers, andS Heemstra De Groot. Personal network federations. In Proceedings ofthe 15th IST Mobile & Wireless Communications Summit. Myconos.
[5] IEEE LAN and MAN Standards Committee. IEEE 802.11ad Standard:Wireless LAN Medium Access Control ( MAC ) and Physical Layer (PHY ) Specifications, volume Amendment 3 : Enhancements for VeryHigh Throughput in the 60 GHz Band. 2012.
[6] IEEE LAN/MAN Standards Committee. Part 15.3: Wireless MediumAccess Control (MAC) and Physical Layer (PHY) Specifications forHigh Rate Wireless Personal Area Networks (WPANs), 2009.
[7] ECMA International. Standard ECMA-387: High rate 60 GHz PHY,MAC and PALs. 2010.
[8] Sanjib Sur, Vignesh Venkateswaran, Xinyu Zhang, and ParmeshRamanathan. 60 GHz Indoor Networking through Flexible Beams :A Link-Level Profiling. Acm Sigmetrics, pages 71–84, 2015.
55
[9] Sylvain Collonge, Gheorghe Zaharia, and Ghais El Zein. Influence of thehuman activity on wide-band characteristics of the 60 GHz indoor radiochannel. IEEE Transactions on Wireless Communications, 3(6):2396–2406, 2004.
[10] Martins Jacob, Christian Mbianke, and Thomas Kurner. Human BodyBlockage - Guidelines for TGad MAC development. Technical ReportNovember, 2009.
[11] ITU-R. Attenuation by atmospheric gases. P Series Radiowavepropagation, 10, 2013.
[12] Kishor Chandra, R Venkatesha Prasad, Ignas GMM Niemegeers, andAbdur R Biswas. Adaptive beamwidth selection for contention basedaccess periods in millimeter wave wlans. In 2014 IEEE 11th ConsumerCommunications and Networking Conference (CCNC), pages 458–464.IEEE, 2014.
[13] Federal Communications Commission. Revision of Part 15 of the Com-mission’s Rules Regarding Operation in the 57-64 GHz Band. Technicalreport, 2015.
[14] Alexander Maltsev, Roman Maslennikov, Alexey Sevastyanov, AlexeyKhoryaev, and Artyom Lomayev. Experimental investigations of 60GHz WLAN systems in office environment. IEEE Journal on SelectedAreas in Communications, 27(8):1488–1499, 2009.
[15] IEEE 802.15 Task Group 3c. http://www.ieee802.org/15/pub/tg3c.html.
[16] Kishor Chandra, Arjan Doff, Zizheng Cao, R. Venkatesha Prasad, andIgnas Niemegeers. 60 GHz MAC Standardization: Progress and WayForward. 2015 12th Annual IEEE Consumer Communications and Net-working Conference, CCNC 2015, pages 182–187, 2015.
[17] ITU. ITU-R M.2003 Multiple Gigabit Wireless Systems in frequenciesaround 60 GHz. Technical report, 2012.
[18] Thomas Nitsche, Carlos Cordeiro, Adriana B Flores, Edward WKnightly, Eldad Perahia, and I Nvited P Aper. RADIO COMMU-NICATIONS IEEE 802.11ad : Directional 60 GHz Communication forMulti Gigabit-per-Second Wi-Fi. (December):132–141, 2014.
[19] Y. Ming Tsang and Ada S Y Poon. Detecting human blockage anddevice movement in mmwave communication system. GLOBECOM -IEEE Global Telecommunications Conference, 2011.
[20] A. W. Doff, K. Chandra, and R. Venkatesha Prasad. Sensor assistedmovement identification and prediction for beamformed 60 GHz links.
56
2015 12th Annual IEEE Consumer Communications and NetworkingConference, CCNC 2015, (i):648–653, 2015.
[21] A. Khfaji, R. Saadane, J. El Abbadi, and M. Belkasmi. Ray TracingTechnique based 60 GHz Band Propagation Modelling and Influence ofPeople Shadowing. Engineering and Technology, 2(9):667–673, 2008.
[22] Martin Jacob, Sebastian Priebe, Alexander Maltsev, Artyom Lomayev,Vinko Erceg, and Thomas Kurner. A ray tracing based stochastic hu-man blockage model for the IEEE 802.11ad 60 GHz channel model.Proceedings of the 5th European Conference on Antennas and Propaga-tion (EUCAP), (m):3084–3088, 2011.
[23] Carl Gustafson and Fredrik Tufvesson. Characterization of 60 GHzshadowing by human bodies and simple phantoms. Radioengineering,21(4):979–984, 2012.
[24] Jonathan Lu, Daniel Steinbach, Patrick Cabrol, and Philip Pietraski-InterDigital. Modeling the Impact of Human Blockers in MillimeterWave Radio Links. ZTE Communications Magazine, 10(4):23–28, 2012.
[25] Y Oguma, R Arai, T Nishio, K Yamamoto, and M Morikura. Proact-ive Base Station Selection Based on Human Blockage Prediction UsingRGB-D Cameras for mmWave Communications. 2015 IEEE GlobalCommunications Conference (GLOBECOM), pages 1–6, 2015.
[26] Sanjib Sur, Xinyu Zhang, Parmesh Ramanathan, and RanveerChandra. BeamSpy : Enabling Robust 60 GHz Links Under Block-age This paper is included in the Proceedings of the. Proceedings ofthe 13th USENIX Symposium on Networked Systems Design and Im-plementation (NSDI ’16), pages 193 —- 206, 2016.
[27] Roberto Congiu, Hossein Shokri-Ghadikolaei, Carlo Fischione, and For-tunato Santucci. On the Relay-Fallback Tradeoff in Millimeter WaveWireless System. page 6, 2016.
[28] Kishor Chandra, R. Venkatesha Prasad, Bien Quang Niemegeers, andIgnas. Cogcell:cognitive interplay between 60ghz picocells and 2.4/5ghzhotspots in the 5g era. IEEE Communications Magazine, Special is-sue on Emerging Applications, Services and Engineering for CognitiveCellular Systems (EASE4CCS),, 2015.
[29] Swetank Kumar Saha, Viral Vijay Vira, Anuj Garg, and DimitriosKoutsonikolas. 60 GHz Multi-Gigabit Indoor WLANs: Dream or Real-ity? 2015.
57
[30] Thomas Nitsche, Guillermo Bielsa, Irene Tejado, and Universidad Car-los Iii. Boon and Bane of 60 GHz Networks : Practical Insights intoBeamforming , Interference , and Frame Level Operation. 2015.
[31] Junaid Ansari, Nikos Perpinias, Alexander Nahring, Petri Mahonen,and Marina Petrova. Empirical characterization of mm-wave commu-nication links in realistic indoor scenarios. 2015 IEEE Wireless Com-munications and Networking Conference (WCNC), pages 1799–1804,2015.
[32] Adrian Loch. Millimeter-Wave Blind Spots : Mitigating Deafness Col-lisions Using Frame Aggregation. (mmNet), 2016.
[33] Daniel Halperin, Srikanth Kandula, Jitendra Padhye, Paramvir Bahl,and David Wetherall. Augmenting data center networks with multi-gigabit wireless links. Sigcomm 2011, 41(4):38, 2011.
[34] Yibo Zhu, Xia Zhou, Zengbin Zhang, Lin Zhou, Amin Vahdat, Ben Y.Zhao, and Haitao Zheng. Cutting the cord: a Robust Wireless FacilitiesNetwork for Data Centers. Proceedings of the 20th annual internationalconference on Mobile computing and networking - MobiCom ’14, pages581–592, 2014.
[35] Yibo Zhu, Zengbin Zhang, Zhinus Marzi, Chris Nelson, UpamanyuMadhow, Ben Y Zhao, and Haitao Zheng. Demystifying 60GHz out-door picocells. the 20Th Annual International Conference, pages 5–16,2014.
[36] Ljiljana Simic, Nikos Perpinias, and Marina Petrova. 60 GHz OutdoorUrban Measurement Study of the Feasibility of Multi-Gbps mm-WaveCellular Networks. (mmNet):331–336, mar 2016.
[37] Intel Corporation. Intel® Wireless Gigabit Sink W13100 ProductBrief.
[38] Intel Corporation. Intel® Tri-Band Wireless-AC 17265 Product Brief.
[39] iPerf - The TCP, UDP and SCTP network bandwidth measurementtool.
[40] William Lee. Wireless and Cellular Communications. McGraw-Hill,third edition, 2005.
[41] Adrian Loch, Irene Tejado, and Joerg Widmer. Potholes Ahead: Impactof Transient Link Blockage on Beam Steering in Practical mm-WaveSystems. pages 1–15, 2016.
58
[42] Thomas Nitsche, Adriana B. Flores, Edward W. Knightly, and JoergWidmer. Steering with eyes closed: Mm-Wave beam steering withoutin-band measurement. Proceedings - IEEE INFOCOM, 26:2416–2424,2015.
[43] Julian Arnold, Ljiljana Simi, Marina Petrova, and Petri Mahonen.Demo : Spectrum-Agile mm-Wave Packet Radio Implementation onUSRPs. pages 5–8, 2015.
[44] Gek Hong Sim, Rui Li, Cristina Cano, David Malone, Paul Patras,and Joerg Widmer. Learning from Experience : Efficient DecentralizedScheduling for 60GHz Mesh Networks. 2016.
[45] Yuta Oguma, Takayuki Nishio, Koji Yamamoto, and MasahiroMorikura. Proactive Traffic Control based on Human Blockage Pre-diction using RGB-D Cameras for mmWave Communications. IEICETransactions on Communications, E99B(8):1734–1744, 2016.
[46] M Ghaddar and M Nedil. Experimental Analysis of Human Body Ef-fects on NLOS 60 GHz Propagation Channel. pages 1788–1789, 2015.
59

60

Appendix A
IEEE 802.11ad MCS
Data ReceiverPHY MCS Modulation Code Rate Sensitivity
Rate (Mbps) (dBm)
Control 0 π/2-DBPSK 1/2 27.5 -78
1 π/2-BPSK 1/2 385 -682 π/2-BPSK 1/2 770 -663 π/2-BPSK 5/8 962.5 -654 π/2-BPSK 3/4 1155 -64
Single 5 π/2-BPSK 13/16 1251.25 -62Carrier 6 π/2-QPSK 1/2 1540 -63(SC) 7 π/2-QPSK 5/8 1925 -62
8 π/2-QPSK 3/4 2310 -619 π/2-QPSK 13/16 2502.5 -5910 π/2-16QAM 1/2 3080 -5511 π/2-16QAM 5/8 3850 -5412 π/2-16QAM 3/4 4620 -53
13 SQPSK 1/2 693 -6614 SQPSK 5/8 866.25 -6415 QPSK 1/2 1386 -6316 QPSK 5/8 1732.5 -6217 QPSK 3/4 2079 -60
OFDM 18 16QAM 1/2 2772 -5819 16QAM 5/8 3465 -5620 16QAM 3/4 4158 -5421 16QAM 13/16 4504.5 -5322 64QAM 5/8 5197.5 -5123 64QAM 3/4 6237 -4924 64QAM 13/16 6756 -47
61

Data ReceiverPHY MCS Modulation Code Rate Sensitivity
Rate (Mbps) (dBm)
25 π/2-BPSK 13/28 626 -6426 π/2-BPSK 13/21 834 -60
Low 27 π/2-BPSK 52/63 1112 -57Power 28 π/2-QPSK 13/28 1251 -57
SC 29 π/2-QPSK 13/21 1668 -5730 π/2-QPSK 52/63 2224 -5731 π/2-QPSK 13/14 2503 -57
Table A.1: Data rate and receiver sensitivity corresponding to MCS
62
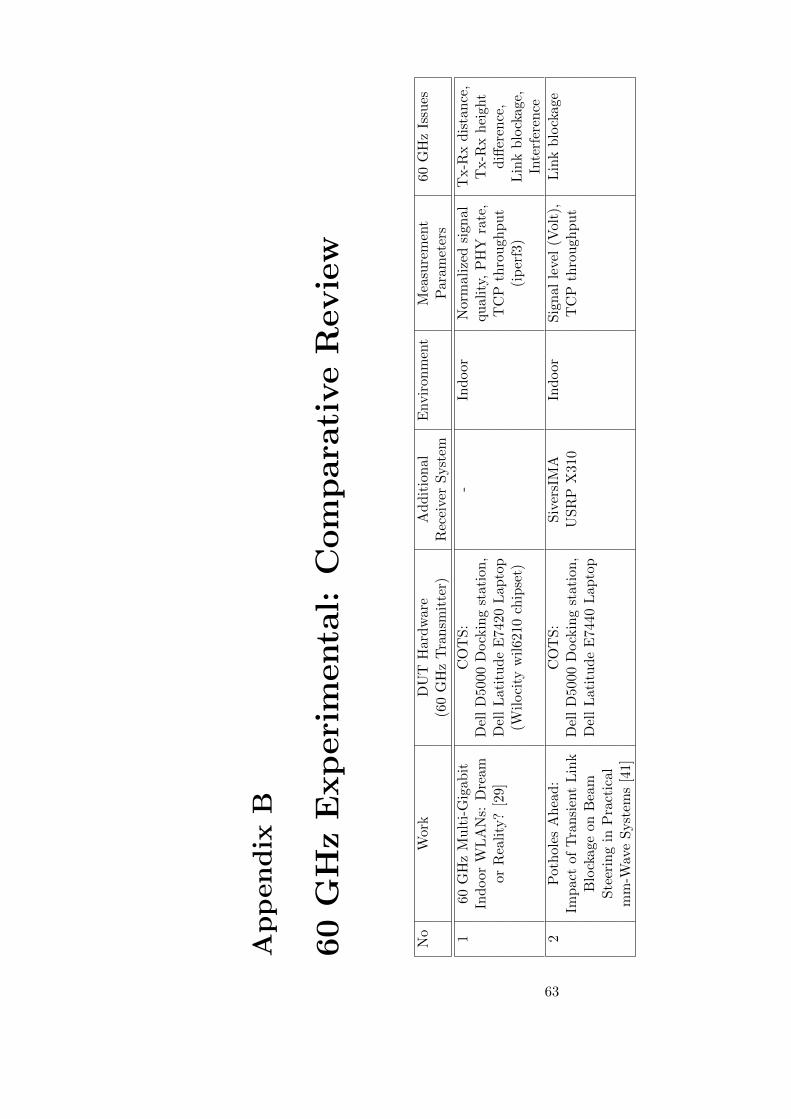
Ap
pen
dix
B
60
GH
zE
xp
eri
menta
l:C
om
para
tive
Revie
w
No
Work
DU
TH
ard
war
eA
dd
itio
nal
Envir
on
men
tM
easu
rem
ent
60
GH
zIs
sues
(60
GH
zT
ran
smit
ter)
Rec
eive
rS
yst
emP
aram
eter
s
160
GH
zM
ult
i-G
igab
itC
OT
S:
-In
door
Norm
aliz
edsi
gn
al
Tx-R
xd
ista
nce
,In
door
WL
AN
s:D
ream
Del
lD
500
0D
ock
ing
stat
ion
,qu
ali
ty,
PH
Yra
te,
Tx-R
xh
eight
orR
eali
ty?
[29]
Del
lL
atit
ud
eE
7420
Lap
top
TC
Pth
rou
ghp
ut
diff
eren
ce,
(Wil
oci
tyw
il62
10ch
ipse
t)(i
per
f3)
Lin
kb
lock
age,
Inte
rfer
ence
2P
oth
oles
Ahea
d:
CO
TS
:S
iver
sIM
AIn
door
Sig
nal
leve
l(V
olt
),L
ink
blo
ckage
Imp
act
ofT
ran
sien
tL
ink
Del
lD
500
0D
ock
ing
stat
ion
,U
SR
PX
310
TC
Pth
rou
ghp
ut
Blo
ckag
eon
Bea
mD
ell
Lat
itu
de
E74
40L
apto
pS
teer
ing
inP
ract
ical
mm
-Wav
eSyst
ems
[41]
63
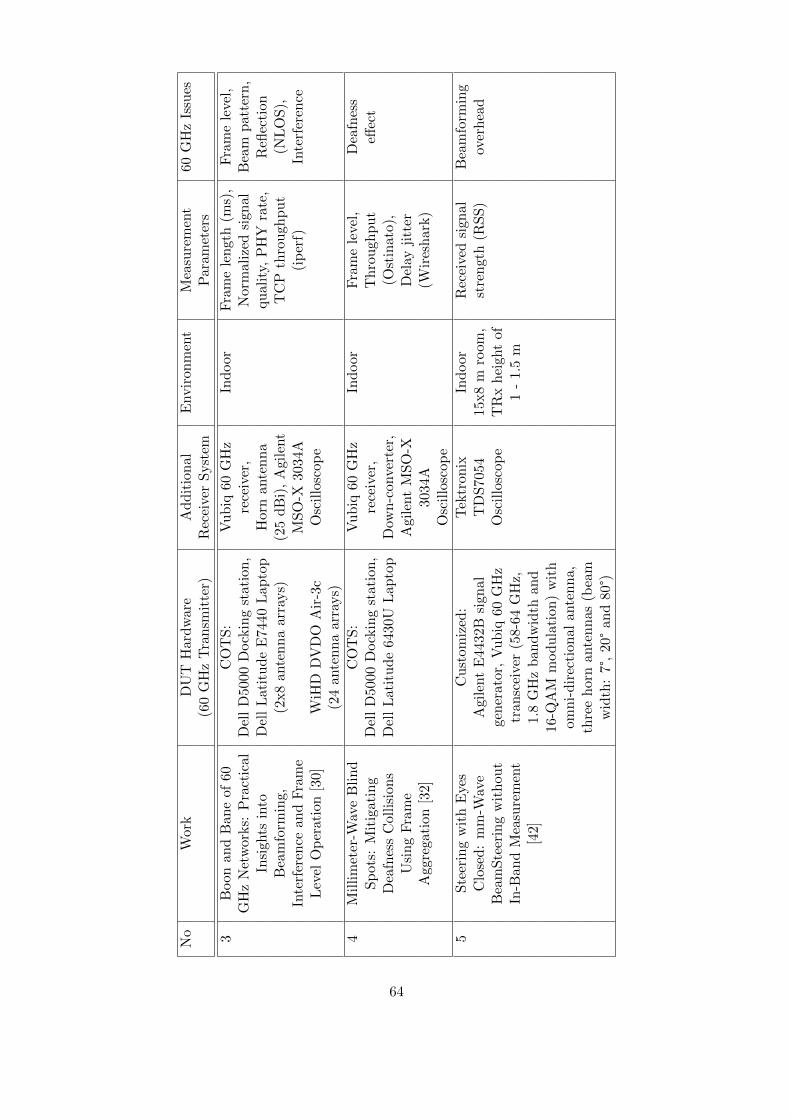
No
Wor
kD
UT
Har
dw
are
Ad
dit
ion
alE
nvir
on
men
tM
easu
rem
ent
60
GH
zIs
sues
(60
GH
zT
ran
smit
ter)
Rec
eive
rS
yst
emP
aram
eter
s
3B
oon
and
Ban
eof
60C
OT
S:
Vu
biq
60G
Hz
Ind
oor
Fra
me
len
gth
(ms)
,F
ram
ele
vel,
GH
zN
etw
ork
s:P
ract
ical
Del
lD
500
0D
ock
ing
stat
ion
,re
ceiv
er,
Norm
aliz
edsi
gn
al
Bea
mp
att
ern
,In
sigh
tsin
toD
ell
Lati
tud
eE
7440
Lap
top
Hor
nan
ten
na
qu
alit
y,P
HY
rate
,R
eflec
tion
Bea
mfo
rmin
g,
(2x8
ante
nn
aar
rays)
(25
dB
i),
Agi
lent
TC
Pth
rou
gh
pu
t(N
LO
S),
Inte
rfer
ence
an
dF
ram
eM
SO
-X30
34A
(ip
erf)
Inte
rfer
ence
Lev
elO
per
ati
on[3
0]W
iHD
DV
DO
Air
-3c
Osc
illo
scop
e(2
4an
tenn
aar
rays)
4M
illi
met
er-W
ave
Bli
nd
CO
TS
:V
ub
iq60
GH
zIn
door
Fra
me
leve
l,D
eafn
ess
Sp
ots
:M
itig
atin
gD
ell
D500
0D
ock
ing
stat
ion
,re
ceiv
er,
Th
rou
gh
pu
teff
ect
Dea
fnes
sC
oll
isio
ns
Del
lL
ati
tud
e64
30U
Lap
top
Dow
n-c
onver
ter,
(Ost
inato
),U
sin
gF
ram
eA
gile
nt
MS
O-X
Del
ayji
tter
Agg
rega
tion
[32]
3034
A(W
ires
hark
)O
scil
losc
ope
5S
teer
ing
wit
hE
yes
Cu
stom
ized
:T
ektr
onix
Ind
oor
Rec
eive
dsi
gn
al
Bea
mfo
rmin
gC
lose
d:
mm
-Wav
eA
gile
nt
E44
32B
sign
alT
DS
7054
15x
8m
room
,st
ren
gth
(RS
S)
over
hea
dB
eam
Ste
erin
gw
ith
ou
tge
ner
ator
,V
ub
iq60
GH
zO
scil
losc
ope
TR
xh
eigh
tof
In-B
and
Mea
sure
men
ttr
an
scei
ver
(58-
64G
Hz,
1-
1.5
m[4
2]
1.8
GH
zb
and
wid
than
d16-
QA
Mm
od
ula
tion
)w
ith
om
ni-
dir
ecti
onal
ante
nn
a,th
ree
hor
nan
ten
nas
(bea
mw
idth
:7°,
20°
and
80°)
64
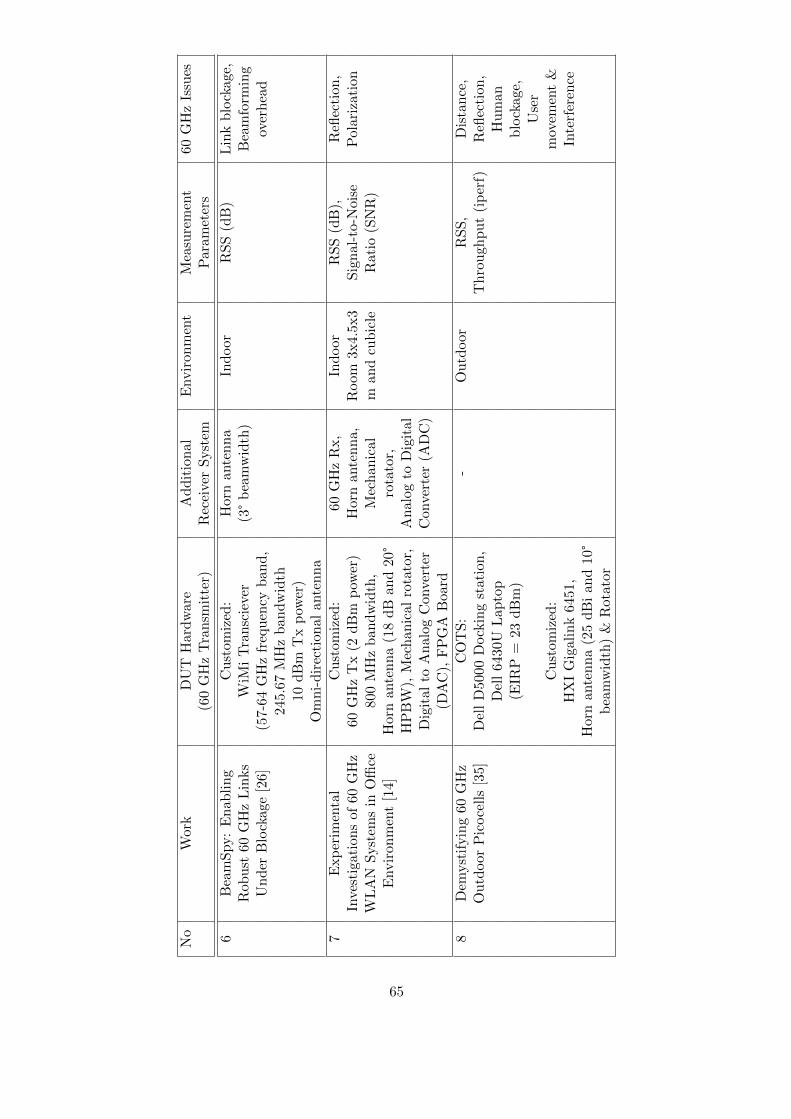
No
Work
DU
TH
ard
war
eA
dd
itio
nal
Envir
on
men
tM
easu
rem
ent
60
GH
zIs
sues
(60
GH
zT
ran
smit
ter)
Rec
eive
rS
yst
emP
ara
met
ers
6B
eam
Spy:
En
abli
ng
Cu
stom
ized
:H
orn
ante
nn
aIn
door
RS
S(d
B)
Lin
kb
lock
age,
Rob
ust
60G
Hz
Lin
ks
WiM
iT
ran
scie
ver
(3°
bea
mw
idth
)B
eam
form
ing
Un
der
Blo
ckag
e[2
6](5
7-6
4G
Hz
freq
uen
cyb
and
,ov
erh
ead
245
.67
MH
zb
and
wid
th10
dB
mT
xp
ower
)O
mn
i-d
irec
tion
alan
ten
na
7E
xp
erim
enta
lC
ust
omiz
ed:
60G
Hz
Rx,
Ind
oor
RS
S(d
B),
Refl
ecti
on
,In
vest
igat
ion
sof
60G
Hz
60G
Hz
Tx
(2d
Bm
pow
er)
Hor
nan
ten
na,
Room
3x4.
5x3
Sig
nal
-to-N
ois
eP
ola
riza
tion
WL
AN
Syst
ems
inO
ffice
800
MH
zb
and
wid
th,
Mec
han
ical
man
dcu
bic
leR
atio
(SN
R)
Envir
on
men
t[1
4]
Horn
ante
nn
a(1
8d
Ban
d20
°ro
tato
r,H
PB
W),
Mec
han
ical
rota
tor,
An
alog
toD
igit
al
Dig
ital
toA
nal
ogC
onve
rter
Con
vert
er(A
DC
)(D
AC
),F
PG
AB
oard
8D
emyst
ifyin
g60
GH
zC
OT
S:
-O
utd
oor
RS
S,
Dis
tan
ce,
Ou
tdoor
Pic
oce
lls
[35]
Del
lD
500
0D
ock
ing
stat
ion
,T
hro
ugh
pu
t(i
per
f)R
eflec
tion
,D
ell
6430
UL
apto
pH
um
an
(EIR
P=
23d
Bm
)b
lock
age,
Use
rC
ust
omiz
ed:
mov
emen
t&
HX
IG
igal
ink
6451
,In
terf
eren
ceH
orn
ante
nn
a(2
5d
Bi
and
10°
bea
mw
idth
)&
Rot
ator
65
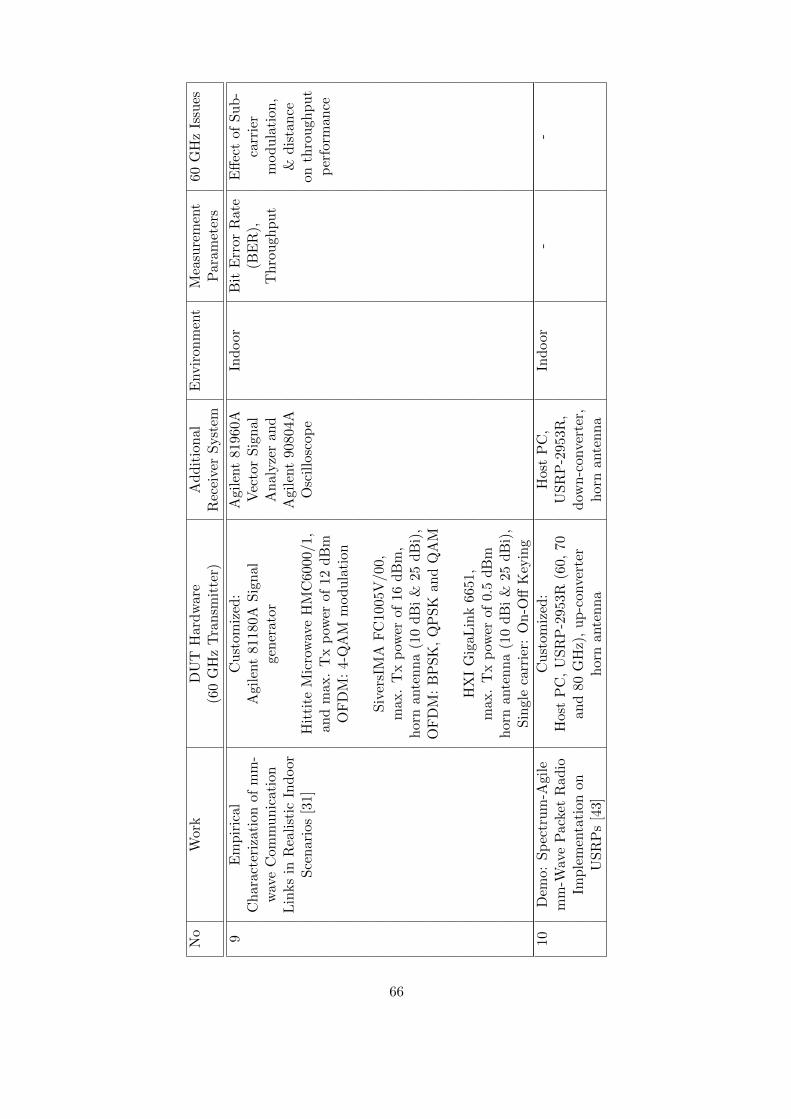
No
Work
DU
TH
ard
war
eA
dd
itio
nal
Envir
on
men
tM
easu
rem
ent
60
GH
zIs
sues
(60
GH
zT
ran
smit
ter)
Rec
eive
rS
yst
emP
aram
eter
s
9E
mp
iric
al
Cu
stom
ized
:A
gile
nt
8196
0AIn
door
Bit
Err
orR
ate
Eff
ect
of
Su
b-
Ch
ara
cter
izati
onof
mm
-A
gil
ent
8118
0AS
ign
alV
ecto
rS
ign
al(B
ER
),ca
rrie
rw
ave
Com
mu
nic
atio
nge
ner
ator
An
alyze
ran
dT
hro
ugh
pu
tm
od
ula
tion
,L
inks
inR
eali
stic
Ind
oor
Agi
lent
9080
4A&
dis
tan
ceS
cen
ari
os[3
1]H
itti
teM
icro
wav
eH
MC
6000
/1,
Osc
illo
scop
eon
thro
ugh
pu
tan
dm
ax.
Tx
pow
erof
12d
Bm
per
form
an
ceO
FD
M:
4-Q
AM
mod
ula
tion
Siv
ersI
MA
FC
1005
V/0
0,m
ax.
Tx
pow
erof
16d
Bm
,h
orn
ante
nn
a(1
0d
Bi
&25
dB
i),
OF
DM
:B
PS
K,
QP
SK
and
QA
M
HX
IG
igaL
ink
6651
,m
ax.
Tx
pow
erof
0.5
dB
mh
orn
ante
nn
a(1
0d
Bi
&25
dB
i),
Sin
gle
carr
ier:
On
-Off
Key
ing
10
Dem
o:S
pec
tru
m-A
gile
Cu
stom
ized
:H
ost
PC
,In
door
--
mm
-Wav
eP
acke
tR
ad
ioH
ost
PC
,U
SR
P-2
953R
(60,
70U
SR
P-2
953R
,Im
ple
men
tati
onon
and
80G
Hz)
,u
p-c
onve
rter
dow
n-c
onver
ter,
US
RP
s[4
3]h
orn
ante
nn
ah
orn
ante
nn
a
66

No
Work
DU
TH
ard
war
eA
dd
itio
nal
Envir
on
men
tM
easu
rem
ent
60
GH
zIs
sues
(60
GH
zT
ran
smit
ter)
Rec
eive
rS
yst
emP
aram
eter
s
11
60
GH
zO
utd
oor
Urb
anC
ust
omiz
ed:
Hor
nan
ten
na,
Ou
tdoor
RS
SB
eam
-M
easu
rem
ent
Stu
dy
of
Agil
ent
E44
38C
ES
GA
gile
nt
1197
0Vm
isali
gn
men
tth
eF
easi
bil
ity
of
Mu
lti-
Vec
tor
Sig
nal
Gen
erat
or,
mix
er,
Gb
ps
mm
-Wav
eC
ellu
lar
Siv
ersI
MA
FC
1005
V/1
00A
gile
nt
N90
30A
Net
wor
ks
[36]
mm
-Wav
eu
p-c
onve
rter
,S
pec
tru
mA
nal
yze
r(E
IRP
=30
dB
m,
fc=
61.5
GH
z)
12
60
GH
zIn
door
Cu
stom
ized
:W
iMi
syst
em:
Ind
oor
RS
SU
ser
mob
ilit
y,N
etw
orkin
gth
rou
gh
WiM
isy
stem
:H
orn
ante
nn
a,L
ink
blo
ckage
Fle
xib
leB
eam
s:W
AR
Pb
oard
(FP
GA
),60
GH
zR
FR
x,
AL
ink-L
evel
Pro
fili
ng
DA
C,
60G
Hz
RF
,A
DC
,W
AR
Pb
oard
[8]
Hor
nan
ten
na
(FP
GA
)
13
Lea
rnin
gfr
om
CO
TS
:-
Ind
oor
PH
Yra
teD
eafn
ess
Exp
erie
nce
:E
ffici
ent
Del
lD
5000
Dock
ing
stat
ion
effec
tD
ecen
trali
zed
Del
l64
30U
Lap
top
Sch
edu
lin
gfo
r60
GH
zM
esh
Net
work
s[4
4]
67
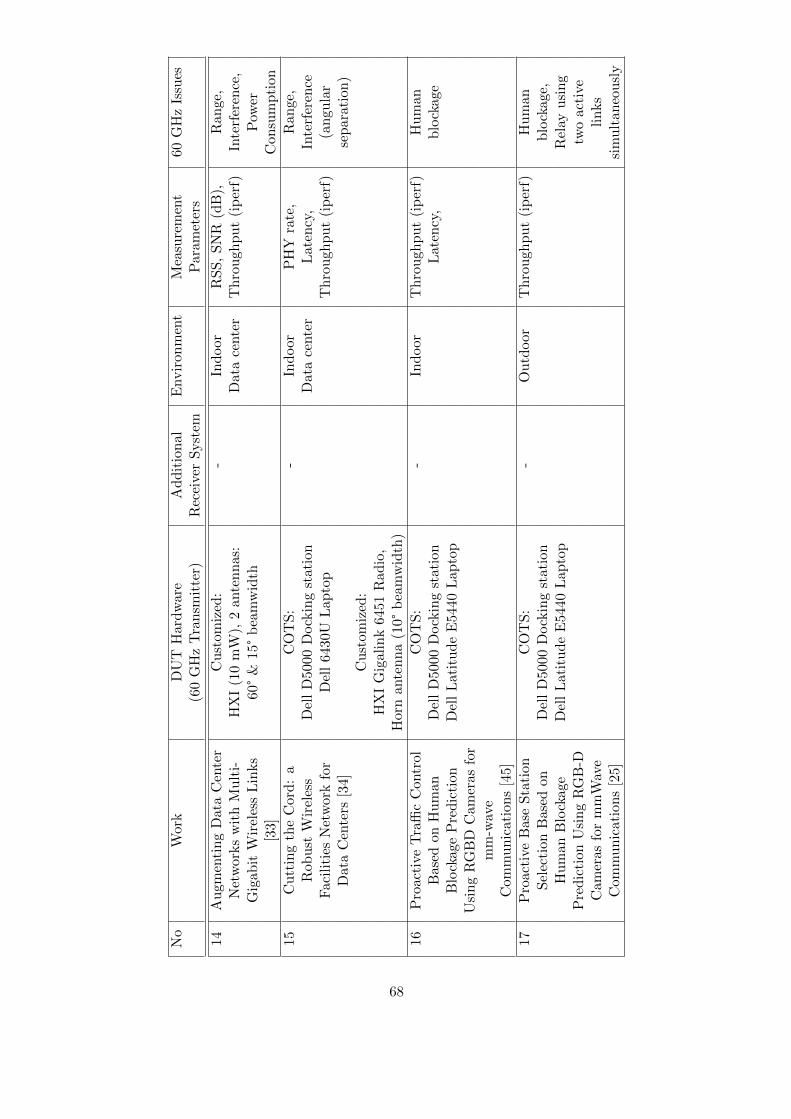
No
Wor
kD
UT
Har
dw
are
Ad
dit
ion
alE
nvir
on
men
tM
easu
rem
ent
60
GH
zIs
sues
(60
GH
zT
ran
smit
ter)
Rec
eive
rS
yst
emP
aram
eter
s
14
Au
gm
enti
ng
Dat
aC
ente
rC
ust
omiz
ed:
-In
door
RS
S,
SN
R(d
B),
Ran
ge,
Net
wor
ks
wit
hM
ult
i-H
XI
(10
mW
),2
ante
nn
as:
Data
cente
rT
hro
ugh
pu
t(i
per
f)In
terf
eren
ce,
Gig
ab
itW
irel
ess
Lin
ks
60°
&15
°b
eam
wid
thP
ower
[33]
Con
sum
pti
on
15
Cu
ttin
gth
eC
ord
:a
CO
TS
:-
Ind
oor
PH
Yra
te,
Ran
ge,
Rob
ust
Wir
eles
sD
ell
D50
00D
ock
ing
stat
ion
Data
cente
rL
ate
ncy
,In
terf
eren
ceF
acil
itie
sN
etw
ork
for
Del
l64
30U
Lap
top
Th
rou
gh
pu
t(i
per
f)(a
ngu
lar
Dat
aC
ente
rs[3
4]
sep
ara
tion
)C
ust
omiz
ed:
HX
IG
igal
ink
6451
Rad
io,
Hor
nante
nn
a(1
0°b
eam
wid
th)
16
Pro
act
ive
Tra
ffic
Contr
olC
OT
S:
-In
door
Th
rou
gh
pu
t(i
per
f)H
um
an
Base
don
Hu
man
Del
lD
5000
Dock
ing
stat
ion
Late
ncy
,b
lock
age
Blo
ckag
eP
red
icti
on
Del
lL
atit
ud
eE
5440
Lap
top
Usi
ng
RG
BD
Cam
eras
for
mm
-wav
eC
om
mu
nic
ati
ons
[45]
17
Pro
acti
veB
ase
Sta
tion
CO
TS
:-
Ou
tdoor
Th
rou
gh
pu
t(i
per
f)H
um
an
Sel
ecti
on
Bas
edon
Del
lD
5000
Dock
ing
stat
ion
blo
ckage,
Hu
man
Blo
ckage
Del
lL
atit
ud
eE
5440
Lap
top
Rel
ayu
sin
gP
red
icti
on
Usi
ng
RG
B-D
two
act
ive
Cam
eras
for
mm
Wav
eli
nks
Com
mu
nic
ati
ons
[25]
sim
ult
an
eou
sly
68
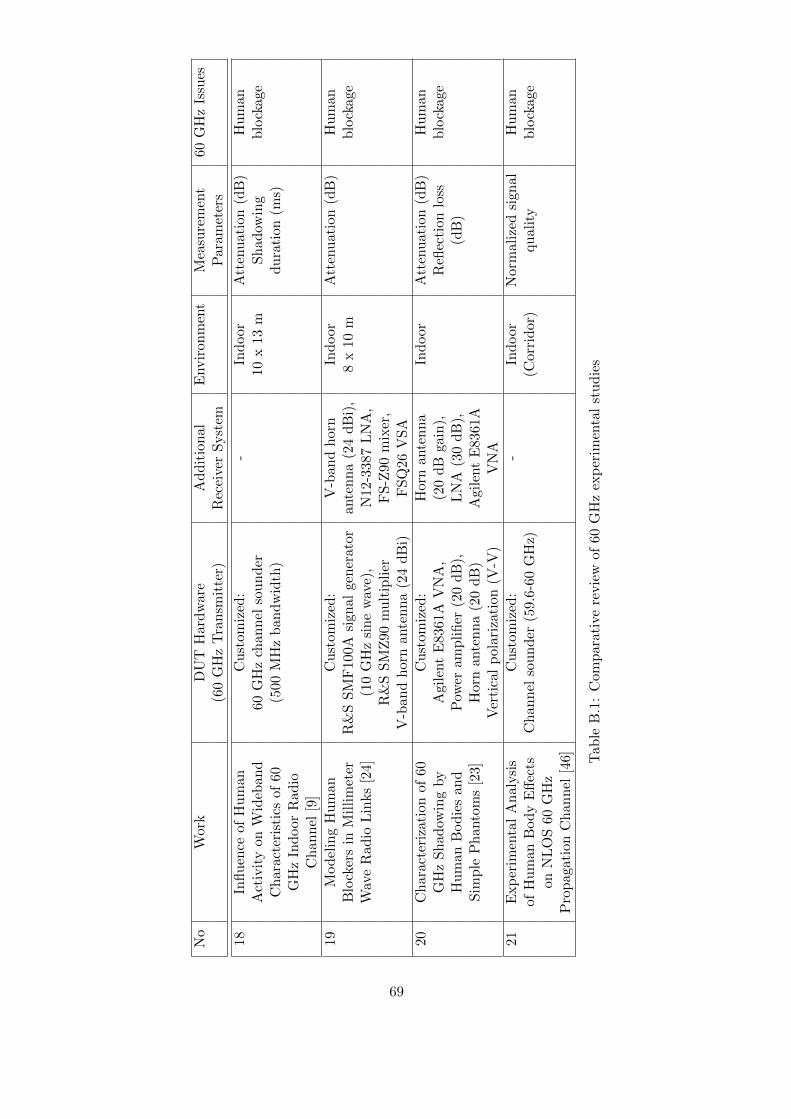
No
Work
DU
TH
ard
war
eA
dd
itio
nal
Envir
onm
ent
Mea
sure
men
t60
GH
zIs
sues
(60
GH
zT
ran
smit
ter)
Rec
eive
rS
yst
emP
aram
eter
s
18
Infl
uen
ceof
Hu
man
Cu
stom
ized
:-
Ind
oor
Att
enu
ati
on
(dB
)H
um
an
Act
ivit
yon
Wid
eban
d60
GH
zch
ann
elso
un
der
10x
13m
Sh
adow
ing
blo
ckage
Ch
ara
cter
isti
csof
60
(500
MH
zb
and
wid
th)
du
rati
on
(ms)
GH
zIn
door
Rad
ioC
han
nel
[9]
19
Mod
elin
gH
um
an
Cu
stom
ized
:V
-ban
dh
orn
Ind
oor
Att
enu
ati
on
(dB
)H
um
an
Blo
cker
sin
Mil
lim
eter
R&
SS
MF
100A
sign
alge
ner
ator
ante
nn
a(2
4d
Bi)
,8
x10
mb
lock
age
Wav
eR
ad
ioL
inks
[24]
(10
GH
zsi
ne
wav
e),
N12
-338
7L
NA
,R
&S
SM
Z90
mu
ltip
lier
FS
-Z90
mix
er,
V-b
and
hor
nan
ten
na
(24
dB
i)F
SQ
26V
SA
20
Ch
ara
cter
izati
onof
60C
ust
omiz
ed:
Hor
nan
ten
na
Ind
oor
Att
enu
ati
on
(dB
)H
um
an
GH
zS
had
owin
gby
Agi
lent
E83
61A
VN
A,
(20
dB
gain
),R
eflec
tion
loss
blo
ckage
Hu
man
Bod
ies
and
Pow
eram
pli
fier
(20
dB
),L
NA
(30
dB
),(d
B)
Sim
ple
Ph
anto
ms
[23]
Horn
ante
nn
a(2
0d
B)
Agi
lent
E83
61A
Ver
tica
lp
olar
izat
ion
(V-V
)V
NA
21
Exp
erim
enta
lA
nal
ysi
sC
ust
omiz
ed:
-In
door
Norm
aliz
edsi
gn
al
Hu
man
of
Hu
man
Bod
yE
ffec
tsC
han
nel
sou
nd
er(5
9.6-
60G
Hz)
(Corr
idor)
qu
ali
tyb
lock
age
on
NL
OS
60G
Hz
Pro
pag
atio
nC
han
nel
[46] T
able
B.1
:C
omp
arat
ive
revie
wof
60G
Hz
exp
erim
enta
lst
ud
ies
69