Embed Size (px)
Citation preview

33PCI Journal | November–December 2017
Many new accelerated construction methods have been investigated and implemented using precast concrete subassemblies. Rapid construction
methods can help reduce construction-induced delays and minimize the inconvenience to the public. Examples of their use on transportation structures include the connec-tions on parking structures, full-depth precast concrete bridge decks, precast concrete deck girders, and precast concrete box beams.
The most critical field construction process for precast con-crete subassemblies is completing the connections. Long-term performance problems, such as cracking and deterio-ration within the connection, have occurred on past precast concrete structural projects.1–3 These performance problems have been attributed to a variety of causes, including con-struction techniques, materials, and poor design. One area of concern is the process of completing connections with field-cast materials, such as grouts or concrete. Connections between prefabricated bridge components may exhibit poor performance due to the material selected or the construction practices implemented in the field.
The objective of this research was to evaluate a wide variety of different material categories for potential use in precast concrete connections on applications such as bridge superstructures. Comparisons were made of the materials based on the results of various material characterization, durability, and bond tests. The results were analyzed and used to predict the relative performance
■ This research investigated the performance of a va-riety of materials that may be used in precast con-crete field-cast connections, including high-strength cementitious grout, epoxy grout, magnesium phos-phate grout, ultra-high-performance concrete, cable grout, and conventional bridge deck concrete.
■ Performance categories investigated included me-chanical strength and shrinkage, bond strength, and durability.
■ Because a wide range of material performances are achievable, the critical parameters should be carefully considered when selecting connection systems.
Characterization of materials used in field-cast precast concrete connections
Matthew K. Swenty and Benjamin A. Graybeal
34 PCI Journal | November–December 2017
Testing outline
A program was developed to investigate a larger, more diverse list of field-cast materials that have the potential for use in modular bridge component connections. The categories of materials were selected based on the litera-ture review, previous experience, and recommendations from industry representatives. The program was designed to investigate representative samples of materials in six different categories, all of which are available as prebagged mixtures or standard concrete mixtures:
• ultra-high-performance concrete (UHPC) (materials U1 [normal set] and U2 [rapid set])
• standard-set magnesium phosphate grout (material M1)
• conventional prebagged cementitious grouts (materials G1, G2, and G3)
• epoxy grout (material E1)
• bridge deck concrete (material C1)
• post-tensioning cable grout (material T1)
Materials G1, G2, and G3 were chosen in the conventional cementitious grout category because this category has been investigated in previous studies and is commonly deployed in prefabricated bridge-element-type construction projects.
A series of tests was performed on each selected material under similar environmental conditions in a concrete labo-ratory. Three different categories of tests were executed:
• material: flow or slump, set time, compressive strength, split cylinder, modulus of elasticity, re-strained shrinkage, and unrestrained shrinkage
• bond: slant cylinder, split cylinder, and restrained shrinkage
• durability: freezing and thawing and rapid chloride penetrability, both of which were completed only on materials G1, E1, M1 and U2
The basic material characterization and durability tests were based on ASTM International standards. Nonstan-dardized tests based on previous testing experience and ASTM methods were used to measure the bond strength and early-age shrinkage of the materials. Testing began immediately after the materials were cast and continued for a minimum of two months. The measurements during the first 24 hours were used for accelerated construction com-parisons, while the longer-term measurements were used
of these materials when deployed in field-cast precast concrete connections.4,5
Literature review
Many designers specify prepackaged, low-shrinkage, high-early-strength grouts for precast concrete bridge con-nections.3,6 However, these grouts have not demonstrated consistent performance. When testing various connections in bridge decks, researchers have noted that, even under controlled laboratory conditions, shrinkage cracks and durability issues still arise.7,8
Gulyas et al. studied the use of a magnesium phosphate–based grout and a regular cementitious grout for use in shear keys on adjacent box beams in Alaska.2 The mate-rials were tested using standard ASTM tests and compo-nent tests. The standard tests worked well as a screening process, but more-representative testing methods were recommended. The magnesium phosphate–based grout was reported to perform well for adjacent box-beam bridges.
Research led by Issa furthered the research by Gulyas et al. by testing four different commercially available materials in component tests.1 The four materials includ-ed two magnesium phosphate–based grouts, a standard cementitious grout, and a polymer concrete. The focus was on performing shear, tension, and flexure tests on scaled shear keys typically used between adjacent box beams. The results indicated that the magnesium phosphate grouts did not bond well to the substrate concrete, in part because of carbonation effects, and had limited workability. The poly-mer concrete had the best results and highest compressive strength, while the standard grout performed well and was easier to use.
Other researchers have executed similar plans for testing materials used in precast concrete component connections. Ma et al. conducted further investigations into standard cementitious grouts, high-performance concretes, and magnesium phosphate grouts for use in component connec-tions.9 The research focused on finding materials that work well for one- and seven-day applications. A set of guide-lines was produced based on standard ASTM test methods for compressive strength, shrinkage, bond strength, chloride penetration, and resistance to freezing and thawing. Scholz et al. investigated three cementitious prebagged grouts and a magnesium phosphate grout, studying the bond strength and standard material properties.10 The grouts with the best bond strength and lowest shrinkage did not predict the best performance in simulated grout pockets. The grouts all performed differently, but magnesium phosphate tended to perform well. Based on these four grouts, a set of guidelines was produced that, when followed, should increase the likelihood of good performance.
35PCI Journal | November–December 2017
and final set were measured based on ASTM C403-08 Time of Setting of Concrete Mixtures by Penetration Resistance.13 Each material was used as the mortar in this ASTM method to determine how quickly it reached initial and final set. A deviation from the ASTM method was that only one sample was taken for each individual material due to the mixer volume limitation.
Following the final set of each material, basic mechani-cal properties, including the compressive strength, ten-sile strength, and modulus of elasticity, were measured over time. The compressive strength was measured using ASTM C39-09a Compressive Strength of Cylindrical Concrete Specimens14 for C1 and ASTM C109-02 Com-pressive Strength of Hydraulic Cement Mortars (Using 2-in. or [50-mm] Cube Specimens)15 for the other materials. The splitting tensile strength of the materials was captured using ASTM C496-04 Splitting Tensile Strength of Cylindrical Concrete Specimens16 for all materials except the UHPCs U1 and U2. By definition, materials with fiber matrices, such as U1 and U2, cannot be used in ASTM C496-04. ASTM C469-02 Static Modulus of Elasticity and Poisson’s Ratio of Concrete in Compression17 was used as a guide in finding the modulus of elasticity of each material. The specimens were each loaded twice, and the average strain values were used in the final computations. Standard 4 in. (100 mm) diameter by 8 in. (200 mm) nominal-length spec-imens were used throughout.
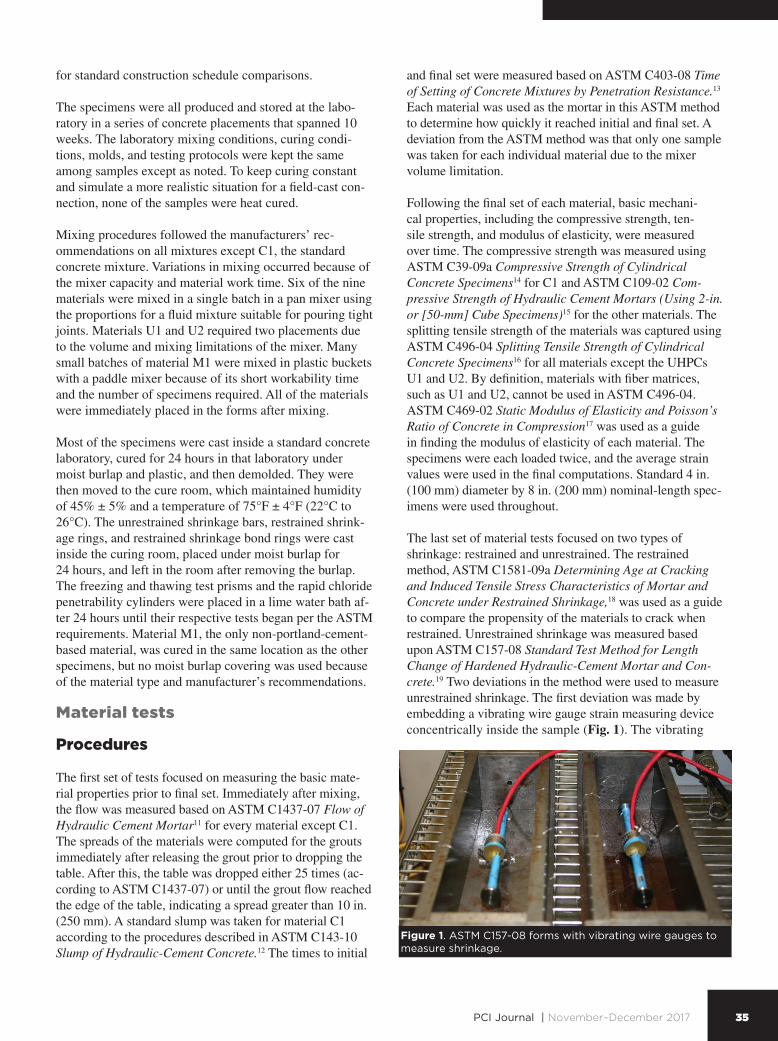
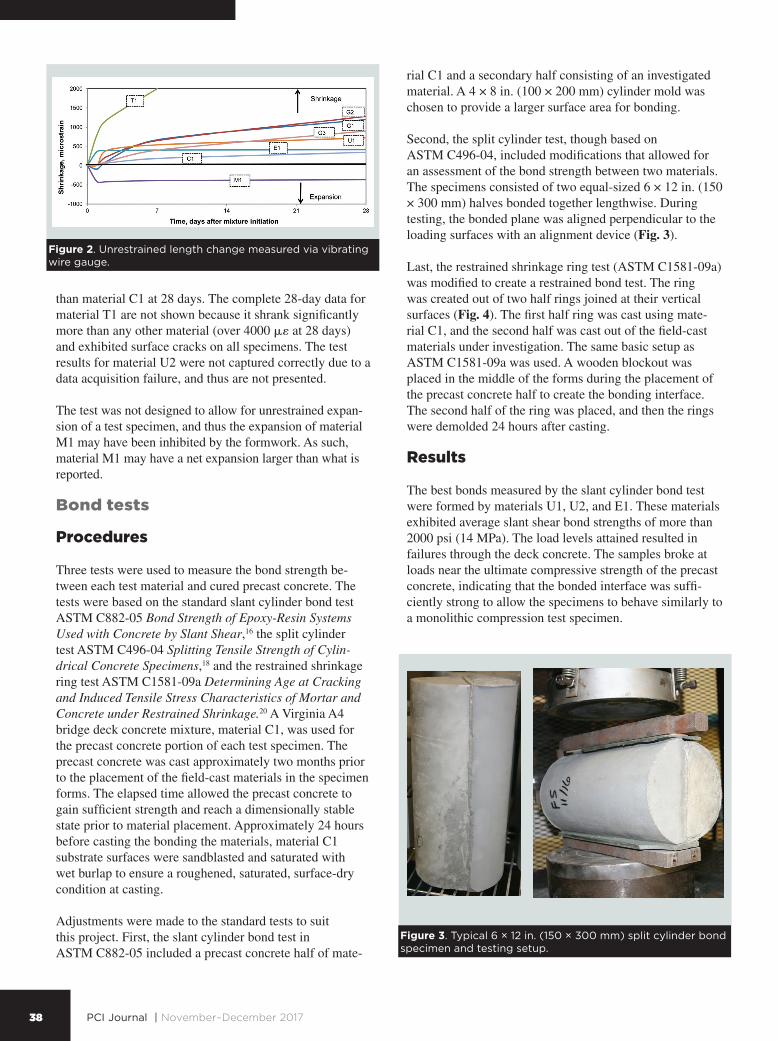
The last set of material tests focused on two types of shrinkage: restrained and unrestrained. The restrained method, ASTM C1581-09a Determining Age at Cracking and Induced Tensile Stress Characteristics of Mortar and Concrete under Restrained Shrinkage,18 was used as a guide to compare the propensity of the materials to crack when restrained. Unrestrained shrinkage was measured based upon ASTM C157-08 Standard Test Method for Length Change of Hardened Hydraulic-Cement Mortar and Con-crete.19 Two deviations in the method were used to measure unrestrained shrinkage. The first deviation was made by embedding a vibrating wire gauge strain measuring device concentrically inside the sample (Fig. 1). The vibrating
for standard construction schedule comparisons.
The specimens were all produced and stored at the labo-ratory in a series of concrete placements that spanned 10 weeks. The laboratory mixing conditions, curing condi-tions, molds, and testing protocols were kept the same among samples except as noted. To keep curing constant and simulate a more realistic situation for a field-cast con-nection, none of the samples were heat cured.
Mixing procedures followed the manufacturers’ rec-ommendations on all mixtures except C1, the standard concrete mixture. Variations in mixing occurred because of the mixer capacity and material work time. Six of the nine materials were mixed in a single batch in a pan mixer using the proportions for a fluid mixture suitable for pouring tight joints. Materials U1 and U2 required two placements due to the volume and mixing limitations of the mixer. Many small batches of material M1 were mixed in plastic buckets with a paddle mixer because of its short workability time and the number of specimens required. All of the materials were immediately placed in the forms after mixing.
Most of the specimens were cast inside a standard concrete laboratory, cured for 24 hours in that laboratory under moist burlap and plastic, and then demolded. They were then moved to the cure room, which maintained humidity of 45% ± 5% and a temperature of 75°F ± 4°F (22°C to 26°C). The unrestrained shrinkage bars, restrained shrink-age rings, and restrained shrinkage bond rings were cast inside the curing room, placed under moist burlap for 24 hours, and left in the room after removing the burlap. The freezing and thawing test prisms and the rapid chloride penetrability cylinders were placed in a lime water bath af-ter 24 hours until their respective tests began per the ASTM requirements. Material M1, the only non-portland-cement-based material, was cured in the same location as the other specimens, but no moist burlap covering was used because of the material type and manufacturer’s recommendations.
Material tests
Procedures
The first set of tests focused on measuring the basic mate-rial properties prior to final set. Immediately after mixing, the flow was measured based on ASTM C1437-07 Flow of Hydraulic Cement Mortar11 for every material except C1. The spreads of the materials were computed for the grouts immediately after releasing the grout prior to dropping the table. After this, the table was dropped either 25 times (ac-cording to ASTM C1437-07) or until the grout flow reached the edge of the table, indicating a spread greater than 10 in. (250 mm). A standard slump was taken for material C1 according to the procedures described in ASTM C143-10 Slump of Hydraulic-Cement Concrete.12 The times to initial
Figure 1. ASTM C157-08 forms with vibrating wire gauges to measure shrinkage.

36 PCI Journal | November–December 2017
confirming that some UHPC formulations exhibit a long dormant period prior to the full initiation of the curing reactions. Material U2 is specifically designed to set more quickly than material U1 with more rapid strength gain.
The unit weights varied from 106 lb/ft3 (1690 kg/m3) for material T1 to 159 lb/ft3 (2550 kg/m3) for material U1 (Ta-ble 1). The largest values were the UHPC mixtures, materi-als U1 and U2, due to the internal steel fiber reinforcement. Materials C1 and G2 expressed a unit weight in the range commonly observed for conventional concrete. Materials M1 and E1 were slightly less than a typical concrete unit weight, but not as light as a typical lightweight material. Materials G1, G3, and T1 had unit weights similar to light-weight concretes.
The mechanical properties were measured after final set once the materials reached usable strengths. For all materials, this occurred within 7 days, and for many it was within 24 hours. Table 2 presents the compressive strength results. All of the materials tested had compres-sive strengths of at least 4 ksi (27.6 MPa) within 7 days. Material C1 had the lowest 7-day strength of 4.0 ksi (28 MPa), a usable strength for many projects. Materials E1, U2, and U1 exhibited superior compressive strengths of more than 14 ksi (97 MPa) by 7 days. Materials M1, E1, and U2 had compressive strengths greater than 8 ksi (55 MPa) within 24 hours of mixing initiation and may be well suited for accelerated applications. Conventional grout materials G1, G2, and G3 reached at least 3 ksi (21 MPa) compressive strength at 24 hours but gained more strength by 7 days.
The ASTM C496 splitting tensile strength results fol-lowed a pattern similar to the compressive strength results (Table 2). Material E1 had the highest tensile strength at 1 and 28 days. The 1-day tensile strength of material E1
wire gauge method captured the internal unrestrained length change immediately after casting, thus recording the behavior during the first 24 hours, which is not report-ed in the standard ASTM C157-08 test method. A form release agent was applied immediately prior to casting the specimens to ensure that little friction developed between the material and steel form. Second, to more closely simulate field conditions, the samples were cured with all other specimens as described in the testing outline section instead of a lime bath.
Results
The first category of material test results focused on the time prior to final set. All of the materials were work-able and could be used in the field casting of connections between precast concrete components. Materials T1 and U2 were extremely fluid and flowed to the edge of the table without any table drops. Materials G1, G2, and G3 were fluid and had full spreads using fewer than 25 table drops (Table 1). Materials M1, E1, and U1 had spreads between 6.6 and 7.1 in. (170 and 180 mm) without dropping the table. When the table was dropped 25 times, the spread increased by approximately 1.0 in. (25 mm) for each mate-rial. Material C1 had coarse aggregate, so a spread mea-surement was not performed. Over the course of using this mixture, it was workable with an average slump of 5.3 in. (135 mm).
The set times demonstrated that all materials reached final set within 10.5 hours except material U1 (Table 1). Material M1 set times were too fast to take more than two data points, meaning that the initial and final set times were nearly identical. These data indicate that material M1 sets within minutes and provides little work time between the end of mixing and initial set. The slowest time to initial set was material U1. It took 17 hours to reach final set,
Table 1. Material properties prior to final set
MaterialInitial spread
(no table drops), in.
Final spread Set time, hrUnit weight, lb/ft3
Table drops Spread, in. Initial Final
G1 4.8 17 10.0 5.3 6.8 119
G2 4.0 9 10.0 8.9 10.4 143
G3 4.0 24 10.0 n.d. n.d. 111
M1 6.6 25 7.6 0.1 0.1 126
E1 6.8 25 7.2 2.0 2.3 134
T1 10.0 n/a* n/a* n.d. n.d. 106
U1 7.1 25 8.5 8.3 17.0 159
U2 10.0 n/a* n/a* 3.8 6.0 154
C1 n/a† n/a† n/a† 3.8 6.0 150
Note: n/a = not applicable; n.d. = no data. 1 in. = 25.4 mm; 1 lb/ft3 = 16.03 kg/m3.
* Materials T1 and U2 spread 10 in. without any table drops.
† Slump testing was performed on the concrete material C1.

37PCI Journal | November–December 2017
The last set of material results was from the restrained and unrestrained shrinkage tests. The restrained shrinkage test provided an indication of the shrinkage rate and tensile strength of the materials. For most materials, there was a distinct gain in strain within the steel form followed by a rapid reduction in strain, indicating that cracking had occurred. The cracking of the ring was confirmed visually on each specimen (Table 3). Materials G1, G2, G3, and T1 cracked within three days, while material C1 cracked about three weeks after casting. The best-performing materials, M1 and E1, did not crack during testing either visually or as indicated with the strain gauges. Both materials were monitored for about four months without any indication of cracking.
Under restrained shrinkage, materials U1 and U2 behaved differently from the other materials. They both exhibited numerous small cracks that were hard to detect visually and with the strain readings. The strain readings on the steel ring did not exhibit large jumps at any point during testing. The steel fiber matrix arrested the cracks, kept the cracks small, and prevented large strain losses in the ring, unlike the other materials, which instantaneously lost strain upon cracking.
Figure 2 shows the results from the modified ASTM C157-08 shrinkage bars with the vibrating wire gauges (unrestrained shrinkage). The shrinkage was recorded beginning at casting, at which point all materi-als were still workable. Materials M1, C1, and E1 proved the most dimensionally stable of all materials. After one day, material M1 had expanded about 400 με and E1 had shrunk about 400 με. These values did not change sig-nificantly after the initial 24 hours. Material C1 was slow to shrink and had a similar 28-day value to material E1. Material U1 shrank about twice as much as material C1, while materials G1 and G2 shrank about three times more
was more than three times stronger than the next highest material G2. The other grouts exhibited 24-hour tensile strengths within a relatively tight range: 330 to 435 psi (2.3 to 3.00 MPa) at 24 hours and 475 to 665 psi (3.28 to 4.59 MPa) at 28 days. This ASTM test method is not appro-priate without modification for fiber-reinforced concretes, and thus results for materials U1 and U2 are not reported.
The measured modulus of elasticity values (Table 2) demonstrate three clear patterns. Materials U1 and U2 exhibit a substantially higher modulus of elasticity, commensurate with their high compressive strengths. Materials M1, E1, and C1 express stiffness values similar to that normally expected from conventional concrete. The conventional grout materials and material T1, which con-tain no coarse aggregate, exhibit reduced modulus values commensurate with a level of stiffness that is expected from mortars.
Table 2. Material properties after final set
MaterialCompressive strength, ksi Splitting tensile strength, psi Modulus of elasticity, ksi
24 hours 7 days 28 days 24 hours 28 days 28 days
G1 3.45 6.22 6.70 385 525 2300
G2 5.07 7.90 8.94 435 665 3100
G3 3.91 7.16 7.53 n.d. n.d. n.d.
M1 8.40 8.10 9.91 330 650 4770
E1 10.1 14.1 14.4 1940 2130 3390
T1 n.d.* 5.25 8.47 350 475 730
U1 n.d.* 15.7 18.3 n/a† n/a† 7550
U2 10.0 n.d. 21.8 n/a† n/a† 7370
C1 1.51 4.04 5.87 210 570 3940
Note: n/a = not applicable; n.d. = no data. 1 psi = 6.895 kPa; 1 ksi = 6.895 MPa.
* Material had not set.
† Test not applicable to fiber-reinforced concretes.
Table 3. Shrinkage ring results
MaterialAge at first cracking
(visual), daysAge at first cracking (strain gauge), days
G1 2.9 2.9
G2 2.8 2.5
G3 7.1 3.6
M1 n/a* n/a*
E1 n/a† n/a†
T1 0.9 0.9
U1 71.4 16.4
U2 48.0 6.3
C1 23.6 23.1
Note: n/a = not applicable.
* No cracks, test stopped at 121.5 days.
† No cracks, test stopped at 114.6 days.
38 PCI Journal | November–December 2017
rial C1 and a secondary half consisting of an investigated material. A 4 × 8 in. (100 × 200 mm) cylinder mold was chosen to provide a larger surface area for bonding.
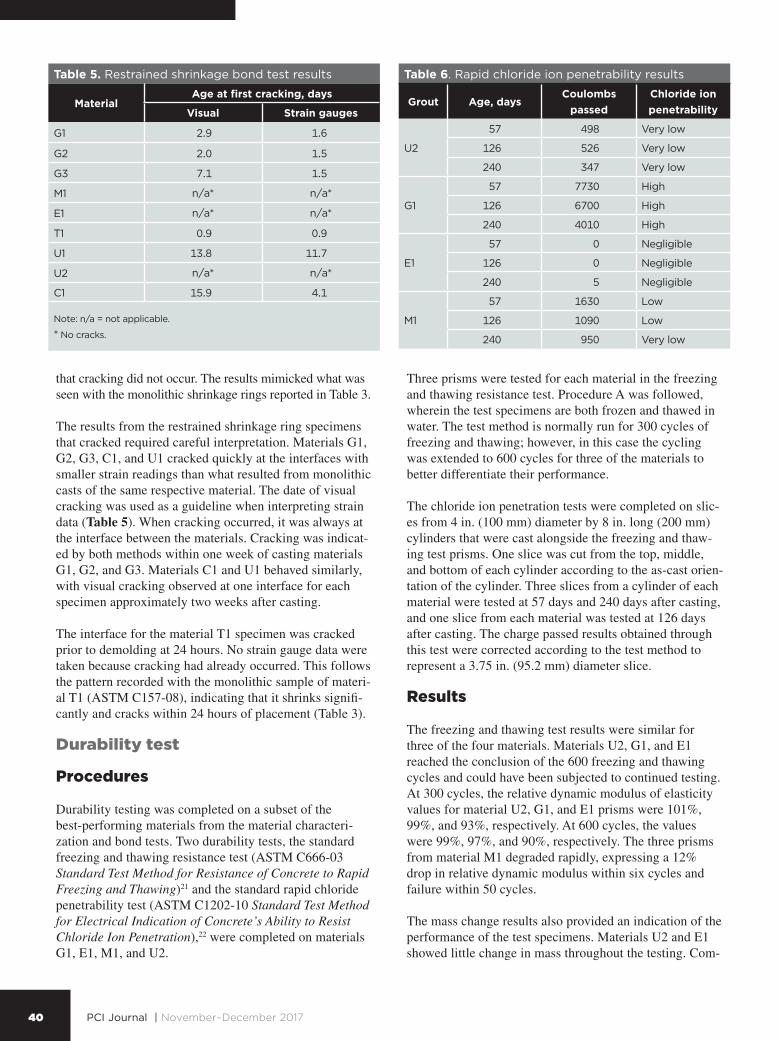
Second, the split cylinder test, though based on ASTM C496-04, included modifications that allowed for an assessment of the bond strength between two materials. The specimens consisted of two equal-sized 6 × 12 in. (150 × 300 mm) halves bonded together lengthwise. During testing, the bonded plane was aligned perpendicular to the loading surfaces with an alignment device (Fig. 3).
Last, the restrained shrinkage ring test (ASTM C1581-09a) was modified to create a restrained bond test. The ring was created out of two half rings joined at their vertical surfaces (Fig. 4). The first half ring was cast using mate-rial C1, and the second half was cast out of the field-cast materials under investigation. The same basic setup as ASTM C1581-09a was used. A wooden blockout was placed in the middle of the forms during the placement of the precast concrete half to create the bonding interface. The second half of the ring was placed, and then the rings were demolded 24 hours after casting.
Results
The best bonds measured by the slant cylinder bond test were formed by materials U1, U2, and E1. These materials exhibited average slant shear bond strengths of more than 2000 psi (14 MPa). The load levels attained resulted in failures through the deck concrete. The samples broke at loads near the ultimate compressive strength of the precast concrete, indicating that the bonded interface was suffi-ciently strong to allow the specimens to behave similarly to a monolithic compression test specimen.
than material C1 at 28 days. The complete 28-day data for material T1 are not shown because it shrank significantly more than any other material (over 4000 με at 28 days) and exhibited surface cracks on all specimens. The test results for material U2 were not captured correctly due to a data acquisition failure, and thus are not presented.
The test was not designed to allow for unrestrained expan-sion of a test specimen, and thus the expansion of material M1 may have been inhibited by the formwork. As such, material M1 may have a net expansion larger than what is reported.
Bond tests
Procedures
Three tests were used to measure the bond strength be-tween each test material and cured precast concrete. The tests were based on the standard slant cylinder bond test ASTM C882-05 Bond Strength of Epoxy-Resin Systems Used with Concrete by Slant Shear,16 the split cylinder test ASTM C496-04 Splitting Tensile Strength of Cylin-drical Concrete Specimens,18 and the restrained shrinkage ring test ASTM C1581-09a Determining Age at Cracking and Induced Tensile Stress Characteristics of Mortar and Concrete under Restrained Shrinkage.20 A Virginia A4 bridge deck concrete mixture, material C1, was used for the precast concrete portion of each test specimen. The precast concrete was cast approximately two months prior to the placement of the field-cast materials in the specimen forms. The elapsed time allowed the precast concrete to gain sufficient strength and reach a dimensionally stable state prior to material placement. Approximately 24 hours before casting the bonding the materials, material C1 substrate surfaces were sandblasted and saturated with wet burlap to ensure a roughened, saturated, surface-dry condition at casting.
Adjustments were made to the standard tests to suit this project. First, the slant cylinder bond test in ASTM C882-05 included a precast concrete half of mate-
Figure 3. Typical 6 × 12 in. (150 × 300 mm) split cylinder bond specimen and testing setup.
Figure 2. Unrestrained length change measured via vibrating wire gauge.

39PCI Journal | November–December 2017
grout materials did not fail; rather, the inherent tensile strength of the precast concrete proved to be the limiting factor.
Prior to testing, much like the slant cylinder bond test specimens, visible cracking appeared on the splitting cylinder bond test materials G1, G2, T1, and M1. These four materials had average 28-day split cylinder bond strengths between 260 and 368 psi (1.8 and 2.54 MPa). The deck concrete, material C1, did not have interface cracks at the bonded surface prior to testing; however, the split cylinder bond strength was 248 psi (1.71 MPa). This was the lowest value of any bonded material. These specimens all broke at the bonded interface between the two materials (Table 4).
No cracking was observed for materials M1, E1, and U2 throughout the duration of the last bond test, the restrained ring bond test. The strain on the steel form plotted over time for these materials showed consistent patterns confirming
Prior to the execution of the slant cylinder bond tests, materials G1, G2, T1, and C1 exhibited visible cracking at the bonded surface between the two materials. These four materials along with material G3 had average slant cylinder bond strengths between 200 and 920 psi (1.4 and 6.3 MPa) (Table 4). Material M1 had the lowest slant cylinder bond strength at 50 psi (0.3 MPa); however, this may be attribut-ed to its short work time of less than 10 minutes (Table 1). During casting, this material may have begun to set prior to stable contact with the precast concrete surface.
The highest bonded values as measured by the split cylinder bond test came from materials U1, U2, and E1. The UHPC samples (materials U1 and U2), exhibited average splitting tensile bond strengths greater than 600 psi (4.1 MPa), while E1 was 483 psi (3.33 MPa). These values were close to 570 psi (3.9 MPa), the splitting ten-sile result of the monolithic material C1 sample (Table 2). The failure surface in these materials was in the precast concrete paste next to the bonded surface. These field-cast
Figure 4. Ring setup for the placement of the second material and a final restrained bond ring specimen.
Table 4. Average interface bond stress test results at 28 days
Material
Slant cylinder bond test Split cylinder bond test
Average failure bond stress, psi
Failure surfaceAverage failure bond
stress, psiFailure surface
G1 200 Along interface (precracked) 260 Along interface (precracked)
G2 520 Along interface (precracked) 368 Along interface (precracked)
G3* 240 n.d.† 300 Along interface (precracked)
M1 50 Along interface 362 Along interface (precracked)
E1 3530 Through concrete 483 Precast concrete paste
T1 920 Along interface (precracked) 277 Along interface (precracked)
U1 2700 Through concrete 664 Precast concrete paste
U2 2200 n.d.† 619 Precast concrete paste
C1 680 Along interface (precracked) 248 Along interface
Note: n.d. = no data. 1 psi = 6.895 kPa. * Average calculated from two specimens; third broke along the bonded surface prior to testing. † Result not appropriately documented.
40 PCI Journal | November–December 2017
Three prisms were tested for each material in the freezing and thawing resistance test. Procedure A was followed, wherein the test specimens are both frozen and thawed in water. The test method is normally run for 300 cycles of freezing and thawing; however, in this case the cycling was extended to 600 cycles for three of the materials to better differentiate their performance.
The chloride ion penetration tests were completed on slic-es from 4 in. (100 mm) diameter by 8 in. long (200 mm) cylinders that were cast alongside the freezing and thaw-ing test prisms. One slice was cut from the top, middle, and bottom of each cylinder according to the as-cast orien-tation of the cylinder. Three slices from a cylinder of each material were tested at 57 days and 240 days after casting, and one slice from each material was tested at 126 days after casting. The charge passed results obtained through this test were corrected according to the test method to represent a 3.75 in. (95.2 mm) diameter slice.
Results
The freezing and thawing test results were similar for three of the four materials. Materials U2, G1, and E1 reached the conclusion of the 600 freezing and thawing cycles and could have been subjected to continued testing. At 300 cycles, the relative dynamic modulus of elasticity values for material U2, G1, and E1 prisms were 101%, 99%, and 93%, respectively. At 600 cycles, the values were 99%, 97%, and 90%, respectively. The three prisms from material M1 degraded rapidly, expressing a 12% drop in relative dynamic modulus within six cycles and failure within 50 cycles.
The mass change results also provided an indication of the performance of the test specimens. Materials U2 and E1 showed little change in mass throughout the testing. Com-
that cracking did not occur. The results mimicked what was seen with the monolithic shrinkage rings reported in Table 3.
The results from the restrained shrinkage ring specimens that cracked required careful interpretation. Materials G1, G2, G3, C1, and U1 cracked quickly at the interfaces with smaller strain readings than what resulted from monolithic casts of the same respective material. The date of visual cracking was used as a guideline when interpreting strain data (Table 5). When cracking occurred, it was always at the interface between the materials. Cracking was indicat-ed by both methods within one week of casting materials G1, G2, and G3. Materials C1 and U1 behaved similarly, with visual cracking observed at one interface for each specimen approximately two weeks after casting.
The interface for the material T1 specimen was cracked prior to demolding at 24 hours. No strain gauge data were taken because cracking had already occurred. This follows the pattern recorded with the monolithic sample of materi-al T1 (ASTM C157-08), indicating that it shrinks signifi-cantly and cracks within 24 hours of placement (Table 3).
Durability test
Procedures
Durability testing was completed on a subset of the best-performing materials from the material characteri-zation and bond tests. Two durability tests, the standard freezing and thawing resistance test (ASTM C666-03 Standard Test Method for Resistance of Concrete to Rapid Freezing and Thawing)21 and the standard rapid chloride penetrability test (ASTM C1202-10 Standard Test Method for Electrical Indication of Concrete’s Ability to Resist Chloride Ion Penetration),22 were completed on materials G1, E1, M1, and U2.
Table 5. Restrained shrinkage bond test results
MaterialAge at first cracking, days
Visual Strain gauges
G1 2.9 1.6
G2 2.0 1.5
G3 7.1 1.5
M1 n/a* n/a*
E1 n/a* n/a*
T1 0.9 0.9
U1 13.8 11.7
U2 n/a* n/a*
C1 15.9 4.1
Note: n/a = not applicable.
* No cracks.
Table 6. Rapid chloride ion penetrability results
Grout Age, daysCoulombs
passedChloride ion penetrability
U2
57 498 Very low
126 526 Very low
240 347 Very low
G1
57 7730 High
126 6700 High
240 4010 High
E1
57 0 Negligible
126 0 Negligible
240 5 Negligible
M1
57 1630 Low
126 1090 Low
240 950 Very low

41PCI Journal | November–December 2017
When making the slant cylinder (ASTM C882-05) or split cylinder bond tests (based on ASTM C496-04), the precast concrete sides of the specimens had to be care-fully fitted into the formwork. If care was not taken, the fluid materials could seep around the bonded surface and adhere to the side of the precast concrete specimen. The challenges involved with the execution of these bond tests raised questions about the practicality and robustness of these test methods for assessing interface bond. Recent research focused on bond performance captured through ASTM C1583 appears compelling and might afford a cleaner means of assessing performance for a wider variety of materials and interface surface preparations.24
Conclusion
The test program focused on characterizing basic me-chanical, bond, and durability properties for six categories of field-cast materials that could be used in connecting precast concrete components. Nine typical sample materials were tested. (The authors acknowledge that other similar materials are available within each respective category.) The results demonstrate that the material characteristics and practical construction considerations can vary widely, even within a category. These results must be carefully considered when selecting the appropriate grout to use in a construction project.4,5
The following conclusions may be drawn when comparing the results of all phases of the test program:
• For accelerated construction projects requiring high compressive strength within one day, material E1, an epoxy-based grout, and material U2, a UHPC, displayed excellent properties. They had rapid strength gain, were dimensionally stable materials, had good workability, and had high tensile strength. The materi-als also developed strong bonds with the precast con-crete, and they exhibited good durability. In addition, material U2 displayed a high modulus of elasticity and contained an internal fiber reinforcement that can control cracking if it occurs.
• A common alternative for accelerated construction and for other projects requiring exceptionally rapid strength gain is material M1, a magnesium ammonium phosphate–based grout. The greatest concerns with this material are its limited working time and its durability. The limited work time created problems when trying to quickly cast the material and bond to the substrate. The bond strengths were the lowest of the materials tested. In addition, the material’s resistance to freezing and thawing was poor compared with the other materials.
• For construction that allows a longer cure time, mate-rial U1, an unaccelerated UHPC mixture, is a viable
bined with the visual observations for these specimens, this result is indicative of the fact that the specimens nei-ther lost significant mass from the exterior of the specimen nor gained significant mass by absorbing water. Material G1 specimens showed an initial slight increase in mass, followed by a continual slight decrease in mass throughout testing. Material M1 specimens exhibited a rapid increase in mass until the tests on these prisms were stopped at 50 cycles.
The rapid chloride penetration tests resulted in clear patterns for the four materials tested (Table 6). The values for the top, middle, and bottom were averaged for the three samples of each material. Material U2 passed a low charge at all ages throughout this test, material M1 passed a low charge throughout most of this test, and material G1 passed a high charge throughout the test. Material E1 has a nonconductive, epoxy-based matrix and thus conducted a negligible charge throughout the duration of the test.
Assessment methodology considerations
The test methods engaged in this study were chosen or developed to assess the performance measures of interest for materials that may be used in precast concrete connections. Although the obtained results are valid, further advancement in testing methodology may be advantageous. The dimen-sional stability tests and the bond tests deserve discussion.
The dimensional stability test based on unrestrained shrinkage (the modified ASTM C157-08) provided a con-tinuous set of results starting at casting. This proved useful because many of the materials are applicable for accelerat-ed construction and experience large dimensional changes within the first 24 hours. However, using a vibrating wire gauge within the form increased the expense, required an additional specialized data acquisition system, and proved tedious to set up concentrically within the formwork. In addition, the specimen setup may have had frictional resistance between the formwork and material even though the formwork was heavily oiled prior to casting. Other test methods, such as a modified version of ASTM C157 with sealed and unsealed conditions combined with ASTM C1698, provide other avenues toward capturing the needed dimensional stability information.23
The bond tests were based on casting the materials next to a precast concrete component. The precast concrete com-ponents were all cast and sandblasted separately. While careful quality control was maintained, small variations in surface condition existed among the precast concrete surfaces. Preparation of the precast concrete material must be done carefully, especially when making precast concrete components with small surface areas, such as in the re-strained shrinkage bond test (based on ASTM C1581-09a).

42 PCI Journal | November–December 2017
Throughout this research effort, the performance of a variety of field-cast grout-type materials has been investigated through the conduct of various material characterization tests. Figure 5 presents a graphical summary of the results of this research effort. The results for each parameter denoted on the left are plotted on the adjacent linear scale. This graphic allows for visual interpretation of the overall results of the research program, thus providing for a simplified grasp of the performance of each material.
Acknowledgments
The research project discussed herein could not have been completed were it not for the dedicated support of the federal and contract staff associated with the Federal Highway Administration (FHWA) Structural Concrete Research Program. Special recognition goes to Brenton Stone, who assisted the authors with various aspects of the research. Additional engineering assistance was provided by Gary Greene and Jussara Tanesi. Technical assistance with the casting, preparation, and testing of specimens was provided by Bradford Tschetter, Daniel Balcha, Tim Tuggle, Brian Story, Kevin Deasy, and Paul Ryberg.
The publication of this paper does not necessarily indicate approval or endorsement of the findings, opinions, conclusions, or recommendations either inferred or specifically expressed herein by the FHWA or the U.S. government.
choice. This material has high compressive strength and a high tensile strength. The bond strengths were high in the slant cylinder bond and split cylinder bond tests. Total shrinkage is less than observed with the conventional grouts, and the internal fiber reinforce-ment can control cracking if it occurs.
• The standard bridge deck concrete, material C1, per-formed as well as the standard grouts in most cases. The conventional grouts shrank more, had only modestly higher compressive strengths and bond strengths, and cracked earlier in the bond tests. The downside of materi-al C1 is that its coarse aggregate could eliminate its use in tight connection spaces between prefabricated elements.
• Material T1, the cable grout, was not well suited for this application. The material exhibited large shrinkage rates when tested, had low bond strengths in every test, and exhibited large cracks in the samples during the curing stage.
Practical applications
Owners, specifiers, and designers wishing to use field-cast grouts for precast concrete connections should carefully consider the performance measures that are of greatest interest before, during, and after deployment. Many classes of grout-type materials are available, with each offering different performance levels relative to different metrics. In all cases, it is important to ensure that the connection design is constructible, durable, and economical over the life of the constructed facility.
Figure 5. Graphical representation of the performance of the tested materials. Note: 1 in. = 25.4 mm; 1 ft = 0.305 m; 1 yd = 0.914 m; 1 lb = 4.448 N; 1 psi = 6.895 kPa; 1 ksi = 6.895 MPa.

43PCI Journal | November–December 2017
12. ASTM Subcommittee C09.60. 2010. Standard Test Method for Slump of Hydraulic-Cement Concrete. ASTM C143-10. West Conshohocken, PA: ASTM International.
13. ASTM Subcommittee C09.23. 2008. Standard Test Method for Time of Setting of Concrete Mixtures by Penetration Resistance. ASTM C403-08. West Conshohocken, PA: ASTM International.
14. ASTM Subcommittee C09.61. 2009. Standard Test Method for Compressive Strength of Cylindrical Concrete Specimens. ASTM C39-09a. West Conshohocken, PA: ASTM International.
15. ASTM Subcommittee C01.27. 2002. Standard Test Method for Compressive Strength of Hydraulic Cement Mortars (Using 2-in. or [50-mm] Cube Specimens). ASTM C109-02. West Conshohocken, PA: ASTM International.
16. ASTM Subcommittee C09.61. 2004. Standard Test Method for Splitting Tensile Strength of Cylindrical Concrete Specimens. ASTM C496-04. West Conshohocken, PA: ASTM International.
17. ASTM Subcommittee C09.61. 2002. Standard Test Method for Static Modulus of Elasticity and Poisson’s Ratio of Concrete in Compression. ASTM C469-02. West Conshohocken, PA: ASTM International.
18. ASTM Subcommittee C09.68. 2009. Standard Test Method for Determining Age at Cracking and Induced Tensile Stress Characteristics of Mortar and Concrete under Restrained Shrinkage. ASTM C1581-09a. West Conshohocken, PA: ASTM International.
19. ASTM Subcommittee C09.68. 2008. Standard Test Method for Length Change of Hardened Hydraulic-Cement Mortar and Concrete. ASTM C157-08. West Conshohocken, PA: ASTM International.
20. ASTM Subcommittee C09.25. 2005. Standard Test Method for Bond Strength of Epoxy-Resin Systems Used With Concrete By Slant Shear. ASTM C882-05. West Conshohocken, PA: ASTM International.
21. ASTM Subcommittee C09.67. 2008. Standard Test Method for Resistance of Concrete to Rapid Freezing and Thawing. ASTM C666-08. West Conshohocken, PA: ASTM International.
22. ASTM Subcommittee C09.66. 2010. Standard Test Method for Electrical Indication of Concrete’s Ability to Resist Chloride Ion Penetration. ASTM C1202-10. West Conshohocken, PA: ASTM International.
References
1. Issa, M. A., M. A. Issa, S. Y. Khayyat, A. A. Yousif, and I. I. Kaspar. 1995. “Field Performance of Full Depth Precast Concrete Panels in Bridge Deck Reconstruction.” PCI Journal 40 (3): 82–94.
2. Gulyas, R. J., G. J. Wirthlin, and J. T. Champa. 1995. “Evaluation of Keyway Grout Test Methods for Precast Concrete Bridges.” PCI Journal 40 (1): 44–57.
3. Biswas, M. 1986. “Precast Bridge Deck Design Systems.” PCI Journal 31 (2): 40–94.
4. Graybeal, B. A. 2013. “Material Characterization of Field-Cast Connection Grouts.” TechBrief FHWA-HRT-13-042. McLean, VA: FHWA (Federal Highway Administration).
5. Swenty, M. K., and B. A. Graybeal. 2013. “Material Characterization of Field-Cast Connection Grouts.” FHWA-HRT-13-041, NTIS PB2013-130231. McLean, VA: FHWA.
6. Culmo, M. P. 2009. “Connection Details for Prefabricated Bridge Elements and Systems.” FHWA-IF-09-010. McLean, VA: FHWA.
7. Markowski, S. M. 2005. “Experimental and Analytical Study of Full-Depth Precast/Prestressed Concrete Deck Panels for Highway Bridges.” Master’s thesis, University of Wisconsin–Madison.
8. Swenty, M. K. 2009. “The Investigation of Transverse Joints and Grouts on Full Depth Concrete Bridge Deck Panels.” PhD diss., Virginia Polytechnic Institute and State University.
9. Ma, J. Z. “Durability Performance Criteria of Closure Pour Materials for CIP Connections.” In The Third International fib Congress and Exhibition Incorporating the PCI Annual Convention and Bridge Conference: Proceedings Disc, Washington, D.C., May 29–June 2, 2010. Chicago, IL: PCI. CD-ROM.
10. Scholz, D. P., J. A. Wallenfelsz, C. Ligeron, and C. L. Roberts-Wollmann. 2007. “Recommendations for the Connection Between Full-Depth Precast Bridge Deck Panel Systems and Precast I-Beams.” FHWA/VTRC 07-CR17. Charlottesville, VA: Virginia Transportation Research Council.
11. ASTM Subcommittee C01.22. 2007. Standard Test Method for Flow of Hydraulic Cement Mortar. ASTM C1437-07. West Conshohocken, PA: ASTM International.

44 PCI Journal | November–December 2017
Content on the Bond Performance Between a Concrete Substrate and a Non-Shrink Cement Based Grout.” Paper presented at the National Accelerated Bridge Construction Conference, Miami, FL.
23. De la Varga, I., and B. A. Graybeal. 2014. “Dimen-sional Stability of Grout-Type Materials Used as Con-nections between Prefabricated Concrete Elements.” Journal of Materials in Civil Engineering 27 (9): 04014246.
24. De la Varga, I., J. F. Munoz, D. P. Bentz, and B. A. Graybeal. 2015. “Effect of the Interface Moisture
About the authors
Matthew Swenty, PhD, PE, is an associate professor in the Department of Civil and Environmental Engineering at the Virginia Military Institute in Lexington, Va.
Benjamin A. Graybeal, PhD, PE, leads the Bridge Engineering Research Team at the FHWA Turner-Fairbank Highway Research Center in McLean, Va.
Abstract
In precast concrete construction, completing the connections is one of the most critical field construc-tion processes. Short-term construction-related issues along with long-term performance problems have been attributed to the field-cast materials used in the connec-tions. This research investigated the performance of a variety of materials that may be used in precast con-crete field-cast connections. The categories included high-strength cementitious grout, epoxy grout, magne-sium phosphate grout, ultra-high-performance concrete (UHPC), cable grout, and conventional bridge deck concrete. Performance categories investigated included
mechanical strength and shrinkage, bond strength, and durability. Standard ASTM tests, along with newly developed bond and shrinkage tests, were applied.
The UHPC and epoxy grout samples showed good performance for accelerated construction projects. The high-strength cementitious grouts exhibited perfor-mance similar to a standard concrete mixture in most categories. Because a wide range of material perfor-mances are achievable, the critical parameters should be carefully considered when selecting connection systems.
Keywords
Accelerated construction, bridge, cable grout, connec-tion, epoxy grout, field casting, grout, high-strength ce-mentitious grout, magnesium phosphate grout, UHPC, ultra-high-performance concrete.
Review policy
This paper was reviewed in accordance with the Precast/Prestressed Concrete Institute’s peer-review process.
Reader comments
Please address reader comments to [email protected] or Precast/Prestressed Concrete Institute, c/o PCI Journal, 200 W. Adams St., Suite 2100, Chicago, IL 60606. J