Embed Size (px)
Citation preview

3 1176 00169 0909
NASA Technical Memorandum 81940
NASA-TM-81940 19810009574
!
CHARACTERIZATIONOFDELAMINATIONONSET
ANDGROWTHINA COMPOSITELAMINATE
T, KevinO'Brien
FEB2 4 1981
't.A[qG .E _ _'_cSEARCH CENTE,,(_,LIBRARY,NASA
1 NANA_}, NationalAeronautics find
Space Administration
LangleyResearchCenterHampton,Virginia 23665
https://ntrs.nasa.gov/search.jsp?R=19810009574 2018-07-13T09:38:51+00:00Z

CHARACTERIZATION OF DELAMINATION ONSET AND GROWTH IN A
COMPOSITE LAMINATE
, T. Kevin O'Brien
Structures LaboratoryU.S. Army Research and Technology Laboratories (AVRADCOM)
NASA Langley Research Center
Hampton, Virginia 23665
SUMMARY
The onset and growth of delaminations in unnotched [±30/±30/90/90]s
graphite-epoxy laminates is described quantitatively. These laminates,
designed to delaminate at the edges under tensile loads, were tested and
analyzed. Delamination growth and stiffness loss were monitored nondestruc-
tively. Laminate stiffness decreased linearly with delamination size. The
strain energy release rate, G, associated with delamination growth, was
calculated from two analyses. A critical G for delamination onset was
determined, and then was used to predict the onset of delaminations in
[+45n/-45n/0n/90n]s (n=1,2,3) laminates. A delamination resistance curve
(R-curve) was developed to characterize the observed stable delamination
growth under quasi-static loading. A power law correlation between G and
delamination growth rates in fatigue was established.

INTRODUCTION
A commonly observed failure mode in laminated composite materials is
delamination between the composite layers. Delaminations may develop during
manufacture due to incomplete curing or the introduction of a foreign ,_
particle; they may result from impact damage; or they may result from the
interlaminar stresses that develop at stress-free edges or discontinuities.
Furthermore, delaminations may grow under cyclic loading. Delamination
growth redistributes the stresses in the plies of a laminate, and may
influence residual stiffness, residual strength, and fatigue life. Hence,
a fatigue analysis for composite materials should take into account the
presence and growth of delaminations.
A bibliography of experimental and analytical work on delamination is
contained in reference [i]. One of the most promising techniques for
characterizing delamination growth is based on the rate of strain energy
released, G, with delamination growth [i]. Previous work [2] has shown
that the cyclic growth rate of debonds between the metal and composite
component s of reinforced panels could be correlated with G. Measured
critical G values have been used in soPhisticated analyses [3,4] to pre-
dict the onset of edge delaminations in unnotched composite laminates.
In the present study, a simple technique was developed, employing
strain energy release rates to characterize the onset and growth of
delaminations in a composite laminate. First, the damage that developed
in unnotched [±30/±30/90/_]s graphite-epoxy laminates under static
tension loading and tension-tension fatigue loading was determined. Next,
stress distributions generated from a finite element analysis were
correlated with the observed damage° Then, during quasi-static test
2

loads, delamination growth and stiffness loss were monitored nondestruc-
tively to relate laminate stiffness and delamination size. The resulting
test data and analysis were used to derive a closed-form equation for the
strain energy release rate, G, associated with delamination growth. Next,
a critical value of G for delamination onset was determined. It was then
used to predict the onset of delamination in [+45n/-45n/On/90n]s (n=1,2,3)
laminates. A delamination resistance curve (R-curve) was developed to
characterize the observed stable delamination growth during quasi,static
loading. Finally, a power law correlation between G and delsmlination
growth rates in fatigue was established.
SYMBOLS
[A] extensional stiffness matrix
A delaminated area
A* area of interface containing a delamination
a strip delamination size
Aa incremental strip delamination size
d__a delamination growth rate in fatiguedN
[B] coupling stiffness matrix
b half-width of laminate cross section
C,_ empirically determined coefficients
[D] bending stiffness matrix
3

E axial stiffness of a partially delaminated laminate
ELAM axial laminate stiffness calculated from laminated plate theory
E* axial stiffness of a laminate completely delaminated along one or
more interfaces
Ei axial stiffness of the ith sublaminate formed by a delamination
Eo initial tangent modulus of an undamaged laminate
EII,E22,E33 lamina moduli
d_EE rate of stiffness change with delamination areadA
d_EE rate of stiffness change with fatigue cyclesdN
GII,GI2,GI3 lamina shear moduli
G strain energy release rate associated with delamination growth
GI,GII,GII I strain energy re_ease, rate components due to opening,
in-plane shear, and out of plane shear fracture modes
GFEM values of GI, GII , GII 1 calculated from finite element
analysis
Gc critical strain energy release rate for delamination onset
GR delamination resistance
Gmax maximum strain energy release rate in constant strain
amplitude fatigue test
4
h ply thickness
K saturation spacing of cracks in 90° plies
\ Z gage length used to measure axial displacements
N number of fatigue cycles
n number of plies in a laminate
t laminate thickness
ti thickness of ith sublaminate formed by delamination
u,v,w displacements in x,y,z directions
U,V,W displacement functions in x,y,z directions
V material volume
dU
rate of strain energy released as flaw extends
dW
rate of work done by applied load as flaw extends
x,y,z cartesian coordinates
X,Y,Z nodal forces in x,y,z directions
XII first element of the inverse extensional stiffness matrix
(A,ij-1) (i,j = 1,2,3)
s nominal axial strain
go uniform axial strain assumed in finite element analysis

Sc nominal axial strain at onset of delamination
_max maximum cyclic strain level in fatigue
_12,_13,_23 lamina Poisson's ratio J
_x axial stress in a ply
_c remote axial stress applied at onset of delamination
Oz interlaminar normal stress between plies
SPECIMENS AND APPARATUS
Unnotched [±30/±30/90/_]s, T300-5208 graphite-epoxy laminates were
tested in tension. This laminate was designed to have relatively high
tensile interlaminar normal stresses at the edges resulting in the formation
of a delamination [5]. Figure l(a) shows the delamination that developed
along the edge.
The specimens were 254 mm (i0 in.) long by 38 mm (1.5 in.) wide. These
eleven-ply laminates had an average ply thickness of 0.14 mm (.0054 in.).
Specimens were tested in a closed-loop hydraulic testing machine. The
specimen length between the grips was 180 mm (7.0 in.).
Also shown in figure l(a) is a pair of linear variable differential
transducers (LVDT's), that were mounted on the specimen to measure displace-
ments over a 102 mm (4.0 in.) gage length. To prevent slippage, a fast
drying glue was applied to the central 5.6 mm (.22 in.) portion of the
LVDT mounts where they touched the specimen. During "strain-controlled"
loading, these LVDT's were used as the feedback device in the closed loop.f

Dye-penetrant enhanced radiography was used to monitor delamination
growth through the specimen width. Diiodobutane (DIB), a dye penetrant
opaque to x-rays, was injected along the delaminated edge. The film was
: placed immediately behind the specimen. While still mounted in the test
machine, specimens were exposed to x-rays generated for five seconds at 18 kV
from a portable point-source unit positioned 386 mm (15.5 in. ) ,away from the
specimen. The radiographs showed the location of the delamination front
(fig. l(b)). The dark outline in the center of the picture is the "shadow"
(x-ray image) of the LVDT rods used to measure displacements.
DAMAGE DEVELOPMENT
The same type of damage deve!oped during both quasi-static tension
and constant-amplitude, tension-tension fatigue. First, a few isolated
cracks formed in the 90° plies. These were followed almost immediately by
the formation of small delaminations along the edge, as seen in figure 2(a).
When the delaminations formed, the number of 90°-ply cracks increased
significantly along the delaminated length of the specimen. Most of the
90°-ply cracks, which appear as horizontal lines on the radiographs in fig-
ure 2, extended beyond the delamination front outlined in the x-ray photo-
graph. Many of the ply-cracks immediately extended halfway across the
specimen width. As loading continued, additional delaminations formed and
joined with original delaminations. Delaminations grew much more rapidly
along the length of the specimen than across the width (fig. 2(b)).
Eventually, two delaminations, one on each side of the specimen, extended
along the entire specimen length between the grips (fig. 2(c)), after which
7

the delaminations continued to grow across the width. Loading was terminated
when the delamination front reached the shadow of the LVDT rods (fig. 2(d)). i
To illustrate the location of damage through the thickness, a few
acetate tape replicas of a delaminated edge were made [6]. Figure 3 shows J
photographs of two replicas and a portion of the delaminated edge. As shown
in figure 3(a), ply cracks extended through the thickness of all three
interior 90° plies° As shown in figure 3(b), delaminations formed and grew
in -30°/90 ° interfaces, typically shifting from one interface, through
90° ply cracks, to its symmetric -30o/90 ° counterpart. However, delamina-
tions did not shift interfaces at every 90° ply crack encountered. As shown
in a photograph of the delaminated edge, figure 3(c), interface shifting did
not occur in a regular pattern.
Besides formation of delaminations at the -30/90 interfaces and cracks
in the 90° plies, an occasional angular crack formed in the innermost -30 ° ply.
The replica of the edge in figure 4(a) shows two angular cracks in the inner-
most -30° plies originating at a 90° ply crack tip and creating delaminations
in the +30/-30 interfaces. As shown in the radiograph in figure 4(b), the
delaminations in the +30/-30 interfaces were small and triangular in shape.
These +30/-30 delaminations often temporarily arrested initial -30/90 inter-
face delamination growth along the length of the edge. However, -30/90 inter-
face delaminations eventually joined up and grew, whereas isolated
+30/-30 delaminations usually remained small°
STRESS ANALYSIS
Two approximate analyses were used to obtain quantitative predictions
of the onset and growth of delaminations. The first was a quasi-three-
dimensional stress analysis that yielded stress distributions and strain
8

energy release rates. The second was a simple rule of mixtures analysis
that was used along with laminated plate theory to calculate stiffness loss
and strain energy release rates.
Because delaminations form in unnotched laminates as a result of the
interlaminar stresses that develop at the edge, a quasi-three-dimensional
finite element analysis [7] was performed. The finite element analysis was
used to calculate stress distributions in the [±30/±30/90/_]s laminate
for a unit axial nominal strain (go = I). Some details of the analysis are
described in Appendix A.
Figure 5 shows that the through-thickness distribution of the inter-
laminar normal stress, az, calculated at the edge is compressive in the
outer 30° plies but reaches a relatively high tensile value at the -30/90
interface and throughout the 90° plies. Also shown in figure 5 is the
approximate qz distribution through the thickness calculated from
laminated plate theory and an assumed stress distribution across the
width [8]. This plot also shows the highest tensile qz stresses to be at
the -30/90 interface and within the 90° plies.
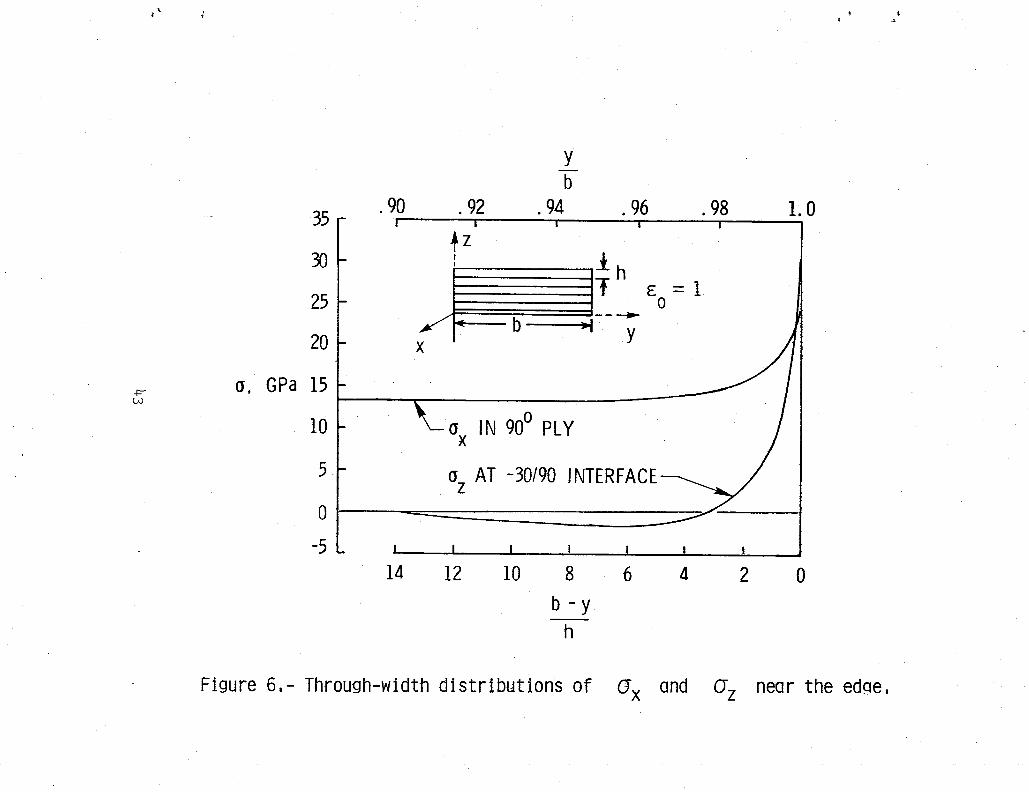
Figure 6 shows a distribution of _z across the specimen width, near
the edge, at the -30/90 interface, as well as a distribution of the axial
stress, Ox, in the adjacent 90° ply. Both Gz and _x have high tensile
values at the edge.
These stress distributions showed reasonable correlation with the
observed damage that developed. Indeed, examining qz and interlaminar
shear stress distributions are helpful in identifying likely delamination
sites. However, interlaminar stress distributions calculated from finite
9

element analyses were not useful for modeling damage growth quantitatively
because the magnitude of calculated peak stresses at the edge varied with6:
mesh size. Furthermore, linear elastic analysis suggests that the inter- _
laminar stresses at ply interfaces can become singular at the edge [7]. This
singular behavior would preclude the use of a failure criterion based on
maximum interlaminar stress values. Therefore, an alternate approach, based
upon strain energy release rates, was adopted to quantitatively describe the
onset and growth of delaminations.
°
STIFFNESS LOSS
In many composite laminates, stiffness loss may reflect delamination
growth. Furthermore, the rate of stiffness loss with delamination growth can
be directly related to strain energy release rates. Therefore, analysis and
experiments were performed to correlate laminate stiffness and delamination
size.
Rule of Mixtures Analysi9
To analyze stiffness loss due to delamination, a simple rule of mixtures
analyses, along with laminated plate theory, was used. First, the stiffness
(tangent modulus) of a balanced, symmetric composite laminate (fig. 7a) was
calculated from laminate theory [9_i0] as
1 (1)ELAM = Xll t
where XII is the first element of the inverse extensional stiffness
Aij-I (i,j = 1,2,3), and t is the laminate thickness.matrix _ Next,
I0

assuming a complete delamination in one or more interfaces, and using the
rule of mixtures assumption that the sublaminates formed undergo the same
axial strain Ibut no longer have the same transverse strains), results in
n
Eiti
E* - i=lt (2)
where
E* = stiffness of a laminate completely delaminated along one or
more interfaces
Ei = the laminate stiffness of the ith sublaminate formed by the
delamination
ti = the thickness of the ith sublaminate
Although equation (2) represents a two-dimensional formulation, E* will
depend upon which interfaces delaminate. This, in turn, determines the
stiffness, Ei, and thickness, zi, of each new sublaminate. Hence, equa-
tion (2) is sensitive to the through-thickness location of the delamination.
For the [±30/±30/90/_]s laminate, assuming a delamination in both -30/90
interfaces (fig. 7b) equation (2) becomes
E* = 8E(±30)2 + 3E(90)3 (3). ll
Finally an equation for the stiffness, E, of a partially delaminated
specimen was developed using the rule of mixtures. Equal-sized delaminated
ii

strips were assumed to exist at both edges of the laminate (fig. 7c). Then,
by assuming the laminated and delaminated portions of the specimen act as
€
independent components loaded in parallel, the rule of mixtures yields
a + ELAM (4
A more general form of equation (4) may be developed by assuming that the
relationship between laminate stiffness loss and delamination size can be
represented by
E - ELAM -A
E* - ELAM A*
where
A = delaminated area
A* = total interfacial area
Rearranging equation (5) yields
A
Equation 4) is a special case of equation (6) where
a A
b A*
12

Experiments
To verify the linear relationship between stiffness and delamination_m
size implied by equations (4) and (6), four quasi-static tensile tests were
conducted. The specimens were loaded in a strain controlled mode until a
delamination formed. Then, the specimens were unloaded to ten percent of
the peak nominal strain, DIB was placed on the specimen edges, and an x-ray
photograph was taken. Next, the specimens were reloaded in increments
of 250 Bm/m above the previous maximum strain level. This procedure was
repeated until the specimen was almost totally delaminated.
During each loading, output signals of the two LVDT's were averaged,
and load deflection curves were plotted on an X-Y plotter. The initial
linear portion of each plot was used to calculate laminate stiffness
corresponding to the damage recorded in the previous x-ray photograph
(fig. 8). Delaminated areas recorded on the photographs within the 102 mm
(4 in.) gage length were measured with a planimeter. To minimize data reduc-
tion error, each delamination was traced three times and measured areas were
averaged. Then, a strip delamination size, a, having equal area over the
LVDT gage length as the measured delamination, was calculated (fig. 9).
Figure i0 shows a plot of normalized stiffness, E/Eo, as a function of
normalized delamination size a/b. A least-squares regression line for the
data indicated that E* = 0.742Eo, where Eo is the initial tangent modulus
measured. Hence, a total delamination in the [±30/±30/90/_]s laminate
would result in a 25.8 percent reduction in laminate stiffness. The data
_ agreed with the linear rule of mixtures equation (4), normalized by ELAM,
where E* was calculated from equation (3) and sublaminate stiffnesses were
calculated using equation (i) (see appendix B) w±th material properties
from reference [ii].
13

Finally, equations (2) and (4) were used iteratively to calculate
laminate stiffness for specimens having -30/90 interface delaminations andj_
concurrent, although small, +30/-30 interface delaminations (see Appendix C).
The contribution of 90° ply cracks to laminate stiffness loss was also
considered (see Appendix C). However, the net effect of both secondary
mechanisms (+30/-30 delaminations and ply cracks) on Stiffness loss was
negligible for the [±30/±30/90/_]s laminate.
STRAIN ENERGY RELEASE RATE
For an elastic body containing a planar flaw of area A, the strain
energy release rate, G, is the difference between the rate of work done,
dW/dA, and the rate at which elastic strain energy is stored, du/dA, as the
flaw area increases [12], i.e.,
S = d-F-w - d_.U (T)clA cI_
Assuming that a nominal strain, E, is sufficient to extend the flaw, the
work term vanishes. Then, if U is expressed as a product of the strain-
energy-density and volume of the body, V, substituting Hooke's law into
equation (7) yields
G = -V _2 dE (8)2 dA
where d__E is the rate of stiffness change as the flaw extends.dA
14

In this study, the body was a tensile-loaded, unnotched composite
laminate, containing edge delaminations. The strain energy release rateb
associated with the growth of edge delaminations can be calculated by
assuming two strip delaminations (fig. 9) where
V=2bZt
A* = 2b
(9)A= 2_a
dA = 2_ da
Then, substituting equations (9) into equation (8) and differentiating
equation (4) yields
o--__ 2t(E - (10)2 LAM
Equation (i0) may also be derived for an arbitrary-shaped delamination by
substituting equation (6) into equation (8), differentiating, and noting
that V = A*t. Hence, as indicated in equation (i0), the strain energy
release rate associated with delamination growth is independent of the
delamination size. The magnitude of G depends only on the laminate layup
and location of the delaminated interface(s) (which determine ELA M and E*),
the nominal strain, g, and the laminate thickness, t.
Furthermore, the strain energy release rate (eq. _I0) may have con-
tributions from any of the three components GI, GII, or Gill, corresponding
to the opening, in-plane shear, and out-of-plane shear fracture modes. In
addition, near the edge, G may deviate from the value predicted by
15

equation (10), which was deve!oped using laminated plate theory and the rule
of mixtures. Therefore, a virtual crack extension technique was used with
the quasi-three-dimensional finite elementanalysis to calculate GI, GII ,
and Gi11 as a function of delamination size (see Appendix A). As shown
in figure ii, the finite element analysis indicated that the total G,
represented by GI plus GII (Gi11 was negligible), reached the value pre-
dicted from equation (i0) once the delamination had grown a very small dis-
tance in from the edge.
Because G increased rapidly with "a" near the edge, a small delamina-
tion that formed (for whatever reason) at the edge would be expected to
undergo rapid initial growth. This behavior was observed in the quasi-static
tension tests used to generate stiffness data. As soon as a del_nination
was detected, the loading was stopped. The formation and growth of the
delamination to some finite size appeared to be nearly instantaneous. There-
fore, G calculated from equation (I0) at the nominal strain where delamina-
tion was first detected was considered to be the critical value, Gc, required
to form the delamination. This Gc was then used to predict the onset of
delamination in other laminates.
DELAMINATION ONSET
To predict the onset of delamination in other laminates, several things
were done. First, tension tests of [±30/±30/90/_]s laminates were run to
determine the nominal strain level, Sc' at which delamination begins.
Next, sc was used in equation (i0) to predict a critical Gc for the onset
of delaminationo Then, Gc was used to predict the nominal strain at the
onset of delamination in other laminates. A more detailed description of
the procedure follows.
16

Critical Gc Determination
First, eighteen [±30/±30/90/90]s graphite epoxy laminates were loaded
monotonically in tension at a rate of 44.5 N!sec (i0 ibs/sec) until a
" delamination was detected. The load level corresponding to delamination onset
was recorded and the corresponding applied stress, qc' was calculated. Then,
_o determine the nominal strain a_ the onset of delamination, _c' _c was
divided by ELAM, calculated from laminated plate theory using the following
elastic properties from reference [ii]
Ell = 138 GPa (20.0 Msi
E22 = 15 GPa (2.1 Msi)
GI2 = 5.9 GPa (0.85 Msi
v12 = 0.21
The average Sc value was 3470 Dm/m. In addition, _c was determined from
LVDT measurements on the four tests conducted to generate stiffness data.
In each of these four tests, the load deflection plot was linear until the
delamination formed. The average value of sc where the load-deflection
curve deviated from linear for these four tests was also 3470 _m/m.
Next, sc was substituted into equation (i0) to determine Gc. Stiff-
ness ELAM and E* were calculated from equations (i) and (3), respectively,
using elastic properties from reference [ii]. The average laminate thick-
ness, measured with micrometers, was 1.51 mm (0.0594 in.). A value
of 137 j/m2 (0.78 in-lbs/in 2) was calculated for the critical strain energy
release rate.
17

Delamination Onset Prediction
To predict the onset of delamination in other laminates, equation (i0)
was inverted to yield
I 2 Gc
The critical Gc determined from [±30/±30/90/_]s laminate data was used
in equation (ii) to predict the nominal strain at the onset of delamination
in [+45n/-45n/0n/90n] s (n = 1,2,3) T300-5208 graphite-epoxy laminates
having the same stacking sequence but different thicknesses. To evaluate E*,
delaminations were modeled along both 0/90 interfaces where high tensile Z
stresses were anticipated [3] on the basis of the approximate analysis of
reference [8]. Delaminations have been observed in the 0/90 interface of
a [145/0/90] s laminate in reference [12]. Then, stiffnesses ELAM and E*
were calculated from equations (i) and (2), respectively, using elastic
properties from reference [ii]. J
A ply thickness of 0.15 mm (0.0057 in.) was determined in reference [3]
for the 8-ply (n = i), 16-ply (n = 2), and 24-ply (n = 3) laminates. In
figure (12), predictions of Ec were compared to gc values calculated by
dividing measured _c values from reference [3] by ELAM. Because the data
from reference [3] represents the average of only two or three tests for
each stacking sequence, only preliminary conclusions can be drawn. Never-
theless, the good comparison indicates that Gc may be independent of the
ply orientations that make up the delaminating interface. For example,
Gc may be the same for delamination onset in the -30/90 interfaces of
18

[±30/±30/90/90]s laminates and for delamination onset in the 0/90 inter-
faces of the [+45n/-45n/0n/90n] s (n = 1,2,3) laminates. In fact, equa-
tion (ii) indicates that the dependence of _c on stacking sequence and the
ply orientations that make up the delaminating interface is accounted for
in the (ELAM - E*) term.
In addition, both equation (ii) and the data indicate that delaminations
will form at a lower nominal strain in thicker laminates of identical stacking
sequences. According to reference [4] interlaminar stress distributions
calculated from elastic analysis will be identical for all [+45n/-45n/On/90n] s
laminates subjected to the same applied stress. Therefore, the authors con-
cluded that a failure criterion, if based on critical interlaminar stresses,
would not predict the thickness dependence of delamination onset. Hence,
the strain energy release rate appears to be the most useful parameter for
quantitatively predicing the onset of delamination after the delamination-
prone interface(s) have been identified from a stress analysis.
DELAMINATION GROWTH
Quasi-Static Tension
Edge delamination has been observed to be a stable fracture process
in laminates subjected to tension loading [1,5,14]. Hence, the applied
load must be increased to force the delamination to grow. Tension tests on
the [±30/±30/90/_]s laminates confirmed this observation. Unstable growth
of the delamination through the width did not occur before the laminate
failed (fractured into two pieces). In the four quasi-static tests con-
ducted to generate stiffness data, delaminations did not grow after the mean
applied load exceeded 13_350 N (3000 ibs). The four laminates eventually
19

failed at a mean load of 20,000 N (4500 ibs). Therefore, the
[±30/±30/90/_] s laminate is well suited to studying stable delamination
growth.
The stable growth of flaws can be characterized using the crack growth _
resistance curve (R-curve) concept of fracture mechanics [15]. Therefore,
a delamination resistance curve was constructed. Strain energy release
rates, G, were calculated from equation (i0). Because G does not depend
on delamination size, it appears as a horizontal line in figure 13. The
three horizontal lines shown are G values calculated for a single specimen
at three successive nominal strain levels. In addition, the delamination
resistance, GR, was calculated using the maximum nominal strain in equa-
tion (i0). However, GR was plotted as a point corresponding to the size
(see fig. 9) of the delamination created by the nominal strain. As shown
in figure 13, the curve formed by all such points, generated during the
four [130/130/90/_]s quasi-static tension tests, constitutes the delamina-
tion growth resistance curve (R-curve) for the graphite epoxy specimens
tested. The critical Gc used in the previous section to predict the onset
of delamination represents the first value of GR, i.e., the first point on
the R-curve. Hence, the R-curve characterizes the laminates resistance to
delamination growth under tensile loading.
If theR-curve is independent of the ply orientations that make up
the delaminated interface, like Gc appears to be (see previous section),
then equation (i0) and the R-curve can be used to predict the growth of
delaminations under quasi-static tension in other laminates. As the
loading is increased, G can be calculated from equation (i0) and
2O

compared with the R-curve to predict delamination size. Hence, delamination
size as a function of applied load could be predicted for other laminates."A
Fatigue
ExperimentS
Constant amplitude, tension-tension, strain-controlled fatigue tests
of [±30/±30/90/90] s graphite epoxy specimens were conducted at a frequency
of i0 Hertz and a strain ratio of 0.2. Specimens were loaded slowly in
tension until a small delamination appeared. Laminate stiffness was measured
during this initial loading. Then, the specimen was unloaded and delamina-
tion size was recorded using DIB-enhanced x-ray photography. Next, the
specimen was reloaded to the mean strain and the stiffness of the delaminated
specimen was recorded. Then, constant-strain-amplitude cyclic loading was
applied. The cyclic loading was interrupted at specified intervals to
measure delamination size and static stiffness. Hence, a photographic
record of delamination size and a record of static stiffness as a function of
load cycles were accumulated. Cyclic loading was terminated when the
delamination had grown across most of the specimen width and the front was
obscured by the x-ray image of the LVDT rods (fig. 2(d)).
D_amin_on 9rowth rate mea6urements
Figure 14 shows a typical plot of delamination size as a function of
load cycles. A strip delamination size, a, was calculated from the delami-
nated area (fig. 9) measured from x-ray photographs using a planimeter.
Three separate planimeter tracings of each delaminated area were performed to
minimize data reduction error. As indicated in figure 14, once the delamina-
tion had grown over the entire length of the specimen edge, a constant growth
21

rate, da/dN, was eventually achieved. Table I lists the growth rates,
da/dN, determined from least squares linear regression analysis of the dataa_
for each fatigue test.
Figure 15 shows, a typical plot of static stiffness loss as a function of
load cycles. This plot also became fairly linear once the delamination had
grown away from the edge. Stiffness degradation rates, dE/dN, were calcu-
lated from least squares linear regression analysis of the data over the
same cyclic range used to fit da/dN data. Because stiffness was found
to be linearly related to delamination size, differentiating both sides of
equation (4) with respect to number of cycles (N) allowed an alternate
determination of delamination growth rates, da/dN, from measured stiffness
degradation rates, dE/dN, i.e.,
da ( _bELAM) dE (12)
Therefore, delamination growth rates for the edge delamination specimens
could be estimated without measuring the delamination size directly (Table 1).
Hence, the [±30/±30/90/_] specimens used in this investigation shoulds
be useful for generating baseline delamination growth data.
Data correlation with analysis
Four fatigue tests were conducted at each of three maximum cyclic
strain levels. The maximum cyclic strain levels, gmax' chosen were 3000,
3250, and 3500 _m/m. The maximum strain energy release rate, Gmax, was
calculated from equation (i0) using g Therefore, a constant amax testmax" _.
was also a constant Gmax test. The mean of the four delamination growth
22

rates, da/dN, was determined for each of the three Gma x levels. A power
curve of the form d_a = BdN CGmax was fit to the three mean values of da/dN
and the three values of G using a least squares routine. An excellentmax
correlation was achieved for both delamination growth rate measurement tech-
niques.
Figure 16 shows d_adN as a function of Gma x for growth rates estimated
directly from measured delaminated areas. The growth rates for all four
tests at each Gma x level are shown along with the mean growth rate. Fig-
ure 17 compares the least-squares power law fits using direct area measure-
menvs and indirect stiffness estimates of delamination growth rates. Because
both da/dN and G can be calculated without direct measurement of delamina-
tion size, the stiffness technique presents a relatively simple means of
generating data to determine the dependence of empirical parsm_eters c and 6
on differences in load history, frequency, temperature, etc.
With the parameters c and B determined, the power law might be
applied to other laminates. The calculated strain energy release rates
could be used with c and 6 measured from edge-delamination baseline
tests to determine delamination growth rates.
CONCLUDING REM_KS
Methodology Summary
A methodology for analyzing the onset and growth of delaminations in
composite materials was formulated based on findings in the current work
a_d in the literature. The methodology is as follows.
First, a stress analysis of the particular material, configuration,
and loading must be performed. The analysis should establish where
23

delaminations will be located. For unnotched laminates, the approximate analyses
discussed in this paper [8,16] might be adequate. After the location is established,t_
the delamination onset and growth can be characterized quantitatively using
strain energy release rates. Such a characterization incorporates the influ- _
ence of material volume. Furthermore, determination of the singular stress
field at the delamination front is not required.
The current work indicates that a total strain energy release rate
may be sufficient to characterize the onset and growth of edge delaminations
in tensile-loaded coupons. More work is required to determine if this is
true for other configurations and loadings. However, if strain energy
release rates must be separated into GI, GII , and Gi11 components using
a numerical analysis, then the dependence of these calculated components
on grid size should be carefully checked and documented.
Immediate Results
A simple rule of mixtures analysis, using laminated plate theory,
indicated that laminate stiffness was a linear function of delamination
size. The analysis accurately predicted stiffness loss due to edge
delaminations in [±30/±30/90/90]s graphite epoxy laminates. The linear
stiffness relationship was used to derive a closed-form equation for the
strain energy release rate, G, associated with delamination growth in
unnotched laminates. The simple G equation was used to predict delamina-
tion onset in _ [+45n/-45n/0n/90n] s (n = 1,2,3) laminates using a
critical G determined from [±30/±30/90/90] s laminates. Stablec
in the [±30/±30/90/9-O]s laminates was characterizeddelaminat ion growth
24

by developing a delamination resistance curve (R-curve). Delamination
growth in [±30/±30/90/90] s laminates in fatigue was characterized by
developing a power law correlation between G and delamination growth rates.
Potential Applications
Preliminary predictions of delamination onset in [+45n/-45n/On/90n] s
laminates using a critical Gc determined from tests on [130/130/90/9-_]s
laminates indicated that Gc may be independent of the ply orientations
that make up the delaminating interface. If this is true for stable
delamination growth with increased tensile load and delamination growth
in fatigue, then the delamination resistance curve (R-curve) and power
law developed on [_30/130/90/_] laminates can be used to predicts
delamination growth in other laminates.
25

APPENDIX A
FINITE ELEMENT ANALYSIS
Formulat i on ',
The quasi-three-dimensional finite element analysis was developed
in reference [7]. A displacement field of the form
u = Sox + U(y,z)
v = v(y,z) (Al)
w = w(y,z)
was assumed, where s was a prescribed uniform axial strain. Eight-nodedo
_ladrilateral, isoparametric elements with three degrees of freedom per node
were used to model a cross section along the specimen length (fig. 18). Only
one quarter of the cross section was modeled due to symmetry conditions. Each
ply Was modeled with one element through its thickness except for the cen-
tral 90° ply, which was modeled with one element through its half-thickness.
The graphite epoxy unidirectional properties [ii] used in the analysis were
Ell = 138 GPa (20.0 Msi)
E22 = E33 = 15 GPa (2.1 Msi)(A2)
G12 = GI3 = G23 = 5.9 GPa (0.85 Msi)
v12 = _13 = _23 = 0.21
26

APPENDIX A
Virtual Crack Extension Technique
Previously, a virtual crack extension technique has been applied to
finite element analysis of delaminations [i_4]. In this technique, the work
required to close the delamination, expressed in terms of nodal forces and
displacements, is assumed to be equivalent to the strain energy released as
the delamination extends due to a constant nominal strain. This technique
greatly simplifies the computation of GI, GII, and Gi11 because
knowledge of the singular stress field near the crack tip is not required.
Figure 19 illustrates the technique as it was used with the quasi-three-
dimensional finite element analysis. First, the nodal forces were calculated
for an initial delamination of size a. Then, the delamination was extended
an amount Aa and the resulting nodal displacements at the same location
were calculated. The expressions for GI, GII, and Gi11 in terms of
nodal forces and displacements were
[lz .2Aa •
_ i Iy_ + y2_'V _ Vcl + Y_(V- Ve)1 (A3)GII 2Aa bJ\ b d
where, for example, ZI represents the force in the z direction at node bb
calculated from element i.
Figure ii shows GI and GII as functions of delamination size.
Gi11 was negligible for this case. Strain energy release rates, GFEM,
27

APPENDIX A
calculated using equations (A3), where normalized by the constant value pre-
dicted from equation (i0). The total G, represented by GI plus GII,
reached the value* predicted by equation (i0) once the deiamination had grown
a very small distance in from the edge. Furthermore, the total G calculated
was not sensitive to mesh refinement. However, the values of GI and GII
calculated were sensitive to mesh refinement.
Figure ll shows the nodal discretization used in the finite element
analysis. Four different initial delamination sizes, a, were modeled. For
each a, the delamination was grown in ten increments, Aa, equal to one tenth
*Because the finite element analysis models only one quarter of the
laminate cross section due to symmetry, the analysis assumes four delaminations
grow simultaneously, two on each side, located in the -30/90 interfaces. How-
ever, in the derivation of equation (i0), only a single delamination was con-
sidered on either edge to be consistant with the physically observed behavior
shown in figure 3(c) and illustrated in figure 20(a). Making the same assump-
tions as the finite element analysis would have yielded
V = 2b_t
A* = 4bZ
A = 4_a
dA = 4_ da
which would result in G = s2t \fELAM - E*_/ Hence, the values calculated from4
the finite element analysis using equations (A3) were doubled to be consistent
with equation (i0) and the observed physical behavior. _
g
28

APPENDIX A
of the initial delamination size. As a was increased, the mesh refinement
changed accordingly. For the smallest delamination size, GII continually
increased as the delamination grew, but GI was constant for all ten incre-
. ments of growth. The ten values of GI for the smallest a are represented
by a horizontal line segment. For the next three delamination sizes, both GI
and GII were constant for all ten increments of growth, but the
ratios GI/GII changed. For the largest delamination size modeled, GI
and GII were identical, both equal to ene-half the total G. Hence,
calculations of GI and GII varied with mesh size.
29

APPENDIX B
EFFECT OF COUPLING ON STIFFNESS LOSS _
The stiffness of an arbitrary composite laminate may be calculated from
laminate theory [9,10] as
i
ELM = _fl']t (Bl)1
where
[A'] = [A]-1 + [A]-I[B][D*]-I[B][A] -I
[D*]= [D]- [B][A]-m[B].
and [A], [B], [D] are the extensional, coupling, and bending stiffness
matrices, respectively, defined in reference [9]. If the laminate is
symmetric, the [B] matrix vanishes, and equation (BI) reduces to
equation (i).
For an arbitrary laminate containing delaminations in one or more
interfaces, equation (BI) may be used in equation (2) to calculate the
stiffnesses, Ei, of the sublaminates that are formed. For the
[±30/±30/90/_] s laminate, with delaminations modeled in both -30/90 inter-
faces, equation (2) becomes equation (3)
8E(±30)2 + 3E(90) 3E* =ll
3O

APPENDIX B
If the (±30)2 sublaminate stiffnesses are calculated using equation (BI)
"- and material properties from reference [II], then E* = 0.69 ELAM, which
exceeds the value of E* extrapolated from a least-squares regression line
for the stiffness data. However, both -30/90 interfaces did not delaminate
complete (fig. 3). As shown in figure 20(a), delaminations shifted from
one -30/90 interface to another through various 90° ply cracks. Delaminations
were believed to grow in this manner to reduce the effect of bending-extension
coupling that would have been present had only one interface been cleanly
delaminated or had both interfaces delaminated at the same time. Therefore,
delaminations were modeled over both -30/90 interfaces (fig. 20(b)) but the
bending-extension coupling in the (±30)2 sublaminates was neglected.
Hence, the stiffness of each sublaminate was evaluated using equation (i).
This resulted in E* = 0.743 ELAM which agreed with the value of E*
extrapolated from a least-squres regression line for the stiffness data
(fig. i0).
In addition, stiffness loss for delaminations of various size was
calculated from the finite element analysis. Concurrent strip delaminations
were assumed in both -30/90 interfaces. Uniform axial extension was also
assumed and, hence, bending-extension coupling was ignored. The stiffness
corresponding to a particular delamination size was calculated using the
technique outlined in reference [16]. Figure 21 shows the stiffness loss
predicted by the linear rule of mixutes (R.O.M.) equation without coupling
(Ei calculated from eq. (i)) and with coupling (Ei calculated from eq. (BI)).
The finite element predictions agreed with the rule of mixtures equation that
% neglected bending-extension coupling. Hence, the finite element results also
agreed with the data plotted in figure i0.
31

APPENDIX C
STIFFNESS CHANGE FROM SECONDARY MECHANISMS
Ninety De_reePly Cracks _"
The spacings of 90° ply cracks in the laminated portion of partially
delaminated [±30/±30/90/'_] s laminates were measured directly from enlarged
x-ray photographs° The mean spacing is plotted in figure 22 as a function
of delamination size (see fig, 9) for three quasi-static test specimens. As
the delaminations grew, the crack spacings decreased to within values pre-
dicted by a simple one-dimensional model [6].
Near the 90° ply cracks, load was assumed to be transferred to the
neighboring plies and then back into the 90° plies to form the next crack.
The model predicted that 90° ply cracks would reach a characteristic satura-
tion spacing, K, determined by the laminate stacking sequence, ply thickness,
and ply stiffness, but independent of load history.
For the [130/130/90/_]s laminate, the model predicted a saturation
spacing of 0.838 mm (0.033 in.). For a [±30/130/903] sublaminate, repre-
sentative of the delaminated portion of the [±30/±30/90/_] s laminate, the
model predicted a saturation spacing of 0.955 mm (0.0367 in.).
Stiffness change due to 90° ply cracking in the partially delaminated
specimen was estimated by reducing the maximum axial stress in the 90° plies
based on the density of cracks present. As shown in figure 23, the transverse
stiffness of the 90° plies, E22 , was reduced by the percentage difference
in the maximum axial stress, calculated from the one dimensional model, at
the predicted crack spacing K and at one half the spacing K/2. This
difference represents the reduction in load carried by the 90° ply once the
saturation crack pattern has formed. _
32

APPENDIX C
For the [±30/±30/90/'_] s laminate, a twelve percent reduction in the
axial stress in the 90° plies was predicted. Reducing, the transverse
stiffness, E22, of the 90° plies by twelve percent resulted in a 0.7 percent
reduction in [±30/±30/90/_]s laminate stiffness. Similarly for the
[±30/±30/903] sublaminate, a 14 percent reduchion in the axial stress in
the 909 plies was predicted. Reducing the transverse stiffness, E22 ,
of the 90° plies by 14 percent resulted in a 2.2 percent reduction in
the [130/130/903] sublaminate stiffness.
Because the estimated contributions of 90° ply cracks to stiffness
reduction in the [130/130/90/_]s delamination specimen were so small,
they were neglected in calculating E*. However, for other laminates and
materials, ply cracking may have a greater effect on axial stiffness and
other stiffness parameters [17,18].
+30/-30 delaminations
The largest +30/-30 interface delaminations, a, recorded during the
four quasi-static tension tests were measured and tabulated in table 2.
Only specimen E20 had a +30./-30 delamination of significant size. Also
shown in table 2 are predicted stiffness values for the [±30/±30/90/_]s
laminate, containing both -30/90 and +30/-30 interface delaminations. The
stiffness was predicted using equations (2) and (4) first for the
+30/-30 delamination, and then for the -30/90 delamination. The stiffness
predicted for specimen E20 was three percent less than the stiffness pre-
dicted assuming only -30/90 delamination. However, the data agreed best
with the prediction that omitted the +30/-30 delamination. Hence, the
% effect of +30/-30 interface delaminations on measured [±30/130/90/_]s
stiffness loss was neglected in calculating E*.
33

REFERENCES
i. E. F. Rybicki, D. W. Schmueser and J. Fox, "An Energy Release Rate
Approach for Stable Crack Growth in the Free-Edge Delamination _
Problem_' J, Composite Materials , Vol. II (1977), p. 470.
2. G. L. Roderick, R. A. Everett, and J. H. Crews, Jr., "Debond.
Propagation in Composite-Reinforced Metals," Fatigue of Composite
Materials, ASTM STP 569, American Society for Testing and Materials,1975, pp. 295-306.
3. B. T. Rodini, Jr. and J. R. Eisenmann, An Analytical and Experimental
Investigation of Edge Delamination in Composite Laminates, 4th
Conf. on Fibrous Composites in Structural Design, San Diego,
Calif., Nov. 14-17, 1978.
4. A. S. D. Wang, F. W. Crossman, and G. E. Law, "Interlaminar Failure
in Epoxy-Based Composite Laminates," Proc. 29th Symp. Failure Modes
in Com_, National Bureau of Standards, 1979.
5. L. M. Lackman and N. J. Pagano, "On the Prevention of Delamination
in Composite Laminates," AIAA/ASME SAE 15th Structures, Structural
Dynamics and Materials Conference, 1974, Paper No. 74-355.
6. K. L. Reifsnider, E. G. Henneke, and W. W. Stinchcomb, "Defect
Property Relationships in Composite Materials, AFML-TR-76-81,Final Report, June 1979.
7. I. S. Raju and J. H. Crews, "Interlaminar Stress Singularities at a
Straight Free Edge in Composite Laminates," NASA TM-81876,August 1980.
8. N. J. Pagano and R. B. Pipes, "Some Observations on the Interlaminar
Strength of Composite Laminates," International Journal of
Mechanical Scienge , Vol. 15 (1973), pp. 679-688 '.
9. R. M. Jones, Mechanics of Composite Materials, Scripta (1975).
i0. T. K. O'Brien and K. L. Reifsnider, "Fatigue Damage: Stiffness/
Strength Comparisons for Composite Materials," Journal of Testing
and Evaluation, Vol. 5, No. 5, 1977, pp. 384-393.
ii. A. S. D. Wang and F. W. Crossman, "Some New Results on Edge Effect
in Symmetric Composite Laminates_" J. Composite Materials,Vol. II (1977), p. 92.
12. G. R. Irwin, !'Fracture," Handbuch der Physik, Vol. 6 1958), p. 551.
13. J. G. Bjeletich, F. W. Crossman, and W. T. Warren, "The Influence
of Stacking Sequence on Failure Modes in Quasi-lsotropic Graphite _Epoxy Laminates," Failure Modes in Composites - IV, AIME, 1979.
34

14. K. L. Reifsnider, E. G. Henneke, II, and W. W. Stinchcomb, "Delaminationin Quasi-Isotropic Graphite-Epoxy _aminates," Composite Materials:
Testing and_ (_th Conference), ASTM STP 617 (1977), P. 93.-3
15. Fracture Toughness Evaluation by R-Curve Methods, ASTM STP 527, AmericanSociety for Testing and Materials, Philadelphia, Pennsylvania, 1973.
16. T. K. 0'Brien, "An Approximate Stress Analysis for Delamination Growthin Unnotched Composite Laminates," Proceedings of the Sixth AnnualMechanics of Composites Review,_Dayton, Ohio, October, 1980.
17. A. L. Highsmith and K. L. Reifsnider, "The Effect of Tensile FatigueDamage on Tensile, Compressive, and Bending Stiffness of CompositeLaminates," Composites Technology Revi_ew,Vol. 2, No. !, Winter 1980.
18. W. So Johnson and G. J. Dvorak, "Mechanisms of Fatigue Damage inBoron/Aluminum Composites," Presented at ASTM Symposium on Damagein Composite Materials, Bal Harbour, Florida, November 10-14, 1980,(will appear in ASTM STP).
%
35

TABLE i.- FATIGUE GROWTH RATE MEASUREMENTS
d_' mm
_' cycle dE Pa Cycle range of
_max Gmax Spec. d-N' cycle linear fit(_m/m) (j/m2) # Area Stiffness (cycles x 103)
measure measure
3000 102 C20 26.0 22.3 -17.7 45 - 120
FI8 19.5 29.0 -22.9 40 - 120
F24 24.5 27.0 -21.3 25 - 80
CIO 28..__._.3 30.,__._2 -23.8 40 - 115
MEAN 24.6 27.1
3250 119 A7 41.8 40 - 80
F3 63.9 64.2 -50.7 14 - 50
E4 23.3 51.2 -40.3 40 - 70
C16 23.6 25.4 -20.1 40 - 120
MEAN 38.2 _ 46.9
3500 138 D2 52.6 106.2 -83.8 30 - 60
BI3 87.1 119.7 -94.5 16 - 40
D22 64.6 39.7 -31.3 20 - 60
B2_& 47.9 _6.__.__6 _ 28 - 7_
MEA_ 63.0 78.0
36

TABLE 2.- ,EFFECTOF +30/-30 DELAMINATION ON STIFFNESS PREDICTION
.....+30/'30 E/ELAM PredictionF
_30/90
Specimen...... - E/Eo measured
# _ ' a ,With _ _ Without
F9 0.848 0.009 0,778 0.780 0.782
E20 .803 .109 .768 .792 .806
C18 .812 .004 .790 .790 .798
D6 .773 .004 .800 .800 .787
A
37

GRAPH ITt/EPOXY .
DELAM 'NAT ION SPEC tMEN DYE-PENETRANT - ENHANCED(±30/±30/90/90) RADIOGRAPH OF DELAMrNATION
5
la) fb)
DELAMI NAr IONFRONT
Figure 1.- Typical instrumented test specimen and dye-penetrant enhanced radiograph,

•.
II
. I
90° PLYCRACKS'
DELAMINATION
(a) (b) (d)
Figure 2,- Radiographs showing damage growth through the width of (±30/±30/90/9O] Slaminates.

-30/90 INTERFACESDELAMINATED "
(o) ,
, GRAPHfTE EPOXY LAMINATES'(±30) {±30)22 .~ (~.
90°3
PLY CRACKS(a )
Figure 3, - Damage locot ion tf1rOUgrl the thickness of [±30/±30/~.o/9DJ s laminates f
,(
>.. .

CRACKSfN
-300
PLY
A ...
REPLICA SHOW ING+30h-30t NTERFACES
DElAM INATED(.a )
Figur~. 4.- Delanllnations in

Z
5.5-
_+30 t Eo = 14.5
-30 --_ y3.5- APPROXIMATE
+30 SOLUTION\ '-FINITE
/h -30 _ / ELEMENT
1.5-90
• 5 _
0 _90-10 0 10 20 30
az, GPa
Figure 5,- Through-thickness O-z distribution at edge of[-+30/+-30/90/9-0]s laminate,
= o. GPa 15-
10 - ,--o IN 90o PLYx
.5- o AT-30190 INTERFPZ
0
-5 - I I I I I i i
14 12 I0 8 6 4 2 0
b-yh
Figure 6,- Through-width distributions of (7x and c7z near the edge,

/
I \.a..JI-b--!
/
PARTIALLYDELAM INATED
(c) -
/
TOTALLYDELAM INATED
(b)
[1II't-B/ f/
lAMINATED(a)
Figure 7.- Rule of mixtures analysis of stiffness loss.

fE2
-
t
-
[+30/+30/90/90J5
GRAPHITE/EPOXY LAMINATE
EO E1 -E2 ~3
E
Figure -S.- Delamination size and stiffnessdataaccumu!ati-on during Quasi-stati-e loading.

-_ I_r3L(a) STIFFNESS (b) DELAMINATED (¢) DELAMINATION
MEASURED AREAMEASURED SIZE CALCULATED
Figure 9,-Iilustration of strip delamination approximation,

1.0
.8 •
_, FOURSPECIMENS
6-E
_- E-q 0
.4 -
.2
I _ I I
0 .2 .4 .6 .8 1.0a
b
Figure 10,- Stiffness as a function of delam.ination size,

GTOTAL= GI + GTr1.0
__oL I !11I1.11]!1III I.LII II)
GI r-'-r-TI3q]]l I I I I ! I ITI I I I I 900
l'_-' a--_ LAa =0.1aGFEM .5
G
GT_=O I I I I
0 .2 .4 .6 .8 1.0ab
Figure11,-Strainenergyreleaseratecomponentsfromfinlteelementanalysl.sas afunctian of delaminationsize,

•008-
•006 - '_
DATA_t0 \\_
O
_:c .004 - /_'0.._.__,.o J _
- _ 2Gc j
n=l n=2 n=3I I j
0 8 16 24
NUMBEROFPLIES
Figure 12,- Edgedelamination onset prediction comparedwith
_.[+45n/-45n/On/90n] (n = 1,2,3) data,S

T_O-5208 GRAPHITE EPOXYF _.n
il DATAFROM •FOURSPECIMENS •
.g • :I •
R-CURVE
.3o /
GR, KJ •m2 R• • G CU VES.2
.1-
0 f i ! I.2 .4 a ..6 8 1.0
b
Figure 13,- Delamination resistance curve (R-curve) for [+-30/+-30/90/_]s T500-5208graphite-epoxy laminates,
,__ ,_ • ,_ _

// J .da
1
a, mm i REGION
/o
, I , I , I _ 1 103O. 20 40 60 80x
CYCLES,N
Figure 14,- Typical plot of delaminationsize as afunction of toad cycles,

i, tI_ LINEAR •
10- _ I- REGION
5•
I I _ I I ! ' 8/ 1030 20 40 60 0 x
CYCLES,N
Figure15,-Typicalplotof staticstiffnesslossas afunctionof loadcycles,

-41×10 -
&
da _ cG P/_ dN max
-55x10 - A
DATAPOINT-_
N
da mm \\tiN, CYCLE - \A
(__
&MEAN
-5lxl0 , , , _ I , , , I
50 100 500G Jmax.-2
m
Figure 16 -Power law curve fit for d_g_oas a functlon of 6max' dN '

-4lxlO -
MEAN OFFOUR
DATAPOINTS da 13-_ =CGmax
-55x 10 - MEASUREMENT C I_
FROMSTIFFNESS AREA 1.38 × 10⁻¹¹ 3.11MEASUREMENTS-12
da mm STIFFNESS 2.56x 10 3.50dN ' CYCLE
FROMDELAMINATEDAREAMEASUREMENTS
1x 10⁻⁵ J _ i J I ! i _ I50 I00 ' 500
JGmax, 2
m
Figure 17,-Effectof delaminationmeasurementmethodon power lawcurve fit,

UNIFORMAXIALEXTENSIONAPPLIED .i-/"
zwX, U j \\\
E \o \
\
LAMINATECROSSSECTIONMODELED \z \
.11-t,,,, i.i,,,,,U = 0 I ] I. l I I ! I I I IIIIIIIII]IIIIIUt
v:o-- IL,IL IL''', " I I I I llll]llllllllltl 2- ! ! ! ] ! !!!!]!!!!!!!!!!_!_
_y/ /
W= 0 _ EIGNT-NODED,QUADRALATEP_L,ISOPARAMETRl-CELEMENTS
Figure 18,- Finite elementdiscretlzation of specimencross section,

--))
- j
CD (1) )
j b ;l f (...
crf c e)
(
\ \- I J..... -
~~a-1l~~--a +~a ·1
(u) AFTER EXTENS ION(a) BEfORE EXTENSION
~ - .-,-CD en
\ b d fO" .. ~ Jr
1 )
c ~
~l
~
~L.,- - -"" -
y,v
z, w
~ x,u
Figure 19.- Virtual crack extension technique used to calculatestrain energy release rates.

SU BLAMINATES
(a) OBSERVED
DELAMINATIONFRONT
PLY CRACKx
z~Yx
z~Y
Figure 20.- Approximate model Df Qbserveddamage.

R.O.M. EQUATION1.0 WITHOUTCOUPLING
FINITEELEMENT
ROMEQUATION
•6 WITH COUPLINGE
co ELAM
•4 [ +_301+3019019-0]S-30/90 INTERFACESDELAMINATED
.2
i I I I
0 .2 .4 .6 .8 1.0ab
Figure 21,- Effect of coupling, on stiffness loss prediction,

[ +30/+30/901_]s LAMINATE
903
K1.2
• m1.0 m DATAFROM3 TESTS
'_ 8_o •
K,mm .6 PREDICTEDSATURATION K
.4 SPACINGSK
.29o3
I j I I
0 .2 .4 .6 .8 1.0a
Figure22,-NinetydegFeeply crockspocingos o functlonofde1ominotionsize,

[±30/+30/90/90J LAMI NAiEs
F "I I\ \
I II n A .-II1II( II \I --'II UV v , v •
\)
F
0\.o
o = f(x) FROM SALURATION SPACING MODELx
Figure 23.- Estimate of stiffness loss from 90° ply cracks.

1. ReportNo. 2. GovernmentAccessionNo. 3. Recipient'sCatalogNo.
NASA TM-81940
4. Title and Subtitle 5. Report,Date
CHARACTERIZATION OF DELAMINATION ONSET AND GROWTH January 1981
IN A COMPOSITE LAMINATE 6. PerformingOrganization Code
7. ,_uthor(s) 8. Performing Orgamzation Report No.
T. Kevin O'Brien
10. Work Unit No.
9. Performing Organization Name and Address 506-53-23-05
NASA Langley Research Center '11.Contractor Grant No.Hampton, VA 23665
i3. Type of Report and Period Covered '
12. Sponsoring Agency Name and Address Technical Memorandum
141ArmyProjectNo.National Aeronautics and Space Administration
Washington, DC 20546
"i6. Supnlement_r'y Notes
Presented at the ASTM Symposium on Damage in Composite Materials: Basic
Mechanisms, Accumulation, Tolerance, and Characterization, Bal Harbour, Florida,
November 10-14, 1980.16. Abstract
The onset and growth of delaminations in unnotched [±30/±30/90/90] sgraphite-epoxy laminates is described quantitatively. These laminates, designed
to delaminate at the edges under tensile loads, were tested and analyzed. Delami-nation growth and stiffness loss were monitored nondestructively. Laminate
stiffness _ecreased linearly with delamination size. The strain energy releaserate, G, associated with delamination growth, was calculated from two analyses.
A critical G for delamination onset was determined, and then was used to predict
the onset of delaminations in [+45n/-45n/0n/90n]s (n=1,2,3) laminates. A delami-nation resistance curve (R-curve) was developed to characterize the observed
stable delamination growth under quasi-static loading. A power law co_relation
between G and delamination growth rates in fatigue was established.
17. Key Words (Suggested by Authoris)) 18. Distribution Statement
Graphite-epoxy Stiffness lossDelamination R-curve
Unclassified - UnlimitedPly cracking Fatigue
Rule of mixtures Growth law Subject Category 24Strai_ energy release rate
19. S_urity Classif.(ofthisreport) 1 20. SecurityClas_if.(ofthis _ge) 21. No. of Pages 221 Price"
Unclassified I Unclassified 60 A04
* For _le by the National Technical Information Se_ice, Springfield, Virginia 22161

_p
_P_J
J_

lm,7


![DERIVE - 1 [INTRODUCCIÓN AL USO DE DERIVE.]](https://img.pdfslide.net/doc/110x75/55cf9b20550346d033a4d7d4/derive-1-introduccion-al-uso-de-derive.jpg)