Embed Size (px)
Citation preview
Characterize populations and health outcomes
Project 4Multi-City Morbidity Study
Characterize daily pollutant mixtures
Sourceapportionment
Sourceapportionment
Examine impacts of air pollution mixtures on
acute severe morbidity
Examine impacts of air pollution mixtures on
acute severe morbidity
Examine and explain heterogeneity of
associations across cities
Examine and explain heterogeneity of
associations across cities
ED visitsED visits
Hospital admissionsHospital admissions
Sociodemographic and housing factorsSociodemographic
and housing factors
Conduct multi-city epidemiologic analysis
How and why do associations between air pollution mixtures and acute morbidity vary across cities?
SO4
NO3
NH4ECOC
metals
otherAtlanta
SO4
NO3
NH4EC
OC
metals
otherSt. Louis
Atmosphericmodeling (e.g., ROS)
Atmosphericmodeling (e.g., ROS)
Direct measurementsDirect measurements

Project 4 Study Team
• Stefanie Sarnat• Andrea Winquist• Mitch Klein• Lyndsey Darrow• Howard Chang• Jim Mulholland• Ted Russell• Paige Tolbert
• Joe Abrams• Mariel Friberg• Katie Gass• Brook Hixson• Jenna Krall• John Pearce• Cassie O’Lenick• Dongni Ye
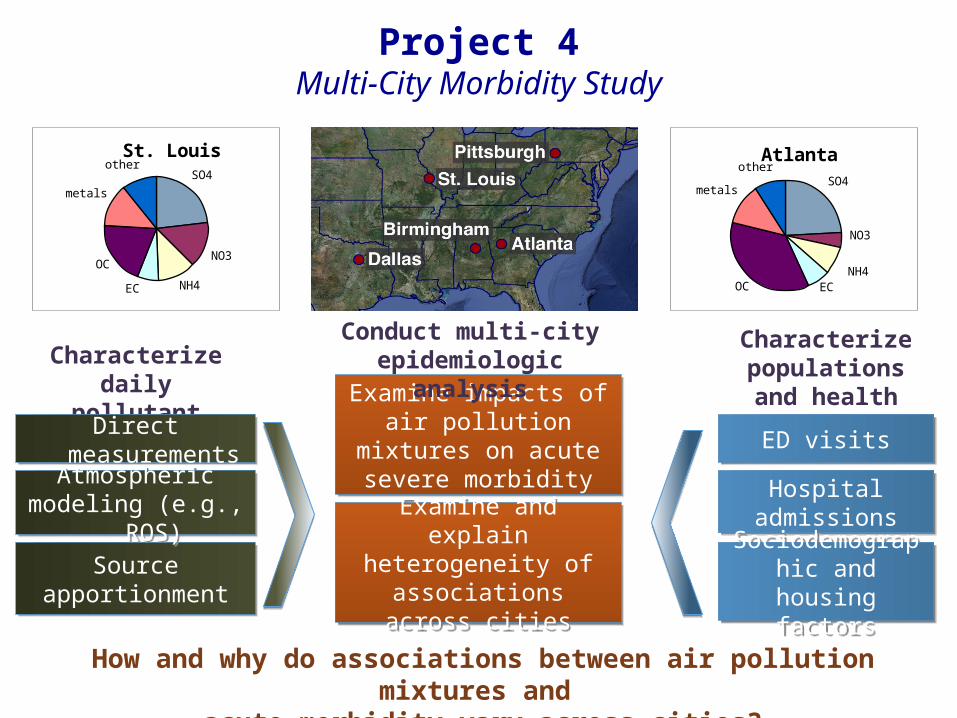
Outline
• Study status• 2013 SAC comments and response• Data and analysis progress
• Selected results presentations• SCAPE exposure metrics comparison• Effect modification of air pollution-asthma associations• Effect modification of air pollution-CVD associations
(Andrea Winquist)• PM2.5 sources and cardiovascular ED visits (Jenna Krall)
• Project 4 plans over coming year
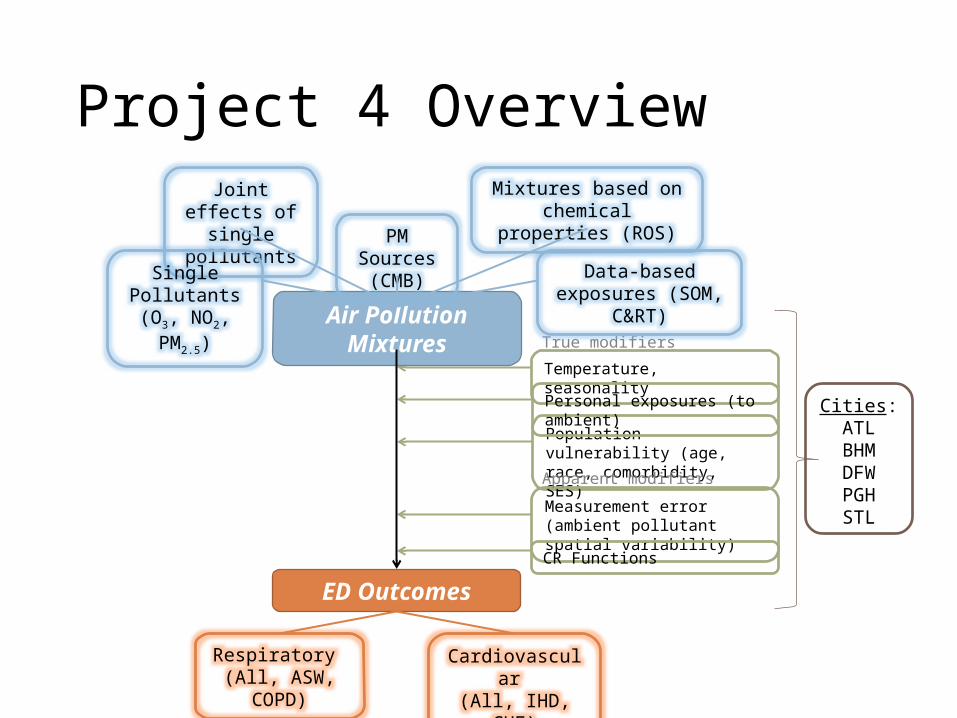
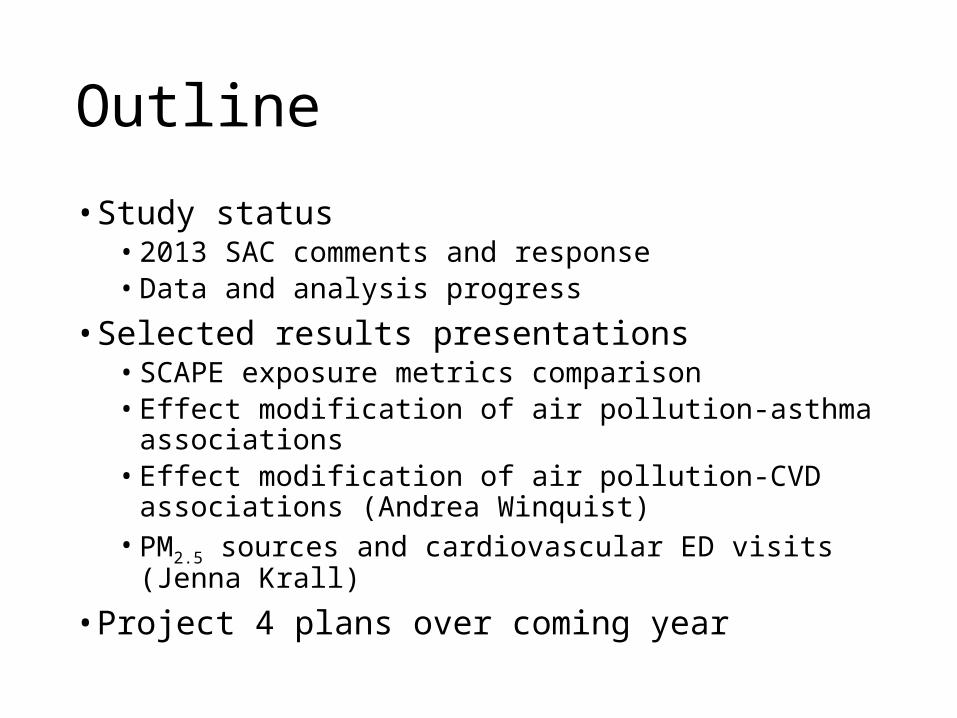
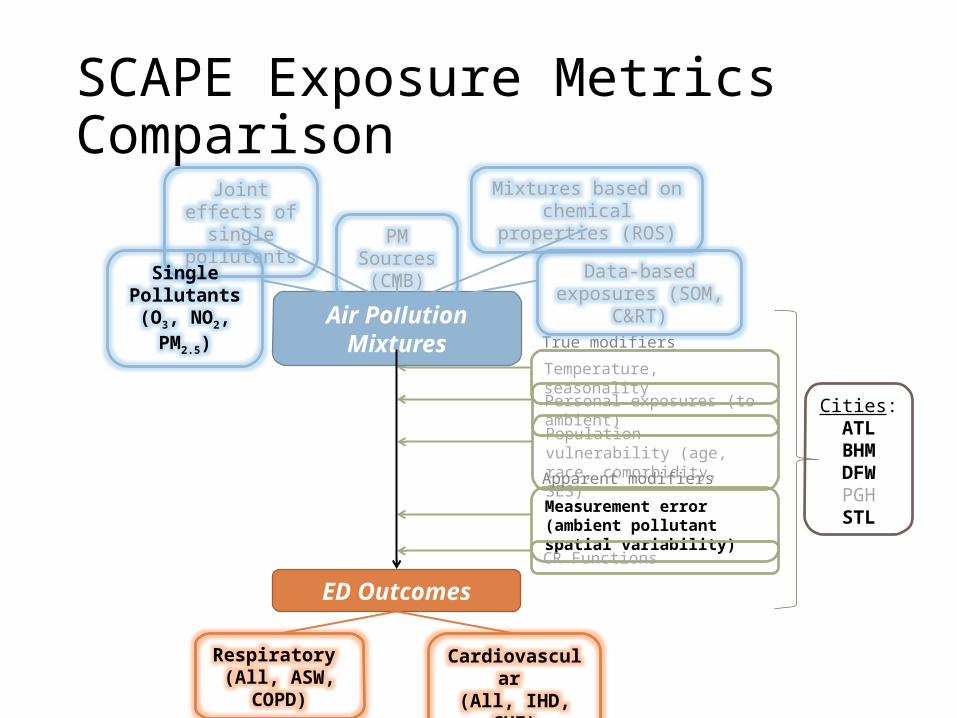
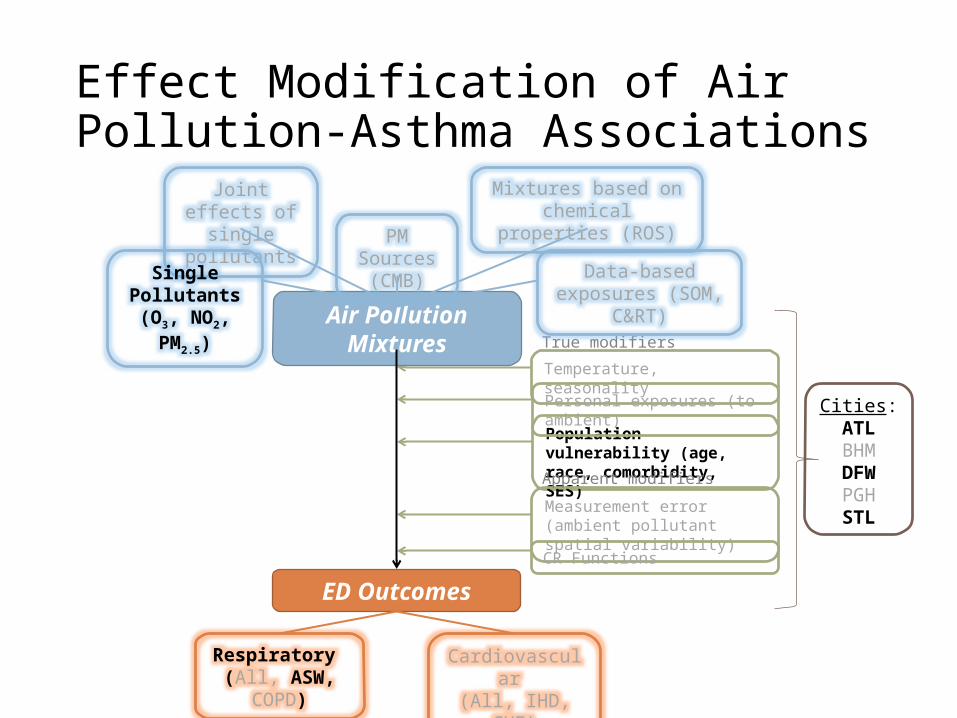
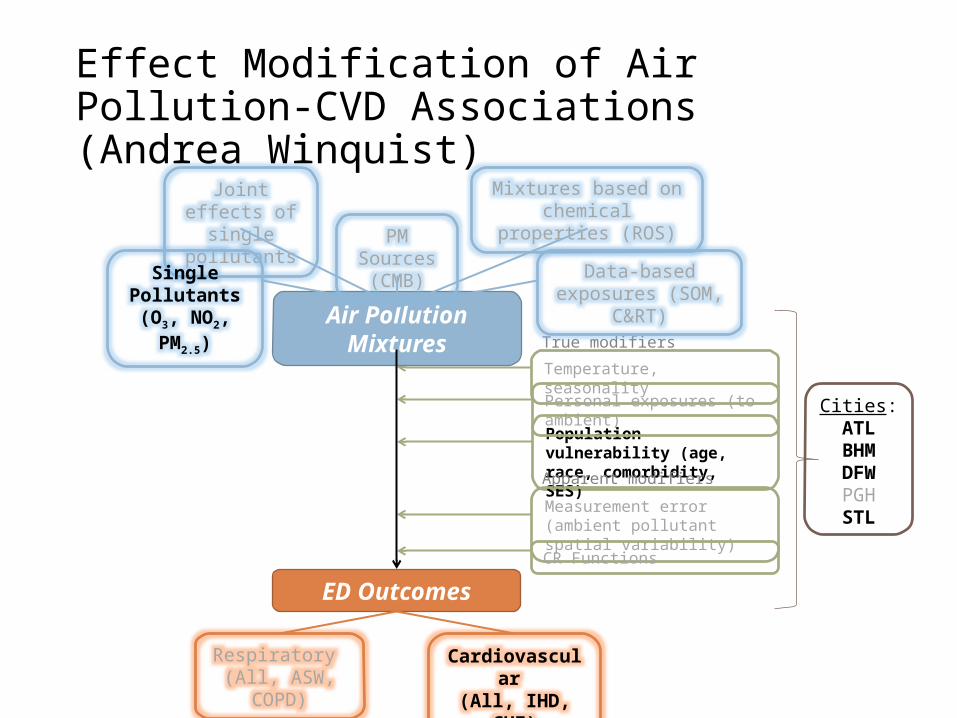
Population vulnerability (age, race, comorbidity, SES)
Temperature, seasonality
Measurement error (ambient pollutant spatial variability)
CR Functions
Personal exposures (to ambient)
True modifiers
Apparent modifiers
Cities:ATL
BHMDFWPGHSTL
Joint effects of single pollutants
Air Pollution Mixtures
ED Outcomes
Single Pollutants (O3, NO2, PM2.5)
Mixtures based on chemical properties (ROS)
Data-based exposures (SOM, C&RT)
Respiratory (All, ASW, COPD)
Cardiovascular (All, IHD, CHF)
PM Sources (CMB)
Project 4 Overview
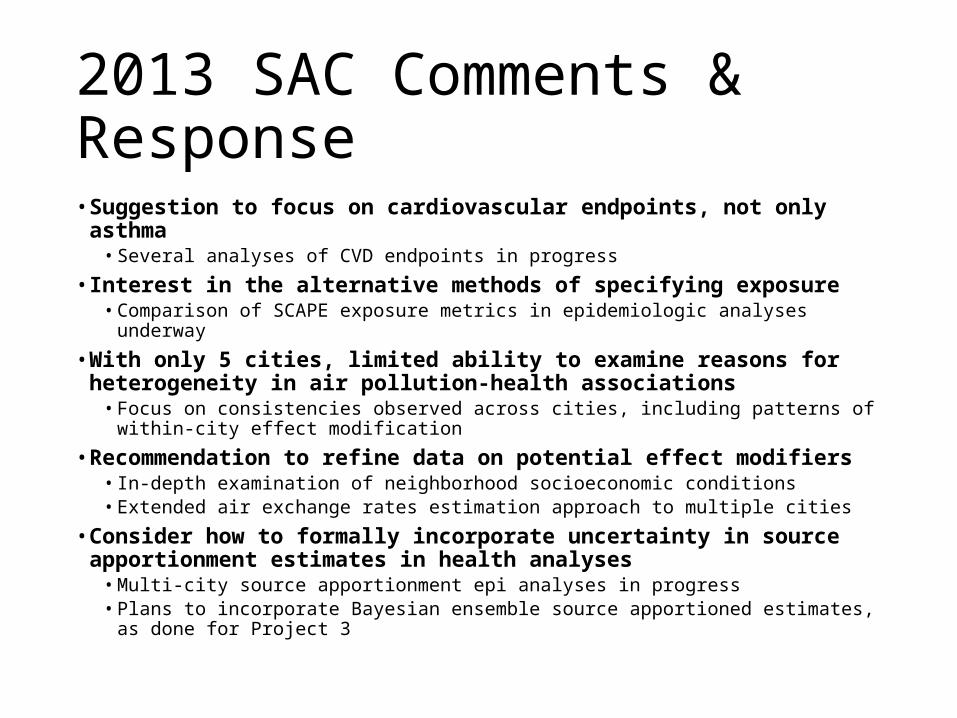
2013 SAC Comments & Response• Suggestion to focus on cardiovascular endpoints, not only asthma
• Several analyses of CVD endpoints in progress
• Interest in the alternative methods of specifying exposure• Comparison of SCAPE exposure metrics in epidemiologic analyses underway
• With only 5 cities, limited ability to examine reasons for heterogeneity in air pollution-health associations
• Focus on consistencies observed across cities, including patterns of within-city effect modification
• Recommendation to refine data on potential effect modifiers• In-depth examination of neighborhood socioeconomic conditions• Extended air exchange rates estimation approach to multiple cities
• Consider how to formally incorporate uncertainty in source apportionment estimates in health analyses
• Multi-city source apportionment epi analyses in progress• Plans to incorporate Bayesian ensemble source apportioned estimates, as done for
Project 3
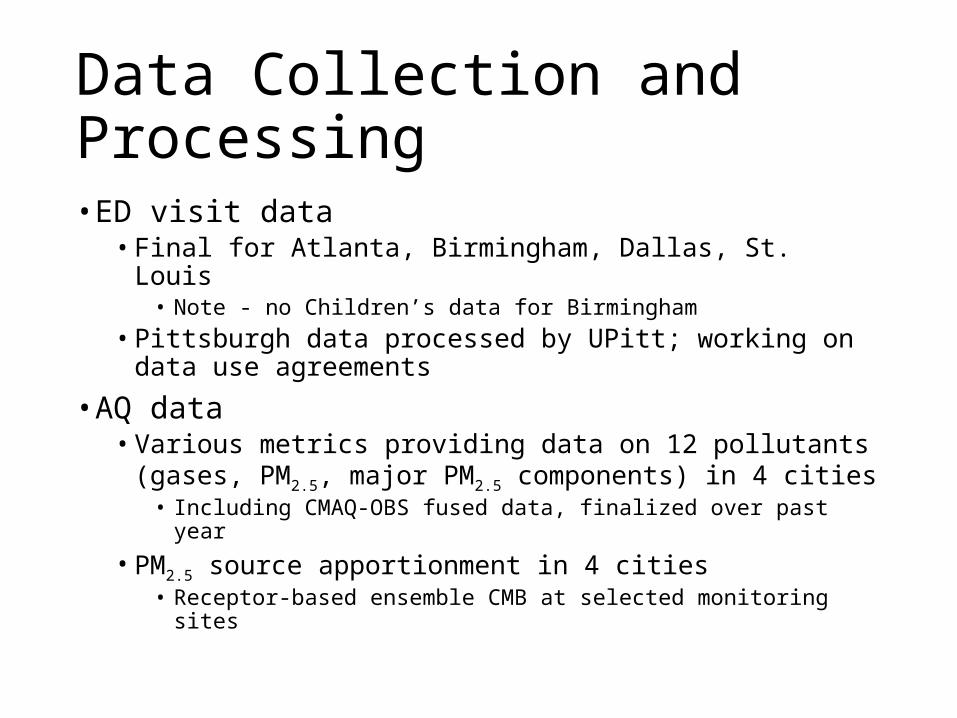
Data Collection and Processing• ED visit data
• Final for Atlanta, Birmingham, Dallas, St. Louis• Note - no Children’s data for Birmingham
• Pittsburgh data processed by UPitt; working on data use agreements
• AQ data• Various metrics providing data on 12 pollutants (gases,
PM2.5, major PM2.5 components) in 4 cities• Including CMAQ-OBS fused data, finalized over past year
• PM2.5 source apportionment in 4 cities• Receptor-based ensemble CMB at selected monitoring sites
Analysis Summary
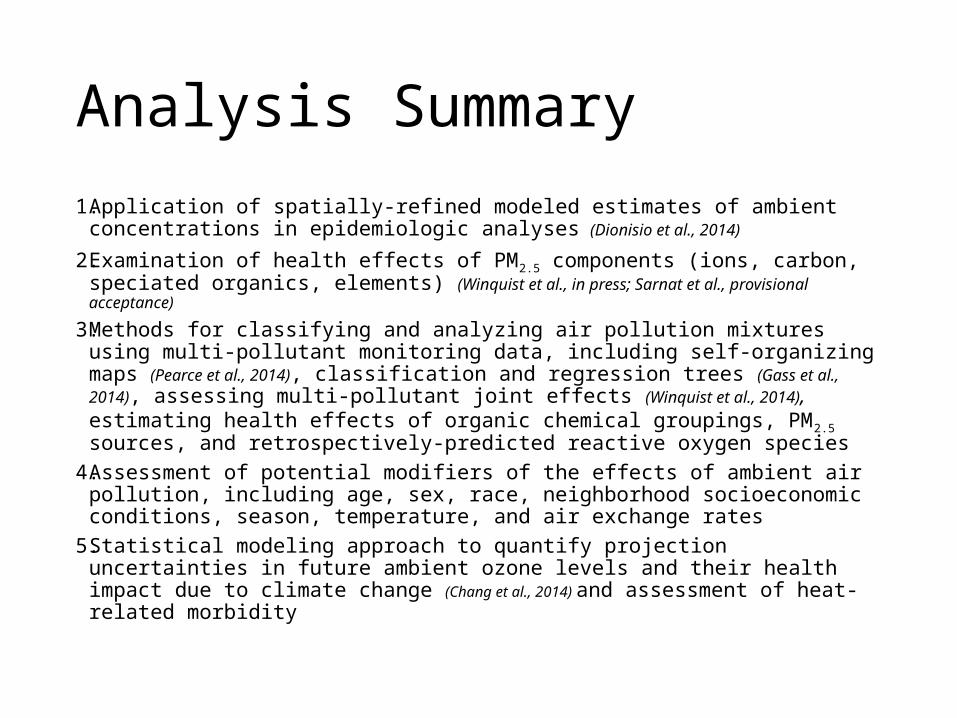
1. Application of spatially-refined modeled estimates of ambient concentrations in epidemiologic analyses (Dionisio et al., 2014)
2. Examination of health effects of PM2.5 components (ions, carbon, speciated organics, elements) (Winquist et al., in press; Sarnat et al., provisional acceptance)
3. Methods for classifying and analyzing air pollution mixtures using multi-pollutant monitoring data, including self-organizing maps (Pearce et al., 2014), classification and regression trees (Gass et al., 2014), assessing multi-pollutant joint effects (Winquist et al., 2014), estimating health effects of organic chemical groupings, PM2.5 sources, and retrospectively-predicted reactive oxygen species
4. Assessment of potential modifiers of the effects of ambient air pollution, including age, sex, race, neighborhood socioeconomic conditions, season, temperature, and air exchange rates
5. Statistical modeling approach to quantify projection uncertainties in future ambient ozone levels and their health impact due to climate change (Chang et al., 2014) and assessment of heat-related morbidity
Analysis Summary
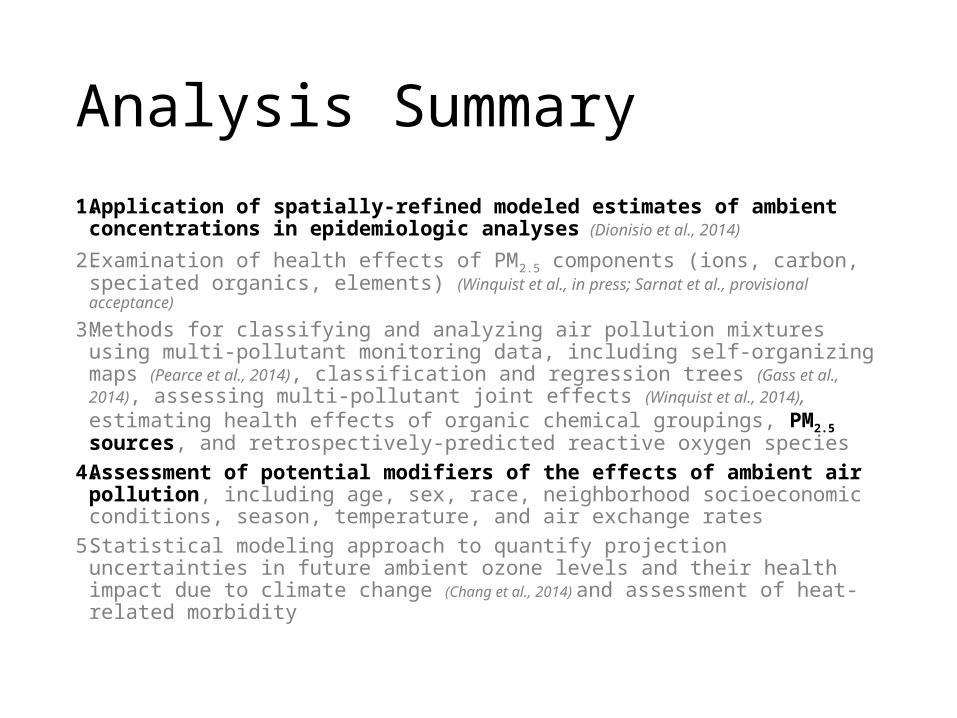
1. Application of spatially-refined modeled estimates of ambient concentrations in epidemiologic analyses (Dionisio et al., 2014)
2. Examination of health effects of PM2.5 components (ions, carbon, speciated organics, elements) (Winquist et al., in press; Sarnat et al., provisional acceptance)
3. Methods for classifying and analyzing air pollution mixtures using multi-pollutant monitoring data, including self-organizing maps (Pearce et al., 2014), classification and regression trees (Gass et al., 2014), assessing multi-pollutant joint effects (Winquist et al., 2014), estimating health effects of organic chemical groupings, PM2.5 sources, and retrospectively-predicted reactive oxygen species
4. Assessment of potential modifiers of the effects of ambient air pollution, including age, sex, race, neighborhood socioeconomic conditions, season, temperature, and air exchange rates
5. Statistical modeling approach to quantify projection uncertainties in future ambient ozone levels and their health impact due to climate change (Chang et al., 2014) and assessment of heat-related morbidity
Population vulnerability (age, race, comorbidity, SES)
Temperature, seasonality
Measurement error (ambient pollutant spatial variability)
CR Functions
Personal exposures (to ambient)
True modifiers
Apparent modifiers
Cities:ATL
BHMDFWPGHSTL
Joint effects of single pollutants
Air Pollution Mixtures
ED Outcomes
Single Pollutants (O3, NO2, PM2.5)
Mixtures based on chemical properties (ROS)
Data-based exposures (SOM, C&RT)
Respiratory (All, ASW, COPD)
Cardiovascular (All, IHD, CHF)
PM Sources (CMB)
SCAPE Exposure Metrics Comparison
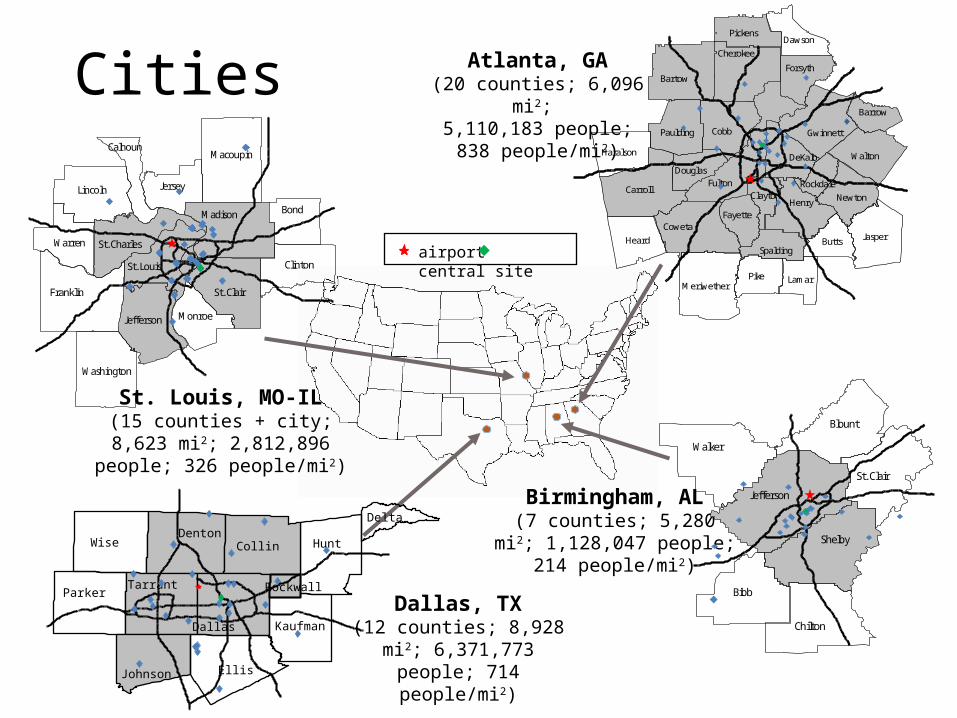
Cities
St. Louis, MO-IL(15 counties + city; 8,623 mi2;
2,812,896 people; 326 people/mi2)
Franklin
Lincoln
Jefferson
Washington
Warren
St. Louis
St. Charles
Macoupin
Madison
St. Clair
Bond
Clinton
Jersey
Monroe
Calhoun
airport central site
Dallas, TX(12 counties; 8,928 mi2; 6,371,773 people; 714
people/mi2)Ellis
HuntWise Collin
Dallas
Parker
Denton
Tarrant
Kaufman
Johnson
Delta
Rockwall
Birmingham, AL(7 counties; 5,280 mi2; 1,128,047 people; 214
people/mi2)Bibb
Jefferson
Shelby
Walker
Blount
Chilton
St. Clair
Atlanta, GA(20 counties; 6,096 mi2; 5,110,183 people; 838
people/mi2)
FultonCarroll
Bartow
Cobb
CowetaJasper
Henry
Pike
Heard
Gwinnett
Walton
Cherokee
Meriwether
DeKalb
Newton
Paulding
Butts
Forsyth
Haralson
Pickens
Lamar
Fayette
Dawson
Douglas
Barrow
Spalding
ClaytonRockdale
Background
• Lack of spatial representativeness of available monitoring data for large metropolitan areas considered here
• Monitored ambient concentrations not fully comparable across different metro areas
• Different numbers and placement of monitors
• AQ core developed a data fusion method to combine monitored observations and modeled CMAQ outputs
• Compare use of CMAQ-OBS with other SCAPE exposure assignment approaches in epidemiologic analyses
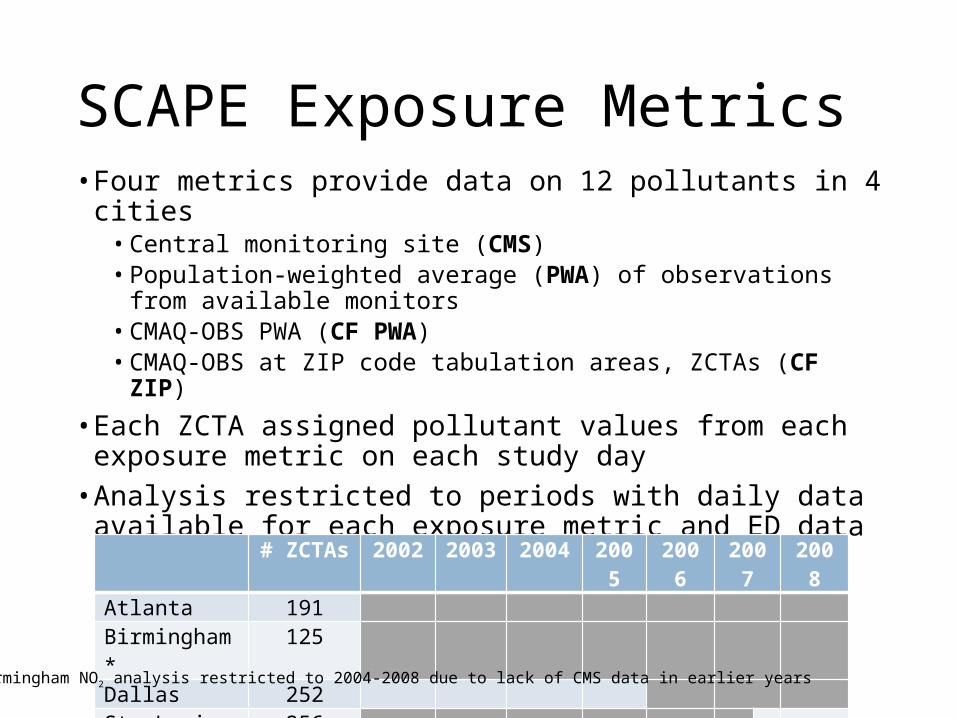
SCAPE Exposure Metrics• Four metrics provide data on 12 pollutants in 4 cities
• Central monitoring site (CMS)• Population-weighted average (PWA) of observations from
available monitors• CMAQ-OBS PWA (CF PWA)• CMAQ-OBS at ZIP code tabulation areas, ZCTAs (CF ZIP)
• Each ZCTA assigned pollutant values from each exposure metric on each study day
• Analysis restricted to periods with daily data available for each exposure metric and ED data# ZCTAs 2002 2003 2004 2005 2006 2007 2008Atlanta 191Birmingham* 125Dallas 252St. Louis 256
*Birmingham NO2 analysis restricted to 2004-2008 due to lack of CMS data in earlier years
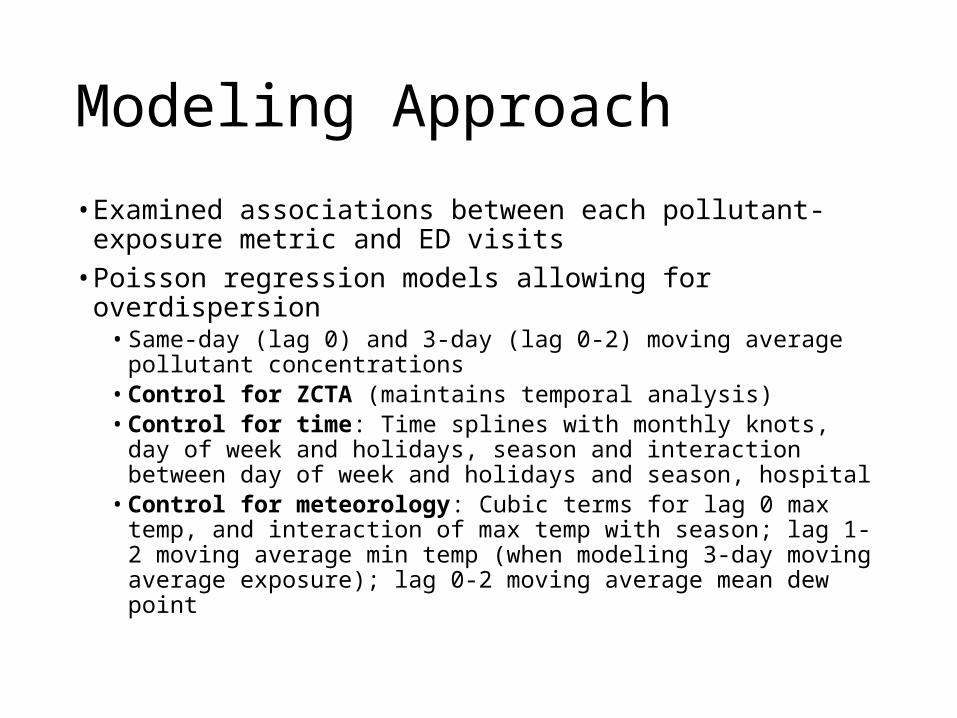
Modeling Approach
• Examined associations between each pollutant-exposure metric and ED visits
• Poisson regression models allowing for overdispersion• Same-day (lag 0) and 3-day (lag 0-2) moving average pollutant
concentrations • Control for ZCTA (maintains temporal analysis)• Control for time: Time splines with monthly knots, day of week
and holidays, season and interaction between day of week and holidays and season, hospital
• Control for meteorology: Cubic terms for lag 0 max temp, and interaction of max temp with season; lag 1-2 moving average min temp (when modeling 3-day moving average exposure); lag 0-2 moving average mean dew point
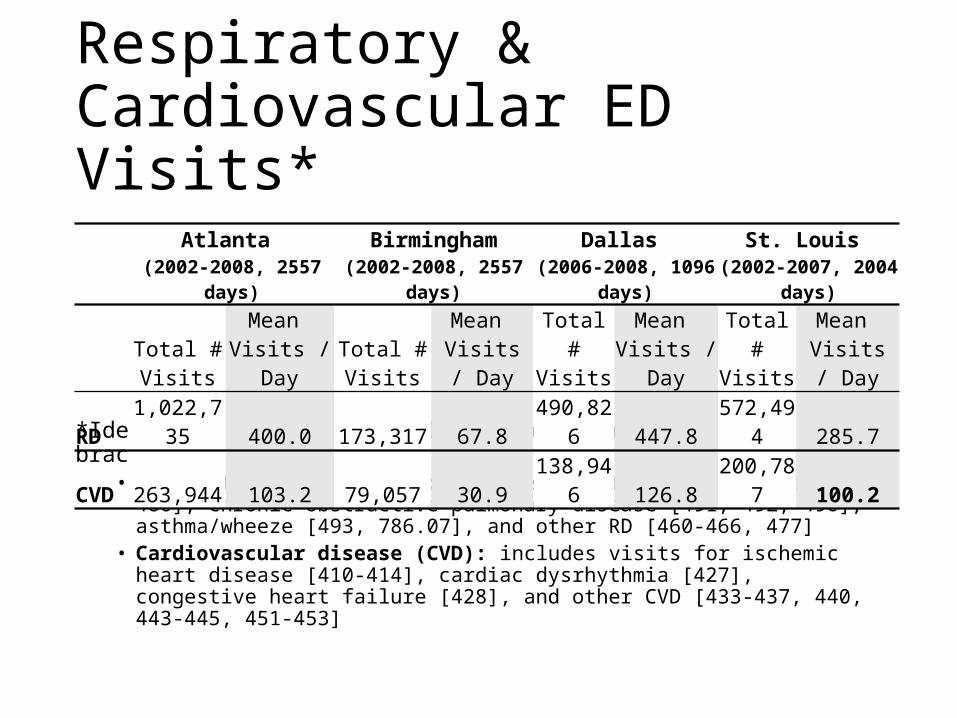
Respiratory & Cardiovascular ED Visits*
*Identified using primary ICD-9 codes [indicated in brackets]:• Respiratory disease (RD): includes visits for pneumonia [480-486], chronic
obstructive pulmonary disease [491, 492, 496], asthma/wheeze [493, 786.07], and other RD [460-466, 477]
• Cardiovascular disease (CVD): includes visits for ischemic heart disease [410-414], cardiac dysrhythmia [427], congestive heart failure [428], and other CVD [433-437, 440, 443-445, 451-453]
Atlanta (2002-2008, 2557 days)
Birmingham(2002-2008, 2557 days)
Dallas (2006-2008, 1096 days)
St. Louis (2002-2007, 2004 days)
Total # Visits
Mean Visits / Day
Total # Visits
Mean Visits / Day
Total # Visits
Mean Visits / Day
Total # Visits
Mean Visits / Day
RD 1,022,735 400.0 173,317 67.8 490,826 447.8 572,494 285.7CVD 263,944 103.2 79,057 30.9 138,946 126.8 200,787 100.2
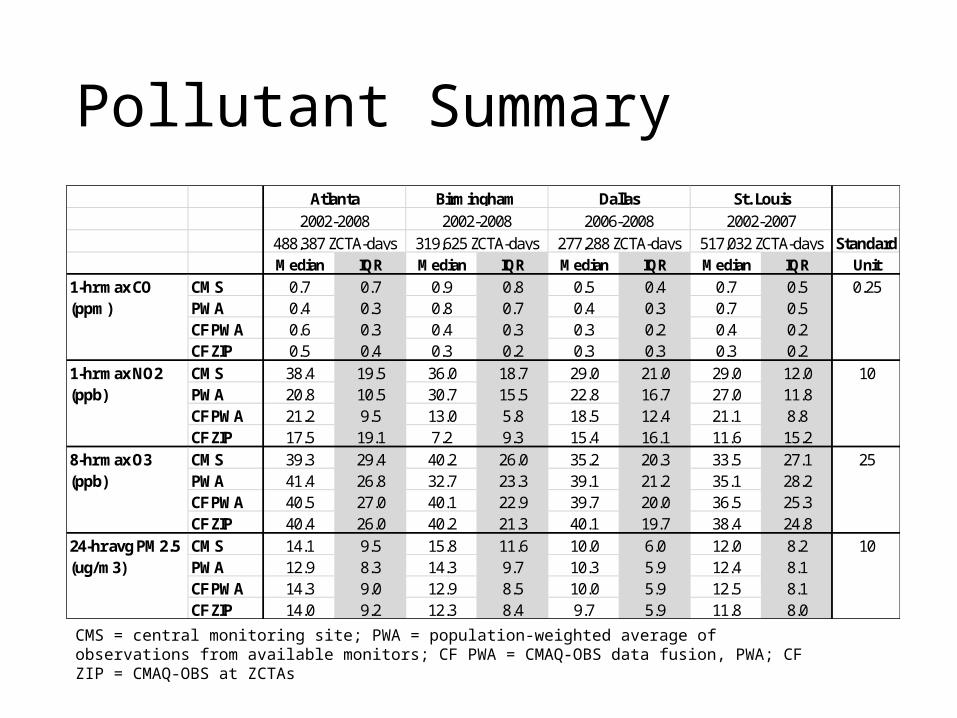
Pollutant Summary
StandardMedian IQR Median IQR Median IQR Median IQR Unit
CMS 0.7 0.7 0.9 0.8 0.5 0.4 0.7 0.5PWA 0.4 0.3 0.8 0.7 0.4 0.3 0.7 0.5CF PWA 0.6 0.3 0.4 0.3 0.3 0.2 0.4 0.2CF ZIP 0.5 0.4 0.3 0.2 0.3 0.3 0.3 0.2CMS 38.4 19.5 36.0 18.7 29.0 21.0 29.0 12.0PWA 20.8 10.5 30.7 15.5 22.8 16.7 27.0 11.8CF PWA 21.2 9.5 13.0 5.8 18.5 12.4 21.1 8.8CF ZIP 17.5 19.1 7.2 9.3 15.4 16.1 11.6 15.2CMS 39.3 29.4 40.2 26.0 35.2 20.3 33.5 27.1PWA 41.4 26.8 32.7 23.3 39.1 21.2 35.1 28.2CF PWA 40.5 27.0 40.1 22.9 39.7 20.0 36.5 25.3CF ZIP 40.4 26.0 40.2 21.3 40.1 19.7 38.4 24.8CMS 14.1 9.5 15.8 11.6 10.0 6.0 12.0 8.2PWA 12.9 8.3 14.3 9.7 10.3 5.9 12.4 8.1CF PWA 14.3 9.0 12.9 8.5 10.0 5.9 12.5 8.1CF ZIP 14.0 9.2 12.3 8.4 9.7 5.9 11.8 8.0
10
25
10
Atlanta Birmingham Dallas St. Louis
0.25
24-hr avg PM2.5 (ug/m3)
2002-2007517,032 ZCTA-days
8-hr max O3 (ppb)
1-hr max CO (ppm)
1-hr max NO2 (ppb)
488,387 ZCTA-days2002-2008 2002-2008
319,625 ZCTA-days2006-2008
277,288 ZCTA-days
CMS = central monitoring site; PWA = population-weighted average of observations from available monitors; CF PWA = CMAQ-OBS data fusion, PWA; CF ZIP = CMAQ-OBS at ZCTAs
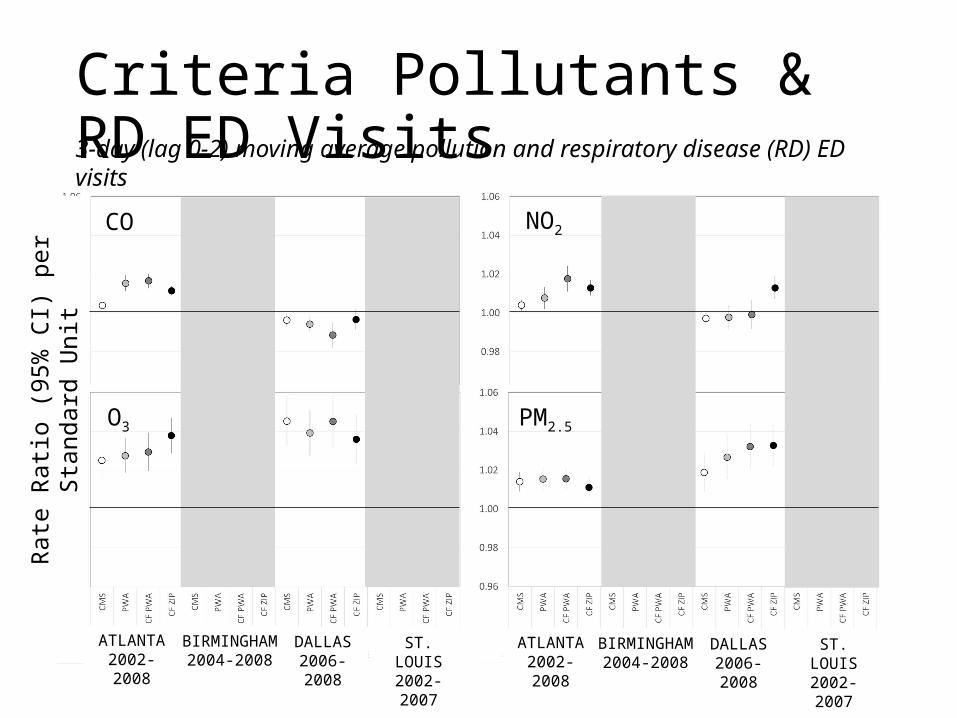
Criteria Pollutants & RD ED Visits
Rate
Rati
o (9
5% C
I) pe
r Sta
ndar
d U
nit
ATLANTA2002-2008
ST. LOUIS2002-2007
DALLAS2006-2008
BIRMINGHAM2004-2008
3-day (lag 0-2) moving average pollution and respiratory disease (RD) ED visits
ATLANTA2002-2008
ST. LOUIS2002-2007
DALLAS2006-2008
BIRMINGHAM2004-2008
CO NO2
O3 PM2.5
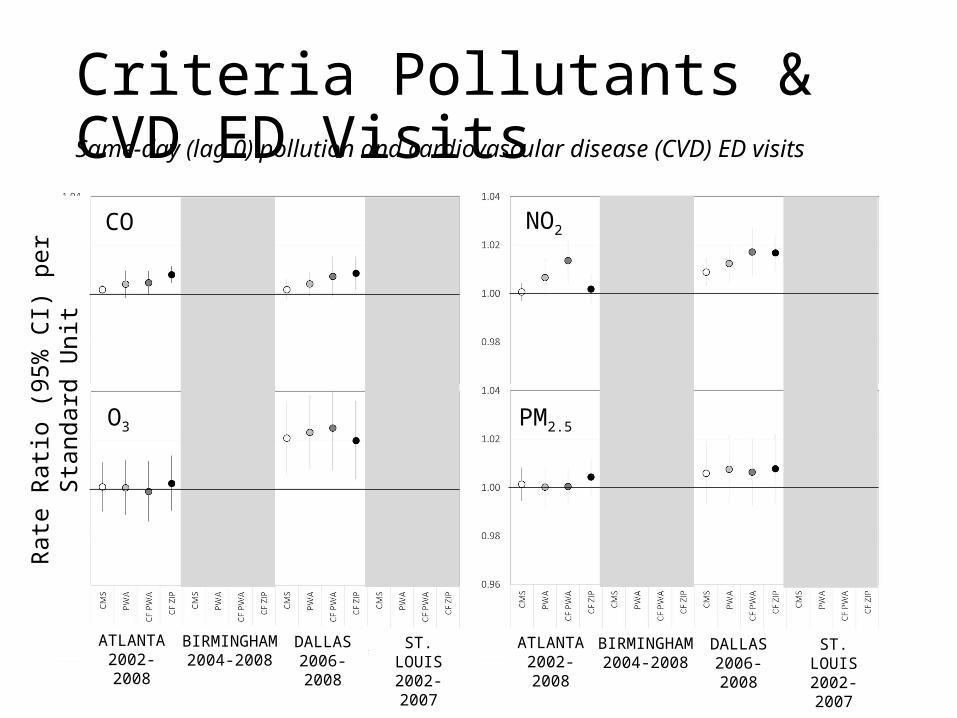
Criteria Pollutants & CVD ED VisitsSame-day (lag 0) pollution and cardiovascular disease (CVD) ED visits
ATLANTA2002-2008
ST. LOUIS2002-2007
DALLAS2006-2008
BIRMINGHAM2004-2008
ATLANTA2002-2008
ST. LOUIS2002-2007
DALLAS2006-2008
BIRMINGHAM2004-2008
CO NO2
O3 PM2.5
Rate
Rati
o (9
5% C
I) pe
r Sta
ndar
d U
nit
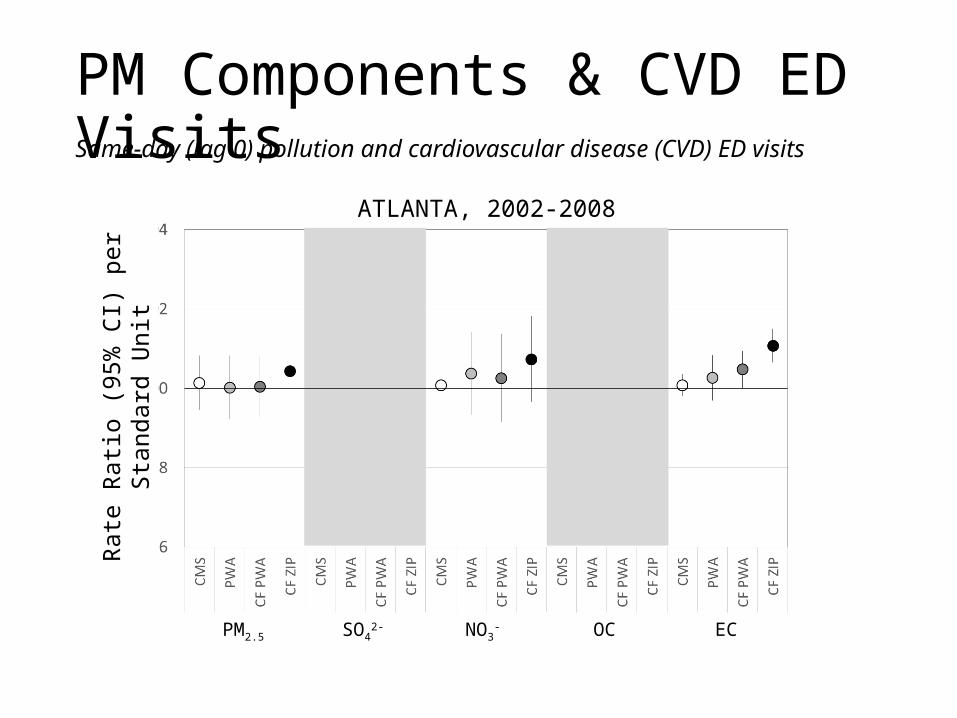
PM Components & CVD ED VisitsSame-day (lag 0) pollution and cardiovascular disease (CVD) ED visits
Rate
Rati
o (9
5% C
I) pe
r Sta
ndar
d U
nit
PM2.5 SO42- NO3
- OC EC
ATLANTA, 2002-2008
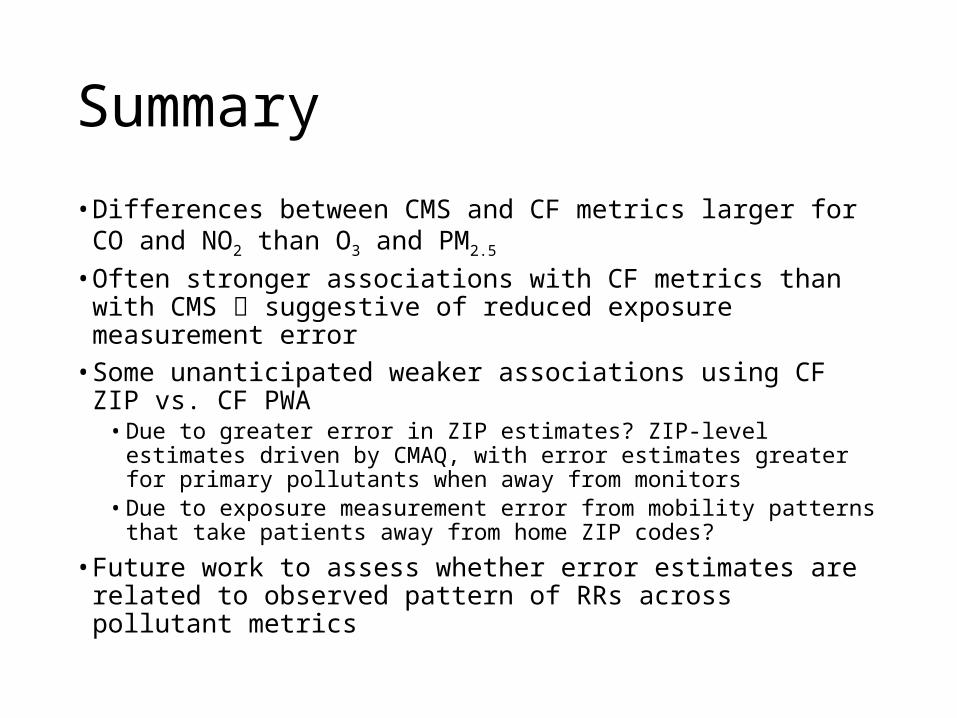
Summary
• Differences between CMS and CF metrics larger for CO and NO2 than O3 and PM2.5
• Often stronger associations with CF metrics than with CMS suggestive of reduced exposure measurement error
• Some unanticipated weaker associations using CF ZIP vs. CF PWA
• Due to greater error in ZIP estimates? ZIP-level estimates driven by CMAQ, with error estimates greater for primary pollutants when away from monitors
• Due to exposure measurement error from mobility patterns that take patients away from home ZIP codes?
• Future work to assess whether error estimates are related to observed pattern of RRs across pollutant metrics
Population vulnerability (age, race, comorbidity, SES)
Temperature, seasonality
Measurement error (ambient pollutant spatial variability)
CR Functions
Personal exposures (to ambient)
True modifiers
Apparent modifiers
Cities:ATL
BHMDFWPGHSTL
Joint effects of single pollutants
Air Pollution Mixtures
ED Outcomes
Single Pollutants (O3, NO2, PM2.5)
Mixtures based on chemical properties (ROS)
Data-based exposures (SOM, C&RT)
Respiratory (All, ASW, COPD)
Cardiovascular (All, IHD, CHF)
PM Sources (CMB)
Effect Modification of Air Pollution-Asthma Associations
Objectives• Strong associations of ozone and traffic-related
pollutants on asthma ED visits in Atlanta and other cities
• Examine potential within-city modification of air pollution-asthma associations
• Understanding of susceptible subpopulations• Are results any more/less consistent across cities within
defined strata?
• Modifiers considered• Age, sex, race (Brooke Hixson)• Neighborhood socioeconomic conditions (Cassie O’Lenick)
Methods
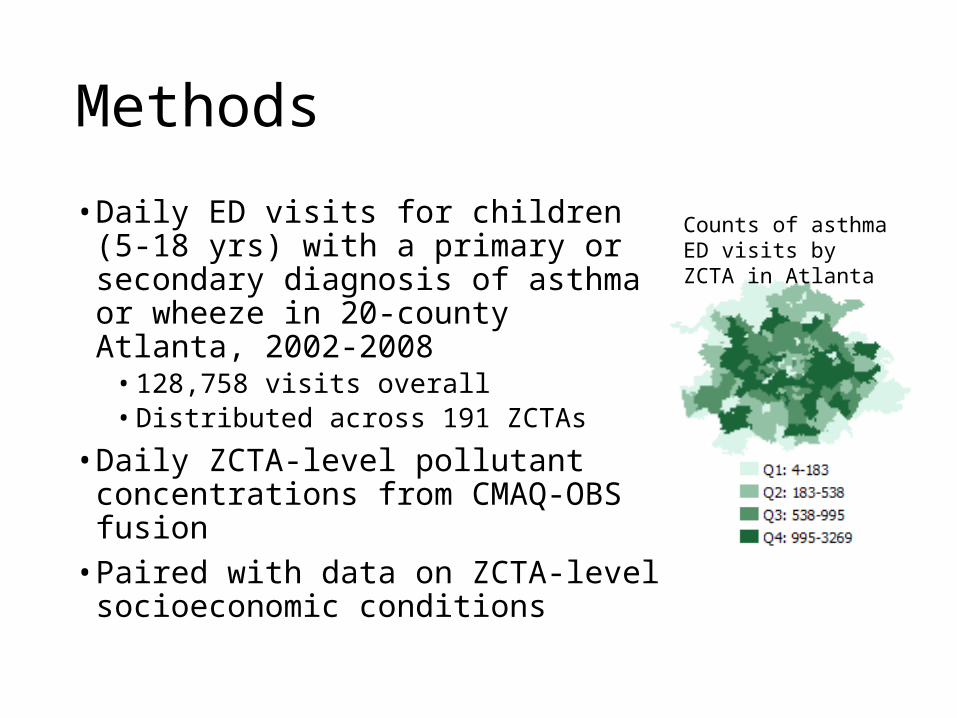
• Daily ED visits for children (5-18 yrs) with a primary or secondary diagnosis of asthma or wheeze in 20-county Atlanta, 2002-2008
• 128,758 visits overall• Distributed across 191 ZCTAs
• Daily ZCTA-level pollutant concentrations from CMAQ-OBS fusion
• Paired with data on ZCTA-level socioeconomic conditions
Counts of asthma ED visits by ZCTA in Atlanta
Socioeconomic Variables
• Acquired data from two sources to account for potential changes to neighborhood socioeconomic conditions over time
• Census 2000 data: assigned to 2002-2004 ED data• 2007-2011 ACS data: assigned to 2005-2008 ED data• Data from Geolytics, standardized to 2010 borders
• Selected variables describing different ZCTA level socioeconomic conditions:
• Education, income, poverty, wealth, working class, unemployment• Composite metrics (e.g., Townsend index of deprivation, Carstairs index,
neighborhood deprivation index, others)
• ZCTAs grouped into strata according to various definitions:• Deprivation area (yes/no), e.g.
• Undereducated area (≤25% of population with high school diploma)• Poverty area (≥20% of population living below the federal poverty line)
• Above/below median, 75th percentile, 90th percentile, or in quartiles of continuous SES variables
Modeling Approach
• Conditional logistic regression• Matching on day of week, month, and year of ED visit,
and ZCTA of patient residence• Additional control for time (spline with 2 knots per
year), meteorology, season, and hospital entry/exit• 3-day (lag 0-2) moving average pollutant concentrations
• Effect modification by ZCTA-level socioeconomic factors examined via stratification
• Here, focus on analyses considering poverty• Mean % below poverty in Atlanta ZCTAs = 13.2%, range
<5% to >45%
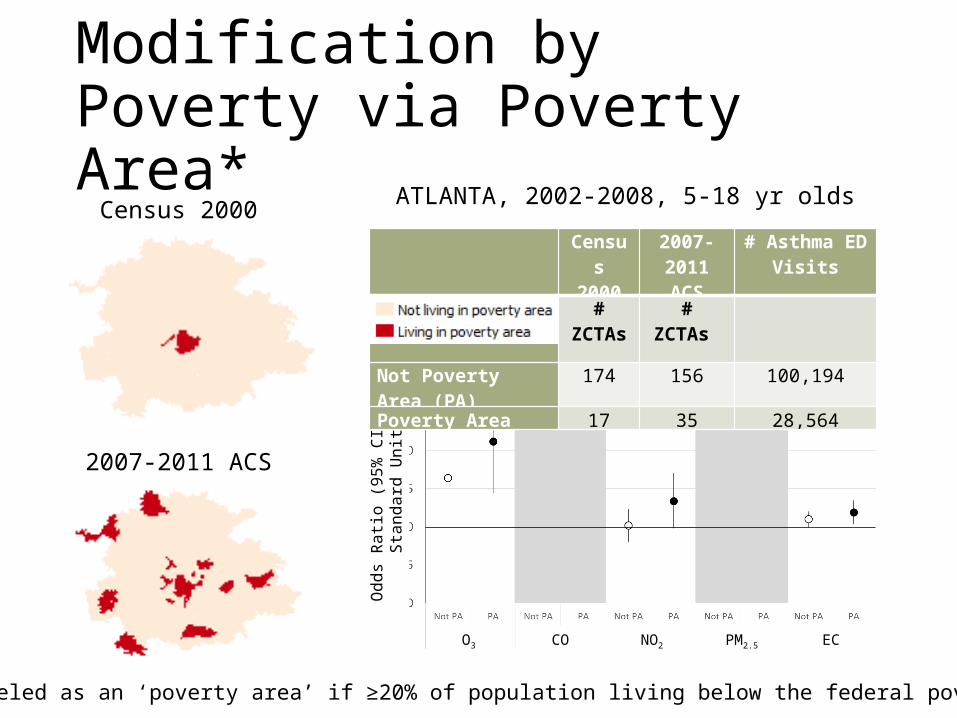
Modification by Poverty via Poverty Area*
O3 CO NO2 PM2.5 EC
*ZCTA labeled as an ‘poverty area’ if ≥20% of population living below the federal poverty line
Odd
s Ra
tio (9
5% C
I) pe
r Sta
ndar
d U
nit
Census 2000
2007-2011 ACS
# Asthma ED Visits
# ZCTAs # ZCTAs Not Poverty Area (PA) 174 156 100,194Poverty Area 17 35 28,564
Census 2000
2007-2011 ACS
ATLANTA, 2002-2008, 5-18 yr olds
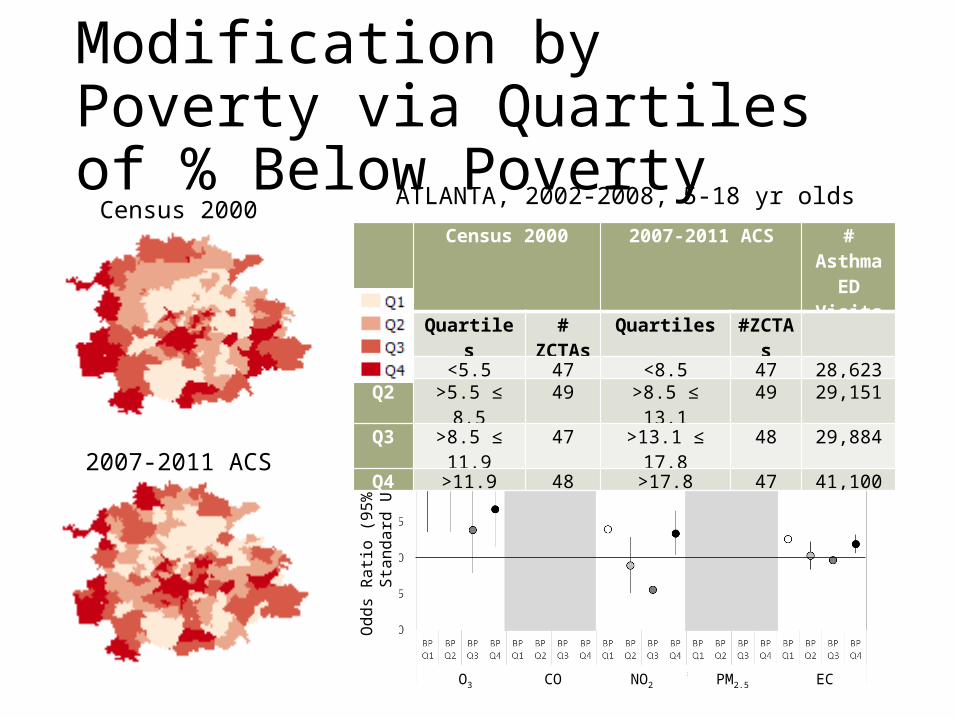
Modification by Poverty via Quartiles of % Below Poverty
O3 CO NO2 PM2.5 EC
Census 2000
2007-2011 ACS
Odd
s Ra
tio (9
5% C
I) pe
r Sta
ndar
d U
nit
Census 2000 2007-2011 ACS # Asthma ED Visits
Quartiles # ZCTAs Quartiles #ZCTAsQ1 <5.5 47 <8.5 47 28,623Q2 >5.5 ≤ 8.5 49 >8.5 ≤ 13.1 49 29,151Q3 >8.5 ≤ 11.9 47 >13.1 ≤ 17.8 48 29,884Q4 >11.9 48 >17.8 47 41,100
ATLANTA, 2002-2008, 5-18 yr olds
Summary
• Strong air pollution-asthma associations among 5-18 yr olds in Atlanta
• Associations generally stronger among patients living in commonly-designated ‘deprived’ areas based on poverty and education (not shown)
• Consistent u-shaped pattern of effect mod for % BP and most other SES metrics: strongest associations among patients living in Q1 (high SES) and Q4 (low SES) ZCTAs
• Observed for most pollutants, for different asthma outcome definitions, for both CF PWA and CF ZIP
• Examination of factors that may differ by SES may facilitate results interpretation, e.g., patient characteristics, ambient concentrations, etc.
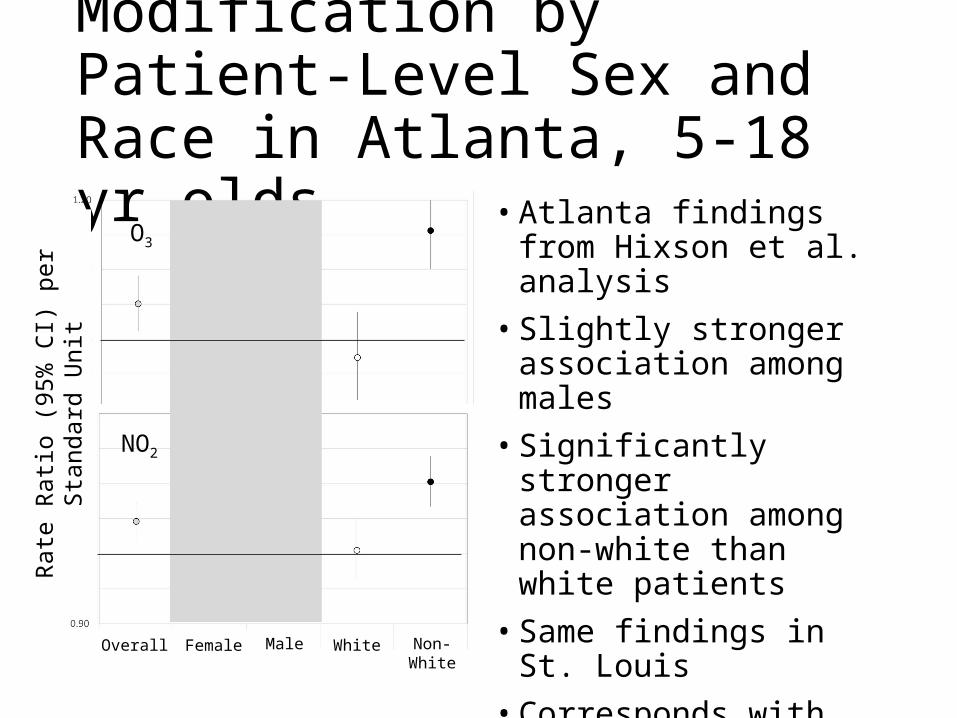
Modification by Patient-Level Sex and Race in Atlanta, 5-18 yr olds
• Atlanta findings from Hixson et al. analysis
• Slightly stronger association among males
• Significantly stronger association among non-white than white patients
• Same findings in St. Louis• Corresponds with Project 3
findings
Overall Female
Rate
Rati
o (9
5% C
I) pe
r Sta
ndar
d U
nit O3
NO2
Male White Non-White
Population vulnerability (age, race, comorbidity, SES)
Temperature, seasonality
Measurement error (ambient pollutant spatial variability)
CR Functions
Personal exposures (to ambient)
True modifiers
Apparent modifiers
Cities:ATL
BHMDFWPGHSTL
Joint effects of single pollutants
Air Pollution Mixtures
ED Outcomes
Single Pollutants (O3, NO2, PM2.5)
Mixtures based on chemical properties (ROS)
Data-based exposures (SOM, C&RT)
Respiratory (All, ASW, COPD)
Cardiovascular (All, IHD, CHF)
PM Sources (CMB)
Effect Modification of Air Pollution-CVD Associations (Andrea Winquist)
Air Pollution and Cardiovascular Disease• Daily ambient air pollutant concentrations have been found to be
associated with the daily number of hospitalizations and emergency department visits for cardiovascular diseases
• The strength of association has varied across geographic locations• Reasons for heterogeneity in the observed strength of association
are not clear; some potential reasons include:• Differences in population characteristics that may influence
susceptibility to cardiovascular effects of air pollution
• Differences in seasonality and meteorology
• Differences in pollutant mixtures
• Differences in factors influencing personal exposure to ambient air pollution
• Differences in measurement error
• Non-linear dose-response curves
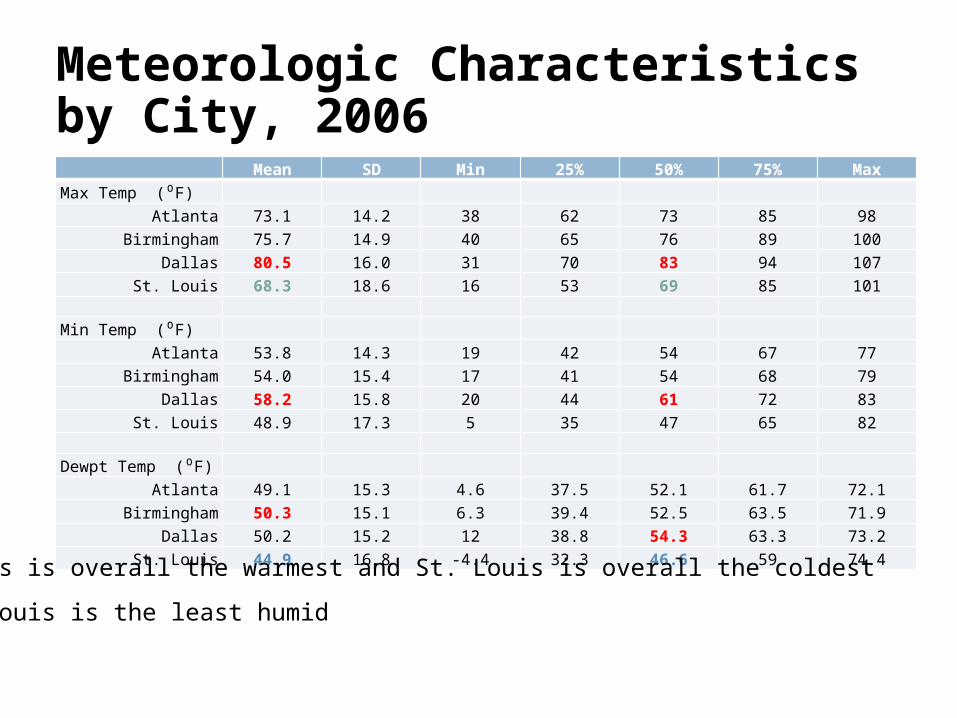
Meteorologic Characteristics by City, 2006 Mean SD Min 25% 50% 75% MaxMax Temp (⁰F)
Atlanta 73.1 14.2 38 62 73 85 98Birmingham 75.7 14.9 40 65 76 89 100
Dallas 80.5 16.0 31 70 83 94 107St. Louis 68.3 18.6 16 53 69 85 101
Min Temp (⁰F)Atlanta 53.8 14.3 19 42 54 67 77
Birmingham 54.0 15.4 17 41 54 68 79Dallas 58.2 15.8 20 44 61 72 83
St. Louis 48.9 17.3 5 35 47 65 82
Dewpt Temp (⁰F)Atlanta 49.1 15.3 4.6 37.5 52.1 61.7 72.1
Birmingham 50.3 15.1 6.3 39.4 52.5 63.5 71.9Dallas 50.2 15.2 12 38.8 54.3 63.3 73.2
St. Louis 44.9 16.8 -4.4 32.3 46.6 59 74.4
• Dallas is overall the warmest and St. Louis is overall the coldest
• St. Louis is the least humid
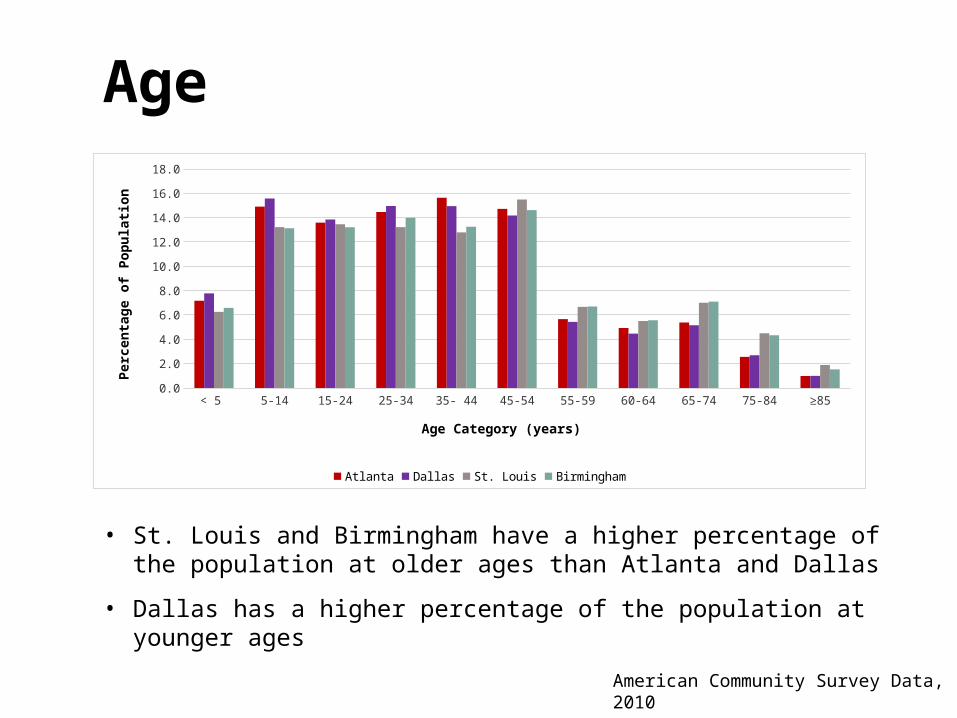
American Community Survey Data, 2010
• St. Louis and Birmingham have a higher percentage of the population at older ages than Atlanta and Dallas
• Dallas has a higher percentage of the population at younger ages
< 5 5-14 15-24 25-34 35- 44 45-54 55-59 60-64 65-74 75-84 ≥850.0
2.0
4.0
6.0
8.0
10.0
12.0
14.0
16.0
18.0
Atlanta Dallas St. Louis Birmingham
Age Category (years)
Perc
enta
ge o
f Pop
ulati
on
Age
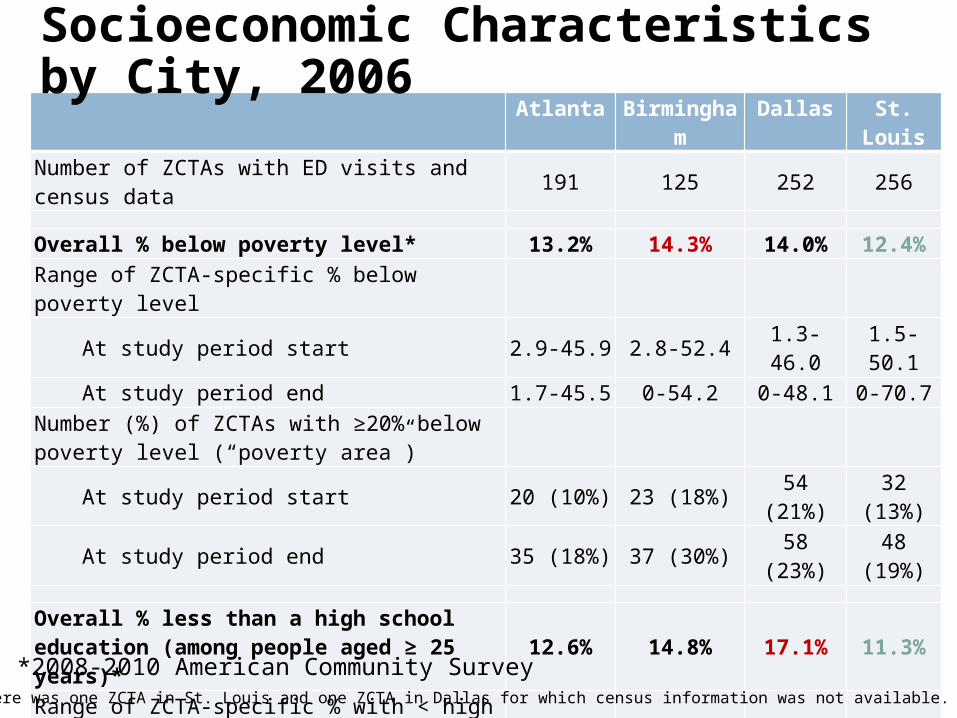
Atlanta Birmingham Dallas St. LouisNumber of ZCTAs with ED visits and census data 191 125 252 256
Overall % below poverty level* 13.2% 14.3% 14.0% 12.4%Range of ZCTA-specific % below poverty level
At study period start 2.9-45.9 2.8-52.4 1.3-46.0 1.5-50.1At study period end 1.7-45.5 0-54.2 0-48.1 0-70.7
Number (%) of ZCTAs with ≥20% below poverty level (“poverty area”)
At study period start 20 (10%) 23 (18%) 54 (21%) 32 (13%)At study period end 35 (18%) 37 (30%) 58 (23%) 48 (19%)
Overall % less than a high school education (among people aged ≥ 25 years)* 12.6% 14.8% 17.1% 11.3%
Range of ZCTA-specific % with < high school educationAt study period start 2.5-39.1 2.2-49.4 1.4-57.8 2.2-47.2At study period end 0.8-34.1 0.5-54.6 0-56.8 0-49.1
Number (%) of ZCTAs with ≥25% with < HS education (“low education area”)
At study period start 44 (23%) 65 (52%) 54 (21%) 49 (19%)At study period end 22 (12%) 31 (25%) 54 (21%) 21 (8%)
Note: There was one ZCTA in St. Louis and one ZCTA in Dallas for which census information was not available.
Socioeconomic Characteristics by City, 2006
*2008-2010 American Community Survey
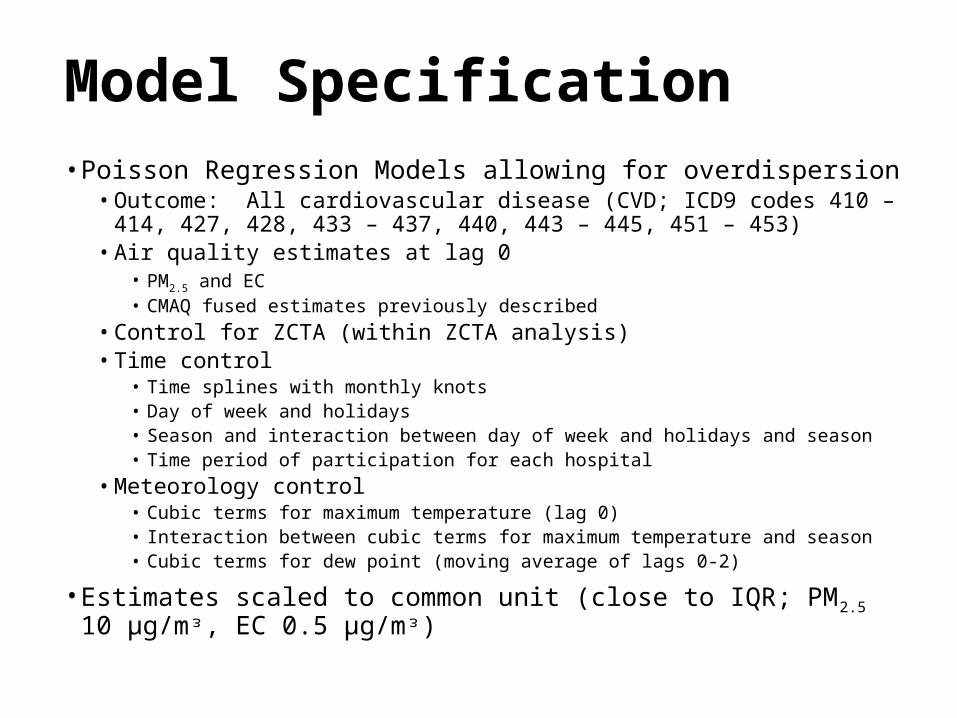
Model Specification• Poisson Regression Models allowing for overdispersion
• Outcome: All cardiovascular disease (CVD; ICD9 codes 410 – 414, 427, 428, 433 – 437, 440, 443 – 445, 451 – 453)
• Air quality estimates at lag 0• PM2.5 and EC• CMAQ fused estimates previously described
• Control for ZCTA (within ZCTA analysis)• Time control
• Time splines with monthly knots• Day of week and holidays• Season and interaction between day of week and holidays and season • Time period of participation for each hospital
• Meteorology control• Cubic terms for maximum temperature (lag 0)• Interaction between cubic terms for maximum temperature and season• Cubic terms for dew point (moving average of lags 0-2)
• Estimates scaled to common unit (close to IQR; PM2.5 10 μg/mᵌ, EC 0.5 μg/mᵌ)
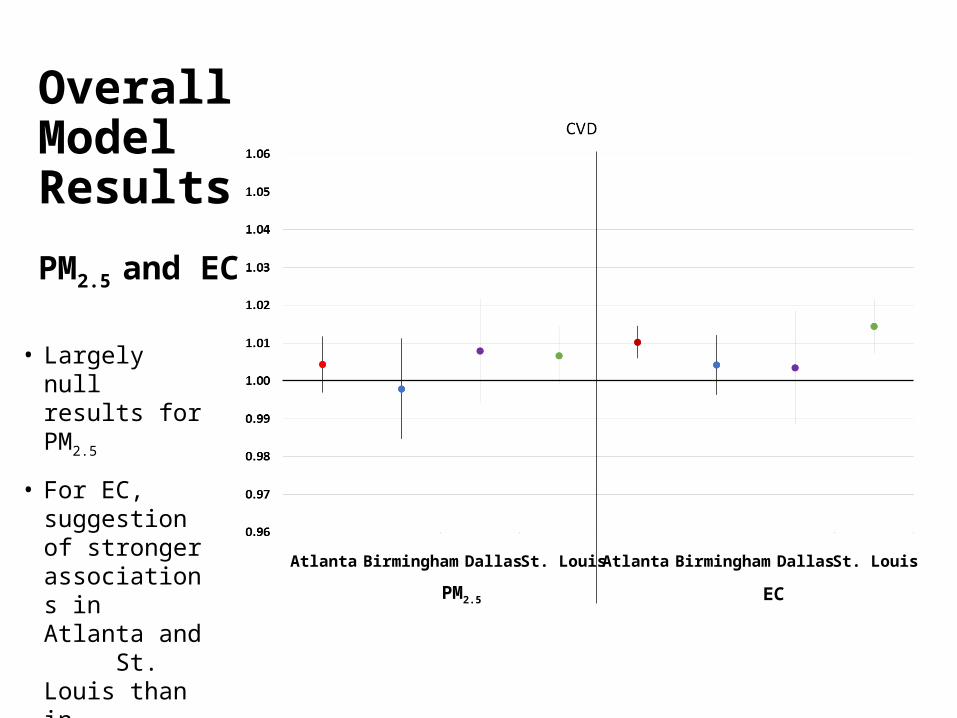
Overall Model Results
PM2.5 and EC
• Largely null results for PM2.5
• For EC, suggestion of stronger associations in Atlanta and St. Louis than in Birmingham and Dallas
Atlanta Birmingham Dallas St. Louis
PM2.5
Atlanta Birmingham Dallas St. Louis
EC
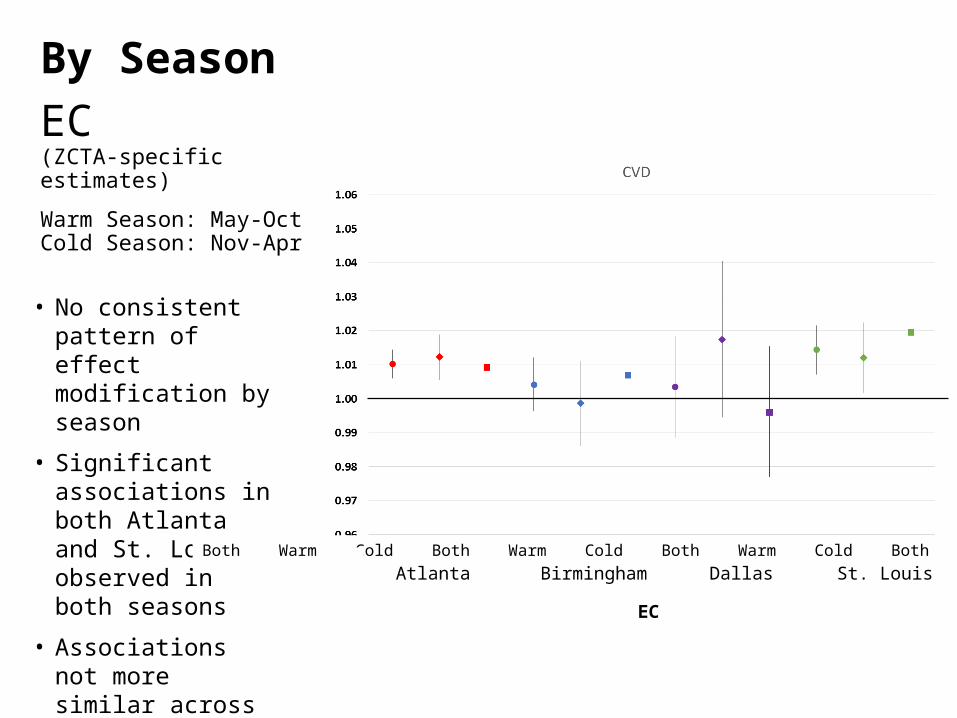
• No consistent pattern of effect modification by season
• Significant associations in both Atlanta and St. Louis observed in both seasons
• Associations not more similar across cities within season
By Season
EC(ZCTA-specific estimates)
Warm Season: May-Oct Cold Season: Nov-Apr
Atlanta Birmingham Dallas St. LouisBoth Warm Cold Both Warm Cold Both Warm Cold Both Warm Cold
EC
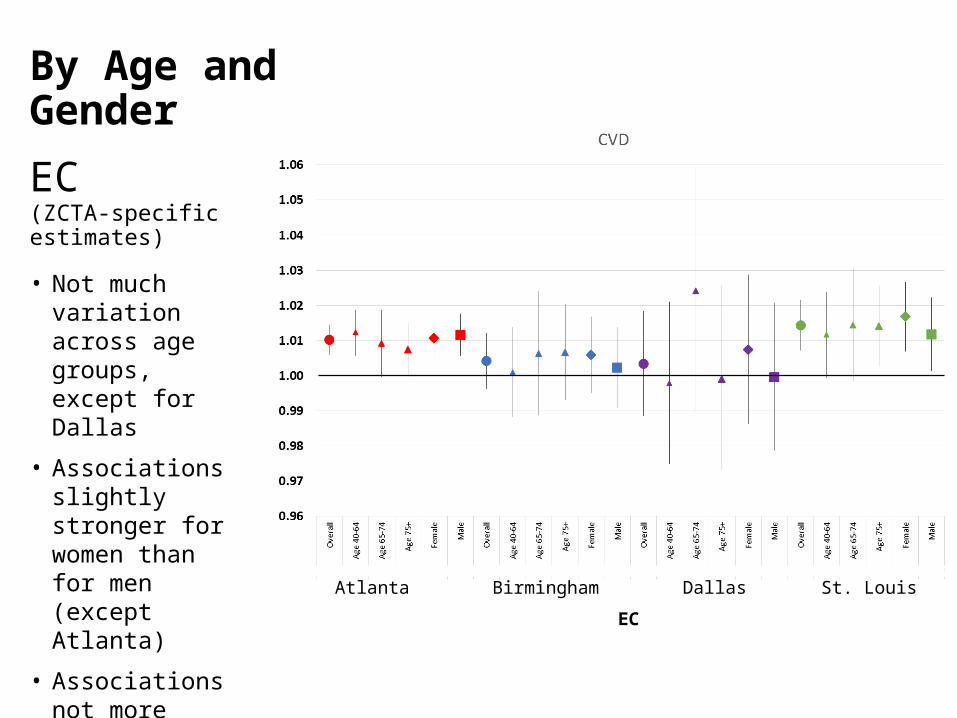
By Age and Gender
EC (ZCTA-specific estimates)• Not much variation
across age groups, except for Dallas
• Associations slightly stronger for women than for men (except Atlanta)
• Associations not more similar across cities within age and gender categories
Atlanta Birmingham Dallas St. Louis
EC
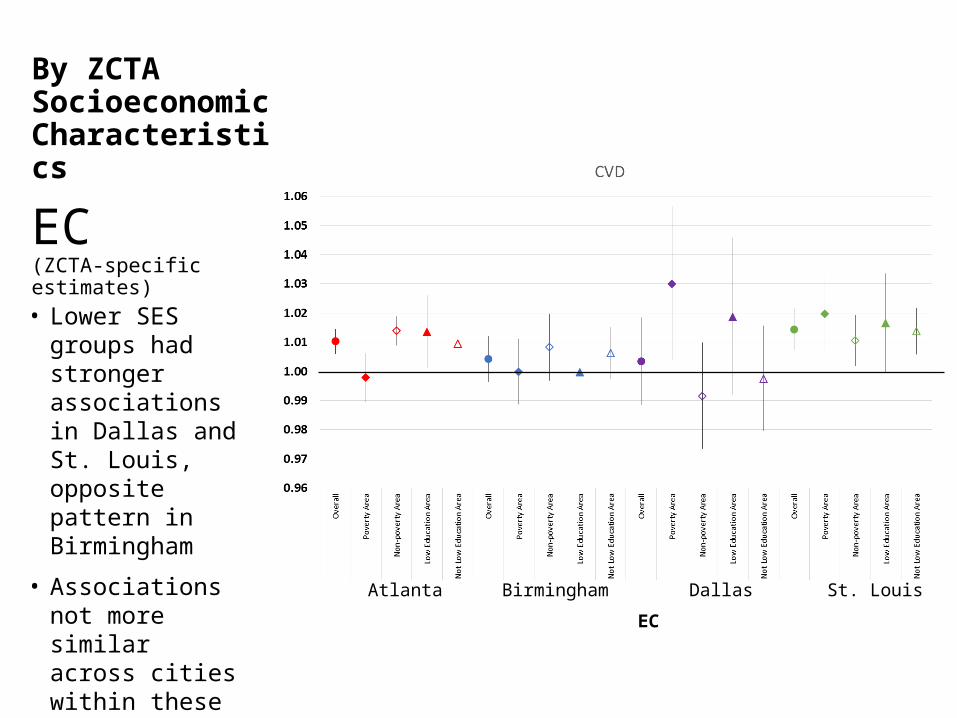
By ZCTA Socioeconomic Characteristics
EC(ZCTA-specific estimates)
Atlanta Birmingham Dallas St. Louis
• Lower SES groups had stronger associations in Dallas and St. Louis, opposite pattern in Birmingham
• Associations not more similar across cities within these SES categories
EC
Preliminary Conclusions• There are differences between the cities in age distribution,
SES, meteorology and pollutant levels
• For CVD, there is not a lot of variation across the cities in the strength of associations with PM2.5 and EC (generally weak associations overall), but statistically significant associations observed for EC in Atlanta and St. Louis
• There was no consistent evidence of effect modification of the association between CVD and EC
• These stratifications for this outcome and pollutant did not explain between-city heterogeneity (but there was not a lot of heterogeneity)
• Future analyses will consider specific types of cardiovascular outcomes and additional pollutants
Population vulnerability (age, race, comorbidity, SES)
Temperature, seasonality
Measurement error (ambient pollutant spatial variability)
CR Functions
Personal exposures (to ambient)
True modifiers
Apparent modifiers
Cities:ATL
BHMDFWPGHSTL
Joint effects of single pollutants
Air Pollution Mixtures
ED Outcomes
Single Pollutants (O3, NO2, PM2.5)
Mixtures based on chemical properties (ROS)
Data-based exposures (SOM, C&RT)
Respiratory (All, ASW, COPD)
Cardiovascular (All, IHD, CHF)
PM Sources (CMB)
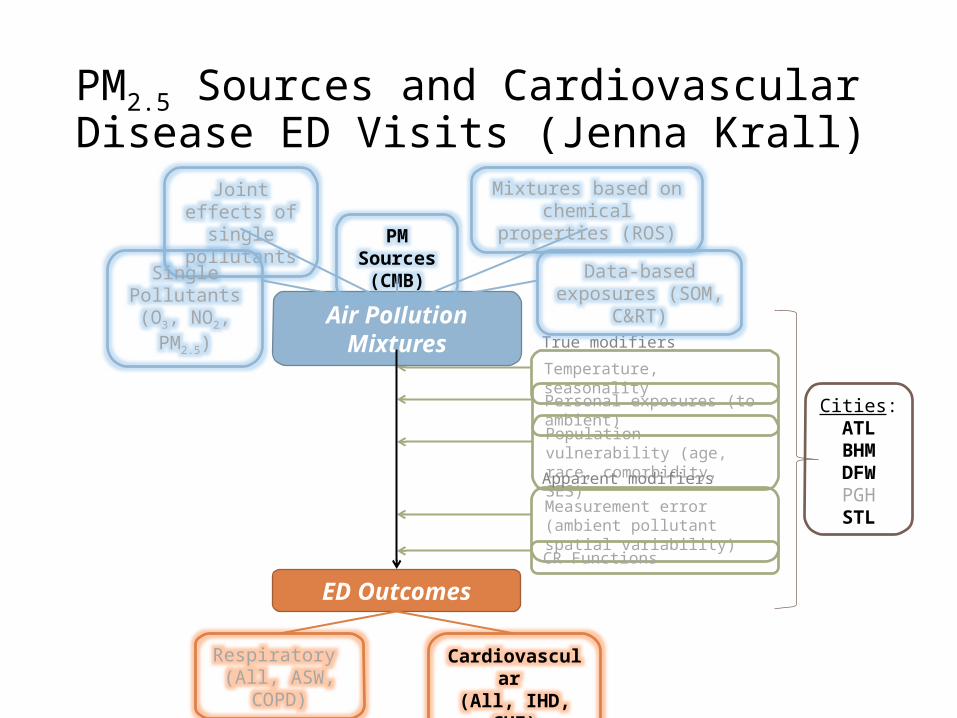
PM2.5 Sources and Cardiovascular Disease ED Visits (Jenna Krall)
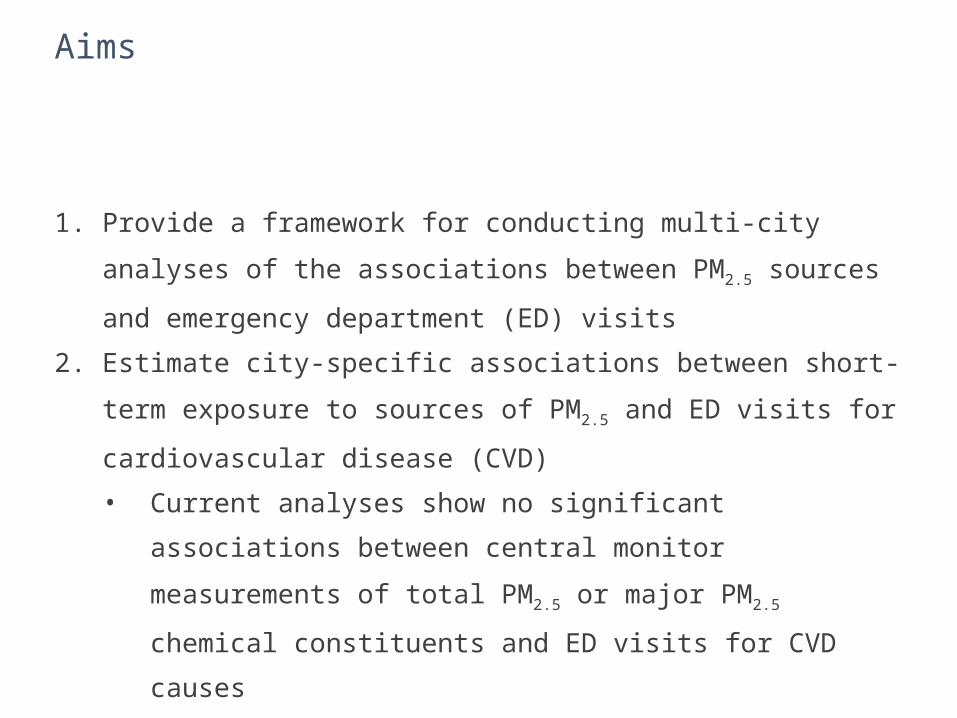
Aims
1. Provide a framework for conducting multi-city analyses of the
associations between PM2.5 sources and emergency department
(ED) visits
2. Estimate city-specific associations between short-term exposure to
sources of PM2.5 and ED visits for cardiovascular disease (CVD)
• Current analyses show no significant associations between
central monitor measurements of total PM2.5 or major PM2.5
chemical constituents and ED visits for CVD causes
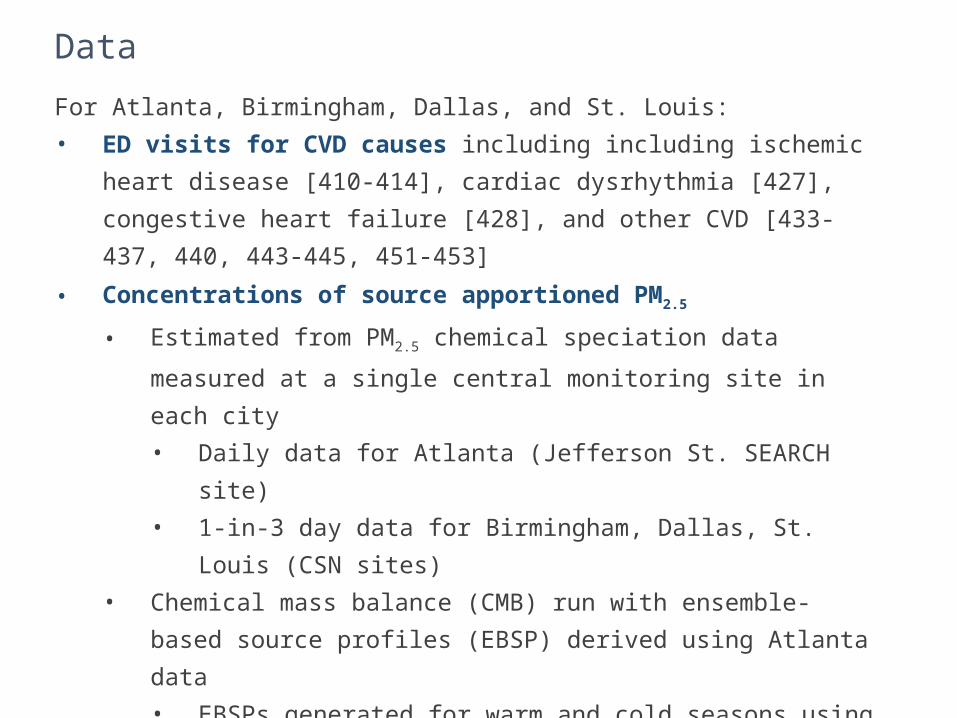
For Atlanta, Birmingham, Dallas, and St. Louis:
• ED visits for CVD causes including including ischemic heart disease
[410-414], cardiac dysrhythmia [427], congestive heart failure [428], and
other CVD [433-437, 440, 443-445, 451-453]
• Concentrations of source apportioned PM2.5
• Estimated from PM2.5 chemical speciation data measured at a single
central monitoring site in each city
• Daily data for Atlanta (Jefferson St. SEARCH site)
• 1-in-3 day data for Birmingham, Dallas, St. Louis (CSN sites)
• Chemical mass balance (CMB) run with ensemble-based source
profiles (EBSP) derived using Atlanta data
• EBSPs generated for warm and cold seasons using CMB with
molecular markers, CMB with gas constraints, positive matrix
factorization (PMF), and chemical transport model using CMAQ
• Sources vary across cities (e.g. no PM2.5 from metals in Atlanta)
• Total PM2.5 mass from central site monitors
Data
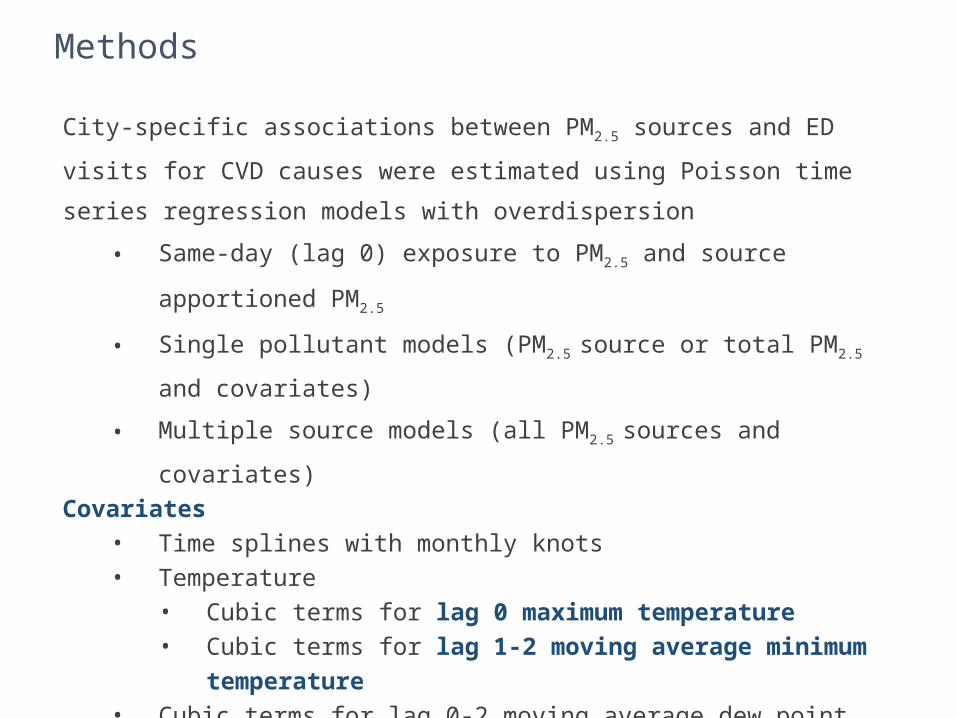
City-specific associations between PM2.5 sources and ED visits for CVD causes
were estimated using Poisson time series regression models with
overdispersion
• Same-day (lag 0) exposure to PM2.5 and source apportioned PM2.5
• Single pollutant models (PM2.5 source or total PM2.5 and covariates)
• Multiple source models (all PM2.5 sources and covariates)
Covariates• Time splines with monthly knots• Temperature
• Cubic terms for lag 0 maximum temperature• Cubic terms for lag 1-2 moving average minimum temperature
• Cubic terms for lag 0-2 moving average dew point temperature• Indicator variables for season, day of week, holidays, hospitals• Interaction terms between season and maximum temperature and
season and day of week/holidays
Methods
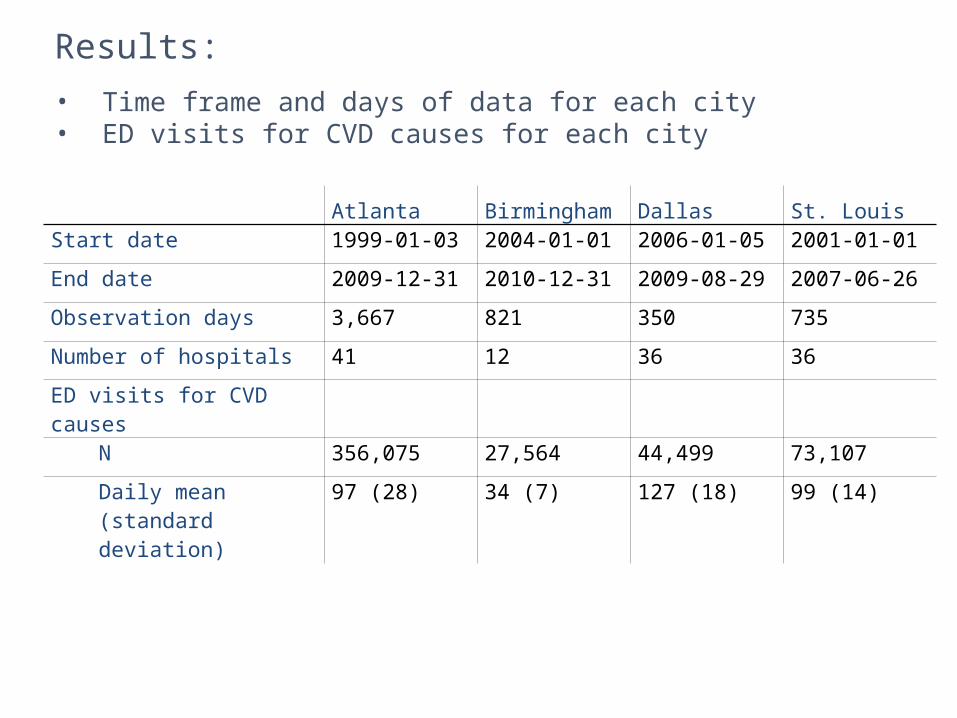
Atlanta Birmingham Dallas St. LouisStart date 1999-01-03 2004-01-01 2006-01-05 2001-01-01
End date 2009-12-31 2010-12-31 2009-08-29 2007-06-26
Observation days 3,667 821 350 735
Number of hospitals 41 12 36 36
ED visits for CVD causes
N 356,075 27,564 44,499 73,107
Daily mean (standard deviation)
97 (28) 34 (7) 127 (18) 99 (14)
Results:
• Time frame and days of data for each city• ED visits for CVD causes for each city
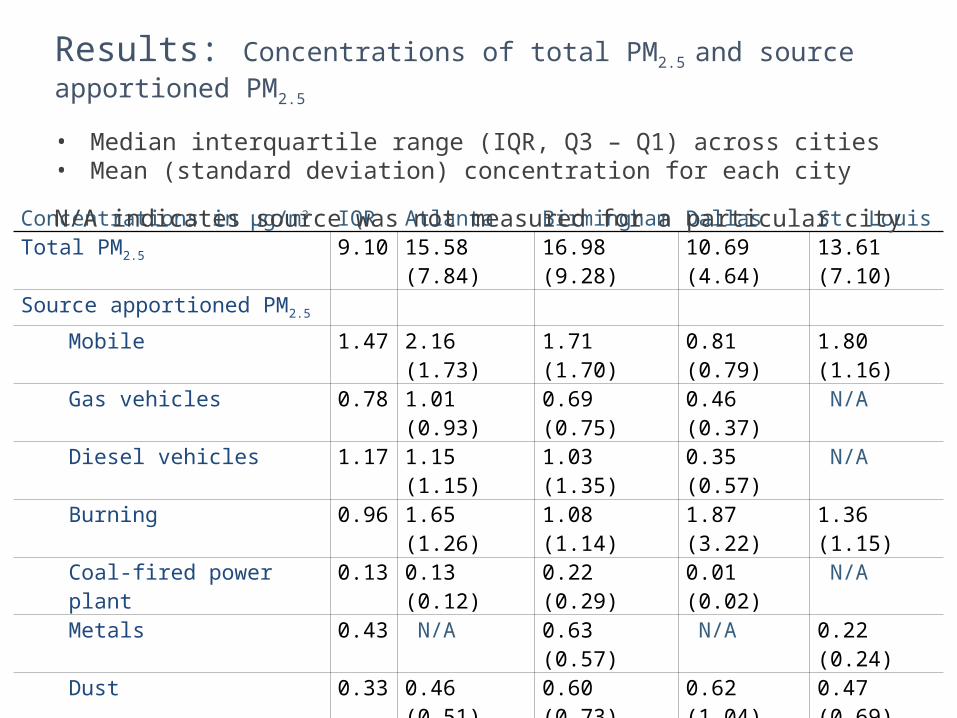
Concentrations in μg/m3 IQR Atlanta Birmingham Dallas St. LouisTotal PM2.5 9.10 15.58 (7.84) 16.98 (9.28) 10.69 (4.64) 13.61 (7.10)
Source apportioned PM2.5
Mobile 1.47 2.16 (1.73) 1.71 (1.70) 0.81 (0.79) 1.80 (1.16)
Gas vehicles 0.78 1.01 (0.93) 0.69 (0.75) 0.46 (0.37) N/A
Diesel vehicles 1.17 1.15 (1.15) 1.03 (1.35) 0.35 (0.57) N/A
Burning 0.96 1.65 (1.26) 1.08 (1.14) 1.87 (3.22) 1.36 (1.15)
Coal-fired power plant 0.13 0.13 (0.12) 0.22 (0.29) 0.01 (0.02) N/A
Metals 0.43 N/A 0.63 (0.57) N/A 0.22 (0.24)
Dust 0.33 0.46 (0.51) 0.60 (0.73) 0.62 (1.04) 0.47 (0.69)
Secondary organic carbon 3.69 1.98 (1.57) 2.08 (1.93) 1.19 (0.89) 1.13 (1.14)
Ammonium sulfate 1.56 3.27 (3.32) 3.35 (3.43) 2.28 (2.55) 3.50 (3.60)
Ammonium bisulfate 0.94 2.20 (1.80) 1.69 (1.54) 1.17 (0.98) 1.68 (1.87)
Ammonium nitrate 1.58 1.10 (1.00) 1.08 (1.01) 1.04 (1.18) 3.05 (3.24)
Results: Concentrations of total PM2.5 and source apportioned PM2.5
• Median interquartile range (IQR, Q3 – Q1) across cities • Mean (standard deviation) concentration for each city
N/A indicates source was not measured for a particular city
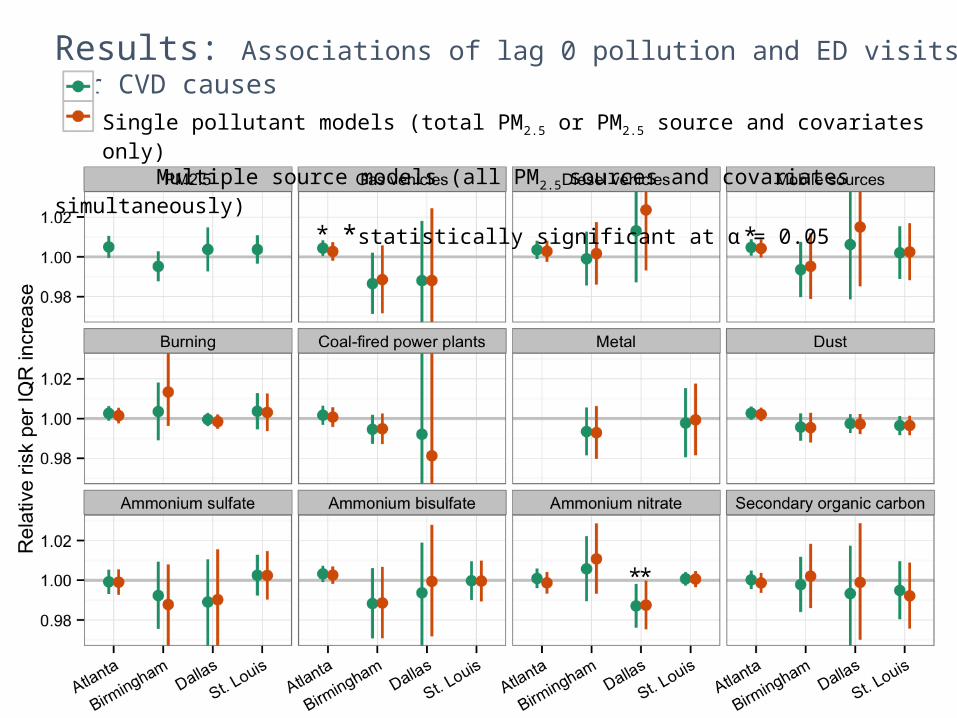
Results: Associations of lag 0 pollution and ED visits for CVD causes
Single pollutant models (total PM2.5 or PM2.5 source and covariates only) Multiple source models (all PM2.5 sources and covariates simultaneously)
*statistically significant at α = 0.05
**
**
In general, associations between PM2.5 sources and ED visits for CVD causes
were null across cities• Results mostly consistent with observed null associations between
CVD ED visits and PM2.5 from central monitoring sites in Atlanta
• We observed positive, statistically significant associations of CVD ED
visits with gas vehicles and mobile sources in Atlanta• We did not observe these associations in other cities, which had
shorter time series and temporally sparser pollution data
compared with Atlanta
Future work:
1. Associations between PM2.5 sources and ED visit subcategories
• CVD: ischemic heart disease and congestive heart failure• Respiratory: asthma and wheeze
2. Incorporate uncertainty from estimating PM2.5 sources into health effect
regression models
3. Develop multi-city model
4. Long-term goal to incorporate CMAQ-CMB outputs
Conclusions and future work
Project 4 Plans Over Coming Year• Submit drafted manuscripts:
• Hixson et al., Modification of air pollution-asthma by age• Gass et al., 3-city C&RT
• Finalize analyses, draft and submit manuscripts:• Sarnat et al., SCAPE exposure metrics comparison• O’Lenick et al., Modification of air pollution-asthma by SES (poster)• Winquist et al., Modification of air pollution-CVD associations• Krall et al., Multi-city PM2.5 sources and CVD (poster)• Pearce et al., Atlanta SOM epi application
• Make progress on additional analyses• ROS-DTT and ED visits in Atlanta• Organic chemical groups and ED visits in Atlanta• Assessment of effect modification by air exchange rates• Assessment of effect modification by temperature• Quintiles analysis
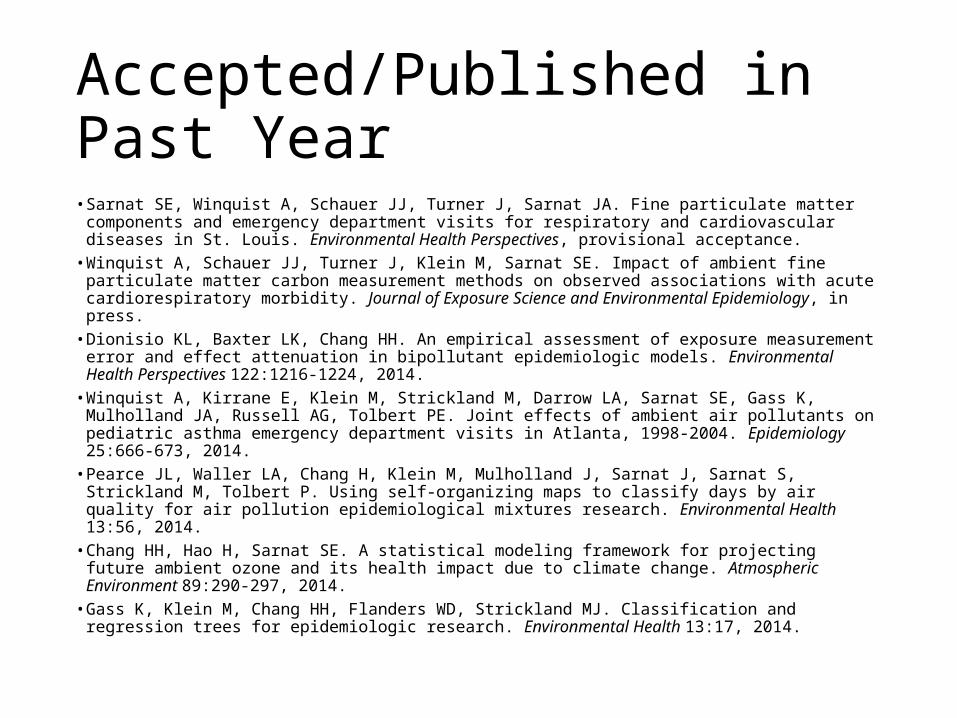
Accepted/Published in Past Year• Sarnat SE, Winquist A, Schauer JJ, Turner J, Sarnat JA. Fine particulate matter components and
emergency department visits for respiratory and cardiovascular diseases in St. Louis. Environmental Health Perspectives, provisional acceptance.
• Winquist A, Schauer JJ, Turner J, Klein M, Sarnat SE. Impact of ambient fine particulate matter carbon measurement methods on observed associations with acute cardiorespiratory morbidity. Journal of Exposure Science and Environmental Epidemiology, in press.
• Dionisio KL, Baxter LK, Chang HH. An empirical assessment of exposure measurement error and effect attenuation in bipollutant epidemiologic models. Environmental Health Perspectives 122:1216-1224, 2014.
• Winquist A, Kirrane E, Klein M, Strickland M, Darrow LA, Sarnat SE, Gass K, Mulholland JA, Russell AG, Tolbert PE. Joint effects of ambient air pollutants on pediatric asthma emergency department visits in Atlanta, 1998-2004. Epidemiology 25:666-673, 2014.
• Pearce JL, Waller LA, Chang H, Klein M, Mulholland J, Sarnat J, Sarnat S, Strickland M, Tolbert P. Using self-organizing maps to classify days by air quality for air pollution epidemiological mixtures research. Environmental Health 13:56, 2014.
• Chang HH, Hao H, Sarnat SE. A statistical modeling framework for projecting future ambient ozone and its health impact due to climate change. Atmospheric Environment 89:290-297, 2014.
• Gass K, Klein M, Chang HH, Flanders WD, Strickland MJ. Classification and regression trees for epidemiologic research. Environmental Health 13:17, 2014.

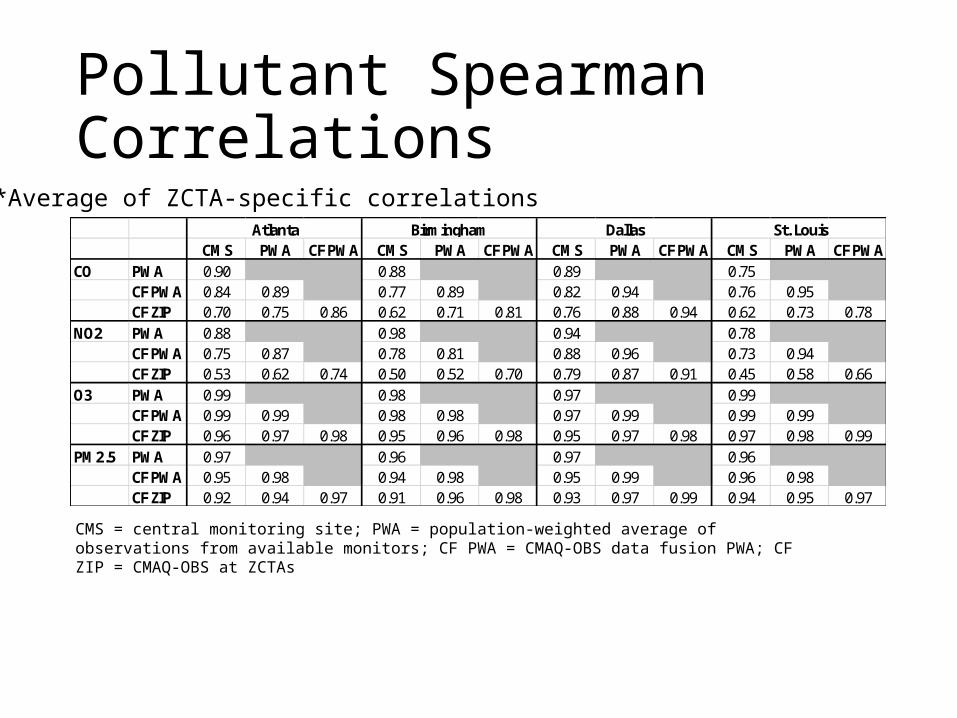
Pollutant Spearman Correlations
CMS PWA CF PWA CMS PWA CF PWA CMS PWA CF PWA CMS PWA CF PWACO PWA 0.90 0.88 0.89 0.75
CF PWA 0.84 0.89 0.77 0.89 0.82 0.94 0.76 0.95CF ZIP 0.70 0.75 0.86 0.62 0.71 0.81 0.76 0.88 0.94 0.62 0.73 0.78
NO2 PWA 0.88 0.98 0.94 0.78CF PWA 0.75 0.87 0.78 0.81 0.88 0.96 0.73 0.94CF ZIP 0.53 0.62 0.74 0.50 0.52 0.70 0.79 0.87 0.91 0.45 0.58 0.66
O3 PWA 0.99 0.98 0.97 0.99CF PWA 0.99 0.99 0.98 0.98 0.97 0.99 0.99 0.99CF ZIP 0.96 0.97 0.98 0.95 0.96 0.98 0.95 0.97 0.98 0.97 0.98 0.99
PM2.5 PWA 0.97 0.96 0.97 0.96CF PWA 0.95 0.98 0.94 0.98 0.95 0.99 0.96 0.98CF ZIP 0.92 0.94 0.97 0.91 0.96 0.98 0.93 0.97 0.99 0.94 0.95 0.97
Atlanta Birmingham Dallas St. Louis
*Average of ZCTA-specific correlations
CMS = central monitoring site; PWA = population-weighted average of observations from available monitors; CF PWA = CMAQ-OBS data fusion PWA; CF ZIP = CMAQ-OBS at ZCTAs