Embed Size (px)
Citation preview
1
Characterizing Asphaltene Deposition in the Presence of
Chemical Dispersants in Porous Media Micromodels
Yu-Jiun Lin1, Peng He1, Mohammad Tavakkoli1, Nevin Thunduvila Mathew2, Yap Yit Fatt3,
John C. Chai4, Afshin Goharzadeh3, Francisco M. Vargas1, and Sibani Lisa Biswal1*
1Department of Chemical and Biomolecular Engineering, Rice University, Houston, Texas 77005, United States
2Department of Chemical Engineering, The Petroleum Institute, Post Office Box 2533, Abu Dhabi, United Arab Emirates
3Department of Mechanical Engineering, The Petroleum Institute, Post Office Box 2533, Abu Dhabi, United Arab Emirates
4School of Computing and Engineering, University of Huddersfield, Huddersfield HD1 3DH, United Kingdom
*Email: [email protected]
Abstract
Asphaltenes are components in crude oil known to deposit and interrupt flows in critical
regions during oil production, such as the wellbore and transportation pipelines. Chemical
dispersants are commonly used to disperse asphaltenes into smaller agglomerates or increase
asphaltene stability in solution with the goal of preventing deposition. However, in many
cases, these chemical dispersants fail in the field or even worsen the deposition problems in
the wellbores. Further understanding of the mechanisms by which dispersants alter asphaltene
deposition under dynamic flowing conditions are needed to better understand flow assurance
problems. Here, we describe the use of porous media microfluidic devices to evaluate how
chemical dispersants change asphaltene deposition. Four commercially used alkyl-phenol
model chemical dispersants are tested with model oils flowing through porous media, and the
resulting deposition kinetics are visualized at both the matrix-scale and the pore-scale.
Interestingly, initial asphaltene deposition worsens in the presence of the tested dispersants,
but the mechanism by which plugging and permeability reduction in the porous media varies.
The velocity profiles near the deposit are analyzed to further investigate how shear forces
affect asphaltene deposition. The deposition tendency is also related to the intermolecular
interactions governing the asphaltene-dispersant systems. Furthermore, the model system is
extended to a real case. The use of porous media microfluidic devices offers a unique
2
platform to develop and design effective chemical dispersants for flow assurance problems.
1. Introduction
Flow assurance in the oil and gas industry has been focused on preventing asphaltene
deposition.1–6 Severe asphaltene problems often arise in the porous media near the wellbore
region, where significant changes either in shear rates or pressure occur. As a result of these
flow changes, nano- and micro-aggregates of the destabilized asphaltenes form in the crude
oil.7,8 Additionally, temperature and composition of the crude oil can also vary significantly
during crude oil recovery, causing asphaltenes to precipitate. In particular, pipeline fouling
has been reported to be a result of CO2 injection in Enhanced Oil Recovery (EOR)9,10 and
mixing various crude oil streams.11 Following initial adsorption, asphaltene deposition can
cause flow assurance problems by plugging small pore throats via the mechanical trapping or
depositing on rock surfaces.12,13 Both plugging and non-plugging depositions contribute to
the permeability reduction within the porous media. Depending on the local flow velocity
gradients, asphaltene deposits can be mobilized from non-plugging deposits to later
contribute to mechanical trapping and plugging of the porous media, which further depicts
the complexity of asphaltene deposition to flow assurance.
Common solutions utilized to tackle this problem include mechanical removal using
scrapers or solvent washing in the wellbore and near-wellbore region.14,15 Additionally,
preventive chemical additives, such as asphaltene inhibitors or dispersants, have been
3
proposed to be injected into the wellbore and formation. Inhibitors can be used to shift the
thermodynamic conditions required for asphaltene precipitation versus dispersants prevent
destabilized asphaltene agglomerates from flocculating and aggregating with the goal of
keeping asphaltenes suspended in the crude oil so that they can be carried by the flow instead
of depositing onto the surface or plugging pore throats.16–21 Previous studies of
low-molecular-weight alkylbenzene-derived amphiphile dispersants investigate the influence
of both the polarity of head groups and length of the alkyl tail on stabilizing asphaltenes
under the scenario that polar moiety attaches to asphaltenes, and alkyl tails offer steric
repulsion.16,17 Bulk studies of alkylphenol dispersants on the asphaltene aggregation in
heptane/toluene (Heptol) solutions evaluated dispersant effectiveness in terms of delaying the
precipitation onset and reducing aggregate size.22 The effectiveness of dispersants is typically
characterized by quantifying the concentration of suspended asphaltenes in the solution using
turbidity measurements and dispersancy tests by transmittance under static conditions.16,17,22–
27 However, the performance of dispersants under complex flow conditions is difficult to
predict solely from static dispersancy tests. Without considering hydrodynamic effects on
asphaltene aggregates, these chemical dispersants may worsen deposition and hasten flow
assurance problems in the field.28 Although commercially available alkyl-phenols have
demonstrated various successes as asphaltene dispersants, it is not clear how these chemicals
influence plugging and non-plugging asphaltene deposition processes. Therefore, it is
4
important to study the performance of asphaltene dispersants under flowing conditions in
porous media and integrate these studies with conventional dispersancy tests to form a
multifaceted screening platform to better understand the influence of chemical additive
injections for flow assurance.
Microfluidic systems provide a fast and well-controlled platform to study flow processes
within porous media, and to date, has been successfully applied to various crude oil and
asphaltene systems.29–33 The typical length scales of microfluidic devices match the
representative pore sizes of the near-wellbore region and reservoir rock, and its transparency
allows processes to be visualized.34–36 The direct visualization capacity provide a platform for
studying asphaltene deposition dynamics in great detail. Additionally, the high
surface-to-volume ratio in microfluidic devices gives rise to a highly controllable
measurement for studying particle-surface interactions and provides a high-throughput
platform for efficient screening of dispersants. Deposition is a result of competition between
surface adsorption and erosion. Adsorption is dominated by the diffusion of small asphaltene
particles to the surface, but erosion is governed by the shear forces exerted by fluid
convection acting on the deposited aggregates. The convection-diffusion effect has been
previously highlighted as an important factor on asphaltene deposition.37 In this study,
dispersants alter the size and the intermolecular interactions between asphaltene aggregates;
hence influencing both the diffusion and shear removal regarding the deposition process.
5
In this paper, we studied the deposition kinetics of asphaltenes under the influence of
dispersants with dynamic flow conditions in porous media microfluidic devices. In particular,
we will identify how various chemical dispersants changes the effective asphaltene size and
intermolecular interactions, which in turn alters the deposition and shear removal tendencies.
A microfluidic device was used to analyze different asphaltene deposition growth rates and
morphologies and provides further insight how altering the chemical interactions among
asphaltenes can lead to worsening deposition in porous media.
2. Experimental Methods
2.1 Asphaltenes in Model Oils and Crude Oil with Dispersants
The asphaltenes used in this study were extracted from Canadian bitumen samples by
n-pentane. A model oil was prepared by slowly dissolving the extracted asphaltenes in
toluene at 90oC in 40 kHz ultrasonication bath (Branson) for a minimum of 30 minutes until a
final asphaltene concentration of 0.5 wt% was reached. Results with the model oil are also
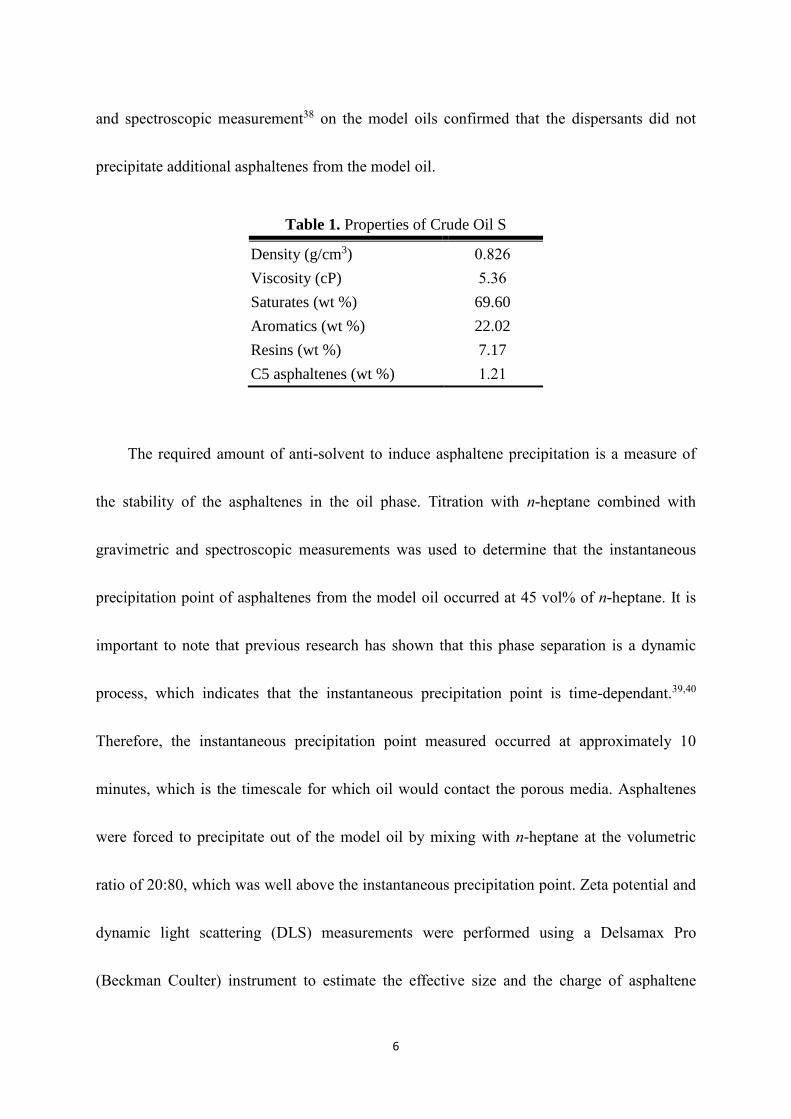
compared with Crude Oil S, whose properties at 1 atm and 23 oC are listed in Table 1.
Commercial dispersants, such as p-dodecylphenol (purity ≥ 96.5%) [Pfaltz & Bauer
(Connecticut, USA)], p-hexylphenol (98%), p-octylphenol (99%), iso-dodecylphenol and
other chemicals were reagent grade (purity ≥ 99%) [Sigma-Aldrich (Missouri, USA)] and
used as is. These various dispersants were premixed into the model oil at the concentration of
0.01 wt%, characteristic of what would typically be used in field applications. A gravimetric
6
and spectroscopic measurement38 on the model oils confirmed that the dispersants did not
precipitate additional asphaltenes from the model oil.
The required amount of anti-solvent to induce asphaltene precipitation is a measure of
the stability of the asphaltenes in the oil phase. Titration with n-heptane combined with
gravimetric and spectroscopic measurements was used to determine that the instantaneous
precipitation point of asphaltenes from the model oil occurred at 45 vol% of n-heptane. It is
important to note that previous research has shown that this phase separation is a dynamic
process, which indicates that the instantaneous precipitation point is time-dependant.39,40
Therefore, the instantaneous precipitation point measured occurred at approximately 10
minutes, which is the timescale for which oil would contact the porous media. Asphaltenes
were forced to precipitate out of the model oil by mixing with n-heptane at the volumetric
ratio of 20:80, which was well above the instantaneous precipitation point. Zeta potential and
dynamic light scattering (DLS) measurements were performed using a Delsamax Pro
(Beckman Coulter) instrument to estimate the effective size and the charge of asphaltene
Table 1. Properties of Crude Oil S
Density (g/cm3) 0.826
Viscosity (cP) 5.36
Saturates (wt %) 69.60
22.02
7.17
Aromatics (wt %)
Resins (wt %)
C5 asphaltenes (wt %) 1.21
7
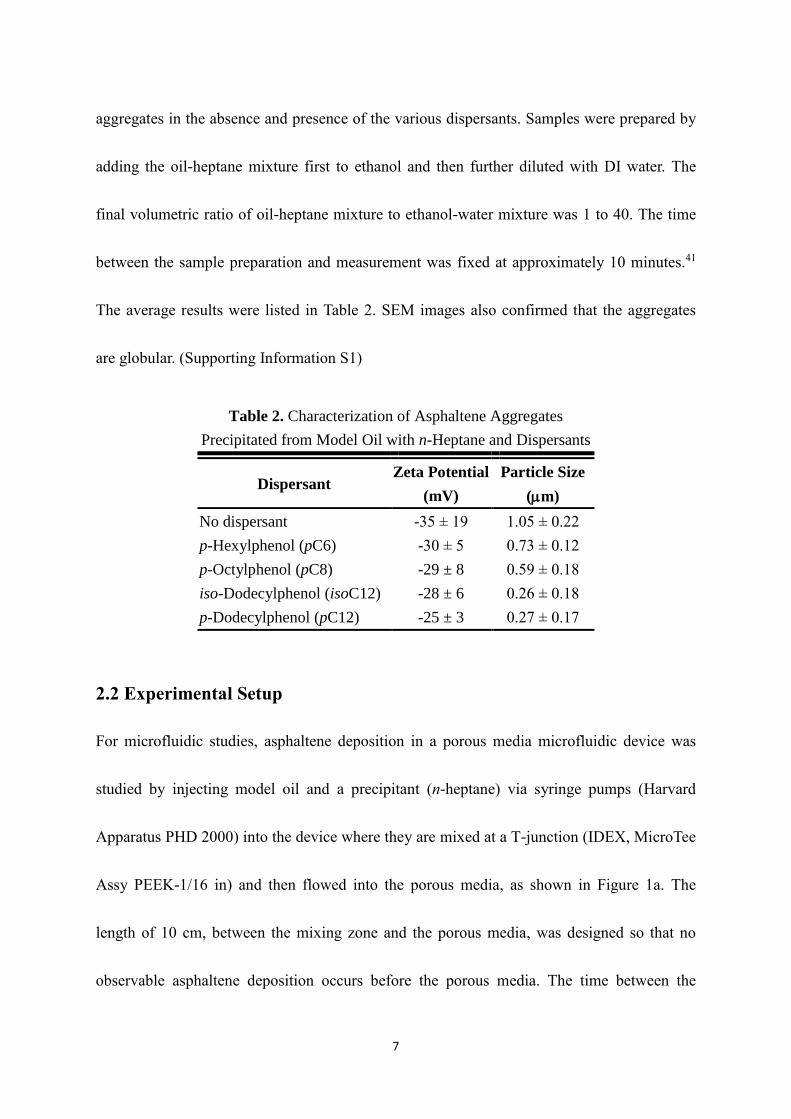
aggregates in the absence and presence of the various dispersants. Samples were prepared by
adding the oil-heptane mixture first to ethanol and then further diluted with DI water. The
final volumetric ratio of oil-heptane mixture to ethanol-water mixture was 1 to 40. The time
between the sample preparation and measurement was fixed at approximately 10 minutes.41
The average results were listed in Table 2. SEM images also confirmed that the aggregates
are globular. (Supporting Information S1)
2.2 Experimental Setup
For microfluidic studies, asphaltene deposition in a porous media microfluidic device was
studied by injecting model oil and a precipitant (n-heptane) via syringe pumps (Harvard
Apparatus PHD 2000) into the device where they are mixed at a T-junction (IDEX, MicroTee
Assy PEEK-1/16 in) and then flowed into the porous media, as shown in Figure 1a. The
length of 10 cm, between the mixing zone and the porous media, was designed so that no
observable asphaltene deposition occurs before the porous media. The time between the
Table 2. Characterization of Asphaltene Aggregates
Precipitated from Model Oil with n-Heptane and Dispersants
Dispersant Zeta Potential
(mV)
Particle Size
(m)
No dispersant -35 ± 19 1.05 ± 0.22
p-Hexylphenol (pC6) -30 ± 5 0.73 ± 0.12
p-Octylphenol (pC8) -29 ± 8
-28 ± 6
-25 ± 3
0.59 ± 0.18
iso-Dodecylphenol (isoC12) 0.26 ± 0.18
p-Dodecylphenol (pC12) 0.27 ± 0.17
8
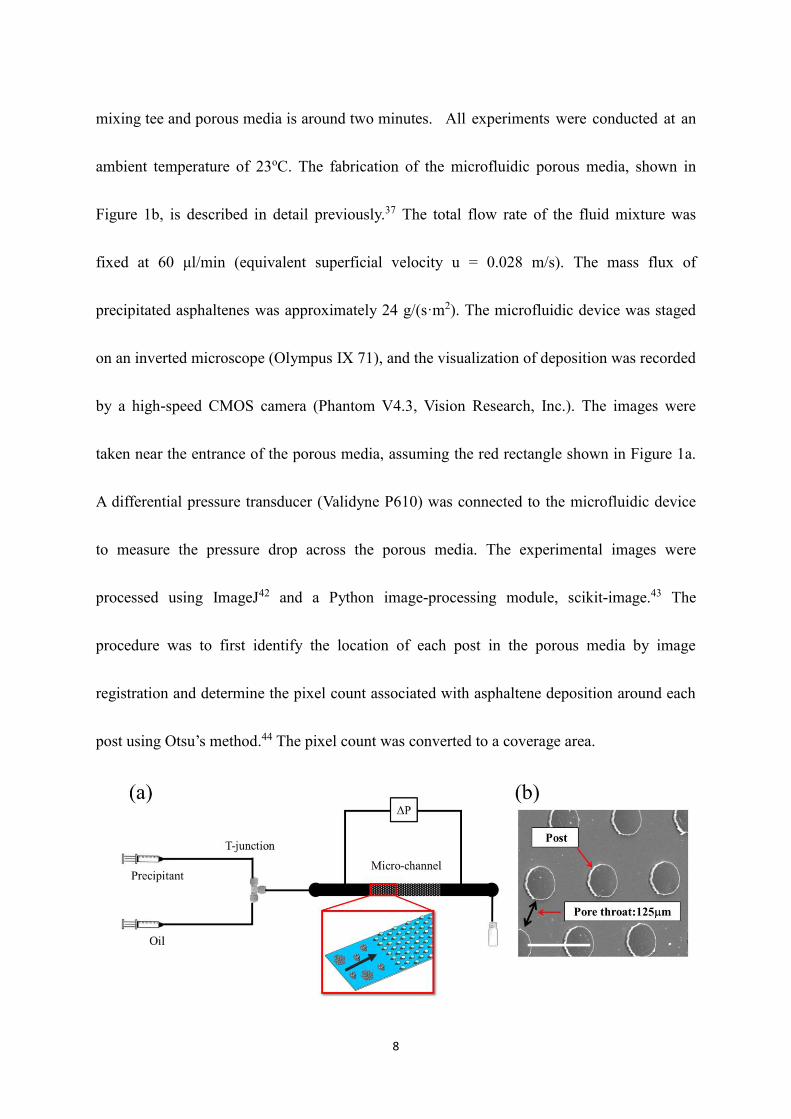
mixing tee and porous media is around two minutes. All experiments were conducted at an
ambient temperature of 23oC. The fabrication of the microfluidic porous media, shown in
Figure 1b, is described in detail previously.37 The total flow rate of the fluid mixture was
fixed at 60 μl/min (equivalent superficial velocity u = 0.028 m/s). The mass flux of
precipitated asphaltenes was approximately 24 g/(s·m2). The microfluidic device was staged
on an inverted microscope (Olympus IX 71), and the visualization of deposition was recorded
by a high-speed CMOS camera (Phantom V4.3, Vision Research, Inc.). The images were
taken near the entrance of the porous media, assuming the red rectangle shown in Figure 1a.
A differential pressure transducer (Validyne P610) was connected to the microfluidic device
to measure the pressure drop across the porous media. The experimental images were
processed using ImageJ42 and a Python image-processing module, scikit-image.43 The
procedure was to first identify the location of each post in the porous media by image
registration and determine the pixel count associated with asphaltene deposition around each
post using Otsu’s method.44 The pixel count was converted to a coverage area.
9
Figure 1. (a) Schematic of experimental setup. (b) SEM image of the porous media used to study deposition.
The scale bar is 200 μm. The red rectangle represents the recording region.
2.3 Flow/Aggregate Correlation
Since dispersants alter asphaltene aggregate size, deposition can be described in terms of the
Péclet number (𝑃𝑒), which accounts for the relative contributions from convection and
diffusion in the presence of different chemical dispersants, with the limitation that the
particles are in the vicinity of an individual post, which acts as the collector surface, and
within the size range of 0.1 – 10 µm.45 The asphaltene aggregate size, obtained from DLS, is
used to calculate the Péclet number by Eq. 1-2 to analyze the relative convection-diffusion
ratio:37,45–47
𝑃𝑒 =2𝑢𝑅𝑝
𝐷𝐵𝑀 (1)
𝐷𝐵𝑀 =𝑘𝐵𝑇
6𝜋𝜇𝑅𝑝 (2)
where 𝑅𝑝 is the average radius of asphaltene aggregate, 𝐷𝐵𝑀 is the Brownian diffusivity
(m2/𝑠) assuming a spherical aggregate which is supported by our SEM measurements, 𝑢 =
0.028 m/s is the superficial velocity, 𝜇 is the dynamic viscosity of the oil-precipitant
mixture (~0.4 cP), and 𝑘𝐵 = 1.3810-23 (m2 ⋅ kg)/(s2 ⋅ K) is the Boltzmann constant.
3. Results and Discussions
3.1 Asphaltene Aggregation with Dispersants
The tendency for asphaltene aggregation is investigated by varying the chain length of the
alkyl tail on the dispersant. These chemicals have a phenol head group and an alkyl tail. It is
10
thought that the alkyl tail increases the steric repulsion between asphaltene aggregates, as
shown in Table 2, where smaller aggregates form in the presence of dispersants with longer
chain lengths. Goual et al. also studied the effects of alkylphenols on asphaltene aggregation
and found that aggregates became smaller and filamentary because alkylphenols attached to
the surface of asphaltene aggregates, which increased steric interactions.22 Chang et al.
conducted a systematic investigation of the effect of dispersants having various functional
groups and lengths for the alkyl tail on solubilized asphaltenes. It was found that a longer
alkyl tail better stabilized asphaltenes in the solution.16
3.2 Deposition Rate and Morphology of Asphaltenes in Micromodel
Asphaltene deposition from model oils with and without the presence of the dispersants was
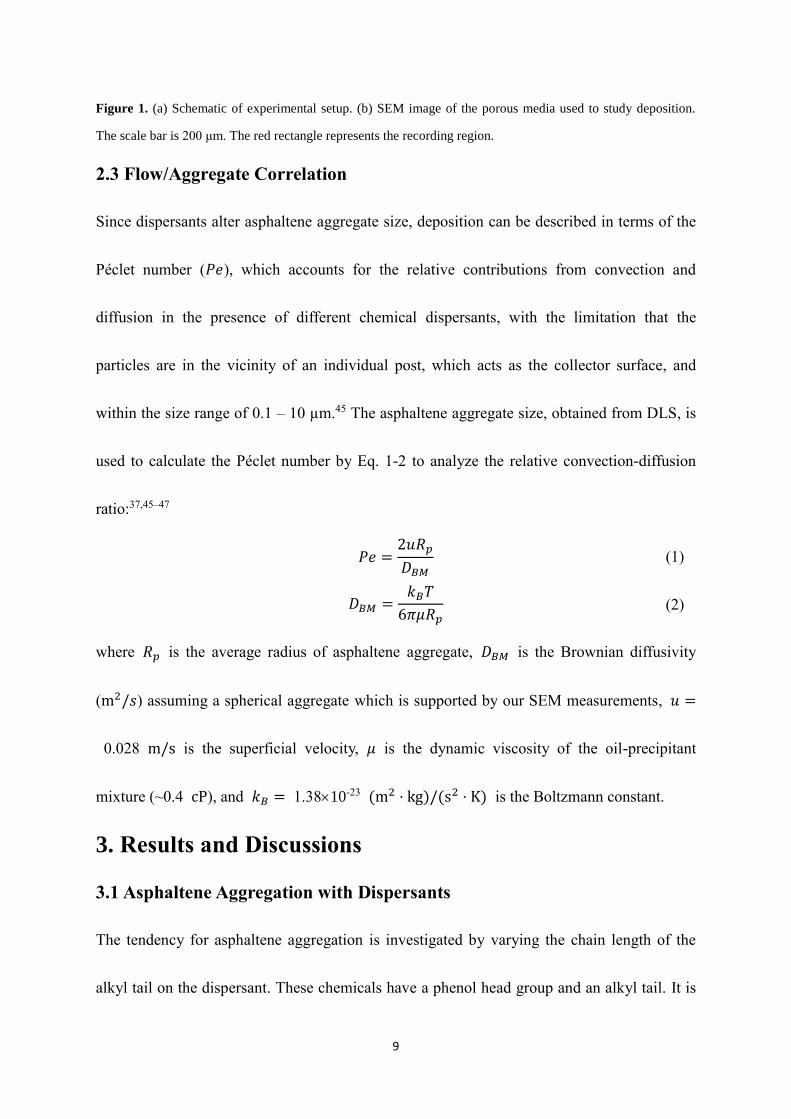
further examined. The representative deposition profiles in porous media are shown in Figure
2. In the absence of the precipitant, shown in Figure 2a, asphaltenes remain soluble in the oil
phase and flow within the porous media without depositing. In the presence of the precipitant,
n-heptane, a cone-shaped deposit is observed to form at the front of the posts, against the
flow direction as well as the rear of the posts, as shown in Figure 2b. In the presence of
p-hexylphenol and p-octylphenol, the asphaltene deposits tend to form blunter cone-shape,
resulting in a wide streamlined shape, as shown in Figure 2c - 2d versus in the presence of
p-dodecylphenol and iso-dodecylphenol, a smaller streamlined deposit is observed in front of
the post. Furthermore, the deposition on the rear-side of the post is significantly reduced in
11
the presence of dispersants.
Figure 2. Deposition profiles with and without dispersants in homogeneous porous media taken at 900s near the
inlet. (a) Only oil. (b) No dispersant. (c) p-hexylphenol (d) p-octylphenol (e) p-dodecylphenol (f)
iso-dodecylphenol. Scale bar is 200 m, and the scale bar in the inset is 100 m. Flow is from left to right.
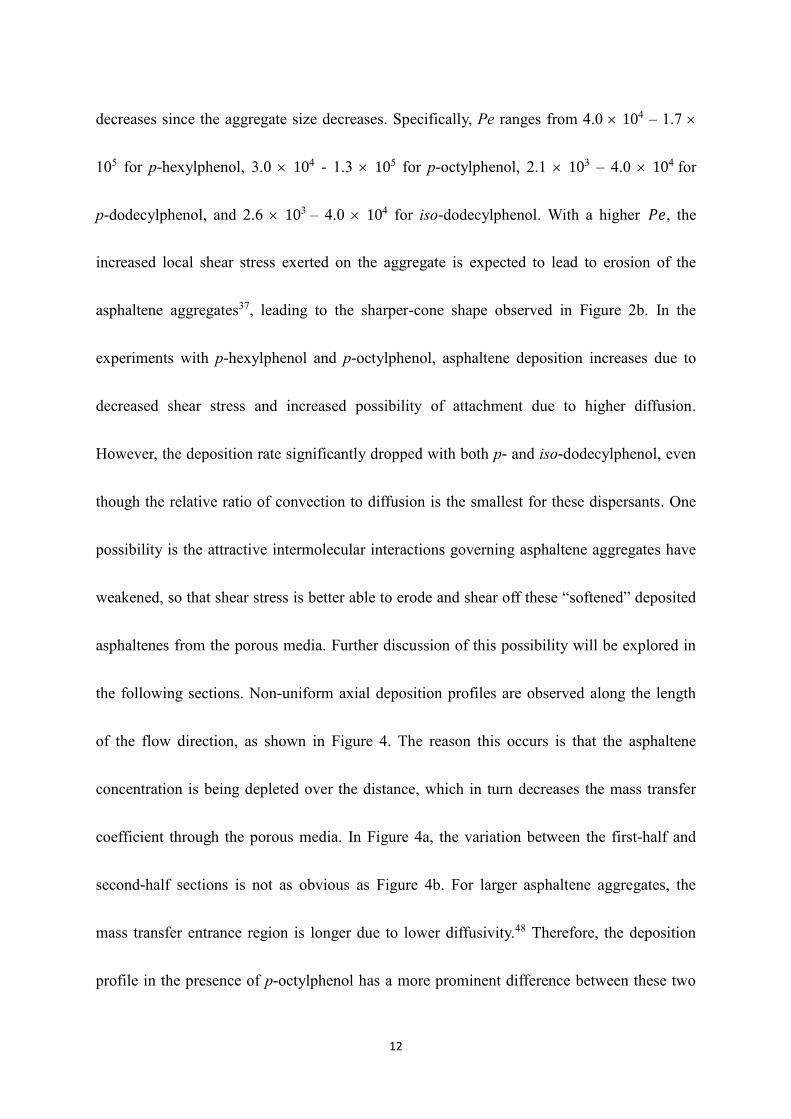
The averaged deposition is quantified in Figure 3a, where the deposition rate, the ratio of
the coverage of deposited asphaltenes and time, is shown in Figure 3b and the pressure drop
measurements are provided in Figure 3c. Model oils with p-hexylphenol or p-octylphenol
show higher overall deposition rates than the no-dispersant experiment. Initially, model oils
with p-dodecylphenol or iso-dodecylphenol also show a higher deposition rate, but the
deposition rate then reduces; hence the overall deposition is lower than the no-dispersant
case.
The Péclet number (𝑃𝑒), based on average aggregates size, is calculated to correlate the
properties of the flow to the aggregation.37,46,47 Previous research has shown that stable
asphaltenes are present in oil and deposit on the surface as aggregates in the colloidal size
range.4 The no-dispersant case has the highest 𝑃𝑒 (1.7 – 4.2 105). With dispersants, 𝑃𝑒
12
decreases since the aggregate size decreases. Specifically, Pe ranges from 4.0 104 – 1.7
105 for p-hexylphenol, 3.0 104 - 1.3 105 for p-octylphenol, 2.1 103 – 4.0 104 for
p-dodecylphenol, and 2.6 103 – 4.0 104 for iso-dodecylphenol. With a higher 𝑃𝑒, the
increased local shear stress exerted on the aggregate is expected to lead to erosion of the
asphaltene aggregates37, leading to the sharper-cone shape observed in Figure 2b. In the
experiments with p-hexylphenol and p-octylphenol, asphaltene deposition increases due to
decreased shear stress and increased possibility of attachment due to higher diffusion.
However, the deposition rate significantly dropped with both p- and iso-dodecylphenol, even
though the relative ratio of convection to diffusion is the smallest for these dispersants. One
possibility is the attractive intermolecular interactions governing asphaltene aggregates have
weakened, so that shear stress is better able to erode and shear off these “softened” deposited
asphaltenes from the porous media. Further discussion of this possibility will be explored in
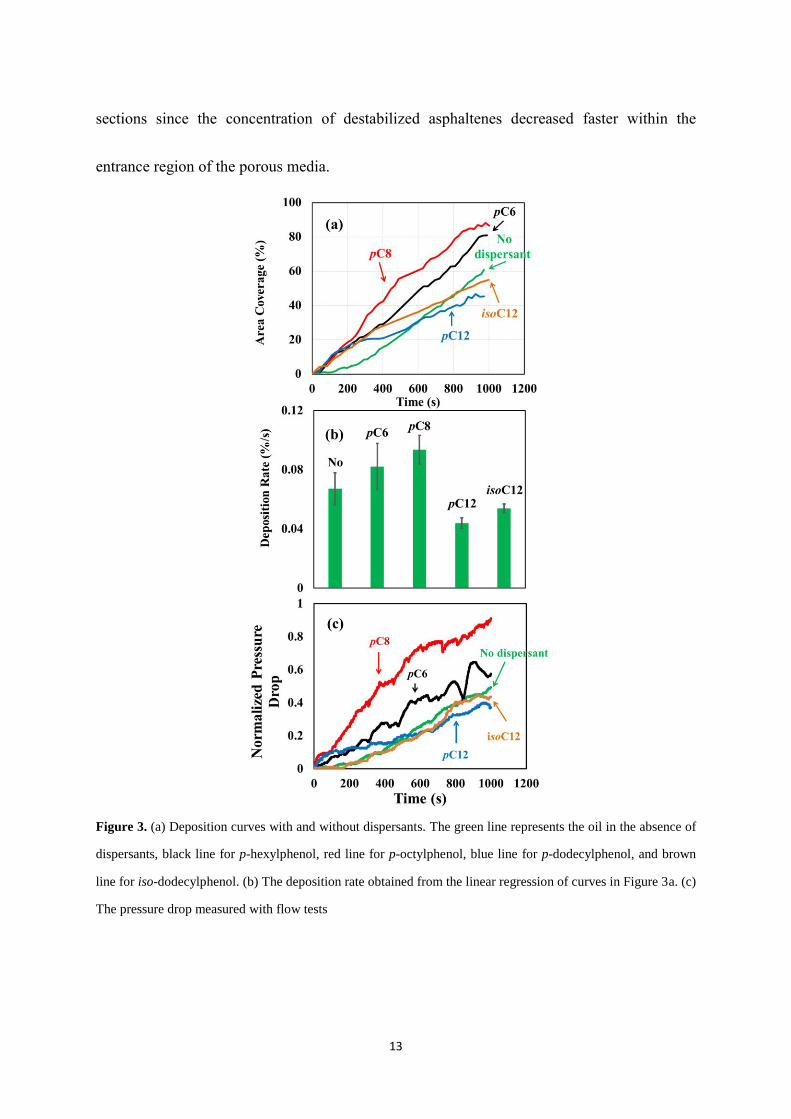
the following sections. Non-uniform axial deposition profiles are observed along the length
of the flow direction, as shown in Figure 4. The reason this occurs is that the asphaltene
concentration is being depleted over the distance, which in turn decreases the mass transfer
coefficient through the porous media. In Figure 4a, the variation between the first-half and
second-half sections is not as obvious as Figure 4b. For larger asphaltene aggregates, the
mass transfer entrance region is longer due to lower diffusivity.48 Therefore, the deposition
profile in the presence of p-octylphenol has a more prominent difference between these two
13
sections since the concentration of destabilized asphaltenes decreased faster within the
entrance region of the porous media.
Figure 3. (a) Deposition curves with and without dispersants. The green line represents the oil in the absence of
dispersants, black line for p-hexylphenol, red line for p-octylphenol, blue line for p-dodecylphenol, and brown
line for iso-dodecylphenol. (b) The deposition rate obtained from the linear regression of curves in Figure 3a. (c)
The pressure drop measured with flow tests
14
Figure 4. Deposition profiles with and without p-octylphenol in taken at 900s. (a) No dispersant. (b)
p-octylphenol. Scale bar is 500 m. Flow is from left to right. The white dotted line separates the section near
the inlet and the section near the outlet.
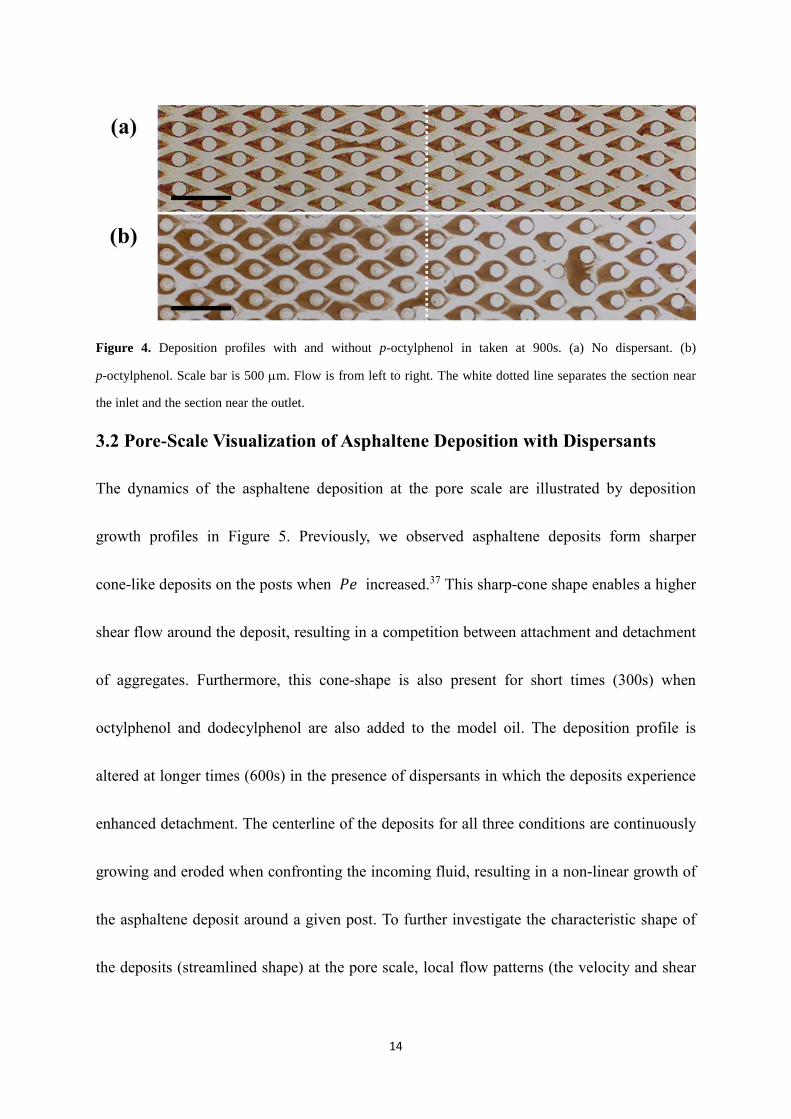
3.2 Pore-Scale Visualization of Asphaltene Deposition with Dispersants
The dynamics of the asphaltene deposition at the pore scale are illustrated by deposition
growth profiles in Figure 5. Previously, we observed asphaltene deposits form sharper
cone-like deposits on the posts when 𝑃𝑒 increased.37 This sharp-cone shape enables a higher
shear flow around the deposit, resulting in a competition between attachment and detachment
of aggregates. Furthermore, this cone-shape is also present for short times (300s) when
octylphenol and dodecylphenol are also added to the model oil. The deposition profile is
altered at longer times (600s) in the presence of dispersants in which the deposits experience
enhanced detachment. The centerline of the deposits for all three conditions are continuously
growing and eroded when confronting the incoming fluid, resulting in a non-linear growth of
the asphaltene deposit around a given post. To further investigate the characteristic shape of
the deposits (streamlined shape) at the pore scale, local flow patterns (the velocity and shear
15
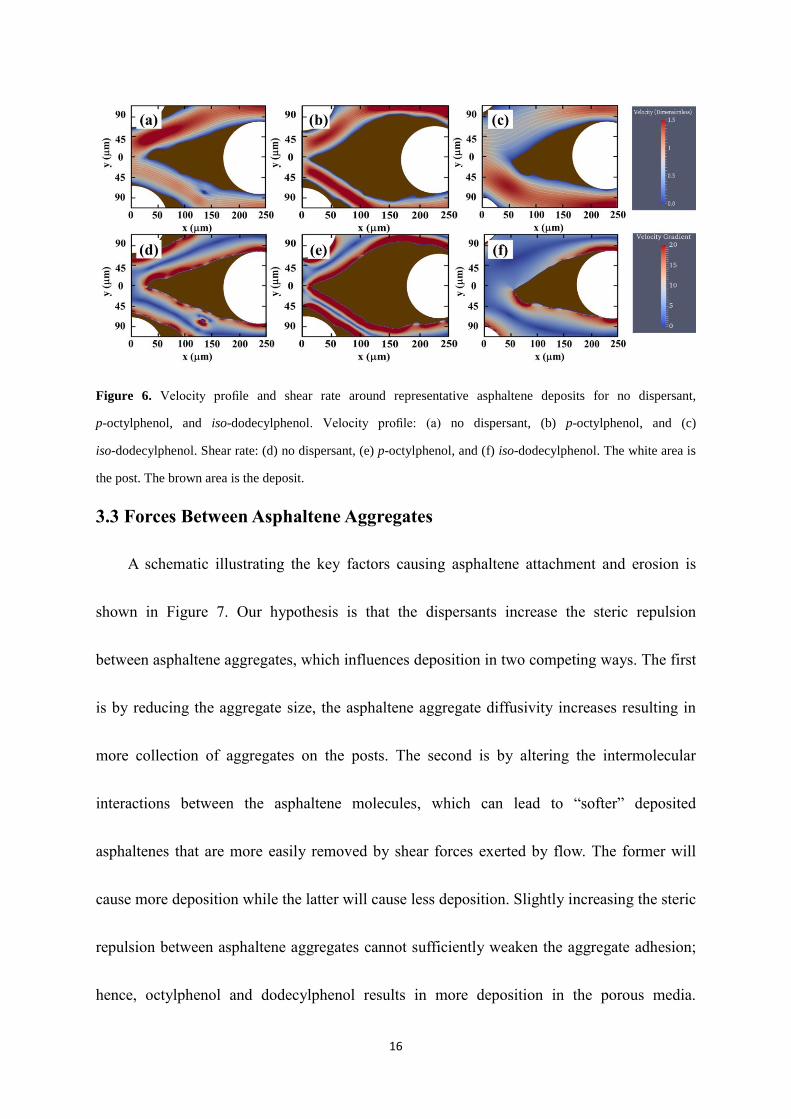
rate profiles of the deposits) are plotted by a Lattice-Boltzmann method, as shown in Figure 6
(Described in Supporting Information S2.) High-velocity fluid flow zones are found at the
north and south regions of the post (𝑦 = 45-90 m), suggesting a higher shear removal effect.
The locations between posts (𝑥 = 0-100 m and 200-250 m) show the highest velocity. The
streamlined shape formed between these two high-velocity zones (𝑥 = 100-200 m) is due
to the fluid stagnation region near the post. High shear rates are also found at the interface of
the deposit and flowing fluid, resulting in a strong competition between attachment and
detachment. However, enhanced local shear stress is not able to explain the decrease in the
overall deposition rate for p- and iso-dodecylphenol. Hence, the intermolecular interactions
between asphaltenes in the presence of dispersants are discussed in the following section.
Figure 5. Schematic dynamics of asphaltene deposition growth with and without dispersants. (a) No dispersant
(b) p-octylphenol (c) iso-dodecylphenol. Red line is for 300s. The yellow line is for 600s. Scale bar is 100 m.
16
Figure 6. Velocity profile and shear rate around representative asphaltene deposits for no dispersant,
p-octylphenol, and iso-dodecylphenol. Velocity profile: (a) no dispersant, (b) p-octylphenol, and (c)
iso-dodecylphenol. Shear rate: (d) no dispersant, (e) p-octylphenol, and (f) iso-dodecylphenol. The white area is
the post. The brown area is the deposit.
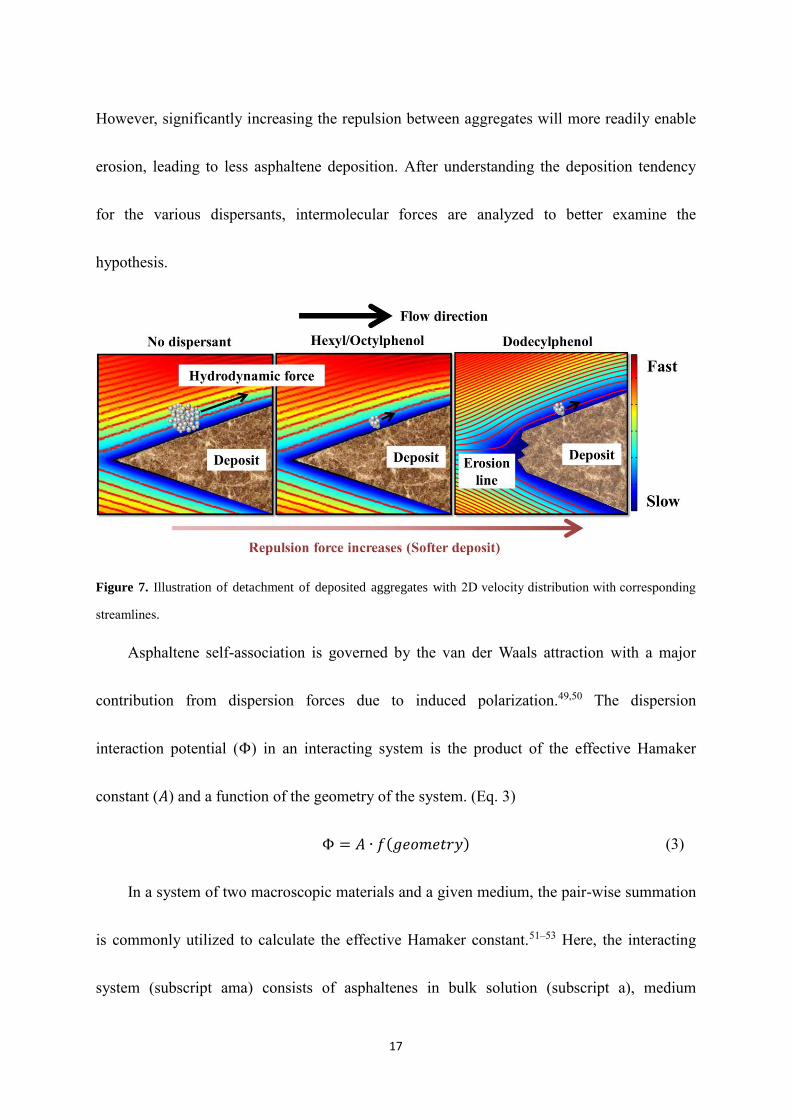
3.3 Forces Between Asphaltene Aggregates
A schematic illustrating the key factors causing asphaltene attachment and erosion is
shown in Figure 7. Our hypothesis is that the dispersants increase the steric repulsion
between asphaltene aggregates, which influences deposition in two competing ways. The first
is by reducing the aggregate size, the asphaltene aggregate diffusivity increases resulting in
more collection of aggregates on the posts. The second is by altering the intermolecular
interactions between the asphaltene molecules, which can lead to “softer” deposited
asphaltenes that are more easily removed by shear forces exerted by flow. The former will
cause more deposition while the latter will cause less deposition. Slightly increasing the steric
repulsion between asphaltene aggregates cannot sufficiently weaken the aggregate adhesion;
hence, octylphenol and dodecylphenol results in more deposition in the porous media.
17
However, significantly increasing the repulsion between aggregates will more readily enable
erosion, leading to less asphaltene deposition. After understanding the deposition tendency
for the various dispersants, intermolecular forces are analyzed to better examine the
hypothesis.
Figure 7. Illustration of detachment of deposited aggregates with 2D velocity distribution with corresponding
streamlines.
Asphaltene self-association is governed by the van der Waals attraction with a major
contribution from dispersion forces due to induced polarization.49,50 The dispersion
interaction potential (Φ) in an interacting system is the product of the effective Hamaker
constant (𝐴) and a function of the geometry of the system. (Eq. 3)
Φ = 𝐴 ∙ 𝑓(𝑔𝑒𝑜𝑚𝑒𝑡𝑟𝑦) (3)
In a system of two macroscopic materials and a given medium, the pair-wise summation
is commonly utilized to calculate the effective Hamaker constant.51–53 Here, the interacting
system (subscript ama) consists of asphaltenes in bulk solution (subscript a), medium
18
(subscript m), and asphaltenes adsorbed onto a surface.54 If the Hamaker constants for the
bulk asphaltenes and adsorbed asphaltenes are assumed to be similar, then the effective
Hamaker constant can be calculated as:
𝐴𝑎𝑚𝑎 = (√𝐴𝑎 − √𝐴𝑚)2 (4)
where 𝐴𝑎 and 𝐴𝑚 are Hamaker constants of the bulk asphaltenes and bulk medium
solution, respectively. The Hamaker constant of a pure material can be calculated by Eq. 5
with the assumption that the dispersive energy component is the main contribution to the
surface energy, which is a good assumption for these experiments due to lack of the hydrogen
bonding in solvents (n-heptane and toluene):53
𝐴𝑚 = 24𝜋𝐿02 𝛾𝑠 (5)
where 𝐿0 = 0.165 𝑛𝑚 is defined as the characteristic distance between interacting
molecules, and 𝛾𝑠 is the surface energy. The calculated Hamaker constant (𝐴𝑎 = 5.73 10-20
J) was obtained from Gonzalez et al. who used the Lifshitz theory towards a system of
asphaltenes.50 The Hamaker constant of the medium (𝐴𝑚 = 4.22 10-20 J) was calculated
with the measured surface energy (𝛾𝑠 = 20.5 ±0.06 mN/m), where the surface tension was
measured using a force tensiometer (K100, KRÜSS, GmbH). The effective Hamaker
constant of the interacting system (𝐴𝑎𝑚𝑎) was estimated to be 1.14 10-21 J using Eq. 4.
Previously, Fotland et al. studied van der Waals forces between asphaltenes by altering the
medium with different ratios of n-pentane and benzene.55 They found that the effective
19
Hamaker constant was reduced with a smaller fraction of n-pentane, which also explained
their experimental observations that asphaltene precipitation is directly correlated to the ratio
of precipitant in the solution. Additionally, Wang et al. analyzed the interaction forces of
asphaltene surfaces in heptane-toluene mixtures using atomic force microscopy (AFM). They
found that the interaction was mainly due to van der Waals attractive forces when asphaltenes
were in a solvent with high volume ratio of n-heptane, which is similar to the conditions
reported here.56
To study the attachment and removal of asphaltenes, the attraction and repulsion are
estimated as follows. The attraction of asphaltenes to the post is assumed to be a system with
a particle and a planar surface in contact with a distance (D), and the attractive force (𝐹𝐴) can
be described by Eq. 6.53
𝐹𝐴 =𝐴𝑎𝑚𝑎𝑅𝑝
6𝐷2 (6)
Since dispersants are known to increase the steric repulsion between asphaltene
aggregates by adsorbing onto the asphaltenes, then this steric repulsion has a significant
impact on erosion of asphaltene depostited.16,17,22,24 To evaluate the steric repulsive forces
(𝐹𝑠), we use the force-distance profile between a particle and a repulsive surface, which is
shorter than two times of the thickness of the adsorbed layer, (𝐷 < 2𝐿), estimated by Eq.
7.53,57,58
20
𝐹𝑠(𝐷) = 2𝜋𝑅𝑝 (
𝑘𝐵𝑇
𝑠3) {
8𝐿
5[(
2𝐿
𝐷)
54
− 1] +8𝐿
7[(
𝐷
2𝐿)
74
− 1]} 𝑓𝑜𝑟 𝐷 < 2𝐿 (7)
where 𝑠 is the average distance between attachment points59, 𝐿 is the thickness of the
adsorbed dispersant layer. The first term in Eq. 7 is the osmotic repulsion from the overlap of
steric surfaces which increases the osmotic pressure and the second term is associated with
the loss of entropy associated with adsorption.57 (See Supporting Information S3)
Electrostatic repulsion is neglected because most of the solvents used as the medium are
non-polar (n-heptane and toluene) and the measured zeta potential for asphaltenes with
different dispersants are in a similar range, suggesting that the electrostatic repulsion between
asphaltene aggregates are not a dominant factor. The combination of attraction and repulsion
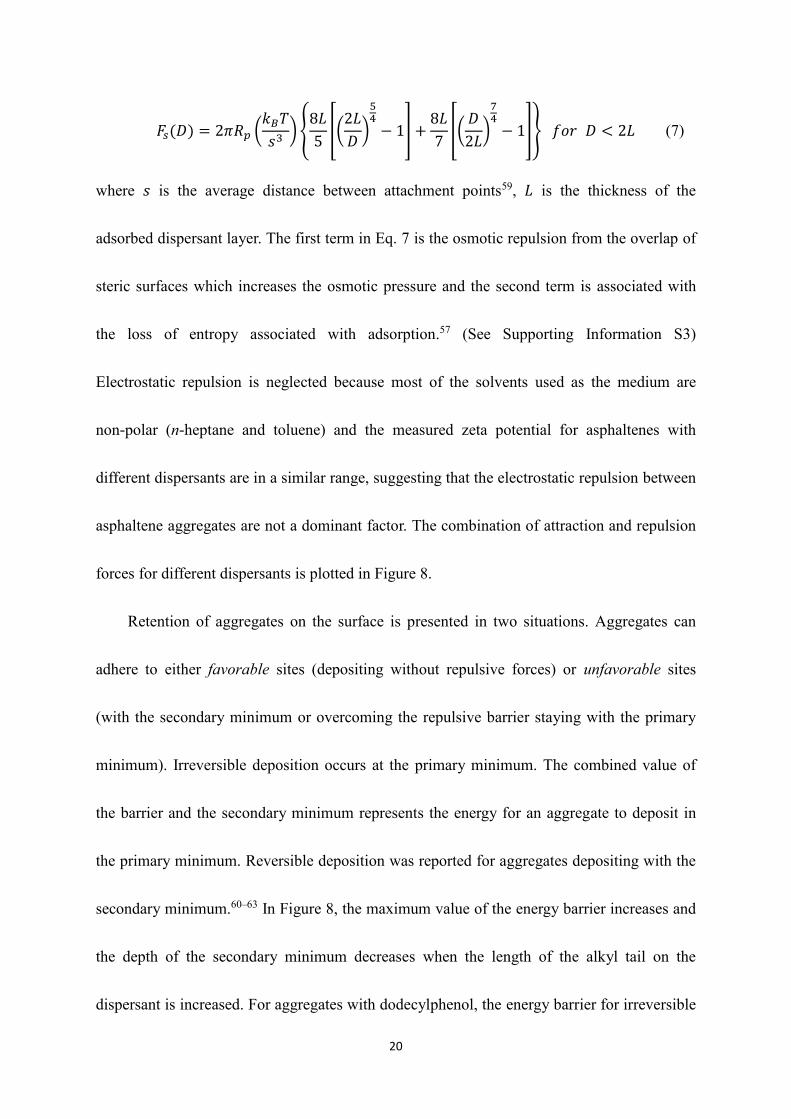
forces for different dispersants is plotted in Figure 8.
Retention of aggregates on the surface is presented in two situations. Aggregates can
adhere to either favorable sites (depositing without repulsive forces) or unfavorable sites
(with the secondary minimum or overcoming the repulsive barrier staying with the primary
minimum). Irreversible deposition occurs at the primary minimum. The combined value of
the barrier and the secondary minimum represents the energy for an aggregate to deposit in
the primary minimum. Reversible deposition was reported for aggregates depositing with the
secondary minimum.60–63 In Figure 8, the maximum value of the energy barrier increases and
the depth of the secondary minimum decreases when the length of the alkyl tail on the
dispersant is increased. For aggregates with dodecylphenol, the energy barrier for irreversible
21
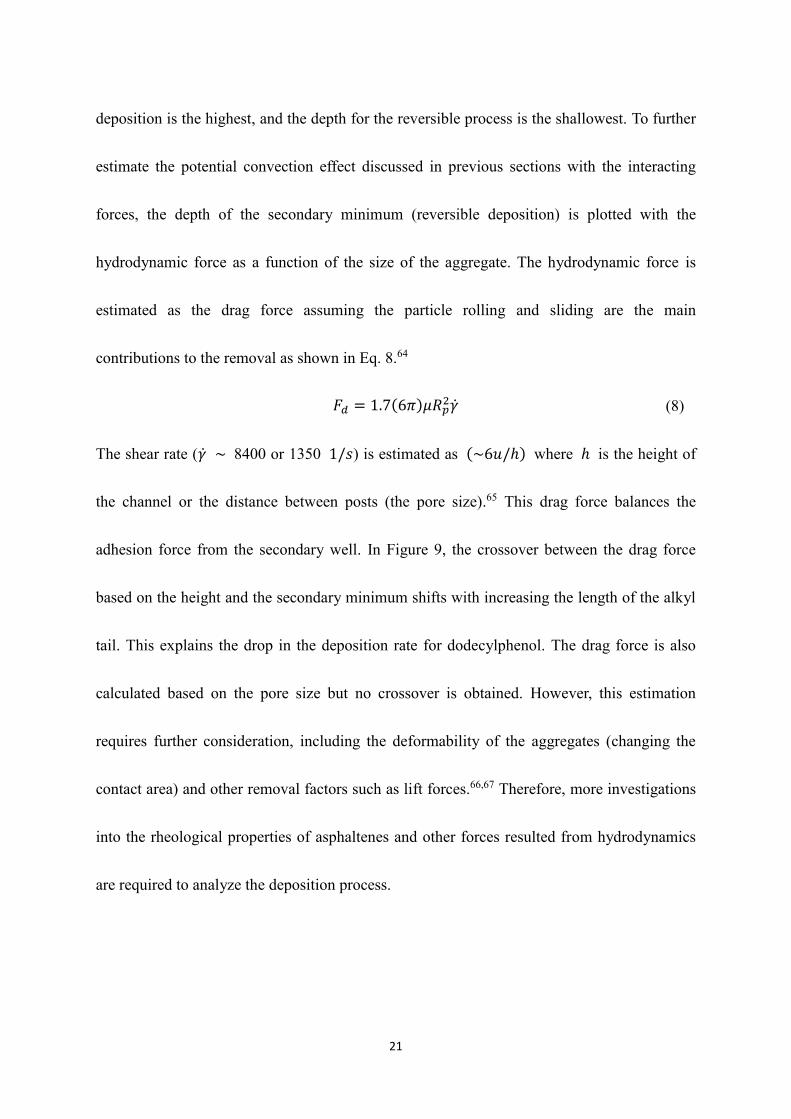
deposition is the highest, and the depth for the reversible process is the shallowest. To further
estimate the potential convection effect discussed in previous sections with the interacting
forces, the depth of the secondary minimum (reversible deposition) is plotted with the
hydrodynamic force as a function of the size of the aggregate. The hydrodynamic force is
estimated as the drag force assuming the particle rolling and sliding are the main
contributions to the removal as shown in Eq. 8.64
𝐹𝑑 = 1.7(6𝜋)𝜇𝑅𝑝2�̇� (8)
The shear rate (�̇� ~ 8400 or 1350 1/𝑠) is estimated as (~6𝑢/ℎ) where ℎ is the height of
the channel or the distance between posts (the pore size).65 This drag force balances the
adhesion force from the secondary well. In Figure 9, the crossover between the drag force
based on the height and the secondary minimum shifts with increasing the length of the alkyl
tail. This explains the drop in the deposition rate for dodecylphenol. The drag force is also
calculated based on the pore size but no crossover is obtained. However, this estimation
requires further consideration, including the deformability of the aggregates (changing the
contact area) and other removal factors such as lift forces.66,67 Therefore, more investigations
into the rheological properties of asphaltenes and other forces resulted from hydrodynamics
are required to analyze the deposition process.
22
Figure 8. Approximation of the interaction between an asphaltene aggregate and an asphaltene-deposited
surface with dispersants. The inset plot is the zoom-in graph of Figure 8. Black line represents p-hexylphenol,
red dashed line is p-octylphenol, and blue dotdashed line is p-dodecylphenol.
Figure 9. The depth of the secondary minimum and the hydrodynamic force are functions of the size of the
asphaltene aggregate. The black line represents p-hexylphenol, red dashed line is p-octylphenol, and blue
dotdashed line is p-dodecylphenol. The orange dotted line represents the hydrodynamic force based on the
height of the micromodel and aqua dotted line is the hydrodynamic force based on the pore size calculated from
Eq. 8.
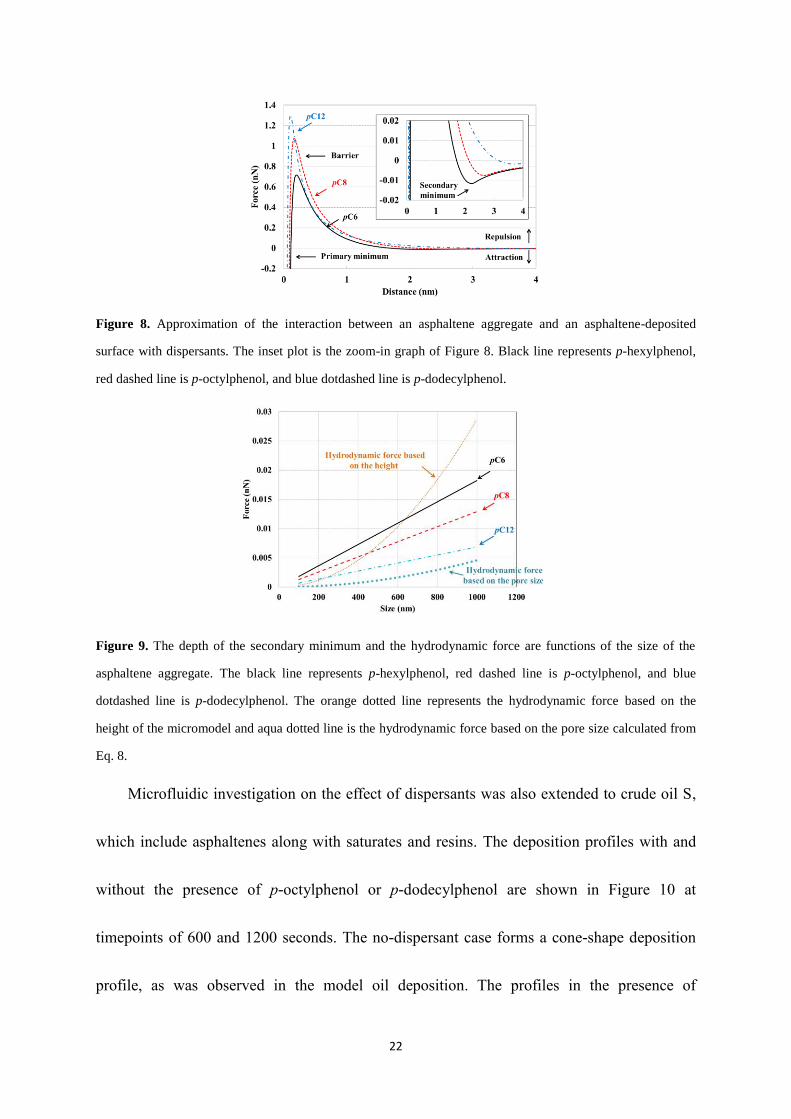
Microfluidic investigation on the effect of dispersants was also extended to crude oil S,
which include asphaltenes along with saturates and resins. The deposition profiles with and
without the presence of p-octylphenol or p-dodecylphenol are shown in Figure 10 at
timepoints of 600 and 1200 seconds. The no-dispersant case forms a cone-shape deposition
profile, as was observed in the model oil deposition. The profiles in the presence of
23
dispersants show more streamlined shapes, as shown in Figure 10e and Figure 10f. This
streamlined shape is possibly caused by a smaller effective aggregate size. This dynamic
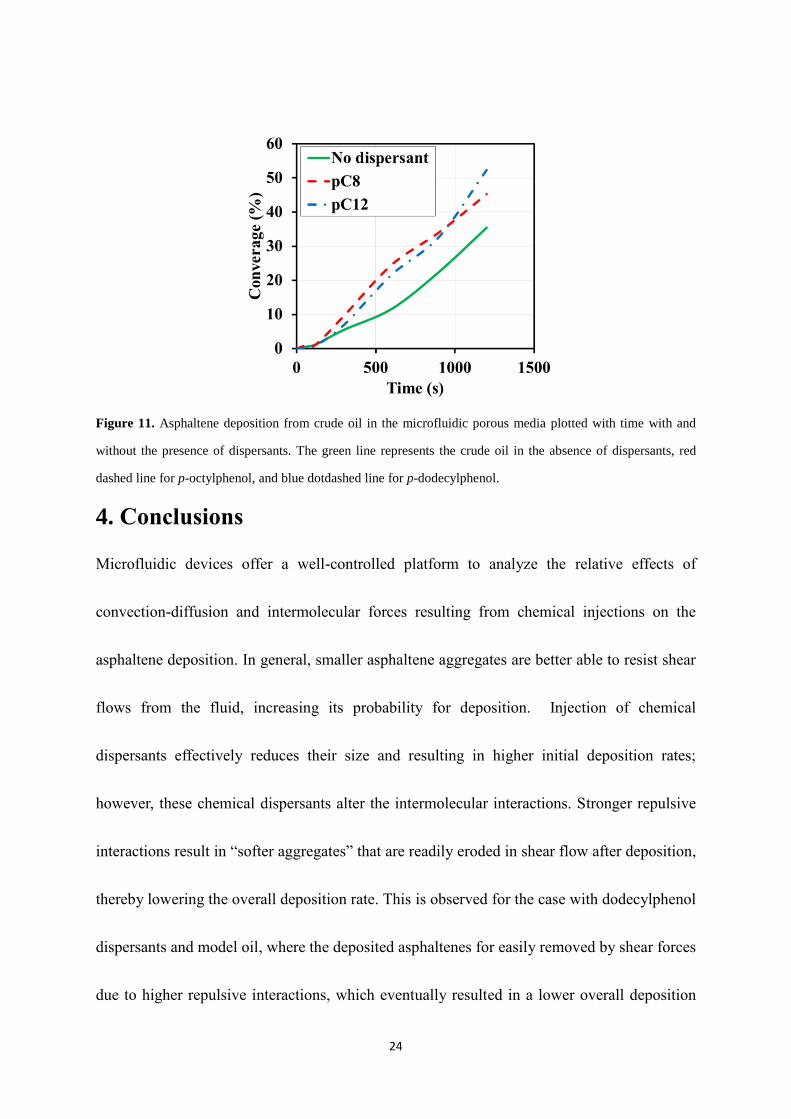
growth of deposition is quantified, as shown in Figure 11. More deposition is obtained with
the presence of dispersants, which is the same trend observed in the model oil tests. However,
the addition of p-dodecylphenol caused more deposition than the case with the presence of
p-octylphenol. There are two possible reasons for this difference. First, there is a significant
amount of saturates in crude oil S, which increases the Hamaker constant for the system.55,56
Hence, the steric repulsion provided by adsorbed dispersants are not strong enough to easily
disrupt the deposited asphaltenes due to shear flow. Second, the combination of resins in the
crude oil and dispersants stabilize the asphaltenes better in the crude oil compared to the
model oil, resulting in even smaller aggregates and less hydrodynamic erosion. Therefore, a
higher deposition rate is observed with the presence of p-dodecylphenol in crude oil S.
Figure 10. Deposition profiles of crude oil S with and without the presence of dispersants taken at 600s for
(a)(b)(c) and 1200s for (d)(e)(f). (a) and (d) are no-dispersant cases. (b) and (e) are for p-octylphenol. (c) and (f)
are for p-dodecylphenol. Scale bar is 500 m. Flow is from left to right.
24
Figure 11. Asphaltene deposition from crude oil in the microfluidic porous media plotted with time with and
without the presence of dispersants. The green line represents the crude oil in the absence of dispersants, red
dashed line for p-octylphenol, and blue dotdashed line for p-dodecylphenol.
4. Conclusions
Microfluidic devices offer a well-controlled platform to analyze the relative effects of
convection-diffusion and intermolecular forces resulting from chemical injections on the
asphaltene deposition. In general, smaller asphaltene aggregates are better able to resist shear
flows from the fluid, increasing its probability for deposition. Injection of chemical
dispersants effectively reduces their size and resulting in higher initial deposition rates;
however, these chemical dispersants alter the intermolecular interactions. Stronger repulsive
interactions result in “softer aggregates” that are readily eroded in shear flow after deposition,
thereby lowering the overall deposition rate. This is observed for the case with dodecylphenol
dispersants and model oil, where the deposited asphaltenes for easily removed by shear forces
due to higher repulsive interactions, which eventually resulted in a lower overall deposition
25
rate. Furthermore, in crude oil systems that include saturates and resins, the asphaltenes are
not as easily destabilized compared to the model oil system. The saturates in crude oil
increase the attractive Hamaker constant for the asphaltene aggregates, while the resins
combined with dispersants reduce the effective aggregate size.
Supporting Information
Images of asphaltene aggregates from optical microscopy and SEM, numerical simulation on
flow through porous media, parameters for steric repulsion approximation, and videos of
deposition.
Author Information
Corresponding Author
*Email: [email protected]
Acknowledgments
We acknowledge the financial support provided by the Abu Dhabi National Oil Co.
(ADNOC), the Abu Dhabi Oil R&D Sub-Committee, and the Petroleum Institute (PI), UAE.
We thank Sun Young Ji, Sang Hun Ji, and Zhuqing Zhang for their technical support.
References
(1) Creek, J. L. Energy Fuels 2005, 19, 1212.
(2) Mullins, O. C.; Sabbah, H.; Eyssautier, J.; Pomerantz, A. E.; Barré, L.; Andrews, A. B.;
Ruiz-Morales, Y.; Mostowfi, F.; McFarlane, R.; Goual, L.; Lepkowicz, R.; Cooper, T.;
Orbulescu, J.; Leblanc, R. M.; Edwards, J.; Zare, R. N. Energy Fuels 2012, 26 (7),
3986–4003.
(3) Leontaritis, K. J. Society of Petroleum Engineers, 1989.
26
(4) Buckley, J. S. Energy Fuels 2012, 26 (7), 4086–4090.
(5) Vargas, F. M.; Garcia-Bermudes, M.; Boggara, M.; Punnapala, S.; Abutaqiya, M.;
Mathew, N.; Prasad, S.; Khaleel, A.; Al Rashed, M.; Al Asafen, H. Offshore
Technology Conference, 2014.
(6) Zhuang, Y.; Goharzadeh, A.; Lin, Y. J.; Yap, Y. F.; Chai, J. C.; Mathew, N.; Vargas, F.;
Biswal, S. L. J. Pet. Sci. Eng. 2016, 145, 77–82.
(7) Chaisoontornyotin, W.; Haji-Akbari, N.; Fogler, H. S.; Hoepfner, M. P. Energy Fuels
2016, 30 (3), 1979–1986.
(8) Chaisoontornyotin, W.; Bingham, A. W.; Hoepfner, M. P. Energy Fuels 2017.
(9) Novosad, Z.; Costain, T. G. Society of Petroleum Engineers, 1990.
(10) Verdier, S.; Carrier, H.; Andersen, S. I.; Daridon, J.-L. Energy Fuels 2006, 20 (4),
1584–1590.
(11) Pazuki, G. R.; Nikookar, M. Fuel 2006, 85 (7–8), 1083–1086.
(12) Gruesbeck, C.; Collins, R. E. Soc. Pet. Eng. J. 1982, 22 (6), 847–856.
(13) Wang, S.; Civan, F. Society of Petroleum Engineers, 2001.
(14) Tuttle, R. N. J. Pet. Technol. 1983, 35 (6), 1192–1196.
(15) Hu, C.; Yen, A.; Joshi, N.; Hartman, R. L. Chem. Eng. Sci. 2016, 140, 144–152.
(16) Chang, C.-L.; Fogler, H. S. Langmuir 1994, 10 (6), 1749–1757.
(17) Chang, C.-L.; Fogler, H. S. Langmuir 1994, 10 (6), 1758–1766.
(18) Rocha Junior, L. C.; Ferreira, M. S.; da Silva Ramos, A. C. J. Pet. Sci. Eng. 2006, 51
(1–2), 26–36.
(19) Schantz, S. S.; Stephenson, W. K. Society of Petroleum Engineers, 1991.
(20) Lightford, S. C.; Pitoni, E.; Mauri, L.; Armesi, F. SPE Prod. Oper. 2008, 23 (3), 301–
311.
(21) Carlos da Silva Ramos, A.; Haraguchi, L.; Notrispe, F. R.; Loh, W.; Mohamed, R. S. J.
Pet. Sci. Eng. 2001, 32 (2–4), 201–216.
(22) Goual, L.; Sedghi, M.; Wang, X.; Zhu, Z. Langmuir 2014, 30 (19), 5394–5403.
(23) Barcenas, M.; Orea, P.; Buenrostro-González, E.; Zamudio-Rivera, L. S.; Duda, Y.
Energy Fuels 2008, 22 (3), 1917–1922.
(24) Rogel, E. Energy Fuels 2011, 25 (2), 472–481.
(25) Juyal, P.; Ho, V.; Yen, A.; Allenson, S. J. Energy Fuels 2012, 26 (5), 2631–2640.
(26) Kraiwattanawong, K.; Fogler, H. S.; Gharfeh, S. G.; Singh, P.; Thomason, W. H.;
Chavadej, S. Energy Fuels 2009, 23 (3), 1575–1582.
(27) Pereira, J. C.; Delgado-Linares, J.; Briones, A.; Guevara, M.; Scorzza, C.; Salager, J.-L.
Pet. Sci. Technol. 2011, 29 (23), 2432–2440.
(28) Melendez-Alvarez, A. A.; Garcia-Bermudes, M.; Tavakkoli, M.; Doherty, R. H.; Meng,
S.; Abdallah, D. S.; Vargas, F. M. Fuel 2016, 179, 210–220.
(29) Hu, C.; Morris, J. E.; Hartman, R. L. Lab. Chip 2014, 14 (12), 2014–2022.
27
(30) Sieben, V. J.; Tharanivasan, A. K.; Ratulowski, J.; Mostowfi, F. Lab. Chip 2015, 15
(20), 4062–4074.
(31) Doryani, H.; Malayeri, M. R.; Riazi, M. Fuel 2016, 182, 613–622.
(32) Qi, Z.; Abedini, A.; Lele, P.; Mosavat, N.; Guerrero, A.; Sinton, D. Fuel 2017, 193,
284–293.
(33) Sieben, V. J.; Tharanivasan, A. K.; Andersen, S. I.; Mostowfi, F. Energy Fuels 2016, 30
(3), 1933–1946.
(34) Kim, M.; Sell, A.; Sinton, D. Lab. Chip 2013, 13 (13), 2508.
(35) Ma, K.; Liontas, R.; Conn, C. A.; Hirasaki, G. J.; Biswal, S. L. Soft Matter 2012, 8 (41),
10669.
(36) Conn, C. A.; Ma, K.; Hirasaki, G. J.; Biswal, S. L. Lab Chip 2014, 14 (20), 3968–3977.
(37) Lin, Y.-J.; He, P.; Tavakkoli, M.; Mathew, N. T.; Fatt, Y. Y.; Chai, J. C.; Goharzadeh, A.;
Vargas, F. M.; Biswal, S. L. Langmuir 2016.
(38) Tavakkoli, M.; Grimes, M. R.; Liu, X.; Garcia, C. K.; Correa, S. C.; Cox, Q. J.; Vargas,
F. M. Energy Fuels 2015, 29 (5), 2890–2900.
(39) Vilas Bôas Fávero, C.; Maqbool, T.; Hoepfner, M.; Haji-Akbari, N.; Fogler, H. S. Adv.
Colloid Interface Sci. 2017, 244, 267–280.
(40) Mohammadi, S.; Rashidi, F.; Mousavi-Dehghani, S. A.; Ghazanfari, M.-H. Can. J.
Chem. Eng. 2016, 94 (9), 1820–1829.
(41) Yudin, I. K.; Anisimov, M. A. In Asphaltenes, Heavy Oils, and Petroleomics; Mullins,
O. C., Sheu, E. Y., Hammami, A., Marshall, A. G., Eds.; Springer New York: New York,
NY, 2007; pp 439–468.
(42) Schneider, C. A.; Rasband, W. S.; Eliceiri, K. W. Nat. Methods 2012, 9 (7), 671–675.
(43) Hunter, J. D. Comput. Sci. Eng. 2007, 9 (3), 90–95.
(44) Nobuyuki, O. IEEE Trans. Syst. Man Cybern. 1979, 9 (1), 62–66.
(45) Adamczyk, Z.; Van De Ven, T. G. . J. Colloid Interface Sci. 1981, 84 (2), 497–518.
(46) Vincent, M. R. de S.; Abkarian, M.; Tabuteau, H. Soft Matter 2016, 12 (4), 1041–1050.
(47) Kusaka, Y.; Duval, J. F. L.; Adachi, Y. Environ. Sci. Technol. 2010, 44 (24), 9413–
9418.
(48) Hoepfner, M. P.; Limsakoune, V.; Chuenmeechao, V.; Maqbool, T.; Fogler, H. S.
Energy Fuels 2013, 27 (2), 725–735.
(49) Buckley, J. S.; Hirasaki, G. J.; Liu, Y.; Von Drasek, S.; Wang, J.-X.; Gill, B. S. Pet. Sci.
Technol. 1998, 16 (3–4), 251–285.
(50) Gonzalez Rodriguez, D. L. Modeling of asphaltene precipitation and deposition
tendency using the PC-SAFT equation of state. Ph.D. Thesis, Rice University, 2008.
(51) Vincent, B. J. Colloid Interface Sci. 1973, 42 (2), 270–285.
(52) Kaneda, I.; Vincent, B. J. Colloid Interface Sci. 2004, 274 (1), 49–54.
(53) Israelachvili, J. N. Intermolecular and surface forces, 3rd ed.; Academic Press:
28
Burlington, MA, 2011.
(54) Berg, J. C. An introduction to interfaces & colloids: the bridge to nanoscience; World
Scientific: Singapore ; Hackensack, NJ, 2010.
(55) Fotland, P.; Askvik, K. M. Colloids Surf. Physicochem. Eng. Asp. 2008, 324 (1–3), 22–
27.
(56) Wang, S.; Liu, J.; Zhang, L.; Masliyah, J.; Xu, Z. Langmuir 2010, 26 (1), 183–190.
(57) de Gennes, P. G. Adv. Colloid Interface Sci. 1987, 27 (3–4), 189–209.
(58) Petosa, A. R.; Jaisi, D. P.; Quevedo, I. R.; Elimelech, M.; Tufenkji, N. Environ. Sci.
Technol. 2010, 44 (17), 6532–6549.
(59) Rahme, K.; Chen, L.; Hobbs, R. G.; Morris, M. A.; O’Driscoll, C.; Holmes, J. D. RSC
Adv. 2013, 3 (17), 6085.
(60) Molnar, I. L.; Johnson, W. P.; Gerhard, J. I.; Willson, C. S.; O’Carroll, D. M. Water
Resour. Res. 2015, 51 (9), 6804–6845.
(61) Franchi, A.; O’Melia, C. R. Environ. Sci. Technol. 2003, 37 (6), 1122–1129.
(62) Tufenkji, N.; Elimelech, M. Langmuir 2004, 20 (25), 10818–10828.
(63) Tufenkji, N.; Elimelech, M. Langmuir 2005, 21 (3), 841–852.
(64) Meinders, J. M.; van der Mei, H. C.; Busscher, H. J. J. Colloid Interface Sci. 1995, 176
(2), 329–341.
(65) Hatch, A. C.; Patel, A.; Beer, N. R.; Lee, A. P. Lab. Chip 2013, 13 (7), 1308.
(66) Burdick, G. M.; Berman, N. S.; Beaudoin, S. P. Thin Solid Films 2005, 488 (1–2), 116–
123.
(67) Gradoń, L. Adv. Powder Technol. 2009, 20 (1), 17–28.
29
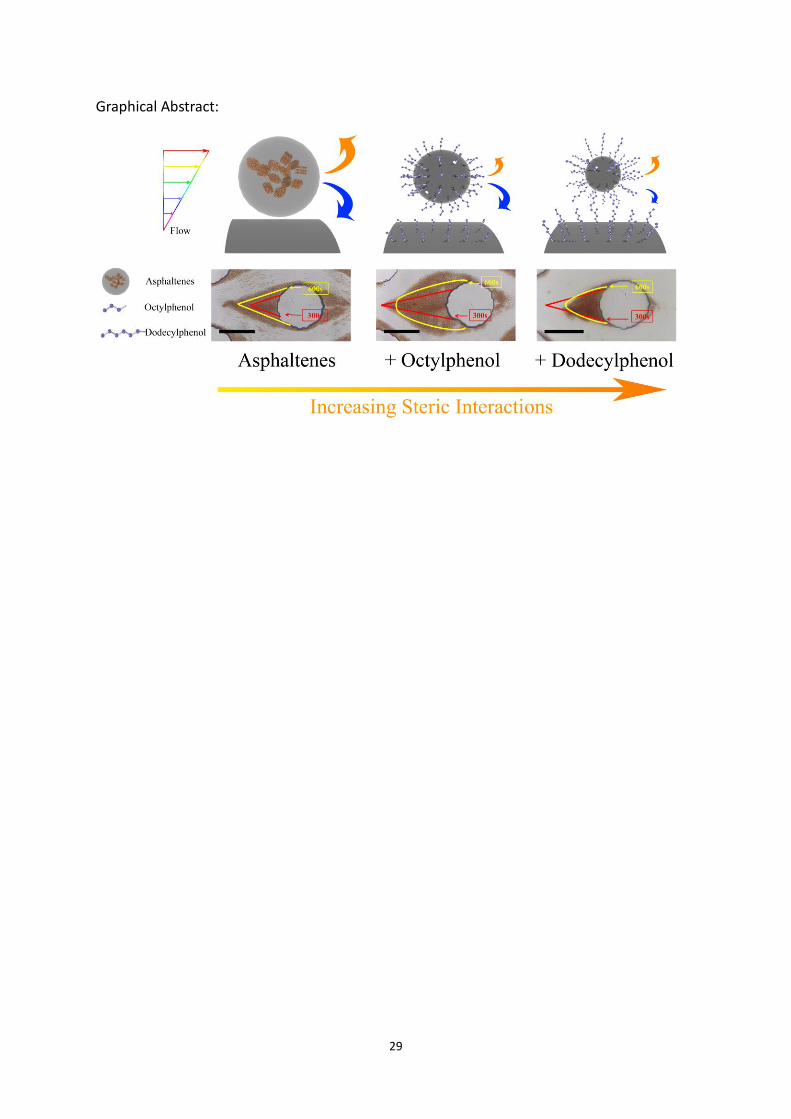
Graphical Abstract: