Embed Size (px)
Citation preview
Charting and Analysis of Turbine Maintenance
Procedures for increased safety in a Nuclear Power Plant
by
ANNELIE WHEELER
24143180
Submitted in partial fulfilment of the requirements for
the degree of
BACHELORS OF INDUSTRIAL ENGINEERING
in the
FACULTY OF ENGINEERING, BUILT ENVIRONMENT AND
INFORMATION TECHNOLOGY
UNIVERSITY OF PRETORIA
PRETORIA
NOVEMBER 2008

BPJ420 Final Project Report
“Charting and analysis of turbine maintenance proc edures for increased safety in a nuclear power plant”
Annelie Wheeler
24143180 BEng(Industrial)4
University of Pretoria
November 2008
ii
Executive Summary
With the growing environmental crisis and the difficulties in fossil-fuel power generation it is expected
that nuclear power will soon be the power source of choice in the world.
The Pebble Bed Modular Reactor (PBMR) in Centurion, Gauteng is an example of innovation in the
nuclear power generation arena. They are striving to produce a nuclear power plant that is safe, efficient
and effective.
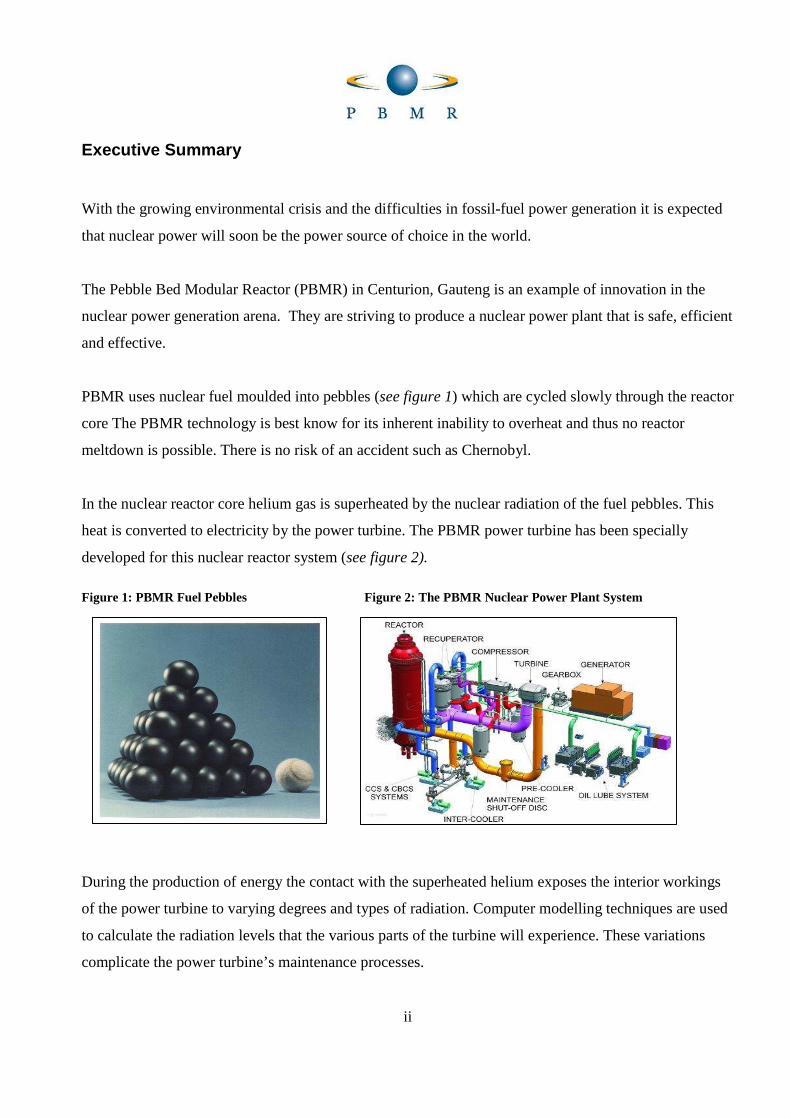
PBMR uses nuclear fuel moulded into pebbles (see figure 1) which are cycled slowly through the reactor
core The PBMR technology is best know for its inherent inability to overheat and thus no reactor
meltdown is possible. There is no risk of an accident such as Chernobyl.
In the nuclear reactor core helium gas is superheated by the nuclear radiation of the fuel pebbles. This
heat is converted to electricity by the power turbine. The PBMR power turbine has been specially
developed for this nuclear reactor system (see figure 2).
Figure 1: PBMR Fuel Pebbles Figure 2: The PBMR Nuclear Power Plant System
During the production of energy the contact with the superheated helium exposes the interior workings
of the power turbine to varying degrees and types of radiation. Computer modelling techniques are used
to calculate the radiation levels that the various parts of the turbine will experience. These variations
complicate the power turbine’s maintenance processes.

iii
This project focuses on the development and analysis of the maintenance procedures for the power
turbine. A process flow diagram was developed to map the total process. This indicated where there
were problem areas such as extremely high radiation exposure levels and tasks that may be impossible to
complete by hand. The process flow diagram also assisted in determining parallel processes which can
shorten working time.
Ergonomics and safety factors were also considered to identify problem tasks, assist in finding potential
solutions and to increase the overall efficiency of the maintenance program. Through this process it was
established that the “Cycle-Out” maintenance approach would be the only viable method.
With this knowledge in hand the remaining maintenance procedures were carefully checked to
determine their inclusion in this approach. Eliminated procedures were not charted. The flow diagrams
for the viable approach were completed and redrawn to include the parallel flows identified.
Upon inspection the original procedure list for the “Cycle-Out” approach was found to be incomplete. It
was thus updated to include several missing procedures. The associated radiation calculations were
made for the missing procedures to complete the data set. Radiation levels were mapped onto the
additional flow diagram to clearly indicate radiation safety levels.
No changes were made to the safety equipment intended for use as no better alternatives could be found.
Procedures where required protection measures prohibited effective working were identified and
alternative methods suggested.

iv
Table of Contents
Executive Summary.................................................................................................................................... ii
Table of Contents....................................................................................................................................... iv
List of Tables and Figures.......................................................................................................................... vi
1. Introduction & Background ................................................................................................................- 1 -
1.1 Introduction...................................................................................................................................- 1 -
1.2 Background...................................................................................................................................- 1 -
2. Project Aim .........................................................................................................................................- 3 -
3. Project Scope ......................................................................................................................................- 5 -
4. Literature Review & Selection of Methods, Tools & Techniques......................................................- 6 -
4.1 Literature Study............................................................................................................................- 6 -
4.1.1 Introduction..........................................................................................................................- 6 -
4.1.2 Nuclear Power Plants and Nuclear Energy.......................................................................- 7 -
4.1.3 Gas Power Turbine..............................................................................................................- 8 -
4.1.4 Radiation Modeling.............................................................................................................- 9 -
4.1.5 Personnel Safety.................................................................................................................- 10 -
4.1.6 Task Times and Turbine Safety........................................................................................- 11 -
4.1.7 Maintenance Procedures...................................................................................................- 12 -
4.1.8 Process Flow Diagrams......................................................................................................- 13 -
4.2 Selection of Methods, Tools and Techniques..............................................................................- 14 -
5. Project Environment and Data Analysis ...........................................................................................- 15 -
5.1 The Project Environment............................................................................................................- 15 -
5.2 Data Gathering and Analysis......................................................................................................- 17 -
5.2.1 The purpose and risks of data gathering:........................................................................- 17 -
5.2.2 Turbine assembly/disassembly procedures.....................................................................- 18 -
5.2.3 Maintenance procedures...................................................................................................- 19 -
5.2.4 Work duration estimates...................................................................................................- 20 -
5.2.5 Radiation modelling...........................................................................................................- 20 -
5.2.6 Maximum safe radiation exposure levels.........................................................................- 21 -
v
6. Development of Conceptual Design/Solution ..................................................................................- 23 -
7. The Charting Process: Development of the Process Flow Diagrams ...............................................- 25 -
7.1 Charting the Maintenance Procedure.................................................................................- 25 -
7.2 Identification of Parallel Streams........................................................................................- 29 -
7.3 Detail Task Analysis.............................................................................................................- 30 -
7.4 Identification of Problem Tasks..........................................................................................- 31 -
7.5 Maintenance Approach Analysis.........................................................................................- 33 -
7.6 Task and Radiation Zone Limitations................................................................................- 35 -
7.7 Potential Solution Identification..........................................................................................- 36 -
8. Correction of Incomplete Data Set & Radiation Calculations..........................................................- 37 -
9. Recommendations for Future work ..................................................................................................- 39 -
10. Conclusion ......................................................................................................................................- 40 -
11. References.......................................................................................................................................- 41 -
11.1 Literature.............................................................................................................................- 41 -
11.2 Tables and Figures..............................................................................................................- 42 -
11.3 General Web References....................................................................................................- 45 -
12. Appendix A.....................................................................................................................................- 46 -
13. Appendix B .....................................................................................................................................- 55 -

vi
List of Tables and Figures
Figure 1: PBMR Fuel Pebbles ………………………………………………………………………….ii
Figure 2: The PBMR Nuclear Power Plant System.................................................................................... ii
Figure 3: A visual overview of Project topics with information flow and future uses...........................- 5 -
Figure 4: Example of machine design drawings for turbine assembly/disassembly ............................- 18 -
Figure 5: Example of 3D computer models for turbine assembly/disassembly ...................................- 19 -
Figure 6: Maintenance Procedure Outline FPD....................................................................................- 19 -
Figure 7: Spreadsheet-based Gantt Chart showing work duration estimates for full maintenance. .....- 20 -
Figure 8: Radiation warning symbol.....................................................................................................- 21 -
Figure 9: Spreadsheet containing process, man-hours and working body distance details. .................- 22 -
Figure 10: Basic process flow diagram example ..................................................................................- 23 -
Figure 11: First-stage PFD for Maintenance tasks 1 – 4.5 ...................................................................- 25 -
Figure 12: First-stage PFD for Maintenance tasks 5.1 – 5.3 ................................................................- 26 -
Figure 13: First-stage PFD for Maintenance tasks 5.4 – 5.9 ................................................................- 27 -
Figure 14: First-stage PFD for Maintenance tasks 13 – 19. .................................................................- 28 -
Figure 15: Second-stage PFD for Maintenance tasks 5.4 – 5.9 ............................................................- 29 -
Figure 16: Process Flow Diagram Block Detail ...................................................................................- 30 -
Table 1: Allowable access times for radioactive zones ........................................................................- 30 -
Figure 17: Radiation Modelling Data Example – Expected Dosages for various distances & stages..- 31 -
Figure 18: Maintenance PFD for tasks 5.4 – 5.9 with zone gradations (Overhaul Approach).............- 32 -
Figure 19: Maintenance PFD for tasks 5.4 – 5.9 with zone gradations (Cycle-Out Approach)...........- 32 -
Table 2: Maintenance Approach comparison in radiation dosages and required manpower ...............- 33 -
Table 3: Radiation Protection Guidelines .............................................................................................- 35 -
Figure 20: Maintenance PFD for sets 13 – 19, with radiation zones....................................................- 37 -
Figure 21: Additional procedures and radiation calculations ...............................................................- 38 -

- 1 -
1. Introduction & Background
1.1 Introduction
PBMR (Pebble Bed Modular Reactor) is a company aimed at the development, construction,
commissioning and maintaining of PBMR nuclear power plants for South Africa. They are based
primarily in Centurion, Gauteng.
PBMR’s current goal is the development and construction of a DPP (Demonstration Power
Plant) at Koeberg in the Cape. The PBMR DPP will be located adjacent to the current Koeberg
Nuclear Power Station. Commissioning is scheduled for 2013.
Safety is paramount in working with nuclear technologies, especially in the application of such
technologies for power generation aimed at being a safe, clean energy source for the people of
South Africa.
A crucial part of the nuclear power generation process is the power turbine. Helium gas is
superheated by radioactive materials in the core of the nuclear reactor and this heat is converted
to electricity by the power turbine. This project focuses on the maintenance procedures of the
power turbine.
1.2 Background
The power turbine is a large and specially designed piece of equipment housed inside two layers
of protective casing and connected to the system through intakes and outlets. As with any other
part of the system, it is both exposed to radioactive materials and requires maintenance to keep it
operating efficiently and safely.
- 2 -
Maintenance for the power turbine is scheduled to occur at 6-year intervals. There are two
approaches than can be used: overhaul or cycle-out. The overhaul approach entails the shut-
down, disassembly, full servicing, reassembly and restarting of the power turbine unit. The
single existing unit is maintained.
The cycle-out approach entails the rotation of two turbine units. During this procedure the entire
existing unit is taken apart and the turbine is cycled out. A new or fully serviced turbine unit is
put in place to operate for the next six years. The removed turbine unit is stored for a period to
promote radioactive decay before servicing occurs. At the next service interval the two turbines
are switched again.
In order to ensure that the maintenance is done safely and efficiently it is necessary for the entire
maintenance procedure to be properly documented and analysed.
Analysis and proper documentation of this procedure will provide structure and detail which
serves to assist in identification of problematic maintenance activities and dangerous radiation
exposure periods.
Improved maintenance information could assist in determining which approach is best to use.

- 3 -
2. Project Aim
The aim of this project is to identify problem areas and research potential solutions for the
maintenance procedures of the PBMR power turbine through the drawing and analysis of a
process flow diagram.
PBMR has been provided with assembly and disassembly data for two differing maintenance
approaches. This data needs to be broken down into manageable sections and charted with an
appropriate process flow diagram (PFD) to allow problematic areas to be identified.
Construction of proper and detailed PFDs will also allow simultaneous tasks to be identified
which will cut down on maintenance time. Individual task times can be allocated accordingly
and the radiation dosages which maintenance personnel will experience can be calculated.
A list of problem tasks and processes can then be identified. This list will provide the
groundwork for the research and development of safe and ergonomic specialised tooling or
procedures that can be used to overcome obstacles for that particular maintenance approach.
Examples of maintenance obstacles that could arise from the PFD and analysis are:
• Operations which will be impossible for personnel to perform manually and should be
mechanised through special tools, or done robotically.
• How carrying out a high radiation procedure is affected by wearing Personal Protective
Equipment (PPE).
• What safety regulations and ergonomic issues a specific task could present.
• How these issues can be solved.

- 4 -
This information has great future potential value for PBMR. It can be used to appropriately
schedule maintenance teams and working times to ensure radioactive safety and balanced dose
periods. It can also be used to develop maintenance manuals and maintenance training materials.
Identification of problem tasks and researching potential solutions can be used in future to
develop specialized tools or robotic solutions.
The PFD and the associated marked safety and ergonomic issues can be used to develop the
detailed maintenance procedures that will be the standard practice for the power turbine. Detailed
maintenance period information regarding the total downtimes for each maintenance approach
could also be used to determine which approach is more viable.
- 5 -
3. Project Scope
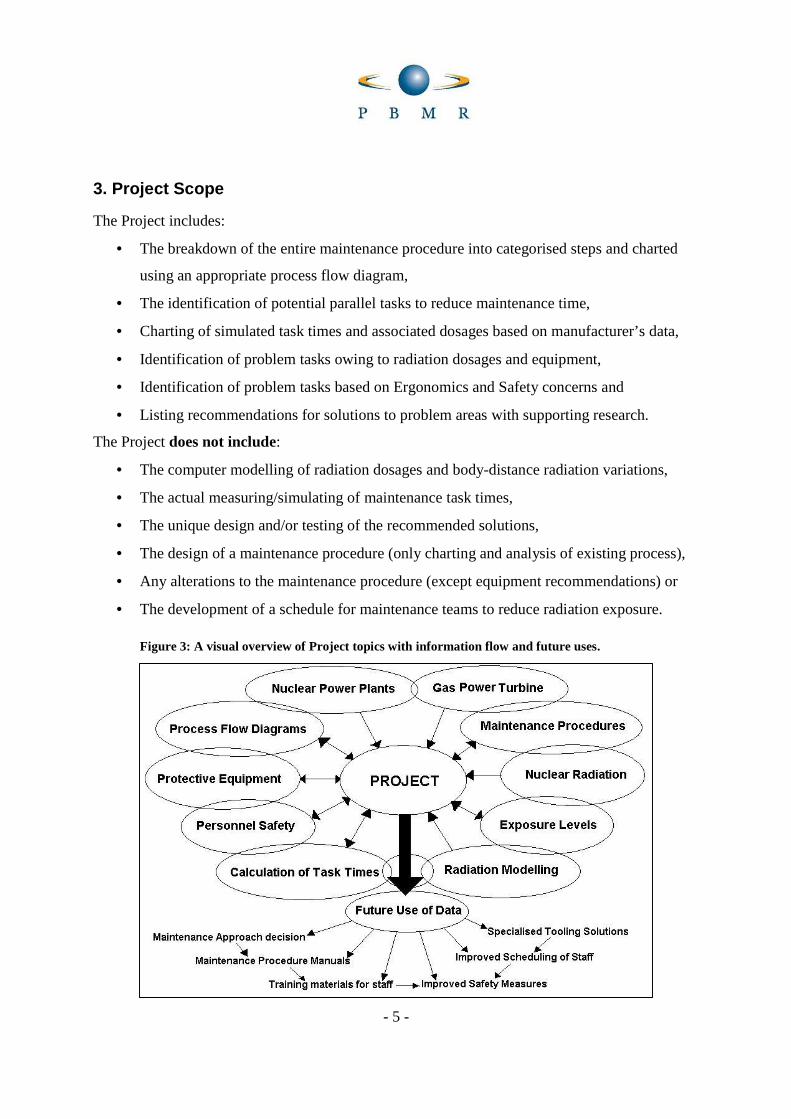
The Project includes:
• The breakdown of the entire maintenance procedure into categorised steps and charted
using an appropriate process flow diagram,
• The identification of potential parallel tasks to reduce maintenance time,
• Charting of simulated task times and associated dosages based on manufacturer’s data,
• Identification of problem tasks owing to radiation dosages and equipment,
• Identification of problem tasks based on Ergonomics and Safety concerns and
• Listing recommendations for solutions to problem areas with supporting research.
The Project does not include:
• The computer modelling of radiation dosages and body-distance radiation variations,
• The actual measuring/simulating of maintenance task times,
• The unique design and/or testing of the recommended solutions,
• The design of a maintenance procedure (only charting and analysis of existing process),
• Any alterations to the maintenance procedure (except equipment recommendations) or
• The development of a schedule for maintenance teams to reduce radiation exposure.
Figure 3: A visual overview of Project topics with information flow and future uses.
- 6 -
4. Literature Review & Selection of Methods, Tools & Techniques
4.1 Literature Study
4.1.1 Introduction
The nuclear power industry is a still a relatively “young” field in the modern world. Although the
technology has been around for more than 40 years a lot of the newer research and development
occurring in this field is not public knowledge. Most projects in nuclear technology are not open
learning environments and as such there is very limited reference material available that directly
covers the specific topic of this project.
While it is true that nuclear energy is a widespread topic with much discussion and debate in
today’s society it is the lack of (or secrecy of) research into the PBMR technology specifically
which constrains this literature review to its fringe topics. As shown in figure 1 on the previous
page there are numerous topics that together form this project.
While research into certain topics is either too vague or still very limited there are many
reference articles which are related to this project. This research covers areas such as the building
of safe nuclear reactors, the use of radioactive materials to generate energy, detection of radiation
levels, human errors and the risks in nuclear power plants.

- 7 -
4.1.2 Nuclear Power Plants and Nuclear Energy
[10] Talamo, Alberto. (2006). Advanced In-Core Fuel Cycles for the Gas Turbine-Modular
Helium Reactor. PhD Thesis. (KTH Royal Institute of Technology)
• Various generations of nuclear power have evolved, each focusing on improved safety
and increased efficiency. This particular study focuses on testing 2 types of fuel in trying
to reduce the decay of the core by increasing passive cooling.
• This project will also be designing a process for the maintenance of a gas power turbine
but the fuel system is designed around pebble bed reactor technology rather than core fuel
rods. This research shows the variety in the application of nuclear energy to power
generation and the various ways that safety in general can be improved.
[6] Jones, Christopher Michael. (2003). Nonproliferation Issues in the Nuclear Energy Future.
Double Master’s Thesis. (Massachusetts Institute of Technology)
• In order to combat the continuing increases in greenhouse gas emissions it is necessary
for less carbon-intensive energy technologies to be developed. The scale required to
combat the environmental challenge will necessitate the development of nuclear power
and a supporting infrastructure with workforce on a global growth scale, even in
developing nations. The author questions not only the realisation of such a scenario but
also the risks involved.
• The completion of this project forms part of the realisation of this scenario. PBMR is
developing advanced nuclear energy technology which is inherently safe and
environmentally friendly in design and in so doing is contributing towards meeting the
global challenge. Future use of the materials developed in this project will also contribute
to creating a workforce capable of maintaining this technology as a safe and reliable
energy source. By improving the safety of the workforce and the technology the risks
involved in moving towards a nuclear-powered future are greatly decreased.
- 8 -
4.1.3 Gas Power Turbine
[13] Zhao, Yongjun. (2005). An Integrated Framework for Gas Turbine Based Power Plant
Operational Modeling and Optimization. Ph.D. Thesis. (Georgia Institute of Technology)
• This research encompasses the proposal of a framework which incorporates all the
various major operational functions of a nuclear power plant that uses a gas turbine as its
power conversion unit. By optimizing all the operational factors of the plant it enhances
the strategic positioning in the electricity supply market for that specific power plant.
• It includes an optimized framework for maintenance scheduling and particularly looks at
the sequential scheduling time intervals. The reality of ageing of the turbines and the
influence it has on shorter periods between preventative maintenance are important to the
profitability of the company.
• In nuclear power plants this operational situation is present with the added factor of the
increased recurring periods of exposure to radiation that the maintenance personnel
experience.
• This project thus acknowledges this operational aspect and introduces a PFD to clearly
define the most effective and safe procedure for maintenance staff of the turbine to
follow. This research also integrates with the concepts of turbine rotation or maintenance
based upon the ageing effects of the radiation. By optimisation of the maintenance
procedures the entire power plant benefits.
[11] Wang, Chunyun. (2003). Design, Analysis and Optimization of the Power Conversion
System for the Modular Pebble Bed Reactor System. PhD Thesis. (Massachusetts Institute of
Technology)
• This study deals with the development of a reference design for an indirect helium cycle
in the power conversion system of a PBMR. The PBMR requires a gas turbine cycle to be
used for its power conversion in order for the technology to achieve economic

- 9 -
competitiveness in the nuclear power generation industry. The author notes that the
efficiency of the helium cycle (power conversion) is significantly affected by the
performance of its individual conversion unit components.
• In analysing the maintenance procedures of the PBMR power turbine this project is
contributing to the performance of the helium cycle as the turbine and compressor form
the largest parts of the power conversion unit of the PBMR. The improved safety and the
clarity of maintenance procedures through the development of the PFD are thus
contributing to the economic competitiveness of the PBMR as a whole.
4.1.4 Radiation Modeling
[7] Ling, Xianbing. (2001). Bayesian analysis for the site-specific dose modeling in nuclear
power plant decommissioning. Master’s Thesis. (North Carolina State University)
• The author uses various modelling frameworks to determine the presence of radiation in
various parts of the environment during and after decommissioning of a nuclear power
plant. He provides information on the various radionuclides and their concentrations
found around the nuclear power plants and then tests for them at those specific sites.
• The process flow diagram of this project takes into consideration the exposure of the
various parts of the turbine to radionuclides which results in subsequent radiation
exposure potential for the personnel handling them during maintenance procedures.
Radiation dose modelling is the best way to judge the expected dosages for specific
areas/items in order to improve safety.

- 10 -
[5] Jacobsson Svärd, Staffan. (2004). A Tomographic Measurement Technique for Irradiated
Nuclear Fuel Assemblies. PhD Thesis. (Uppsala University)
• This research designs a new measuring technique to measure the radiation of fuel rods
without removing them from the assembly plant. It is also possible to apply the design to
measure the radiation levels of spent fuel rods before removing them.
• Similar techniques are used in laboratory settings to model the exposure and absorption
of radiation by the turbines to be used by PBMR. This data is used to ensure the least
possible exposure to the various parts during maintenance as some parts are more
radioactive than others. This influences the design of the PFD for the maintenance
procedure.
4.1.5 Personnel Safety
[3] Delgado-Loperena, Dharma. (2004) Human Error in Nuclear Power Plants: A Stochastic
Dynamic Model. Ph.D Thesis. (University of Missouri-Columbia)
• Chernobyl is an example of a nuclear disaster where failure was attributed to human
error. This study researches the contributors to human performance errors and suggests a
model to be used by nuclear power plant control room operators to ensure a safer
environment.
• This study supports the current project by emphasizing the need to have clear and safe
processes in a nuclear power plant. In this project the specific processes are limited to the
maintenance of the power turbine and the safety of these procedures. Personnel operating
in this particular environment should have well-defined maintenance procedures and
processes which are easy to understand to provide the most efficient task plan with
minimized radiation exposure.

- 11 -
[8] Mkhosi, Margaret Msongi. (2007). Computational fluid dynamics analysis of aerosol
deposition in pebble beds. PhD Thesis. (Ohio State University)
• The essence of this research is to determine the transport by air of radioactive materials if
they were to be released during an accident at a Pebble Bed Nuclear Reactor.
Computational fluid dynamics is used to predict the dispersion of irradiated aerosol
particles from the PBMR.
• This research strongly supports this project as active radionuclides are dispersed
throughout the entire system of the PBMR by the inert helium from the reactor. These
particles travel through the turbine and compressor and are deposited within the
equipment either as plate-out or deposition radiation. Maintenance of the turbine thus has
to take into account this radiation in order to maintain a safe working environment. Both
the research and this project are important in proving the safety of the PBMR to allow for
its subsequent licensing to operate in South Africa.
4.1.6 Task Times and Turbine Safety
[12] Yildiz, Bilge. (2003). Development of a hybrid intelligent system for on-line real-time
monitoring of nuclear power plant operations. M.IT Thesis. (Massachusetts Institute of
Technology)
• This research aimed at improving the monitoring of ongoing operations and productivity
in a nuclear power plant and other environments with complex systems by creating a
monitoring system for early detection of errors. They specifically looked at monitoring
various factors that affect the bearings in complex equipment. Turbines use shafts and
complex bearing structures and which will benefit by such an early warning system as
malfunctions and the resulting loss in production are very costly.
• This project will provide a process flow diagram used during routine maintenance of the
turbine, which will also focus on parallel tasks to ensure that no unneeded time is wasted
during maintenance, not only for the limitation of exposure to radiation, but also for the

- 12 -
minimizing of downtime of the turbine. Turbine downtime means no power generation
which results in economic losses. A real-time monitoring system such as the research
describes will continue to operate through maintenance and improves the safety of the
working environment.
4.1.7 Maintenance Procedures
[9] Smith, Curtis Lee. (2002). Risk-informed incident management for nuclear power plants.
Ph.D Thesis. (Massachusetts Institute of Technology)
• In this research the author examines various factors that influence decision making in the
operations of a nuclear power plant then develops a methodology and tests it in two case
studies requiring informed decisions during incidents in the plant. He provides a tool with
which managers can defend their decisions as it is based on sound scientific principles
and includes all factors relevant to the specific environment.
• The methodology eliminates personal preferences and ensures that various groups who
give input to the decisions all consider similar factors, which if not guided by a given
methodology for decision making, can result in increased risk affecting efficiency and
economics.
• This project proposes to achieve a similar result, thus providing the maintenance team
with a clear and scientific process to approach the maintenance of the turbine. Radiation
exposure specifics and parallel tasks have been predetermined and translated into
procedure and safety regulations.
[4] Erguina, Vera. (2004). Safety assured financial evaluation of maintenance. Ph.D Thesis.
(Texas A&M University)
• Continued economic success is the reason for this model, while balancing this with the
safety and environmental factors influencing the maintenance scheduling. The study

- 13 -
looks at maintaining reliability and how to allocate funding to keep reliability optimal.
The author acknowledges that the reliability of the operations at a nuclear power plant is
based on the initial reliability of the plant and the subsequent reliability of maintenance
procedures.
• Although this research and modelling is done in the traditional environment of
radioactive cores which are prone to decay and cooling issues (with the possibility of
meltdown as the extreme case of failure) the reliability factors of the nuclear power plants
are similar in their effect on safety and profitability. The analysis of maintenance
procedures from a safety perspective is the exact undertaking of this project.
4.1.8 Process Flow Diagrams
[1] Bandara, Wasana. (2007). Process modelling success factors and measures. PhD Thesis.
(Queensland University of Technology)
• The author has researched the application of business process modelling as a process
design technique with a focus on “how” to do this effectively. This research is the first
study which has shown empirical evidence for the success of process modelling
techniques. It also considers the proper identification of the process and the workflow as
guidelines in effective management.
• While business and a turbine may be very different process scenarios the fact remains
that processes need to be understood. While businesses require process models the
turbine maintenance procedure requires an effective process flow diagram. Properly
identifying and charting the workflow as a PFD will assist in effectively managing the
maintenance procedure.
[2] Blomqvist, Peter & Wygler, Franz. (2006). Analysing and Reengineering the Order Process
at Noblessa Sverige AB: A Pre-Study for an ERP System Implementation. Master’s Thesis’.
(Linköping University)

- 14 -
• This research focuses on the analysis and re-engineering of an order process system at a
sales company as preparation for the acquisition of an ERP system to increase order
capacity. In order to understand the current order process the system was mapped so that
improvement areas could be identified. This process mapping was then used to develop
an improved process.
• This research supports the selection of process flow diagrams as the major tool for this
project. In order to enhance the safety and improve the maintenance procedures it is
necessary to understand the process. Mapping the process using process flow diagrams
will result in the ability to identify problem areas so that improvements can be made.
4.2 Selection of Methods, Tools and Techniques
The major technique for the execution of this project will be the charting of the maintenance
procedures using process flow diagrams.
The PFD will be detailed with other applicable collected data in order to create a comprehensive
and detailed yet logical and understandable maintenance flow diagram. This PFD can then be
used to identify problem areas in the maintenance procedures with regards to radiation dosages.
General research and ingenuity will be applied to discover potential solutions to problem areas.
Ergonomics and general safety (in adherence with the Occupational Health and Safety Act) will
be considered when identifying problems and potential solutions.

- 15 -
5. Project Environment and Data Analysis
5.1 The Project Environment
This project falls under the auspices of the Special Tooling Division of PBMR. Special Tooling
is dedicated to the analysis and development of specialised equipment solutions for the PBMR.
This stems from the lack of existing tools and machinery available to maintain and operate the
very unique design of this PBMR.
Work done in this particular division is mostly in digital format however hard copies of all
materials are maintained for reference purposes. Often scale models are built to assist in
understanding and solving unique design problems. A large open-plan office with mid-height
cubicles provides a good balance between interaction, communication, personal space and
privacy.
PBMR has catered for this project by providing collections of data, support from its engineers in
this division, a working space within the offices of the division and has offered internet
connectivity as well as a computer with software on which to work. The offices provide all
necessary amenities for a working environment. A prerequisite for the undertaking of this project
is that all source data and work done on this project will remain the property of PBMR. All
information forming part of this project will be governed by PBMR’s intellectual property rights.
This project cannot be ranked as “vital” to the company however it is “necessary” that the work
be done in order for the construction of the plant to go ahead. This can be said for almost any of
the work taking place within PBMR. With commissioning of the DPP set for 2013 there is
somewhat pressure to meet deadlines for approvals from the National Nuclear Regulator (NNR),
a public entity reporting to the Department of Minerals and Energy.

- 16 -
The necessity for the completion of this work will still exist even if the work were not
undertaken for the purposes of this project. The work is ideally suited for the Industrial
Engineering discipline as it contains a great deal of process flow diagram creation and analysis
as well as safety and ergonomics aspects.
For the purposes of this project stakeholders are defined as any party with an interest in the work
of this project or any party who may benefit (even unknowingly) from the work done in the
project.
The stakeholders of this project are:
• The candidate (this student),
• PBMR Special Tooling Division,
• PBMR Demonstration Power Plant (DPP) Division,
• Maintenance and training manual creators for turbine operations (PBMR),
• PBMR turbine maintenance workers,
• The Department of Industrial Engineering, UP,
• Eskom and
• The general electricity-consuming populace of South Africa.
- 17 -
5.2 Data Gathering and Analysis
The data for this project has been sourced by way of the Special Tooling division of PBMR. The
data in its raw form consists of documentation from both the turbine manufacturer and the
turbine systems design teams at PBMR. No actual documentation has been included in this
report owing to the confidential nature of these documents. Examples and extracts are shown.
This data analysis does cover the purpose, organisation and quality of the data gathered. The data
is divided into sets of which the content and use of the data are explained. The relationship
between the gathered data as it relates to this project is also shown. The data only takes into
account non-emergency and standard operational events. Emergency situations, such as
breakages or penetrations are outside the scope of this project.
5.2.1 The purpose and risks of data gathering:
This project has significant practical application rather than theoretical formulation. Without the
data gathered it would not be possible to do this project as it is, simply put, merely a logical
consolidation and rearrangement of the various data sets into a simple, logical and useful form.
This is then used to identify problems and research potential solutions in order to improve safety.
Without obtaining all the required data possible this project would be extremely risky. It is thus
important to ensure that all the necessary data was gathered before proceeding with the task.
Lack of data in any particular set could cause incorrect or incomplete results which, given the
environment in which this project lies, could cause a very unsafe working environment.

- 18 -
5.2.2 Turbine assembly/disassembly procedures
Detailed assembly/disassembly procedures for the entire turbine unit are documented in three
formats:
• Textual – step by step written instructions (example not shown)
• Schematic – a series of machine design drawings (see Image 3)
• Graphic – a collection of 3D computer models (see Image 4)
It must be noted that the assembly and disassembly procedures for the turbine are identical but
reversed. Also, assembly/disassembly should not be confused with maintenance. While
maintenance does require disassembly and assembly of the turbine it also requires other tasks
such as actual repair work which distinguishes it from normal assembly/disassembly procedures.
Figure 4: Example of machine design drawings for turbine assembly/disassembly

- 19 -
Figure 5: Example of 3D computer models for turbine assembly/disassembly
5.2.3 Maintenance procedures
Figure 6: Maintenance Procedure Outline FPD
The maintenance procedures are provided in two
formats though not all information is present in both.
The outline of the maintenance procedures is provided
in a rough flow-diagram fashion (see Image 5). This
flow diagram contains very little detail and excludes
the effects of radiation.
The full details of the turbine maintenance procedure
can be extracted (in spreadsheet format) from the
working body distances and man-hours documentation
(see section 5.2.7).

- 20 -
5.2.4 Work duration estimates
.
The turbine manufacturer has compiled a spreadsheet-based Gantt Chart to document the
expected work duration estimates for the two maintenance approaches. (see Image 6)
These show the full time period estimated for disassembly, inspection, repair and reassembly of
the power turbine. This data will be used to both generate and moderate the total process flow
diagram that will be developed.
Figure 7: Spreadsheet-based Gantt Chart showing work duration estimates for full maintenance.
5.2.5 Radiation modelling
Atomic radionuclides generated in the core of the nuclear reactor are carried through the power
plant system by the superheated helium gas. These radionuclides are deposited throughout the
system in two manners: “plate out”or “dust deposition”. Most of the radioactivity present in the

- 21 -
turbine is due to the plate-out of the radionuclides on the inner surfaces. Radioactive dust also
settles on these surfaces but their radioactivity is negligible to that of the plate-out deposits.
To assist in the planning of the maintenance tasks and especially in planning the appropriate
radiation protection measures which may be required the radiation dose rates have been
calculated at a number of locations around the turbine at various stages of disassembly,
inspection and possibly repair.
The computer modelling of the radiation levels has been done using specialised software. The
comprehensive details of these models as well as explanatory text regarding the results have been
provided. This data is mostly in text and table formats. Modelled dose rates which exceed the
specified criteria for safe operating conditions have been highlighted.
5.2.6 Maximum safe radiation exposure levels
Figure 8: Radiation warning symbol
In order to maintain the safety of workers during
maintenance it is necessary to understand the limits of the
human body with relation to radiation exposure. Many
years of medical testing and research into these fields have
determined safe exposure levels. These dose rates are
moderated and approved by nuclear authorities such as the
NNR and are reviewed on an international level.
The maximum safe dose rates as approved for the PBMR
have been tabulated and are included in the modelling
documentation (see section 5.2.5).

- 22 -
5.2.7 Working body distances & man-hours
The distances between the body of the worker and the irradiated components are documented in
a spreadsheet which also contains the detailed maintenance process. The man-hours required for
certain processes are also tabulated in this document. These three data sets will play a vital role
in the creation of the PFDs for this project. Below is a segment of the spreadsheet (see image 8).
Useful information derived from the spreadsheet regarding turbine (dis)assembly requirements:
� 11 523 man hours if the turbine inner casing and turbine rotor assembly are reused,
� 2 738 if the inner casing assembly is replaced with a pre-assembled inner casing,
� 3.3 workers minimum to complete the assembly in 345.9 days, or
� 18 workers maximum to perform the assembly in the shortest possible time (202.6 days).
� A dedicated maintenance area on the maintenance facility floor,
� 200mm approximate working distance from the worker's body.
Figure 9: Spreadsheet containing process, man-hours and working body distance details.

- 23 -
6. Development of Conceptual Design/Solution
As stated a process flow diagram will be created from the data gathered. The PFD is the first and
largest step. The PFD will structure the data in a logical and complete manner. By combining all
the various data sets it will be possible to detail the PFD with all the information necessary to
properly analyse the maintenance procedure as a whole.
Shown below is a simple flow diagram example drawn in Visio. The flow diagrams for the entire
project will be drawn in Visio and will contain more detail than the example below.
Figure 10: Basic process flow diagram example

- 24 -
The PFD will evolve through the following steps:
• Charting the entire maintenance procedure in sequence.
• Identify and name each individual task block.
• Identification of parallel streams.
• Populate tasks with information - task times, radiation measures, body distances, etc.
• Calculate task exposure values using detail information.
• Identify tasks in which maximum radiation dosages are exceeded and highlight these.
• Identify tasks in which ergonomic or other safety issues are present.
• Analyse the specific task/s to determine the exact cause of excess.
• Research available solutions and limitations based on specific task.
• Determine potential solution measures to overcome radiation or other problems.
• Summarise all useful information into a single project document.

- 25 -
7. The Charting Process: Development of the Process Flow Diagrams
7.1 Charting the Maintenance Procedure
The first step in the development of the Process Flow Diagrams was mapping the process fully in
its original form. Microsoft Visio was used to draw up the process flow diagrams. Three
examples of first-stage process flow diagrams are shown in Figures 11, 12 and 13 below.
Figure 11: First-stage PFD for Maintenance tasks 1 – 4.5
The tasks have been mapped in single file. The first task in a series is indicated in blue. Total
process details are included at the end of each page in green. The PFD is structured in a basic
zigzag pattern. No parallel tasks have been identified for this set and it remains as is.

- 26 -
A legend provides explanation of the contents of each task block, namely:
• Operation #
• Operation Name
• Number of workers required for each task
• The number of work-hours required per worker to complete the task
• The total number of man-hours (all workers)
• The number of days for a task, where a day is equal to 10 work-hours
• The working distance, in mm, from the body (Radiation Activity Distance)
Individual Process Flow Diagram pages follow on from one another. Figure 12 shows the second
page of the Process Flow Diagram.
Figure 12: First-stage PFD for Maintenance tasks 5.1 – 5.3

- 27 -
The Process Flow Diagrams are very cramped. The lack of parallel flows makes the maintenance
process seem very linear. Below is the third example of a first-stage PFD.
Figure 13: First-stage PFD for Maintenance tasks 5.4 – 5.9
The Original maintenance tasks run from set 1 to set 19. The number of tasks within a set varies
between 1 and 40. Later elimination of unnecessary procedures decreased the maintenance sets
to 1 - 4, 6, 7 and 13-19 only. (Sets 5 and 8 – 12 eliminated).

- 28 -
Figure 14 shows the first-stage process flow diagram for tasks 13 – 19. Note that tasks 6 and 7
are single –step tasks and are included in this diagram as an aside.
Figure 14: First-stage PFD for Maintenance tasks 13 – 19.
- 29 -
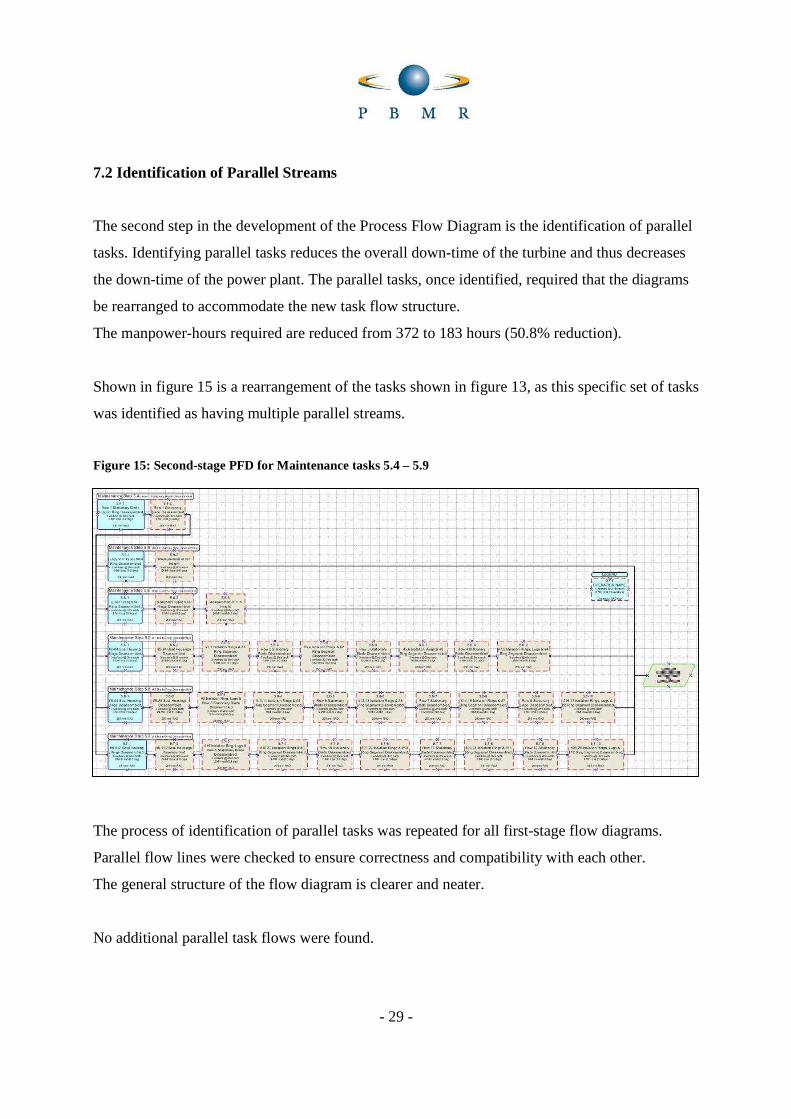
7.2 Identification of Parallel Streams
The second step in the development of the Process Flow Diagram is the identification of parallel
tasks. Identifying parallel tasks reduces the overall down-time of the turbine and thus decreases
the down-time of the power plant. The parallel tasks, once identified, required that the diagrams
be rearranged to accommodate the new task flow structure.
The manpower-hours required are reduced from 372 to 183 hours (50.8% reduction).
Shown in figure 15 is a rearrangement of the tasks shown in figure 13, as this specific set of tasks
was identified as having multiple parallel streams.
Figure 15: Second-stage PFD for Maintenance tasks 5.4 – 5.9
The process of identification of parallel tasks was repeated for all first-stage flow diagrams.
Parallel flow lines were checked to ensure correctness and compatibility with each other.
The general structure of the flow diagram is clearer and neater.
No additional parallel task flows were found.

- 30 -
7.3 Detail Task Analysis
Each task block in the new Process Flow Diagram contains detailed information about the task
itself as described in Section 7.1. These details, coupled with the radiation modelling data for
each task had to be analysed to determine where radiation levels exceeded safe levels or
exposure times were too great.
Figure 16: Process Flow Diagram Block Detail
The safe radiation levels are based on the following data:
1. A maximum acceptable dose rate of 1.7mSv/h at 1 cm distance from the outer shield or
unshielded source surface.
2. A maximum acceptable rate of 60µSv/h at 20 cm distance
Following modelling, the radiation emissions have been zoned for clarity in distance and time
exposure. Zones R1 (Gray) and R2 (Green) fall below the relevant criterion value while zones
R3 (Yellow), R4 (Pink) and R5 (Red) are situations where the radiation exposure exceeds
maximum safe levels.
Table 1: Allowable access times for radioactive zones
Zone Mean Access Requirement [h/y]
Maximum Access Requirement [h/y]
Dose rate limits for zone [µSv/h]
R1 500 2000 <5
R2 50 500 5<χ<50
R3 10 50 50<χ<500
R4 1 10 500<χ<5000
R5 <1 >5000

- 31 -
The radiation modelling results were presented in a series of tables and images which are colour-
coded to match the Radiation Zones described. Examples of these are shown in Figure 17.
Figure 17: Radiation Modelling Data Example – Expected Dosages for various distances & stages
7.4 Identification of Problem Tasks
The initial radiation modelling suggested that the inner casing radiation dosages would be
beyond safe levels even after a five-year radioactive decay period. This implied that all such
tasks would automatically exceed the safe dose and would thus require safety equipment.
Safety standards indicate that the resulting radiation exposure from maintenance tasks should be
less than 2mSv per person per year. Radiation calculations were provided for both maintenance
approaches.

- 32 -
Based on these values, the process flow diagrams were colour-coded to identify dangerous tasks.
Figure 18: Maintenance PFD for tasks 5.4 – 5.9 with zone gradations (Overhaul Approach)
It was noticed, however, that for the same set of tasks using the Cycle-Out maintenance approach
(replacing of inner casing and turbine assembly with spare and 5 year decay period before
maintenance) the radiation zones were greatly altered. Figure 19 shows the alternative zones.
Figure 19: Maintenance PFD for tasks 5.4 – 5.9 with zone gradations (Cycle-Out Approach)

- 33 -
7.5 Maintenance Approach Analysis
The Maintenance Approach was the first and largest problem encountered. As shown in Figures
18 and 19 the radiation dosages vary greatly between the two approaches. The resulting
manpower required for the tasks (taking into account worker rotations due to radiation) in
overhaul also bordered on the ridiculous. Shown in table 2 is a comparison between the
requirements for Overhaul and Cycle-Out.
Table 2: Maintenance Approach comparison in radiation dosages and required manpower
Task
Min Worker
[a]
Dose Rate [c]
(µSv/h)
Total Dose Rate per worker
(µSv/h x h) Zone
Required min worker
based on dose rate
limit
Dose Rate [c']
(µSv/h)
Total Dose Rate per worker
(µSv/h x h) Zone
Required min worker
based on dose rate
limit 5.5-1 3 2000 6000 R4 180 11 33 R2 4 5.5-2 3 2000 16000 R4 180 11 88 R2 4 5.5-3 3 2000 6000 R4 180 11 33 R2 4 5.5-4 3 2000 4000 R4 180 11 22 R2 4 5.5-5 3 2000 6000 R4 180 11 33 R2 4 5.5-6 3 2000 4000 R4 180 11 22 R2 4 5.5-7 3 2000 6000 R4 180 11 33 R2 4 5.5-8 3 2000 4000 R4 180 11 22 R2 4 5.5-9 3 2000 8000 R4 180 11 44 R2 4 5.6-1 3 2700 8100 R4 243 11 33 R2 4 5.6-2 3 2700 21600 R4 243 11 88 R2 4 5.6-3 3 2700 10800 R4 243 11 44 R2 4 5.6-4 3 2700 8100 R4 243 11 33 R2 4 5.6-5 3 2700 5400 R4 243 11 22 R2 4 5.6-6 3 2700 8100 R4 243 11 33 R2 4 5.6-7 3 2700 5400 R4 243 11 22 R2 4 5.6-8 3 2700 8100 R4 243 11 33 R2 4 5.6-9 3 2700 5400 R4 243 11 22 R2 4 5.6-10 3 2700 8100 R4 243 11 33 R2 4 5.7-1 3 170000 510000 R5 15300 52 156 R3 9 5.7-2 3 170000 1360000 R5 15300 52 416 R3 9 5.7-3 3 170000 680000 R5 15300 52 208 R3 9 5.7-4 3 170000 510000 R5 15300 52 156 R3 9 5.7-5 3 170000 340000 R5 15300 52 104 R3 9 5.7-6 3 170000 510000 R5 15300 52 156 R3 9 5.7-7 3 170000 340000 R5 15300 52 104 R3 9 5.7-8 3 170000 510000 R5 15300 52 156 R3 9 5.7-9 3 170000 340000 R5 15300 52 104 R3 9 5.7-10 3 170000 510000 R5 15300 52 156 R3 9

- 34 -
After analysis of the range of problem tasks, specifically those of the overhaul-procedure
maintenance of the inner casing assembly it was obvious that on-the-spot maintenance of the
inner casing was unfeasible. Overhaul of the inner casing assembly would require
• large amounts of cumbersome and expensive protective equipment,
• more personnel to place into maintenance rotations in order to reduce radiation exposure
per person to safe levels, which increases labour costs
• longer downtime to overhaul on the spot, reducing capacity and decreasing income
• extra manpower would require extra training of personnel for work under time pressure
in an extremely dangerous environment, which would be economically unviable
The actual economic effects of these factors have yet to be quantified, however it is generally
accepted that the economic shortcomings of the overhaul approach would greatly outweigh the
costs involved in maintaining a replacement assembly and allowing radioactive decay before
maintenance occurs.
The overhaul maintenance approach is thus not recommended. The cycle-out maintenance
approach was therefore decided upon. The remaining process flow diagrams were drawn based
on this information.
The elimination of procedures belonging to the overhaul maintenance approach decreased the
total maintenance sets to 1 - 4, 6, 7 and 13-19 only. Sets 5 and 8 – 12 were removed. The
diagrams for set 5 are still included in this report as their radiation levels were the critical factor
in determining the feasibility of the approaches.
The final complete process flow diagrams for the cycle-out approach are shown in Appendix A.

- 35 -
7.6 Task and Radiation Zone Limitations
The following guidelines are specified for required protective measures for maintenance tasks
performed in the radiation zones:
Table 3: Radiation Protection Guidelines
Zone Required Protection Dose Rate Limit
(µSv/h) R1 • Wear protection mask to prevent internal exposure
• Wear film badge to monitor external exposure • Shielding suit is preferable to prevent external exposure of β
radiation • Allowable working time shall be less than 10 hours per day
<5
R2 • Wear protection mask to prevent internal exposure • Wear film badge and alarm meter to monitor external exposure • Wear shielding suits to prevent external exposure of β radiation • Allowable working time shall be less than 10 hours per day
5< χ <50
R3 • Wear protection mask to prevent internal exposure • Wear film badge and alarm meter to monitor external exposure • Wear shielding suits to prevent external exposure of β radiation • Suitable shielding objects are required to prevent radiation • Allowable working time shall be less than 10 hours per day
50< χ <500
As is shown, radiation guidelines only cover the zones 1 to 3. R4 and R5 zones are so highly
irradiated that very few protective measures are capable of reducing the exposure levels. R3
exposure already requires bulky shielding suits as well as shielding objects.
R4 and R5 are thus highly unviable working conditions especially when coupled with the severe
time restrictions placed on such levels of exposure, resulting in very high labour figures.

- 36 -
7.7 Potential Solution Identification
Several basic radiation contamination prevention procedures have been identified by PBMR.
These include pre-maintenance preparation of the room as well as the preparation for workers.
Two types of radiation suits have been identified by PBMR as potential protective measures.
These are the basic airtight “Tyvex Suit” and the heavier perfectly airtight “Air Line Suit” with
an oxygen cylinder. Workers will also be required, on occasion, to use radiation shields for
additional protection. Both the suits and the shields will decrease working efficiency but this has
been factored into the maintenance plan already.
Additionally, jigs for lifting larger objects have been designed along with the machinery they
were created for. These jigs thus fall outside the scope of this project. Additional specialised
tooling for specific tasks are being developed by application to the first turbine prototype model
as well as through advanced simulation modelling.
No additional information was available on potential alternatives as none currently exist in the
marketplace. Until such time as improved protective equipment is internationally available at
feasible prices the Tyvex suits and radiation shields will be used.
As explained in section 7.6 the radiation protection guidelines for R3 already require the use of
shielding objects. Shielding objects are heavy, bulky and reduce worker capability as well as
taking up at least one hand. Working under such conditions would greatly hamper productivity.
In order to recommend alternatives for these specific tasks, all tasks with radiation zone
classifications of R3 or higher had to be identified. The data was incomplete, however, and had
to be corrected before this could occur.

- 37 -
8. Correction of Incomplete Data Set & Radiation Ca lculations
As stated before, the radiation-based maintenance procedure set was incomplete and required the
addition of the procedures 13 – 19. In order to identify any R3 classified tasks the radiation zone
calculations for these added tasks had to be calculated. These can be seen in Figure 21 on the
following page.
Only two of the added tasks were identified as R3. In existing charts only task set 4.5 was
identified as R3. The radiation zones were mapped onto the process flow diagram, as seen in
Figure 20 below. All zones identified are still feasible for work.
Figure 20: Maintenance PFD for sets 13 – 19, with radiation zones.

- 38 -
Figure 21: Additional procedures and radiation calculations

- 39 -
9. Recommendations for Future work
This project has created several opportunities for further work related to the turbine maintenance
procedures at PBMR. These topics include:
• Full charting of the maintenance procedures for the stored turbine unit after 5 years
• Investigation of alternative protection equipment and measures, with the possibility of
development of new and improved items to cater to the needs of the workers
• Financial analysis (break-even analysis) of alternate maintenance approaches
• Creation of maintenance manuals and training materials for turbine maintenance
• Development of personnel rotation schedules for maintenance work
• Development of automation for tasks with high radiation levels or which require
additional shielding to reduce task inefficiency and increase safety.
In particular, one large potential future development announced at PBMR which may be
impacted by the results of this project is the recent idea to change the power generation plant to a
water-based system. In this proposal, the super-heated helium will, through a heat exchange
system, heat water to create steam which would drive the turbine.
A steam-driven system will be slightly less inefficient overall owing to energy lost in the heat
exchange but will significantly reduce the radiation levels passing through the turbine and
compressor units. If radiation levels are reduced far enough the overhaul maintenance approach
may become feasible again.
With respect to the results of this project, the following actions are recommended to improve
safety and decrease working time:
• Task sets 4.5 and 13.1 be automated if possible, or to as great an extent as is possible.
• If not possible, additional shielding objects be mechanised to some degree to free the
worker from having to hold and move them around

- 40 -
10. Conclusion
This project has produced results which are of great value to PBMR. The development of the
process flow diagrams and the association of the radiation measures have provided a visual tool
in understanding the processes, the safety levels of the tasks and identification of problem areas.
The most valuable output of this project is the discovery of the infeasibility of the overhaul
maintenance approach owing to the extremely high radiation levels and ridiculously high number
of workers required to complete the tasks. This revelation will reduce the amount of work to be
done in task and tool simulations, writing of manuals and training materials, and the analysis of
the economics of running the plant.
In addition, by charting the flow diagrams a foundation has been established for further charting
and detailed analysis of work, not only in the turbine maintenance field but also elsewhere. The
success of combining process flow diagrams with radiation modelling figures and ergonomics
can be applied to numerous radiation-exposed procedures throughout the plant to increase the
levels of safety for all workers.
The identification of specific tasks that may require automation or partial mechanisation will also
allow for focused research and development into solving only actual problems and thereby
reducing the overall workload.
In conclusion, this project has not only achieved its intended goals but has exceeded them by
exposing vital information critical to both the design and running of the PBMR nuclear plant.

- 41 -
11. References
11.1 Literature
[1] Bandara, Wasana. (2007). Process modelling success factors and measures. PhD Thesis.
(Queensland University of Technology)
[2] Blomqvist, Peter & Wygler, Franz. (2006). Analysing and Reengineering the Order Process
at Noblessa Sverige AB: A Pre-Study for an ERP System Implementation. Master’s Thesis’.
(Linköping University)
[3] Delgado-Loperena, Dharma. (2004) Human Error in Nuclear Power Plants: A Stochastic
Dynamic Model. Ph.D Thesis. (University of Missouri-Columbia)
[4] Erguina, Vera. (2004). Safety assured financial evaluation of maintenance. Ph.D Thesis.
(Texas A&M University)
[5] Jacobsson Svärd, Staffan. (2004). A Tomographic Measurement Technique for Irradiated
Nuclear Fuel Assemblies. PhD Thesis. (Uppsala University)
[6] Jones, Christopher Michael. (2003). Nonproliferation Issues in the Nuclear Energy Future.
Double Master’s Thesis. (Massachusetts Institute of Technology)
[7] Ling, Xianbing. (2001). Bayesian analysis for the site-specific dose modeling in nuclear
power plant decommissioning. Master’s Thesis. (North Carolina State University)
[8] Mkhosi, Margaret Msongi. (2007). Computational fluid dynamics analysis of aerosol
deposition in pebble beds. PhD Thesis. (Ohio State University)
- 42 -
[9] Smith, Curtis Lee. (2002). Risk-informed incident management for nuclear power plants.
Ph.D Thesis. (Massachusetts Institute of Technology)
[10] Talamo, Alberto. (2006). Advanced In-Core Fuel Cycles for the Gas Turbine-Modular
Helium Reactor. PhD Thesis. (KTH Royal Institute of Technology)
[11] Wang, Chunyun. (2003). Design, Analysis and Optimization of the Power Conversion
System for the Modular Pebble Bed Reactor System. PhD Thesis. (Massachusetts Institute of
Technology)
[12] Yildiz, Bilge. (2003). Development of a hybrid intelligent system for on-line real-time
monitoring of nuclear power plant operations. M.IT Thesis. (Massachusetts Institute of
Technology)
[13] Zhao, Yongjun. (2005). An Integrated Framework for Gas Turbine Based Power Plant
Operational Modeling and Optimization. Ph.D. Thesis. (Georgia Institute of Technology)
11.2 Tables and Figures
Figure 1: PBMR Fuel Pebbles, Web, www.pbmr.co.za
Figure 2: The PBMR Nuclear Power Plant System, Web, www.pbmr.co.za
Figure 3: A visual overview of Project topics with information flow and future uses,
Own work ©A Wheeler 2008
Figure 4: Example of machine design drawings for turbine assembly/disassembly,
PBMR, Project data collection

- 43 -
Figure 5: Example of 3D computer models for turbine assembly/disassembly,
PBMR, Project data collection
Figure 6: Maintenance Procedure Outline FPD PBMR, Project data collection
Figure 7: Spreadsheet-based Gantt Chart showing work duration estimates for full maintenance,
PBMR, Project data collection
Figure 8: Radiation warning symbol, Web, http://www.basis-
online.nl/index.cfm/1,100,325,0,html/Kwaliteit-van-arbeid-in-de-gehandicaptenzorg
Figure 9: Spreadsheet containing process, man-hours and working body distance details,
PBMR, Project data collection
Figure 10: Basic process flow diagram example, PBMR, Project data collection
Figure 11: First-stage PFD for Maintenance tasks 1 – 4.5 Own work ©A Wheeler 2008
Figure 12: First-stage PFD for Maintenance tasks 5.1 – 5.3 Own work ©A Wheeler 2008
Figure 13: First-stage PFD for Maintenance tasks 5.4 – 5.9 Own work ©A Wheeler 2008
Figure 14: First-stage PFD for Maintenance tasks 13 – 19 Own work ©A.Wheeler 2008
Figure 15: Second-stage PFD for Maintenance tasks 4.5 – 5.9 Own ©A Wheeler 2008
Figure 16: Process Flow Diagram Block Detail Own work ©A Wheeler 2008
Table 1: Allowable access times for radioactive zones PBMR Project data collection

- 44 -
Figure 17: Radiation Modelling Data Example – Expected Dosages for various distances and
stages PBMR Project data collection
Figure 18: Maintenance PFD for tasks 5.4 – 5.9 with zone gradations (Overhaul Approach)
Own work ©A Wheeler 2008
Figure 19: Maintenance PFD for tasks 5.4 – 5.9 with zone gradations (Cycle-Out Approach)
Own work ©A Wheeler 2008
Figure 20: Maintenance PFD for sets 13 – 19, with radiation zones Own ©A Wheeler 2008
Figure 21: Additional procedures and radiation calculations Own work ©A Wheeler 2008
Table 2: Maintenance Approach comparison in radiation dosages and required manpower
Adapted from PBMR Project data collection
Table 3: Radiation Protection Guidelines PBMR Project data collection

- 45 -
11.3 General Web References
www.pbmr.co.za
www.wikipedia.org
www.upetd.up.ac.za
www.google.co.za
www.cane.org.za
www.dme.gov.za/energy/nuclear
www.lib.ncsu.edu
http://qualitativeresearch.ratcliffs.net/15methods.pdf
http://my.execpc.com/~helberg/pitfalls
www.sanpad.org.za/portal/docs/rci/Data%20Analysis.ppt
http://www.hse.gov.uk/nuclear/llc/2002/sella2.htm
www.necsa.co.za
http://www.nrc.gov/reading-rm/doc-collections/commission/secys/1999/secy1999-207/attachment2.pdf

- 46 -
12. Appendix A
Turbine Maintenance Process Flow Diagram sets 1 - 4
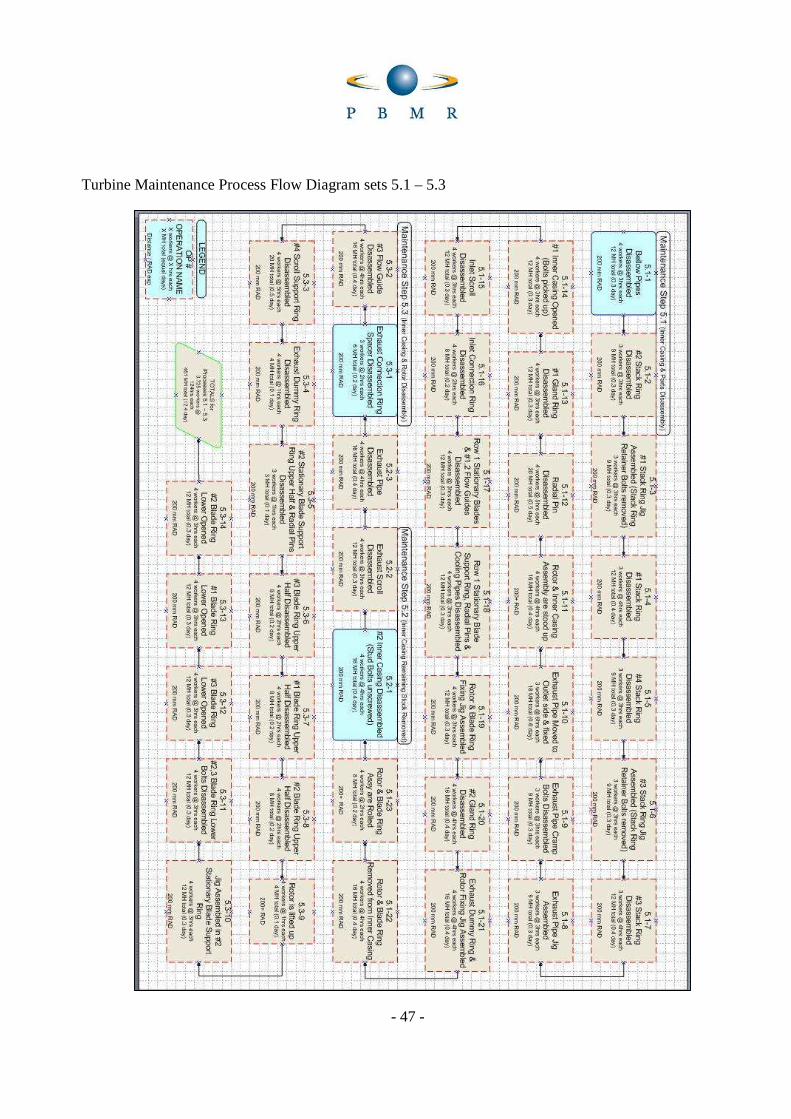
- 47 -
Turbine Maintenance Process Flow Diagram sets 5.1 – 5.3

- 48 -
Turbine Maintenance Process Flow Diagram sets 5.4 – 5.9 (First-stage, no parallel tasks)
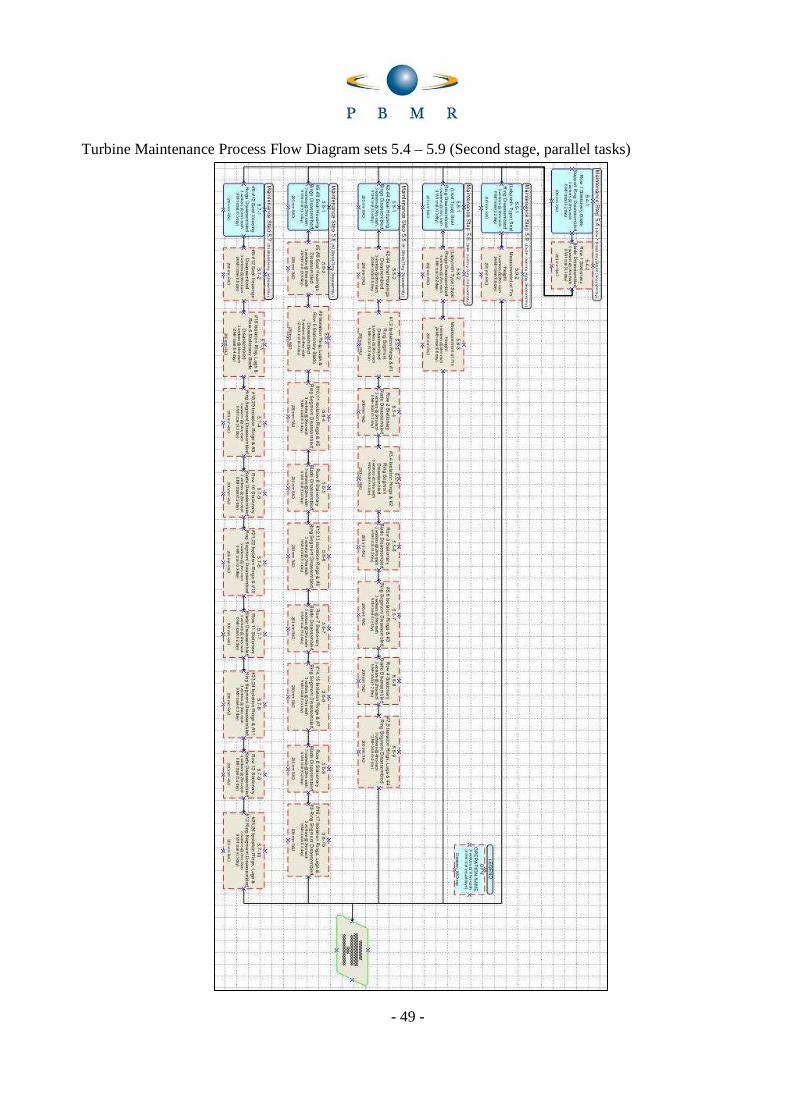
- 49 -
Turbine Maintenance Process Flow Diagram sets 5.4 – 5.9 (Second stage, parallel tasks)

- 50 -
Turbine Maintenance Process Flow Diagram sets 13 – 19 (incl. 6 & 7)

- 51 -
ZONED Maintenance PFD for sets 1 – 4 (colour coded)

- 52 -
ZONED Maintenance PFD for sets 5.4 – 5.9 (Cycle-Out Approach, after 5 years decay)

- 53 -
ZONED Maintenance PFD for sets 5.4 – 5.9 (Overhaul approach, on-the-spot maintenance)

- 54 -
ZONED Maintenance PFD for sets 13 – 19 (incl. 6,7)

- 55 -
13. Appendix B
Example of original maintenance task list with worker radiation activity distances

- 56 -
Task list with estimated exposures, radiation calculations and min worker requirements

- 57 -
Added maintenance tasks in the cycle-out approach task list with extra radiation calculations

- 58 -
The Overhaul (left colouring) vs. Cycle-Out (right colouring) radiation and worker calculations which proved the infeasibility of the overhaul approach
Task
Min Worker
[a]
Dose Rate [c]
(µSv/h)
Total Dose Rate
per worker
(µSv/h x h) Zone
Required min
worker based on dose rate
limit
Dose Rate [c']
(µSv/h)
Total Dose
Rate per worker
(µSv/h x h) Zone
Required min
worker based on dose rate
limit 5.5-1 3 2000 6000 R4 180 11 33 R2 4 5.5-2 3 2000 16000 R4 180 11 88 R2 4 5.5-3 3 2000 6000 R4 180 11 33 R2 4 5.5-4 3 2000 4000 R4 180 11 22 R2 4 5.5-5 3 2000 6000 R4 180 11 33 R2 4 5.5-6 3 2000 4000 R4 180 11 22 R2 4 5.5-7 3 2000 6000 R4 180 11 33 R2 4 5.5-8 3 2000 4000 R4 180 11 22 R2 4 5.5-9 3 2000 8000 R4 180 11 44 R2 4 5.6-1 3 2700 8100 R4 243 11 33 R2 4 5.6-2 3 2700 21600 R4 243 11 88 R2 4 5.6-3 3 2700 10800 R4 243 11 44 R2 4 5.6-4 3 2700 8100 R4 243 11 33 R2 4 5.6-5 3 2700 5400 R4 243 11 22 R2 4 5.6-6 3 2700 8100 R4 243 11 33 R2 4 5.6-7 3 2700 5400 R4 243 11 22 R2 4 5.6-8 3 2700 8100 R4 243 11 33 R2 4 5.6-9 3 2700 5400 R4 243 11 22 R2 4 5.6-10 3 2700 8100 R4 243 11 33 R2 4 5.7-1 3 170000 510000 R5 15300 52 156 R3 9 5.7-2 3 170000 1360000 R5 15300 52 416 R3 9 5.7-3 3 170000 680000 R5 15300 52 208 R3 9 5.7-4 3 170000 510000 R5 15300 52 156 R3 9 5.7-5 3 170000 340000 R5 15300 52 104 R3 9 5.7-6 3 170000 510000 R5 15300 52 156 R3 9 5.7-7 3 170000 340000 R5 15300 52 104 R3 9 5.7-8 3 170000 510000 R5 15300 52 156 R3 9 5.7-9 3 170000 340000 R5 15300 52 104 R3 9 5.7-10 3 170000 510000 R5 15300 52 156 R3 9

- 59 -
Example 1 of modelled dose rate calculations (colour-coded by zone) for stages of maintenance

- 60 -
Example 2 of modelled radiation dose rates for various stages of maintenance (colour-coded)

- 61 -
Example 3 of modelled radiation dose rates for various stages of turbine maintenance