Embed Size (px)
Citation preview
1Astronomy & Astrophysics manuscript no. 30184 c© ESO 2017
February 1, 2017
Chasing disks around O-type (proto)stars:
Evidence from ALMA observations
R. Cesaroni1, A. Sanchez-Monge2, M. T. Beltran1, K. G. Johnston3, L. T. Maud4, L. Moscadelli1, J. C. Mottram5,A. Ahmadi5, V. Allen6, H. Beuther5, T. Csengeri7, S. Etoka8, G. A. Fuller9,10, D. Galli1, R. Galvan-Madrid11,C. Goddi12,4, T. Henning5, M. G. Hoare13, P. D. Klaassen14, R. Kuiper15, M. S. N. Kumar16,17, S. Lumsden18,
T. Peters19, V. M. Rivilla1, P. Schilke2, L. Testi20,1, F. van der Tak21,6, S. Vig22, C. M. Walmsley23,1, andH. Zinnecker24
1 INAF, Osservatorio Astrofisico di Arcetri, Largo E. Fermi 5, I-50125 Firenze, Italy e-mail: [email protected] I. Physikalisches Institut, Universitat zu Koln, Zulpicher Strasse 77, 50937, Koln, Germany3 School of Physics and Astronomy, University of Leeds, West Yorkshire, Leeds LS2 9JT, UK4 ALLEGRO/Leiden Observatory, Leiden University, PO Box 9513, NL-2300 RA Leiden, the Netherlands5 Max Planck Institute for Astronomy, Konigstuhl 17, D-69117 Heidelberg, Germany6 Kapteyn Astronomical Institute, University of Groningen, 9700 AV, Groningen, The Netherlands7 Max-Planck-Institut fur Radioastronomie, Auf dem Hugel 69, D-53121 Bonn, Germany8 Hamburger Sternwarte, Universitat Hamburg, 21029, Hamburg, Germany9 Jodrell Bank Centre for Astrophysics, School of Physics and Astronomy, The University of Manchester, Oxford Road, Manchester M13
9PL, UK10 UK ALMA Regional Centre Node11 Instituto de Radioastronomıa y Astrofısica, UNAM, Apdo. Postal 3-72 (Xangari), 58089 Morelia, Michoacan, Mexico12 Department of Astrophysics/IMAPP, Radboud University, P.O. Box 9010, 6500 GL Nijmegen, The Netherlands13 School of Physics and Astronomy, University of Leeds, Leeds LS2 9JT, UK14 UK Astronomy Technology Centre, Royal Observatory Edinburgh, Blackford Hill, Edinburgh EH9 3HJ, UK15 Institut fur Astronomie und Astrophysik, Universitat Tubingen, Auf der Morgenstelle 10, D-72076 Tubingen, Germany16 Centre for Astrophysics, University of Hertfordshire, College Lane, Hatfield, AL10 9AB, UK17 Instituto de Astrofısica e Ciencias do Espaco, Universidade do Porto, CAUP, Rua das Estrelas, 4150-762, Porto, Portugal18 School of Physics and Astronomy, University of Leeds, West Yorkshire, Leeds LS2 9JT, UK19 Max-Planck-Institut fur Astrophysik, Karl-Schwarzschild-Str. 1, D-85741 Garching, Germany20 European Southern Observatory, Karl-Schwarzschild-Str. 2, D-85748 Garching bei Munchen, Germany21 SRON Netherlands Institute for Space Research, Landleven 12, 9747 AD, Groningen, The Netherlands22 Indian Institute of Space science and Technology, Thiruvananthapuram 695 547, India23 Dublin Institute of Advanced Studies, Fitzwilliam Place 31, Dublin 2, Ireland24 SOFIA Science Center, Deutsches SOFIA Institut, NASA Ames Research Center, Moffett Field, CA, 94035, USA
Received date; accepted date
ABSTRACT
Context. Circumstellar disks around massive stars could mediate the accretion onto the star from the infalling envelope, as well as minimise the
effects of radiation pressure. Despite such a crucial role, only few convincing candidates have been provided for disks around deeply embedded
O-type (proto)stars.
Aims. In order to establish whether disk-mediated accretion is the formation mechanism for the most massive stars, we have searched for
circumstellar, rotating disks around a limited sample of 6 luminous (>105 L⊙) young stellar objects. These have been selected in such a way as
to maximize the likelihood of association with disk+jet systems, based on their IR and radio properties.
Methods. We used ALMA with ∼0.′′2 resolution to observe a large number of molecular lines, typical of hot molecular cores. In this paper we
limit our analysis to two disk tracers (methyl cyanide, CH3CN, and its isotopologue 13CH3CN), and an outflow tracer (silicon monoxide, SiO).
Results. We reveal many cores, although their number depends dramatically on the target. We focus on the cores that present prominent
molecular line emission. In 6 of these a velocity gradient is seen across the core, with three cases showing evidence of Keplerian-like rotation.
The SiO data reveal clear but poorly collimated bipolar outflow signatures towards two objects only. This can be explained if real jets are rare
(perhaps short lived) in very massive objects and/or stellar multiplicity significantly affects the outflow structure. For all cores with velocity
gradients, the velocity field is analysed through position–velocity plots to establish whether the gas is undergoing rotation with 3rot ∝ R−α, as
expected for Keplerian-like disks.
Conclusions. Our results suggest that in 3 objects we are observing rotation in circumstellar disks, with 3 more tentative cases, and 1 core
where no evidence for rotation is found. In all cases but one, we find that the gas mass is less than the mass of any embedded O-type star,
consistent with the (putative) disks undergoing Keplerian-like rotation. With the caveat of low-number statistics, we conclude that the disk
detection rate could be sensitive to the evolutionary stage of the YSO. In young, deeply embedded sources, the evidence for disks could be
weak because of confusion with the surrounding envelope, while in the most evolved sources the molecular component of the disk could
have already been dispersed. Only in those objects that are at an intermediate stage of the evolution, the molecular disk would be sufficiently
prominent and relatively less embedded to be detectable by mm/submm observations.
Key words. Stars: early-type – Stars: formation – ISM: molecules – Accretion, accretion disks
1. Introduction
How do massive stars form? A growing number of both ob-
servational and theoretical studies center on this topic. Recent
years have seen significant progress (Tan et al. 2014) and we
can now claim that numerical simulations adequately describe
the formation of the most massive stars (Krumholz et al. 2007a;
Kuiper et al. 2010; Peters et al. 2010). Observations are still
lagging behind, but the dramatic improvement in sensitivity
and/or resolution, offered by a number of facilities in recent
years (Herschel, NOEMA, ALMA), is now allowing a quan-
tum leap in our knowledge of the formation process of all stars,
in general, and of early-type stars, in particular.
As in the low-mass case, disks around OB-type stars play
an important role in angular momentum transfer (Rosen et
al. 2012), but their existence is particularly crucial in allowing
accretion to proceed, overcoming the powerful radiation pres-
sure of luminous protostars (Krumholz et al. 2009; Kuiper et
al. 2011; Peters et al. 2011; Klassen et al. 2016). In their com-
prehensive review, Beltran & de Wit (2016) have summarized
the current evidence for disks around intermediate- (∼2–7 M⊙)
and high-mass (>∼7 M⊙) stars, from the embedded to the opti-
cally visible phase. Comparison between this recent review and
the previous one by Cesaroni et al. (2007) shows that, while lit-
tle doubt can now be cast about the existence of disks around
B-type (proto)stars, those around O-type stars remain elusive.
Observational evidence for massive cores, possibly undergo-
ing (solid-body) rotation and containing newly born early-type
stars has been provided by various authors (see e.g. Beltran &
de Wit 2016, Zapata et al. 2015). However, despite the pre-
diction that Keplerian rotation could be seen up to 1000 AU
radii (see Fig. 4 of Kuiper et al. 2011), only one convincing
case is known of a Keplerian disk around a deeply embedded
(proto)star exceeding the (approximate) threshold of ∼15 M⊙separating B- from O-type stars (Mottram et al. 2011b). This
is AFGL 4176, for which Johnston et al. (2015) derive a stellar
mass of 25 M⊙ corresponding to an O7 spectral type. Not sur-
prisingly, this result has been obtained thanks to the resolution
and sensitivity of the Atacama Large Millimeter/submillimeter
Array (ALMA).
In fact, prior to the finding of Johnston and collaborators,
ALMA had already been crucial in placing the existence of
disks around B-type stars on solid ground. While evidence for
such disks was provided by various authors (see Cesaroni et
al. 2007, Beltran & de Wit 2016, and references therein), it was
unclear whether disk-mediated accretion is the standard mech-
anism for the formation of B-type stars. With this in mind, we
performed ALMA observations of two selected targets, with
luminosities of ∼104 L⊙ and associated with bipolar nebulae
and hot molecular core (HMC) tracers. Our observations con-
firmed the presence of Keplerian disks, rotating about stellar
masses of 9–18 M⊙ (Sanchez-Monge et al. 2013, 2014; Beltran
et al. 2014), which indicates a continuity in the formation pro-
cess from solar-type to B-type stars.
Based on this successful project, we have taken the study a
step further and extended our disk search to the most massive
Send offprint requests to: R. Cesaroni, e-mail:
stars. All models predict the existence of disks around such
stars, although it is possible that their structure, size, and life-
time depend upon the formation process. Circumstellar disks
are a natural outcome of the Bondi accretion process depicted
by Keto (2002, 2003, 2007) and maintain their overall structure
and velocity field even while partly ionized. The monolithic-
accretion theory by McKee & Tan (2003) – in its modern incar-
nations by Krumholz et al. (2007b, 2009) – implies highly frag-
mented disks, encompassing binary and even multiple systems.
More critical could be the situation of disks in the competitive
accretion scenario by Bonnell et al. (2006), where a highly dy-
namical process favours the formation of the most massive stars
in the gravitational well of a rich stellar cluster. Such a per-
turbed scenario could have even more dramatic consequences
for the disk structure than just fragmentation: disks might be
truncated or destroyed and reformed on relatively short (dy-
namical) timescales. In conclusion, the observable disk param-
eters are potentially useful to get an insight on the OB-type star
formation process itself.
With all of the above in mind, we performed ALMA ob-
servations of a selected sample of luminous (>105 L⊙) YSOs
to investigate the presence of disks and possibly establish their
characteristics. This article summarizes the preliminary find-
ings of our study, while a detailed description of each source
will be given in forthcoming dedicated papers. In the following,
we explain how the targets were selected (Sect. 2), describe the
observations and data reduction (Sect. 3), present the main re-
sults (Sect. 4), and analyse our findings to draw conclusions on
the existence of disks around O-type (proto)stars (Sects. 5 and
6). Finally, a summary is given in Sect. 7.
2. Target selection and characterization
Our goal is to establish whether disk accretion is the common
mechanism for the formation of O-type stars. We thus chose 6
targets from the “toroid” sample of Beltran et al. (2005, 2011a)
and the RMS survey database1 (Lumsden et al. 2013; Urquhart
et al. 2008), which satisfy most of the following criteria:
– luminosity >105 L⊙, the minimum value for O-type stars;
– presence of a jet/outflow, from previous studies and/or data
available to us, based on the assumption that disks are as-
sociated with bipolar flows ejected along the disk rotation
axis;
– known association with a hot molecular core and/or
mid-IR colours typical of young massive (proto)stars
(S 21µm/S 8µm>∼ 2; Lumsden et al. 2013);
– distance below 8 kpc, to maximize the number of feasible
targets without reducing the spatial resolution too much.
The 6 targets are given in Table 1 with their equatorial co-
ordinates, LSR velocity (VLSR), bolometric luminosity (Lbol),
mass of the molecular clump2 enshrouding the correspond-
ing star forming region (Mgas), and distance (d). The values
of Lbol for G17.64, G345.49, and G345.50 have been taken
1 http://rms.leeds.ac.uk/cgi-bin/public/RMS DATABASE.cgi2 We refer to “clumps” as pc-scale structures, as opposed to “cores”,
whose sizes are below ∼0.1 pc.
R. Cesaroni et al.: Chasing disks around O-type (proto)stars: Evidence from ALMA observations 3
Table 1. Targets for the ALMA observations with their main parameters, obtained from the literature.
name other α(J2000) δ(J2000) VLSR d Lbol Mgasa Ref.c
names (h m s) (◦ ′ ′′) (km s−1) (kpc) (105 L⊙) (103 M⊙)
G17.64+0.16 AFGL 2136 18 22 26.370 −13 30 12.00 22.5 2.2 1.0 0.20 1
G24.78+0.08 18 36 12.661 −07 12 10.15 111.0 7.7 2.2 4.8 2, 3
G29.96−0.02 W43 S 18 46 03.665 −02 39 22.00 98.0 5.26 5.8 1.3 4, 5
G31.41+0.31 18 47 34.315 −01 12 45.90 96.5 7.9 2.6 5.2 3, 6
G345.49+1.47 16 59 41.610 −40 03 43.30 −12.6 2.4b 1.5 1.2 1
G345.50+0.35 17 04 22.870 −40 44 23.50 −17.8 2.0 1.0 0.55 1
a Computed from the flux density at 870 µm obtained from the ATLASGAL data, assuming a dust temperature of 50 K, a dust absorption
coefficient κdust = 2 cm2g−1 (Ossenkopf & Henning 1994), and a gas-to-dust mass ratio of 100.b We prefer the spectrophotometric distance estimate by Moises et al. (2011) to the kinematic distance of 1.6±0.1 kpc by Urquhart et al. (2008).c References for distance and luminosity: 1. RMS database; 2. Forster & Caswell (1989); 3. this paper; 4. Beltran et al. (2013); 5. Zhang et
al. (2014); 6. Cesaroni et al. (1994a)
from the RMS database3. For G29.96 we used the estimate
of Beltran et al. (2013), based on the Hi-GAL data, scaled
to the new distance estimate of 5.26 kpc (Zhang et al. 2014).
For G24.78 and G31.41, we have estimated Lbol by integrat-
ing under the spectral energy distribution reconstructed us-
ing the data from various surveys (Hi-GAL/Herschel, WISE,
MSX, MIPSGAL/Spitzer). Mgas has been computed from the
flux density at 870 µm obtained from the ATLASGAL4 data
(Schuller et al. 2009; Contreras et al. 2013), assuming an arbi-
trary dust temperature Tdust = 50 K, a dust absorption coeffi-
cient κdust = 2 cm2g−1 at 870 µm (Ossenkopf & Henning 1994),
and a gas-to-dust mass ratio of 100.
One sees that 3 sources lie at ∼2 kpc and the other 3 at ∼6–
8 kpc. While this makes it difficult to compare the properties of
the different objects, it allows us to investigate possible biases
related to the distance.
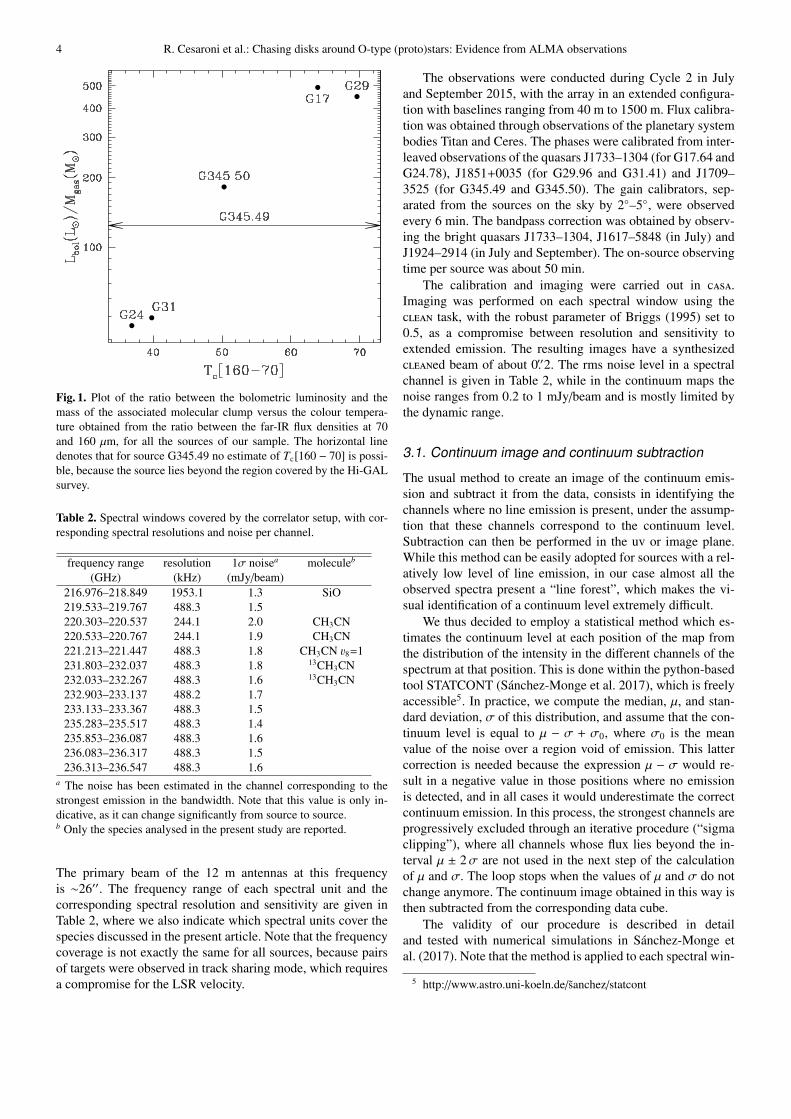
We can get a hint on the evolutionary stage of the star form-
ing region to which the targets belong, by inspecting the far-
IR colour temperature, Tc[160 − 70], between 70 and 160 µm
and the ratio Lbol/Mgas. The latter is believed to be a good
proxy for the source age (see e.g. McKee & Tan 2003, Elia
et al. 2010), as the gas mass is converted into stars during the
process of star formation. The former is very sensitive to the
temperature of the clump enshrouding the star forming region,
as the typical spectral energy distribution of high-mass YSOs
peaks around ∼100 µm (see e.g. van der Tak 2000, Cesaroni et
al. 2015). Since the environment is progressively heated by the
newly formed stars, one expects an increase of the dust tem-
perature with time and thus an increase of Tc[160 − 70] with
age. In Fig. 1, we plot these two parameters for our targets,
for which we obtained the far-IR fluxes from the Hi-GAL data
(Molinari et al. 2010, 2016). Indeed both parameters give con-
sistent age indications: colder sources have lower Lbol/Mgas ra-
tios, and vice versa. On this basis, the targets can be grouped
3 The RMS luminosities have been derived from the method de-
scribed in Mottram et al. (2011a), updated with the Hi-GAL/Herschel
far-IR fluxes (Molinari et al. 2010, 2016), where available (Mottram
et al. in prep.).4 The ATLASGAL project is a collaboration between the Max-
Planck-Gesellschaft, the European Southern Observatory (ESO), and
the Universidad de Chile.
into three pairs with progressively increasing age: G24.78 and
G31.41; G345.49 and G345.50; and G17.64 and G29.96.
A word of caution is in order for the luminosity and mass
estimates. The former assume isotropic emission, but inclina-
tion with respect to the line of sight could play a role if the
clumps are not spherically symmetric and opacity is non negli-
gible. For example, the flash-light effect can lead to underesti-
mating the luminosity by an order of magnitude (see Zhang et
al. 2013), if the bipolar structure is seen edge-on. Vice versa,
a pole-on view may cause a significant overestimate of the lu-
minosity. Our estimated luminosity may also be affected by the
radiation from nearby more evolved massive stars, which are
only loosely connected with the target of interest. An illumi-
nating example is that of G29.96. Although de Buizer (2002)
has demonstrated that the HMC is a prominent mid-IR emitter,
the nearby ultracompact Hii region is known to be associated
with an O5–O6 star (Martın-Hernandez et al. 2003), which may
therefore contribute to a significant fraction of Lbol (up to 92%;
see Vacca et al. 1996). The value of 5.8 × 10⁵ L⊙ is thus an
upper limit to the luminosity of the HMC. While a similar con-
clusion may hold also for the other five cores, the contribution
from nearby stars is rather uncertain in these cases, as such stars
have not been directly observed.
Finally, we note that a priori the mass estimate can be
affected by significant errors (a factor of ∼2; see Maud et
al. 2015a), mostly due to the uncertainties on κdust and Tdust.
However, the latter is unlikely to vary more than Tc[160 − 70],
namely ∼40%, while the former should not change much from
source to source, because the selected sample is relatively
homogeneous. Assuming that κdust is indeed the same in all
sources, the points in Fig. 1 can only shift systematically along
the y-axis, thus preserving the observed trend.
3. Observations and data analysis
ALMA was employed to perform observations towards the po-
sitions given in Table 1. The number of 12-m antennas used
ranged from 38 to 41. The correlator was set in such a way
as to cover a large number of lines, with special attention
to the CH3CN(12–11), 13CH3CN(13–12), and SiO(5–4) rota-
tional transitions. A broad 1.8 GHz spectral unit was also used
to obtain a sensitive continuum measurement at ∼218 GHz.
4 R. Cesaroni et al.: Chasing disks around O-type (proto)stars: Evidence from ALMA observations
Fig. 1. Plot of the ratio between the bolometric luminosity and the
mass of the associated molecular clump versus the colour tempera-
ture obtained from the ratio between the far-IR flux densities at 70
and 160 µm, for all the sources of our sample. The horizontal line
denotes that for source G345.49 no estimate of Tc[160 − 70] is possi-
ble, because the source lies beyond the region covered by the Hi-GAL
survey.
Table 2. Spectral windows covered by the correlator setup, with cor-
responding spectral resolutions and noise per channel.
frequency range resolution 1σ noisea moleculeb
(GHz) (kHz) (mJy/beam)
216.976–218.849 1953.1 1.3 SiO
219.533–219.767 488.3 1.5
220.303–220.537 244.1 2.0 CH3CN
220.533–220.767 244.1 1.9 CH3CN
221.213–221.447 488.3 1.8 CH3CN 38=1
231.803–232.037 488.3 1.8 13CH3CN
232.033–232.267 488.3 1.6 13CH3CN
232.903–233.137 488.2 1.7
233.133–233.367 488.3 1.5
235.283–235.517 488.3 1.4
235.853–236.087 488.3 1.6
236.083–236.317 488.3 1.5
236.313–236.547 488.3 1.6
a The noise has been estimated in the channel corresponding to the
strongest emission in the bandwidth. Note that this value is only in-
dicative, as it can change significantly from source to source.b Only the species analysed in the present study are reported.
The primary beam of the 12 m antennas at this frequency
is ∼26′′. The frequency range of each spectral unit and the
corresponding spectral resolution and sensitivity are given in
Table 2, where we also indicate which spectral units cover the
species discussed in the present article. Note that the frequency
coverage is not exactly the same for all sources, because pairs
of targets were observed in track sharing mode, which requires
a compromise for the LSR velocity.
The observations were conducted during Cycle 2 in July
and September 2015, with the array in an extended configura-
tion with baselines ranging from 40 m to 1500 m. Flux calibra-
tion was obtained through observations of the planetary system
bodies Titan and Ceres. The phases were calibrated from inter-
leaved observations of the quasars J1733–1304 (for G17.64 and
G24.78), J1851+0035 (for G29.96 and G31.41) and J1709–
3525 (for G345.49 and G345.50). The gain calibrators, sep-
arated from the sources on the sky by 2◦–5◦, were observed
every 6 min. The bandpass correction was obtained by observ-
ing the bright quasars J1733–1304, J1617–5848 (in July) and
J1924–2914 (in July and September). The on-source observing
time per source was about 50 min.
The calibration and imaging were carried out in casa.
Imaging was performed on each spectral window using the
clean task, with the robust parameter of Briggs (1995) set to
0.5, as a compromise between resolution and sensitivity to
extended emission. The resulting images have a synthesized
cleaned beam of about 0.′′2. The rms noise level in a spectral
channel is given in Table 2, while in the continuum maps the
noise ranges from 0.2 to 1 mJy/beam and is mostly limited by
the dynamic range.
3.1. Continuum image and continuum subtraction
The usual method to create an image of the continuum emis-
sion and subtract it from the data, consists in identifying the
channels where no line emission is present, under the assump-
tion that these channels correspond to the continuum level.
Subtraction can then be performed in the uv or image plane.
While this method can be easily adopted for sources with a rel-
atively low level of line emission, in our case almost all the
observed spectra present a “line forest”, which makes the vi-
sual identification of a continuum level extremely difficult.
We thus decided to employ a statistical method which es-
timates the continuum level at each position of the map from
the distribution of the intensity in the different channels of the
spectrum at that position. This is done within the python-based
tool STATCONT (Sanchez-Monge et al. 2017), which is freely
accessible5. In practice, we compute the median, µ, and stan-
dard deviation, σ of this distribution, and assume that the con-
tinuum level is equal to µ − σ + σ0, where σ0 is the mean
value of the noise over a region void of emission. This latter
correction is needed because the expression µ − σ would re-
sult in a negative value in those positions where no emission
is detected, and in all cases it would underestimate the correct
continuum emission. In this process, the strongest channels are
progressively excluded through an iterative procedure (“sigma
clipping”), where all channels whose flux lies beyond the in-
terval µ ± 2σ are not used in the next step of the calculation
of µ and σ. The loop stops when the values of µ and σ do not
change anymore. The continuum image obtained in this way is
then subtracted from the corresponding data cube.
The validity of our procedure is described in detail
and tested with numerical simulations in Sanchez-Monge et
al. (2017). Note that the method is applied to each spectral win-
5 http://www.astro.uni-koeln.de/sanchez/statcont
R. Cesaroni et al.: Chasing disks around O-type (proto)stars: Evidence from ALMA observations 5
dow of the correlator, independently of the others. This makes
it acceptable to neglect the dependence of the continuum emis-
sion on frequency, since the bandwidths are relatively narrow
(<2 GHz).
4. Results
In this section, we present and discuss the main findings of our
observations, focusing on the comparison between the differ-
ent sources. A more detailed analysis of each target will be
performed in a number of dedicated papers.
4.1. Continuum emission
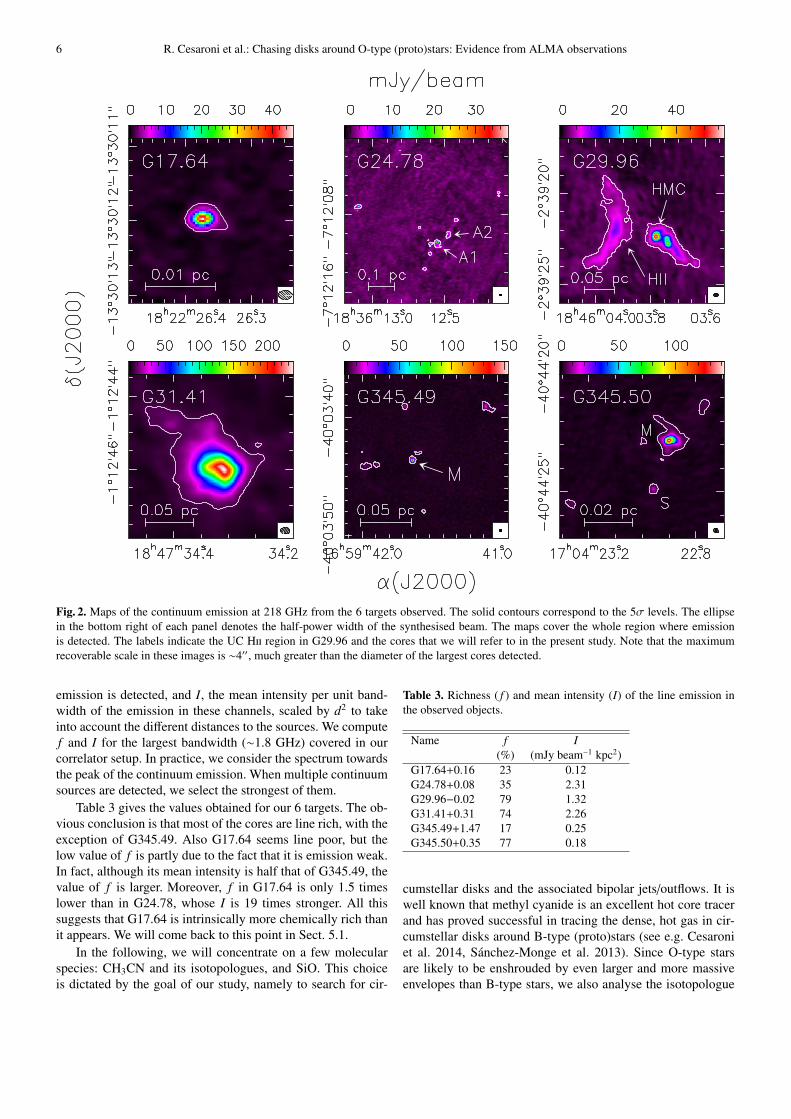
The maps of the continuum emission of the 6 targets are shown
in Fig. 2. All of these have been obtained from the spectral
unit with the largest bandwidth (1.8 GHz), using the proce-
dure described in Sect. 3.1. One sees that most maps present
a clumpy structure, with the emission being concentrated in
a single source only in two cases (G17.64 and G31.41). In
particular, in G17.64 the continuum source is basically unre-
solved with a synthesised beam of ∼0.′′15, and the emission
could entirely be due to free-free emission, based on the re-
sults of Menten & van der Tak (2004). The arc-like feature in
G29.96 traces the rim of the cometary ultracompact (UC) Hii
region and is (at least partly) due to free-free continuum emis-
sion from the ionized gas. Prominent free-free emission is also
contaminating one source in G24.78 (see Beltran et al. 2007)
and one in G345.49 (Guzman et al. 2010), known from pre-
vious observations at centimeter wavelengths. All these three
continuum sources (G29.96, G24.78, G345.49) are also clearly
detected in the H30α recombination line, which is covered by
our frequency setup.
All the other features detected above a 5σ level in Fig. 2
are dominated by dust emission and trace compact molecular
cores. It thus appears that the level of fragmentation in the ob-
served regions varies quite a lot, from compact objects such
as G17.64 and G31.41 (although on different spatial scales),
to very clumpy regions like G24.78 and G345.49, where vi-
sual inspection identifies up to 9 fragments in each of them.
In G31.41, a large continuum opacity could justify the (appar-
ent) homogeneity of the core, but even so, the putative frag-
ments would be “squeezed” inside a more compact region than
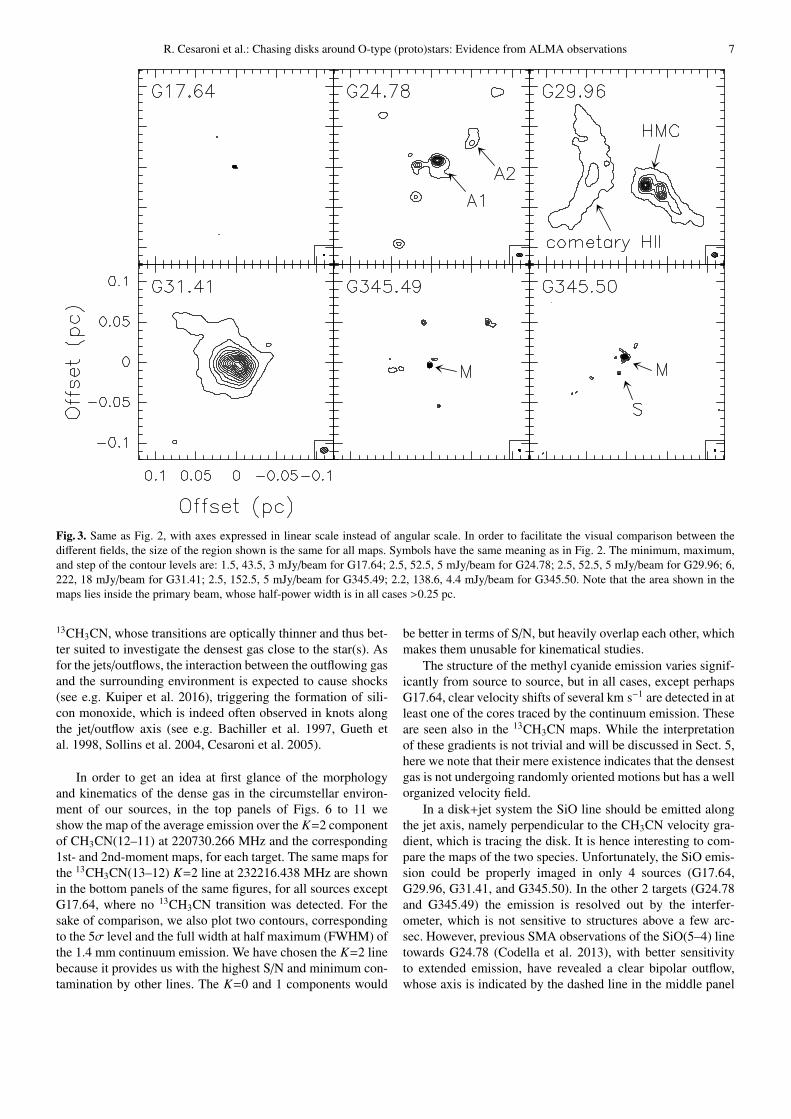
in the other targets. The variety of clumpiness is better illus-
trated by Fig. 3, where the same data as in Fig. 2 are shown
with constant physical scales. The most distant fields such as
G31.41 might indeed contain more undetected cores, but the
different morphologies observed in the various sources cannot
be explained by the different spatial resolutions alone. This is
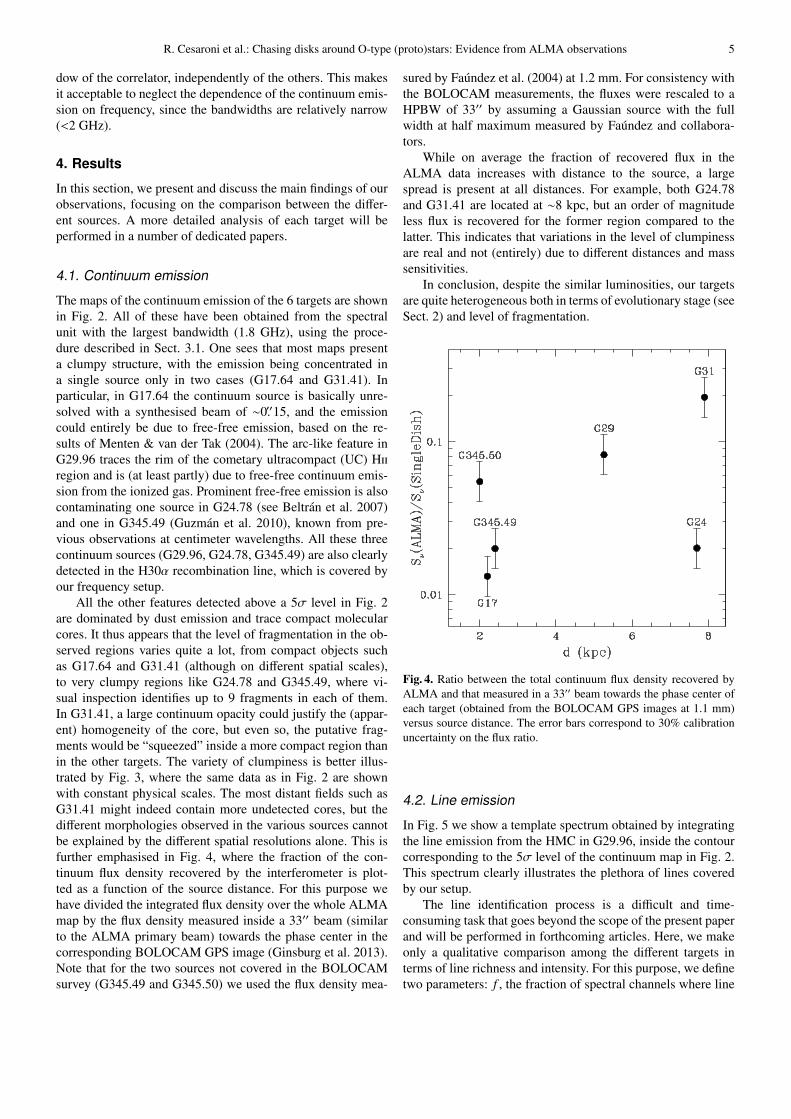
further emphasised in Fig. 4, where the fraction of the con-
tinuum flux density recovered by the interferometer is plot-
ted as a function of the source distance. For this purpose we
have divided the integrated flux density over the whole ALMA
map by the flux density measured inside a 33′′ beam (similar
to the ALMA primary beam) towards the phase center in the
corresponding BOLOCAM GPS image (Ginsburg et al. 2013).
Note that for the two sources not covered in the BOLOCAM
survey (G345.49 and G345.50) we used the flux density mea-
sured by Faundez et al. (2004) at 1.2 mm. For consistency with
the BOLOCAM measurements, the fluxes were rescaled to a
HPBW of 33′′ by assuming a Gaussian source with the full
width at half maximum measured by Faundez and collabora-
tors.
While on average the fraction of recovered flux in the
ALMA data increases with distance to the source, a large
spread is present at all distances. For example, both G24.78
and G31.41 are located at ∼8 kpc, but an order of magnitude
less flux is recovered for the former region compared to the
latter. This indicates that variations in the level of clumpiness
are real and not (entirely) due to different distances and mass
sensitivities.
In conclusion, despite the similar luminosities, our targets
are quite heterogeneous both in terms of evolutionary stage (see
Sect. 2) and level of fragmentation.
Fig. 4. Ratio between the total continuum flux density recovered by
ALMA and that measured in a 33′′ beam towards the phase center of
each target (obtained from the BOLOCAM GPS images at 1.1 mm)
versus source distance. The error bars correspond to 30% calibration
uncertainty on the flux ratio.
4.2. Line emission
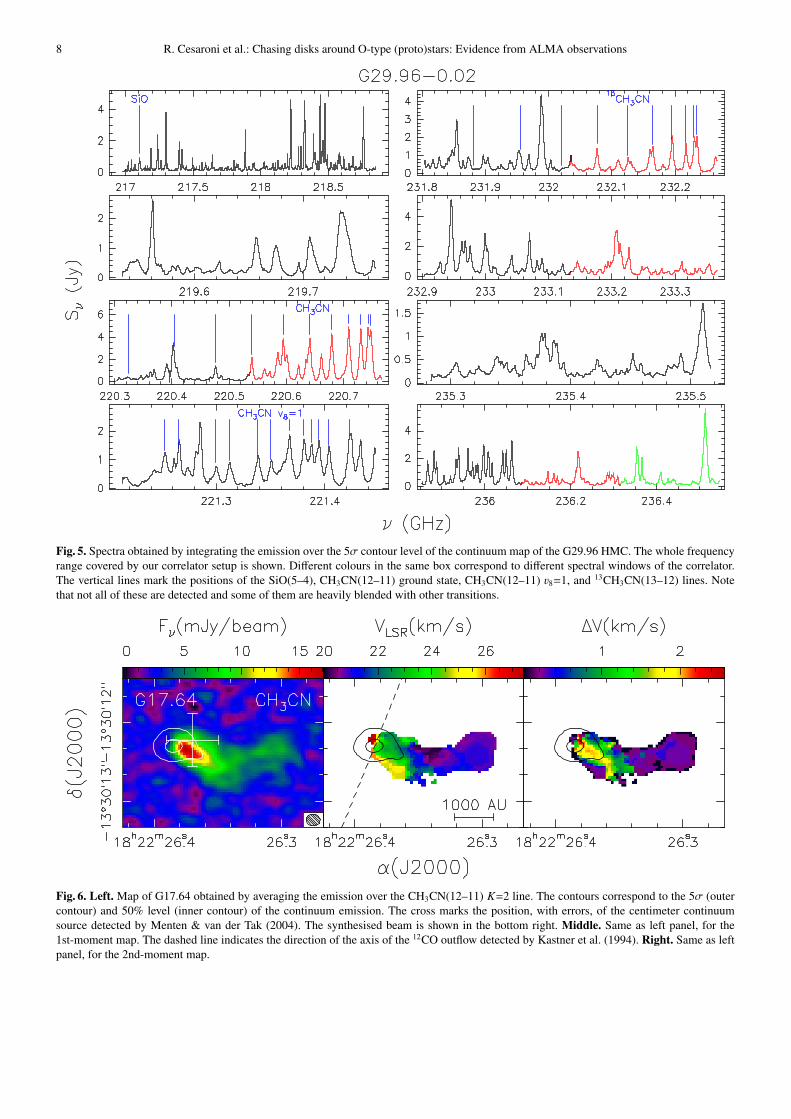
In Fig. 5 we show a template spectrum obtained by integrating
the line emission from the HMC in G29.96, inside the contour
corresponding to the 5σ level of the continuum map in Fig. 2.
This spectrum clearly illustrates the plethora of lines covered
by our setup.
The line identification process is a difficult and time-
consuming task that goes beyond the scope of the present paper
and will be performed in forthcoming articles. Here, we make
only a qualitative comparison among the different targets in
terms of line richness and intensity. For this purpose, we define
two parameters: f , the fraction of spectral channels where line
6 R. Cesaroni et al.: Chasing disks around O-type (proto)stars: Evidence from ALMA observations
Fig. 2. Maps of the continuum emission at 218 GHz from the 6 targets observed. The solid contours correspond to the 5σ levels. The ellipse
in the bottom right of each panel denotes the half-power width of the synthesised beam. The maps cover the whole region where emission
is detected. The labels indicate the UC Hii region in G29.96 and the cores that we will refer to in the present study. Note that the maximum
recoverable scale in these images is ∼4′′, much greater than the diameter of the largest cores detected.
emission is detected, and I, the mean intensity per unit band-
width of the emission in these channels, scaled by d2 to take
into account the different distances to the sources. We compute
f and I for the largest bandwidth (∼1.8 GHz) covered in our
correlator setup. In practice, we consider the spectrum towards
the peak of the continuum emission. When multiple continuum
sources are detected, we select the strongest of them.
Table 3 gives the values obtained for our 6 targets. The ob-
vious conclusion is that most of the cores are line rich, with the
exception of G345.49. Also G17.64 seems line poor, but the
low value of f is partly due to the fact that it is emission weak.
In fact, although its mean intensity is half that of G345.49, the
value of f is larger. Moreover, f in G17.64 is only 1.5 times
lower than in G24.78, whose I is 19 times stronger. All this
suggests that G17.64 is intrinsically more chemically rich than
it appears. We will come back to this point in Sect. 5.1.
In the following, we will concentrate on a few molecular
species: CH3CN and its isotopologues, and SiO. This choice
is dictated by the goal of our study, namely to search for cir-
Table 3. Richness ( f ) and mean intensity (I) of the line emission in
the observed objects.
Name f I
(%) (mJy beam−1 kpc2)
G17.64+0.16 23 0.12
G24.78+0.08 35 2.31
G29.96−0.02 79 1.32
G31.41+0.31 74 2.26
G345.49+1.47 17 0.25
G345.50+0.35 77 0.18
cumstellar disks and the associated bipolar jets/outflows. It is
well known that methyl cyanide is an excellent hot core tracer
and has proved successful in tracing the dense, hot gas in cir-
cumstellar disks around B-type (proto)stars (see e.g. Cesaroni
et al. 2014, Sanchez-Monge et al. 2013). Since O-type stars
are likely to be enshrouded by even larger and more massive
envelopes than B-type stars, we also analyse the isotopologue
R. Cesaroni et al.: Chasing disks around O-type (proto)stars: Evidence from ALMA observations 7
Fig. 3. Same as Fig. 2, with axes expressed in linear scale instead of angular scale. In order to facilitate the visual comparison between the
different fields, the size of the region shown is the same for all maps. Symbols have the same meaning as in Fig. 2. The minimum, maximum,
and step of the contour levels are: 1.5, 43.5, 3 mJy/beam for G17.64; 2.5, 52.5, 5 mJy/beam for G24.78; 2.5, 52.5, 5 mJy/beam for G29.96; 6,
222, 18 mJy/beam for G31.41; 2.5, 152.5, 5 mJy/beam for G345.49; 2.2, 138.6, 4.4 mJy/beam for G345.50. Note that the area shown in the
maps lies inside the primary beam, whose half-power width is in all cases >0.25 pc.
13CH3CN, whose transitions are optically thinner and thus bet-
ter suited to investigate the densest gas close to the star(s). As
for the jets/outflows, the interaction between the outflowing gas
and the surrounding environment is expected to cause shocks
(see e.g. Kuiper et al. 2016), triggering the formation of sili-
con monoxide, which is indeed often observed in knots along
the jet/outflow axis (see e.g. Bachiller et al. 1997, Gueth et
al. 1998, Sollins et al. 2004, Cesaroni et al. 2005).
In order to get an idea at first glance of the morphology
and kinematics of the dense gas in the circumstellar environ-
ment of our sources, in the top panels of Figs. 6 to 11 we
show the map of the average emission over the K=2 component
of CH3CN(12–11) at 220730.266 MHz and the corresponding
1st- and 2nd-moment maps, for each target. The same maps for
the 13CH3CN(13–12) K=2 line at 232216.438 MHz are shown
in the bottom panels of the same figures, for all sources except
G17.64, where no 13CH3CN transition was detected. For the
sake of comparison, we also plot two contours, corresponding
to the 5σ level and the full width at half maximum (FWHM) of
the 1.4 mm continuum emission. We have chosen the K=2 line
because it provides us with the highest S/N and minimum con-
tamination by other lines. The K=0 and 1 components would
be better in terms of S/N, but heavily overlap each other, which
makes them unusable for kinematical studies.
The structure of the methyl cyanide emission varies signif-
icantly from source to source, but in all cases, except perhaps
G17.64, clear velocity shifts of several km s−1 are detected in at
least one of the cores traced by the continuum emission. These
are seen also in the 13CH3CN maps. While the interpretation
of these gradients is not trivial and will be discussed in Sect. 5,
here we note that their mere existence indicates that the densest
gas is not undergoing randomly oriented motions but has a well
organized velocity field.
In a disk+jet system the SiO line should be emitted along
the jet axis, namely perpendicular to the CH3CN velocity gra-
dient, which is tracing the disk. It is hence interesting to com-
pare the maps of the two species. Unfortunately, the SiO emis-
sion could be properly imaged in only 4 sources (G17.64,
G29.96, G31.41, and G345.50). In the other 2 targets (G24.78
and G345.49) the emission is resolved out by the interfer-
ometer, which is not sensitive to structures above a few arc-
sec. However, previous SMA observations of the SiO(5–4) line
towards G24.78 (Codella et al. 2013), with better sensitivity
to extended emission, have revealed a clear bipolar outflow,
whose axis is indicated by the dashed line in the middle panel
8 R. Cesaroni et al.: Chasing disks around O-type (proto)stars: Evidence from ALMA observations
Fig. 5. Spectra obtained by integrating the emission over the 5σ contour level of the continuum map of the G29.96 HMC. The whole frequency
range covered by our correlator setup is shown. Different colours in the same box correspond to different spectral windows of the correlator.
The vertical lines mark the positions of the SiO(5–4), CH3CN(12–11) ground state, CH3CN(12–11) 38=1, and 13CH3CN(13–12) lines. Note
that not all of these are detected and some of them are heavily blended with other transitions.
Fig. 6. Left. Map of G17.64 obtained by averaging the emission over the CH3CN(12–11) K=2 line. The contours correspond to the 5σ (outer
contour) and 50% level (inner contour) of the continuum emission. The cross marks the position, with errors, of the centimeter continuum
source detected by Menten & van der Tak (2004). The synthesised beam is shown in the bottom right. Middle. Same as left panel, for the
1st-moment map. The dashed line indicates the direction of the axis of the 12CO outflow detected by Kastner et al. (1994). Right. Same as left
panel, for the 2nd-moment map.
R. Cesaroni et al.: Chasing disks around O-type (proto)stars: Evidence from ALMA observations 9
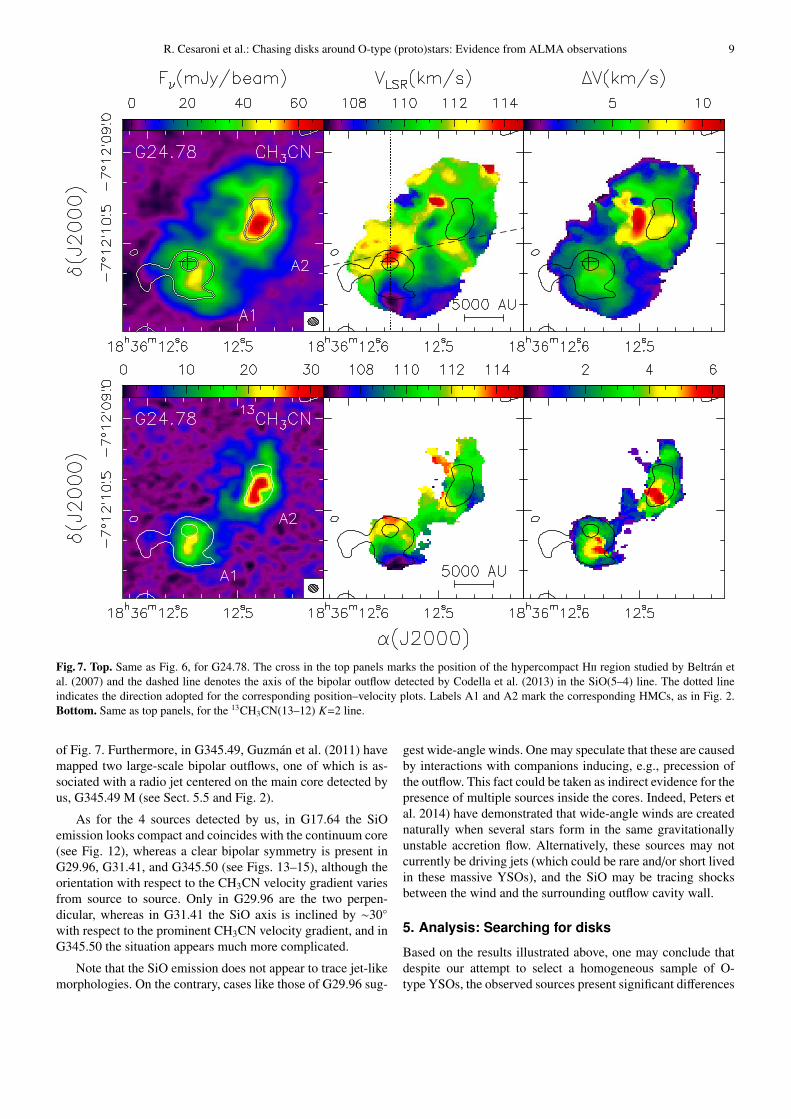
Fig. 7. Top. Same as Fig. 6, for G24.78. The cross in the top panels marks the position of the hypercompact Hii region studied by Beltran et
al. (2007) and the dashed line denotes the axis of the bipolar outflow detected by Codella et al. (2013) in the SiO(5–4) line. The dotted line
indicates the direction adopted for the corresponding position–velocity plots. Labels A1 and A2 mark the corresponding HMCs, as in Fig. 2.
Bottom. Same as top panels, for the 13CH3CN(13–12) K=2 line.
of Fig. 7. Furthermore, in G345.49, Guzman et al. (2011) have
mapped two large-scale bipolar outflows, one of which is as-
sociated with a radio jet centered on the main core detected by
us, G345.49 M (see Sect. 5.5 and Fig. 2).
As for the 4 sources detected by us, in G17.64 the SiO
emission looks compact and coincides with the continuum core
(see Fig. 12), whereas a clear bipolar symmetry is present in
G29.96, G31.41, and G345.50 (see Figs. 13–15), although the
orientation with respect to the CH3CN velocity gradient varies
from source to source. Only in G29.96 are the two perpen-
dicular, whereas in G31.41 the SiO axis is inclined by ∼30◦
with respect to the prominent CH3CN velocity gradient, and in
G345.50 the situation appears much more complicated.
Note that the SiO emission does not appear to trace jet-like
morphologies. On the contrary, cases like those of G29.96 sug-
gest wide-angle winds. One may speculate that these are caused
by interactions with companions inducing, e.g., precession of
the outflow. This fact could be taken as indirect evidence for the
presence of multiple sources inside the cores. Indeed, Peters et
al. 2014) have demonstrated that wide-angle winds are created
naturally when several stars form in the same gravitationally
unstable accretion flow. Alternatively, these sources may not
currently be driving jets (which could be rare and/or short lived
in these massive YSOs), and the SiO may be tracing shocks
between the wind and the surrounding outflow cavity wall.
5. Analysis: Searching for disks
Based on the results illustrated above, one may conclude that
despite our attempt to select a homogeneous sample of O-
type YSOs, the observed sources present significant differences
10 R. Cesaroni et al.: Chasing disks around O-type (proto)stars: Evidence from ALMA observations
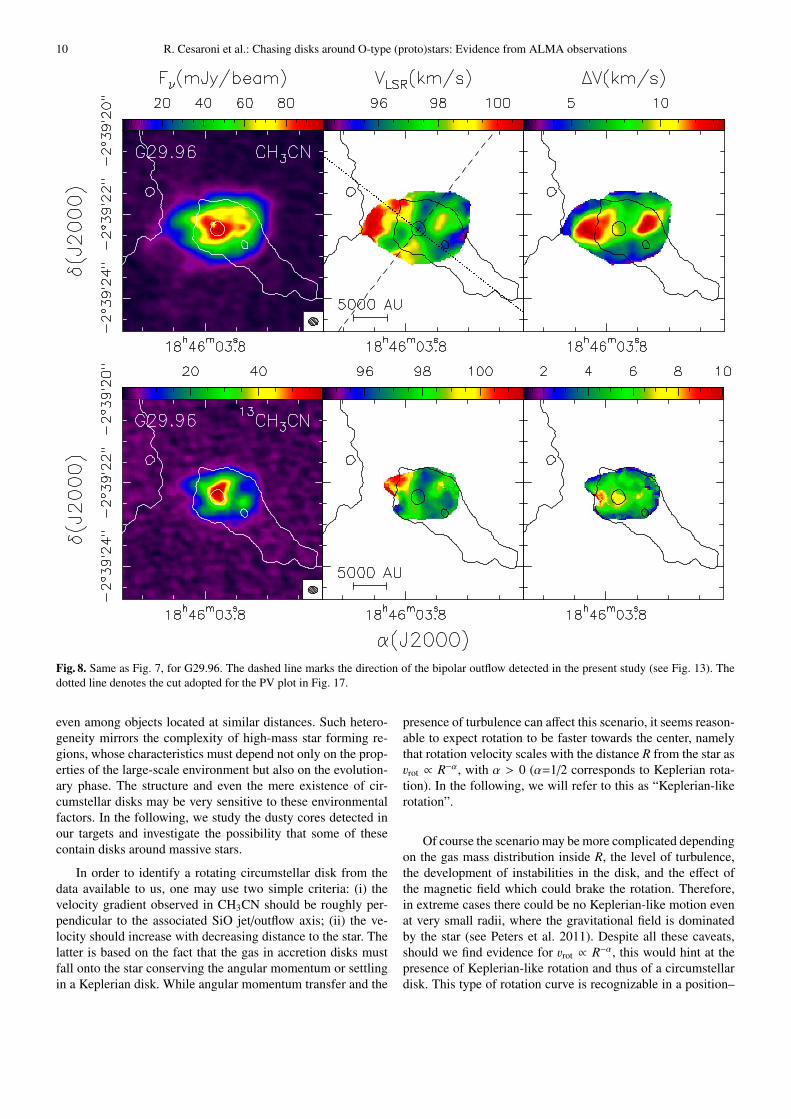
Fig. 8. Same as Fig. 7, for G29.96. The dashed line marks the direction of the bipolar outflow detected in the present study (see Fig. 13). The
dotted line denotes the cut adopted for the PV plot in Fig. 17.
even among objects located at similar distances. Such hetero-
geneity mirrors the complexity of high-mass star forming re-
gions, whose characteristics must depend not only on the prop-
erties of the large-scale environment but also on the evolution-
ary phase. The structure and even the mere existence of cir-
cumstellar disks may be very sensitive to these environmental
factors. In the following, we study the dusty cores detected in
our targets and investigate the possibility that some of these
contain disks around massive stars.
In order to identify a rotating circumstellar disk from the
data available to us, one may use two simple criteria: (i) the
velocity gradient observed in CH3CN should be roughly per-
pendicular to the associated SiO jet/outflow axis; (ii) the ve-
locity should increase with decreasing distance to the star. The
latter is based on the fact that the gas in accretion disks must
fall onto the star conserving the angular momentum or settling
in a Keplerian disk. While angular momentum transfer and the
presence of turbulence can affect this scenario, it seems reason-
able to expect rotation to be faster towards the center, namely
that rotation velocity scales with the distance R from the star as
3rot ∝ R−α, with α > 0 (α=1/2 corresponds to Keplerian rota-
tion). In the following, we will refer to this as “Keplerian-like
rotation”.
Of course the scenario may be more complicated depending
on the gas mass distribution inside R, the level of turbulence,
the development of instabilities in the disk, and the effect of
the magnetic field which could brake the rotation. Therefore,
in extreme cases there could be no Keplerian-like motion even
at very small radii, where the gravitational field is dominated
by the star (see Peters et al. 2011). Despite all these caveats,
should we find evidence for 3rot ∝ R−α, this would hint at the
presence of Keplerian-like rotation and thus of a circumstellar
disk. This type of rotation curve is recognizable in a position–
R. Cesaroni et al.: Chasing disks around O-type (proto)stars: Evidence from ALMA observations 11
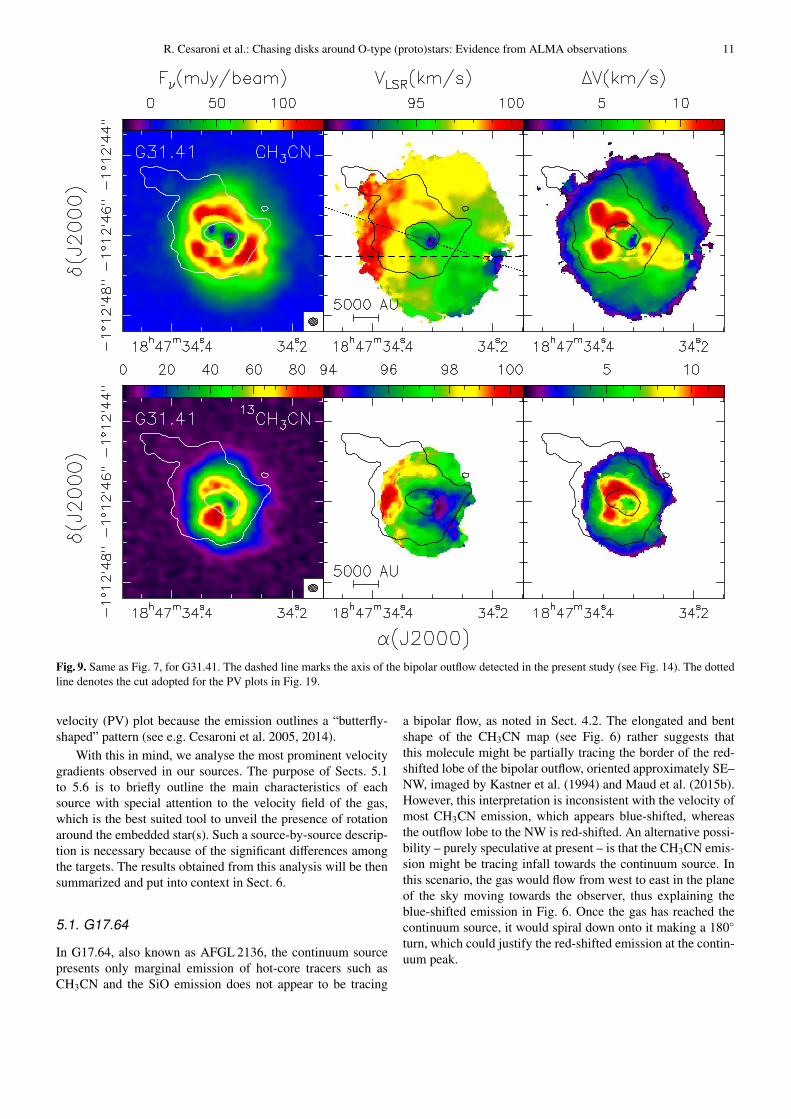
Fig. 9. Same as Fig. 7, for G31.41. The dashed line marks the axis of the bipolar outflow detected in the present study (see Fig. 14). The dotted
line denotes the cut adopted for the PV plots in Fig. 19.
velocity (PV) plot because the emission outlines a “butterfly-
shaped” pattern (see e.g. Cesaroni et al. 2005, 2014).
With this in mind, we analyse the most prominent velocity
gradients observed in our sources. The purpose of Sects. 5.1
to 5.6 is to briefly outline the main characteristics of each
source with special attention to the velocity field of the gas,
which is the best suited tool to unveil the presence of rotation
around the embedded star(s). Such a source-by-source descrip-
tion is necessary because of the significant differences among
the targets. The results obtained from this analysis will be then
summarized and put into context in Sect. 6.
5.1. G17.64
In G17.64, also known as AFGL 2136, the continuum source
presents only marginal emission of hot-core tracers such as
CH3CN and the SiO emission does not appear to be tracing
a bipolar flow, as noted in Sect. 4.2. The elongated and bent
shape of the CH3CN map (see Fig. 6) rather suggests that
this molecule might be partially tracing the border of the red-
shifted lobe of the bipolar outflow, oriented approximately SE–
NW, imaged by Kastner et al. (1994) and Maud et al. (2015b).
However, this interpretation is inconsistent with the velocity of
most CH3CN emission, which appears blue-shifted, whereas
the outflow lobe to the NW is red-shifted. An alternative possi-
bility – purely speculative at present – is that the CH3CN emis-
sion might be tracing infall towards the continuum source. In
this scenario, the gas would flow from west to east in the plane
of the sky moving towards the observer, thus explaining the
blue-shifted emission in Fig. 6. Once the gas has reached the
continuum source, it would spiral down onto it making a 180◦
turn, which could justify the red-shifted emission at the contin-
uum peak.
12 R. Cesaroni et al.: Chasing disks around O-type (proto)stars: Evidence from ALMA observations
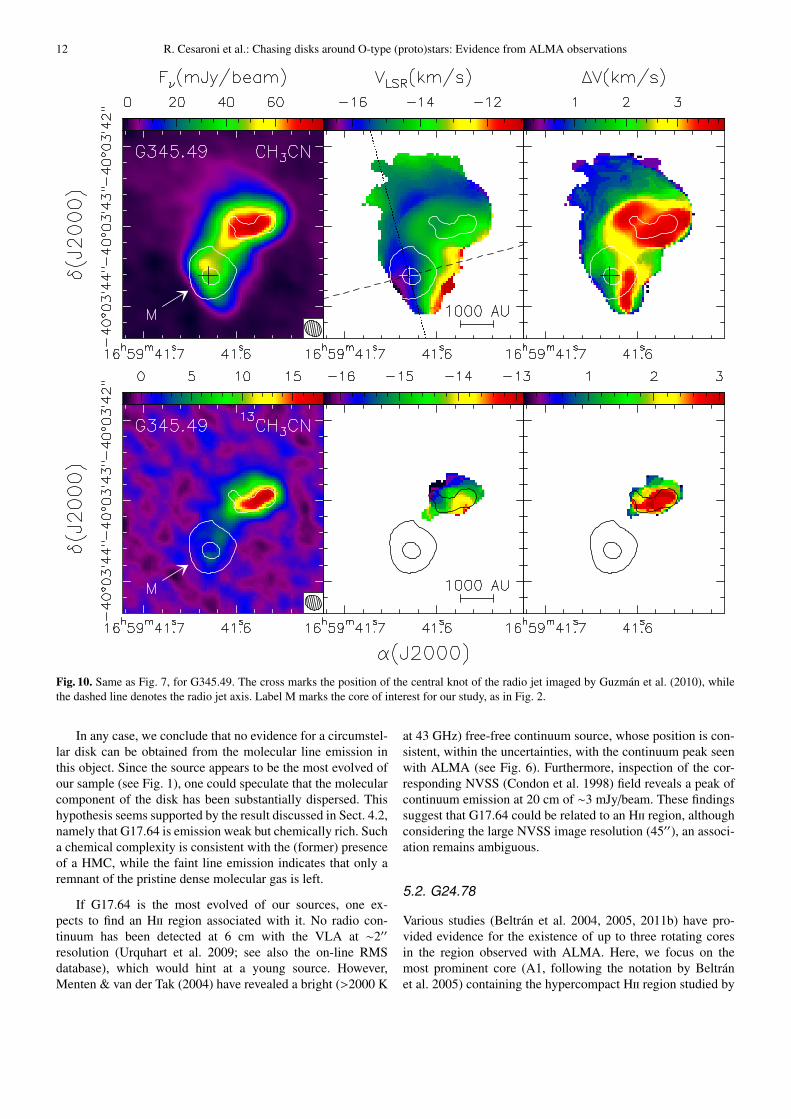
Fig. 10. Same as Fig. 7, for G345.49. The cross marks the position of the central knot of the radio jet imaged by Guzman et al. (2010), while
the dashed line denotes the radio jet axis. Label M marks the core of interest for our study, as in Fig. 2.
In any case, we conclude that no evidence for a circumstel-
lar disk can be obtained from the molecular line emission in
this object. Since the source appears to be the most evolved of
our sample (see Fig. 1), one could speculate that the molecular
component of the disk has been substantially dispersed. This
hypothesis seems supported by the result discussed in Sect. 4.2,
namely that G17.64 is emission weak but chemically rich. Such
a chemical complexity is consistent with the (former) presence
of a HMC, while the faint line emission indicates that only a
remnant of the pristine dense molecular gas is left.
If G17.64 is the most evolved of our sources, one ex-
pects to find an Hii region associated with it. No radio con-
tinuum has been detected at 6 cm with the VLA at ∼2′′
resolution (Urquhart et al. 2009; see also the on-line RMS
database), which would hint at a young source. However,
Menten & van der Tak (2004) have revealed a bright (>2000 K
at 43 GHz) free-free continuum source, whose position is con-
sistent, within the uncertainties, with the continuum peak seen
with ALMA (see Fig. 6). Furthermore, inspection of the cor-
responding NVSS (Condon et al. 1998) field reveals a peak of
continuum emission at 20 cm of ∼3 mJy/beam. These findings
suggest that G17.64 could be related to an Hii region, although
considering the large NVSS image resolution (45′′), an associ-
ation remains ambiguous.
5.2. G24.78
Various studies (Beltran et al. 2004, 2005, 2011b) have pro-
vided evidence for the existence of up to three rotating cores
in the region observed with ALMA. Here, we focus on the
most prominent core (A1, following the notation by Beltran
et al. 2005) containing the hypercompact Hii region studied by
R. Cesaroni et al.: Chasing disks around O-type (proto)stars: Evidence from ALMA observations 13
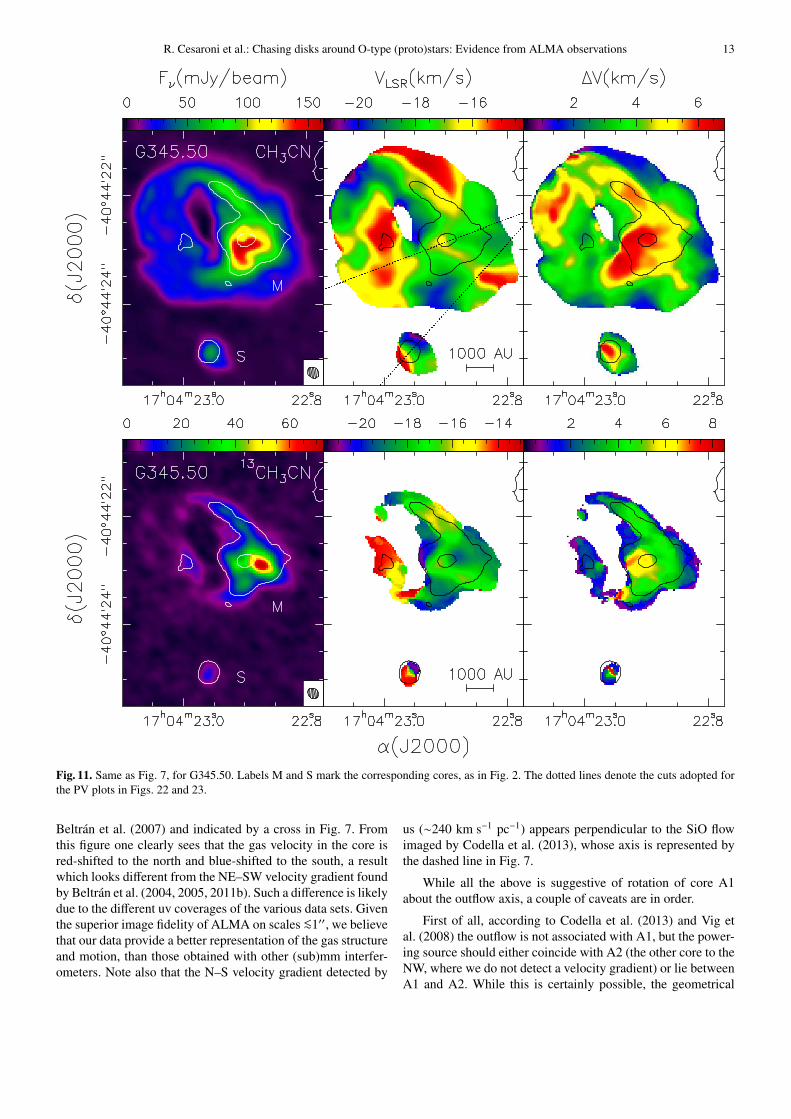
Fig. 11. Same as Fig. 7, for G345.50. Labels M and S mark the corresponding cores, as in Fig. 2. The dotted lines denote the cuts adopted for
the PV plots in Figs. 22 and 23.
Beltran et al. (2007) and indicated by a cross in Fig. 7. From
this figure one clearly sees that the gas velocity in the core is
red-shifted to the north and blue-shifted to the south, a result
which looks different from the NE–SW velocity gradient found
by Beltran et al. (2004, 2005, 2011b). Such a difference is likely
due to the different uv coverages of the various data sets. Given
the superior image fidelity of ALMA on scales <∼1′′, we believe
that our data provide a better representation of the gas structure
and motion, than those obtained with other (sub)mm interfer-
ometers. Note also that the N–S velocity gradient detected by
us (∼240 km s−1 pc−1) appears perpendicular to the SiO flow
imaged by Codella et al. (2013), whose axis is represented by
the dashed line in Fig. 7.
While all the above is suggestive of rotation of core A1
about the outflow axis, a couple of caveats are in order.
First of all, according to Codella et al. (2013) and Vig et
al. (2008) the outflow is not associated with A1, but the power-
ing source should either coincide with A2 (the other core to the
NW, where we do not detect a velocity gradient) or lie between
A1 and A2. While this is certainly possible, the geometrical
14 R. Cesaroni et al.: Chasing disks around O-type (proto)stars: Evidence from ALMA observations
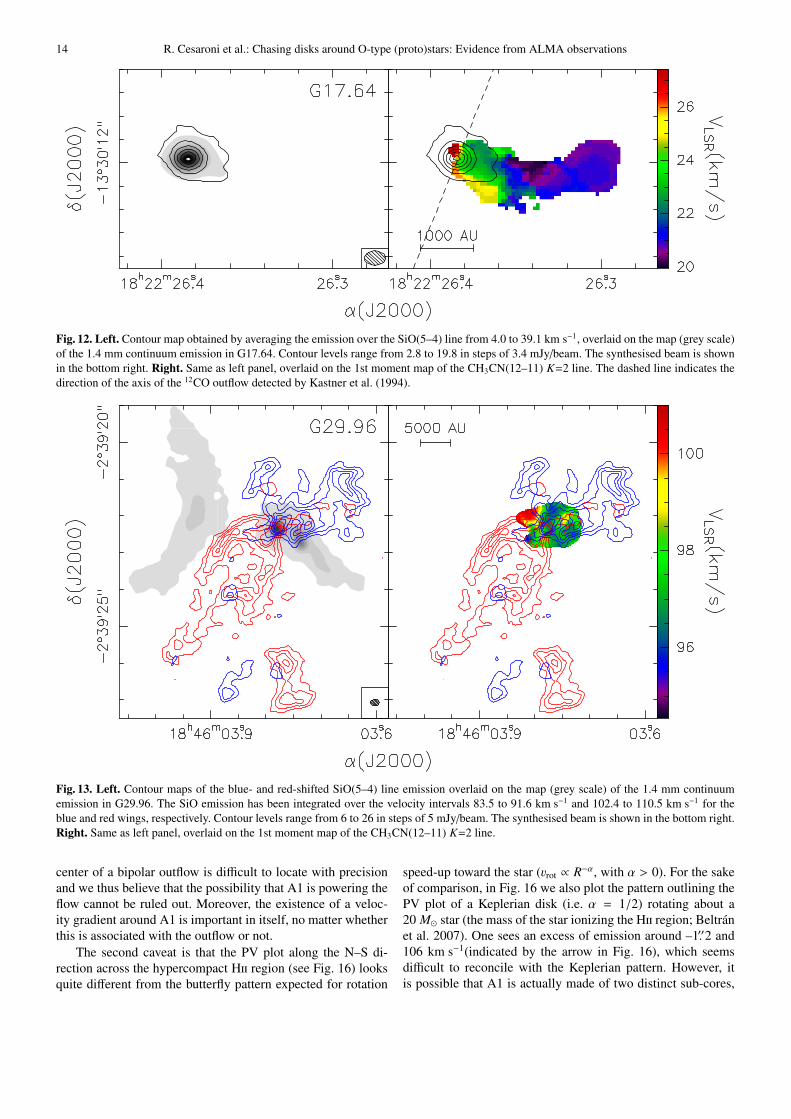
Fig. 12. Left. Contour map obtained by averaging the emission over the SiO(5–4) line from 4.0 to 39.1 km s−1, overlaid on the map (grey scale)
of the 1.4 mm continuum emission in G17.64. Contour levels range from 2.8 to 19.8 in steps of 3.4 mJy/beam. The synthesised beam is shown
in the bottom right. Right. Same as left panel, overlaid on the 1st moment map of the CH3CN(12–11) K=2 line. The dashed line indicates the
direction of the axis of the 12CO outflow detected by Kastner et al. (1994).
Fig. 13. Left. Contour maps of the blue- and red-shifted SiO(5–4) line emission overlaid on the map (grey scale) of the 1.4 mm continuum
emission in G29.96. The SiO emission has been integrated over the velocity intervals 83.5 to 91.6 km s−1 and 102.4 to 110.5 km s−1 for the
blue and red wings, respectively. Contour levels range from 6 to 26 in steps of 5 mJy/beam. The synthesised beam is shown in the bottom right.
Right. Same as left panel, overlaid on the 1st moment map of the CH3CN(12–11) K=2 line.
center of a bipolar outflow is difficult to locate with precision
and we thus believe that the possibility that A1 is powering the
flow cannot be ruled out. Moreover, the existence of a veloc-
ity gradient around A1 is important in itself, no matter whether
this is associated with the outflow or not.
The second caveat is that the PV plot along the N–S di-
rection across the hypercompact Hii region (see Fig. 16) looks
quite different from the butterfly pattern expected for rotation
speed-up toward the star (3rot ∝ R−α, with α > 0). For the sake
of comparison, in Fig. 16 we also plot the pattern outlining the
PV plot of a Keplerian disk (i.e. α = 1/2) rotating about a
20 M⊙ star (the mass of the star ionizing the Hii region; Beltran
et al. 2007). One sees an excess of emission around –1.′′2 and
106 km s−1(indicated by the arrow in Fig. 16), which seems
difficult to reconcile with the Keplerian pattern. However, it
is possible that A1 is actually made of two distinct sub-cores,
R. Cesaroni et al.: Chasing disks around O-type (proto)stars: Evidence from ALMA observations 15
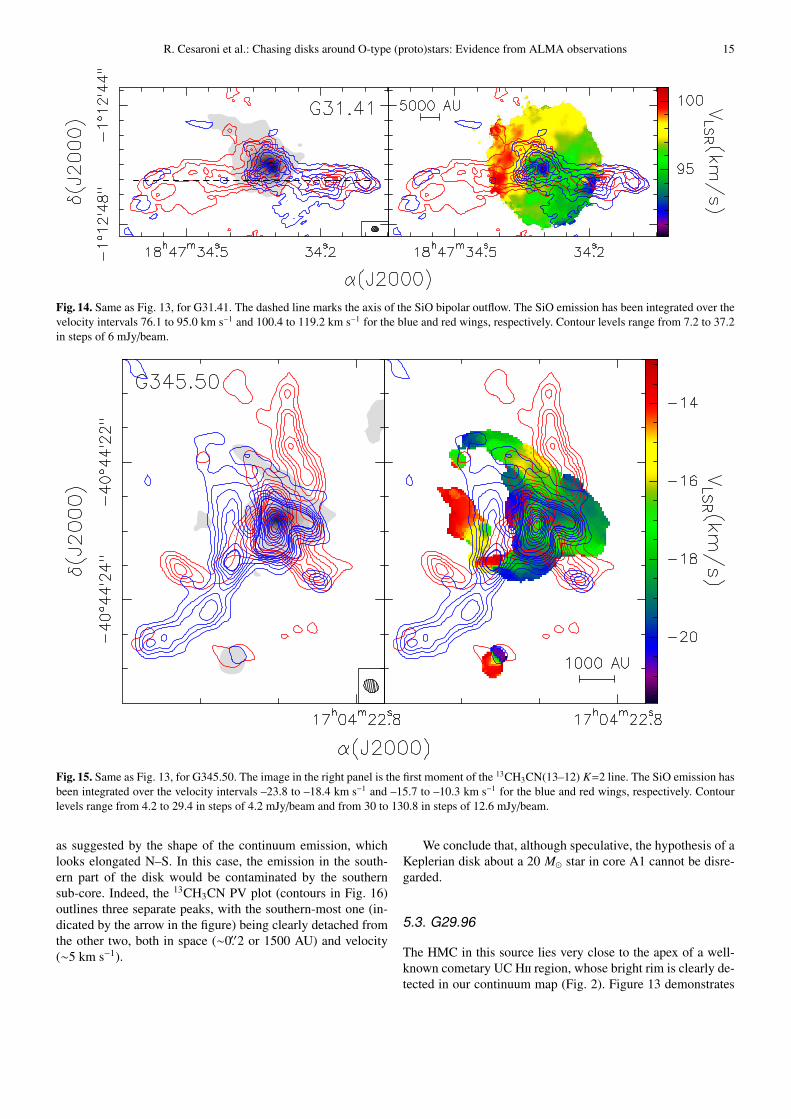
Fig. 14. Same as Fig. 13, for G31.41. The dashed line marks the axis of the SiO bipolar outflow. The SiO emission has been integrated over the
velocity intervals 76.1 to 95.0 km s−1 and 100.4 to 119.2 km s−1 for the blue and red wings, respectively. Contour levels range from 7.2 to 37.2
in steps of 6 mJy/beam.
Fig. 15. Same as Fig. 13, for G345.50. The image in the right panel is the first moment of the 13CH3CN(13–12) K=2 line. The SiO emission has
been integrated over the velocity intervals –23.8 to –18.4 km s−1 and –15.7 to –10.3 km s−1 for the blue and red wings, respectively. Contour
levels range from 4.2 to 29.4 in steps of 4.2 mJy/beam and from 30 to 130.8 in steps of 12.6 mJy/beam.
as suggested by the shape of the continuum emission, which
looks elongated N–S. In this case, the emission in the south-
ern part of the disk would be contaminated by the southern
sub-core. Indeed, the 13CH3CN PV plot (contours in Fig. 16)
outlines three separate peaks, with the southern-most one (in-
dicated by the arrow in the figure) being clearly detached from
the other two, both in space (∼0.′′2 or 1500 AU) and velocity
(∼5 km s−1).
We conclude that, although speculative, the hypothesis of a
Keplerian disk about a 20 M⊙ star in core A1 cannot be disre-
garded.
5.3. G29.96
The HMC in this source lies very close to the apex of a well-
known cometary UC Hii region, whose bright rim is clearly de-
tected in our continuum map (Fig. 2). Figure 13 demonstrates
16 R. Cesaroni et al.: Chasing disks around O-type (proto)stars: Evidence from ALMA observations
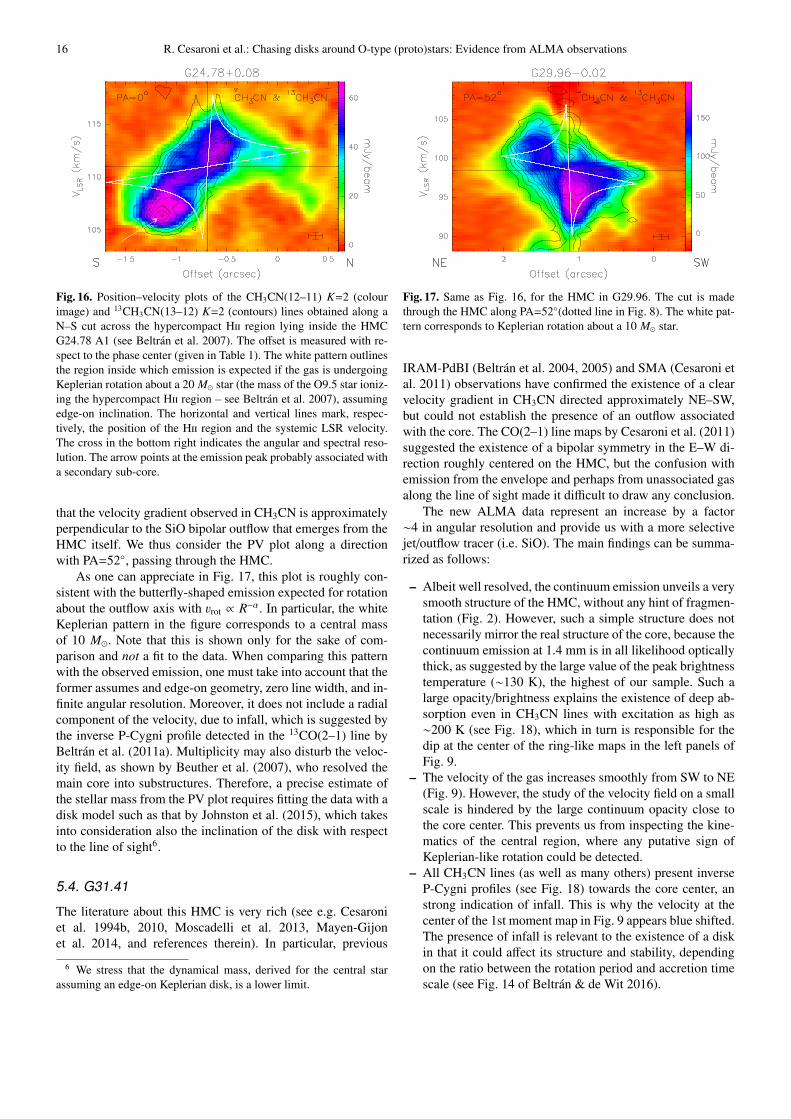
Fig. 16. Position–velocity plots of the CH3CN(12–11) K=2 (colour
image) and 13CH3CN(13–12) K=2 (contours) lines obtained along a
N–S cut across the hypercompact Hii region lying inside the HMC
G24.78 A1 (see Beltran et al. 2007). The offset is measured with re-
spect to the phase center (given in Table 1). The white pattern outlines
the region inside which emission is expected if the gas is undergoing
Keplerian rotation about a 20 M⊙ star (the mass of the O9.5 star ioniz-
ing the hypercompact Hii region – see Beltran et al. 2007), assuming
edge-on inclination. The horizontal and vertical lines mark, respec-
tively, the position of the Hii region and the systemic LSR velocity.
The cross in the bottom right indicates the angular and spectral reso-
lution. The arrow points at the emission peak probably associated with
a secondary sub-core.
that the velocity gradient observed in CH3CN is approximately
perpendicular to the SiO bipolar outflow that emerges from the
HMC itself. We thus consider the PV plot along a direction
with PA=52◦, passing through the HMC.
As one can appreciate in Fig. 17, this plot is roughly con-
sistent with the butterfly-shaped emission expected for rotation
about the outflow axis with 3rot ∝ R−α. In particular, the white
Keplerian pattern in the figure corresponds to a central mass
of 10 M⊙. Note that this is shown only for the sake of com-
parison and not a fit to the data. When comparing this pattern
with the observed emission, one must take into account that the
former assumes and edge-on geometry, zero line width, and in-
finite angular resolution. Moreover, it does not include a radial
component of the velocity, due to infall, which is suggested by
the inverse P-Cygni profile detected in the 13CO(2–1) line by
Beltran et al. (2011a). Multiplicity may also disturb the veloc-
ity field, as shown by Beuther et al. (2007), who resolved the
main core into substructures. Therefore, a precise estimate of
the stellar mass from the PV plot requires fitting the data with a
disk model such as that by Johnston et al. (2015), which takes
into consideration also the inclination of the disk with respect
to the line of sight6.
5.4. G31.41
The literature about this HMC is very rich (see e.g. Cesaroni
et al. 1994b, 2010, Moscadelli et al. 2013, Mayen-Gijon
et al. 2014, and references therein). In particular, previous
6 We stress that the dynamical mass, derived for the central star
assuming an edge-on Keplerian disk, is a lower limit.
Fig. 17. Same as Fig. 16, for the HMC in G29.96. The cut is made
through the HMC along PA=52◦(dotted line in Fig. 8). The white pat-
tern corresponds to Keplerian rotation about a 10 M⊙ star.
IRAM-PdBI (Beltran et al. 2004, 2005) and SMA (Cesaroni et
al. 2011) observations have confirmed the existence of a clear
velocity gradient in CH3CN directed approximately NE–SW,
but could not establish the presence of an outflow associated
with the core. The CO(2–1) line maps by Cesaroni et al. (2011)
suggested the existence of a bipolar symmetry in the E–W di-
rection roughly centered on the HMC, but the confusion with
emission from the envelope and perhaps from unassociated gas
along the line of sight made it difficult to draw any conclusion.
The new ALMA data represent an increase by a factor
∼4 in angular resolution and provide us with a more selective
jet/outflow tracer (i.e. SiO). The main findings can be summa-
rized as follows:
– Albeit well resolved, the continuum emission unveils a very
smooth structure of the HMC, without any hint of fragmen-
tation (Fig. 2). However, such a simple structure does not
necessarily mirror the real structure of the core, because the
continuum emission at 1.4 mm is in all likelihood optically
thick, as suggested by the large value of the peak brightness
temperature (∼130 K), the highest of our sample. Such a
large opacity/brightness explains the existence of deep ab-
sorption even in CH3CN lines with excitation as high as
∼200 K (see Fig. 18), which in turn is responsible for the
dip at the center of the ring-like maps in the left panels of
Fig. 9.
– The velocity of the gas increases smoothly from SW to NE
(Fig. 9). However, the study of the velocity field on a small
scale is hindered by the large continuum opacity close to
the core center. This prevents us from inspecting the kine-
matics of the central region, where any putative sign of
Keplerian-like rotation could be detected.
– All CH3CN lines (as well as many others) present inverse
P-Cygni profiles (see Fig. 18) towards the core center, an
strong indication of infall. This is why the velocity at the
center of the 1st moment map in Fig. 9 appears blue shifted.
The presence of infall is relevant to the existence of a disk
in that it could affect its structure and stability, depending
on the ratio between the rotation period and accretion time
scale (see Fig. 14 of Beltran & de Wit 2016).
R. Cesaroni et al.: Chasing disks around O-type (proto)stars: Evidence from ALMA observations 17
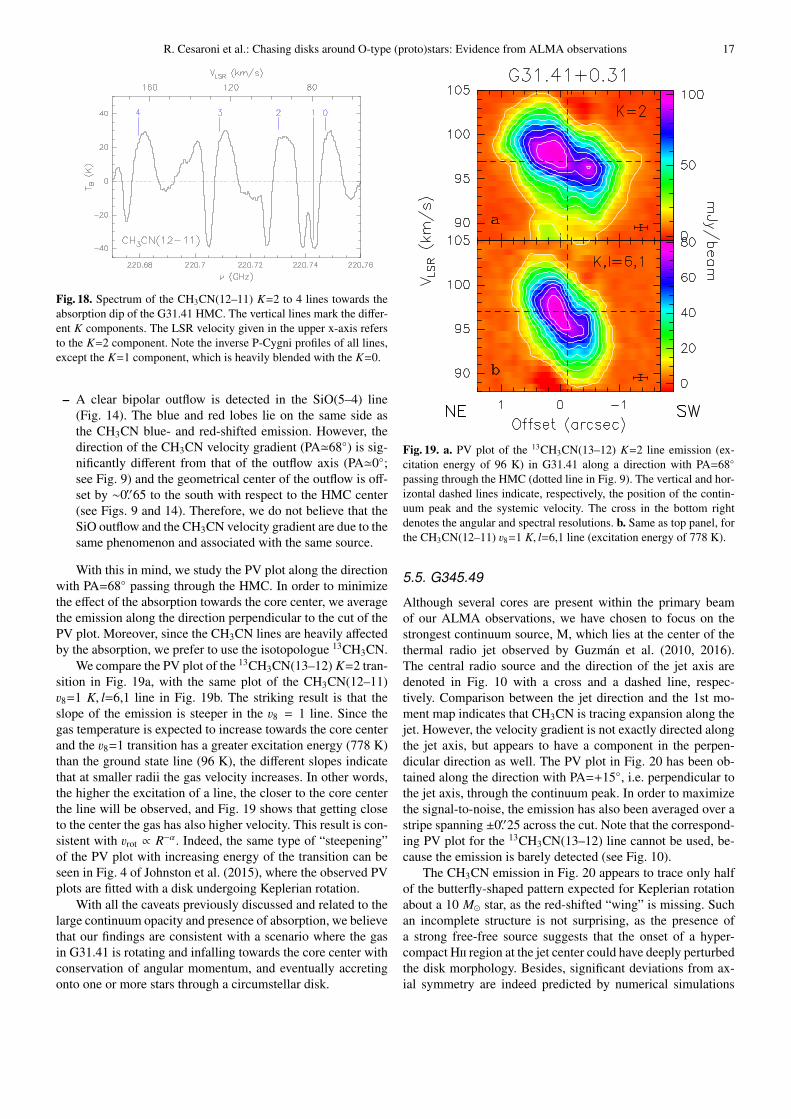
Fig. 18. Spectrum of the CH3CN(12–11) K=2 to 4 lines towards the
absorption dip of the G31.41 HMC. The vertical lines mark the differ-
ent K components. The LSR velocity given in the upper x-axis refers
to the K=2 component. Note the inverse P-Cygni profiles of all lines,
except the K=1 component, which is heavily blended with the K=0.
– A clear bipolar outflow is detected in the SiO(5–4) line
(Fig. 14). The blue and red lobes lie on the same side as
the CH3CN blue- and red-shifted emission. However, the
direction of the CH3CN velocity gradient (PA≃68◦) is sig-
nificantly different from that of the outflow axis (PA≃0◦;
see Fig. 9) and the geometrical center of the outflow is off-
set by ∼0.′′65 to the south with respect to the HMC center
(see Figs. 9 and 14). Therefore, we do not believe that the
SiO outflow and the CH3CN velocity gradient are due to the
same phenomenon and associated with the same source.
With this in mind, we study the PV plot along the direction
with PA=68◦ passing through the HMC. In order to minimize
the effect of the absorption towards the core center, we average
the emission along the direction perpendicular to the cut of the
PV plot. Moreover, since the CH3CN lines are heavily affected
by the absorption, we prefer to use the isotopologue 13CH3CN.
We compare the PV plot of the 13CH3CN(13–12) K=2 tran-
sition in Fig. 19a, with the same plot of the CH3CN(12–11)
38=1 K, l=6,1 line in Fig. 19b. The striking result is that the
slope of the emission is steeper in the 38 = 1 line. Since the
gas temperature is expected to increase towards the core center
and the 38=1 transition has a greater excitation energy (778 K)
than the ground state line (96 K), the different slopes indicate
that at smaller radii the gas velocity increases. In other words,
the higher the excitation of a line, the closer to the core center
the line will be observed, and Fig. 19 shows that getting close
to the center the gas has also higher velocity. This result is con-
sistent with 3rot ∝ R−α. Indeed, the same type of “steepening”
of the PV plot with increasing energy of the transition can be
seen in Fig. 4 of Johnston et al. (2015), where the observed PV
plots are fitted with a disk undergoing Keplerian rotation.
With all the caveats previously discussed and related to the
large continuum opacity and presence of absorption, we believe
that our findings are consistent with a scenario where the gas
in G31.41 is rotating and infalling towards the core center with
conservation of angular momentum, and eventually accreting
onto one or more stars through a circumstellar disk.
Fig. 19. a. PV plot of the 13CH3CN(13–12) K=2 line emission (ex-
citation energy of 96 K) in G31.41 along a direction with PA=68◦
passing through the HMC (dotted line in Fig. 9). The vertical and hor-
izontal dashed lines indicate, respectively, the position of the contin-
uum peak and the systemic velocity. The cross in the bottom right
denotes the angular and spectral resolutions. b. Same as top panel, for
the CH3CN(12–11) 38=1 K, l=6,1 line (excitation energy of 778 K).
5.5. G345.49
Although several cores are present within the primary beam
of our ALMA observations, we have chosen to focus on the
strongest continuum source, M, which lies at the center of the
thermal radio jet observed by Guzman et al. (2010, 2016).
The central radio source and the direction of the jet axis are
denoted in Fig. 10 with a cross and a dashed line, respec-
tively. Comparison between the jet direction and the 1st mo-
ment map indicates that CH3CN is tracing expansion along the
jet. However, the velocity gradient is not exactly directed along
the jet axis, but appears to have a component in the perpen-
dicular direction as well. The PV plot in Fig. 20 has been ob-
tained along the direction with PA=+15◦, i.e. perpendicular to
the jet axis, through the continuum peak. In order to maximize
the signal-to-noise, the emission has also been averaged over a
stripe spanning ±0.′′25 across the cut. Note that the correspond-
ing PV plot for the 13CH3CN(13–12) line cannot be used, be-
cause the emission is barely detected (see Fig. 10).
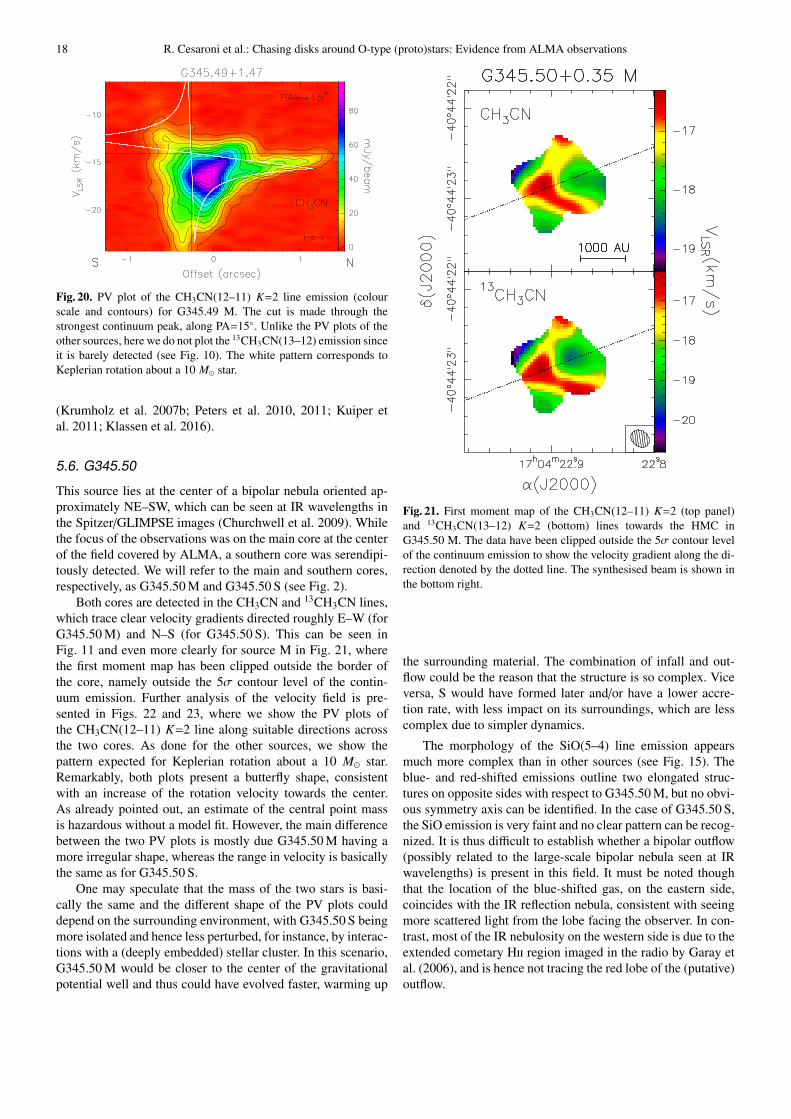
The CH3CN emission in Fig. 20 appears to trace only half
of the butterfly-shaped pattern expected for Keplerian rotation
about a 10 M⊙ star, as the red-shifted “wing” is missing. Such
an incomplete structure is not surprising, as the presence of
a strong free-free source suggests that the onset of a hyper-
compact Hii region at the jet center could have deeply perturbed
the disk morphology. Besides, significant deviations from ax-
ial symmetry are indeed predicted by numerical simulations
18 R. Cesaroni et al.: Chasing disks around O-type (proto)stars: Evidence from ALMA observations
Fig. 20. PV plot of the CH3CN(12–11) K=2 line emission (colour
scale and contours) for G345.49 M. The cut is made through the
strongest continuum peak, along PA=15◦. Unlike the PV plots of the
other sources, here we do not plot the 13CH3CN(13–12) emission since
it is barely detected (see Fig. 10). The white pattern corresponds to
Keplerian rotation about a 10 M⊙ star.
(Krumholz et al. 2007b; Peters et al. 2010, 2011; Kuiper et
al. 2011; Klassen et al. 2016).
5.6. G345.50
This source lies at the center of a bipolar nebula oriented ap-
proximately NE–SW, which can be seen at IR wavelengths in
the Spitzer/GLIMPSE images (Churchwell et al. 2009). While
the focus of the observations was on the main core at the center
of the field covered by ALMA, a southern core was serendipi-
tously detected. We will refer to the main and southern cores,
respectively, as G345.50 M and G345.50 S (see Fig. 2).
Both cores are detected in the CH3CN and 13CH3CN lines,
which trace clear velocity gradients directed roughly E–W (for
G345.50 M) and N–S (for G345.50 S). This can be seen in
Fig. 11 and even more clearly for source M in Fig. 21, where
the first moment map has been clipped outside the border of
the core, namely outside the 5σ contour level of the contin-
uum emission. Further analysis of the velocity field is pre-
sented in Figs. 22 and 23, where we show the PV plots of
the CH3CN(12–11) K=2 line along suitable directions across
the two cores. As done for the other sources, we show the
pattern expected for Keplerian rotation about a 10 M⊙ star.
Remarkably, both plots present a butterfly shape, consistent
with an increase of the rotation velocity towards the center.
As already pointed out, an estimate of the central point mass
is hazardous without a model fit. However, the main difference
between the two PV plots is mostly due G345.50 M having a
more irregular shape, whereas the range in velocity is basically
the same as for G345.50 S.
One may speculate that the mass of the two stars is basi-
cally the same and the different shape of the PV plots could
depend on the surrounding environment, with G345.50 S being
more isolated and hence less perturbed, for instance, by interac-
tions with a (deeply embedded) stellar cluster. In this scenario,
G345.50 M would be closer to the center of the gravitational
potential well and thus could have evolved faster, warming up
Fig. 21. First moment map of the CH3CN(12–11) K=2 (top panel)
and 13CH3CN(13–12) K=2 (bottom) lines towards the HMC in
G345.50 M. The data have been clipped outside the 5σ contour level
of the continuum emission to show the velocity gradient along the di-
rection denoted by the dotted line. The synthesised beam is shown in
the bottom right.
the surrounding material. The combination of infall and out-
flow could be the reason that the structure is so complex. Vice
versa, S would have formed later and/or have a lower accre-
tion rate, with less impact on its surroundings, which are less
complex due to simpler dynamics.
The morphology of the SiO(5–4) line emission appears
much more complex than in other sources (see Fig. 15). The
blue- and red-shifted emissions outline two elongated struc-
tures on opposite sides with respect to G345.50 M, but no obvi-
ous symmetry axis can be identified. In the case of G345.50 S,
the SiO emission is very faint and no clear pattern can be recog-
nized. It is thus difficult to establish whether a bipolar outflow
(possibly related to the large-scale bipolar nebula seen at IR
wavelengths) is present in this field. It must be noted though
that the location of the blue-shifted gas, on the eastern side,
coincides with the IR reflection nebula, consistent with seeing
more scattered light from the lobe facing the observer. In con-
trast, most of the IR nebulosity on the western side is due to the
extended cometary Hii region imaged in the radio by Garay et
al. (2006), and is hence not tracing the red lobe of the (putative)
outflow.
R. Cesaroni et al.: Chasing disks around O-type (proto)stars: Evidence from ALMA observations 19
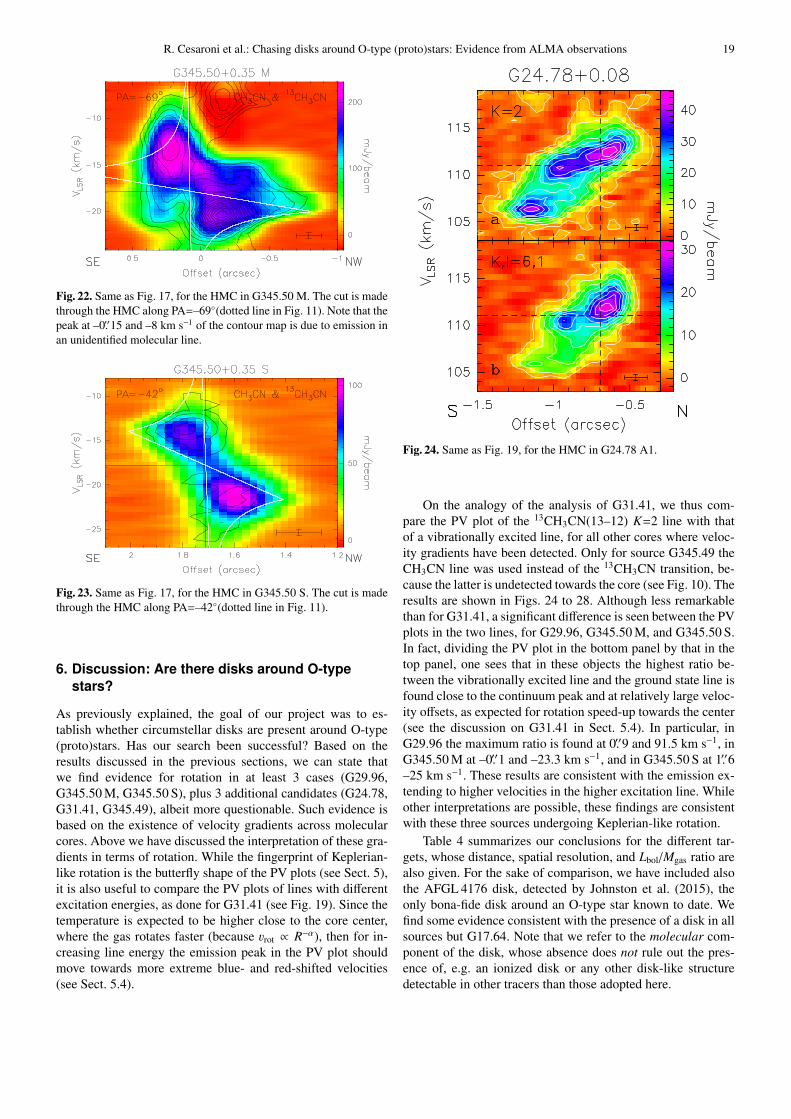
Fig. 22. Same as Fig. 17, for the HMC in G345.50 M. The cut is made
through the HMC along PA=–69◦(dotted line in Fig. 11). Note that the
peak at –0.′′15 and –8 km s−1 of the contour map is due to emission in
an unidentified molecular line.
Fig. 23. Same as Fig. 17, for the HMC in G345.50 S. The cut is made
through the HMC along PA=–42◦(dotted line in Fig. 11).
6. Discussion: Are there disks around O-type
stars?
As previously explained, the goal of our project was to es-
tablish whether circumstellar disks are present around O-type
(proto)stars. Has our search been successful? Based on the
results discussed in the previous sections, we can state that
we find evidence for rotation in at least 3 cases (G29.96,
G345.50 M, G345.50 S), plus 3 additional candidates (G24.78,
G31.41, G345.49), albeit more questionable. Such evidence is
based on the existence of velocity gradients across molecular
cores. Above we have discussed the interpretation of these gra-
dients in terms of rotation. While the fingerprint of Keplerian-
like rotation is the butterfly shape of the PV plots (see Sect. 5),
it is also useful to compare the PV plots of lines with different
excitation energies, as done for G31.41 (see Fig. 19). Since the
temperature is expected to be higher close to the core center,
where the gas rotates faster (because 3rot ∝ R−α), then for in-
creasing line energy the emission peak in the PV plot should
move towards more extreme blue- and red-shifted velocities
(see Sect. 5.4).
Fig. 24. Same as Fig. 19, for the HMC in G24.78 A1.
On the analogy of the analysis of G31.41, we thus com-
pare the PV plot of the 13CH3CN(13–12) K=2 line with that
of a vibrationally excited line, for all other cores where veloc-
ity gradients have been detected. Only for source G345.49 the
CH3CN line was used instead of the 13CH3CN transition, be-
cause the latter is undetected towards the core (see Fig. 10). The
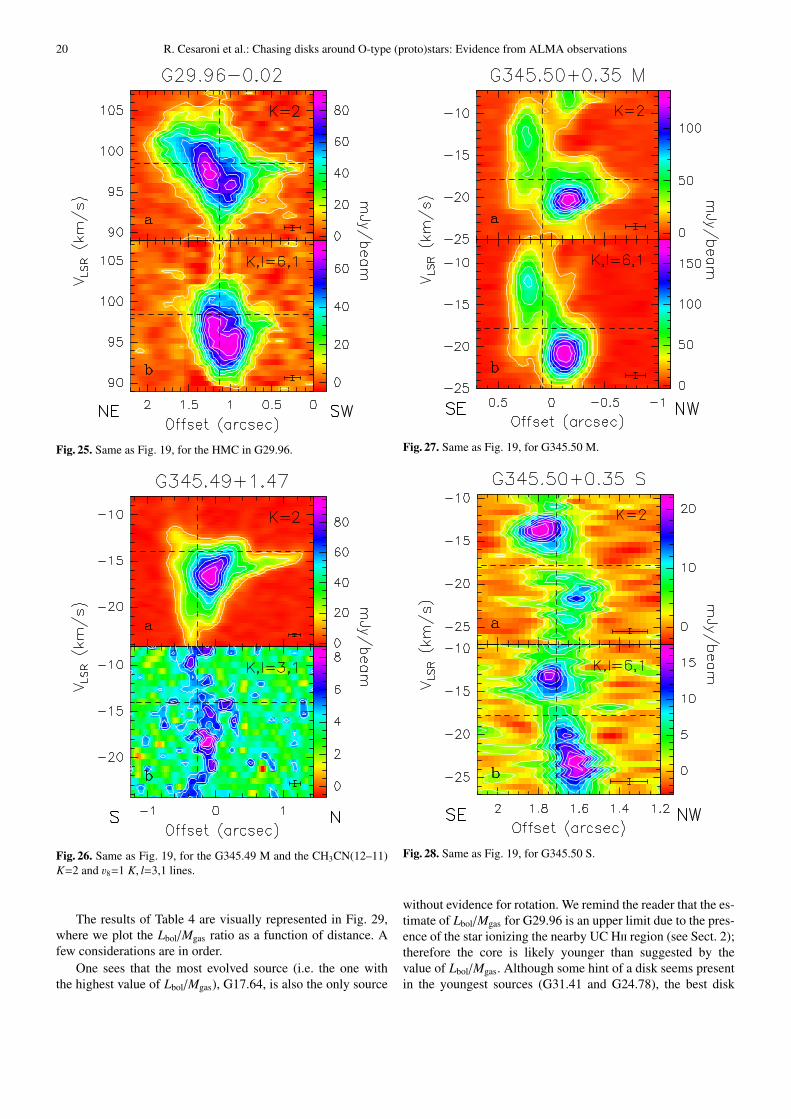
results are shown in Figs. 24 to 28. Although less remarkable
than for G31.41, a significant difference is seen between the PV
plots in the two lines, for G29.96, G345.50 M, and G345.50 S.
In fact, dividing the PV plot in the bottom panel by that in the
top panel, one sees that in these objects the highest ratio be-
tween the vibrationally excited line and the ground state line is
found close to the continuum peak and at relatively large veloc-
ity offsets, as expected for rotation speed-up towards the center
(see the discussion on G31.41 in Sect. 5.4). In particular, in
G29.96 the maximum ratio is found at 0.′′9 and 91.5 km s−1, in
G345.50 M at –0.′′1 and –23.3 km s−1, and in G345.50 S at 1.′′6
–25 km s−1. These results are consistent with the emission ex-
tending to higher velocities in the higher excitation line. While
other interpretations are possible, these findings are consistent
with these three sources undergoing Keplerian-like rotation.
Table 4 summarizes our conclusions for the different tar-
gets, whose distance, spatial resolution, and Lbol/Mgas ratio are
also given. For the sake of comparison, we have included also
the AFGL 4176 disk, detected by Johnston et al. (2015), the
only bona-fide disk around an O-type star known to date. We
find some evidence consistent with the presence of a disk in all
sources but G17.64. Note that we refer to the molecular com-
ponent of the disk, whose absence does not rule out the pres-
ence of, e.g. an ionized disk or any other disk-like structure
detectable in other tracers than those adopted here.
20 R. Cesaroni et al.: Chasing disks around O-type (proto)stars: Evidence from ALMA observations
Fig. 25. Same as Fig. 19, for the HMC in G29.96.
Fig. 26. Same as Fig. 19, for the G345.49 M and the CH3CN(12–11)
K=2 and 38=1 K, l=3,1 lines.
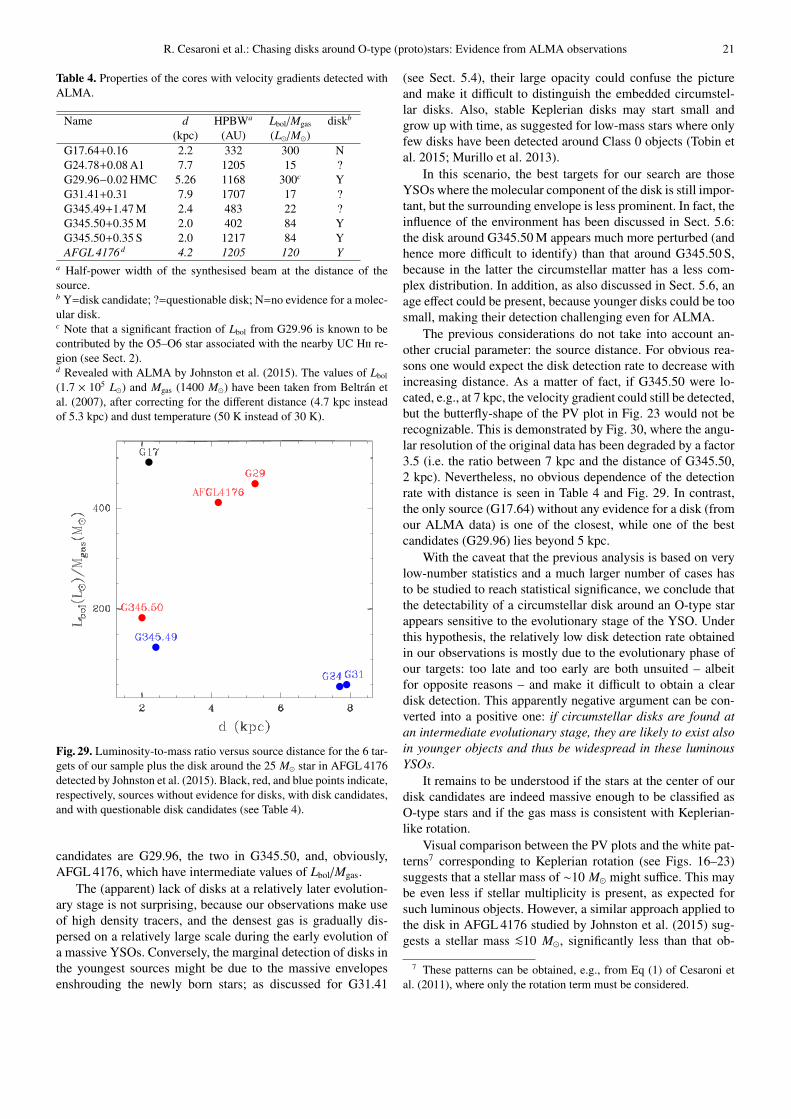
The results of Table 4 are visually represented in Fig. 29,
where we plot the Lbol/Mgas ratio as a function of distance. A
few considerations are in order.
One sees that the most evolved source (i.e. the one with
the highest value of Lbol/Mgas), G17.64, is also the only source
Fig. 27. Same as Fig. 19, for G345.50 M.
Fig. 28. Same as Fig. 19, for G345.50 S.
without evidence for rotation. We remind the reader that the es-
timate of Lbol/Mgas for G29.96 is an upper limit due to the pres-
ence of the star ionizing the nearby UC Hii region (see Sect. 2);
therefore the core is likely younger than suggested by the
value of Lbol/Mgas. Although some hint of a disk seems present
in the youngest sources (G31.41 and G24.78), the best disk
R. Cesaroni et al.: Chasing disks around O-type (proto)stars: Evidence from ALMA observations 21
Table 4. Properties of the cores with velocity gradients detected with
ALMA.
Name d HPBWa Lbol/Mgas diskb
(kpc) (AU) (L⊙/M⊙)
G17.64+0.16 2.2 332 300 N
G24.78+0.08 A1 7.7 1205 15 ?
G29.96−0.02 HMC 5.26 1168 300c Y
G31.41+0.31 7.9 1707 17 ?
G345.49+1.47 M 2.4 483 22 ?
G345.50+0.35 M 2.0 402 84 Y
G345.50+0.35 S 2.0 1217 84 Y
AFGL 4176 d 4.2 1205 120 Y
a Half-power width of the synthesised beam at the distance of the
source.b Y=disk candidate; ?=questionable disk; N=no evidence for a molec-
ular disk.c Note that a significant fraction of Lbol from G29.96 is known to be
contributed by the O5–O6 star associated with the nearby UC Hii re-
gion (see Sect. 2).d Revealed with ALMA by Johnston et al. (2015). The values of Lbol
(1.7 × 10⁵ L⊙) and Mgas (1400 M⊙) have been taken from Beltran et
al. (2007), after correcting for the different distance (4.7 kpc instead
of 5.3 kpc) and dust temperature (50 K instead of 30 K).
Fig. 29. Luminosity-to-mass ratio versus source distance for the 6 tar-
gets of our sample plus the disk around the 25 M⊙ star in AFGL 4176
detected by Johnston et al. (2015). Black, red, and blue points indicate,
respectively, sources without evidence for disks, with disk candidates,
and with questionable disk candidates (see Table 4).
candidates are G29.96, the two in G345.50, and, obviously,
AFGL 4176, which have intermediate values of Lbol/Mgas.
The (apparent) lack of disks at a relatively later evolution-
ary stage is not surprising, because our observations make use
of high density tracers, and the densest gas is gradually dis-
persed on a relatively large scale during the early evolution of
a massive YSOs. Conversely, the marginal detection of disks in
the youngest sources might be due to the massive envelopes
enshrouding the newly born stars; as discussed for G31.41
(see Sect. 5.4), their large opacity could confuse the picture
and make it difficult to distinguish the embedded circumstel-
lar disks. Also, stable Keplerian disks may start small and
grow up with time, as suggested for low-mass stars where only
few disks have been detected around Class 0 objects (Tobin et
al. 2015; Murillo et al. 2013).
In this scenario, the best targets for our search are those
YSOs where the molecular component of the disk is still impor-
tant, but the surrounding envelope is less prominent. In fact, the
influence of the environment has been discussed in Sect. 5.6:
the disk around G345.50 M appears much more perturbed (and
hence more difficult to identify) than that around G345.50 S,
because in the latter the circumstellar matter has a less com-
plex distribution. In addition, as also discussed in Sect. 5.6, an
age effect could be present, because younger disks could be too
small, making their detection challenging even for ALMA.
The previous considerations do not take into account an-
other crucial parameter: the source distance. For obvious rea-
sons one would expect the disk detection rate to decrease with
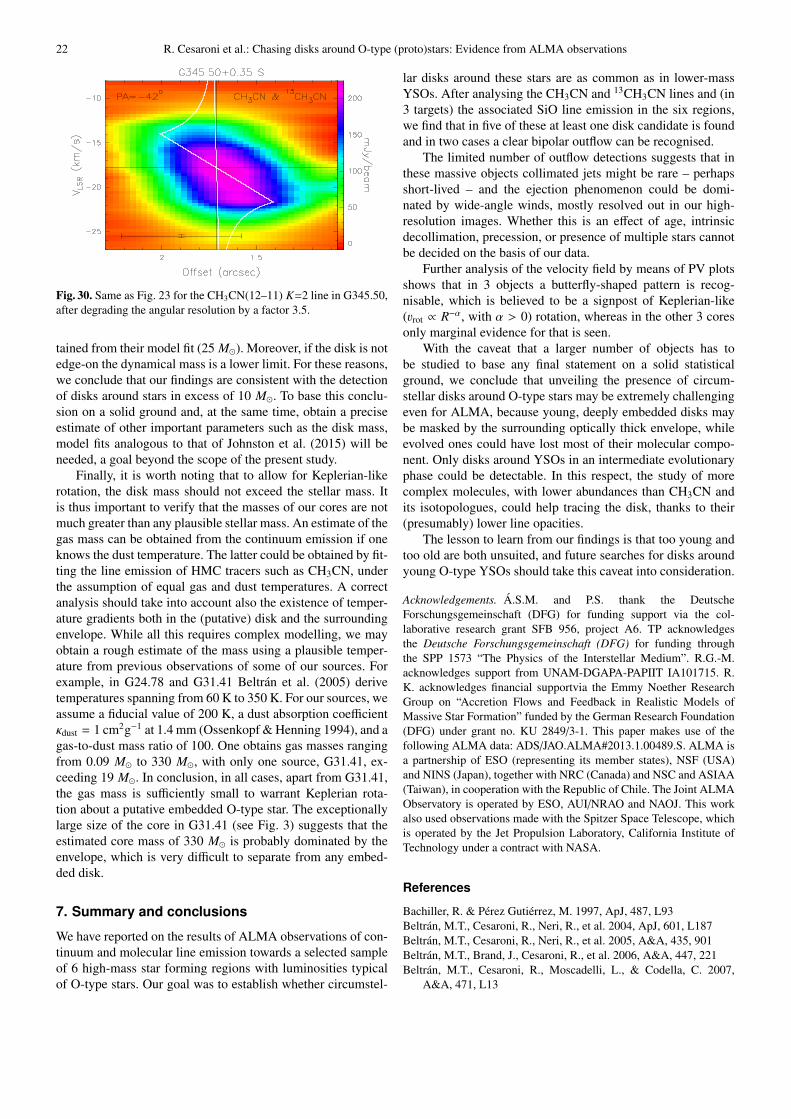
increasing distance. As a matter of fact, if G345.50 were lo-
cated, e.g., at 7 kpc, the velocity gradient could still be detected,
but the butterfly-shape of the PV plot in Fig. 23 would not be
recognizable. This is demonstrated by Fig. 30, where the angu-
lar resolution of the original data has been degraded by a factor
3.5 (i.e. the ratio between 7 kpc and the distance of G345.50,
2 kpc). Nevertheless, no obvious dependence of the detection
rate with distance is seen in Table 4 and Fig. 29. In contrast,
the only source (G17.64) without any evidence for a disk (from
our ALMA data) is one of the closest, while one of the best
candidates (G29.96) lies beyond 5 kpc.
With the caveat that the previous analysis is based on very
low-number statistics and a much larger number of cases has
to be studied to reach statistical significance, we conclude that
the detectability of a circumstellar disk around an O-type star
appears sensitive to the evolutionary stage of the YSO. Under
this hypothesis, the relatively low disk detection rate obtained
in our observations is mostly due to the evolutionary phase of
our targets: too late and too early are both unsuited – albeit
for opposite reasons – and make it difficult to obtain a clear
disk detection. This apparently negative argument can be con-
verted into a positive one: if circumstellar disks are found at
an intermediate evolutionary stage, they are likely to exist also
in younger objects and thus be widespread in these luminous
YSOs.
It remains to be understood if the stars at the center of our
disk candidates are indeed massive enough to be classified as
O-type stars and if the gas mass is consistent with Keplerian-
like rotation.
Visual comparison between the PV plots and the white pat-
terns7 corresponding to Keplerian rotation (see Figs. 16–23)
suggests that a stellar mass of ∼10 M⊙ might suffice. This may
be even less if stellar multiplicity is present, as expected for
such luminous objects. However, a similar approach applied to
the disk in AFGL 4176 studied by Johnston et al. (2015) sug-
gests a stellar mass <∼10 M⊙, significantly less than that ob-
7 These patterns can be obtained, e.g., from Eq (1) of Cesaroni et
al. (2011), where only the rotation term must be considered.
22 R. Cesaroni et al.: Chasing disks around O-type (proto)stars: Evidence from ALMA observations
Fig. 30. Same as Fig. 23 for the CH3CN(12–11) K=2 line in G345.50,
after degrading the angular resolution by a factor 3.5.
tained from their model fit (25 M⊙). Moreover, if the disk is not
edge-on the dynamical mass is a lower limit. For these reasons,
we conclude that our findings are consistent with the detection
of disks around stars in excess of 10 M⊙. To base this conclu-
sion on a solid ground and, at the same time, obtain a precise
estimate of other important parameters such as the disk mass,
model fits analogous to that of Johnston et al. (2015) will be
needed, a goal beyond the scope of the present study.
Finally, it is worth noting that to allow for Keplerian-like
rotation, the disk mass should not exceed the stellar mass. It
is thus important to verify that the masses of our cores are not
much greater than any plausible stellar mass. An estimate of the
gas mass can be obtained from the continuum emission if one
knows the dust temperature. The latter could be obtained by fit-
ting the line emission of HMC tracers such as CH3CN, under
the assumption of equal gas and dust temperatures. A correct
analysis should take into account also the existence of temper-
ature gradients both in the (putative) disk and the surrounding
envelope. While all this requires complex modelling, we may
obtain a rough estimate of the mass using a plausible temper-
ature from previous observations of some of our sources. For
example, in G24.78 and G31.41 Beltran et al. (2005) derive
temperatures spanning from 60 K to 350 K. For our sources, we
assume a fiducial value of 200 K, a dust absorption coefficient
κdust = 1 cm2g−1 at 1.4 mm (Ossenkopf & Henning 1994), and a
gas-to-dust mass ratio of 100. One obtains gas masses ranging
from 0.09 M⊙ to 330 M⊙, with only one source, G31.41, ex-
ceeding 19 M⊙. In conclusion, in all cases, apart from G31.41,
the gas mass is sufficiently small to warrant Keplerian rota-
tion about a putative embedded O-type star. The exceptionally
large size of the core in G31.41 (see Fig. 3) suggests that the
estimated core mass of 330 M⊙ is probably dominated by the
envelope, which is very difficult to separate from any embed-
ded disk.
7. Summary and conclusions
We have reported on the results of ALMA observations of con-
tinuum and molecular line emission towards a selected sample
of 6 high-mass star forming regions with luminosities typical
of O-type stars. Our goal was to establish whether circumstel-
lar disks around these stars are as common as in lower-mass
YSOs. After analysing the CH3CN and 13CH3CN lines and (in
3 targets) the associated SiO line emission in the six regions,
we find that in five of these at least one disk candidate is found
and in two cases a clear bipolar outflow can be recognised.
The limited number of outflow detections suggests that in
these massive objects collimated jets might be rare – perhaps
short-lived – and the ejection phenomenon could be domi-
nated by wide-angle winds, mostly resolved out in our high-
resolution images. Whether this is an effect of age, intrinsic
decollimation, precession, or presence of multiple stars cannot
be decided on the basis of our data.
Further analysis of the velocity field by means of PV plots
shows that in 3 objects a butterfly-shaped pattern is recog-
nisable, which is believed to be a signpost of Keplerian-like
(3rot ∝ R−α, with α > 0) rotation, whereas in the other 3 cores
only marginal evidence for that is seen.
With the caveat that a larger number of objects has to
be studied to base any final statement on a solid statistical
ground, we conclude that unveiling the presence of circum-
stellar disks around O-type stars may be extremely challenging
even for ALMA, because young, deeply embedded disks may
be masked by the surrounding optically thick envelope, while
evolved ones could have lost most of their molecular compo-
nent. Only disks around YSOs in an intermediate evolutionary
phase could be detectable. In this respect, the study of more
complex molecules, with lower abundances than CH3CN and
its isotopologues, could help tracing the disk, thanks to their
(presumably) lower line opacities.
The lesson to learn from our findings is that too young and
too old are both unsuited, and future searches for disks around
young O-type YSOs should take this caveat into consideration.
Acknowledgements. A.S.M. and P.S. thank the Deutsche
Forschungsgemeinschaft (DFG) for funding support via the col-
laborative research grant SFB 956, project A6. TP acknowledges
the Deutsche Forschungsgemeinschaft (DFG) for funding through
the SPP 1573 “The Physics of the Interstellar Medium”. R.G.-M.
acknowledges support from UNAM-DGAPA-PAPIIT IA101715. R.
K. acknowledges financial supportvia the Emmy Noether Research
Group on “Accretion Flows and Feedback in Realistic Models of
Massive Star Formation” funded by the German Research Foundation
(DFG) under grant no. KU 2849/3-1. This paper makes use of the
following ALMA data: ADS/JAO.ALMA#2013.1.00489.S. ALMA is
a partnership of ESO (representing its member states), NSF (USA)
and NINS (Japan), together with NRC (Canada) and NSC and ASIAA
(Taiwan), in cooperation with the Republic of Chile. The Joint ALMA
Observatory is operated by ESO, AUI/NRAO and NAOJ. This work
also used observations made with the Spitzer Space Telescope, which
is operated by the Jet Propulsion Laboratory, California Institute of
Technology under a contract with NASA.
References
Bachiller, R. & Perez Gutierrez, M. 1997, ApJ, 487, L93
Beltran, M.T., Cesaroni, R., Neri, R., et al. 2004, ApJ, 601, L187
Beltran, M.T., Cesaroni, R., Neri, R., et al. 2005, A&A, 435, 901
Beltran, M.T., Brand, J., Cesaroni, R., et al. 2006, A&A, 447, 221
Beltran, M.T., Cesaroni, R., Moscadelli, L., & Codella, C. 2007,
A&A, 471, L13
R. Cesaroni et al.: Chasing disks around O-type (proto)stars: Evidence from ALMA observations 23
Beltran, M.T., Cesaroni, R., Neri, R., & Codella, C. 2011a, A&A, 525,
A151
Beltran, M.T., Cesaroni, R., Zhang, Q., et al. 2011b, A&A, 532, A91
Beltran, M.T., Olmi, L., Cesaroni, R., et al. 2013, A&A, 552, A123
Beltran, M.T., Sanchez-Monge, A., Cesaroni, R., et al. 2014, A&A,
571, A52
Beltran, M.T. & de Wit, W.J. 2016, A&ARv, 24, 6
Beuther, H., Zhang, Q., Bergin, E.A., et al. 2007, A&A, 468, 1045
Bonnell, I.A. & Bate, M.R. 2006, MNRAS, 370, 488
Cesaroni, R., Neri, R., Olmi, L., et al. 2005, A&A, 434, 1039
Cesaroni, R., Beltran, M.T., Zhang, Q., Beuther, H., & Fallscheer, C.
2011, A&A, 533, A73
Cesaroni, R., Galli, D., Neri, R., & Walmsley, C.M. 2014, A&A, 566,
A73
Cesaroni, R., Churchwell, E., Hofner, P., Walmsley, C.M., & Kurtz, S.
1994a, A&A, 288, 903
Cesaroni, R., Olmi, L., Walmsley, C.M., Churchwell, E., & Hofner, P.
1994b, ApJ, 435, L137
Cesaroni, R., Galli, D., Lodato, G., Walmsley, C.M., & Zhang, Q.
2007, in Protostars and Planets V, ed. B. Reipurth, D. Jewitt, &
K. Keil (Tucson: Univ. of Arizona Press), 197
Cesaroni, R., Hofner, P., Araya, E., & Kurtz, S. 2010, A&A, 509, 50
Cesaroni, R., Pestalozzi, M., Beltran, M.T., et al. 2015, A&A, 579,
A71
Codella, C., Beltran, M.T., Cesaroni, R., et al. 2013, A&A, 550, A81
Condon, J.J., Cotton, W.D., Greisen, E.W., et al. 1998, AJ, 115, 1693
Contreras, Y., Schuller, F., Urquhart, J. S., et al. 2013, A&A, 549, A45
Churchwell, E., Babler, B.L., Meade, M.R., et al. 2009, PASP, 121,
213
De Buizer, J.M., Watson, A.M., Radomski, J.T., Pina, R.K., & Telesco,
C.M. 2002, ApJ, 564, L101
Elia, D., Schisano, E., Molinari, S., et al. 2010, A&A, 518, L97
Faundez, S., Bronfman, L., Garay, G., et al. 2004, A&A, 426, 97
Forster, J.R. & Caswell, J.L. 1989, A&A, 213, 339
Garay, G., Brooks, K.J., Mardones, D., & Norris, R.P. 2006, ApJ, 651,
914
Gueth, F., Guilloteau, S., & Bachiller, R. 1998, A&A, 333, 287
Ginsburg, A., Glenn, J., Rosolowsky, E., et al. 2013, ApJS, 208, 14
Guzman, A.E., Garay, G., Brooks, K.J. 2010, ApJ, 725, 734
Guzman, A.E., Garay, G., Brooks, K.J., Rathborne, J., & Gusten, R.
2011, ApJ, 736, 150
Guzman, A.E., Garay, G., Rodrıguez, L.F., et al. 2016, ApJ, 826, 208
Johnston, K.G., Robitaille, T.P., Beuther, H., et al. 2015, ApJ, 813,
L19
Kastner, J.H., Weintraub, D.A., Snell, R.L., et al. 1994, ApJ, 425, 695
Keto, E. 2002, ApJ, 580, 980
Keto, E. 2003, ApJ, 599, 1196
Keto, E. 2007, ApJ, 666, 976
Klassen, M., Pudritz, R.E., Kuiper, R., Peters, T., & Banerjee, R. 2016,
ApJ, 823, 28
Krumholz, M.R., Klein, R.I., & McKee, C.F., 2007a, ApJ, 656, 959
Krumholz, M.R., Klein, R.I., & McKee, C.F., 2007b, ApJ, 665, 478
Krumholz, M.R., Klein, R.I., McKee, C.F., Offner, S.S.R., &
Cunningham, A.J. 2009, Science, 323, 754
Kuiper, R., Klahr, H., Beuther, H., & Henning, Th. 2010, ApJ, 722,
1556
Kuiper, R., Klahr, H., Beuther, H., & Henning, Th. 2011, ApJ, 732, 20
Kuiper, R., Turner, N.J., & Yorke, H.W. 2016, ApJ, 832, 40
Lumsden, S.L., Hoare, M.G., Urquhart, J.S., et al. 2013, ApJS, 208,
11
Martın-Hernandez, N.L., Bik, A., Kaper, L., Tielens, A.G.G.M., &
Hanson, M.M. 2003, A&A, 405, 175
Maud, L.T., Lumsden, S.L., Moore, T.J.T., et al. 2015a, MNRAS, 452,
637
Maud, L.T., Moore, T.J.T., Lumsden, S.L., et al. 2015b, MNRAS, 453,
645
McKee, C. F. & Tan, J. C. 2003, ApJ, 585, 850
Mayen-Gijon, J.M., Anglada, G., Osorio, M., et al. 2014, MNRAS,
437, 3766
Menten, K.M. & van der Tak, F.F.S. 2004, A&A, 414, 289
Moises, A.P., Damineli, A., Figueredo, E., et al. 2011, MNRAS, 411,
705
Molinari, S., Swinyard, B., Bally, J., et al. 2010, PASP, 122, 314
Molinari, S., Schisano, E., Elia, D., et al. 2016, A&A, 591, A149
Moscadelli, L., Li, J.J., Cesaroni, R., Sanna, A., Xu, Y., & Zhang, Q.
2013, A&A, 549, A122
Mottram, J.C., Hoare, M.G., Urquhart, J.S., et al. 2011a, A&A, 525,
A149
Mottram, J.C., Hoare, M.G., Davies, B., et al. 2011b, ApJ, 730, L33
Murillo, N.M., Lai, S.-P., Bruderer, S., Harsono, D., van Dishoeck,
E.F. 2013, A&A, 560, 103
Ossenkopf, V. & Henning, Th. 1994, A&A, 291, 943
Peters, T., Banerjee, R., Klessen, R.S., et al. 2010, ApJ, 711, 1017
Peters, T., Banerjee, R., Klessen, R.S., & Mac Low, M.-M. 2011, ApJ,
729, 72
Peters, T., Klaassen, P.D., Mac Low, M.-M., et al. 2014, ApJ, 788, 14
Rosen, A.L., Krumholz, M.R., & Ramirez-Ruiz, E. 2012, ApJ, 748,
97
Sanchez-Monge, A., Cesaroni, R., Beltran, M.T., et al. 2013, A&A,
552, L10
Sanchez-Monge, A., Beltran, M.T., Cesaroni, R., et al. 2014, A&A,
569, A11
Sanchez-Monge, A., Schilke, P., Ginzburg, A., Cesaroni, R., &
Schmiedeke, A. 2017, A&A, submitted
Schuller, F., Menten, K.M., Contreras, Y., et al. 2009, A&A, 504, 415
Sollins, P.K., Hunter, T.R., Battat, J., et al. 2004, ApJ, 616, L35
Tan, J.C., Beltran, M.T., Caselli, P., et al. 2014, in Protostars and
Planets VI, ed. H. Beuther, R. S. Klessen, C. P. Dullemond, and T.
Henning (Tucson: Univ. of Arizona Press), 149
Tobin, J.J., Looney, L.W., Wilner, D.J., et al. 2015, ApJ, 805, 125
Urquhart, J.S., Busfield, A.L.. Hoare, M.G., et al. 2008, A&A, 487,
253
Urquhart, J.S., Hoare, M.G., Purcell, C.R., et al. 2009, A&A, 501, 539
Vacca, W.D., Garmany, C.D., & Shull, M. 1996, ApJ, 460, 914
van der Tak, F.F.S., van Dishoeck, E.F., Evans, N.J., II, Blake, G.A.
2000, ApJ, 537, 283
Vig, S., Cesaroni, R., Testi, L., Beltran, M.T., & Codella, C. 2008,
A&A, 488, 605
Zapata, L.A., Palau, A., Galvan-Madrid, R., et al. 2015, MNRAS, 447,
1826
Zhang, B., Moscadelli, L., Sato, M., Reid, M.J., et al. 2014, ApJ, 781,
89
Zhang, Y., Tan, J.C., De Buizer, J.M., et al. 2013, ApJ, 767, 58