Embed Size (px)
Citation preview
CHATFIELD WATERSHED PLAN
Developed for:
Colorado Department of Public Health and Environment Chatfield Watershed Authority
Chatfield Watershed Stakeholders
April 2015
Chatfield Watershed Plan April 2015
i
TABLE OF CONTENTS
ACRONYMS .......................................................................................................................................... VII
EXECUTIVE SUMMARY .................................................................................................................... ES-1
1. WATERSHED GOALS AND OBJECTIVES .................................................................................. 9
2. WATERSHED DESCRIPTION .................................................................................................... 11
2.1 Chatfield Watershed Hydrography and Topography ....................................................... 13
2.2 Chatfield Watershed Climate ........................................................................................... 16
2.3 Chatfield Watershed Population ...................................................................................... 19
2.4 Current and Future Land Use .......................................................................................... 21
2.5 Chatfield Reservoir Storage Reallocation ....................................................................... 24
3. REGULATORY AND AGENCY OVERVIEW ............................................................................. 27
3.1 Regulatory Framework .................................................................................................... 27
3.2 Chatfield Watershed Authority ......................................................................................... 32
4. WATER QUALITY AND HYDROLOGIC CONDITIONS ............................................................. 35
4.1 Flow Conditions ............................................................................................................... 35
4.2 Water Quality Conditions ................................................................................................. 37
4.2.1 Reservoir Conditions ........................................................................................... 42 4.2.2 Watershed Conditions ......................................................................................... 44 4.2.3 Focus on Total Phosphorus Conditions ............................................................... 49
5. POLLUTANT SOURCE ASSESSMENT AND LINKAGE TO WATER QUALITY ....................... 52
5.1 Agricultural Activities ....................................................................................................... 52
5.1.1 Agricultural Zone Districts .................................................................................... 52
5.2 Septic Systems ................................................................................................................ 54
5.3 Streambank Erosion ........................................................................................................ 56
5.4 Wildfires ........................................................................................................................... 57
5.5 Regulated Stormwater ..................................................................................................... 59
5.6 Wastewater Treatment Facilities ..................................................................................... 61
5.7 Estimated Pollutant Source Loading ............................................................................... 63
6. IDENTIFICATION OF MANAGEMENT STRATEGIES ............................................................... 67
6.1 Agricultural Activities ....................................................................................................... 67
6.1.1 Prioritized Management Measures ...................................................................... 67 6.1.2 Effectiveness of Management Measures ............................................................ 68
Chatfield Watershed Plan April 2015
ii
6.2 Septic Systems ................................................................................................................ 68
6.2.1 Prioritized Management Measures ...................................................................... 70
6.3 Streambank Stabilization ................................................................................................. 71
6.3.1 Prioritized Management Measures ...................................................................... 74 6.3.2 Effectiveness of Management Measures ............................................................ 75
6.4 Wildfire Management ...................................................................................................... 76
6.4.1 Pre-Wildfire Management Activities ..................................................................... 76 6.4.2 Post-Wildfire Management Activities ................................................................... 76 6.4.3 Prioritized Management Measures ...................................................................... 77 6.4.4 Effectiveness of Management Measures ............................................................ 78
6.5 Education and Outreach .................................................................................................. 79
6.5.1 Current Education and Outreach efforts in Chatfield Watershed ........................ 79 6.5.2 Looking Ahead to New Education and Outreach Strategies ............................... 80 6.5.3 Funding New Education and Outreach Strategies .............................................. 81
6.6 Pollutant Source Load Reductions .................................................................................. 82
6.6.1 Prioritized Management Measures ...................................................................... 83
7. IMPLEMENTATION PROGRAM ................................................................................................. 85
7.1 Proposed Implementation Program and Milestones ....................................................... 85
7.2 Monitoring Plan ............................................................................................................... 92
7.3 Technical and Funding Assistance .................................................................................. 92
7.3.1 Long-term Funding Strategy Needed .................................................................. 94
7.4 Water Quality Checkpoints .............................................................................................. 94
8. REFERENCES ............................................................................................................................ 95
9. ANNOTATED BIBLIOGRAPHY .................................................................................................. 99
LIST OF TABLES
Table ES-1 Proposed Implementation Program of Potential Actions to Promote Water Quality Protection .......................................................................................................................... 7
Table 1-1 Nine Elements of a Watershed Plan (US EPA 2008) ........................................................ 9
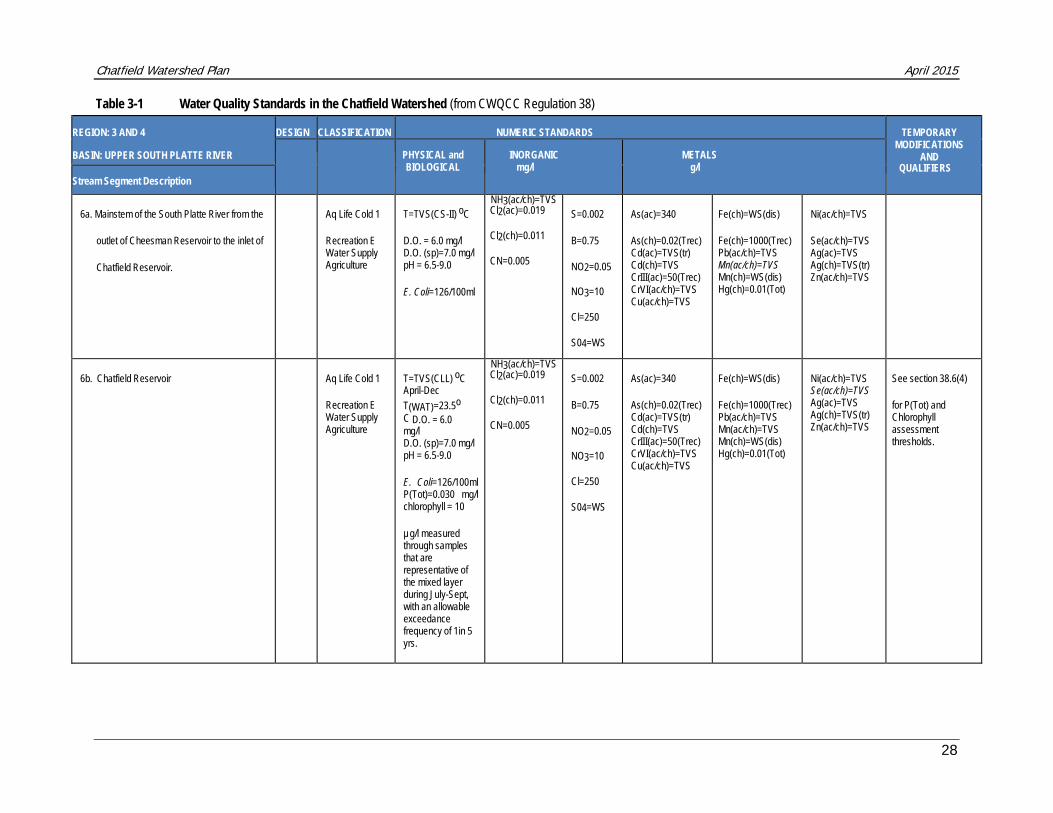
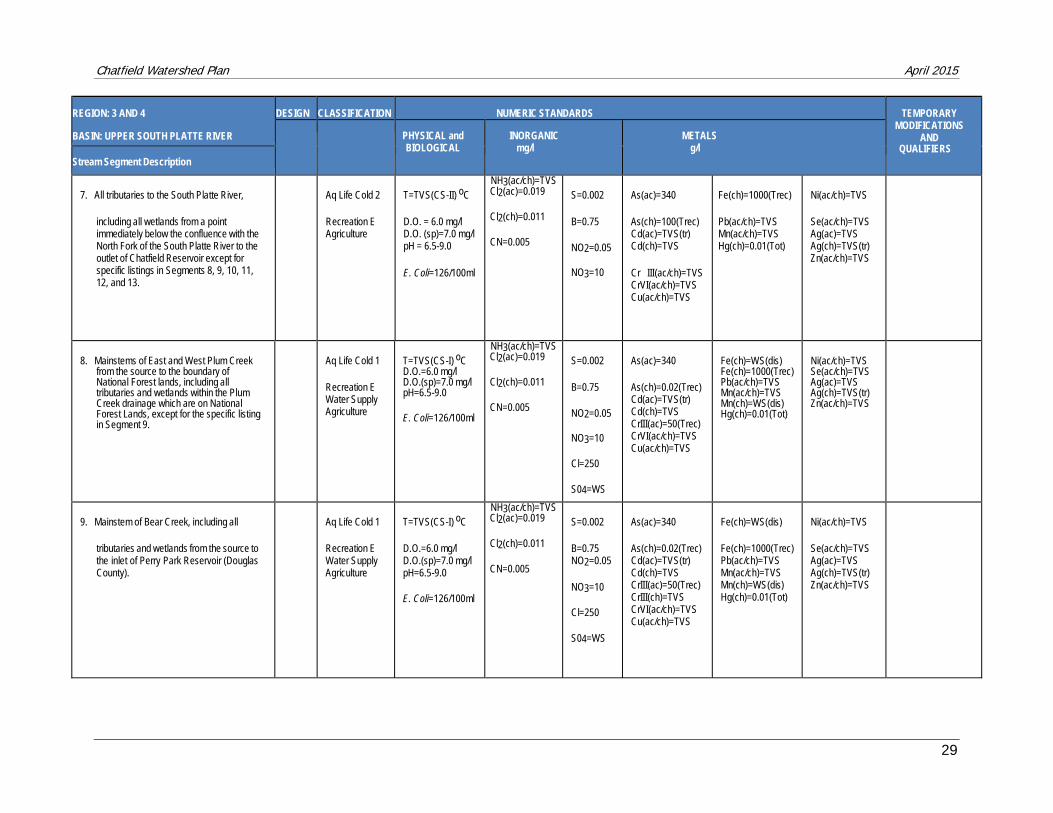
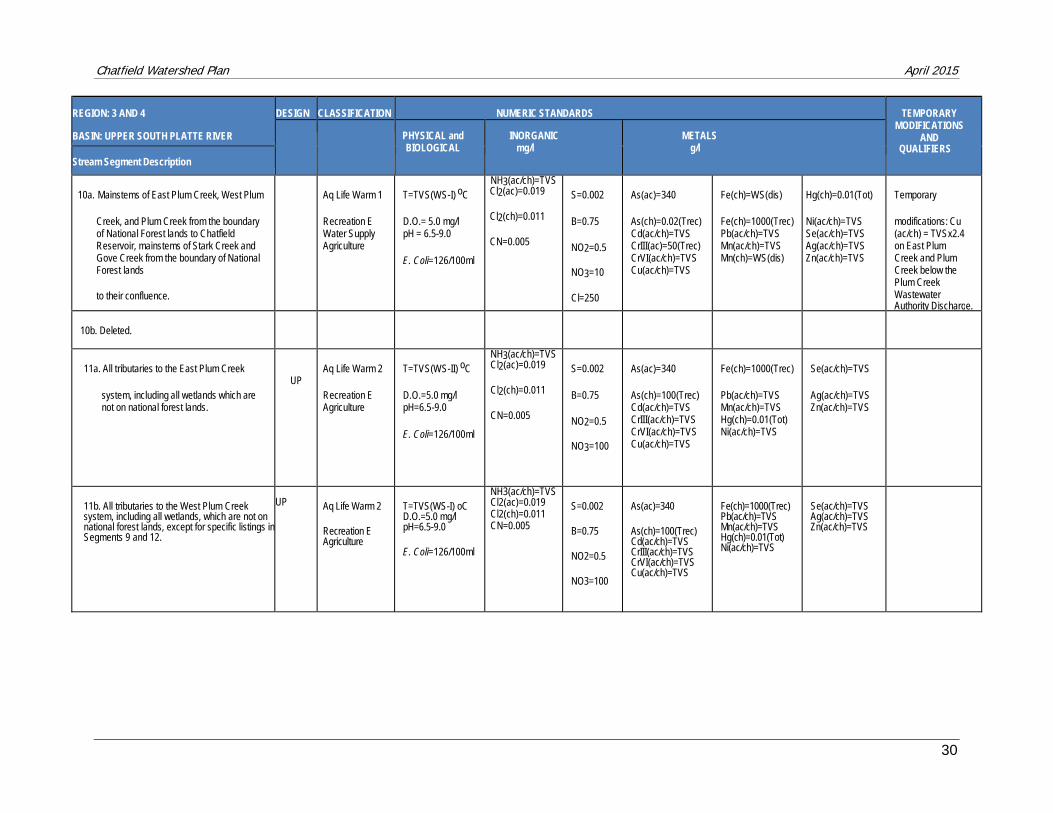
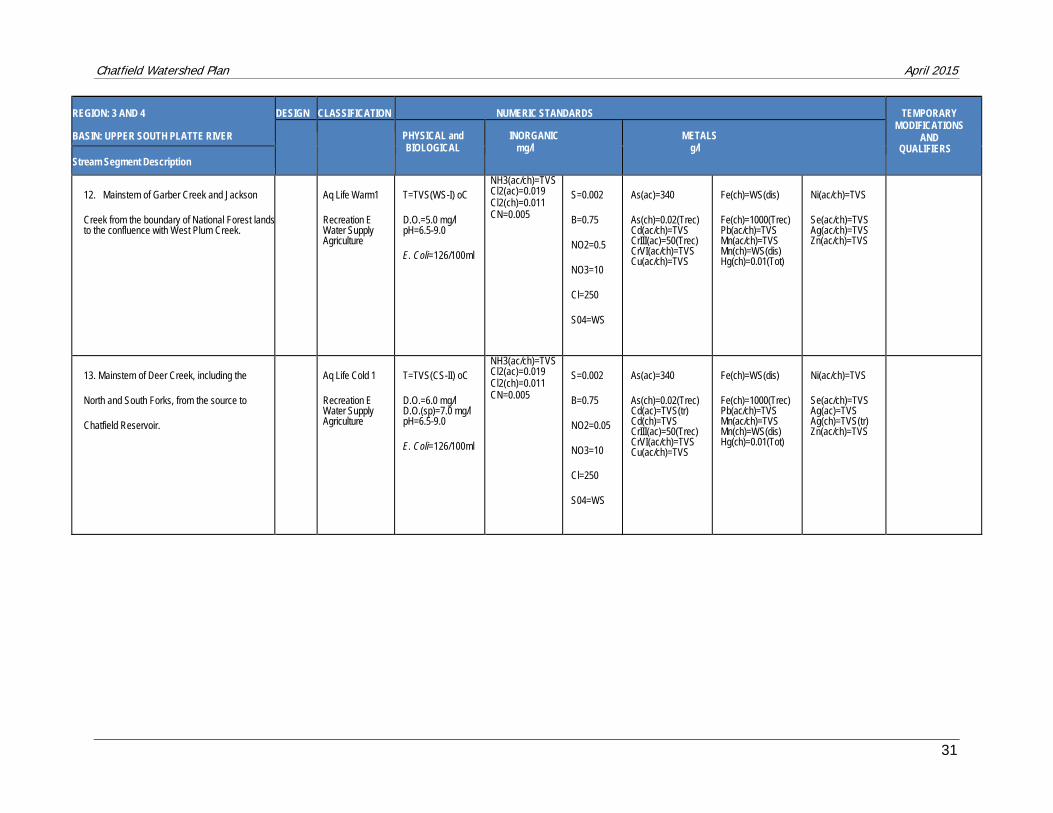
Table 3-1 Water Quality Standards in the Chatfield Watershed (from CWQCC Regulation 38) ................................................................................................................................... 28
Table 3-2 Assessment Criteria and Water Quality Standards in Chatfield Reservoir (from Regulation 38) ................................................................................................................. 32
Table 3-3 Summary of Roles and Legal Responsibilities of the Chatfield Watershed Authority .......................................................................................................................... 34
Table 4-1 Flow Data in Chatfield Watershed ................................................................................... 36
Chatfield Watershed Plan April 2015
iii
Table 4-2 Average Seasonal Flows in Chatfield Watershed .......................................................... 36
Table 4-3 Chatfield Monitoring Program - Analyte List .................................................................... 39
Table 4-4 Water Quality Standards for Parameters Analyzed in the Chatfield Monitoring Program ........................................................................................................................... 40
Table 4-5 Plum Creek Sampling Locations ..................................................................................... 41
Table 4-6 Analyte List and Methods for Plum Cr Surface Water Samples ...................................... 42
Table 4-7 TP vs TSS Correlation Values (R2) Along Reaches of Plum Creek (4/26/12-12/11/13) ......................................................................................................................... 47
Table 4-8 Preliminary Findings of the Plum Creek Watershed Study Error! Bookmark not defined.
Table 5-1 Six Minimum Measures for Stormwater Management .................................................... 59
Table 5-2 Wastewater Treatment Facilities in the Chatfield Watershed .......................................... 61
Table 5-3 Land Use Distribution in Chatfield Watershed (Source of Data: Land Use Coverage from Douglas and Jefferson Counties, Town of Castle Rock, and City of Littleton) ....................................................................................................................... 64
Table 5-4 Potential Land-based Pollutant Loadings per Drainage Area ......................................... 64
Table 6-1 Removal Efficiencies of Typical Septic Systems (USEPA 2002) .................................... 69
Table 6-2 Key Supporters of Education and Outreach in the Chatfield Watershed ........................ 80
Table 6-3 Management Scenarios for Load Reduction Estimation ................................................. 83
Table 6-4 Estimated Load Reductions Based on Loading Spreadsheet Tool ................................. 83
Table 7-1 Proposed Implementation Program and Milestones ....................................................... 86
Table 7-2 Potential Partnership and Funding Resources ................................................................ 93
LIST OF FIGURES Figure ES-1 Chatfield Watershed .......................................................................................................... 1
Figure ES-2 Historic Chl-a Concentrations in Chatfield Reservoir - In 2009 the Chl-a standard of 10 µg/L was adopted, with an assessment threshold of 11.2 µg/L. .............................. 3
Figure ES-3 Historic TP Concentrations in Chatfield Reservoir – In 2009 the TP standard was changed to 30 µg/L with an assessment threshold of 35 µg/L. ......................................... 4
Figure ES-4 Nonpoint Sources in the Chatfield Watershed Impact Water Quality - The majority of TP to the Reservoir is from nonpoint source impacts. Additional data and studies are needed to verify potential sources and magnitude of pollutant loads. ................................................................................................................................. 5
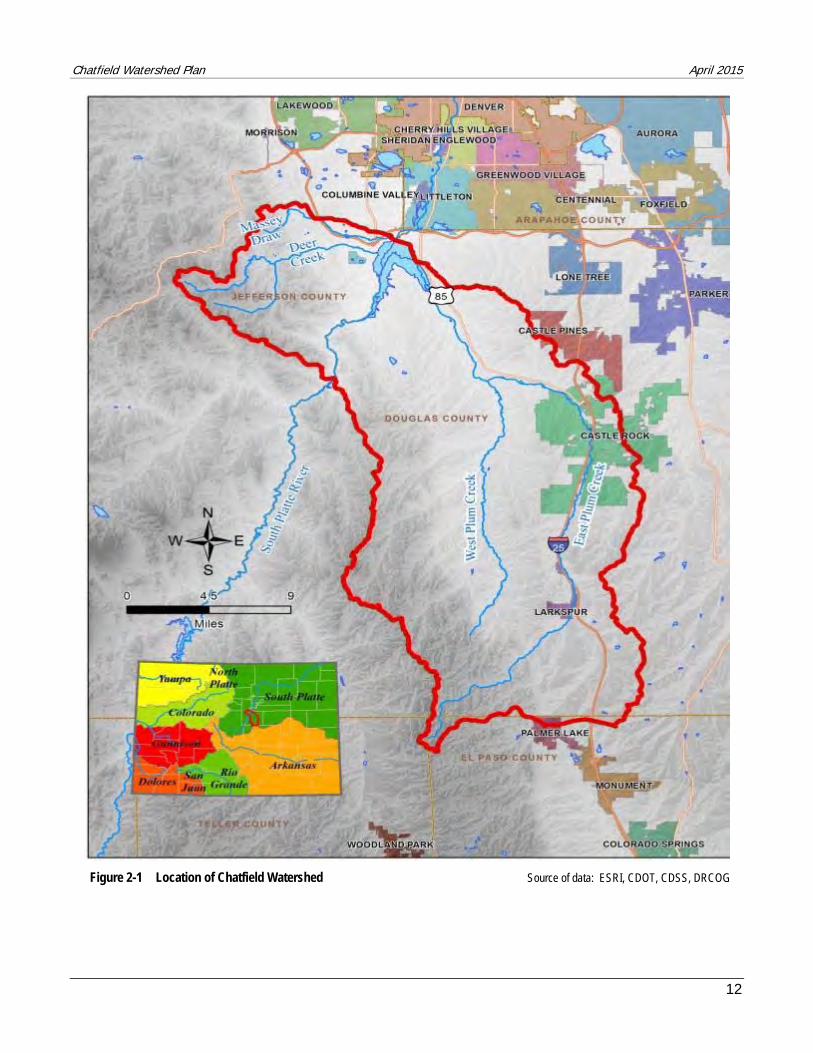
Figure 2-1 Location of Chatfield Watershed Source of data: ESRI, CDOT, CDSS, DRCOG .......... 12
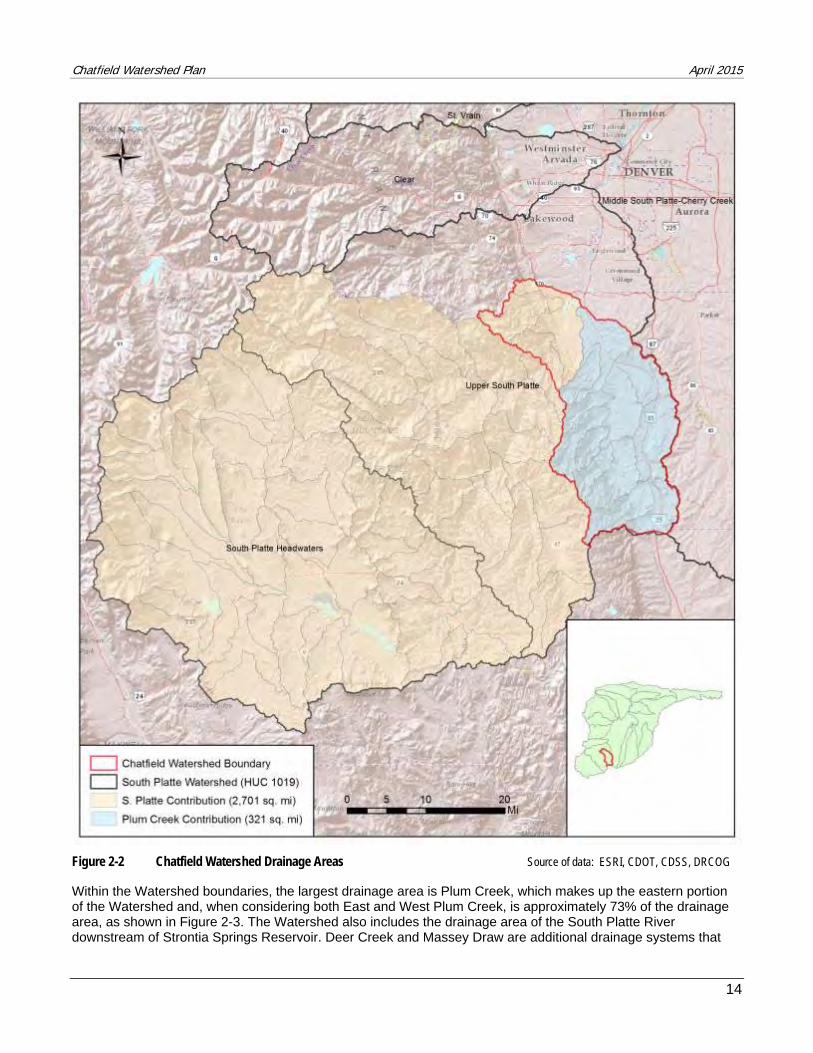
Figure 2-2 Chatfield Watershed Drainage Areas Source of data: ESRI, CDOT, CDSS, DRCOG ........................................................................................................................... 14
Figure 2-3 Chatfield Watershed Hydrography and Topography ....................................................... 15
Chatfield Watershed Plan April 2015
iv
Figure 2-4 Chatfield Watershed Climate Source of data: ESRI, CDOT, CDSS, DRCOG, USDA-NRCS, Oregon Climate Service at Oregon State University ................................ 17
Figure 2-5 Average Annual Precipitation within Chatfield Watershed .............................................. 18
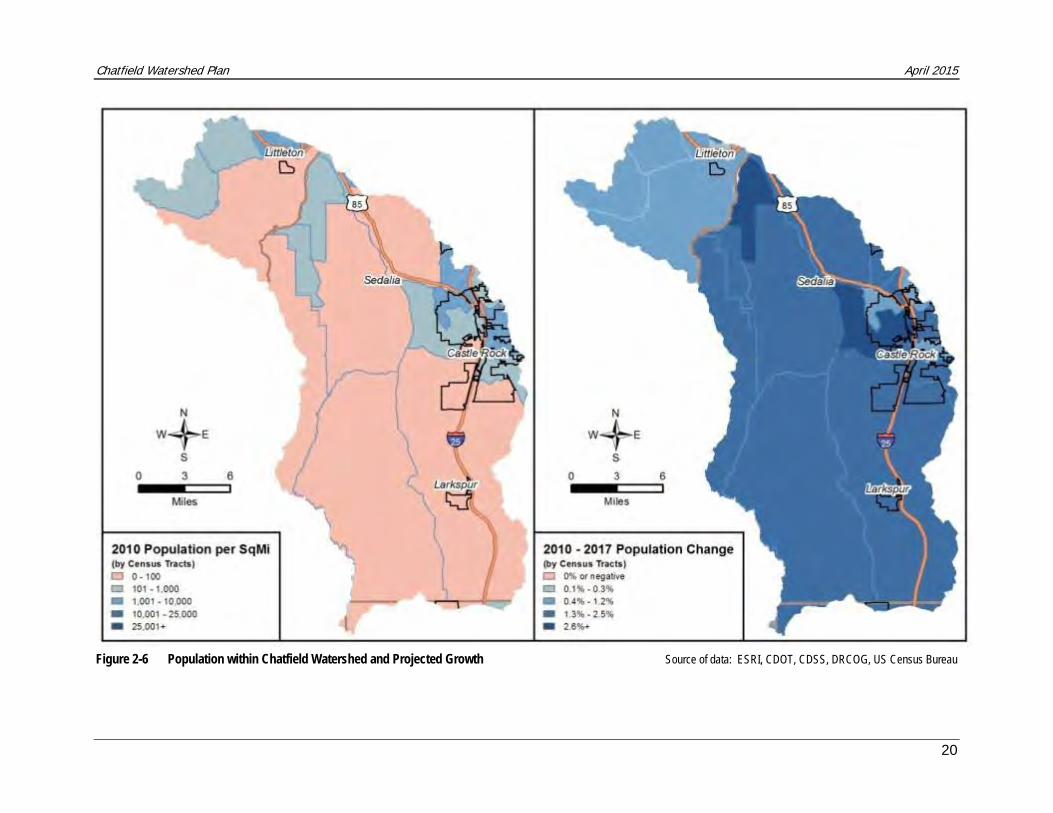
Figure 2-6 Population within Chatfield Watershed and Projected Growth Source of data: ESRI, CDOT, CDSS, DRCOG, US Census Bureau .............................................. 20
Figure 2-7 Current Land Uses in Chatfield Watershed ..................................................................... 22
Figure 2-8 Future Land Use Changes in Chatfield Watershed ......................................................... 23
Figure 2-9 Reallocation is achieved by designating a higher elevation for the existing multi-purpose conservation pool (USACE 2013) ..................................................................... 25
Figure 2-10 Chatfield Reallocation Water Level Fluctuations (USACE 2013) .................................... 26
Figure 4-1 Historic Annual Inflow to Chatfield Reservoir (1986 – 2013) – In 2009 the median Inflow was adopted by CWQCC at 100,860 AF/yr. Source of Data: USGS Station 6709530, CO DWR Station 6708000 and Regulation 73. ................................... 35
Figure 4-2 Monitoring Locations in the Chatfield Watershed ............................................................ 38
Figure 4-3 TP Growing Season Average (July – September) in Chatfield Reservoir (1983-2014) - The TP standard was revised in 2009 to a growing season average of 30 µg/L with an assessment threshold of 35 µg/L. ............................................................... 43
Figure 4-4 Chl-a Growing Season Average (July – September) in Chatfield Reservoir (1983-2014) - The chl-a growing season average of 10 µg/Lµg/L, with an assessment threshold of 11.2 µg/Lµg/L, was adopted as a water quality standard in Chatfield Reservoir in 2009. ........................................................................................................... 43
Figure 4-5 Historic Annual Phosphorus Load to Chatfield Reservoir (1983 – 2014); Phosphorus TMAL is 19,600 lbs/yr. ................................................................................ 44
Figure 4-6 E. coli Bacteria Measured in the Plum Creek Watershed (Apr 2012 – Dec 2014) - No exceedances of the water quality standard (126 MPN/100mL [assessed as a geometric mean]) have been observed. .......................................................................... 46
Figure 4-7 Variability of Total Suspended Solids (TSS) Concentration along Plum Creek Basin (Apr 2012 - Dec 2014) – TSS is an indicator of sediment. The correlation (R value) between TSS and TP is being evaluated to understand the potential nonpoint source impacts from erosion of degraded streambanks in the Plum Creek basin. .................................................................................................................... 47
Figure 4-8 Observed TP concentrations and growing season averages in South Platte R. at Waterton Canyon. ........................................................................................................... 48
Figure 4-9 Comparison of TP Loading in the South Platte River at Waterton Rd. and Plum Creek at Titan Rd. to growing season average of chl-a observed at Chatfield Reservoir – The South Platte Basin has contributed a larger TP load to Chatfield Reservoir 55% of the time. Prior to 2009, chl-a was a goal of 17 µg/L. Since 2009, chl-a is a water quality standard of 10 µg/L, with an assessment threshold of 11.2 µg/L (1 in 5 year allowable exceedance frequency). ........................................... 50
Figure 4-10 Annual Flow and TP Loading in the South Platte River at Waterton Rd. and Plum Creek at Titan Rd. ........................................................................................................... 51
Figure 5-1 Agricultural zoned areas within the Chatfield Watershed ................................................ 53
Chatfield Watershed Plan April 2015
v
Figure 5-2 Locations of Known Septic Systems in Chatfield Watershed .......................................... 55
Figure 5-3 Example of Streambank Erosion along Massey Draw, upstream of Chatfield Reservoir ......................................................................................................................... 57
Figure 5-4 Wildfires Impacting the Chatfield Watershed (Geomac 2013) ........................................ 58
Figure 5-5 MS4 Boundaries in the Chatfield Watershed (December 2013) ..................................... 60
Figure 5-6 Wastewater Treatment Facilities in Chatfield Watershed - ............................................. 62
Figure 5-7 Estimated Land-based TSS Loadings by Land Use and Zoning ..................................... 65
Figure 5-8 Estimated Land-based TN Loadings by Land Use and Zoning ....................................... 65
Figure 5-9 Estimated Land-based TP Loadings by Land Use and Zoning ....................................... 66
Figure 5-10 Estimated Land-based Bacteria Loadings by Land Use and Zoning .............................. 66
Figure 6-1 Predicted Pollutant Impact Areas from Septic Systems (Gorman, 2013) ........................ 70
Figure 6-2 Predicted Streambank Erosion Hot-Spots (Gorman, 2013) ............................................ 73
LIST OF APPENDICES Appendix A – Chatfield Reallocation Adaptive Management Plan (ERO Resources Corporation 2013)
Appendix B - Fish, Wildlife and Recreation Mitigation Plan (Chatfield Reallocation Water Providers 2013)
Appendix C – Summary of Recent Water Quality Data
Appendix D – Summary of Example National and Regional Phosphorus Loading Rates by Land Use
Appendix E – Example Agricultural Efficiencies
Appendix F – Hot Spot Analysis for Potential Pollutant Impacts from Septic Systems and Stream Bank Erosion in the Plum Creek Watershed (Gorman 2013)
Appendix G – Agencies Responsible for Wildfire Management
Appendix H – Framework for Volunteer Water Quality Monitoring
Appendix I – Summary of Current or Ongoing Chatfield Watershed Projects
Chatfield Watershed Plan April 2015
vi
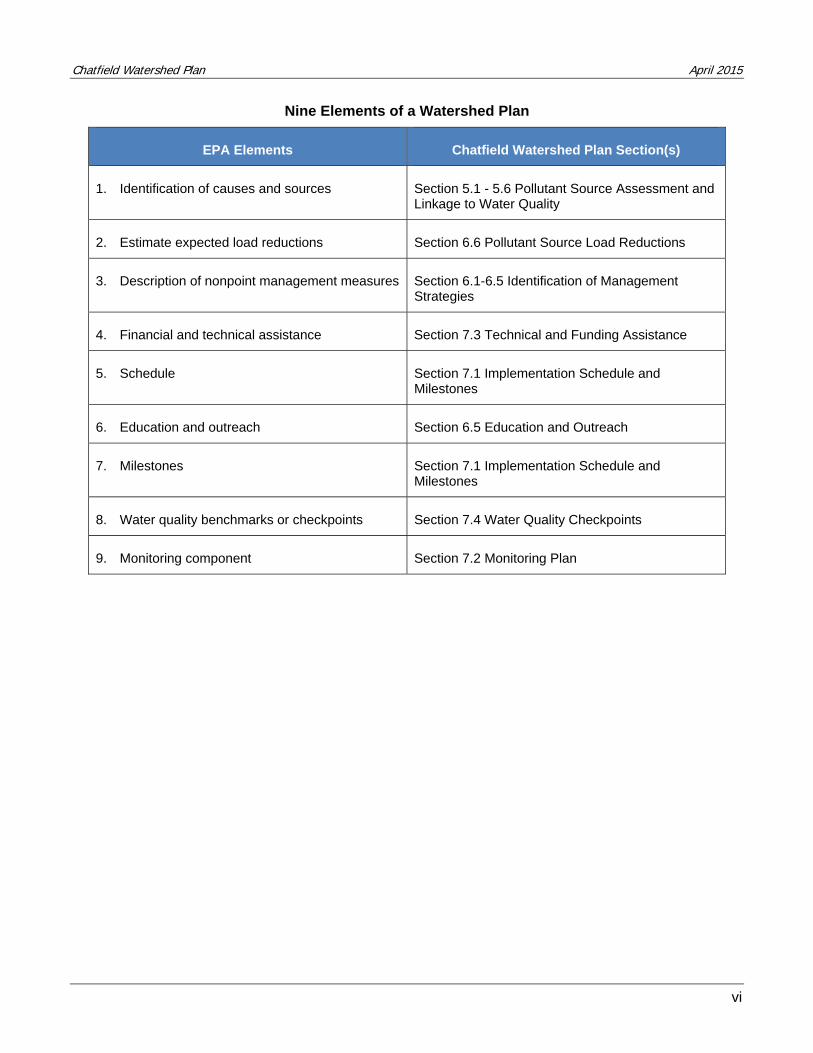
Nine Elements of a Watershed Plan
EPA Elements Chatfield Watershed Plan Section(s)
1. Identification of causes and sources Section 5.1 - 5.6 Pollutant Source Assessment and Linkage to Water Quality
2. Estimate expected load reductions Section 6.6 Pollutant Source Load Reductions
3. Description of nonpoint management measures Section 6.1-6.5 Identification of Management Strategies
4. Financial and technical assistance Section 7.3 Technical and Funding Assistance
5. Schedule Section 7.1 Implementation Schedule and Milestones
6. Education and outreach Section 6.5 Education and Outreach
7. Milestones Section 7.1 Implementation Schedule and Milestones
8. Water quality benchmarks or checkpoints Section 7.4 Water Quality Checkpoints
9. Monitoring component Section 7.2 Monitoring Plan
Chatfield Watershed Plan April 2015
vii
Acronyms
AFO Animal feeding operations
BAER Burned Area Emergency Response
BMP Best Management Practice
CALF Colorado Agricultural Leadership Foundation
CANOE Chatfield Area Network for Outreach and Education
CCBWQA Cherry Creek Basin Water Quality Authority
CCR Code of Colorado Regulations
CDPHE Colorado Department of Public Health and Environment
CDPS Colorado Discharge Permit System
cfs cubic feet per second
Chl-a Chlorophyll-a
CMP Comprehensive Master Plan
CSFS Colorado State Forest Service
CSU Colorado State University
CUSP Coalition of Upper South Platte
CWA Chatfield Watershed Authority
CWCB Colorado Water Conservation Board
CWPP Community Wildfire Protection Plan
CWQCC Colorado Water Quality Control Commission
DO Dissolved oxygen
DRCOG Denver Regional Council of Governments
DWR Division of Water Resources
E. coli Escherichia coli
EFDC Environmental Fluid Dynamics Code
EPA Environmental Protection Agency
EPC East Plum Creek
EQIP Environmental Quality Incentives Program
Chatfield Watershed Plan April 2015
viii
EWP Emergency Watershed Protection
FHAD Flood Hazard Area Delineation
FMP Forest Management Plan
Forest Ag Program Forest Agriculture Program
FR/EIS Feasibility Report / Environmental Impact Statement
FRFTP Front Range Fuels Treatment Partnership
FRWWP Front Range Watershed Wildfire Protection
FSA Farm Service Agency
HFRA Healthy Forest Restoration Act
HSPF Hydrologic Simulation Program - Fortran
IBI Index of Biological Integrity
IR Integrated Report
ISDS Individual Sewage Disposal Systems
lbs pounds
LID Low Impact Development
LSPC Load Simulation Program in C++
m meter
MDP Major Drainageway Plan
MEP Maximum Extent Practicable
mg/L milligram per liter
MS4 Municipal Separate Storm Sewer System
NIFC National Interagency Fire Center
NO2-N nitrite as nitrogen
NO3-N nitrate as nitrogen
NPS Nonpoint source
NRCS Natural Resources Conservation Service
OWTS Onsite Wastewater Treatment System (Septic System)
PCWRA Plum Creek Water Reclamation Authority
Chatfield Watershed Plan April 2015
ix
SPEB South Platte Enhancement Board
SWAT Soil and Water Assessment Tool
TCHD Tri-County Health Department
TKN Total Kjeldahl Nitrogen
TMAL Total Maximum Annual Load
TN Total nitrogen
TOC Total organic carbon
TP Total phosphorus
TSS Total suspended solids
UDFCD Urban Drainage and Flood Control District
µg/L microgram per liter
USACE United States Army Corps of Engineers
USBR United States Bureau of Reclamation
USDA United States Department of Agriculture
USEPA United States Environmental Protection Agency
USFS United States Forest Service
USGS United States Geological Survey
USPWPRP Upper South Platte Watershed Protection and Restoration Project
WAR Watershed Assessment Report
WARMF Watershed Analysis Risk Management Framework
WARSSS Watershed Assessment for River Stability and Sediment Supply
WARSSS Watershed Assessment for River Stability and Sediment Supply
WPC West Plum Creek
WQCD Colorado Water Quality Control Division
WQS Water Quality Standard
WRP Watershed Restoration Plan
WUI Wildland-Urban Interfaces
WWTF Wastewater Treatment Facility
Chatfield Watershed Plan April 2015
1
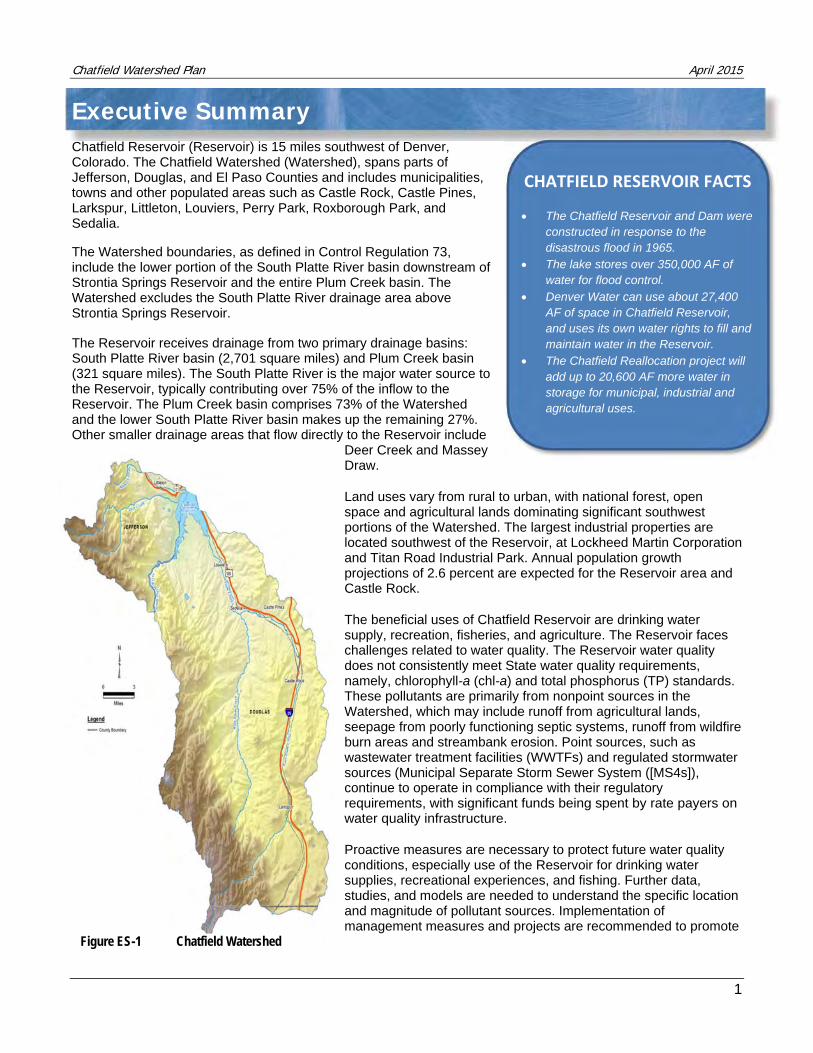
Executive Summary Chatfield Reservoir (Reservoir) is 15 miles southwest of Denver, Colorado. The Chatfield Watershed (Watershed), spans parts of Jefferson, Douglas, and El Paso Counties and includes municipalities, towns and other populated areas such as Castle Rock, Castle Pines, Larkspur, Littleton, Louviers, Perry Park, Roxborough Park, and Sedalia.
The Watershed boundaries, as defined in Control Regulation 73, include the lower portion of the South Platte River basin downstream of Strontia Springs Reservoir and the entire Plum Creek basin. The Watershed excludes the South Platte River drainage area above Strontia Springs Reservoir.
The Reservoir receives drainage from two primary drainage basins: South Platte River basin (2,701 square miles) and Plum Creek basin (321 square miles). The South Platte River is the major water source to the Reservoir, typically contributing over 75% of the inflow to the Reservoir. The Plum Creek basin comprises 73% of the Watershed and the lower South Platte River basin makes up the remaining 27%. Other smaller drainage areas that flow directly to the Reservoir include
Deer Creek and Massey Draw.
Land uses vary from rural to urban, with national forest, open space and agricultural lands dominating significant southwest portions of the Watershed. The largest industrial properties are located southwest of the Reservoir, at Lockheed Martin Corporation and Titan Road Industrial Park. Annual population growth projections of 2.6 percent are expected for the Reservoir area and Castle Rock.
The beneficial uses of Chatfield Reservoir are drinking water supply, recreation, fisheries, and agriculture. The Reservoir faces challenges related to water quality. The Reservoir water quality does not consistently meet State water quality requirements, namely, chlorophyll-a (chl-a) and total phosphorus (TP) standards. These pollutants are primarily from nonpoint sources in the Watershed, which may include runoff from agricultural lands, seepage from poorly functioning septic systems, runoff from wildfire burn areas and streambank erosion. Point sources, such as wastewater treatment facilities (WWTFs) and regulated stormwater sources (Municipal Separate Storm Sewer System ([MS4s]), continue to operate in compliance with their regulatory requirements, with significant funds being spent by rate payers on water quality infrastructure.
Proactive measures are necessary to protect future water quality conditions, especially use of the Reservoir for drinking water supplies, recreational experiences, and fishing. Further data, studies, and models are needed to understand the specific location and magnitude of pollutant sources. Implementation of management measures and projects are recommended to promote
CHATFIELD RESERVOIR FACTS
The Chatfield Reservoir and Dam were constructed in response to the disastrous flood in 1965.
The lake stores over 350,000 AF of water for flood control.
Denver Water can use about 27,400 AF of space in Chatfield Reservoir, and uses its own water rights to fill and maintain water in the Reservoir.
The Chatfield Reallocation project will add up to 20,600 AF more water in storage for municipal, industrial and agricultural uses.
Figure ES-1 Chatfield Watershed
Chatfield Watershed Plan April 2015
2
water quality protection and avoid impairment. However, there is currently no long-term funding source to adequately mitigate water quality concerns.
The Chatfield Watershed Authority (CWA) has developed this Watershed Plan to help prioritize water quality issues and solutions, including potential data collection, studies and projects that could address nonpoint water quality concerns and improve water quality, as funding becomes available. By demonstrating tangible steps that the Watershed community can take to preserve water quality, the CWA intends to engage stakeholders and promote the value of proactive water quality protection.
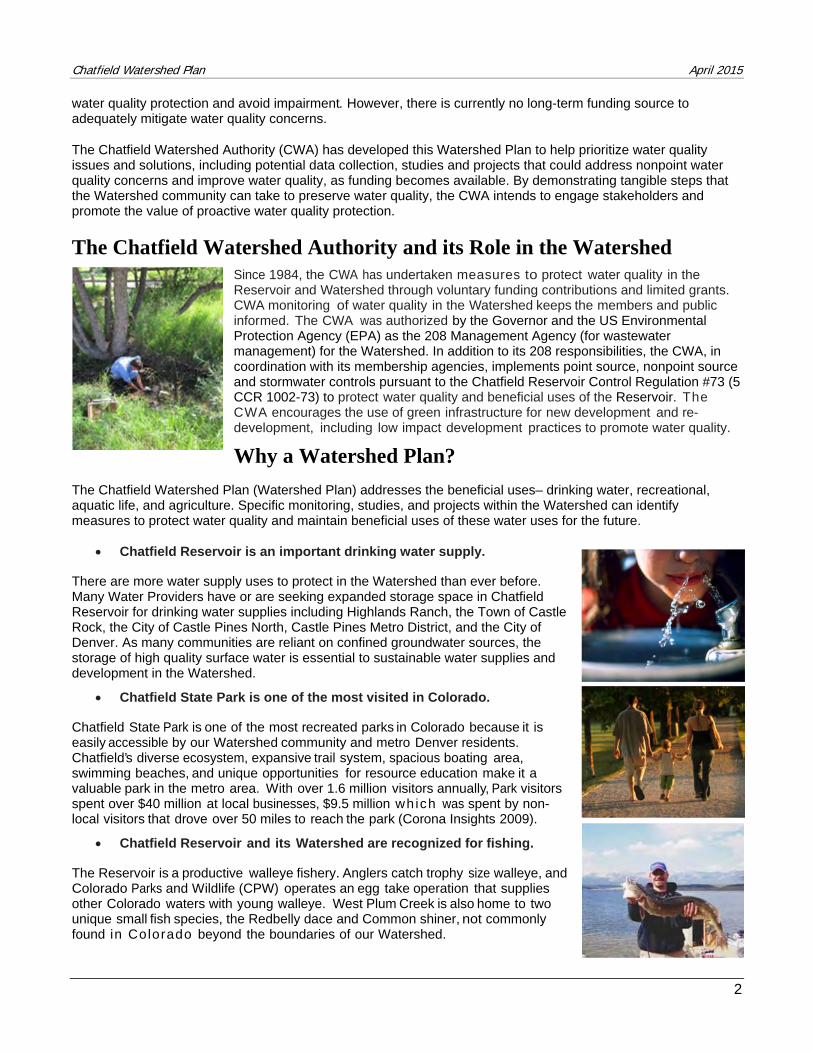
The Chatfield Watershed Authority and its Role in the Watershed Since 1984, the CWA has undertaken measures to protect water quality in the Reservoir and Watershed through voluntary funding contributions and limited grants. CWA monitoring of water quality in the Watershed keeps the members and public informed. The CWA was authorized by the Governor and the US Environmental Protection Agency (EPA) as the 208 Management Agency (for wastewater management) for the Watershed. In addition to its 208 responsibilities, the CWA, in coordination with its membership agencies, implements point source, nonpoint source and stormwater controls pursuant to the Chatfield Reservoir Control Regulation #73 (5 CCR 1002-73) to protect water quality and beneficial uses of the Reservoir. The CWA encourages the use of green infrastructure for new development and re-development, including low impact development practices to promote water quality.
Why a Watershed Plan?
The Chatfield Watershed Plan (Watershed Plan) addresses the beneficial uses– drinking water, recreational, aquatic life, and agriculture. Specific monitoring, studies, and projects within the Watershed can identify measures to protect water quality and maintain beneficial uses of these water uses for the future.
Chatfield Reservoir is an important drinking water supply.
There are more water supply uses to protect in the Watershed than ever before. Many Water Providers have or are seeking expanded storage space in Chatfield Reservoir for drinking water supplies including Highlands Ranch, the Town of Castle Rock, the City of Castle Pines North, Castle Pines Metro District, and the City of Denver. As many communities are reliant on confined groundwater sources, the storage of high quality surface water is essential to sustainable water supplies and development in the Watershed.
Chatfield State Park is one of the most visited in Colorado.
Chatfield State Park is one of the most recreated parks in Colorado because it is easily accessible by our Watershed community and metro Denver residents. Chatfield’s diverse ecosystem, expansive trail system, spacious boating area, swimming beaches, and unique opportunities for resource education make it a valuable park in the metro area. With over 1.6 million visitors annually, Park visitors spent over $40 million at local businesses, $9.5 million which was spent by non-local visitors that drove over 50 miles to reach the park (Corona Insights 2009).
Chatfield Reservoir and its Watershed are recognized for fishing.
The Reservoir is a productive walleye fishery. Anglers catch trophy size walleye, and Colorado Parks and Wildlife (CPW) operates an egg take operation that supplies other Colorado waters with young walleye. West Plum Creek is also home to two unique small fish species, the Redbelly dace and Common shiner, not commonly found in Colorado beyond the boundaries of our Watershed.
Chatfield Watershed Plan April 2015
3
What are the Issues?
The Reservoir water quality does not consistently meet state regulations.
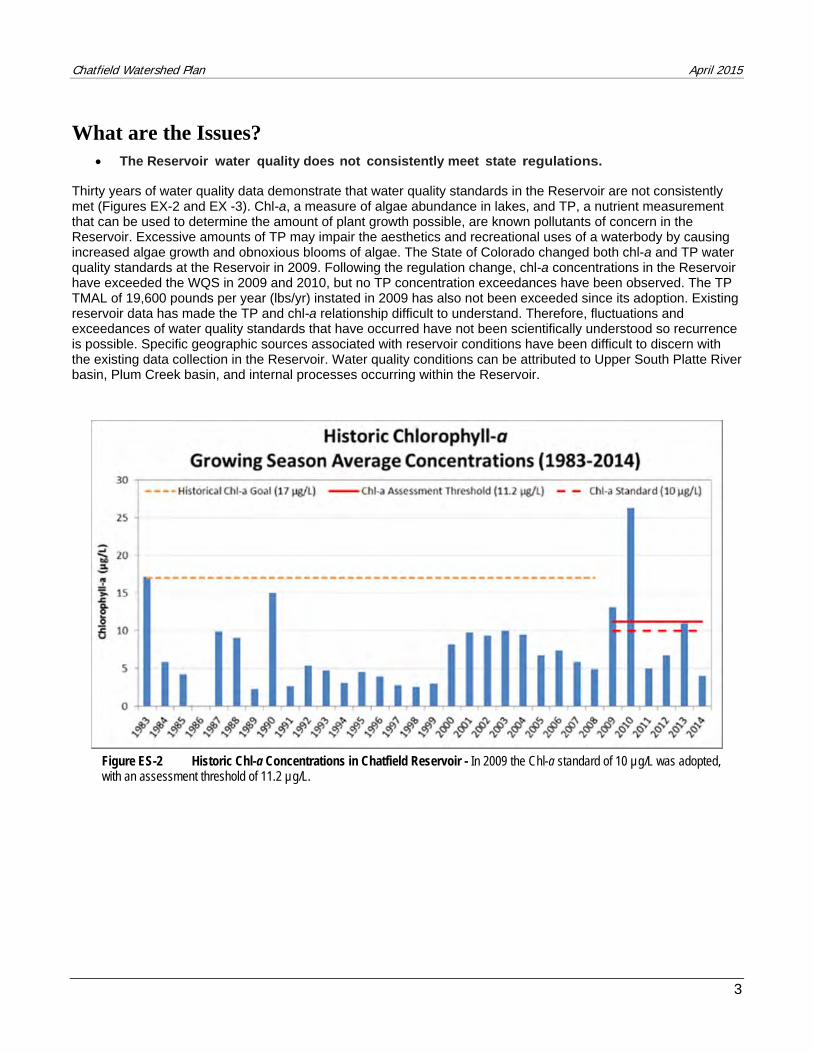
Thirty years of water quality data demonstrate that water quality standards in the Reservoir are not consistently met (Figures EX-2 and EX -3). Chl-a, a measure of algae abundance in lakes, and TP, a nutrient measurement that can be used to determine the amount of plant growth possible, are known pollutants of concern in the Reservoir. Excessive amounts of TP may impair the aesthetics and recreational uses of a waterbody by causing increased algae growth and obnoxious blooms of algae. The State of Colorado changed both chl-a and TP water quality standards at the Reservoir in 2009. Following the regulation change, chl-a concentrations in the Reservoir have exceeded the WQS in 2009 and 2010, but no TP concentration exceedances have been observed. The TP TMAL of 19,600 pounds per year (lbs/yr) instated in 2009 has also not been exceeded since its adoption. Existing reservoir data has made the TP and chl-a relationship difficult to understand. Therefore, fluctuations and exceedances of water quality standards that have occurred have not been scientifically understood so recurrence is possible. Specific geographic sources associated with reservoir conditions have been difficult to discern with the existing data collection in the Reservoir. Water quality conditions can be attributed to Upper South Platte River basin, Plum Creek basin, and internal processes occurring within the Reservoir.
Figure ES-2 Historic Chl-a Concentrations in Chatfield Reservoir - In 2009 the Chl-a standard of 10 µg/L was adopted, with an assessment threshold of 11.2 µg/L.
Chatfield Watershed Plan April 2015
4
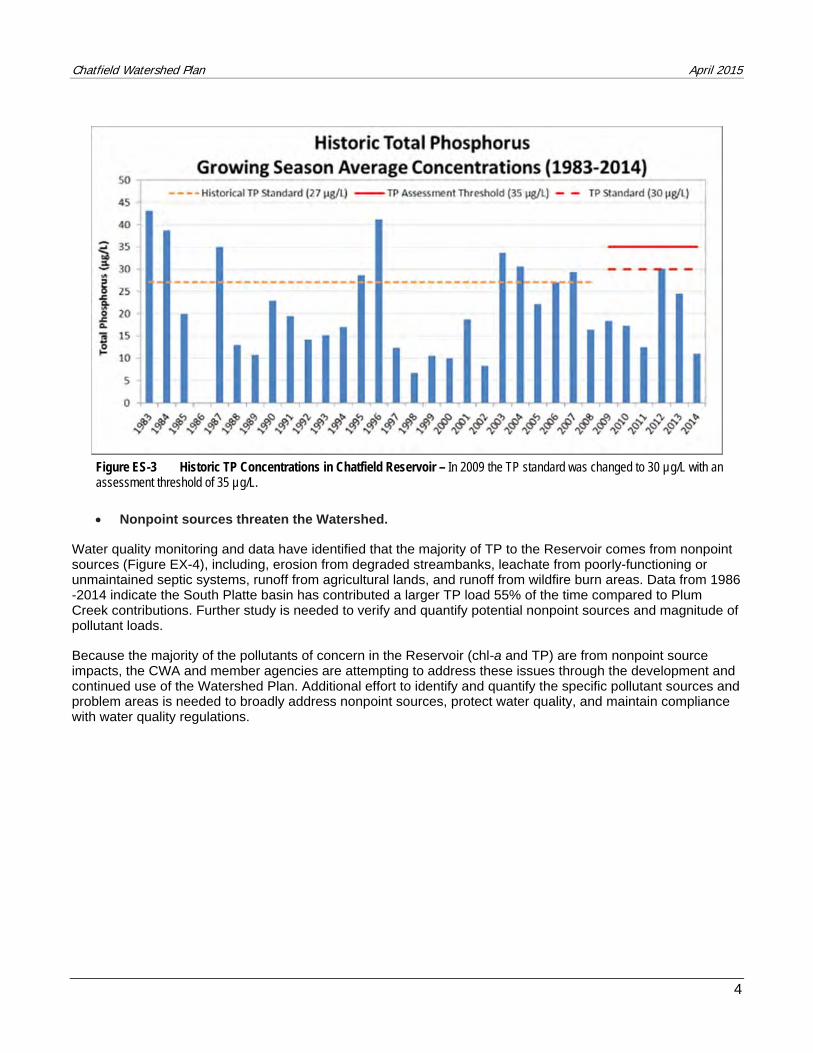
Figure ES-3 Historic TP Concentrations in Chatfield Reservoir – In 2009 the TP standard was changed to 30 µg/L with an assessment threshold of 35 µg/L.
Nonpoint sources threaten the Watershed.
Water quality monitoring and data have identified that the majority of TP to the Reservoir comes from nonpoint sources (Figure EX-4), including, erosion from degraded streambanks, leachate from poorly-functioning or unmaintained septic systems, runoff from agricultural lands, and runoff from wildfire burn areas. Data from 1986 -2014 indicate the South Platte basin has contributed a larger TP load 55% of the time compared to Plum Creek contributions. Further study is needed to verify and quantify potential nonpoint sources and magnitude of pollutant loads.
Because the majority of the pollutants of concern in the Reservoir (chl-a and TP) are from nonpoint source impacts, the CWA and member agencies are attempting to address these issues through the development and continued use of the Watershed Plan. Additional effort to identify and quantify the specific pollutant sources and problem areas is needed to broadly address nonpoint sources, protect water quality, and maintain compliance with water quality regulations.
Chatfield Watershed Plan April 2015
5
Current nonpoint funding sources are limited.
• The CWA members, who voluntarily contribute funds to CWA, support our water quality monitoring and annual reporting to the state.
• Federal, state, and local grants augment the limited funding for water quality projects; however, these grants are limited and exceptionally competitive.
• Local land use agencies implement their stormwater criteria and have completed projects that address stormwater runoff, which have been shown to maintain and even improve water quality in some instances. However, there is still a need to address nonpoint source water quality issues with a more holistic approach.
• The Chatfield Reallocation project will require mitigation measures to offset impacts from the additional water storage in the Reservoir. Partnerships with Chatfield Reallocation Water Providers on mitigation projects will allow for enhanced water quality protections of Plum Creek; however, additional water quality projects are needed to address other broad-based nonpoint source impacts in the Watershed.
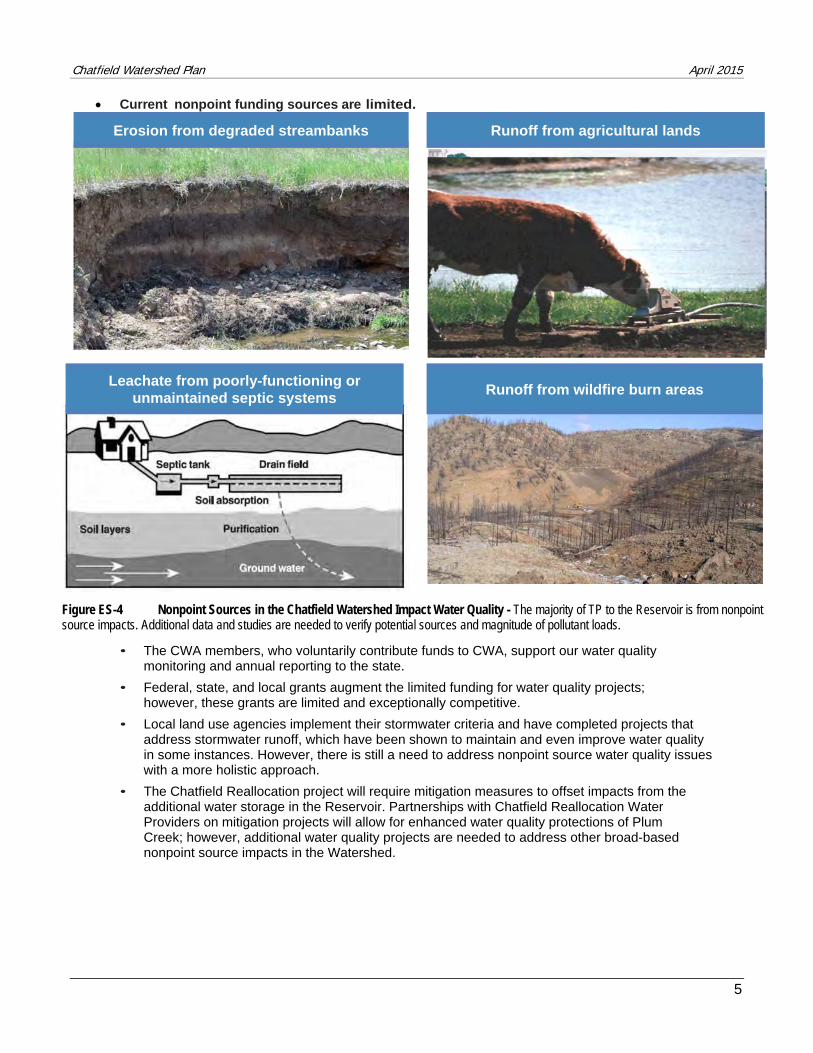
Erosion from degraded streambanks Runoff from agricultural lands
Leachate from poorly-functioning or unmaintained septic systems
Runoff from wildfire burn areas
Figure ES-4 Nonpoint Sources in the Chatfield Watershed Impact Water Quality - The majority of TP to the Reservoir is from nonpoint source impacts. Additional data and studies are needed to verify potential sources and magnitude of pollutant loads.
Chatfield Watershed Plan April 2015
6
What must be accomplished?
Proposed Watershed Plan Implementation Program identifies next steps.
As part of the Watershed Plan, an implementation program was developed to prioritize potential activities that meet Plan goals. The Implementation Program Strategy includes these components:
1. Conducting monitoring, modeling, and studies to support project feasibility,
2. Evaluating cost/benefit of each proposed Watershed activity,
3. Implementing projects that complement the Watershed Plan Mission and Vision, and
4. Ongoing outreach to stakeholders and the entire watershed community to increase awareness of nonpoint source issues.
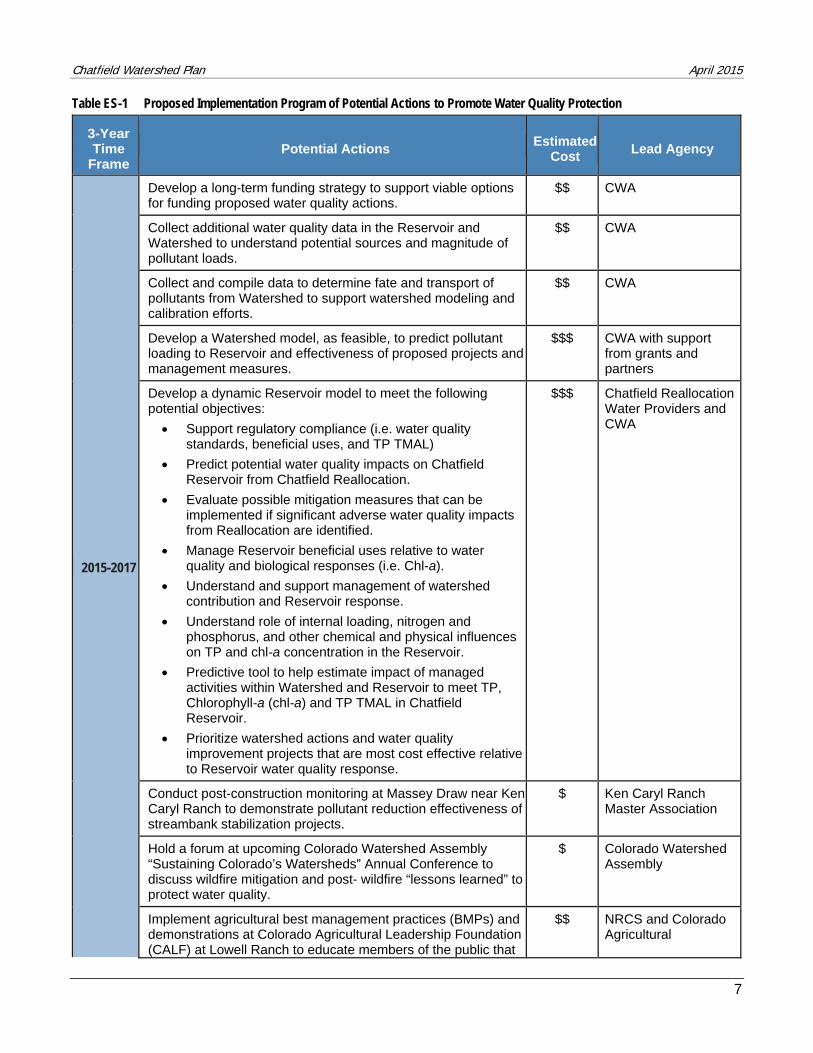
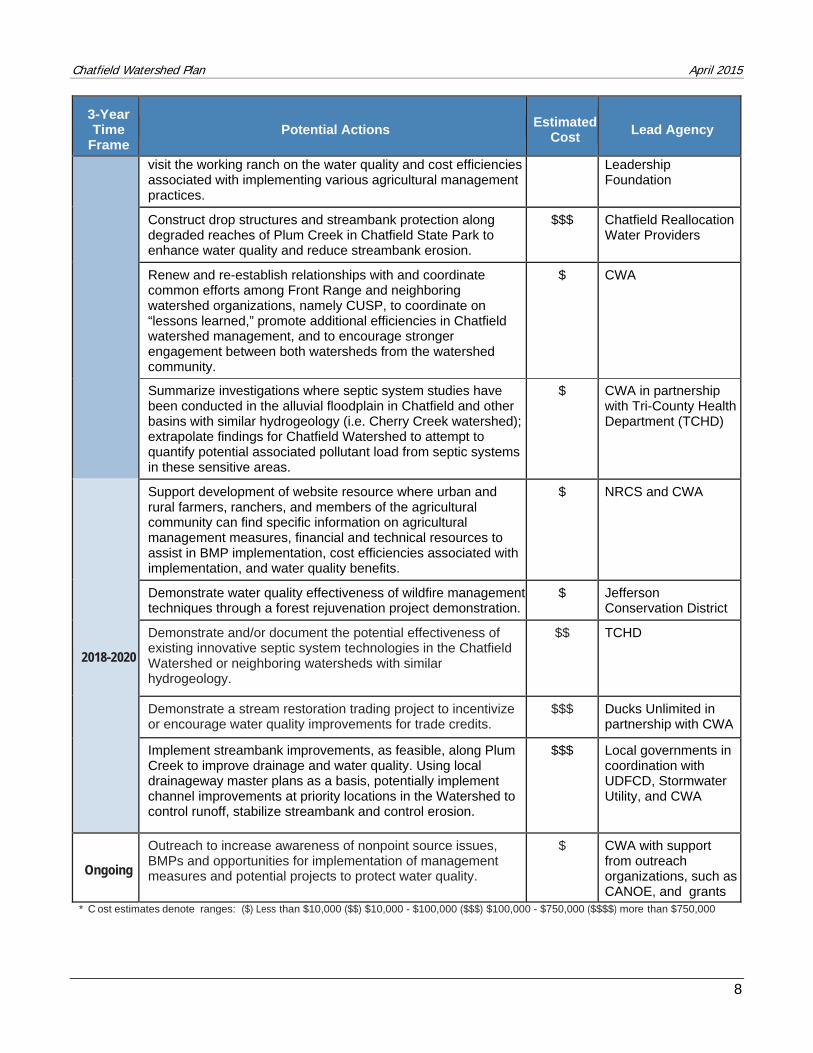
Specific actions were developed and prioritized through collaborative stakeholder efforts as presented in Table ES-1. Recognizing that activities outlined in this Plan are intended for implementation within the Watershed, collaboration with the Coalition of the Upper South Platte (CUSP) is a crucial strategy to address nonpoint sources and water quality issues in drainages above Strontia Springs Reservoir that also ultimately impact the Reservoir.
The potential actions and projects in Table ES-1 are scheduled in 3-year timeframes since their implementation is subject to funding, as well as political and community support. The initial 3-year implementation plan reflects more immediate goals based on current funding, partnerships, and Plan objectives. Presently, improved monitoring and initial modeling efforts are paramount priorities of the Plan. Other activities identified in the Plan and listed in the proposed implementation program may occur concurrently if funding and opportunities arise; however, widespread implementation of proposed strategies should be contingent upon further data collection and modeling results to quantify loads and sources, ensuring that resources are spent on the highest priorities. The Plan is intended to be a dynamic and living document that will be reviewed and revisited periodically to update priorities and projects as data are received and as conditions change within the Watershed.
Watershed Plan MISSION:
Protect waters of Reservoir and Chatfield Watershed to water supplies, aquatic life,
Watershed Plan VISION:
Through collaborative efforts, activities to maintain and measurably improve water quality in Chatfield Reservoir and the watershed for designated uses.
Chatfield Watershed Plan April 2015
7
Table ES-1 Proposed Implementation Program of Potential Actions to Promote Water Quality Protection
3-Year Time
Frame Potential Actions
Estimated Cost
Lead Agency
2015-2017
Develop a long-term funding strategy to support viable options for funding proposed water quality actions.
$$ CWA
Collect additional water quality data in the Reservoir and Watershed to understand potential sources and magnitude of pollutant loads.
$$ CWA
Collect and compile data to determine fate and transport of pollutants from Watershed to support watershed modeling and calibration efforts.
$$ CWA
Develop a Watershed model, as feasible, to predict pollutant loading to Reservoir and effectiveness of proposed projects and management measures.
$$$ CWA with support from grants and partners
Develop a dynamic Reservoir model to meet the following potential objectives:
Support regulatory compliance (i.e. water quality standards, beneficial uses, and TP TMAL)
Predict potential water quality impacts on Chatfield Reservoir from Chatfield Reallocation.
Evaluate possible mitigation measures that can be implemented if significant adverse water quality impacts from Reallocation are identified.
Manage Reservoir beneficial uses relative to water quality and biological responses (i.e. Chl-a).
Understand and support management of watershed contribution and Reservoir response.
Understand role of internal loading, nitrogen and phosphorus, and other chemical and physical influences on TP and chl-a concentration in the Reservoir.
Predictive tool to help estimate impact of managed activities within Watershed and Reservoir to meet TP, Chlorophyll-a (chl-a) and TP TMAL in Chatfield Reservoir.
Prioritize watershed actions and water quality improvement projects that are most cost effective relative to Reservoir water quality response.
$$$ Chatfield Reallocation Water Providers and CWA
Conduct post-construction monitoring at Massey Draw near Ken Caryl Ranch to demonstrate pollutant reduction effectiveness of streambank stabilization projects.
$ Ken Caryl Ranch Master Association
Hold a forum at upcoming Colorado Watershed Assembly “Sustaining Colorado’s Watersheds” Annual Conference to discuss wildfire mitigation and post- wildfire “lessons learned” to protect water quality.
$ Colorado Watershed Assembly
Implement agricultural best management practices (BMPs) and demonstrations at Colorado Agricultural Leadership Foundation (CALF) at Lowell Ranch to educate members of the public that
$$ NRCS and Colorado Agricultural
Chatfield Watershed Plan April 2015
8
3-Year Time
Frame Potential Actions
Estimated Cost
Lead Agency
visit the working ranch on the water quality and cost efficiencies associated with implementing various agricultural management practices.
Leadership Foundation
Construct drop structures and streambank protection along degraded reaches of Plum Creek in Chatfield State Park to enhance water quality and reduce streambank erosion.
$$$ Chatfield Reallocation Water Providers
Renew and re-establish relationships with and coordinate common efforts among Front Range and neighboring watershed organizations, namely CUSP, to coordinate on “lessons learned,” promote additional efficiencies in Chatfield watershed management, and to encourage stronger engagement between both watersheds from the watershed community.
$ CWA
Summarize investigations where septic system studies have been conducted in the alluvial floodplain in Chatfield and other basins with similar hydrogeology (i.e. Cherry Creek watershed); extrapolate findings for Chatfield Watershed to attempt to quantify potential associated pollutant load from septic systems in these sensitive areas.
$ CWA in partnership with Tri-County Health Department (TCHD)
2018-2020
Support development of website resource where urban and rural farmers, ranchers, and members of the agricultural community can find specific information on agricultural management measures, financial and technical resources to assist in BMP implementation, cost efficiencies associated with implementation, and water quality benefits.
$ NRCS and CWA
Demonstrate water quality effectiveness of wildfire management techniques through a forest rejuvenation project demonstration.
$ Jefferson Conservation District
Demonstrate and/or document the potential effectiveness of existing innovative septic system technologies in the Chatfield Watershed or neighboring watersheds with similar hydrogeology.
$$ TCHD
Demonstrate a stream restoration trading project to incentivize or encourage water quality improvements for trade credits.
$$$ Ducks Unlimited in partnership with CWA
Implement streambank improvements, as feasible, along Plum Creek to improve drainage and water quality. Using local drainageway master plans as a basis, potentially implement channel improvements at priority locations in the Watershed to control runoff, stabilize streambank and control erosion.
$$$ Local governments in coordination with UDFCD, Stormwater Utility, and CWA
Ongoing
Outreach to increase awareness of nonpoint source issues, BMPs and opportunities for implementation of management measures and potential projects to protect water quality.
$ CWA with support from outreach organizations, such as CANOE, and grants
* C ost estimates denote ranges: ($) Less than $10,000 ($$) $10,000 - $100,000 ($$$) $100,000 - $750,000 ($$$$) more than $750,000
Chatfield Watershed Plan April 2015
9
1. Watershed Goals and Objectives Watershed conditions ultimately affect the Reservoir which serves as a flood control, water supply, fishery and recreational waterbody. Total phosphorus (TP) and chlorophyll-a (chl-a) are known pollutants of concern in the Reservoir. In the Watershed, water quality issues related to nutrients, sedimentation, and bacteria have been attributed to nonpoint sources including:
Stormwater runoff, Erosion from degraded stream banks, Runoff from wildfire burn areas, Runoff from agricultural lands, and Leachate from poorly functioning or unmaintained septic systems.
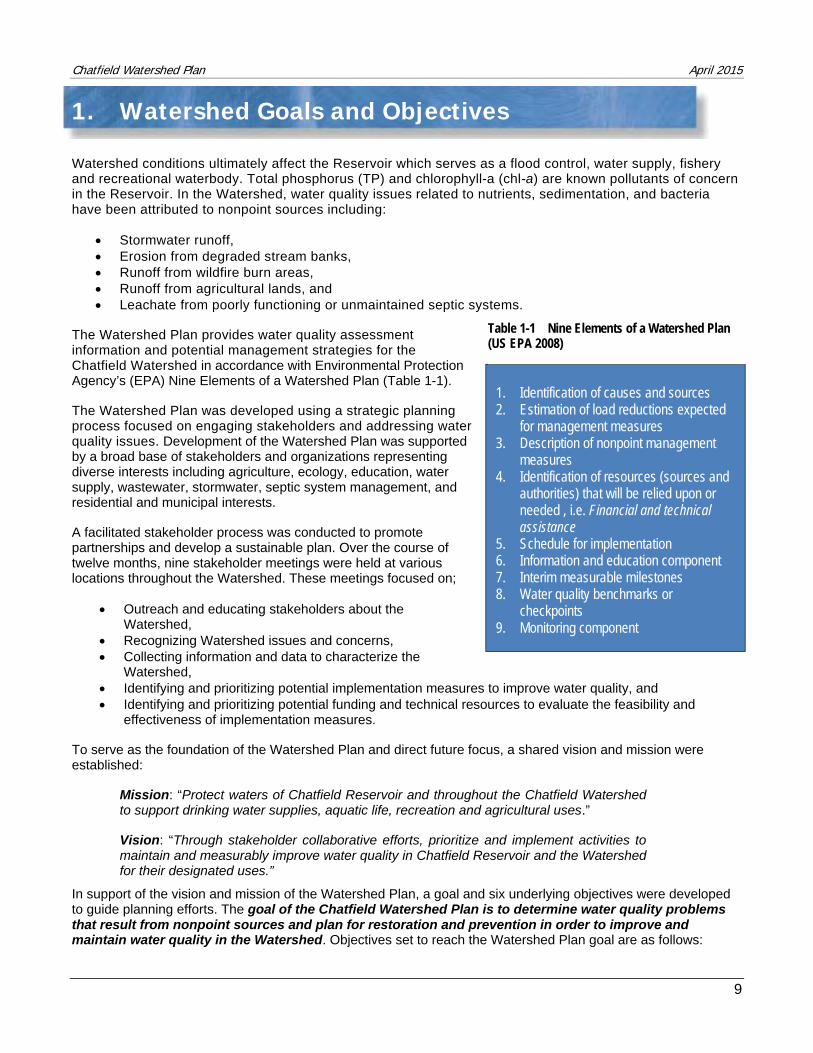
The Watershed Plan provides water quality assessment information and potential management strategies for the Chatfield Watershed in accordance with Environmental Protection Agency’s (EPA) Nine Elements of a Watershed Plan (Table 1-1).
The Watershed Plan was developed using a strategic planning process focused on engaging stakeholders and addressing water quality issues. Development of the Watershed Plan was supported by a broad base of stakeholders and organizations representing diverse interests including agriculture, ecology, education, water supply, wastewater, stormwater, septic system management, and residential and municipal interests.
A facilitated stakeholder process was conducted to promote partnerships and develop a sustainable plan. Over the course of twelve months, nine stakeholder meetings were held at various locations throughout the Watershed. These meetings focused on;
Outreach and educating stakeholders about the Watershed,
Recognizing Watershed issues and concerns, Collecting information and data to characterize the
Watershed, Identifying and prioritizing potential implementation measures to improve water quality, and Identifying and prioritizing potential funding and technical resources to evaluate the feasibility and
effectiveness of implementation measures.
To serve as the foundation of the Watershed Plan and direct future focus, a shared vision and mission were established:
Mission: “Protect waters of Chatfield Reservoir and throughout the Chatfield Watershed to support drinking water supplies, aquatic life, recreation and agricultural uses.”
Vision: “Through stakeholder collaborative efforts, prioritize and implement activities to maintain and measurably improve water quality in Chatfield Reservoir and the Watershed for their designated uses.”
In support of the vision and mission of the Watershed Plan, a goal and six underlying objectives were developed to guide planning efforts. The goal of the Chatfield Watershed Plan is to determine water quality problems that result from nonpoint sources and plan for restoration and prevention in order to improve and maintain water quality in the Watershed. Objectives set to reach the Watershed Plan goal are as follows:
1. Identification of causes and sources 2. Estimation of load reductions expected
for management measures 3. Description of nonpoint management
measures 4. Identification of resources (sources and
authorities) that will be relied upon or needed , i.e. Financial and technical assistance
5. Schedule for implementation 6. Information and education component 7. Interim measurable milestones 8. Water quality benchmarks or
checkpoints 9. Monitoring component
Table 1-1 Nine Elements of a Watershed Plan (US EPA 2008)

Chatfield Watershed Plan April 2015
10
1. Build partnerships, 2. Characterize the Watershed, 3. Determine and understand the water quality issues within the Watershed, 4. Identify potential new management strategies or opportunities to enhance existing measures to
reduce nonpoint source loads, 5. Develop an implementation program that encompasses interim milestones, education and outreach,
and evaluation and monitoring to guide ongoing and future improvements, and. 6. Identify funding sources to support monitoring, modeling, and implementation of water quality
projects.
Chatfield Watershed Plan April 2015
11
2. Watershed Description
The Chatfield Reservoir is 15 miles southwest of Denver, Colorado, and its Watershed encompasses 483 square miles. The Watershed, shown in Figure 2-1, spans parts of Jefferson, Douglas, and El Paso Counties and includes municipalities, and populated areas such as Castle Rock, Castle Pines, Larkspur, Littleton, Louviers, Perry Park, Roxborough Park, and Sedalia. Approximately 24 miles of Interstate 25 and 14 miles of US Highway 85 run through the Watershed.
Chatfield Watershed Plan April 2015
12
Figure 2-1 Location of Chatfield Watershed Source of data: ESRI, CDOT, CDSS, DRCOG
Chatfield Watershed Plan April 2015
13
2.1 Chatfield Watershed Hydrography and Topography
The Watershed headwaters start southwest of Chatfield Reservoir in the front range of the Rocky Mountains and generally flow north or northeast. The Watershed is comprised of two major drainage systems: Plum Creek and South Platte River. Chatfield Reservoir is located at the outlet of the Watershed, which is the confluence of these two drainages.
The Chatfield Reservoir receives drainage from the South Platte River basin (2,701 mi2) and Plum Creek basin (321 mi2) (Figure 2-2). The South Platte River is the major water source to Chatfield Reservoir, typically contributing over 75% of the inflow to the Reservoir. The Watershed boundaries, however, include the lower portion of the South Platte River basin downstream of Strontia Springs Reservoir (118.5 mi2) and the entire Plum Creek basin. The South Platte River drainage upstream of Strontia Springs Reservoir is not included within the Watershed boundaries (consistent with Control Regulation 73). Loads represented in the Chatfield Reservoir reflect water quality received from the complete drainages (i.e., all of the South Platte River and Plum Creek basins) as well as internal loading within the reservoir.
Chatfield Watershed Plan April 2015
14
Figure 2-2 Chatfield Watershed Drainage Areas Source of data: ESRI, CDOT, CDSS, DRCOG
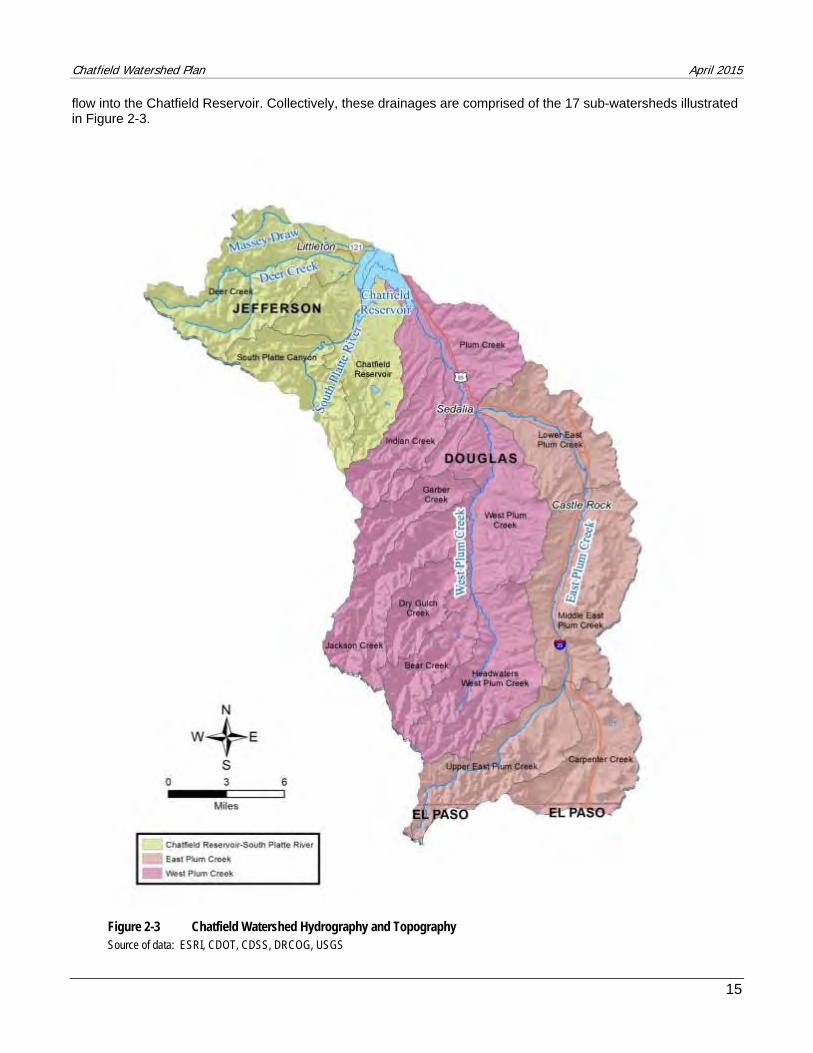
Within the Watershed boundaries, the largest drainage area is Plum Creek, which makes up the eastern portion of the Watershed and, when considering both East and West Plum Creek, is approximately 73% of the drainage area, as shown in Figure 2-3. The Watershed also includes the drainage area of the South Platte River downstream of Strontia Springs Reservoir. Deer Creek and Massey Draw are additional drainage systems that
Chatfield Watershed Plan April 2015
15
flow into the Chatfield Reservoir. Collectively, these drainages are comprised of the 17 sub-watersheds illustrated in Figure 2-3.
Figure 2-3 Chatfield Watershed Hydrography and Topography Source of data: ESRI, CDOT, CDSS, DRCOG, USGS
Chatfield Watershed Plan April 2015
16
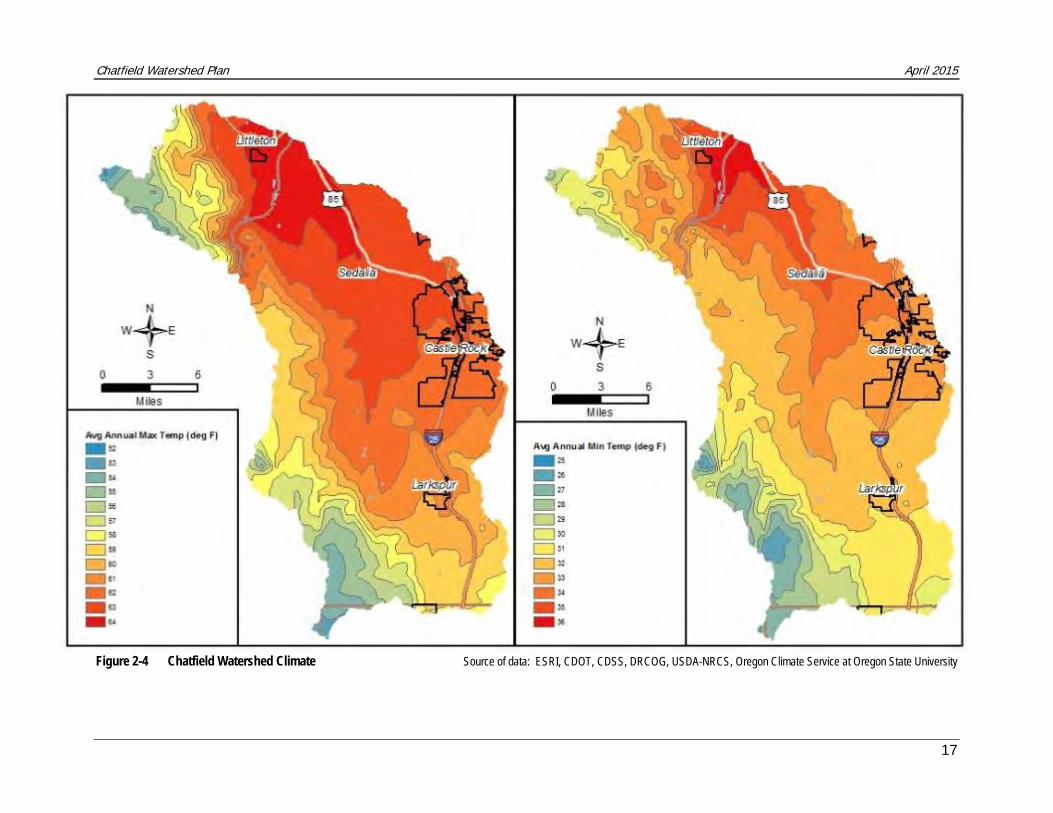
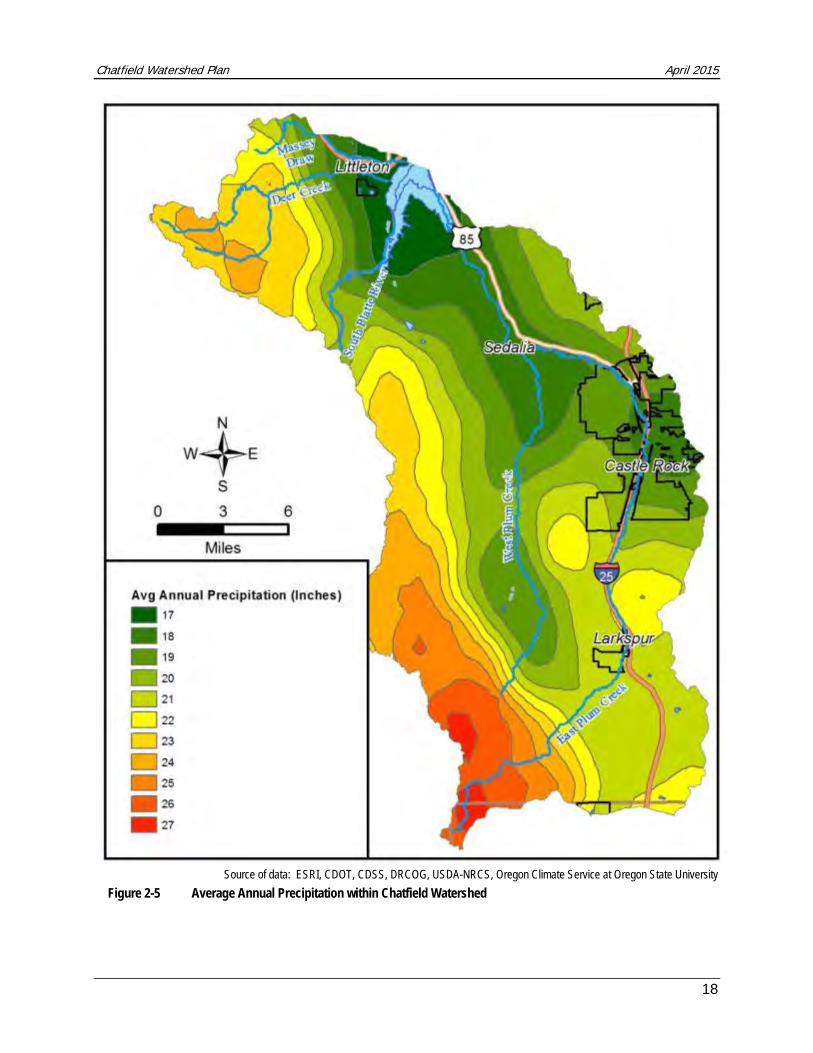
2.2 Chatfield Watershed Climate
In the Chatfield Watershed, areas of higher elevation are located in the western and southwestern portions of the Watershed, where elevations reach 9,700 feet. Topography influences climate and precipitation. As shown in Figure 2-4 and Figure 2-5, the areas of higher elevation typically have the lowest annual temperatures and highest annual precipitation in the Watershed.
Chatfield Watershed Plan April 2015
17
Figure 2-4 Chatfield Watershed Climate Source of data: ESRI, CDOT, CDSS, DRCOG, USDA-NRCS, Oregon Climate Service at Oregon State University
Chatfield Watershed Plan April 2015
18
Source of data: ESRI, CDOT, CDSS, DRCOG, USDA-NRCS, Oregon Climate Service at Oregon State University
Figure 2-5 Average Annual Precipitation within Chatfield Watershed

Chatfield Watershed Plan April 2015
19
2.3 Chatfield Watershed Population
Population within the Watershed varies along with the diverse landscape. As shown in Figure 2-6, population density is highest within and around the Town of Castle Rock (US Census 2010); however, the majority of the Watershed has a lower population density as shown in the unincorporated western and southern areas of the Watershed. The highest population growth projection of 2.6 percent is expected south of Chatfield Reservoir, and in parts of Castle Rock (Figure 2-6) (US Census 2010).
Chatfield Watershed Plan April 2015
20
Figure 2-6 Population within Chatfield Watershed and Projected Growth Source of data: ESRI, CDOT, CDSS, DRCOG, US Census Bureau
Chatfield Watershed Plan April 2015
21
2.4 Current and Future Land Use
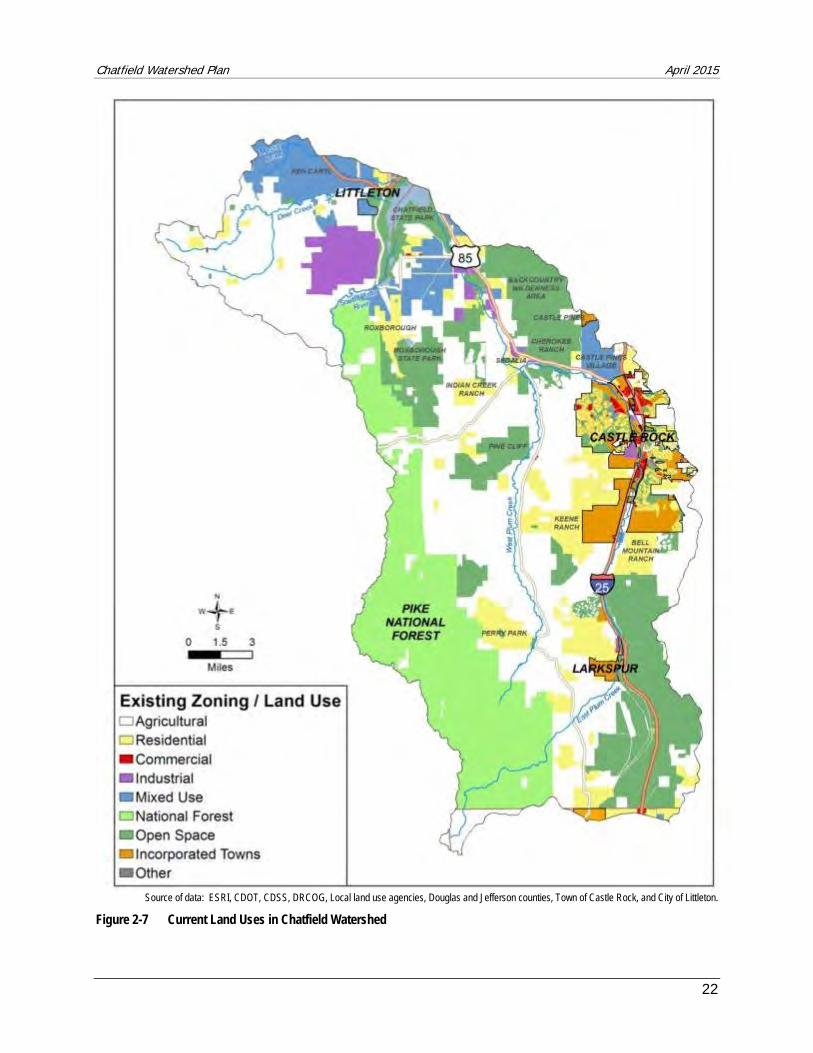
The landscape within the Watershed varies from rural to urban land uses. As shown Figure 2-7, national forest, open space and agricultural lands dominate significant portions of the Watershed. The largest industrial lands are northwest of the South Platte River, where Lockheed Martin Corporation is located and just southeast of Chatfield Reservoir in Titan Road Industrial Park, located along US Highway 85.
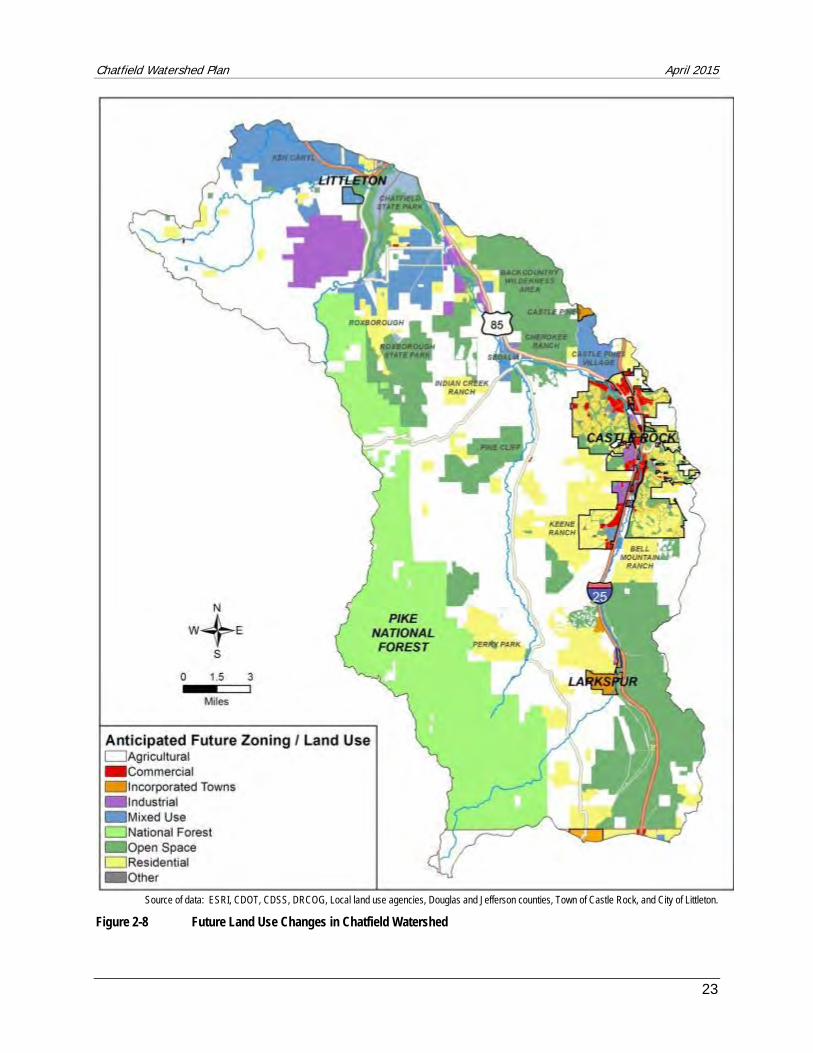
Land use changes are often a response to population growth. To protect rural lands and accommodate projected population growth and patterns of development, Jefferson County and Douglas County have adopted policies that promote sustained growth while protecting natural amenities within their jurisdictions. As shown in Figure 2-8, future land use changes within Douglas County are anticipated to occur in Sedalia as present residential and industrial areas become more intertwined and representative of mixed use. Compared to the present land use map, southern portions of Town of Castle Rock are anticipated to be designated as residential, commercial, mixed use, and open space areas (Town of Castle Rock land use GIS data). The Chatfield Urban Area (south of the Chatfield Reservoir) and the Roxborough Separated Urban Area (east of the South Platte River) are also shown.
The most significant change in future land use can be seen within the Town of Castle Rock where residential, commercial, and industrial land uses are anticipated to increase between 40-50 percent; and designated open space is expected to increase 40 percent. These percent increases are projected in currently undesignated areas within the Town of Castle Rock boundaries. Similar to Douglas County’s policies, the Town of Castle Rock aims to develop new urban areas while preserving open spaces and non-urban areas.
Chatfield Watershed Plan April 2015
22
Source of data: ESRI, CDOT, CDSS, DRCOG, Local land use agencies, Douglas and Jefferson counties, Town of Castle Rock, and City of Littleton.
Figure 2-7 Current Land Uses in Chatfield Watershed
Chatfield Watershed Plan April 2015
23
Source of data: ESRI, CDOT, CDSS, DRCOG, Local land use agencies, Douglas and Jefferson counties, Town of Castle Rock, and City of Littleton.
Figure 2-8 Future Land Use Changes in Chatfield Watershed
Chatfield Watershed Plan April 2015
24
2.5 Chatfield Reservoir Storage Reallocation
In August 2013, a Feasibility Report and Environmental Impact Statement (FR/EIS) was developed by the U.S. Army Corp of Engineers (USACE) in cooperation with the Colorado Water Conservation Board (CWCB) for the proposed reallocation of water storage in the Chatfield Reservoir (USACE 2013). The release of the Final FR/EIS was followed by a 30-day public comment period and a Record of Decision on the FR/EIS is anticipated in 2014.
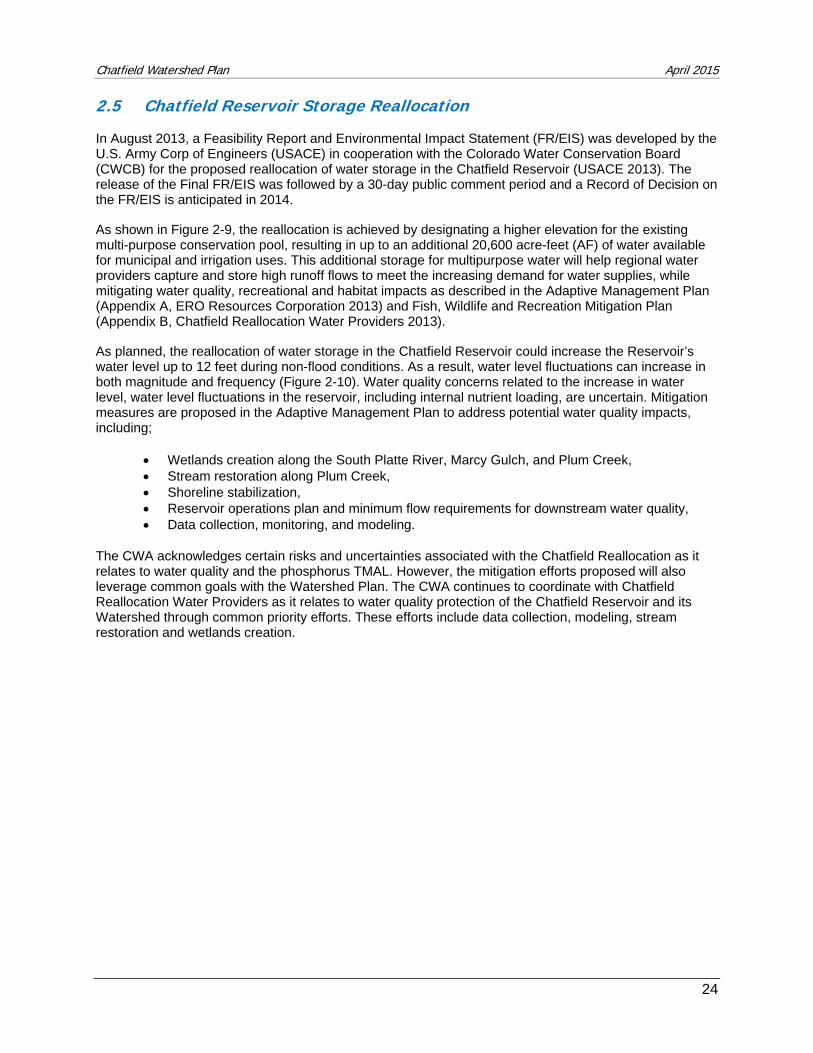
As shown in Figure 2-9, the reallocation is achieved by designating a higher elevation for the existing multi-purpose conservation pool, resulting in up to an additional 20,600 acre-feet (AF) of water available for municipal and irrigation uses. This additional storage for multipurpose water will help regional water providers capture and store high runoff flows to meet the increasing demand for water supplies, while mitigating water quality, recreational and habitat impacts as described in the Adaptive Management Plan (Appendix A, ERO Resources Corporation 2013) and Fish, Wildlife and Recreation Mitigation Plan (Appendix B, Chatfield Reallocation Water Providers 2013).
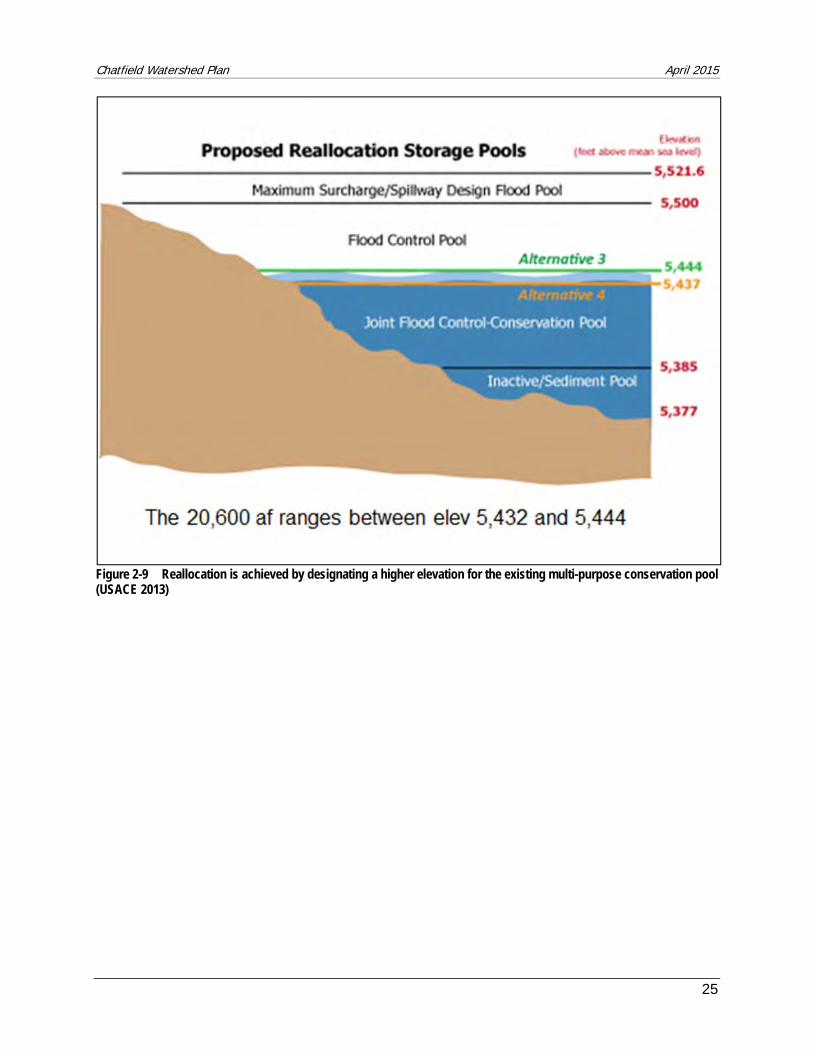
As planned, the reallocation of water storage in the Chatfield Reservoir could increase the Reservoir’s water level up to 12 feet during non-flood conditions. As a result, water level fluctuations can increase in both magnitude and frequency (Figure 2-10). Water quality concerns related to the increase in water level, water level fluctuations in the reservoir, including internal nutrient loading, are uncertain. Mitigation measures are proposed in the Adaptive Management Plan to address potential water quality impacts, including;
Wetlands creation along the South Platte River, Marcy Gulch, and Plum Creek, Stream restoration along Plum Creek, Shoreline stabilization, Reservoir operations plan and minimum flow requirements for downstream water quality, Data collection, monitoring, and modeling.
The CWA acknowledges certain risks and uncertainties associated with the Chatfield Reallocation as it relates to water quality and the phosphorus TMAL. However, the mitigation efforts proposed will also leverage common goals with the Watershed Plan. The CWA continues to coordinate with Chatfield Reallocation Water Providers as it relates to water quality protection of the Chatfield Reservoir and its Watershed through common priority efforts. These efforts include data collection, modeling, stream restoration and wetlands creation.
Chatfield Watershed Plan April 2015
25
Figure 2-9 Reallocation is achieved by designating a higher elevation for the existing multi-purpose conservation pool (USACE 2013)
Chatfield Watershed Plan April 2015
26
Figure 2-10 Chatfield Reallocation Water Level Fluctuations (USACE 2013)
Chatfield Watershed Plan April 2015
27
3. Regulatory and Agency Overview
This section describes Chatfield regulations set forth by the Colorado Water Quality Control Commission (CWQCC) and a description of the CWA, its Watershed role and legal responsibilities.
3.1 Regulatory Framework
The CWQCC, through its authority, adopted water quality regulations in the Chatfield Reservoir and Watershed (Regulations 38 and 73). Regulation 38 (5 CCR 1002-38) contains the designated use classifications and water quality standards for all surface waters in the South Platte River Basin, including Chatfield Reservoir and other waterbodies in the Watershed. Designated use classifications within the Watershed are defined in Regulation 38 and include Aquatic Life Cold 1, Aquatic Life Warm 1 and 2, Recreation E, Water Supply, and Agriculture (CWQCC 2009). Water quality standards throughout the Watershed are presented in Table 3-1. Regulation 73 (5 CCR 1002-73) is the Chatfield Reservoir Control Regulation. First adopted in 1989, this control regulation defines the total maximum annual load (TMAL) for total phosphorus loading, point sources and their wasteload allocations, management approaches to achieve water quality standards, and certain responsibilities of the CWA regarding implementation of point source, nonpoint source, and/or stormwater controls, monitoring, and reporting.
While most Watershed concerns are driven by controlling nutrient loading to the Reservoir, there are two provisional listings within Chatfield Watershed; West Plum Creek (COSPUS10a) and Cook Creek (COSPUS11a), a tributary to East Plum Creek. These waterbodies are listed as impaired for the Aquatic Life Use according to the 2012 Integrated Water Quality Monitoring and Evaluation Report due to data insufficiency for metals (total recoverable iron and pH).
Chatfield Watershed Plan April 2015
28
Table 3-1 Water Quality Standards in the Chatfield Watershed (from CWQCC Regulation 38) REGION: 3 AND 4 BASIN: UPPER SOUTH PLATTE RIVER
DESIGN
CLASSIFICATION
NUMERIC STANDARDS
TEMPORARY
MODIFICATIONS AND
QUALIFIERS
PHYSICAL and BIOLOGICAL
INORGANIC
mg/l
METALS
�g/l Stream Segment Description
6a. Mainstem of the South Platte River from the
outlet of Cheesman Reservoir to the inlet of
Chatfield Reservoir.
Aq Life Cold 1
Recreation E Water Supply Agriculture
T=TVS(CS-II) oC
D.O. = 6.0 mg/l D.O. (sp)=7.0 mg/l pH = 6.5-9.0
E. Coli=126/100ml
NH3(ac/ch)=TVS Cl2(ac)=0.019
Cl2(ch)=0.011
CN=0.005
S=0.002
B=0.75
NO2=0.05
NO3=10
Cl=250
S04=WS
As(ac)=340
As(ch)=0.02(Trec) Cd(ac)=TVS(tr) Cd(ch)=TVS CrIII(ac)=50(Trec) CrVI(ac/ch)=TVS Cu(ac/ch)=TVS
Fe(ch)=WS(dis)
Fe(ch)=1000(Trec) Pb(ac/ch)=TVS Mn(ac/ch)=TVS Mn(ch)=WS(dis) Hg(ch)=0.01(Tot)
Ni(ac/ch)=TVS
Se(ac/ch)=TVS Ag(ac)=TVS Ag(ch)=TVS(tr) Zn(ac/ch)=TVS
6b. Chatfield Reservoir Aq Life Cold 1
Recreation E Water Supply Agriculture
T=TVS(CLL) oC April-Dec
T(WAT)=23.5o
C D.O. = 6.0 mg/l D.O. (sp)=7.0 mg/l pH = 6.5-9.0
E. Coli=126/100ml P(Tot)=0.030 mg/l chlorophyll = 10
µg/l measured through samples that are representative of the mixed layer during July-Sept, with an allowable exceedance frequency of 1in 5 yrs.
NH3(ac/ch)=TVS Cl2(ac)=0.019
Cl2(ch)=0.011
CN=0.005
S=0.002
B=0.75
NO2=0.05
NO3=10
Cl=250
S04=WS
As(ac)=340
As(ch)=0.02(Trec) Cd(ac)=TVS(tr) Cd(ch)=TVS CrIII(ac)=50(Trec) CrVI(ac/ch)=TVS Cu(ac/ch)=TVS
Fe(ch)=WS(dis)
Fe(ch)=1000(Trec) Pb(ac/ch)=TVS Mn(ac/ch)=TVS Mn(ch)=WS(dis) Hg(ch)=0.01(Tot)
Ni(ac/ch)=TVS Se(ac/ch)=TVS Ag(ac)=TVS Ag(ch)=TVS(tr) Zn(ac/ch)=TVS
See section 38.6(4)
for P(Tot) and Chlorophyll assessment thresholds.
Chatfield Watershed Plan April 2015
29
REGION: 3 AND 4 BASIN: UPPER SOUTH PLATTE RIVER
DESIGN
CLASSIFICATION
NUMERIC STANDARDS
TEMPORARY
MODIFICATIONS AND
QUALIFIERS
PHYSICAL and BIOLOGICAL
INORGANIC
mg/l
METALS
�g/l Stream Segment Description
7. All tributaries to the South Platte River,
including all wetlands from a point immediately below the confluence with the North Fork of the South Platte River to the outlet of Chatfield Reservoir except for specific listings in Segments 8, 9, 10, 11, 12, and 13.
Aq Life Cold 2
Recreation E Agriculture
T=TVS(CS-II) oC
D.O. = 6.0 mg/l D.O. (sp)=7.0 mg/l pH = 6.5-9.0
E. Coli=126/100ml
NH3(ac/ch)=TVS Cl2(ac)=0.019
Cl2(ch)=0.011
CN=0.005
S=0.002
B=0.75
NO2=0.05
NO3=10
As(ac)=340
As(ch)=100(Trec) Cd(ac)=TVS(tr) Cd(ch)=TVS
Cr III(ac/ch)=TVS CrVI(ac/ch)=TVS Cu(ac/ch)=TVS
Fe(ch)=1000(Trec)
Pb(ac/ch)=TVS Mn(ac/ch)=TVS Hg(ch)=0.01(Tot)
Ni(ac/ch)=TVS
Se(ac/ch)=TVS Ag(ac)=TVS Ag(ch)=TVS(tr) Zn(ac/ch)=TVS
8. Mainstems of East and West Plum Creek from the source to the boundary of National Forest lands, including all tributaries and wetlands within the Plum Creek drainage which are on National Forest Lands, except for the specific listing in Segment 9.
Aq Life Cold 1
Recreation E Water Supply Agriculture
T=TVS(CS-I) oC D.O.=6.0 mg/l D.O.(sp)=7.0 mg/l pH=6.5-9.0
E. Coli=126/100ml
NH3(ac/ch)=TVS Cl2(ac)=0.019
Cl2(ch)=0.011
CN=0.005
S=0.002
B=0.75
NO2=0.05
NO3=10
Cl=250
S04=WS
As(ac)=340
As(ch)=0.02(Trec) Cd(ac)=TVS(tr) Cd(ch)=TVS CrIII(ac)=50(Trec) CrVI(ac/ch)=TVS Cu(ac/ch)=TVS
Fe(ch)=WS(dis) Fe(ch)=1000(Trec) Pb(ac/ch)=TVS Mn(ac/ch)=TVS Mn(ch)=WS(dis) Hg(ch)=0.01(Tot)
Ni(ac/ch)=TVS Se(ac/ch)=TVS Ag(ac)=TVS Ag(ch)=TVS(tr) Zn(ac/ch)=TVS
9. Mainstem of Bear Creek, including all
tributaries and wetlands from the source to the inlet of Perry Park Reservoir (Douglas County).
Aq Life Cold 1
Recreation E Water Supply Agriculture
T=TVS(CS-I) oC
D.O.=6.0 mg/l D.O.(sp)=7.0 mg/l pH=6.5-9.0
E. Coli=126/100ml
NH3(ac/ch)=TVS Cl2(ac)=0.019
Cl2(ch)=0.011
CN=0.005
S=0.002
B=0.75 NO2=0.05
NO3=10
Cl=250
S04=WS
As(ac)=340
As(ch)=0.02(Trec) Cd(ac)=TVS(tr) Cd(ch)=TVS CrIII(ac)=50(Trec) CrIII(ch)=TVS CrVI(ac/ch)=TVS Cu(ac/ch)=TVS
Fe(ch)=WS(dis)
Fe(ch)=1000(Trec) Pb(ac/ch)=TVS Mn(ac/ch)=TVS Mn(ch)=WS(dis) Hg(ch)=0.01(Tot)
Ni(ac/ch)=TVS
Se(ac/ch)=TVS Ag(ac)=TVS Ag(ch)=TVS(tr) Zn(ac/ch)=TVS
Chatfield Watershed Plan April 2015
30
REGION: 3 AND 4 BASIN: UPPER SOUTH PLATTE RIVER
DESIGN
CLASSIFICATION
NUMERIC STANDARDS
TEMPORARY
MODIFICATIONS AND
QUALIFIERS
PHYSICAL and BIOLOGICAL
INORGANIC
mg/l
METALS
�g/l Stream Segment Description
10a. Mainstems of East Plum Creek, West Plum
Creek, and Plum Creek from the boundary of National Forest lands to Chatfield Reservoir, mainstems of Stark Creek and Gove Creek from the boundary of National Forest lands
to their confluence.
Aq Life Warm 1
Recreation E Water Supply Agriculture
T=TVS(WS-I) oC
D.O.= 5.0 mg/l pH = 6.5-9.0
E. Coli=126/100ml
NH3(ac/ch)=TVS Cl2(ac)=0.019
Cl2(ch)=0.011
CN=0.005
S=0.002
B=0.75
NO2=0.5
NO3=10
Cl=250
As(ac)=340
As(ch)=0.02(Trec) Cd(ac/ch)=TVS CrIII(ac)=50(Trec) CrVI(ac/ch)=TVS Cu(ac/ch)=TVS
Fe(ch)=WS(dis)
Fe(ch)=1000(Trec) Pb(ac/ch)=TVS Mn(ac/ch)=TVS Mn(ch)=WS(dis)
Hg(ch)=0.01(Tot)
Ni(ac/ch)=TVS Se(ac/ch)=TVS Ag(ac/ch)=TVS Zn(ac/ch)=TVS
Temporary
modifications: Cu (ac/ch) = TVSx2.4 on East Plum Creek and Plum Creek below the Plum Creek Wastewater Authority Discharge.
10b. Deleted.
11a. All tributaries to the East Plum Creek
system, including all wetlands which are not on national forest lands.
UP Aq Life Warm 2
Recreation E Agriculture
T=TVS(WS-II) oC
D.O.=5.0 mg/l pH=6.5-9.0
E. Coli=126/100ml
NH3(ac/ch)=TVS Cl2(ac)=0.019
Cl2(ch)=0.011
CN=0.005
S=0.002
B=0.75
NO2=0.5
NO3=100
As(ac)=340
As(ch)=100(Trec) Cd(ac/ch)=TVS CrIII(ac/ch)=TVS CrVI(ac/ch)=TVS Cu(ac/ch)=TVS
Fe(ch)=1000(Trec)
Pb(ac/ch)=TVS Mn(ac/ch)=TVS Hg(ch)=0.01(Tot) Ni(ac/ch)=TVS
Se(ac/ch)=TVS
Ag(ac/ch)=TVS Zn(ac/ch)=TVS
11b. All tributaries to the West Plum Creek system, including all wetlands, which are not on national forest lands, except for specific listings inSegments 9 and 12.
UP Aq Life Warm 2
Recreation E Agriculture
T=TVS(WS-I) oC D.O.=5.0 mg/l pH=6.5-9.0
E. Coli=126/100ml
NH3(ac/ch)=TVS Cl2(ac)=0.019 Cl2(ch)=0.011 CN=0.005
S=0.002
B=0.75
NO2=0.5
NO3=100
As(ac)=340
As(ch)=100(Trec) Cd(ac/ch)=TVS CrIII(ac/ch)=TVS CrVI(ac/ch)=TVS Cu(ac/ch)=TVS
Fe(ch)=1000(Trec) Pb(ac/ch)=TVS Mn(ac/ch)=TVS Hg(ch)=0.01(Tot) Ni(ac/ch)=TVS
Se(ac/ch)=TVS Ag(ac/ch)=TVS Zn(ac/ch)=TVS
Chatfield Watershed Plan April 2015
31
REGION: 3 AND 4 BASIN: UPPER SOUTH PLATTE RIVER
DESIGN
CLASSIFICATION
NUMERIC STANDARDS
TEMPORARY
MODIFICATIONS AND
QUALIFIERS
PHYSICAL and BIOLOGICAL
INORGANIC
mg/l
METALS
�g/l Stream Segment Description
12. Mainstem of Garber Creek and Jackson
Creek from the boundary of National Forest landsto the confluence with West Plum Creek.
Aq Life Warm1
Recreation E Water Supply Agriculture
T=TVS(WS-I) oC
D.O.=5.0 mg/l pH=6.5-9.0
E. Coli=126/100ml
NH3(ac/ch)=TVS Cl2(ac)=0.019 Cl2(ch)=0.011 CN=0.005
S=0.002
B=0.75
NO2=0.5
NO3=10
Cl=250
S04=WS
As(ac)=340
As(ch)=0.02(Trec) Cd(ac/ch)=TVS CrIII(ac)=50(Trec) CrVI(ac/ch)=TVS Cu(ac/ch)=TVS
Fe(ch)=WS(dis)
Fe(ch)=1000(Trec) Pb(ac/ch)=TVS Mn(ac/ch)=TVS Mn(ch)=WS(dis) Hg(ch)=0.01(Tot)
Ni(ac/ch)=TVS
Se(ac/ch)=TVS Ag(ac/ch)=TVS Zn(ac/ch)=TVS
13. Mainstem of Deer Creek, including the
North and South Forks, from the source to
Chatfield Reservoir.
Aq Life Cold 1
Recreation E Water Supply Agriculture
T=TVS(CS-II) oC
D.O.=6.0 mg/l D.O.(sp)=7.0 mg/l pH=6.5-9.0
E. Coli=126/100ml
NH3(ac/ch)=TVS Cl2(ac)=0.019 Cl2(ch)=0.011 CN=0.005
S=0.002
B=0.75
NO2=0.05
NO3=10
Cl=250
S04=WS
As(ac)=340
As(ch)=0.02(Trec) Cd(ac)=TVS(tr) Cd(ch)=TVS CrIII(ac)=50(Trec) CrVI(ac/ch)=TVS Cu(ac/ch)=TVS
Fe(ch)=WS(dis)
Fe(ch)=1000(Trec) Pb(ac/ch)=TVS Mn(ac/ch)=TVS Mn(ch)=WS(dis) Hg(ch)=0.01(Tot)
Ni(ac/ch)=TVS
Se(ac/ch)=TVS Ag(ac)=TVS Ag(ch)=TVS(tr) Zn(ac/ch)=TVS
Chatfield Watershed Plan April 2015
32
As required by law, these Chatfield-related regulations are reviewed by the CWQCC every three years. More information on these water quality regulations is available on the Colorado Department of Public Health and Environment (CDPHE) website.
In 2009, the CWQCC established a new total phosphorus allowable load (i.e. TMAL) in Regulation 73. The TMAL for phosphorus is 19,600 pounds/year under a median inflow of 100,860 acre-feet/year. In 2009, the TMAL and median inflow were updated in Regulation 73 but the wasteload and load allocations remained applicable until the following tasks to support development of revised allocations were completed (CWCC 2009, Statement of Basis and Purpose, Regulation 73):
Partition allowable load between the two main basins (South Platte and Plum Creek); Determine allocation of loads within each basin; Revise wasteload allocations, as appropriate; and Update definitions and regulation language to support TMAL revisions.
The CWQCC acknowledged that progress toward development of the phosphorus allocations will be contingent on the availability of suitable funding to support completion of the tasks and that control regulation definitions and language may need to be revised to support future updates to the TMAL. Attainment of the TMAL may require progressive development of point source and nonpoint controls. Implementation of activities in this Watershed Plan will help the CWA proceed towards achieving the aforementioned tasks identified in Regulation 73.
The TMAL is put in place to meet the water quality standards for the Chatfield Reservoir. To preserve the intended trophic condition of the Reservoir and protect uses, the CWQCC adopted water quality standards revised by the CWQCC in 2009 to maintain the in-lake water quality condition measured historically. The standards are based upon the response in the growth of algae (measured through chl-a) to the concentration of phosphorus. The 2009 revisions increased the TP standard from 27 to 30 µg/L and changed chl-a from a goal of 17 µg/L to a standard of 10 µg/L. Because of the natural variability in the Reservoir and the levels at which the standards were set, exceedances of the standards were anticipated. Natural variability, especially for chlorophyll, is sufficient to produce much more uncertainty in the assessed value than in the standard, which was derived from the set of all summer averages. As a result, attainment of the water quality standards is determined through numeric “assessment criteria” (Table 3-2) which incorporates the standard and the variability in the historical data, without allowing for a change in trophic condition. For chl-a, the assessment criteria is 11.2 µg/L and for phosphorus it is 35 µg/L, each with an allowable exceedance frequency of one-in-five years (Regulation 38, Section 38.69, Statement of Basis and Purpose). These water quality standards apply during the growing season (July through September).
Table 3-2 Assessment Criteria and Water Quality Standards in Chatfield Reservoir (from Regulation 38)
TP (µg/L) Chl-a (µg/L) Allowable Exceedance Frequency
Assessment Criteria 35 11.2 One-in-five years
Water Quality Standard 30 10 One-in-five years
3.2 Chatfield Watershed Authority
A basin-wide group of counties, municipalities, special districts, private, and other entities, known as the “Chatfield Watershed Authority” (CWA), was formulated through intergovernmental agreement after the Chatfield Reservoir total phosphorus standard was adopted in 1984. The CWA operates pursuant to federal and state water quality laws and regulations. Certain responsibilities, requirements and roles have been assigned to CWA, including legal responsibilities pursuant to the Federal Clean Water Act and Colorado Water Quality Control Act (Table 3-3). The CWA has remained very active in watershed management for the past 30 years, providing technical support and long-term planning for water quality issues in the Chatfield Watershed. The CWA provides technical reviews to address wastewater utility

Chatfield Watershed Plan April 2015
33
planning, review of wastewater site applications, permit compliance, stormwater management, nonpoint source controls, watershed management, compliance with the watershed regulatory framework, and improvement of water quality. These responsibilities are in accordance with designation by the Governor (and EPA) of the CWA as the 208 Management Agency under the Federal Clean Water Act for wastewater management in the Chatfield Watershed. In addition to its 208 responsibilities, the CWA is also responsible for implementing point source, nonpoint source and stormwater controls pursuant to the Chatfield Reservoir Control Regulation 73.
Chatfield Watershed Plan April 2015
34
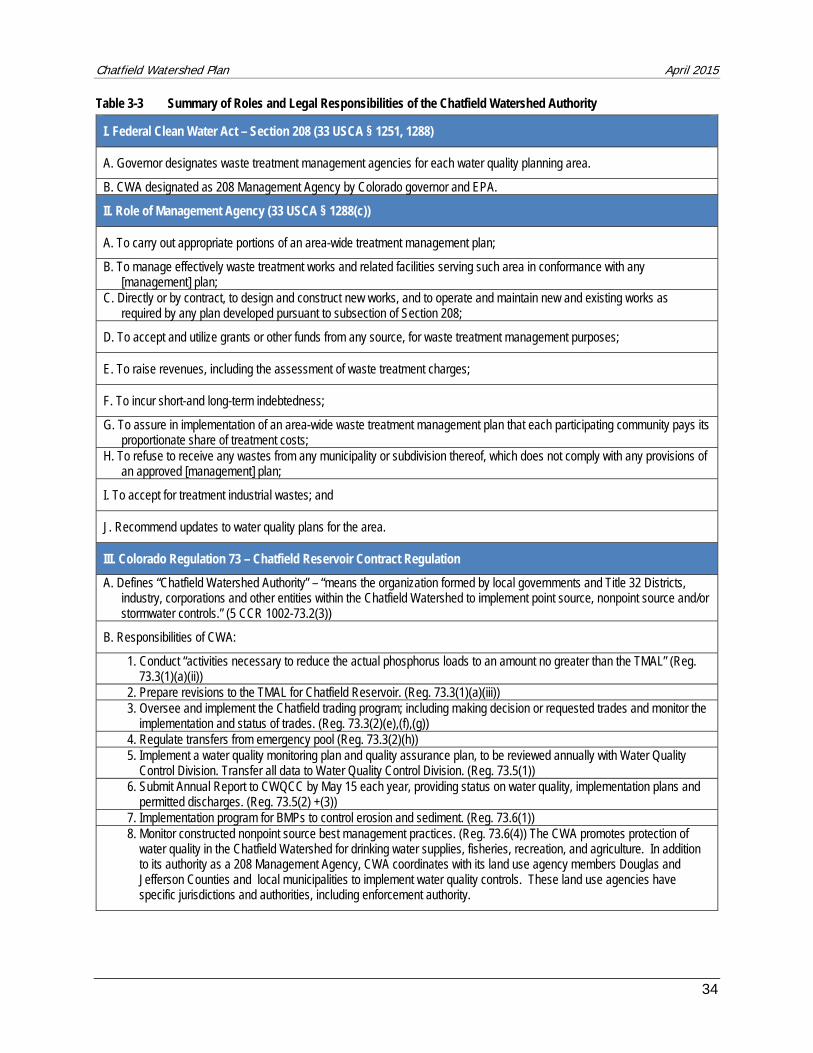
Table 3-3 Summary of Roles and Legal Responsibilities of the Chatfield Watershed Authority
I. Federal Clean Water Act – Section 208 (33 USCA § 1251, 1288)
A. Governor designates waste treatment management agencies for each water quality planning area.
B. CWA designated as 208 Management Agency by Colorado governor and EPA.
II. Role of Management Agency (33 USCA § 1288(c))
A. To carry out appropriate portions of an area-wide treatment management plan;
B. To manage effectively waste treatment works and related facilities serving such area in conformance with any [management] plan;
C. Directly or by contract, to design and construct new works, and to operate and maintain new and existing works as required by any plan developed pursuant to subsection of Section 208;
D. To accept and utilize grants or other funds from any source, for waste treatment management purposes;
E. To raise revenues, including the assessment of waste treatment charges;
F. To incur short-and long-term indebtedness;
G. To assure in implementation of an area-wide waste treatment management plan that each participating community pays its proportionate share of treatment costs;
H. To refuse to receive any wastes from any municipality or subdivision thereof, which does not comply with any provisions of an approved [management] plan;
I. To accept for treatment industrial wastes; and
J. Recommend updates to water quality plans for the area.
III. Colorado Regulation 73 – Chatfield Reservoir Contract Regulation
A. Defines “Chatfield Watershed Authority” – “means the organization formed by local governments and Title 32 Districts, industry, corporations and other entities within the Chatfield Watershed to implement point source, nonpoint source and/or stormwater controls.” (5 CCR 1002-73.2(3))
B. Responsibilities of CWA:
1. Conduct “activities necessary to reduce the actual phosphorus loads to an amount no greater than the TMAL” (Reg. 73.3(1)(a)(ii))
2. Prepare revisions to the TMAL for Chatfield Reservoir. (Reg. 73.3(1)(a)(iii)) 3. Oversee and implement the Chatfield trading program; including making decision or requested trades and monitor the
implementation and status of trades. (Reg. 73.3(2)(e),(f),(g)) 4. Regulate transfers from emergency pool (Reg. 73.3(2)(h)) 5. Implement a water quality monitoring plan and quality assurance plan, to be reviewed annually with Water Quality
Control Division. Transfer all data to Water Quality Control Division. (Reg. 73.5(1)) 6. Submit Annual Report to CWQCC by May 15 each year, providing status on water quality, implementation plans and
permitted discharges. (Reg. 73.5(2) +(3)) 7. Implementation program for BMPs to control erosion and sediment. (Reg. 73.6(1)) 8. Monitor constructed nonpoint source best management practices. (Reg. 73.6(4)) The CWA promotes protection of
water quality in the Chatfield Watershed for drinking water supplies, fisheries, recreation, and agriculture. In addition to its authority as a 208 Management Agency, CWA coordinates with its land use agency members Douglas and Jefferson Counties and local municipalities to implement water quality controls. These land use agencies have specific jurisdictions and authorities, including enforcement authority.
Chatfield Watershed Plan April 2015
35
4. Water Quality and Hydrologic Conditions This section discusses the water quality and hydrologic conditions based on data collected over the past 30 years by the CWA in the Chatfield Reservoir and Watershed. During this period a variety of hydrologic extremes have been measured, ranging from low flows during wide-spread drought conditions in 2002 to flood events that have occurred post-1965, when Chatfield Reservoir was originally constructed for flood control purposes. Natural flow conditions may be affected by water rights, transfers, exchanges and other decreed uses. Water quality conditions are as variable as the flows themselves. Over 75% of the flows into the Reservoir are from the South Platte drainage, and approximately 20% of flows are from the Plum Creek drainage. Since 1986, the South Platte basin has contributed the majority of the TP load about 55% of the time.
This section presents a historic evaluation of conditions of the Chatfield Reservoir and the Watershed in terms of flow (Section 4.1) and water quality (Section 4.2). A summary of recent water quality data (2014) is provided in Appendix C.
4.1 Flow Conditions
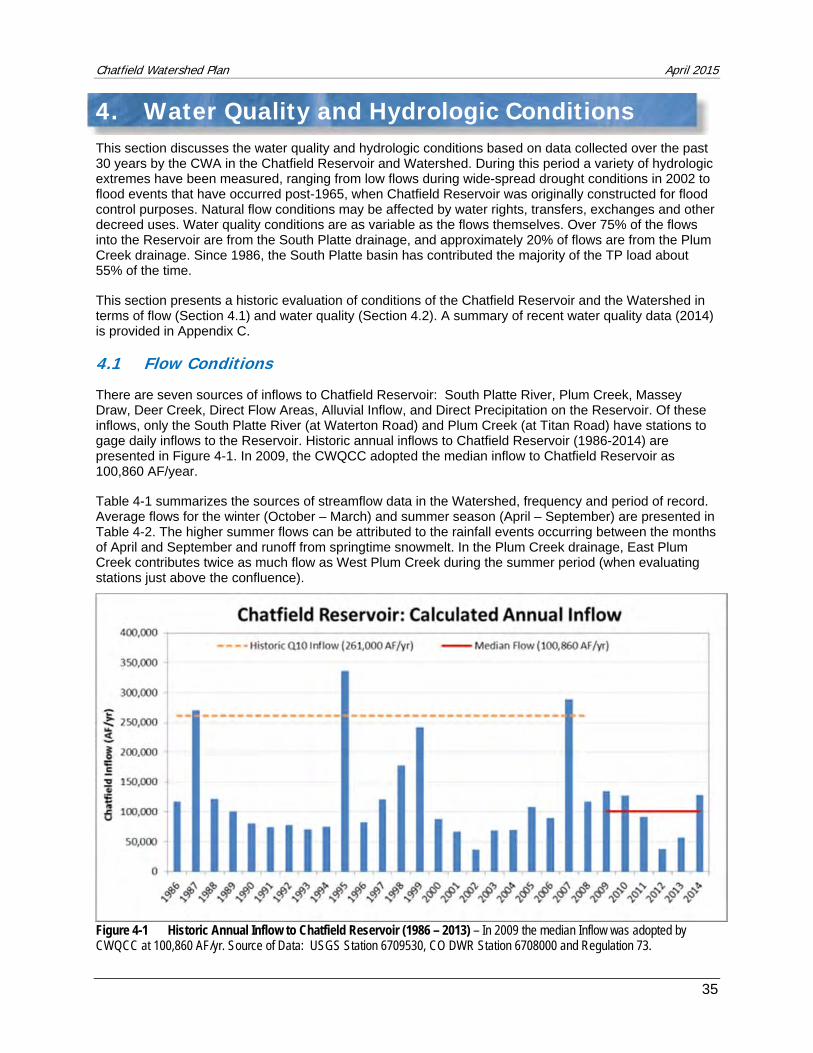
There are seven sources of inflows to Chatfield Reservoir: South Platte River, Plum Creek, Massey Draw, Deer Creek, Direct Flow Areas, Alluvial Inflow, and Direct Precipitation on the Reservoir. Of these inflows, only the South Platte River (at Waterton Road) and Plum Creek (at Titan Road) have stations to gage daily inflows to the Reservoir. Historic annual inflows to Chatfield Reservoir (1986-2014) are presented in Figure 4-1. In 2009, the CWQCC adopted the median inflow to Chatfield Reservoir as 100,860 AF/year.
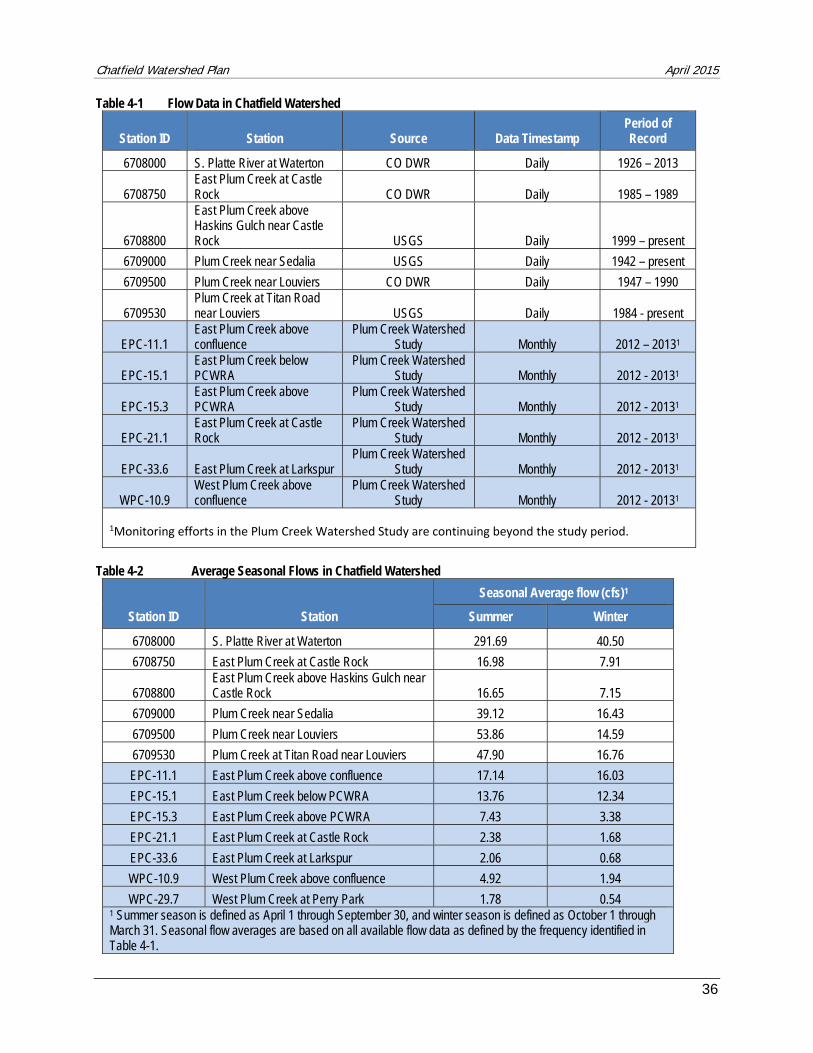
Table 4-1 summarizes the sources of streamflow data in the Watershed, frequency and period of record. Average flows for the winter (October – March) and summer season (April – September) are presented in Table 4-2. The higher summer flows can be attributed to the rainfall events occurring between the months of April and September and runoff from springtime snowmelt. In the Plum Creek drainage, East Plum Creek contributes twice as much flow as West Plum Creek during the summer period (when evaluating stations just above the confluence).
Figure 4-1 Historic Annual Inflow to Chatfield Reservoir (1986 – 2013) – In 2009 the median Inflow was adopted by CWQCC at 100,860 AF/yr. Source of Data: USGS Station 6709530, CO DWR Station 6708000 and Regulation 73.
Chatfield Watershed Plan April 2015
36
Table 4-1 Flow Data in Chatfield Watershed
Station ID Station Source Data Timestamp Period of Record
6708000 S. Platte River at Waterton CO DWR Daily 1926 – 2013
6708750 East Plum Creek at Castle Rock CO DWR Daily 1985 – 1989
6708800
East Plum Creek above Haskins Gulch near Castle Rock USGS Daily 1999 – present
6709000 Plum Creek near Sedalia USGS Daily 1942 – present
6709500 Plum Creek near Louviers CO DWR Daily 1947 – 1990
6709530 Plum Creek at Titan Road near Louviers USGS Daily 1984 - present
EPC-11.1 East Plum Creek above confluence
Plum Creek Watershed Study Monthly 2012 – 20131
EPC-15.1 East Plum Creek below PCWRA
Plum Creek Watershed Study Monthly 2012 - 20131
EPC-15.3 East Plum Creek above PCWRA
Plum Creek Watershed Study Monthly 2012 - 20131
EPC-21.1 East Plum Creek at Castle Rock
Plum Creek Watershed Study Monthly 2012 - 20131
EPC-33.6 East Plum Creek at Larkspur Plum Creek Watershed
Study Monthly 2012 - 20131
WPC-10.9 West Plum Creek above confluence
Plum Creek Watershed Study Monthly 2012 - 20131
1Monitoring efforts in the Plum Creek Watershed Study are continuing beyond the study period.
Table 4-2 Average Seasonal Flows in Chatfield Watershed
Station ID Station
Seasonal Average flow (cfs)1
Summer Winter
6708000 S. Platte River at Waterton 291.69 40.50
6708750 East Plum Creek at Castle Rock 16.98 7.91
6708800 East Plum Creek above Haskins Gulch near Castle Rock 16.65 7.15
6709000 Plum Creek near Sedalia 39.12 16.43
6709500 Plum Creek near Louviers 53.86 14.59
6709530 Plum Creek at Titan Road near Louviers 47.90 16.76
EPC-11.1 East Plum Creek above confluence 17.14 16.03
EPC-15.1 East Plum Creek below PCWRA 13.76 12.34
EPC-15.3 East Plum Creek above PCWRA 7.43 3.38
EPC-21.1 East Plum Creek at Castle Rock 2.38 1.68
EPC-33.6 East Plum Creek at Larkspur 2.06 0.68
WPC-10.9 West Plum Creek above confluence 4.92 1.94
WPC-29.7 West Plum Creek at Perry Park 1.78 0.54 1 Summer season is defined as April 1 through September 30, and winter season is defined as October 1 through March 31. Seasonal flow averages are based on all available flow data as defined by the frequency identified in Table 4-1.
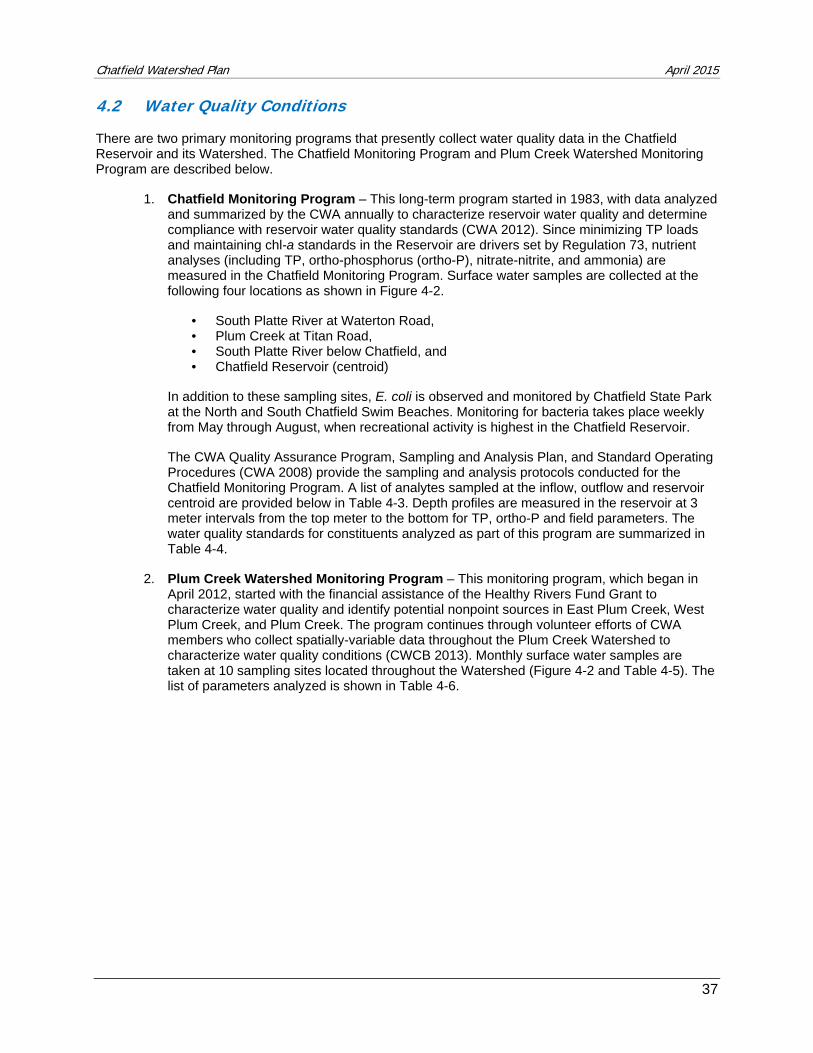
Chatfield Watershed Plan April 2015
37
4.2 Water Quality Conditions
There are two primary monitoring programs that presently collect water quality data in the Chatfield Reservoir and its Watershed. The Chatfield Monitoring Program and Plum Creek Watershed Monitoring Program are described below.
1. Chatfield Monitoring Program – This long-term program started in 1983, with data analyzed and summarized by the CWA annually to characterize reservoir water quality and determine compliance with reservoir water quality standards (CWA 2012). Since minimizing TP loads and maintaining chl-a standards in the Reservoir are drivers set by Regulation 73, nutrient analyses (including TP, ortho-phosphorus (ortho-P), nitrate-nitrite, and ammonia) are measured in the Chatfield Monitoring Program. Surface water samples are collected at the following four locations as shown in Figure 4-2.
• South Platte River at Waterton Road, • Plum Creek at Titan Road, • South Platte River below Chatfield, and • Chatfield Reservoir (centroid)
In addition to these sampling sites, E. coli is observed and monitored by Chatfield State Park at the North and South Chatfield Swim Beaches. Monitoring for bacteria takes place weekly from May through August, when recreational activity is highest in the Chatfield Reservoir.
The CWA Quality Assurance Program, Sampling and Analysis Plan, and Standard Operating Procedures (CWA 2008) provide the sampling and analysis protocols conducted for the Chatfield Monitoring Program. A list of analytes sampled at the inflow, outflow and reservoir centroid are provided below in Table 4-3. Depth profiles are measured in the reservoir at 3 meter intervals from the top meter to the bottom for TP, ortho-P and field parameters. The water quality standards for constituents analyzed as part of this program are summarized in Table 4-4.
2. Plum Creek Watershed Monitoring Program – This monitoring program, which began in April 2012, started with the financial assistance of the Healthy Rivers Fund Grant to characterize water quality and identify potential nonpoint sources in East Plum Creek, West Plum Creek, and Plum Creek. The program continues through volunteer efforts of CWA members who collect spatially-variable data throughout the Plum Creek Watershed to characterize water quality conditions (CWCB 2013). Monthly surface water samples are taken at 10 sampling sites located throughout the Watershed (Figure 4-2 and Table 4-5). The list of parameters analyzed is shown in Table 4-6.
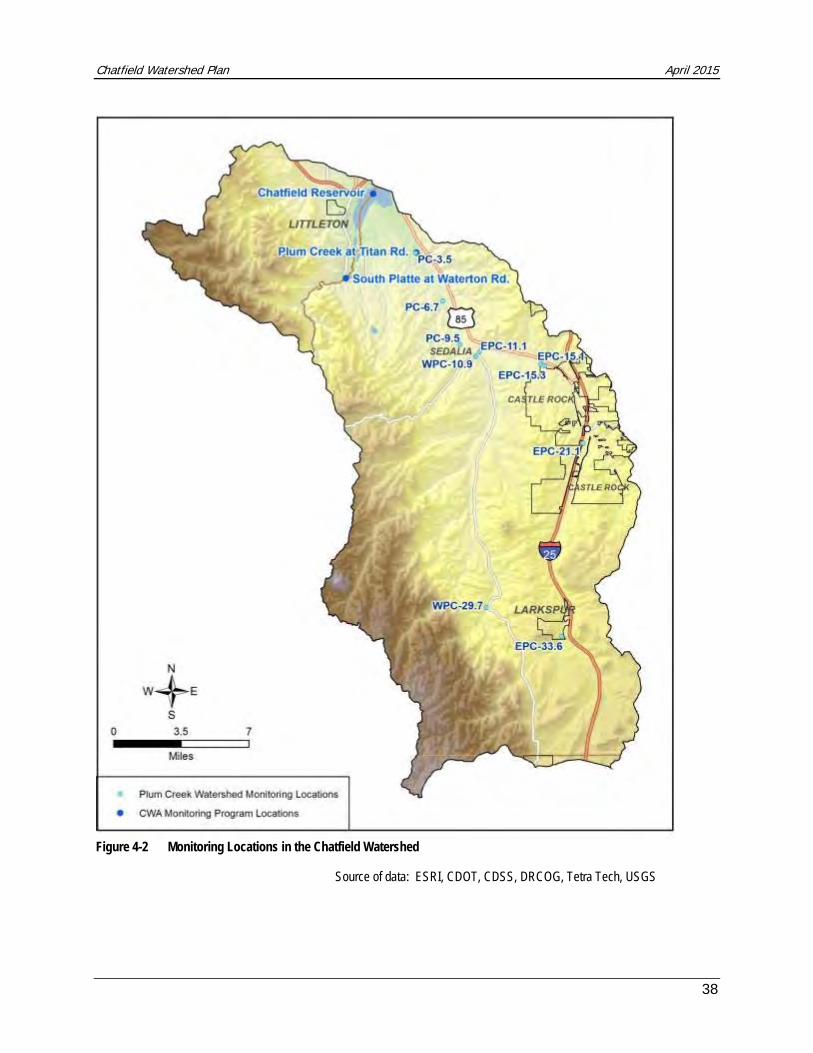
Chatfield Watershed Plan April 2015
38
Figure 4-2 Monitoring Locations in the Chatfield Watershed
Source of data: ESRI, CDOT, CDSS, DRCOG, Tetra Tech, USGS
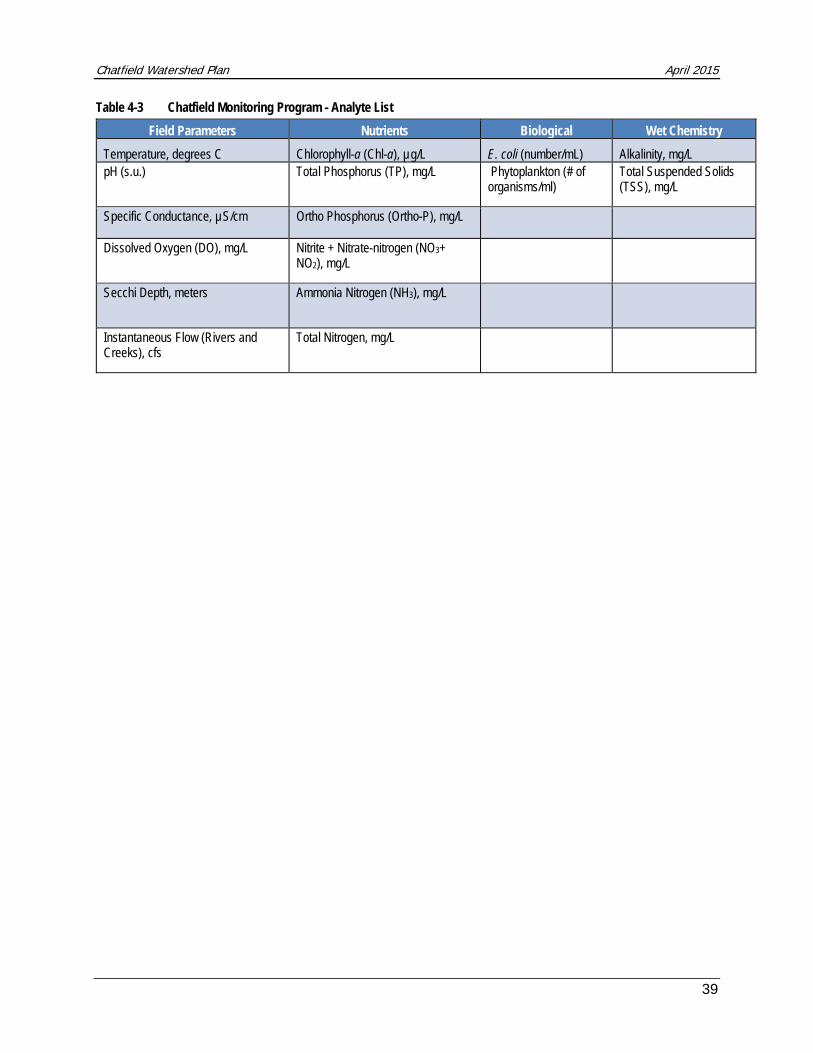
Chatfield Watershed Plan April 2015
39
Table 4-3 Chatfield Monitoring Program - Analyte List
Field Parameters Nutrients Biological Wet Chemistry Temperature, degrees C Chlorophyll-a (Chl-a), µg/L E. coli (number/mL) Alkalinity, mg/L pH (s.u.) Total Phosphorus (TP), mg/L Phytoplankton (# of
organisms/ml) Total Suspended Solids (TSS), mg/L
Specific Conductance, µS/cm Ortho Phosphorus (Ortho-P), mg/L Dissolved Oxygen (DO), mg/L Nitrite + Nitrate-nitrogen (NO3+
NO2), mg/L
Secchi Depth, meters Ammonia Nitrogen (NH3), mg/L
Instantaneous Flow (Rivers and Creeks), cfs
Total Nitrogen, mg/L
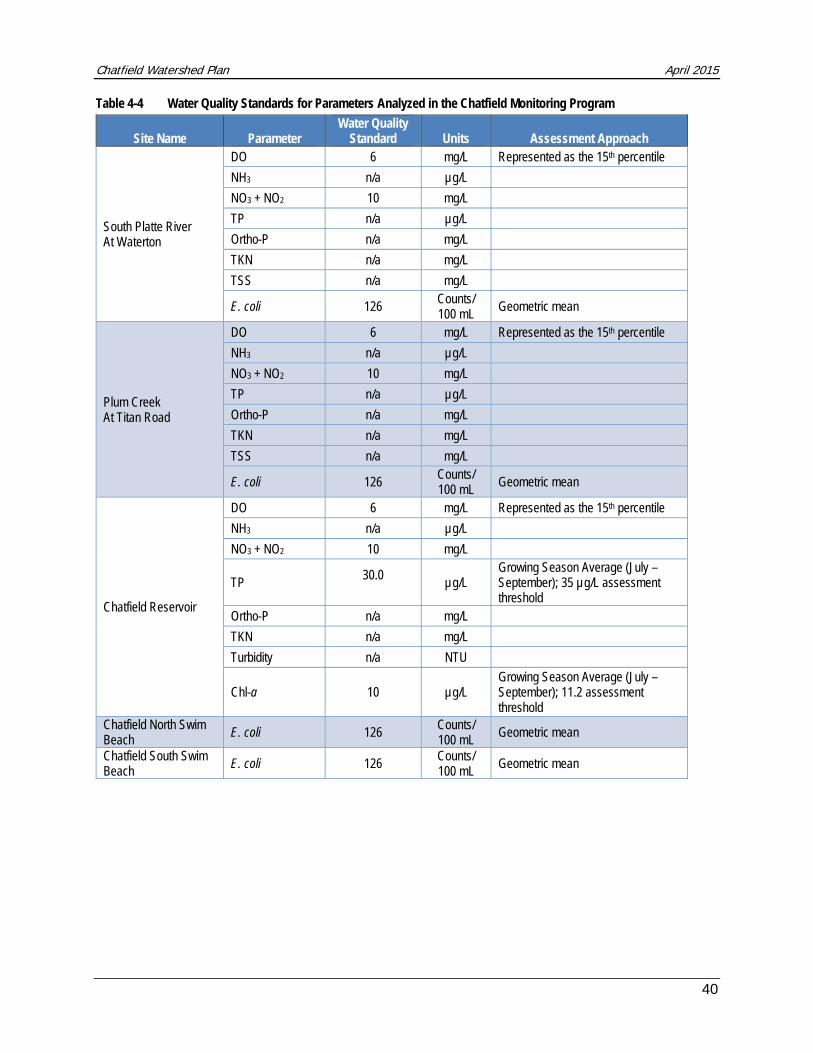
Chatfield Watershed Plan April 2015
40
Table 4-4 Water Quality Standards for Parameters Analyzed in the Chatfield Monitoring Program
Site Name Parameter Water Quality
Standard Units Assessment Approach
South Platte River At Waterton
DO 6 mg/L Represented as the 15th percentile
NH3 n/a µg/L
NO3 + NO2 10 mg/L
TP n/a µg/L
Ortho-P n/a mg/L
TKN n/a mg/L
TSS n/a mg/L
E. coli 126 Counts/ 100 mL
Geometric mean
Plum Creek At Titan Road
DO 6 mg/L Represented as the 15th percentile
NH3 n/a µg/L
NO3 + NO2 10 mg/L
TP n/a µg/L
Ortho-P n/a mg/L
TKN n/a mg/L
TSS n/a mg/L
E. coli 126 Counts/ 100 mL Geometric mean
Chatfield Reservoir
DO 6 mg/L Represented as the 15th percentile
NH3 n/a µg/L
NO3 + NO2 10 mg/L
TP 30.0
µg/L
Growing Season Average (July – September); 35 µg/L assessment threshold
Ortho-P n/a mg/L
TKN n/a mg/L
Turbidity n/a NTU
Chl-a 10 µg/L Growing Season Average (July – September); 11.2 assessment threshold
Chatfield North Swim Beach
E. coli 126 Counts/ 100 mL
Geometric mean
Chatfield South Swim Beach
E. coli 126 Counts/ 100 mL
Geometric mean
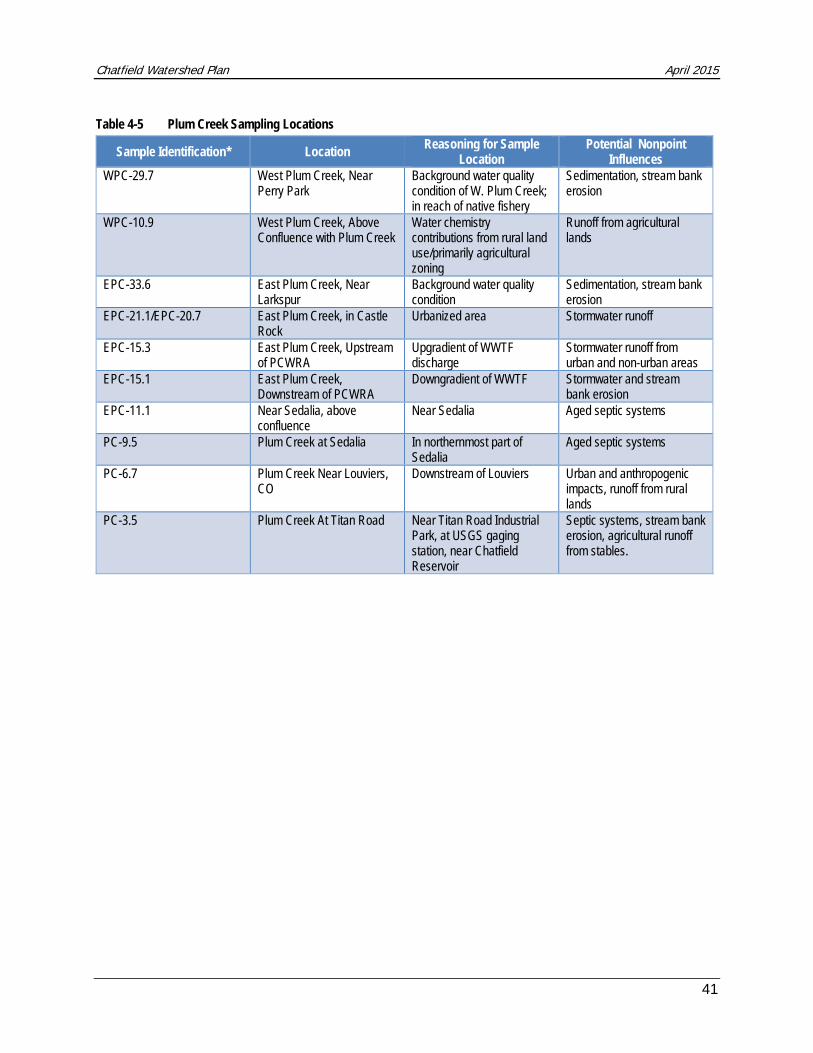
Chatfield Watershed Plan April 2015
41
Table 4-5 Plum Creek Sampling Locations
Sample Identification* Location Reasoning for Sample
Location Potential Nonpoint
Influences WPC-29.7 West Plum Creek, Near
Perry Park Background water quality condition of W. Plum Creek; in reach of native fishery
Sedimentation, stream bank erosion
WPC-10.9 West Plum Creek, Above Confluence with Plum Creek
Water chemistry contributions from rural land use/primarily agricultural zoning
Runoff from agricultural lands
EPC-33.6 East Plum Creek, Near Larkspur
Background water quality condition
Sedimentation, stream bank erosion
EPC-21.1/EPC-20.7 East Plum Creek, in Castle Rock
Urbanized area Stormwater runoff
EPC-15.3 East Plum Creek, Upstream of PCWRA
Upgradient of WWTF discharge
Stormwater runoff from urban and non-urban areas
EPC-15.1 East Plum Creek, Downstream of PCWRA
Downgradient of WWTF Stormwater and stream bank erosion
EPC-11.1 Near Sedalia, above confluence
Near Sedalia Aged septic systems
PC-9.5 Plum Creek at Sedalia In northernmost part of Sedalia
Aged septic systems
PC-6.7 Plum Creek Near Louviers, CO
Downstream of Louviers Urban and anthropogenic impacts, runoff from rural lands
PC-3.5 Plum Creek At Titan Road Near Titan Road Industrial Park, at USGS gaging station, near Chatfield Reservoir
Septic systems, stream bank erosion, agricultural runoff from stables.
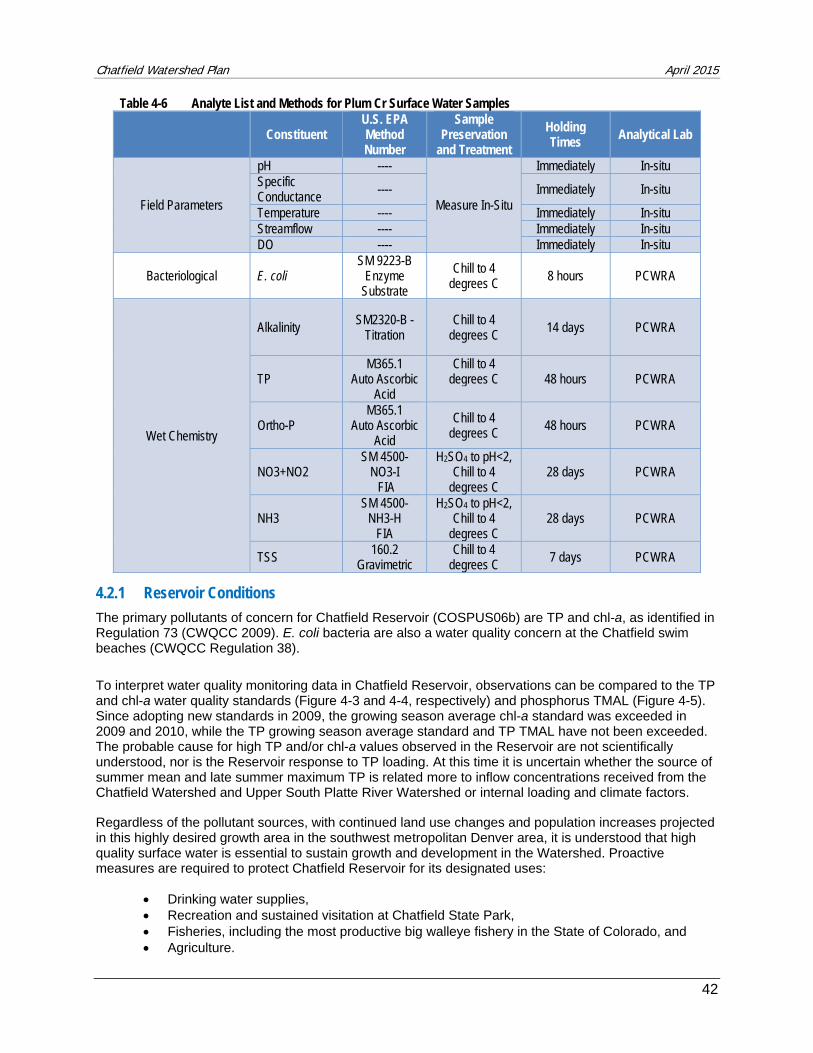
Chatfield Watershed Plan April 2015
42
Table 4-6 Analyte List and Methods for Plum Cr Surface Water Samples
Constituent U.S. EPA Method Number
Sample Preservation
and Treatment
Holding Times Analytical Lab
Field Parameters
pH ----
Measure In-Situ
Immediately In-situ Specific Conductance ---- Immediately In-situ
Temperature ---- Immediately In-situ Streamflow ---- Immediately In-situ DO ---- Immediately In-situ
Bacteriological E. coli SM 9223-B
Enzyme Substrate
Chill to 4 degrees C
8 hours PCWRA
Wet Chemistry
Alkalinity SM2320-B -
Titration Chill to 4
degrees C 14 days PCWRA
TP M365.1
Auto Ascorbic Acid
Chill to 4 degrees C
48 hours PCWRA
Ortho-P M365.1
Auto Ascorbic Acid
Chill to 4 degrees C
48 hours PCWRA
NO3+NO2 SM 4500-
NO3-I FIA
H2SO4 to pH<2, Chill to 4
degrees C 28 days PCWRA
NH3 SM 4500-
NH3-H FIA
H2SO4 to pH<2, Chill to 4
degrees C 28 days PCWRA
TSS 160.2
Gravimetric Chill to 4
degrees C 7 days PCWRA
4.2.1 Reservoir Conditions
The primary pollutants of concern for Chatfield Reservoir (COSPUS06b) are TP and chl-a, as identified in Regulation 73 (CWQCC 2009). E. coli bacteria are also a water quality concern at the Chatfield swim beaches (CWQCC Regulation 38).
To interpret water quality monitoring data in Chatfield Reservoir, observations can be compared to the TP and chl-a water quality standards (Figure 4-3 and 4-4, respectively) and phosphorus TMAL (Figure 4-5). Since adopting new standards in 2009, the growing season average chl-a standard was exceeded in 2009 and 2010, while the TP growing season average standard and TP TMAL have not been exceeded. The probable cause for high TP and/or chl-a values observed in the Reservoir are not scientifically understood, nor is the Reservoir response to TP loading. At this time it is uncertain whether the source of summer mean and late summer maximum TP is related more to inflow concentrations received from the Chatfield Watershed and Upper South Platte River Watershed or internal loading and climate factors.
Regardless of the pollutant sources, with continued land use changes and population increases projected in this highly desired growth area in the southwest metropolitan Denver area, it is understood that high quality surface water is essential to sustain growth and development in the Watershed. Proactive measures are required to protect Chatfield Reservoir for its designated uses:
Drinking water supplies, Recreation and sustained visitation at Chatfield State Park, Fisheries, including the most productive big walleye fishery in the State of Colorado, and Agriculture.
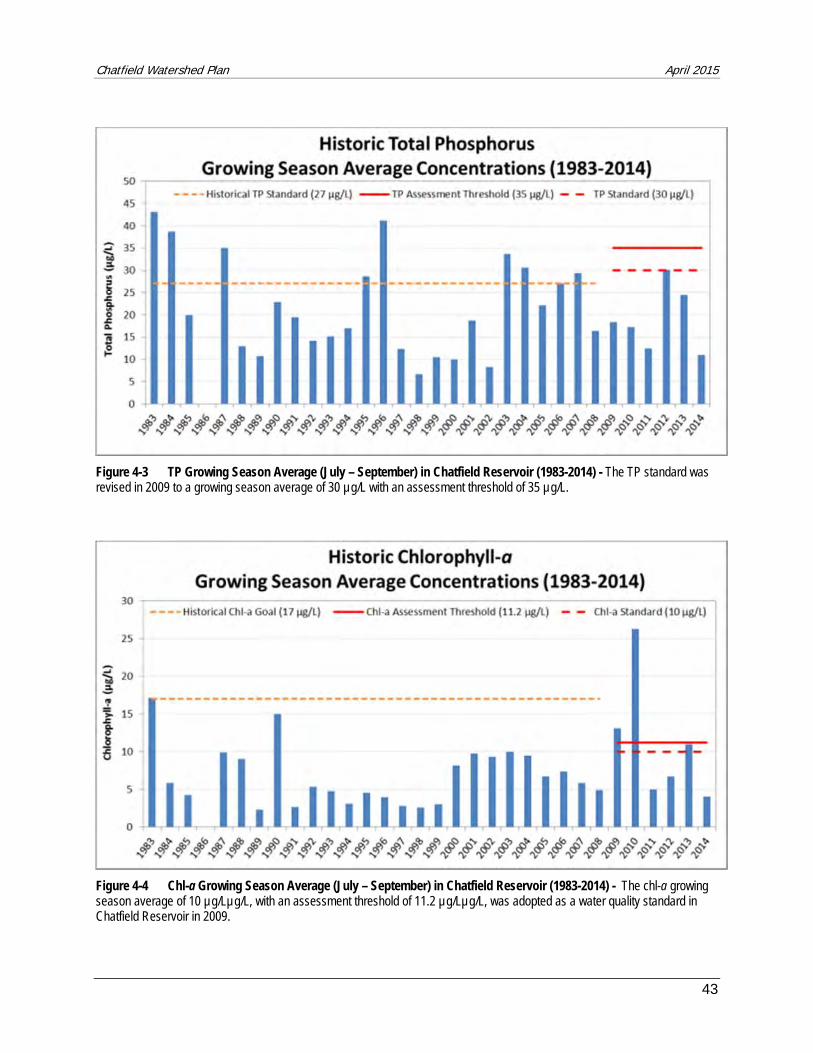
Chatfield Watershed Plan April 2015
43
Figure 4-3 TP Growing Season Average (July – September) in Chatfield Reservoir (1983-2014) - The TP standard was revised in 2009 to a growing season average of 30 µg/L with an assessment threshold of 35 µg/L.
Figure 4-4 Chl-a Growing Season Average (July – September) in Chatfield Reservoir (1983-2014) - The chl-a growing season average of 10 µg/Lµg/L, with an assessment threshold of 11.2 µg/Lµg/L, was adopted as a water quality standard in Chatfield Reservoir in 2009.
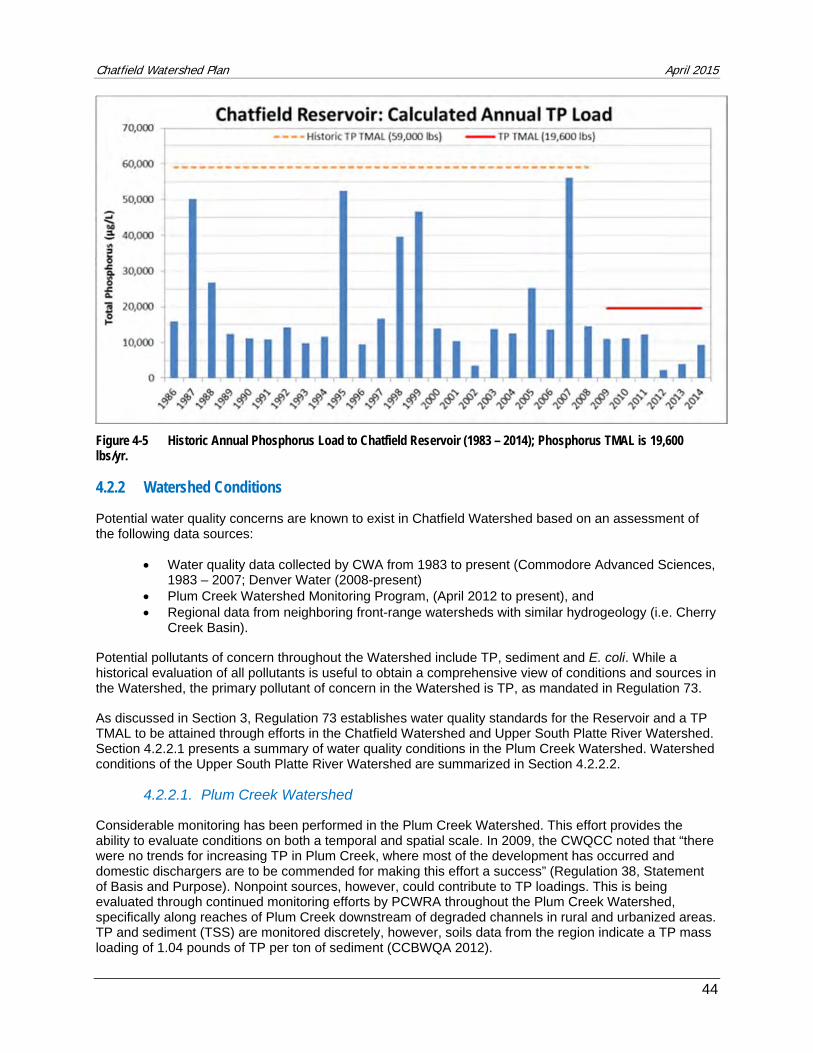
Chatfield Watershed Plan April 2015
44
Figure 4-5 Historic Annual Phosphorus Load to Chatfield Reservoir (1983 – 2014); Phosphorus TMAL is 19,600 lbs/yr.
4.2.2 Watershed Conditions
Potential water quality concerns are known to exist in Chatfield Watershed based on an assessment of the following data sources:
Water quality data collected by CWA from 1983 to present (Commodore Advanced Sciences, 1983 – 2007; Denver Water (2008-present)
Plum Creek Watershed Monitoring Program, (April 2012 to present), and Regional data from neighboring front-range watersheds with similar hydrogeology (i.e. Cherry
Creek Basin).
Potential pollutants of concern throughout the Watershed include TP, sediment and E. coli. While a historical evaluation of all pollutants is useful to obtain a comprehensive view of conditions and sources in the Watershed, the primary pollutant of concern in the Watershed is TP, as mandated in Regulation 73.
As discussed in Section 3, Regulation 73 establishes water quality standards for the Reservoir and a TP TMAL to be attained through efforts in the Chatfield Watershed and Upper South Platte River Watershed. Section 4.2.2.1 presents a summary of water quality conditions in the Plum Creek Watershed. Watershed conditions of the Upper South Platte River Watershed are summarized in Section 4.2.2.2.
4.2.2.1. Plum Creek Watershed
Considerable monitoring has been performed in the Plum Creek Watershed. This effort provides the ability to evaluate conditions on both a temporal and spatial scale. In 2009, the CWQCC noted that “there were no trends for increasing TP in Plum Creek, where most of the development has occurred and domestic dischargers are to be commended for making this effort a success” (Regulation 38, Statement of Basis and Purpose). Nonpoint sources, however, could contribute to TP loadings. This is being evaluated through continued monitoring efforts by PCWRA throughout the Plum Creek Watershed, specifically along reaches of Plum Creek downstream of degraded channels in rural and urbanized areas. TP and sediment (TSS) are monitored discretely, however, soils data from the region indicate a TP mass loading of 1.04 pounds of TP per ton of sediment (CCBWQA 2012).
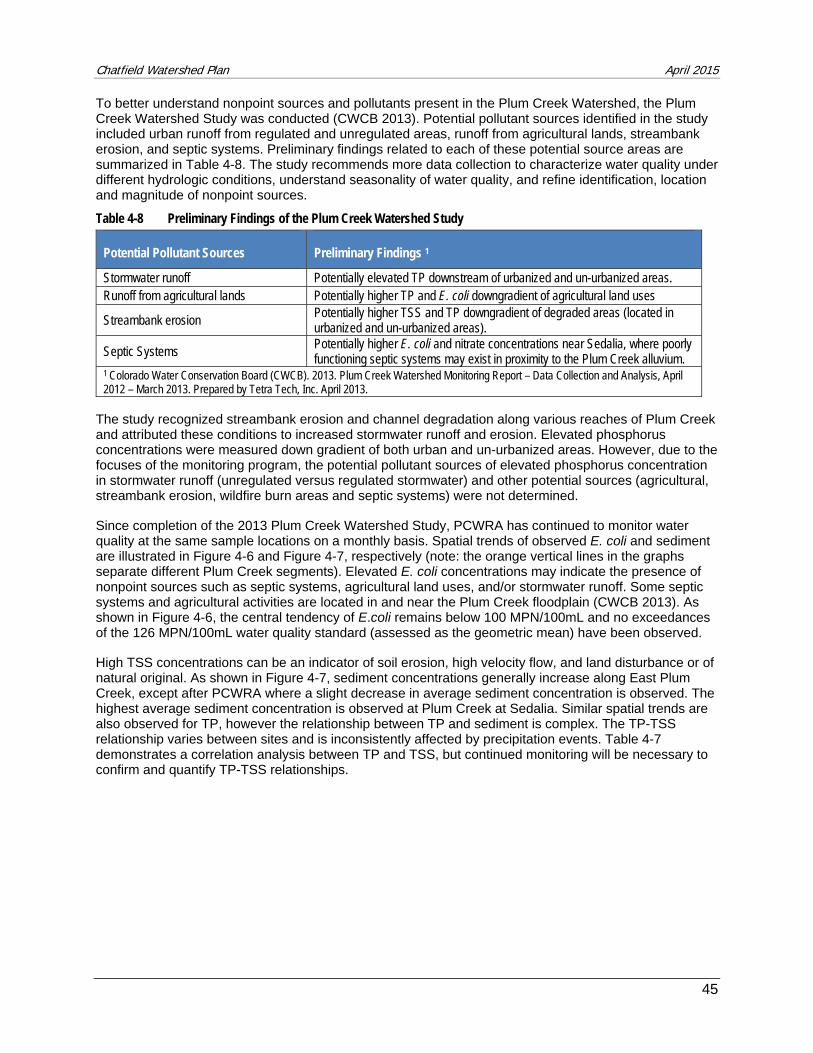
Chatfield Watershed Plan April 2015
45
To better understand nonpoint sources and pollutants present in the Plum Creek Watershed, the Plum Creek Watershed Study was conducted (CWCB 2013). Potential pollutant sources identified in the study included urban runoff from regulated and unregulated areas, runoff from agricultural lands, streambank erosion, and septic systems. Preliminary findings related to each of these potential source areas are summarized in Table 4-8. The study recommends more data collection to characterize water quality under different hydrologic conditions, understand seasonality of water quality, and refine identification, location and magnitude of nonpoint sources.
Table 4-8 Preliminary Findings of the Plum Creek Watershed Study
Potential Pollutant Sources Preliminary Findings 1
Stormwater runoff Potentially elevated TP downstream of urbanized and un-urbanized areas. Runoff from agricultural lands Potentially higher TP and E. coli downgradient of agricultural land uses
Streambank erosion Potentially higher TSS and TP downgradient of degraded areas (located in urbanized and un-urbanized areas).
Septic Systems Potentially higher E. coli and nitrate concentrations near Sedalia, where poorly functioning septic systems may exist in proximity to the Plum Creek alluvium.
1 Colorado Water Conservation Board (CWCB). 2013. Plum Creek Watershed Monitoring Report – Data Collection and Analysis, April 2012 – March 2013. Prepared by Tetra Tech, Inc. April 2013.
The study recognized streambank erosion and channel degradation along various reaches of Plum Creek and attributed these conditions to increased stormwater runoff and erosion. Elevated phosphorus concentrations were measured down gradient of both urban and un-urbanized areas. However, due to the focuses of the monitoring program, the potential pollutant sources of elevated phosphorus concentration in stormwater runoff (unregulated versus regulated stormwater) and other potential sources (agricultural, streambank erosion, wildfire burn areas and septic systems) were not determined.
Since completion of the 2013 Plum Creek Watershed Study, PCWRA has continued to monitor water quality at the same sample locations on a monthly basis. Spatial trends of observed E. coli and sediment are illustrated in Figure 4-6 and Figure 4-7, respectively (note: the orange vertical lines in the graphs separate different Plum Creek segments). Elevated E. coli concentrations may indicate the presence of nonpoint sources such as septic systems, agricultural land uses, and/or stormwater runoff. Some septic systems and agricultural activities are located in and near the Plum Creek floodplain (CWCB 2013). As shown in Figure 4-6, the central tendency of E.coli remains below 100 MPN/100mL and no exceedances of the 126 MPN/100mL water quality standard (assessed as the geometric mean) have been observed.
High TSS concentrations can be an indicator of soil erosion, high velocity flow, and land disturbance or of natural original. As shown in Figure 4-7, sediment concentrations generally increase along East Plum Creek, except after PCWRA where a slight decrease in average sediment concentration is observed. The highest average sediment concentration is observed at Plum Creek at Sedalia. Similar spatial trends are also observed for TP, however the relationship between TP and sediment is complex. The TP-TSS relationship varies between sites and is inconsistently affected by precipitation events. Table 4-7 demonstrates a correlation analysis between TP and TSS, but continued monitoring will be necessary to confirm and quantify TP-TSS relationships.
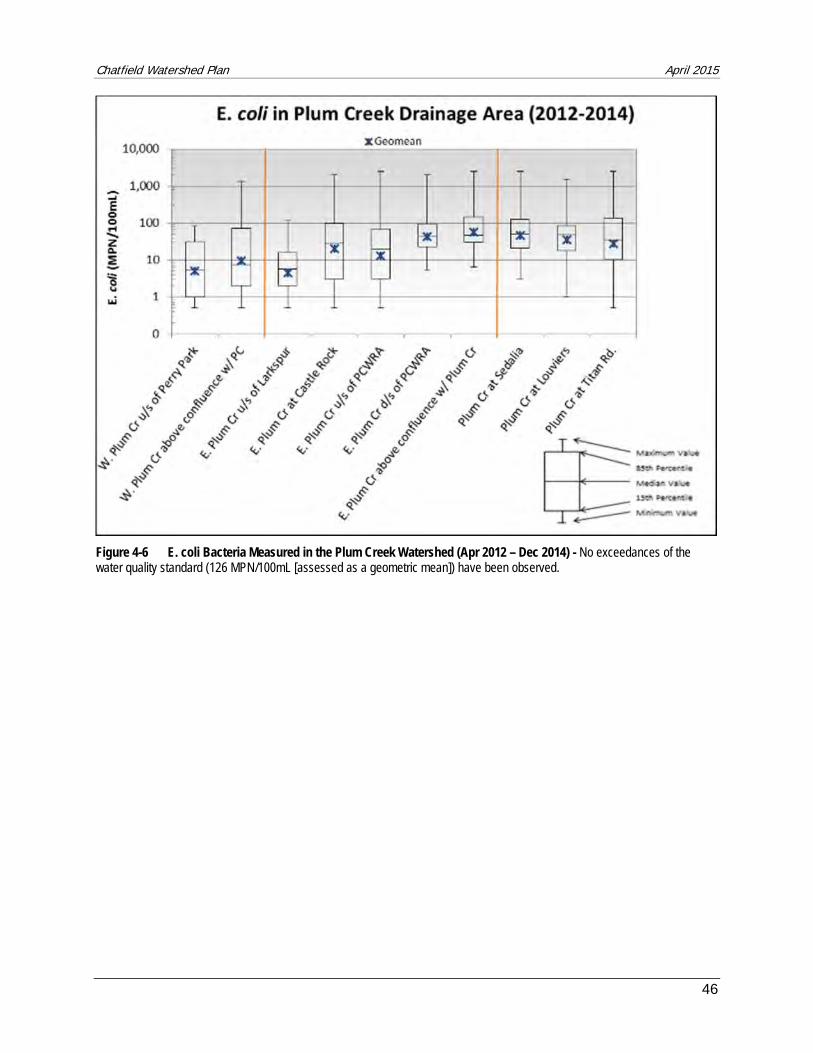
Chatfield Watershed Plan April 2015
46
Figure 4-6 E. coli Bacteria Measured in the Plum Creek Watershed (Apr 2012 – Dec 2014) - No exceedances of the water quality standard (126 MPN/100mL [assessed as a geometric mean]) have been observed.
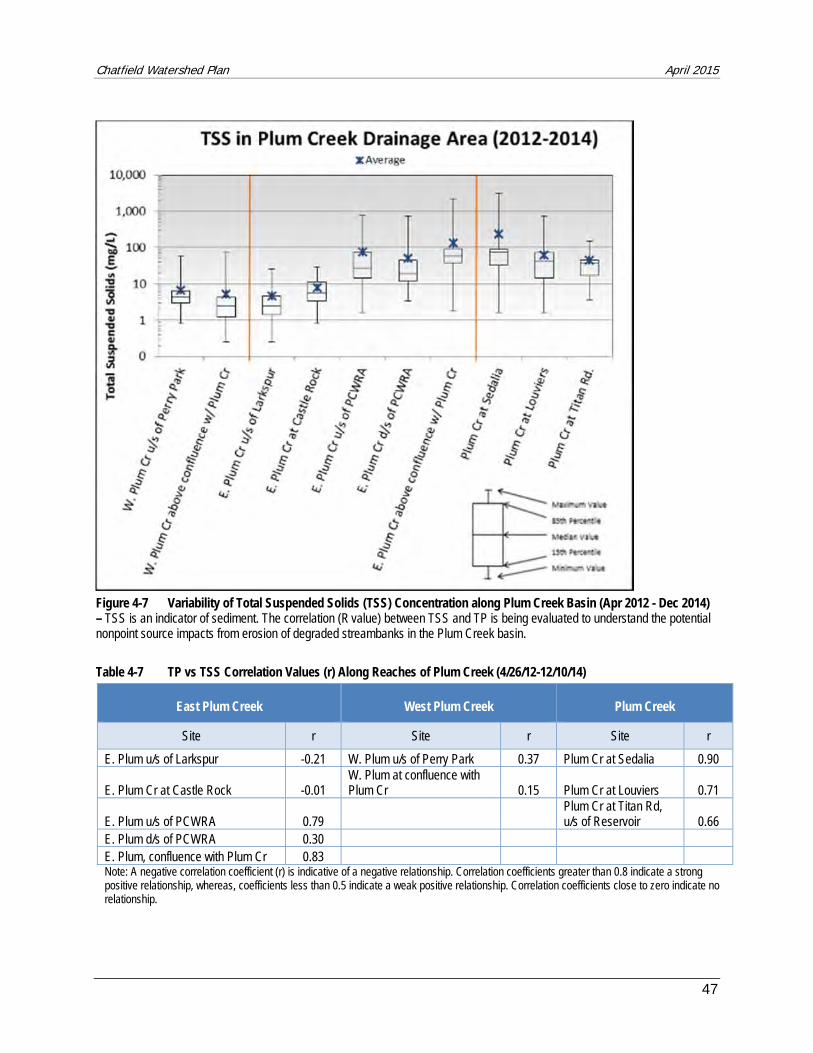
Chatfield Watershed Plan April 2015
47
Figure 4-7 Variability of Total Suspended Solids (TSS) Concentration along Plum Creek Basin (Apr 2012 - Dec 2014) – TSS is an indicator of sediment. The correlation (R value) between TSS and TP is being evaluated to understand the potential nonpoint source impacts from erosion of degraded streambanks in the Plum Creek basin.
Table 4-7 TP vs TSS Correlation Values (r) Along Reaches of Plum Creek (4/26/12-12/10/14)
East Plum Creek West Plum Creek Plum Creek
Site r Site r Site r
E. Plum u/s of Larkspur -0.21 W. Plum u/s of Perry Park 0.37 Plum Cr at Sedalia 0.90
E. Plum Cr at Castle Rock -0.01 W. Plum at confluence with Plum Cr 0.15 Plum Cr at Louviers 0.71
E. Plum u/s of PCWRA 0.79 Plum Cr at Titan Rd, u/s of Reservoir 0.66
E. Plum d/s of PCWRA 0.30 E. Plum, confluence with Plum Cr 0.83 Note: A negative correlation coefficient (r) is indicative of a negative relationship. Correlation coefficients greater than 0.8 indicate a strong positive relationship, whereas, coefficients less than 0.5 indicate a weak positive relationship. Correlation coefficients close to zero indicate no relationship.
Chatfield Watershed Plan April 2015
48
4.2.2.2. Upper South Platte River Watershed
The Upper South Platte River Watershed, above Strontia Springs Reservoir, is the second drainage area contributing to Chatfield Reservoir, as recognized by Regulation 73. In 2006, a watershed plan was revised by CUSP to identify issues within the Watershed, outline goals and strategize efforts. Priority pollutants within the Upper South Platte River Watershed include sediment (of natural and anthropogenic origin), nutrients (phosphorus and nitrogen), metals and acid mine drainage, and, to a lesser extent, bacteria (CUSP 2006). The plan identifies high priorities (e.g., agriculture, wildfire, land use and development) and low priorities (e.g., solid and hazardous waste, spills/illegal dumping, and stormwater runoff) to frame strategies and objectives and address pollutants of concerns collectively. Efforts to improve water quality in the Upper South Platte River Watershed benefit downstream systems including the South Platte River below Strontia Springs Reservoir and the Chatfield Reservoir.
In the 2006 Watershed Plan, CUSP acknowledges phosphorus as a pollutant of focus as there is a flow-adjusted annual allocation established by the CWQCC in the Chatfield Reservoir Control Regulation (Regulation 73) (CUSP 2006). Although the plan does not specify sources of phosphorus within the Upper South Platte River Watershed, observed TP at South Platte River at Waterton Canyon have shown elevated concentrations following large wildfires (Figure 4-8). Since 2006, observed TP concentrations have also been on the decline. Before 2006 observed TP concentrations averaged 31.0 µg/L, whereas more recent TP concentrations observed between 2006 and 2014 averaged 13.1 µg/L. The average TP concentration observed over the entire 1986-2014 period is 25.5 µg/L. In reviewing TP concentrations observed during the summer season months (April through September) from 1986 through 2014, the annual summer season average is 26.1 µg/L in the South Platte River at Waterton Canyon. TP loads from the Upper South Platte River Watershed are discussed in Section 4.2.3.
Figure 4-8 Observed TP concentrations and growing season averages in South Platte R. at Waterton Canyon.
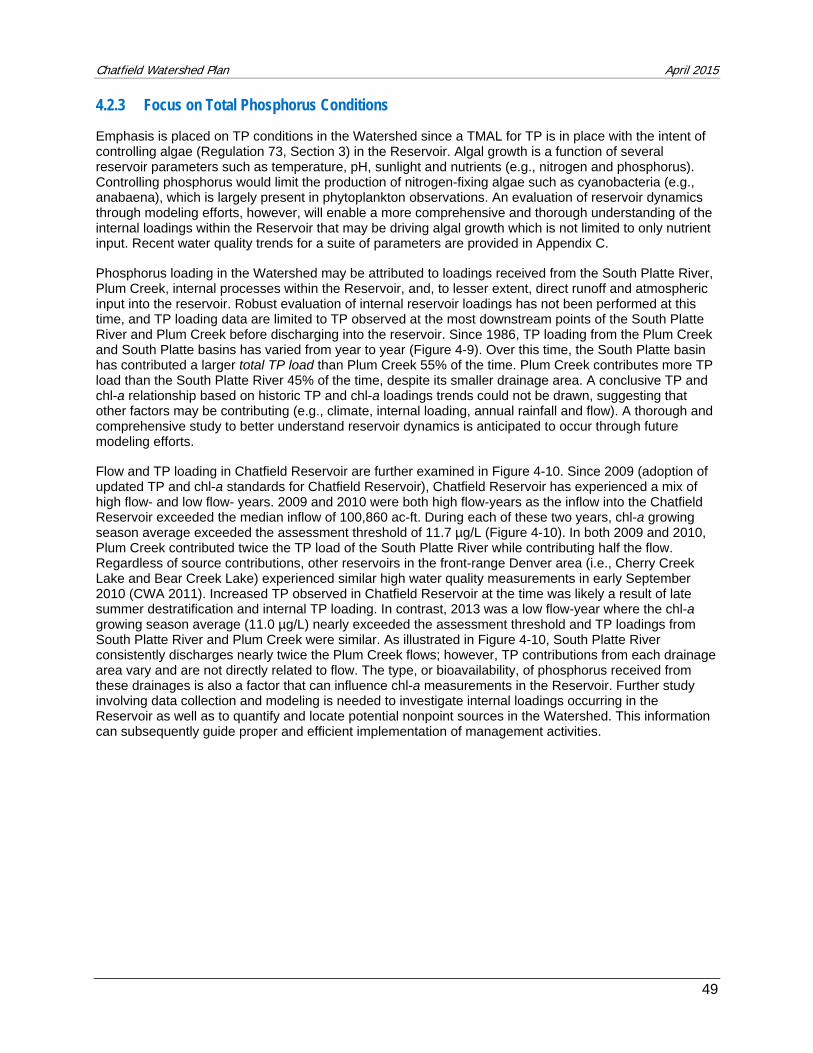
Chatfield Watershed Plan April 2015
49
4.2.3 Focus on Total Phosphorus Conditions
Emphasis is placed on TP conditions in the Watershed since a TMAL for TP is in place with the intent of controlling algae (Regulation 73, Section 3) in the Reservoir. Algal growth is a function of several reservoir parameters such as temperature, pH, sunlight and nutrients (e.g., nitrogen and phosphorus). Controlling phosphorus would limit the production of nitrogen-fixing algae such as cyanobacteria (e.g., anabaena), which is largely present in phytoplankton observations. An evaluation of reservoir dynamics through modeling efforts, however, will enable a more comprehensive and thorough understanding of the internal loadings within the Reservoir that may be driving algal growth which is not limited to only nutrient input. Recent water quality trends for a suite of parameters are provided in Appendix C.
Phosphorus loading in the Watershed may be attributed to loadings received from the South Platte River, Plum Creek, internal processes within the Reservoir, and, to lesser extent, direct runoff and atmospheric input into the reservoir. Robust evaluation of internal reservoir loadings has not been performed at this time, and TP loading data are limited to TP observed at the most downstream points of the South Platte River and Plum Creek before discharging into the reservoir. Since 1986, TP loading from the Plum Creek and South Platte basins has varied from year to year (Figure 4-9). Over this time, the South Platte basin has contributed a larger total TP load than Plum Creek 55% of the time. Plum Creek contributes more TP load than the South Platte River 45% of the time, despite its smaller drainage area. A conclusive TP and chl-a relationship based on historic TP and chl-a loadings trends could not be drawn, suggesting that other factors may be contributing (e.g., climate, internal loading, annual rainfall and flow). A thorough and comprehensive study to better understand reservoir dynamics is anticipated to occur through future modeling efforts.
Flow and TP loading in Chatfield Reservoir are further examined in Figure 4-10. Since 2009 (adoption of updated TP and chl-a standards for Chatfield Reservoir), Chatfield Reservoir has experienced a mix of high flow- and low flow- years. 2009 and 2010 were both high flow-years as the inflow into the Chatfield Reservoir exceeded the median inflow of 100,860 ac-ft. During each of these two years, chl-a growing season average exceeded the assessment threshold of 11.7 µg/L (Figure 4-10). In both 2009 and 2010, Plum Creek contributed twice the TP load of the South Platte River while contributing half the flow. Regardless of source contributions, other reservoirs in the front-range Denver area (i.e., Cherry Creek Lake and Bear Creek Lake) experienced similar high water quality measurements in early September 2010 (CWA 2011). Increased TP observed in Chatfield Reservoir at the time was likely a result of late summer destratification and internal TP loading. In contrast, 2013 was a low flow-year where the chl-a growing season average (11.0 µg/L) nearly exceeded the assessment threshold and TP loadings from South Platte River and Plum Creek were similar. As illustrated in Figure 4-10, South Platte River consistently discharges nearly twice the Plum Creek flows; however, TP contributions from each drainage area vary and are not directly related to flow. The type, or bioavailability, of phosphorus received from these drainages is also a factor that can influence chl-a measurements in the Reservoir. Further study involving data collection and modeling is needed to investigate internal loadings occurring in the Reservoir as well as to quantify and locate potential nonpoint sources in the Watershed. This information can subsequently guide proper and efficient implementation of management activities.
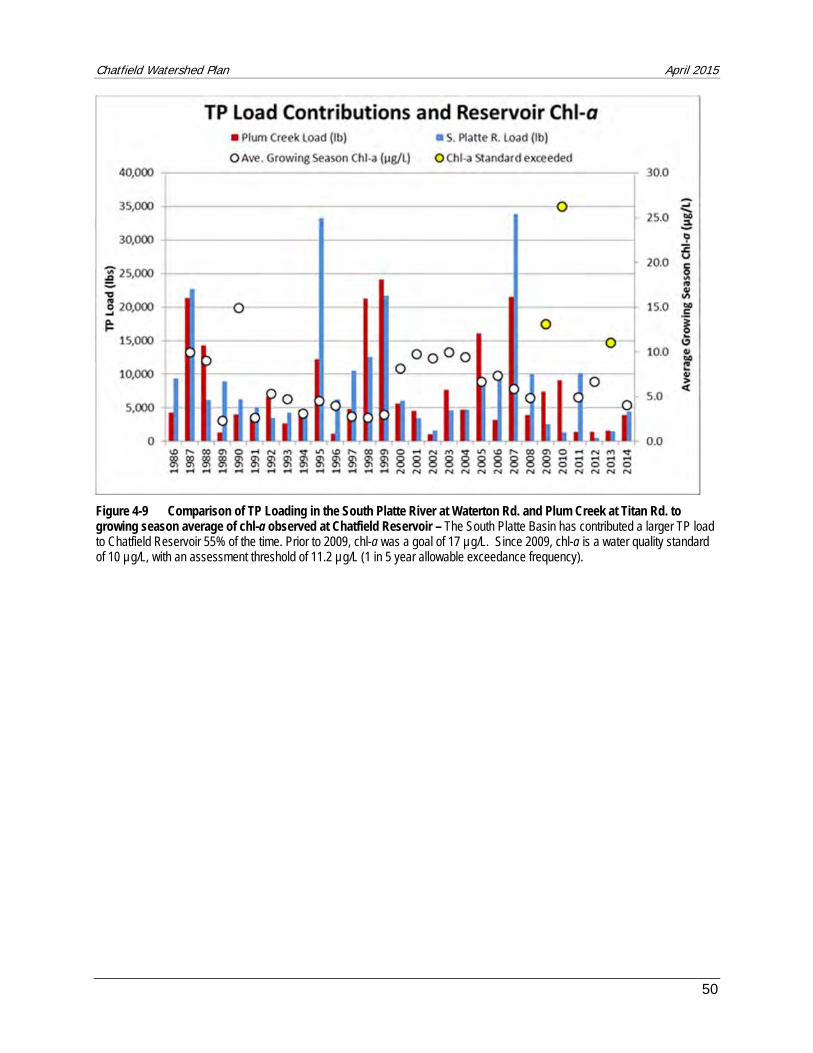
Chatfield Watershed Plan April 2015
50
Figure 4-9 Comparison of TP Loading in the South Platte River at Waterton Rd. and Plum Creek at Titan Rd. to growing season average of chl-a observed at Chatfield Reservoir – The South Platte Basin has contributed a larger TP load to Chatfield Reservoir 55% of the time. Prior to 2009, chl-a was a goal of 17 µg/L. Since 2009, chl-a is a water quality standard of 10 µg/L, with an assessment threshold of 11.2 µg/L (1 in 5 year allowable exceedance frequency).
Chatfield Watershed Plan April 2015
51
Figure 4-10 Annual Flow and TP Loading in the South Platte River at Waterton Rd. and Plum Creek at Titan Rd.
Chatfield Watershed Plan April 2015
52
5. Pollutant Source Assessment and Linkage to Water Quality
Point and nonpoint sources affect water quality in the Chatfield Watershed. Point sources have a track record of compliance with their discharge permits. Regulated stormwater sources (MS4s) are managing regulated stormwater runoff in accordance with permit requirements, as are WWTFs that discharge effluent in compliance with permit limits. Nonpoint sources are generally less managed and have a greater potential impact on water quality in the Watershed. The presence of these sources and the extent of their respective influence on water quality in the Chatfield Watershed are presented in the following sections.
5.1 Agricultural Activities
Agricultural activities covers all activities involved with farming and ranching and can include rural farming, livestock operations, tilling, planting, harvesting, and irrigation. These activities can potentially contribute nutrients, sediment, animal wastes, salts, and pesticides. The Chatfield Watershed is largely agricultural and semi-rural, especially in the upper portions of the Watershed in the Plum Creek drainage area. Agricultural areas in the Watershed consist largely of rural properties, family-owned operations with limited number of head of cattle and horses, rescue horse ranches, farming operations, kennel operations, dude ranches, and ranches/ranchettes with pasture and livestock. There are no Concentrated Animal Feeding Operations (CAFOs) or animal feeding operations (AFOs)1 located in the Watershed.
5.1.1 Agricultural Zone Districts
Agricultural zoned areas within the Chatfield Watershed are depicted in Figure 5-1. These are areas where small scale agricultural farming and ranching activities are allowed and may exist.
1 AFO’s are facilities where animals are confined for at least 45 days in any 12-month period in an area that does not sustain crops or other vegetation while the animals are confined.
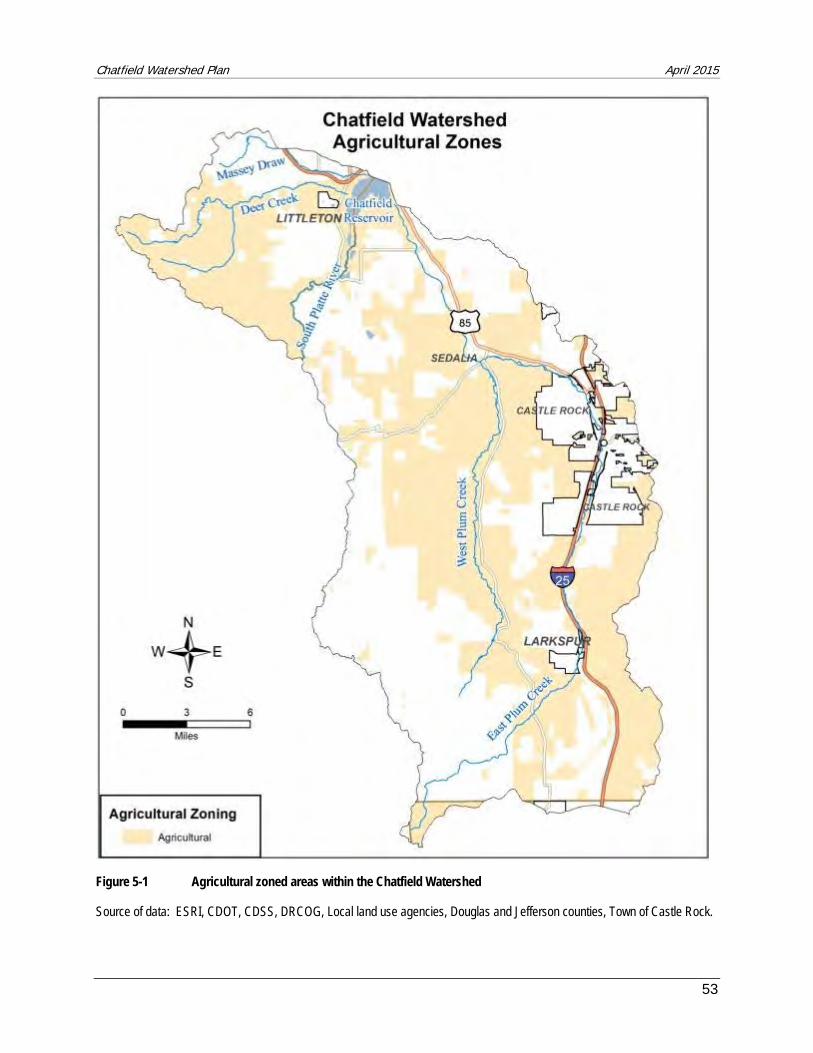
Chatfield Watershed Plan April 2015
53
Figure 5-1 Agricultural zoned areas within the Chatfield Watershed
Source of data: ESRI, CDOT, CDSS, DRCOG, Local land use agencies, Douglas and Jefferson counties, Town of Castle Rock.
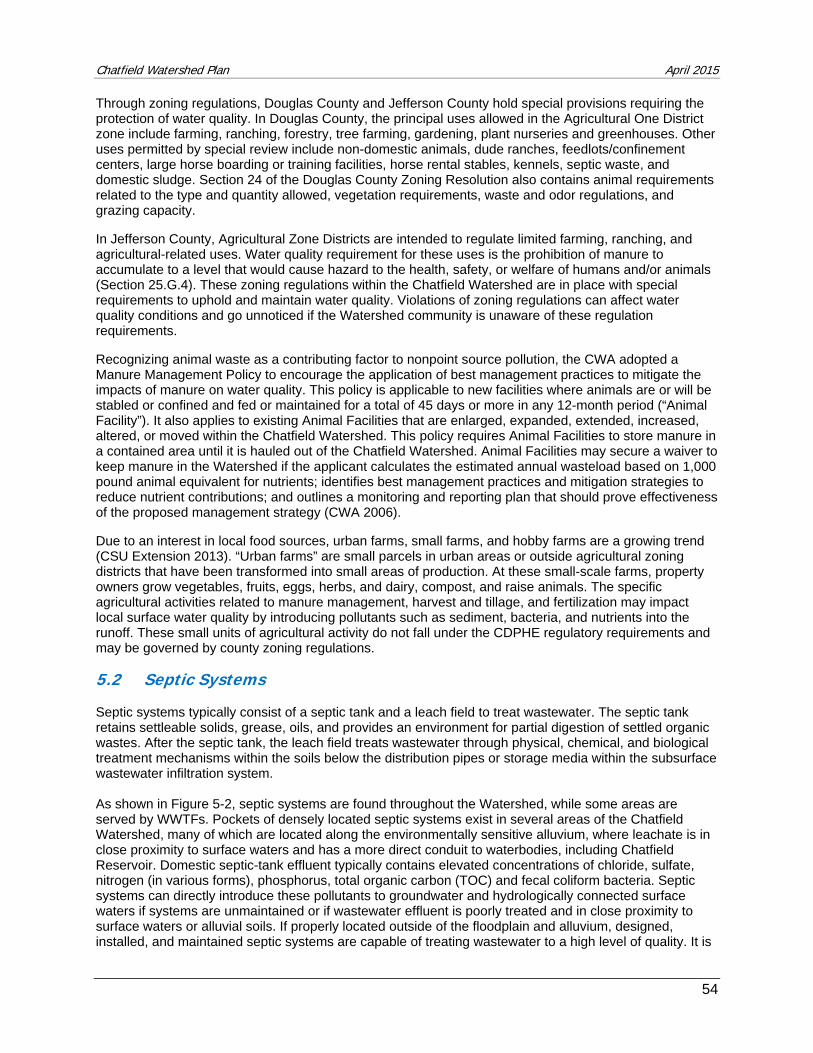
Chatfield Watershed Plan April 2015
54
Through zoning regulations, Douglas County and Jefferson County hold special provisions requiring the protection of water quality. In Douglas County, the principal uses allowed in the Agricultural One District zone include farming, ranching, forestry, tree farming, gardening, plant nurseries and greenhouses. Other uses permitted by special review include non-domestic animals, dude ranches, feedlots/confinement centers, large horse boarding or training facilities, horse rental stables, kennels, septic waste, and domestic sludge. Section 24 of the Douglas County Zoning Resolution also contains animal requirements related to the type and quantity allowed, vegetation requirements, waste and odor regulations, and grazing capacity.
In Jefferson County, Agricultural Zone Districts are intended to regulate limited farming, ranching, and agricultural-related uses. Water quality requirement for these uses is the prohibition of manure to accumulate to a level that would cause hazard to the health, safety, or welfare of humans and/or animals (Section 25.G.4). These zoning regulations within the Chatfield Watershed are in place with special requirements to uphold and maintain water quality. Violations of zoning regulations can affect water quality conditions and go unnoticed if the Watershed community is unaware of these regulation requirements.
Recognizing animal waste as a contributing factor to nonpoint source pollution, the CWA adopted a Manure Management Policy to encourage the application of best management practices to mitigate the impacts of manure on water quality. This policy is applicable to new facilities where animals are or will be stabled or confined and fed or maintained for a total of 45 days or more in any 12-month period (“Animal Facility”). It also applies to existing Animal Facilities that are enlarged, expanded, extended, increased, altered, or moved within the Chatfield Watershed. This policy requires Animal Facilities to store manure in a contained area until it is hauled out of the Chatfield Watershed. Animal Facilities may secure a waiver to keep manure in the Watershed if the applicant calculates the estimated annual wasteload based on 1,000 pound animal equivalent for nutrients; identifies best management practices and mitigation strategies to reduce nutrient contributions; and outlines a monitoring and reporting plan that should prove effectiveness of the proposed management strategy (CWA 2006).
Due to an interest in local food sources, urban farms, small farms, and hobby farms are a growing trend (CSU Extension 2013). “Urban farms” are small parcels in urban areas or outside agricultural zoning districts that have been transformed into small areas of production. At these small-scale farms, property owners grow vegetables, fruits, eggs, herbs, and dairy, compost, and raise animals. The specific agricultural activities related to manure management, harvest and tillage, and fertilization may impact local surface water quality by introducing pollutants such as sediment, bacteria, and nutrients into the runoff. These small units of agricultural activity do not fall under the CDPHE regulatory requirements and may be governed by county zoning regulations.
5.2 Septic Systems
Septic systems typically consist of a septic tank and a leach field to treat wastewater. The septic tank retains settleable solids, grease, oils, and provides an environment for partial digestion of settled organic wastes. After the septic tank, the leach field treats wastewater through physical, chemical, and biological treatment mechanisms within the soils below the distribution pipes or storage media within the subsurface wastewater infiltration system. As shown in Figure 5-2, septic systems are found throughout the Watershed, while some areas are served by WWTFs. Pockets of densely located septic systems exist in several areas of the Chatfield Watershed, many of which are located along the environmentally sensitive alluvium, where leachate is in close proximity to surface waters and has a more direct conduit to waterbodies, including Chatfield Reservoir. Domestic septic-tank effluent typically contains elevated concentrations of chloride, sulfate, nitrogen (in various forms), phosphorus, total organic carbon (TOC) and fecal coliform bacteria. Septic systems can directly introduce these pollutants to groundwater and hydrologically connected surface waters if systems are unmaintained or if wastewater effluent is poorly treated and in close proximity to surface waters or alluvial soils. If properly located outside of the floodplain and alluvium, designed, installed, and maintained septic systems are capable of treating wastewater to a high level of quality. It is
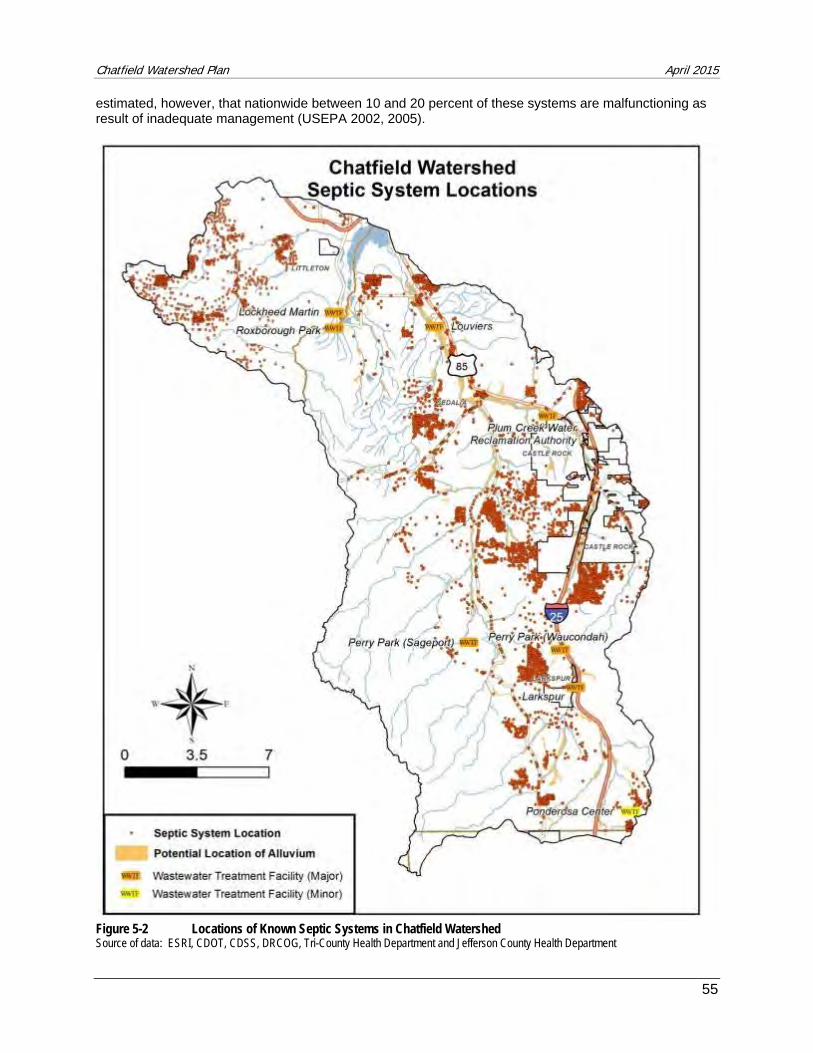
Chatfield Watershed Plan April 2015
55
estimated, however, that nationwide between 10 and 20 percent of these systems are malfunctioning as result of inadequate management (USEPA 2002, 2005).
Figure 5-2 Locations of Known Septic Systems in Chatfield Watershed Source of data: ESRI, CDOT, CDSS, DRCOG, Tri-County Health Department and Jefferson County Health Department
Chatfield Watershed Plan April 2015
56
The 2013 Plum Creek Watershed Monitoring Study identified water quality impacts potentially caused by septic systems along Plum Creek. Higher E. coli concentrations were observed along reaches of Plum Creek where potentially unmaintained septic systems are located in the floodplain, however, data assessed as the geometric mean remains below the E.coli standard. There may be bacteria and nutrient loading from these sources, but further investigation is warranted to conclusively determine the specific source(s) and attempt to quantify the associated pollutant loading from septic systems.
In the adjacent Cherry Creek Watershed, studies were performed to assess the contributions of septic systems to the Cherry Creek alluvium (Halepaska 1998). Based in part on information from the Cherry Creek Basin that demonstrates that effluent from septic system leachate that is located within the alluvial corridors (proximate to the stream) contributed pollutants to the waters, the CWQCC and Colorado Board of Public Health adopted restrictions on locations of septic systems proximate to stream corridors and alluvial floodplains.
5.3 Streambank Erosion
Natural streams or channels in the Chatfield Watershed, such as East Plum Creek, West Plum Creek, Plum Creek, Massey Draw, and Deer Creek, consist of movable streambed that transition over time. A natural flowing stream supports sediment transport in equilibrium, with no long-term trend towards aggregation or degradation (USBR 1987). Alterations to natural streams can be observed by changes in physical channel characteristics (e.g., channel bank width, slope, and depth), flow, and sediment loading. Such alterations can be a result of wildfires, agricultural activities, flash floods, or excessive runoff. Regardless of cause, streambank erosion can contribute large quantities of sediment and nutrients to the drainage system.
Areas of streambank erosion can be sources of sediment and other sediment-laden constituents such as phosphorus which is naturally occurring in marine shale and geologic formations. Based on local data from the Chatfield Watershed, Cherry Creek Basin and regional hydrogeology, soils are naturally high in phosphorus and, therefore, their deposition in receiving waters results in elevated levels of total and dissolved phosphorus. A high correlation between total suspended solids (TSS) and TP concentration has been observed in specific reaches along Plum Creek (CWCB 2013), where streambank erosion occurs.
In the Chatfield Watershed, streambank erosion affects water quality. Plum Creek near its confluence with Chatfield Reservoir has recently exhibited significant streambank erosion and cut slopes. Other profound examples of streambank erosion include reaches of Massey Draw (Figure 5-3), located on the northwestern end of the Watershed.
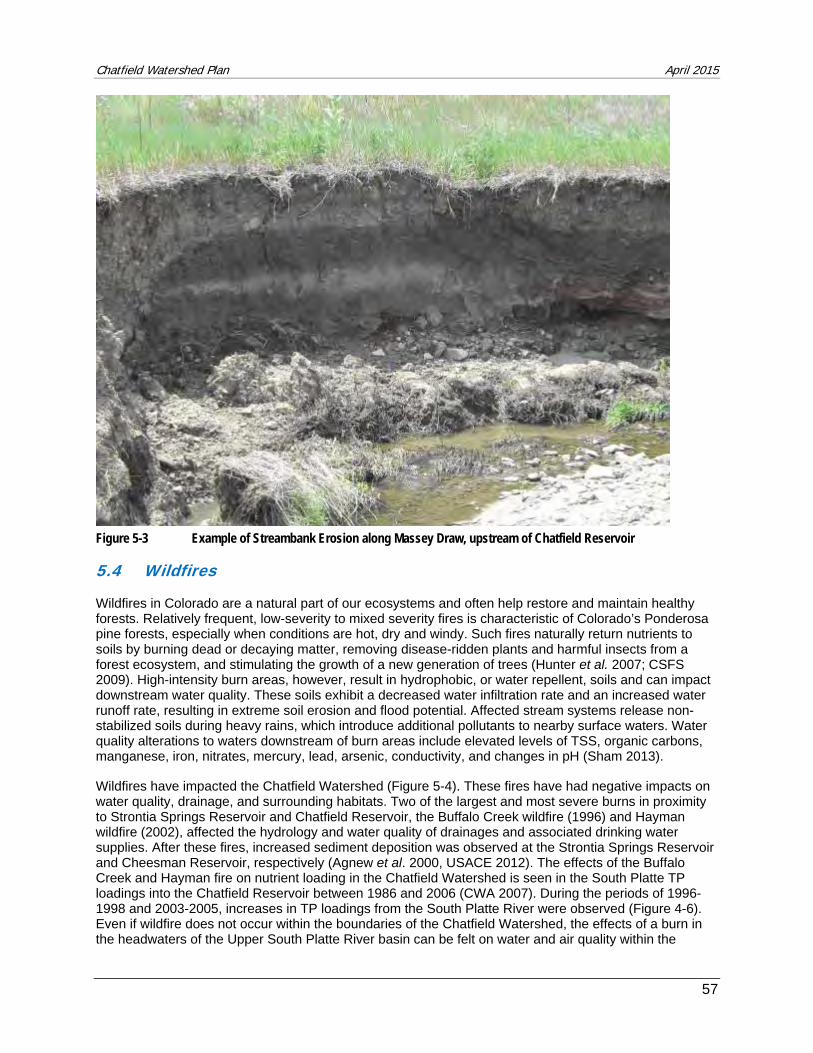
Chatfield Watershed Plan April 2015
57
Figure 5-3 Example of Streambank Erosion along Massey Draw, upstream of Chatfield Reservoir
5.4 Wildfires
Wildfires in Colorado are a natural part of our ecosystems and often help restore and maintain healthy forests. Relatively frequent, low-severity to mixed severity fires is characteristic of Colorado’s Ponderosa pine forests, especially when conditions are hot, dry and windy. Such fires naturally return nutrients to soils by burning dead or decaying matter, removing disease-ridden plants and harmful insects from a forest ecosystem, and stimulating the growth of a new generation of trees (Hunter et al. 2007; CSFS 2009). High-intensity burn areas, however, result in hydrophobic, or water repellent, soils and can impact downstream water quality. These soils exhibit a decreased water infiltration rate and an increased water runoff rate, resulting in extreme soil erosion and flood potential. Affected stream systems release non-stabilized soils during heavy rains, which introduce additional pollutants to nearby surface waters. Water quality alterations to waters downstream of burn areas include elevated levels of TSS, organic carbons, manganese, iron, nitrates, mercury, lead, arsenic, conductivity, and changes in pH (Sham 2013).
Wildfires have impacted the Chatfield Watershed (Figure 5-4). These fires have had negative impacts on water quality, drainage, and surrounding habitats. Two of the largest and most severe burns in proximity to Strontia Springs Reservoir and Chatfield Reservoir, the Buffalo Creek wildfire (1996) and Hayman wildfire (2002), affected the hydrology and water quality of drainages and associated drinking water supplies. After these fires, increased sediment deposition was observed at the Strontia Springs Reservoir and Cheesman Reservoir, respectively (Agnew et al. 2000, USACE 2012). The effects of the Buffalo Creek and Hayman fire on nutrient loading in the Chatfield Watershed is seen in the South Platte TP loadings into the Chatfield Reservoir between 1986 and 2006 (CWA 2007). During the periods of 1996-1998 and 2003-2005, increases in TP loadings from the South Platte River were observed (Figure 4-6). Even if wildfire does not occur within the boundaries of the Chatfield Watershed, the effects of a burn in the headwaters of the Upper South Platte River basin can be felt on water and air quality within the
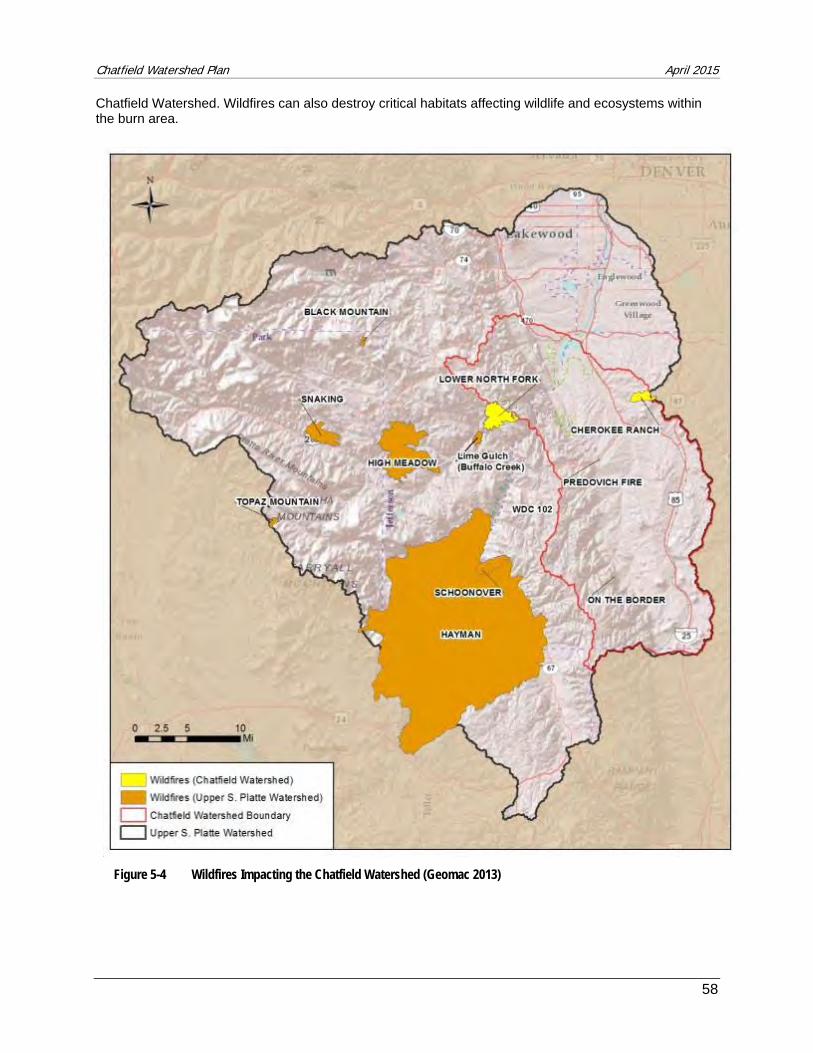
Chatfield Watershed Plan April 2015
58
Chatfield Watershed. Wildfires can also destroy critical habitats affecting wildlife and ecosystems within the burn area.
Figure 5-4 Wildfires Impacting the Chatfield Watershed (Geomac 2013)
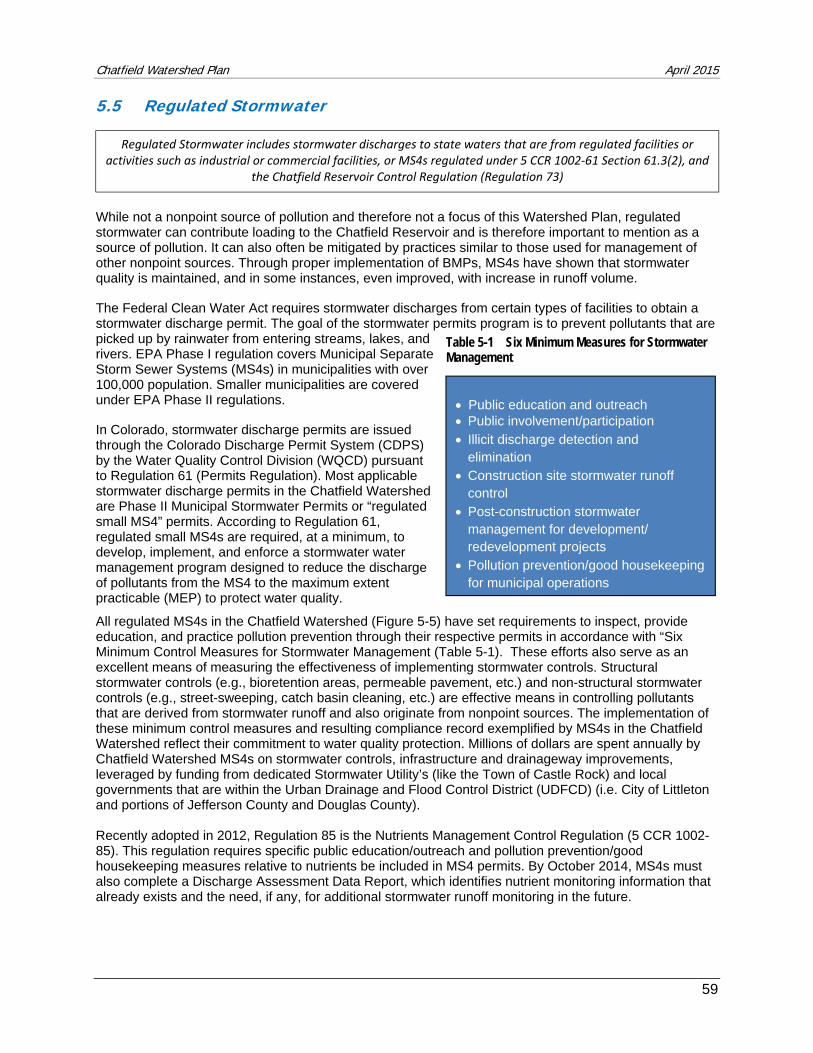
Chatfield Watershed Plan April 2015
59
5.5 Regulated Stormwater
While not a nonpoint source of pollution and therefore not a focus of this Watershed Plan, regulated stormwater can contribute loading to the Chatfield Reservoir and is therefore important to mention as a source of pollution. It can also often be mitigated by practices similar to those used for management of other nonpoint sources. Through proper implementation of BMPs, MS4s have shown that stormwater quality is maintained, and in some instances, even improved, with increase in runoff volume.
The Federal Clean Water Act requires stormwater discharges from certain types of facilities to obtain a stormwater discharge permit. The goal of the stormwater permits program is to prevent pollutants that are picked up by rainwater from entering streams, lakes, and rivers. EPA Phase I regulation covers Municipal Separate Storm Sewer Systems (MS4s) in municipalities with over 100,000 population. Smaller municipalities are covered under EPA Phase II regulations.
In Colorado, stormwater discharge permits are issued through the Colorado Discharge Permit System (CDPS) by the Water Quality Control Division (WQCD) pursuant to Regulation 61 (Permits Regulation). Most applicable stormwater discharge permits in the Chatfield Watershed are Phase II Municipal Stormwater Permits or “regulated small MS4” permits. According to Regulation 61, regulated small MS4s are required, at a minimum, to develop, implement, and enforce a stormwater water management program designed to reduce the discharge of pollutants from the MS4 to the maximum extent practicable (MEP) to protect water quality.
All regulated MS4s in the Chatfield Watershed (Figure 5-5) have set requirements to inspect, provide education, and practice pollution prevention through their respective permits in accordance with “Six Minimum Control Measures for Stormwater Management (Table 5-1). These efforts also serve as an excellent means of measuring the effectiveness of implementing stormwater controls. Structural stormwater controls (e.g., bioretention areas, permeable pavement, etc.) and non-structural stormwater controls (e.g., street-sweeping, catch basin cleaning, etc.) are effective means in controlling pollutants that are derived from stormwater runoff and also originate from nonpoint sources. The implementation of these minimum control measures and resulting compliance record exemplified by MS4s in the Chatfield Watershed reflect their commitment to water quality protection. Millions of dollars are spent annually by Chatfield Watershed MS4s on stormwater controls, infrastructure and drainageway improvements, leveraged by funding from dedicated Stormwater Utility’s (like the Town of Castle Rock) and local governments that are within the Urban Drainage and Flood Control District (UDFCD) (i.e. City of Littleton and portions of Jefferson County and Douglas County). Recently adopted in 2012, Regulation 85 is the Nutrients Management Control Regulation (5 CCR 1002-85). This regulation requires specific public education/outreach and pollution prevention/good housekeeping measures relative to nutrients be included in MS4 permits. By October 2014, MS4s must also complete a Discharge Assessment Data Report, which identifies nutrient monitoring information that already exists and the need, if any, for additional stormwater runoff monitoring in the future.
Regulated Stormwater includes stormwater discharges to state waters that are from regulated facilities or activities such as industrial or commercial facilities, or MS4s regulated under 5 CCR 1002‐61 Section 61.3(2), and
the Chatfield Reservoir Control Regulation (Regulation 73)
Public education and outreach Public involvement/participation Illicit discharge detection and
elimination Construction site stormwater runoff
control Post-construction stormwater
management for development/ redevelopment projects
Pollution prevention/good housekeeping for municipal operations
Table 5-1 Six Minimum Measures for Stormwater Management
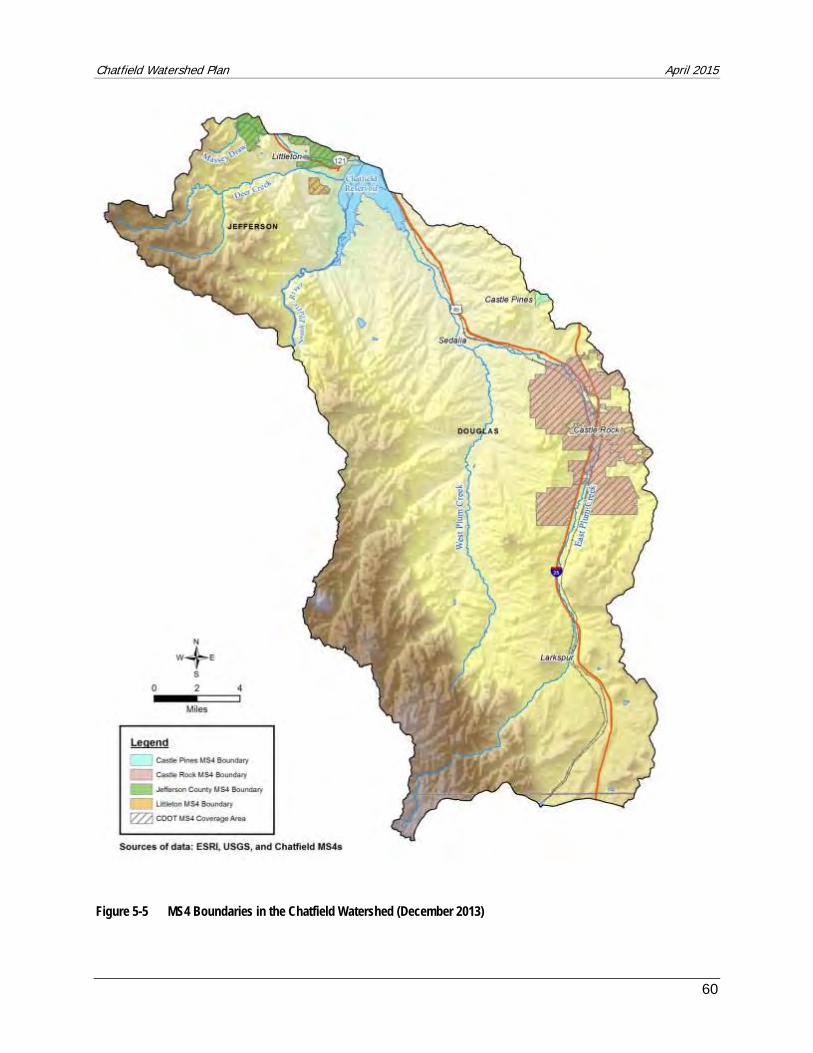
Chatfield Watershed Plan April 2015
60
Figure 5-5 MS4 Boundaries in the Chatfield Watershed (December 2013)
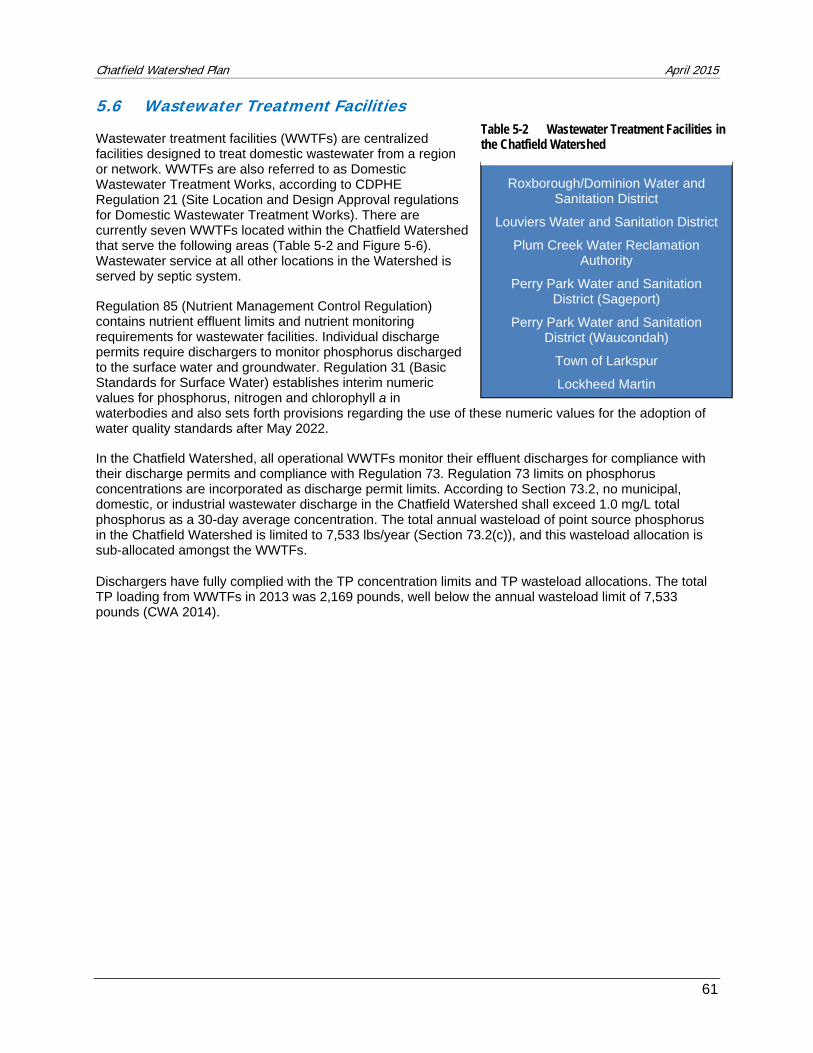
Chatfield Watershed Plan April 2015
61
5.6 Wastewater Treatment Facilities
Wastewater treatment facilities (WWTFs) are centralized facilities designed to treat domestic wastewater from a region or network. WWTFs are also referred to as Domestic Wastewater Treatment Works, according to CDPHE Regulation 21 (Site Location and Design Approval regulations for Domestic Wastewater Treatment Works). There are currently seven WWTFs located within the Chatfield Watershed that serve the following areas (Table 5-2 and Figure 5-6). Wastewater service at all other locations in the Watershed is served by septic system.
Regulation 85 (Nutrient Management Control Regulation) contains nutrient effluent limits and nutrient monitoring requirements for wastewater facilities. Individual discharge permits require dischargers to monitor phosphorus discharged to the surface water and groundwater. Regulation 31 (Basic Standards for Surface Water) establishes interim numeric values for phosphorus, nitrogen and chlorophyll a in waterbodies and also sets forth provisions regarding the use of these numeric values for the adoption of water quality standards after May 2022.
In the Chatfield Watershed, all operational WWTFs monitor their effluent discharges for compliance with their discharge permits and compliance with Regulation 73. Regulation 73 limits on phosphorus concentrations are incorporated as discharge permit limits. According to Section 73.2, no municipal, domestic, or industrial wastewater discharge in the Chatfield Watershed shall exceed 1.0 mg/L total phosphorus as a 30-day average concentration. The total annual wasteload of point source phosphorus in the Chatfield Watershed is limited to 7,533 lbs/year (Section 73.2(c)), and this wasteload allocation is sub-allocated amongst the WWTFs.
Dischargers have fully complied with the TP concentration limits and TP wasteload allocations. The total TP loading from WWTFs in 2013 was 2,169 pounds, well below the annual wasteload limit of 7,533 pounds (CWA 2014).
Roxborough/Dominion Water and Sanitation District
Louviers Water and Sanitation District
Plum Creek Water Reclamation Authority
Perry Park Water and Sanitation District (Sageport)
Perry Park Water and Sanitation District (Waucondah)
Town of Larkspur
Lockheed Martin
Table 5-2 Wastewater Treatment Facilities in the Chatfield Watershed
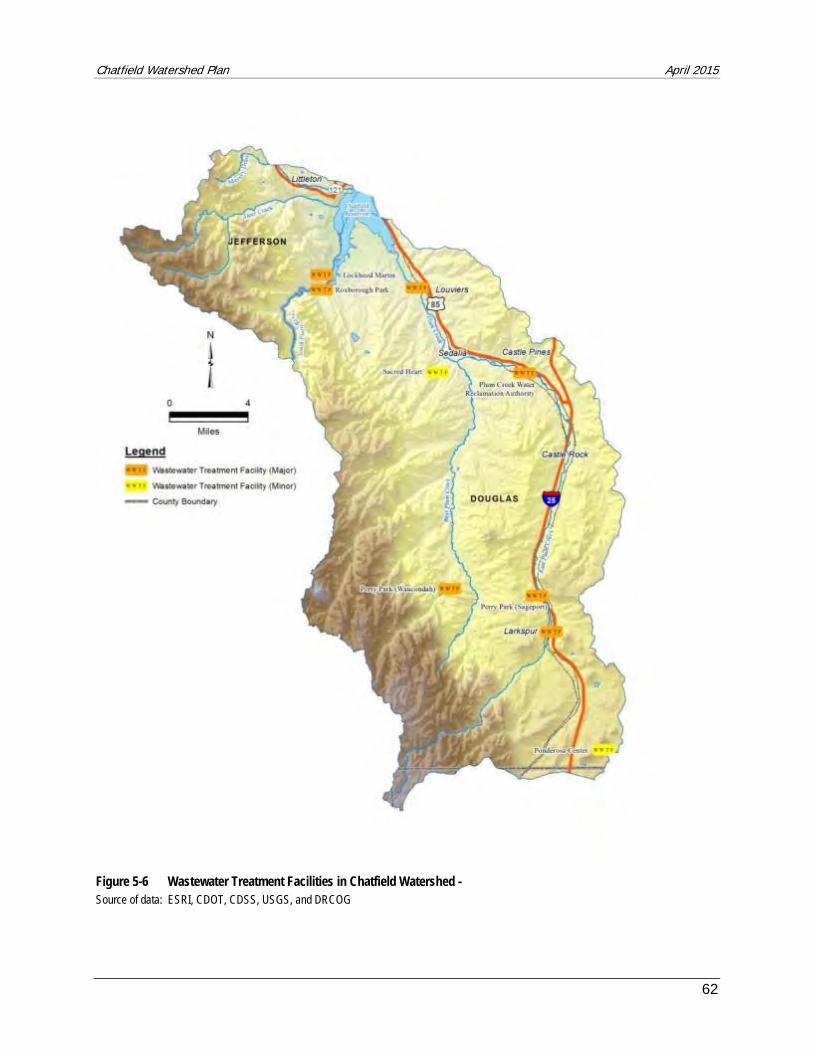
Chatfield Watershed Plan April 2015
62
Figure 5-6 Wastewater Treatment Facilities in Chatfield Watershed - Source of data: ESRI, CDOT, CDSS, USGS, and DRCOG
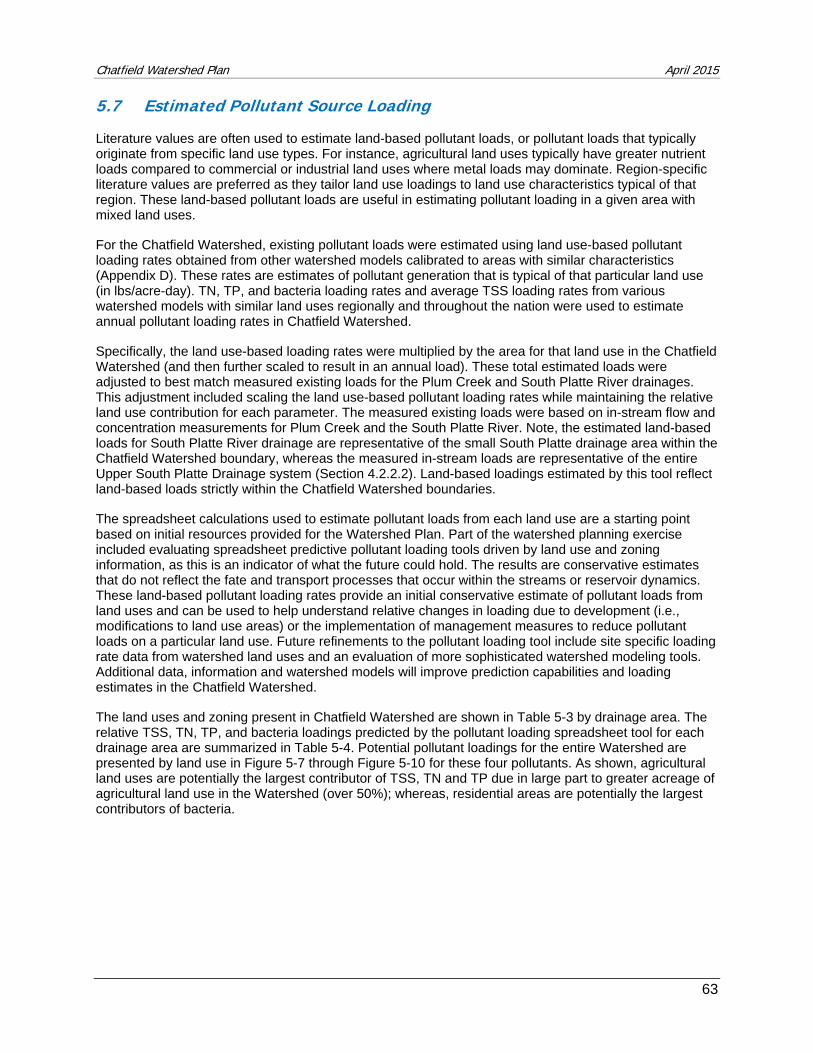
Chatfield Watershed Plan April 2015
63
5.7 Estimated Pollutant Source Loading
Literature values are often used to estimate land-based pollutant loads, or pollutant loads that typically originate from specific land use types. For instance, agricultural land uses typically have greater nutrient loads compared to commercial or industrial land uses where metal loads may dominate. Region-specific literature values are preferred as they tailor land use loadings to land use characteristics typical of that region. These land-based pollutant loads are useful in estimating pollutant loading in a given area with mixed land uses.
For the Chatfield Watershed, existing pollutant loads were estimated using land use-based pollutant loading rates obtained from other watershed models calibrated to areas with similar characteristics (Appendix D). These rates are estimates of pollutant generation that is typical of that particular land use (in lbs/acre-day). TN, TP, and bacteria loading rates and average TSS loading rates from various watershed models with similar land uses regionally and throughout the nation were used to estimate annual pollutant loading rates in Chatfield Watershed.
Specifically, the land use-based loading rates were multiplied by the area for that land use in the Chatfield Watershed (and then further scaled to result in an annual load). These total estimated loads were adjusted to best match measured existing loads for the Plum Creek and South Platte River drainages. This adjustment included scaling the land use-based pollutant loading rates while maintaining the relative land use contribution for each parameter. The measured existing loads were based on in-stream flow and concentration measurements for Plum Creek and the South Platte River. Note, the estimated land-based loads for South Platte River drainage are representative of the small South Platte drainage area within the Chatfield Watershed boundary, whereas the measured in-stream loads are representative of the entire Upper South Platte Drainage system (Section 4.2.2.2). Land-based loadings estimated by this tool reflect land-based loads strictly within the Chatfield Watershed boundaries.
The spreadsheet calculations used to estimate pollutant loads from each land use are a starting point based on initial resources provided for the Watershed Plan. Part of the watershed planning exercise included evaluating spreadsheet predictive pollutant loading tools driven by land use and zoning information, as this is an indicator of what the future could hold. The results are conservative estimates that do not reflect the fate and transport processes that occur within the streams or reservoir dynamics. These land-based pollutant loading rates provide an initial conservative estimate of pollutant loads from land uses and can be used to help understand relative changes in loading due to development (i.e., modifications to land use areas) or the implementation of management measures to reduce pollutant loads on a particular land use. Future refinements to the pollutant loading tool include site specific loading rate data from watershed land uses and an evaluation of more sophisticated watershed modeling tools. Additional data, information and watershed models will improve prediction capabilities and loading estimates in the Chatfield Watershed.
The land uses and zoning present in Chatfield Watershed are shown in Table 5-3 by drainage area. The relative TSS, TN, TP, and bacteria loadings predicted by the pollutant loading spreadsheet tool for each drainage area are summarized in Table 5-4. Potential pollutant loadings for the entire Watershed are presented by land use in Figure 5-7 through Figure 5-10 for these four pollutants. As shown, agricultural land uses are potentially the largest contributor of TSS, TN and TP due in large part to greater acreage of agricultural land use in the Watershed (over 50%); whereas, residential areas are potentially the largest contributors of bacteria.
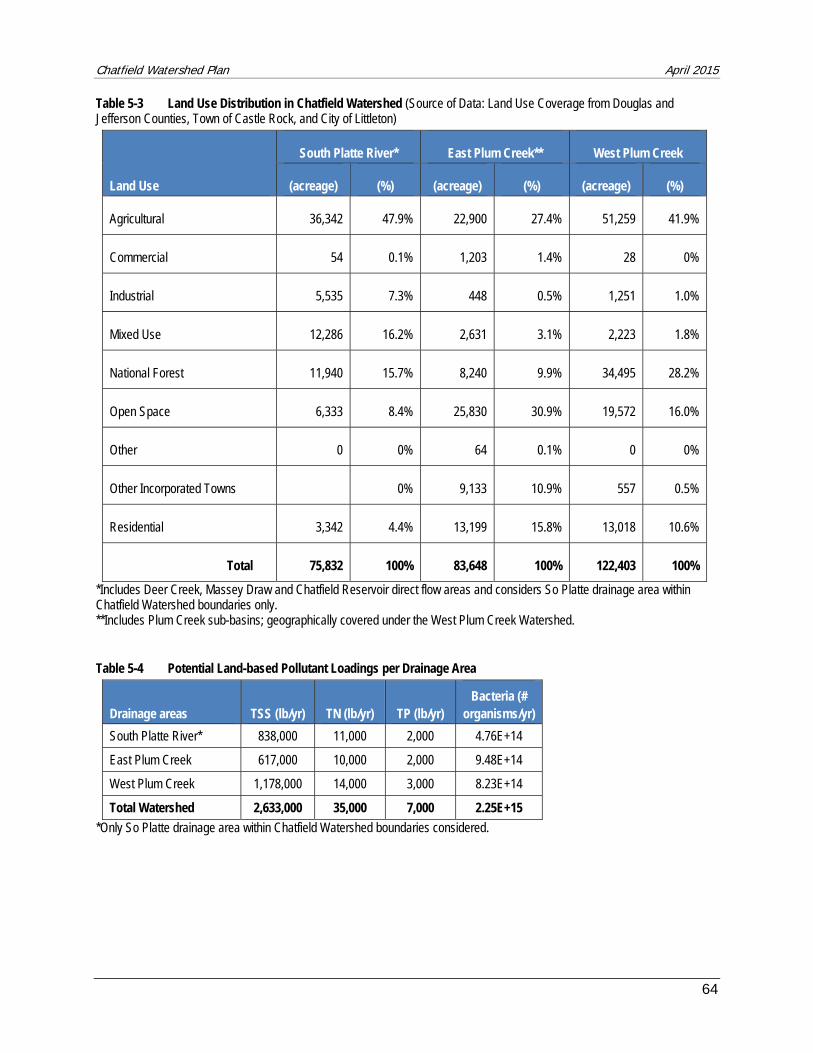
Chatfield Watershed Plan April 2015
64
Table 5-3 Land Use Distribution in Chatfield Watershed (Source of Data: Land Use Coverage from Douglas and Jefferson Counties, Town of Castle Rock, and City of Littleton)
Land Use
South Platte River* East Plum Creek** West Plum Creek
(acreage) (%) (acreage) (%) (acreage) (%)
Agricultural 36,342 47.9% 22,900 27.4% 51,259 41.9%
Commercial 54 0.1% 1,203 1.4% 28 0%
Industrial 5,535 7.3% 448 0.5% 1,251 1.0%
Mixed Use 12,286 16.2% 2,631 3.1% 2,223 1.8%
National Forest 11,940 15.7% 8,240 9.9% 34,495 28.2%
Open Space 6,333 8.4% 25,830 30.9% 19,572 16.0%
Other 0 0% 64 0.1% 0 0%
Other Incorporated Towns 0% 9,133 10.9% 557 0.5%
Residential 3,342 4.4% 13,199 15.8% 13,018 10.6%
Total 75,832 100% 83,648 100% 122,403 100%
*Includes Deer Creek, Massey Draw and Chatfield Reservoir direct flow areas and considers So Platte drainage area within Chatfield Watershed boundaries only. **Includes Plum Creek sub-basins; geographically covered under the West Plum Creek Watershed.
Table 5-4 Potential Land-based Pollutant Loadings per Drainage Area
Drainage areas TSS (lb/yr) TN (lb/yr) TP (lb/yr) Bacteria (#
organisms/yr)
South Platte River* 838,000 11,000 2,000 4.76E+14
East Plum Creek 617,000 10,000 2,000 9.48E+14
West Plum Creek 1,178,000 14,000 3,000 8.23E+14
Total Watershed 2,633,000 35,000 7,000 2.25E+15
*Only So Platte drainage area within Chatfield Watershed boundaries considered.
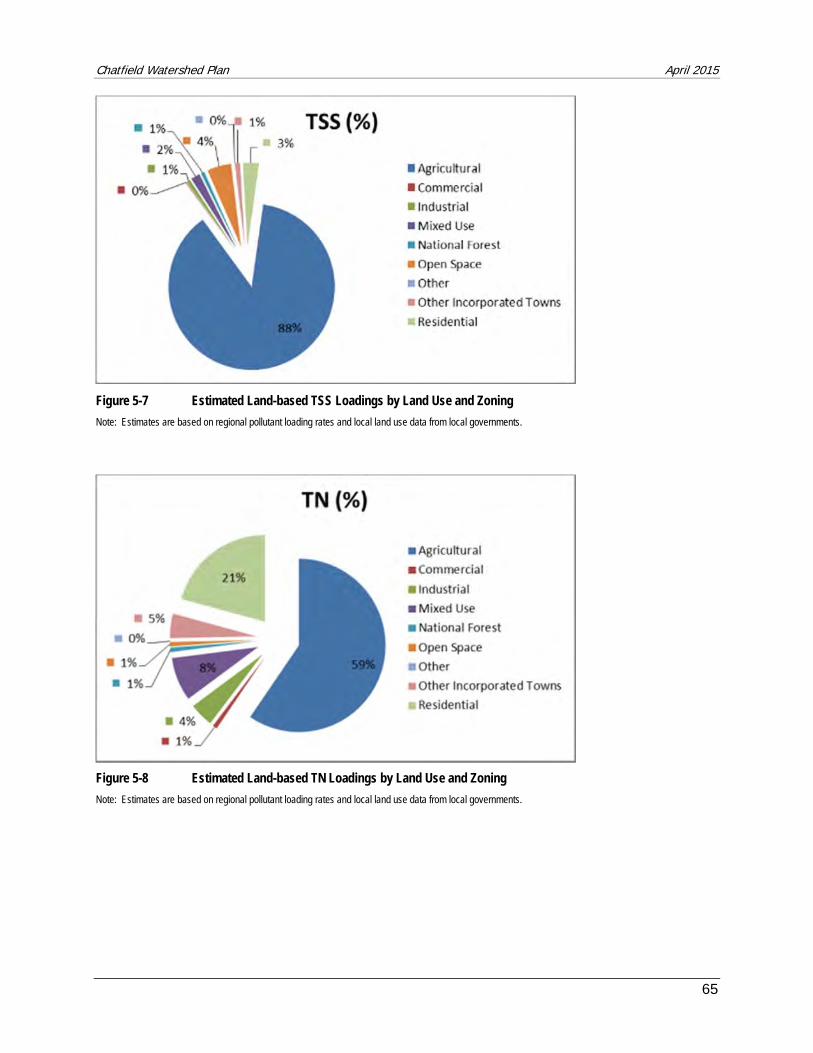
Chatfield Watershed Plan April 2015
65
Figure 5-7 Estimated Land-based TSS Loadings by Land Use and Zoning
Note: Estimates are based on regional pollutant loading rates and local land use data from local governments.
Figure 5-8 Estimated Land-based TN Loadings by Land Use and Zoning
Note: Estimates are based on regional pollutant loading rates and local land use data from local governments.
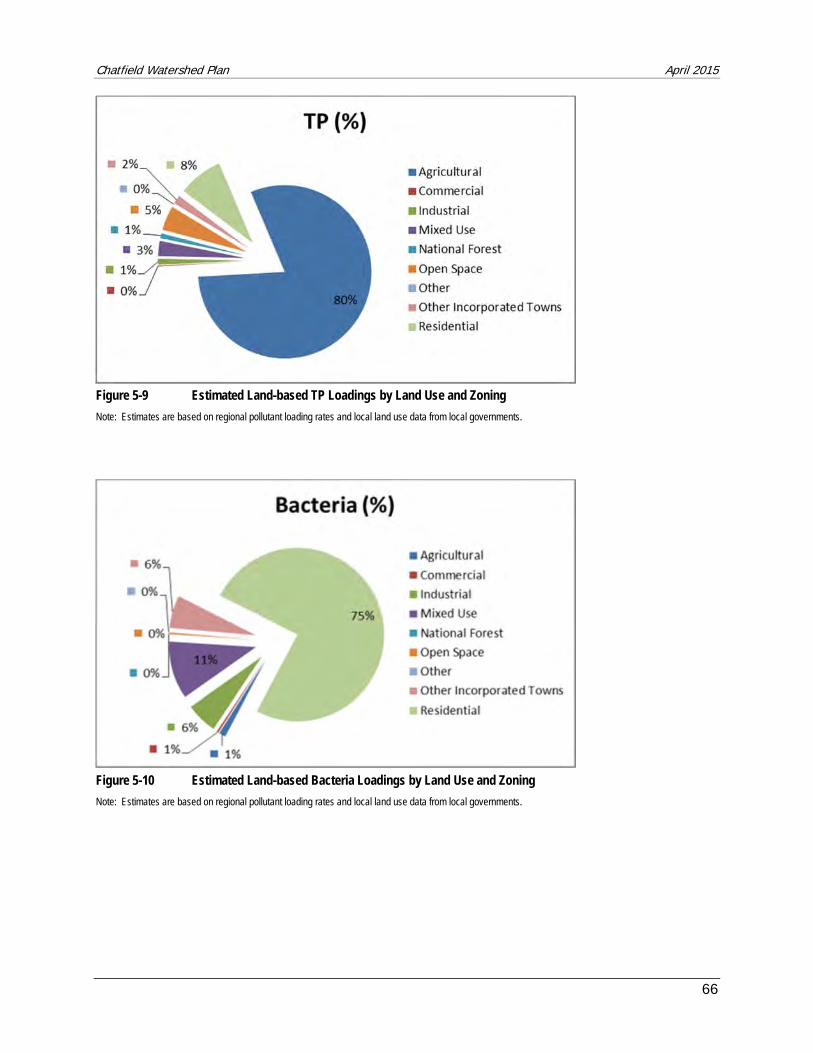
Chatfield Watershed Plan April 2015
66
Figure 5-9 Estimated Land-based TP Loadings by Land Use and Zoning
Note: Estimates are based on regional pollutant loading rates and local land use data from local governments.
Figure 5-10 Estimated Land-based Bacteria Loadings by Land Use and Zoning
Note: Estimates are based on regional pollutant loading rates and local land use data from local governments.
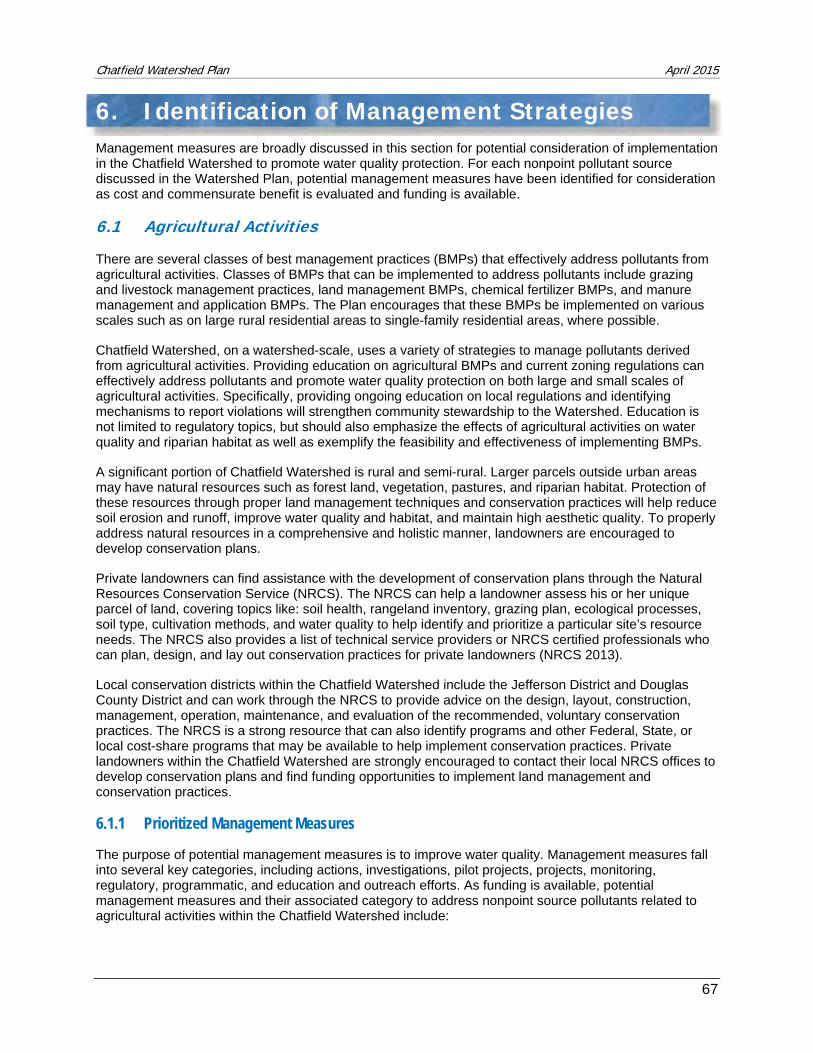
Chatfield Watershed Plan April 2015
67
6. Identification of Management Strategies Management measures are broadly discussed in this section for potential consideration of implementation in the Chatfield Watershed to promote water quality protection. For each nonpoint pollutant source discussed in the Watershed Plan, potential management measures have been identified for consideration as cost and commensurate benefit is evaluated and funding is available.
6.1 Agricultural Activities
There are several classes of best management practices (BMPs) that effectively address pollutants from agricultural activities. Classes of BMPs that can be implemented to address pollutants include grazing and livestock management practices, land management BMPs, chemical fertilizer BMPs, and manure management and application BMPs. The Plan encourages that these BMPs be implemented on various scales such as on large rural residential areas to single-family residential areas, where possible.
Chatfield Watershed, on a watershed-scale, uses a variety of strategies to manage pollutants derived from agricultural activities. Providing education on agricultural BMPs and current zoning regulations can effectively address pollutants and promote water quality protection on both large and small scales of agricultural activities. Specifically, providing ongoing education on local regulations and identifying mechanisms to report violations will strengthen community stewardship to the Watershed. Education is not limited to regulatory topics, but should also emphasize the effects of agricultural activities on water quality and riparian habitat as well as exemplify the feasibility and effectiveness of implementing BMPs.
A significant portion of Chatfield Watershed is rural and semi-rural. Larger parcels outside urban areas may have natural resources such as forest land, vegetation, pastures, and riparian habitat. Protection of these resources through proper land management techniques and conservation practices will help reduce soil erosion and runoff, improve water quality and habitat, and maintain high aesthetic quality. To properly address natural resources in a comprehensive and holistic manner, landowners are encouraged to develop conservation plans.
Private landowners can find assistance with the development of conservation plans through the Natural Resources Conservation Service (NRCS). The NRCS can help a landowner assess his or her unique parcel of land, covering topics like: soil health, rangeland inventory, grazing plan, ecological processes, soil type, cultivation methods, and water quality to help identify and prioritize a particular site’s resource needs. The NRCS also provides a list of technical service providers or NRCS certified professionals who can plan, design, and lay out conservation practices for private landowners (NRCS 2013).
Local conservation districts within the Chatfield Watershed include the Jefferson District and Douglas County District and can work through the NRCS to provide advice on the design, layout, construction, management, operation, maintenance, and evaluation of the recommended, voluntary conservation practices. The NRCS is a strong resource that can also identify programs and other Federal, State, or local cost-share programs that may be available to help implement conservation practices. Private landowners within the Chatfield Watershed are strongly encouraged to contact their local NRCS offices to develop conservation plans and find funding opportunities to implement land management and conservation practices.
6.1.1 Prioritized Management Measures
The purpose of potential management measures is to improve water quality. Management measures fall into several key categories, including actions, investigations, pilot projects, projects, monitoring, regulatory, programmatic, and education and outreach efforts. As funding is available, potential management measures and their associated category to address nonpoint source pollutants related to agricultural activities within the Chatfield Watershed include:
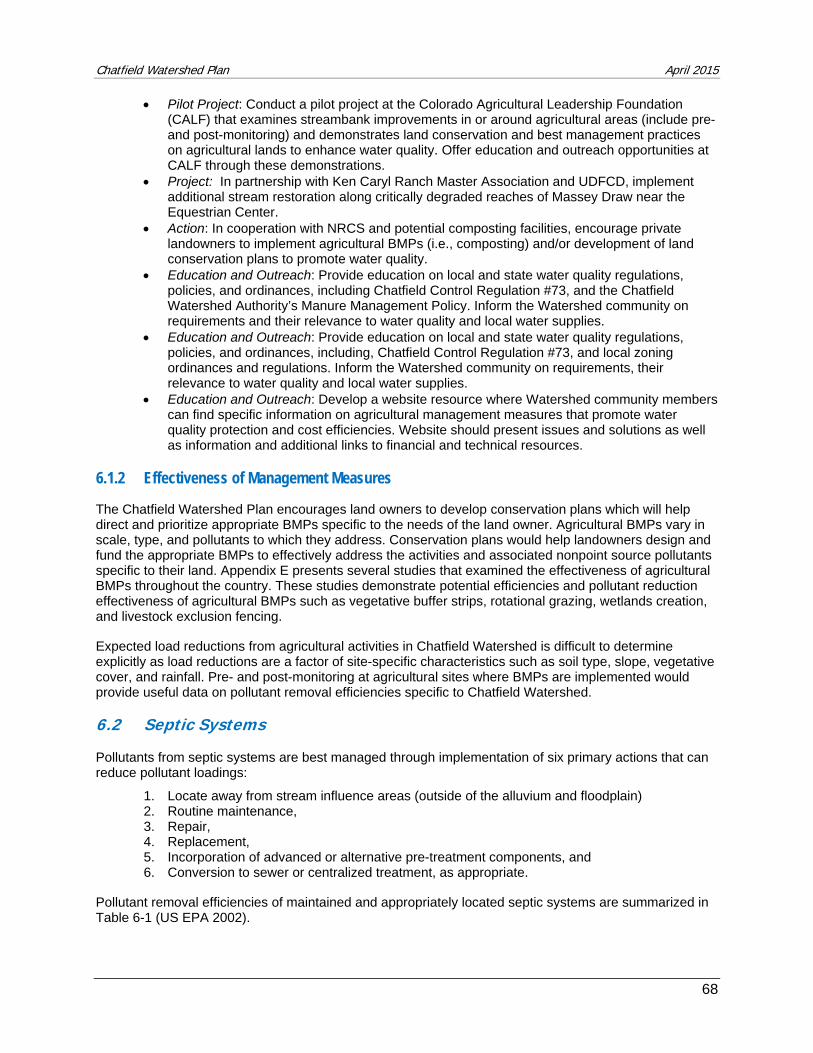
Chatfield Watershed Plan April 2015
68
Pilot Project: Conduct a pilot project at the Colorado Agricultural Leadership Foundation (CALF) that examines streambank improvements in or around agricultural areas (include pre- and post-monitoring) and demonstrates land conservation and best management practices on agricultural lands to enhance water quality. Offer education and outreach opportunities at CALF through these demonstrations.
Project: In partnership with Ken Caryl Ranch Master Association and UDFCD, implement additional stream restoration along critically degraded reaches of Massey Draw near the Equestrian Center.
Action: In cooperation with NRCS and potential composting facilities, encourage private landowners to implement agricultural BMPs (i.e., composting) and/or development of land conservation plans to promote water quality.
Education and Outreach: Provide education on local and state water quality regulations, policies, and ordinances, including Chatfield Control Regulation #73, and the Chatfield Watershed Authority’s Manure Management Policy. Inform the Watershed community on requirements and their relevance to water quality and local water supplies.
Education and Outreach: Provide education on local and state water quality regulations, policies, and ordinances, including, Chatfield Control Regulation #73, and local zoning ordinances and regulations. Inform the Watershed community on requirements, their relevance to water quality and local water supplies.
Education and Outreach: Develop a website resource where Watershed community members can find specific information on agricultural management measures that promote water quality protection and cost efficiencies. Website should present issues and solutions as well as information and additional links to financial and technical resources.
6.1.2 Effectiveness of Management Measures
The Chatfield Watershed Plan encourages land owners to develop conservation plans which will help direct and prioritize appropriate BMPs specific to the needs of the land owner. Agricultural BMPs vary in scale, type, and pollutants to which they address. Conservation plans would help landowners design and fund the appropriate BMPs to effectively address the activities and associated nonpoint source pollutants specific to their land. Appendix E presents several studies that examined the effectiveness of agricultural BMPs throughout the country. These studies demonstrate potential efficiencies and pollutant reduction effectiveness of agricultural BMPs such as vegetative buffer strips, rotational grazing, wetlands creation, and livestock exclusion fencing.
Expected load reductions from agricultural activities in Chatfield Watershed is difficult to determine explicitly as load reductions are a factor of site-specific characteristics such as soil type, slope, vegetative cover, and rainfall. Pre- and post-monitoring at agricultural sites where BMPs are implemented would provide useful data on pollutant removal efficiencies specific to Chatfield Watershed.
6.2 Septic Systems
Pollutants from septic systems are best managed through implementation of six primary actions that can reduce pollutant loadings:
1. Locate away from stream influence areas (outside of the alluvium and floodplain) 2. Routine maintenance, 3. Repair, 4. Replacement, 5. Incorporation of advanced or alternative pre-treatment components, and 6. Conversion to sewer or centralized treatment, as appropriate.
Pollutant removal efficiencies of maintained and appropriately located septic systems are summarized in Table 6-1 (US EPA 2002).
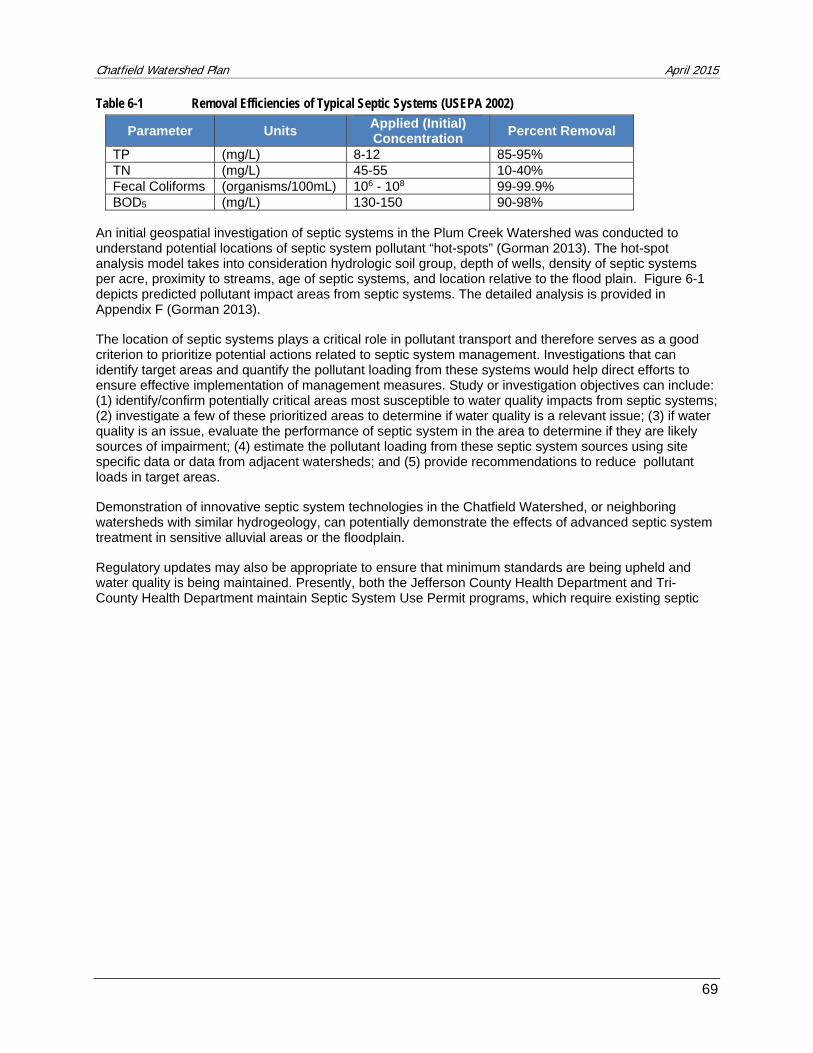
Chatfield Watershed Plan April 2015
69
Table 6-1 Removal Efficiencies of Typical Septic Systems (USEPA 2002)
Parameter Units Applied (Initial) Concentration
Percent Removal
TP (mg/L) 8-12 85-95% TN (mg/L) 45-55 10-40% Fecal Coliforms (organisms/100mL) 106 - 108 99-99.9% BOD5 (mg/L) 130-150 90-98%
An initial geospatial investigation of septic systems in the Plum Creek Watershed was conducted to understand potential locations of septic system pollutant “hot-spots” (Gorman 2013). The hot-spot analysis model takes into consideration hydrologic soil group, depth of wells, density of septic systems per acre, proximity to streams, age of septic systems, and location relative to the flood plain. Figure 6-1 depicts predicted pollutant impact areas from septic systems. The detailed analysis is provided in Appendix F (Gorman 2013).
The location of septic systems plays a critical role in pollutant transport and therefore serves as a good criterion to prioritize potential actions related to septic system management. Investigations that can identify target areas and quantify the pollutant loading from these systems would help direct efforts to ensure effective implementation of management measures. Study or investigation objectives can include: (1) identify/confirm potentially critical areas most susceptible to water quality impacts from septic systems; (2) investigate a few of these prioritized areas to determine if water quality is a relevant issue; (3) if water quality is an issue, evaluate the performance of septic system in the area to determine if they are likely sources of impairment; (4) estimate the pollutant loading from these septic system sources using site specific data or data from adjacent watersheds; and (5) provide recommendations to reduce pollutant loads in target areas.
Demonstration of innovative septic system technologies in the Chatfield Watershed, or neighboring watersheds with similar hydrogeology, can potentially demonstrate the effects of advanced septic system treatment in sensitive alluvial areas or the floodplain.
Regulatory updates may also be appropriate to ensure that minimum standards are being upheld and water quality is being maintained. Presently, both the Jefferson County Health Department and Tri-County Health Department maintain Septic System Use Permit programs, which require existing septic
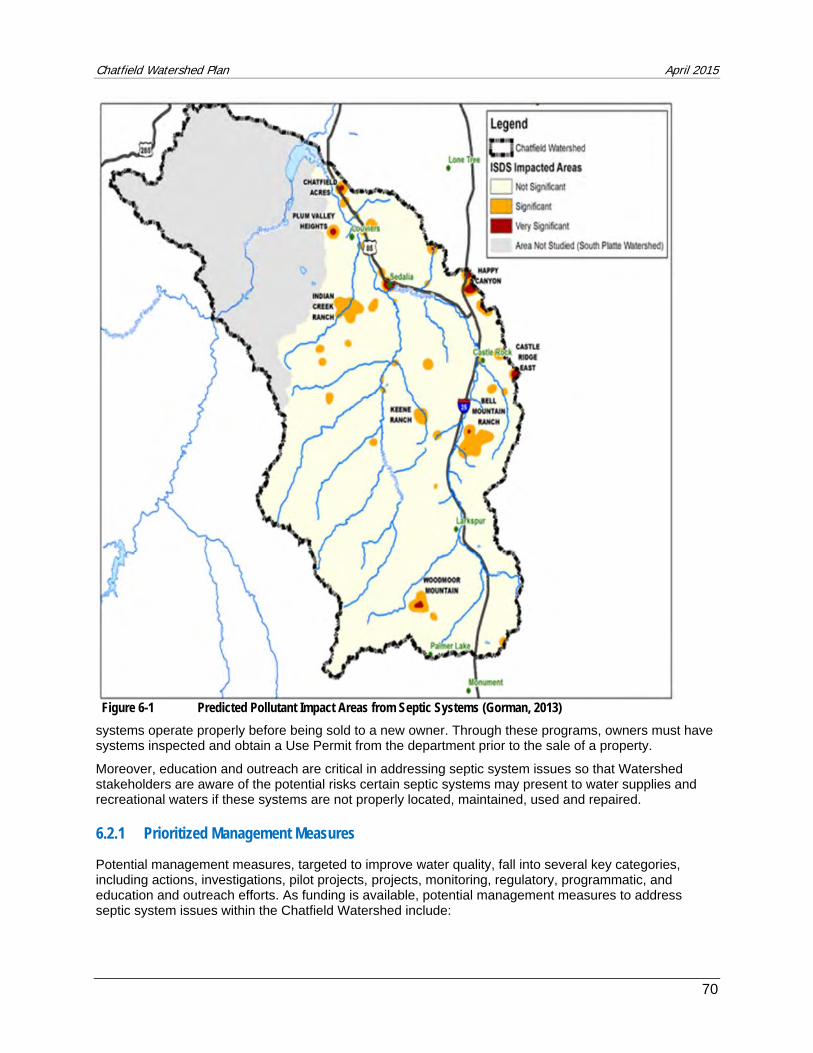
Chatfield Watershed Plan April 2015
70
systems operate properly before being sold to a new owner. Through these programs, owners must have systems inspected and obtain a Use Permit from the department prior to the sale of a property.
Moreover, education and outreach are critical in addressing septic system issues so that Watershed stakeholders are aware of the potential risks certain septic systems may present to water supplies and recreational waters if these systems are not properly located, maintained, used and repaired. 6.2.1 Prioritized Management Measures
Potential management measures, targeted to improve water quality, fall into several key categories, including actions, investigations, pilot projects, projects, monitoring, regulatory, programmatic, and education and outreach efforts. As funding is available, potential management measures to address septic system issues within the Chatfield Watershed include:
Figure 6-1 Predicted Pollutant Impact Areas from Septic Systems (Gorman, 2013)
Chatfield Watershed Plan April 2015
71
Investigation: Summarize septic system investigations, pilot projects, and data collected in Chatfield Watershed and neighboring watersheds.
With the Colorado School of Mines (Gorman, 2013) analysis as a starting point, conduct an investigation(s) to refine where septic systems have the greatest impact on water quality in the Chatfield Watershed and attempt to quantify the associated load. Critical areas can be based on several key factors including density of septic systems and proximity of septic systems to alluvial soils, floodplains, streams, wells and the Chatfield Reservoir.
Pilot Project: As financing and adequate funding is secured, conduct pilot projects in the Chatfield Watershed, to demonstrate water quality improvements that result from conversion of septic systems to centralized sewer and repair and replacement of septic systems.
Pilot Project: Demonstrate and document effectiveness of advanced septic system treatment technologies used in the Chatfield Watershed; quantify a potential load reduction if implemented on a larger scale.
Education and Outreach: Provide resources (e.g., mailings, web-based) that provide education on septic system operation, maintenance and repair. Septic systems are not a threat to water quality if systems are located outside of stream influence areas, and properly designed, installed, and maintained. Emphasize the protection of water quality and drinking water supplies.
In areas where there is a high density of septic systems, prevailing hydrologic and geologic conditions may become stressed and unable to provide adequate treatment. These areas may be considered at higher-risk for potential groundwater contamination and may be of elevated concern if groundwater serves as a local drinking water source or is tributary to Chatfield Reservoir. In these critical areas, incorporating advanced and alternative pre-treatment components could be potential solutions to restore adequate treatment at each septic system. As funding is available, converting those areas with septic system pollutant impacts to centralized sewer and wastewater treatment may be warranted. 6.3 Streambank Stabilization
Stabilization of degraded (no longer natural) streambanks is one approach to mitigate impacts to water quality from degraded stream systems, reduce soil erosion, restore healthy riparian systems, and improve overall water quality. Restoration of riparian systems and habitats can be achieved through engineered enhancements to degraded systems. Streambank restoration efforts include stream improvement projects aimed to stabilize streambank or enhance the stream setting to achieve water quality benefits.
To understand the potential soil erosion impacts and “hot spots” along the Plum Creek streambank in the Chatfield Watershed, a “Soil Erosion Spatial Analysis” was performed (Gorman 2013, Appendix F) based on the Revised Universal Soil Loss Equation (RUSLE) developed by the USDA. RUSLE uses seven parameters to mathematically estimate a specific condition that affects the severity of soil erosion at a particular location:
1. Computed soil loss per unit area (A)
2. Rainfall and runoff factor (R)
3. Soil erodibility factor (K)
4. Slope-length factor (L)
5. Slope-steepness factor (S)
6. Cover and management factor (C)
7. Conservation practice factor (P)
The calculated erosion values reflected by the model can vary significantly due to fluctuating weather conditions. As a result of changing weather patterns, the computed soil loss values obtained from the RUSLE more accurately represent long-term averages rather than a short term prediction. Figure 6-2
Chatfield Watershed Plan April 2015
72
depicts modeled predicted areas along Plum Creek within the Chatfield Watershed that could suffer from severe rates of erosion.
Stream (or channel) stabilization projects help to minimize erosion and sedimentation that occurs from various sources, including stormwater runoff. Considering stormwater runoff parameters (e.g., rate, volume, frequency, and duration) of present and projected future developments, stabilization projects aim to minimize erosion by enhancing channel slope and altering in-stream hydraulic parameters (e.g., channel width, depth, and grade). Stream stabilization projects include, but are not limited to, grading; placement of fill; construction of check structures, drop structures, and channel bed and bank protection measures; and vegetation planting to protect channel area (CCBWQA 2011).
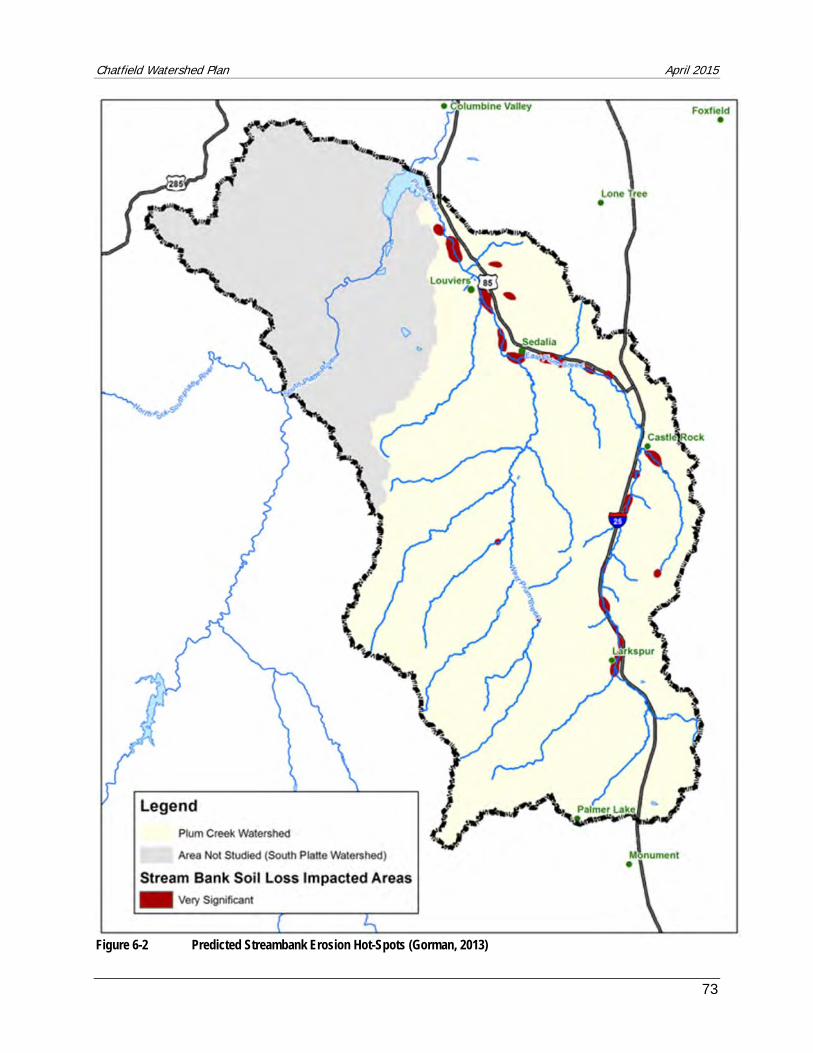
Chatfield Watershed Plan April 2015
73
Figure 6-2 Predicted Streambank Erosion Hot-Spots (Gorman, 2013)
Chatfield Watershed Plan April 2015
74
Other stream improvement projects use additional measures to enhance stream conditions that result in water quality benefits. These measures include riparian and floodplain vegetation planting and improved channel cross sections to promote hydrologic connectivity. In addition, treatment systems, such as stormwater detention, retention, and wetlands, provide water quality benefits to streams by treating the runoff before entering receiving waters. Such improvement projects have been shown to provide multiple water quality benefits including nutrient and sediment load reduction, reduction of metals, and increased dissolved oxygen levels.
Stormwater runoff can be managed at the source through BMPs such as Low Impact Development (LID) practices and green infrastructure which aim to mimic the natural drainage of the area. LID is a comprehensive land planning and engineering design approach that manages stormwater runoff with the goal of restoring and preserving natural drainage. Green infrastructure uses vegetation, soils, and natural processes such as evaporation, infiltration, and capture and reuse to manage water. Communities, researchers, and design professionals in water-limited regions are increasingly recognizing green infrastructure as a cost-effective approach not only to stormwater management, but to water conservation as well (USEPA 2010). In Colorado, legislators adopted modifications to water laws to permit the implementation of rainwater harvesting or the capture of rainwater at the source. BMP practices that can be implemented to preclude stormwater erosion include bioretention, green roofs, permeable pavements, and other infiltration-oriented practices (USEPA 2000). If considered in the early planning stages of development, LID practices and green infrastructure can limit the effects of development by helping to manage stormwater runoff and associated pollutants. The CWA encourages the use of green infrastructure for new development and re-development, including LID practices to promote water quality.
Restoring streambanks and riparian habitats has been a focus of many projects and project pursuits in the Chatfield Watershed. In 2009, the East Plum Creek Watershed Master Plan was completed which served as a preliminary design report for the East Plum Creek Watershed within the Town of Castle Rock boundaries. This plan defined problem areas or areas of instability and identified mitigation measures that address existing problem areas and future changes. Proposed mitigation measures and stabilization projects are scheduled to be implemented by the Town of Castle Rock in upcoming years.
Other areas in the Watershed such as West Plum Creek, Massey Draw, and Deer Creek have areas of streambank instability and can benefit from an evaluation of their specific need for, feasibility of, and potential benefit from implementing streambank stabilization measures to promote water quality protection.
Select areas in the Chatfield Watershed are within the Urban Drainage and Flood Control District (UDFCD). The UDFCD assists collaborated local governments in developing stormwater planning studies to assess detention, water quality, and drainageway needs in watersheds across the Denver metro area. Planning studies have been developed for Massey Draw, Plum Creek, East Plum Creek (UDFCD 1996, 2001, and 2004, 2005, 2008). Channel improvements have been made in Massey Draw in accordance with the UDFCD planning studies (UDFCD 2008).
6.3.1 Prioritized Management Measures
Potential management measures to promote water quality protection fall into several key categories, including actions, investigations, pilot projects, projects, monitoring, regulatory, programmatic, and education and outreach efforts. As funding is available, potential management measures and their associated category to address nonpoint source pollutants related to streambank stabilization issues within the Chatfield Watershed include:
Project: In cooperation with the Town of Castle Rock and its Stormwater Utility, continue the implementation of mitigation measures identified along tributaries to East Plum Creek in the East Plum Creek Watershed Master Plan (Town of Castle Rock 2009).
Project: In coordination with proposed Chatfield Reallocation mitigation requirements on Plum Creek, implement baseline water quality monitoring followed by construction of streambank protection and approximately 40 drop structures along degraded reaches of Plum Creek in
Chatfield Watershed Plan April 2015
75
Chatfield State Park to enhance water quality. Document pollutant reduction effectiveness of the project through post-construction water quality monitoring.
Project: In partnership with Ducks Unlimited and other Watershed stakeholders, implement a stream restoration phosphorus trading demonstration project to incentivize or encourage stream improvements on private land to promote water quality.
Action: Using UDFCD planning studies and local plans as a basis, identify priority locations in the Watershed to stabilize streambanks, harness erosion, and reduce loading from phosphorus-laden sediments.
Monitoring: In coordination with Ken Caryl Ranch Master Association, conduct post-installation monitoring at Massey Draw stream restoration improvements at Equestrian Center to document water quality benefits from stream improvement projects and pollutant reduction effectiveness. .
6.3.2 Effectiveness of Management Measures
Reduction in TSS loading is determined by project design, while associated phosphorus reduction is a function of soil geology and land use characteristics. Expected load reductions from such projects can be estimated by using typical efficiencies of project types and using sediment values typical of the surrounding area. The effectiveness of a streambank stabilization or improvement project is most evident near the project site and within the downstream stream segment. An evaluation of fate and transport on a watershed scale would be necessary to determine if and to what extent upstream streambank stabilization or improvement projects have on water quality in the Chatfield Reservoir compared to projects in immediate areas.
Effectiveness of bank stabilization projects such as grade controls can be estimated by the expected amount of sediment to be retained or the rate of erosion that is expected to be reduced. This reduction in TSS loading can then be correlated to a reduction in nutrients or metals of concern. Effectiveness of streambank improvement projects, however, is specific to the physical and/or biological mechanisms used and the configuration of the improvement project. Sediment basins are a physical mechanism that control the loss of sediment from the basin and upstream by ponding stormwater runoff and allowing a controlled discharge of runoff into receiving waterbodies. Sediment basins have a trapping efficiency of about 99% for fine to coarse sands (Tetra Tech 2006). Biological systems, on the other hand, utilize vegetation and engineered ecosystems to treat runoff through storage and biological uptake. The Lemna Nonpoint Source Treatment system is a proprietary system that has been used previously in the Chatfield Reservoir where dissolved phosphorus reduction rates ranged from 50-98% of the influent concentration. This system, however, required supplemental nitrogen to create adequate duckweed growth (DRCOG 1996). It is common for streambank improvement projects to use a series of mechanisms, or a treatment train, to treat runoff to the maximum extent practicable.
Potential phosphorus removal by implementation of streambank stabilization and improvement projects has been studied to support efforts in East Plum Creek (CH2M Hill 2009). Based on information from the adjacent Cherry Creek watershed, which shares similar topography, shape, geology, and land use, a typical phosphorus concentration of sediments in the East Plum Creek was determined to be 1.04 lbs of phosphorus per ton of sediment. For the purposes of estimating potential phosphorus load reduction in this Watershed Plan, this value was applied to a sediment density of 80 pounds per cubic foot (i.e., mixture of clay, silt, and sand) (CH2M Hill 2009).
In addition to sediment and phosphorus load reduction, other parameters should be considered as well when evaluating stream improvement projects. Ecological assessments and hydraulic parameters (e.g., velocity, shear, power, channel wetted area, and frequency of bank full flow) are also measures of water quality (CCBWQA 2011), which can be used to weigh the potential benefits of stream improvement projects. Further discussion of these parameters and other criteria is presented in the 2011 CCBWQ study, Stream Reclamation, Water Quality Benefit Evaluation-Interim Status Report.
Chatfield Watershed Plan April 2015
76
6.4 Wildfire Management
There are two classes of wildfire management activities that influence water quality which are presented in this section; pre-wildfire management and post-wildfire management. Pre-wildfire management activities include the development and implementation of Community Wildfire Protection Plans (CWPPs); development and implementation of Forest Management Plans (FMPs); and the implementation of Hazardous Fuels Reduction Projects. Post-wildfire management activities can begin during a wildfire event and include the development of a Watershed Assessment Report (WAR) and development of a Watershed Restoration Plan (WRP).
Many of the pre- and post-wildfire management activities described below are currently underway or have occurred in the Chatfield Watershed and Upper South Platte River basin. Many of the agencies responsible for or involved with these pre- and post-wildfire management activities include federal, state, and local entities. These entities and their current activities are described in Appendix G.
6.4.1 Pre-Wildfire Management Activities
Three pre-wildfire management activities summarized below mitigate the severity of a wildfire through planning efforts and hazardous fuels reduction efforts, thereby alleviating wildfire hazards and potential water quality impacts.
• Community Wildfire Protection Plans (CWPPs)
In 2009, the Colorado General Assembly passed Colorado Senate Bill 09-001 which mandated the completion and approval of a Community Wildfire Protection Plan (CWPP) for counties in which areas of wildfire hazards were identified. A CWPP is a plan that identifies specific wildland fire risks facing communities and neighborhoods and provides prioritized recommendations to reduce those risks. Jefferson County and Douglas County both have County-wide CWPPs. Fire district CWPPs and local-level CWPPs also exist in these counties.
• Forest Management Plans (FMPs)
A Forest Management Plan (FMP) is a site-specific plan that is developed based on the landowner’s management objectives and professional expertise of a skilled forester to achieve long-term forest management goals. Example management plan activities include timber harvesting, timber stand improvement, wildlife habitat development, and invasive species and erosion control. A common component of an FMP is a fuels management plan or fire mitigation plan. A fuels management plan identifies fuel reduction activities such as thinning of dense brush for fuel breaks, creating defensible space, and reducing fuel loading along roadsides to facilitate evacuations. FMPs may grant eligibility for financial assistance through the NRCS Environmental Quality Incentives Program (EQIP).
• Hazardous Fuels Reduction Work
Hazardous fuel reduction projects have been proven as a means of mitigating wildfire hazards. Hazardous fuels are any kind of living or dead vegetation that is flammable. The objective of hazardous fuel reduction is to remove enough fuel so that when a wildfire burns, it is less severe and can be more easily suppressed. Hazardous fuel reduction involves thinning trees and removing underbrush which can be done using hand crews or machines. 6.4.2 Post-Wildfire Management Activities
Post-wildfire management activities often begin, and are encouraged to begin, while a wildfire is still active. Two post-wildfire management activities, watershed assessment reporting and watershed restoration planning, are discussed in this section. Based on a wildfire’s intensity, size, and footprint, assessments and restoration plans can be developed to address the impacts of the wildfire and mitigate
Chatfield Watershed Plan April 2015
77
water quality impacts. Thorough, comprehensive, and timely assessment reports and restoration plans are essential in restoring pre-wildfire watershed conditions.
• Watershed Assessment Reports (WAR)
During the initial stages of a wildfire event, Burned Area Emergency Response (BAER) efforts begin to address emergency stabilization measures. The objectives of the BAER program are to identify emergency conditions and to prescribe and implement emergency treatments on Federal lands to minimize threats to life or property or to stabilize and prevent unacceptable degradation to natural and cultural resources (USFS 2013a). Although these watershed assessments are useful in prioritizing emergency efforts, comprehensive watershed assessments are still necessary to serve as a solid foundation for a watershed restoration plan. Example land treatments include aerial seeding and mulching. BAER treatments on National Forest land may benefit downstream private land, but treatments outside Federal lands must be developed and accomplished by other means.
For areas outside Federal lands, the BAER assessment team and Natural Resources Conservation Service (NRCS) work together and coordinate with other federal and local agencies in assisting private landowners in preparing for post-wildfire impacts.
• Watershed Reclamation Plan (WRP)
After emergency stabilization on public and private lands has been achieved, long-term watershed rehabilitation is the responsibility of local entities (e.g., watershed groups, local governments, etc.). Effective watershed rehabilitation starts with a comprehensive watershed assessment that evaluates the effect of the wildfire event and quantifies post-wildfire conditions (e.g., hydrologic conditions and sediment yields) in order to identify watersheds or sub-watersheds at significant risk for post-wildfire impacts. The goal for a post-WRP is to enhance hydrologic recovery to promote sustainable watershed function. A watershed-based, post-wildfire restoration plan identifies actions to reduce post-wildfire flood impacts, prioritizes areas for such actions, and, based on efficiency and projected costs, outlines a plan of action on how to implement the restoration plan.
To facilitate post-wildfire actions, it is important to centralize information and contacts that would be critical in the development of a post-wildfire watershed assessment or restoration plan. Centralizing information from previous wildfire events and their respective post-wildfire activities would serve as a means to highlight successful rehabilitation projects and methods; and to gain efficiencies in the permitting process as lessons are learned. 6.4.3 Prioritized Management Measures
Potential management measures to protect water quality fall into several key categories, including actions, investigations, pilot projects, projects, monitoring, regulatory, programmatic, and education and outreach efforts. As funding is available, potential management measures and their associated category to address wildfire management include:
Action: Establish relationships with and support the efforts of Front Range and neighboring watershed organizations (Front Range Watershed Wildfire Protection (FRWWP), Front Range Fuels Treatment Partnership (FRFTP), Coalition of the Uppers South Platte (CUSP), South Platte Enhancement Board (SPEB) to keep the Chatfield Watershed in mind for future wildfire management efforts that promote water quality protection in our Watershed.
Action: Collaborate with FRFTP Roundtable, local Colorado State Forest Service (CSFS) districts, Conservation Districts, and USFS to determine what areas need additional focus with regards to forest management and fuel treatment needs to promote water quality. Environmentally sensitive areas (i.e. along river corridors) can be prioritized as they are more prone to impact water quality in Chatfield Reservoir.
Chatfield Watershed Plan April 2015
78
Action: In coordination with the Colorado Watershed Assembly annual conference, “Sustaining Colorado’s Watersheds”, hold a forum on “lessons learned” during pre-and post-wildfire mitigation to protect water quality.
Education and Outreach: Coordinate with agencies (e.g., National Resource Conservation Service (NRCS), Conservation Districts, CSFS, USFS, local government) who have fire mitigation staff to reach out and provide education to private landowners on the watershed and water quality benefits of wildfire mitigation projects (e.g., fuels treatment, forest thinning). Hold presentations from fire mitigation specialists.
Action: In coordination with Douglas and Jefferson Counties, encourage implementation of county-wide and local level CWPPs to protect water quality.
6.4.4 Effectiveness of Management Measures
Given the severe potential of water quality impacts from wildfires, pre- and post-wildfire management measures play a strong role in protecting and restoring watershed health. Although, pre-wildfire management activities do not improve current water quality conditions, these actions coupled with aggressive post-wildfire management activities will assuredly protect and help restore watershed health. Estimating an expected load reduction from wildfire management activities is difficult to quantify as effectiveness is a function of wildfire timing, intensity, severity, and other unrelated fire factors such as rainfall characteristics (i.e., intensity, frequency), topography, and land use and management. Pre-wildfire management activities such as development of CWPPs and FMPs and implementation of hazardous fuels reduction projects are aimed at reducing the severity of a fire through preventative measures. Pre-wildfire implementation activities, such as forest thinning and defensible space zoning, indirectly protect water quality by influencing fire behavior. Post-wildfire management activities, on the other hand, can directly improve post-wildfire water quality conditions and protect valuable resources. WARs and WRPs are critical in directing and coordinating effective post-wildfire treatments in an efficient manner. The overall effectiveness of post-wildfire activities is dependent upon the comprehensiveness of watershed assessments and efficient implementation of restoration efforts, all of which are products of collaborative efforts from the federal, state, local, and private entities.
For load reduction estimate purposes, sediment load reductions can range from 75 to 90 percent reduction relative to post-wildfire conditions. According to the Waldo Canyon Fire Master Plan, at least 75% of the delivered sediment from treated hill slopes can be reduced by increasing ground cover to above 65%, treating rills, constructing benches, and establishing riparian vegetation on stream-adjacent slopes (CUSP 2013b). Paired straw mulch swale plots installed on the 2002 Hayman Fire measured 94 percent reduction in sediment yields in post-wildfire year one and 90 percent in post-wildfire year two (Robichaud et al. 2010). In general, there are limited data to accurately determine effectiveness of post-wildfire treatments because field measurements of runoff and sediment yields in burned areas require a rapid response research protocol and are generally expensive and labor-intensive.
In terms of protecting and enhancing water quality conditions in the Chatfield Watershed, load reduction estimates of post-wildfire management measures are difficult to quantify due to their reactionary nature. Highly severe fires can result in erosion rates of 6,700 lbs/ac (0.75 kg/m2), as was the case following the Hayman Fire, introducing significant sediment loads and affiliated pollutant loads to downstream waters (Libohova 2004). Erosion rates are a function of fire severity and rainstorm intensity but can be mitigated by pre-wildfire treatments aimed at reducing fire severity and timely implementation of effective post-wildfire treatments. Total phosphorus concentrations in the South Platte drainage upstream of Chatfield Reservoir were analyzed after the Buffalo Creek and Hayman Creek fires in comparison to the Plum Creek drainage (Figure 4-10). This comparison, coupled with the high erosion rates post wildfire (0.75 kg/m2) and a TP concentration increase in the South Platte drainage post-wildfire of 2-3 times what is normally measured, suggests wildfires are a potential water quality issue in the Watershed.
Chatfield Watershed Plan April 2015
79
6.5 Education and Outreach
Water quality and healthy riparian habitats in the Chatfield Watershed is a shared responsibility. Nearly 350,000 people live and work in this Watershed and over 1.7 million visitors per year enjoy Chatfield State Park for hiking, boating, fishing and wildlife viewing. Horseback riding and dog training and exercise are also very popular activities in designated areas and along the trails that wind through the riparian corridors of Plum Creek, Deer Creek and Waterton Canyon. Hundreds of local residents attend a variety of educational events hosted by not-for-profit educational institutions. Engaging this large audience and developing awareness and knowledge will be important to building a community of Watershed stewards who understand and care about water quality and a generally healthy habitat for people and wildlife.
6.5.1 Current Education and Outreach efforts in Chatfield Watershed
The Chatfield Watershed Planning process benefits from the existence of multiple, high-value institutions with education as a primary mission. These organizations include the Chatfield Area Network for Outreach and Education (CANOE) which is made up of the following organizations:
Audubon of Greater Denver www.denveraudubon.org Denver Botanic Gardens at Chatfield http://www.botanicgardens.org/our-gardens/chatfield
Denver Water http://www.denverwater.org/EducationOutreach Rocky Mountain Land Library www.landlibrary.org
Thorne Nature Experience www.thornenature.org Wildlife Habitat Council www.wildlifehc.org
The mission of CANOE is “to strengthen place-based educational programs in the Chatfield area and to improve participants’ understanding of the South Platte River’s environments from its headwaters in the mountains to the Metropolitan Denver area in the plains.” CANOE is “dedicated to re-connecting people with nature through collaborative and unified efforts to provide a variety of learning opportunities that further our audiences’ understanding and appreciation of both human and natural environments.”
CANOE provides a unique opportunity for partnership with existing organizations that promote general awareness and enjoyment of nature and science. CANOE members have committed members and supporters who identify with and trust these institutions. CANOE needs support for maintaining this important collaboration. They have developed a shared events calendar and can pass along important and timely information to their constituents via e-mail, website postings and various social media with which they are currently engaged.
In addition to CANOE several other important organizations provide education and outreach to target audiences, such as Colorado Agricultural Leadership Foundation (CALF) (www.thecalf.org); Jefferson Soil and Water Conservation District (www.jeffswcd.org) and the Coalition for the Upper South Platte (CUSP) (www.uppersouthplatte.org). Added to these local area institutions are South Suburban Parks & Recreation which is home to South Platte Park and the Carson Nature Center (www.ssprd.org/Facilities/Nature/CarsonNatureCenter).
A coordinated effort among these organizations with local ties will assure that relevant information can be delivered to a target audience from a trusted source. A matrix identifying existing organizations that have agreed to support the watershed planning and watershed plan implementation for the Chatfield Watershed is provided in Table 6-2.
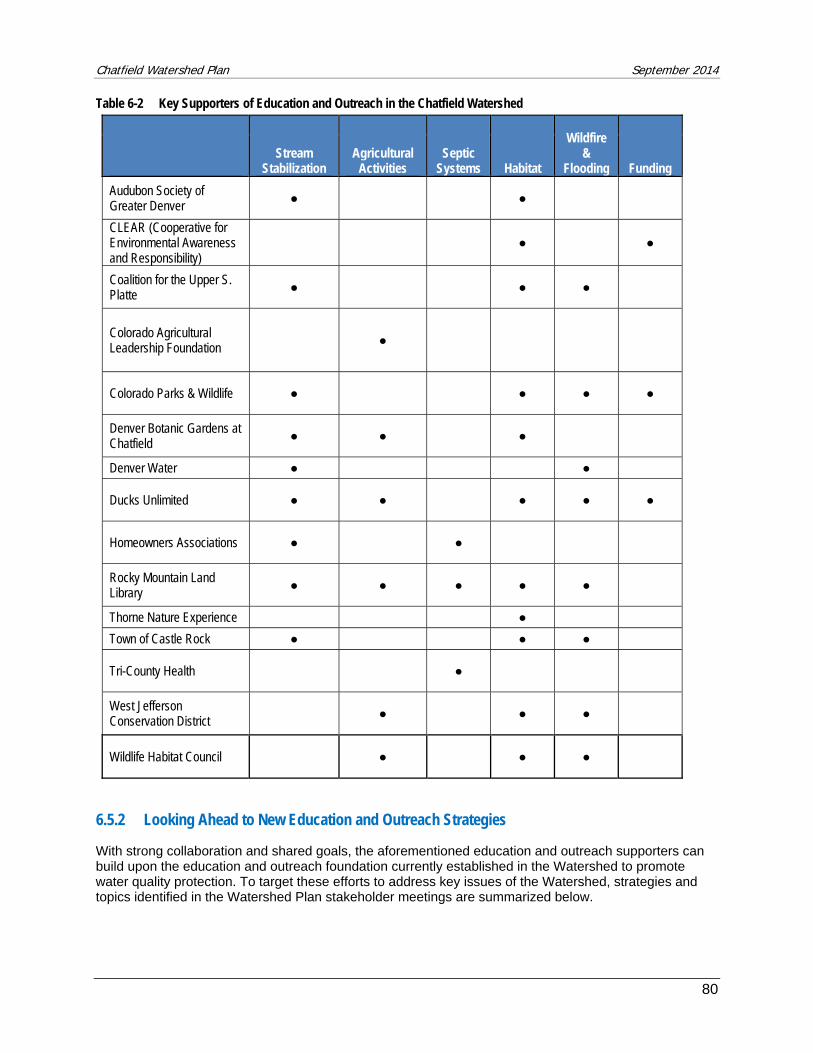
Chatfield Watershed Plan September 2014
80
Table 6-2 Key Supporters of Education and Outreach in the Chatfield Watershed
Stream
Stabilization Agricultural
Activities Septic
Systems Habitat
Wildfire &
Flooding Funding
Audubon Society of Greater Denver ● ●
CLEAR (Cooperative for Environmental Awareness and Responsibility)
● ●
Coalition for the Upper S. Platte
● ● ●
Colorado Agricultural Leadership Foundation ●
Colorado Parks & Wildlife ● ● ● ●
Denver Botanic Gardens at Chatfield ● ● ●
Denver Water ● ●
Ducks Unlimited ● ● ● ● ●
Homeowners Associations ● ●
Rocky Mountain Land Library ● ● ● ● ●
Thorne Nature Experience ●
Town of Castle Rock ● ● ●
Tri-County Health ●
West Jefferson Conservation District ● ● ●
Wildlife Habitat Council ● ● ●
6.5.2 Looking Ahead to New Education and Outreach Strategies
With strong collaboration and shared goals, the aforementioned education and outreach supporters can build upon the education and outreach foundation currently established in the Watershed to promote water quality protection. To target these efforts to address key issues of the Watershed, strategies and topics identified in the Watershed Plan stakeholder meetings are summarized below.
Chatfield Watershed Plan September 2014
81
Wildfires
Educate school children that wildfires are a natural occurrence. These natural events are exacerbated when poor land management practices are implemented and developments are made in close vicinity to fire hazardous areas. Landowners with significant forest property can reduce fire severity and the consequential impacts by practices various forest health measures.
Streambank Stabilization
Signage at streambank restoration locations is extremely helpful in educating the community on the purpose and benefits of such projects.
Septic Systems
General education or awareness on septic systems and leachate fields so that people can understand the potential impacts of a faulty system and the importance of inspections.
Agricultural Activities
Education and outreach efforts may include demonstrations, field trips, or public accessibility to sites where people can learn about the measures and practices being implemented on agricultural grounds to protect water quality. There are two goals here; (1) inform the public that everyone is responsible for protecting water quality, and (2) inform the agricultural community of the feasibility and effectiveness of such measures so that they can learn from each other.
Local Employees
Local industries and employers, such as Lockheed Martin, can be a pivotal conduit in reaching out to the community. Local industry and employers can assist in implementing employee programs that address water quality issues. Many employees live in the Chatfield Watershed where they work.
Students
Building off of the existing voluntary monitoring effort being conducted in the Plum Creek Watershed, reach out to students to assist in monitoring efforts through establishment of “monitoring teams” that collect split samples and analyze results (see Appendix H – Framework for Volunteer Water Quality Monitoring). This “learning by doing” approach can be one of the most effective education and outreach methods for local youth, as demonstrated through the River Watch program in Colorado.
6.5.3 Funding New Education and Outreach Strategies
Given that organizations are identified and a strategy that promotes more cooperative efforts has evolved, funding is the key resource needed to facilitate implementation of education and outreach efforts. The following entities are strong resources for grant and other funding opportunities related to education and outreach efforts.
Urban Waters Partnership Colorado Water Conservation Board (CWCB)
Chatfield Watershed Plan September 2014
82
Colorado Department of Public Health and Environment (CDPHE) Colorado Parks and Wildlife Partners Program
6.6 Pollutant Source Load Reductions
Potential load reductions associated with the implementation of management measures are examined through the use of the loading spreadsheet tool described Section 5.7. The spreadsheet tool applies estimated pollutant removal efficiencies to a prescribed area of land use and zoning to estimate the pollutant load that could potentially occur under these land use conditions. It is important to note that because the load reductions are based on a tool used to determine approximate loading values by land use, the load reductions values are also estimates. Therefore, the load reductions are best interpreted by evaluating the relative load reductions (i.e., percent reductions). These relative reductions are particularly useful because they are still applicable even if the raw loading values estimated by the spreadsheet tool are imprecise.
Table 6-3 presents the management scenarios, or the data input, that was used to examine potential load reduction benefits. The pollutant removal efficiencies are specific to the select management scenario applied and are based on average reported removal rates affiliated with that management strategy. The extent of application considers a spatial extent percentage of application for each management strategy. For purposes of the Watershed Plan, a potential maximum extent of application (percentage) was considered to demonstrate the optimal benefits possible. “Assumed maximum extent” implies the maximum amount of land use that would be reasonably applied (at a maximum). For example, to implement agricultural activities on a “maximum scenario” it is assumed that 90% of agricultural lands will implement conservation plans and BMPs. The septic system management scenario implies that septic system management measures such as locating systems away from stream influence areas (i.e. alluvium and floodplain), maintenance, repair, replacement, incorporation of alternative pre-treatment upgrades, or conversion to sewer or centralized treatment will occur, as appropriate, at the prescribed land use percentages described in Table 6-3.
The results of these scenarios are intended to demonstrate what is possible at aggressive extents of application and are summarized in Table 6-4. As a planning tool, the spreadsheet estimates what the future could hold using conservative results in both estimated annual loads and percent reductions. As funding and resources are available, collection of site-specific local watershed data will refine the loading estimates and percent reductions. The driving purpose of the spreadsheet tool was to create a planning level tool that can examine potential load reductions by changing removal efficiency scenarios and land application extents. The tool was not intended to accurately quantify current loading conditions as it does not consider in-stream fate and transport processes. The existing conditions generated by this tool are gross estimates of what is occurring in the Watershed and potential conditions in the future. It is proposed that this tool will be replaced with a robust watershed model, as funding and additional data are available to support these efforts.
Although the management scenarios represent different extents of application, relative load reduction can be examined between drainages and across parameters for each management measure type. For instance, management measures geared towards agricultural activities address the entire suite of parameters (TSS, TN, TP and Bacteria) compared to streambank stabilization measures which may only address TSS and TP. Streambank stabilization efforts, however, provide additional potential benefits which are not represented in these results (i.e., habitat benefits).
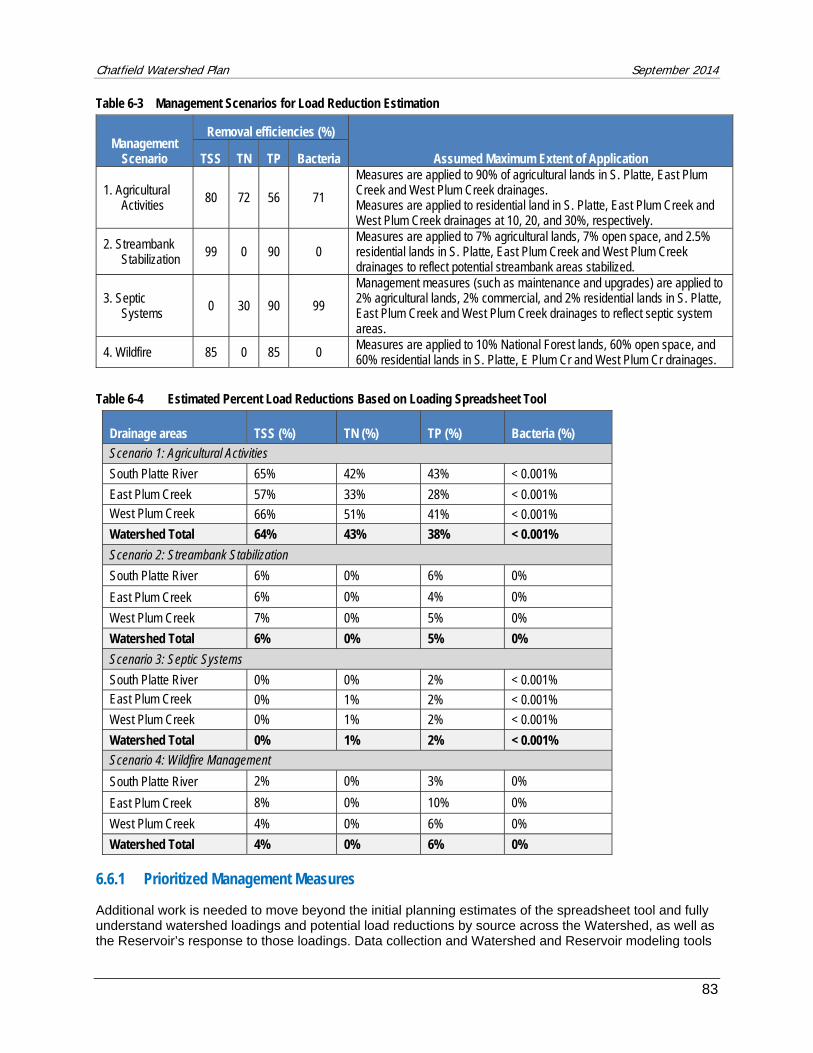
Chatfield Watershed Plan September 2014
83
Table 6-3 Management Scenarios for Load Reduction Estimation
Management Scenario
Removal efficiencies (%)
Assumed Maximum Extent of Application TSS TN TP Bacteria
1. Agricultural Activities
80 72 56 71
Measures are applied to 90% of agricultural lands in S. Platte, East Plum Creek and West Plum Creek drainages. Measures are applied to residential land in S. Platte, East Plum Creek and West Plum Creek drainages at 10, 20, and 30%, respectively.
2. Streambank Stabilization
99 0 90 0 Measures are applied to 7% agricultural lands, 7% open space, and 2.5% residential lands in S. Platte, East Plum Creek and West Plum Creek drainages to reflect potential streambank areas stabilized.
3. Septic Systems 0 30 90 99
Management measures (such as maintenance and upgrades) are applied to 2% agricultural lands, 2% commercial, and 2% residential lands in S. Platte, East Plum Creek and West Plum Creek drainages to reflect septic system areas.
4. Wildfire 85 0 85 0 Measures are applied to 10% National Forest lands, 60% open space, and 60% residential lands in S. Platte, E Plum Cr and West Plum Cr drainages.
Table 6-4 Estimated Percent Load Reductions Based on Loading Spreadsheet Tool
Drainage areas TSS (%) TN (%) TP (%) Bacteria (%)
Scenario 1: Agricultural Activities
South Platte River 65% 42% 43% < 0.001%
East Plum Creek 57% 33% 28% < 0.001% West Plum Creek 66% 51% 41% < 0.001%
Watershed Total 64% 43% 38% < 0.001%
Scenario 2: Streambank Stabilization
South Platte River 6% 0% 6% 0%
East Plum Creek 6% 0% 4% 0%
West Plum Creek 7% 0% 5% 0%
Watershed Total 6% 0% 5% 0%
Scenario 3: Septic Systems
South Platte River 0% 0% 2% < 0.001%
East Plum Creek 0% 1% 2% < 0.001%
West Plum Creek 0% 1% 2% < 0.001%
Watershed Total 0% 1% 2% < 0.001%
Scenario 4: Wildfire Management
South Platte River 2% 0% 3% 0%
East Plum Creek 8% 0% 10% 0%
West Plum Creek 4% 0% 6% 0%
Watershed Total 4% 0% 6% 0%
6.6.1 Prioritized Management Measures
Additional work is needed to move beyond the initial planning estimates of the spreadsheet tool and fully understand watershed loadings and potential load reductions by source across the Watershed, as well as the Reservoir’s response to those loadings. Data collection and Watershed and Reservoir modeling tools
Chatfield Watershed Plan September 2014
84
are imperative to provide a broader understanding of watershed loadings, pollutant transport, and reservoir response. As funding is available, potential management measures are described below:
Study/Investigation: Investigate and identify potential Watershed and Reservoir models appropriate for the Chatfield Watershed and its Reservoir. Some watershed based models capable of simulating watershed-scale pollutant transport include, but are not limited to, Loading Simulation Program in C++ (LSPC), Soil and Water Assessment Tool (SWAT), Watershed Analysis Risk management Framework (WARMF), Environmental Fluid Dynamics Code (EFDC), and Hydrologic Simulation Program – Fortran (HSPF). Dynamic reservoir models like EFDC are well suited for Chatfield Reservoir and its Watershed, as either can estimate pollutant loads while considering water column dynamics and dynamic watershed inputs. Models such as these may also be appropriate for collaborative efforts in meeting the modeling requirements for the proposed Chatfield Reallocation Project. Monitoring: Collection of additional Watershed and Reservoir data is critical to understand potential sources and develop and calibrate models. Additional data is needed to understand the fate and transport of TP from the Watershed to the Reservoir. Only through additional data and analyses can a reliable prediction of reservoir water quality response to proposed management activities be made and fate and transport mechanisms understood. Project: Development of Reservoir and Watershed models to allow a comprehensive and quantitative loading assessment and to improve understanding of fate and transport of pollutants and subsequent reservoir response. Such modeling tools will facilitate development and re-partitioning of the phosphorus TMAL (a regulatory requirement), in addition to projecting future water quantity and quality changes in the Reservoir and Watershed.
Chatfield Watershed Plan April 2015
85
7. Implementation Program
To promote water quality protection, potential management measures, dependent on funding and commensurate cost and benefit analyses, are identified to address key nonpoint source issues in the Chatfield Watershed. The management measures identified in the implementation schedule are potential actions determined through collaborative stakeholder efforts intended to meet specific Watershed needs and achieve pollutant load reductions. Collection of additional water quality data and the development of a linked reservoir-watershed model are paramount priorities of the Chatfield Watershed as these actions will help dictate specific priorities and identify specific issues and areas of concern. Enhanced data collection and the development of water quality models will help guide decisions and focus future watershed efforts on actions that are most impactful and cost-effective. A list highlighting example projects and efforts implemented or currently on-going in the Chatfield Watershed is presented in Appendix I.
An implementation schedule with possible milestones, a monitoring plan, technical and funding resources, and load reduction checkpoints are key elements of the Chatfield Watershed Implementation Program presented in the following sections.
7.1 Proposed Implementation Program and Milestones
The proposed implementation program and associated milestones (Table 7-1) are intended to serve as a guide to manage and prioritize potential actions to promote water quality protection. All activities are subject to available funding, awarded grants, permitting or votes, as some management measures are at the discretion of regulatory bodies or other appropriate entities. As a living document, the Chatfield Watershed Plan is intended to be reviewed annually to modify projects or priorities as needed to reflect the changing trends and conditions of the Watershed. Actions and projects are scheduled in 3-year timeframes since their potential implementation is subject to funding, as well as political support from land use agencies and the community. As opportunities arise, the Watershed Plan will serve as a roadmap for project priorities.
Classifications used in the previous sections are also presented in the schedule. The classifications and representative letters are as follows: Pilot Projects (PP), Projects (P), Regulatory (R), Action (A), Education and Outreach (E&O), Study/Investigation (S/I), and Monitoring (M). The nonpoint source pollutant category each management measure is intended to address is indicated by a (●) symbol. More information on each management measure can be found in the respective nonpoint pollutant source sections above in Section 6, as indicated by the (●) symbol. Since many measures potentially have multiple benefits and address more than one nonpoint pollutant source, but to differing extents, those secondary nonpoint pollutant sources are indicated by a (◐) symbol in Table 7-1 .
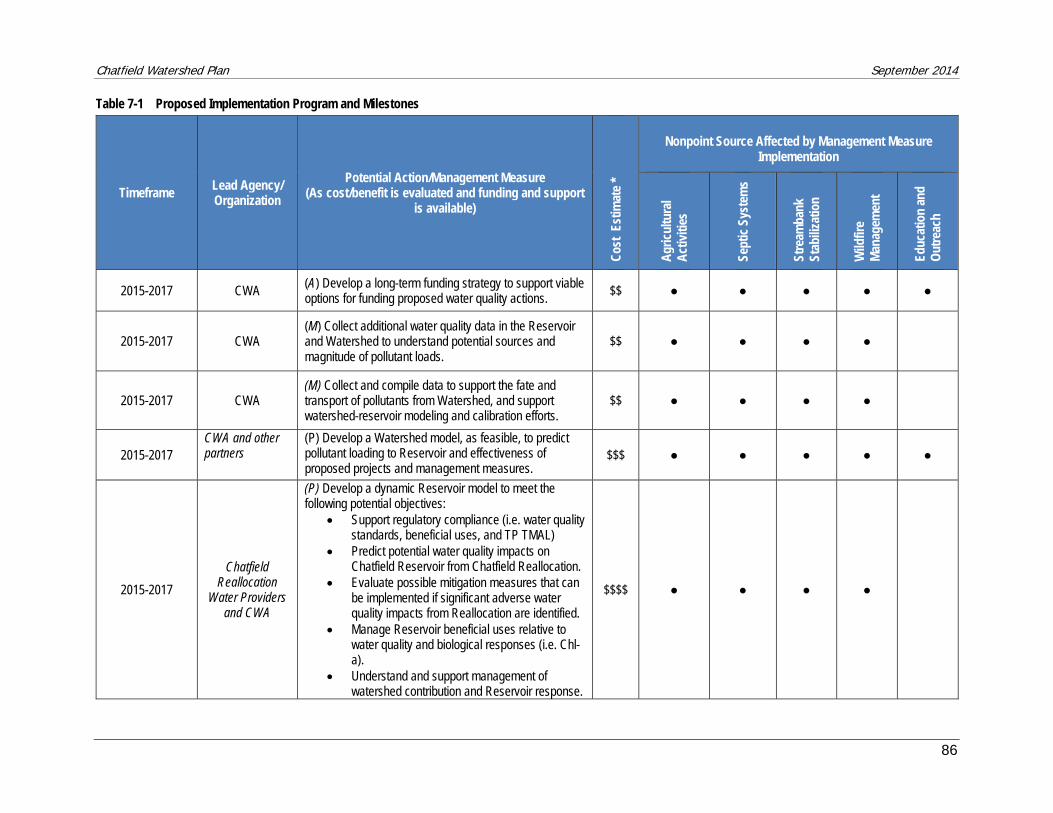
Chatfield Watershed Plan September 2014
86
Table 7-1 Proposed Implementation Program and Milestones
Timeframe Lead Agency/ Organization
Potential Action/Management Measure (As cost/benefit is evaluated and funding and support
is available)
Cos
t Es
timat
e *
Nonpoint Source Affected by Management Measure Implementation
Agr
icul
tura
l A
ctiv
ities
Sept
ic S
yste
ms
Stre
amba
nk
Stab
iliza
tion
Wild
fire
Man
agem
ent
Educ
atio
n an
d O
utre
ach
2015-2017 CWA (A) Develop a long-term funding strategy to support viable options for funding proposed water quality actions. $$ ● ● ● ● ●
2015-2017 CWA (M) Collect additional water quality data in the Reservoir and Watershed to understand potential sources and magnitude of pollutant loads.
$$ ● ● ● ●
2015-2017 CWA (M) Collect and compile data to support the fate and transport of pollutants from Watershed, and support watershed-reservoir modeling and calibration efforts.
$$ ● ● ● ●
2015-2017 CWA and other partners
(P) Develop a Watershed model, as feasible, to predict pollutant loading to Reservoir and effectiveness of proposed projects and management measures.
$$$ ● ● ● ● ●
2015-2017
Chatfield Reallocation
Water Providers and CWA
(P) Develop a dynamic Reservoir model to meet the following potential objectives:
Support regulatory compliance (i.e. water quality standards, beneficial uses, and TP TMAL)
Predict potential water quality impacts on Chatfield Reservoir from Chatfield Reallocation.
Evaluate possible mitigation measures that can be implemented if significant adverse water quality impacts from Reallocation are identified.
Manage Reservoir beneficial uses relative to water quality and biological responses (i.e. Chl- a).
Understand and support management of watershed contribution and Reservoir response.
$$$$ ● ● ● ●
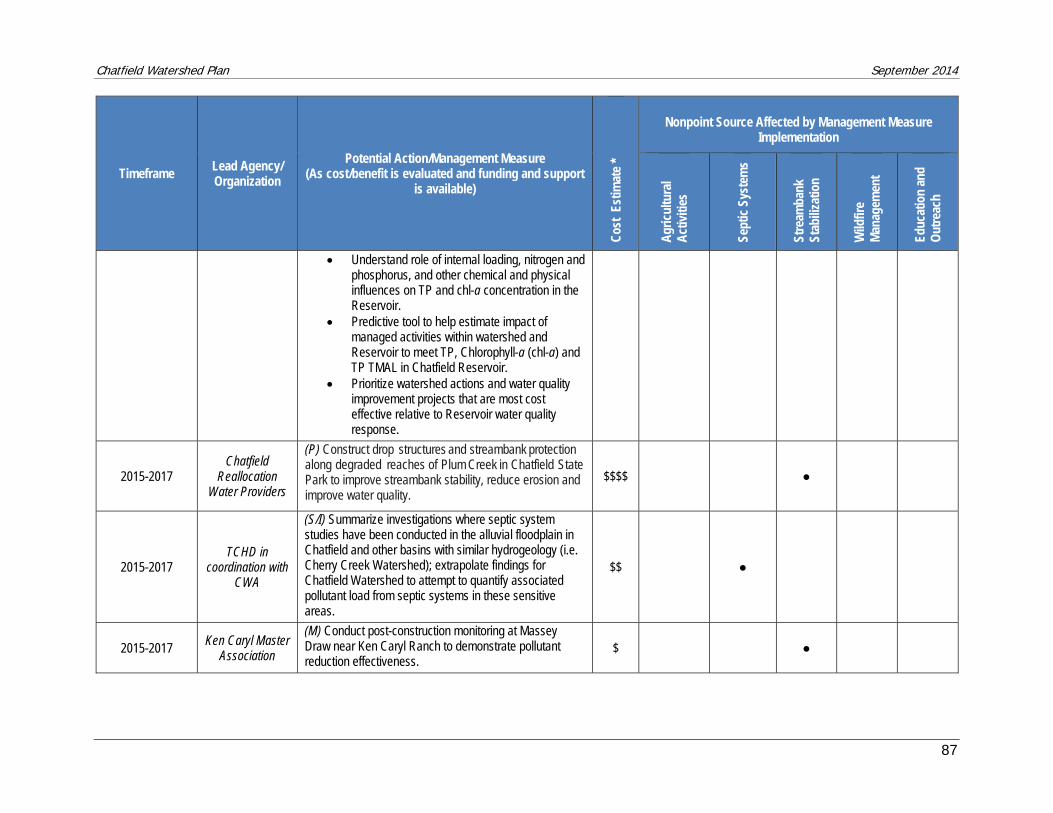
Chatfield Watershed Plan September 2014
87
Timeframe Lead Agency/ Organization
Potential Action/Management Measure (As cost/benefit is evaluated and funding and support
is available)
Cos
t Es
timat
e *
Nonpoint Source Affected by Management Measure Implementation
Agr
icul
tura
l A
ctiv
ities
Sept
ic S
yste
ms
Stre
amba
nk
Stab
iliza
tion
Wild
fire
Man
agem
ent
Educ
atio
n an
d O
utre
ach
Understand role of internal loading, nitrogen and phosphorus, and other chemical and physical influences on TP and chl-a concentration in the Reservoir.
Predictive tool to help estimate impact of managed activities within watershed and Reservoir to meet TP, Chlorophyll-a (chl-a) and TP TMAL in Chatfield Reservoir.
Prioritize watershed actions and water quality improvement projects that are most cost effective relative to Reservoir water quality response.
2015-2017 Chatfield
Reallocation Water Providers
(P) Construct drop structures and streambank protection along degraded reaches of Plum Creek in Chatfield State Park to improve streambank stability, reduce erosion and improve water quality.
$$$$ ●
2015-2017 TCHD in
coordination with CWA
(S/I) Summarize investigations where septic system studies have been conducted in the alluvial floodplain in Chatfield and other basins with similar hydrogeology (i.e. Cherry Creek Watershed); extrapolate findings for Chatfield Watershed to attempt to quantify associated pollutant load from septic systems in these sensitive areas.
$$ ●
2015-2017 Ken Caryl Master
Association
(M) Conduct post-construction monitoring at Massey Draw near Ken Caryl Ranch to demonstrate pollutant reduction effectiveness.
$ ●
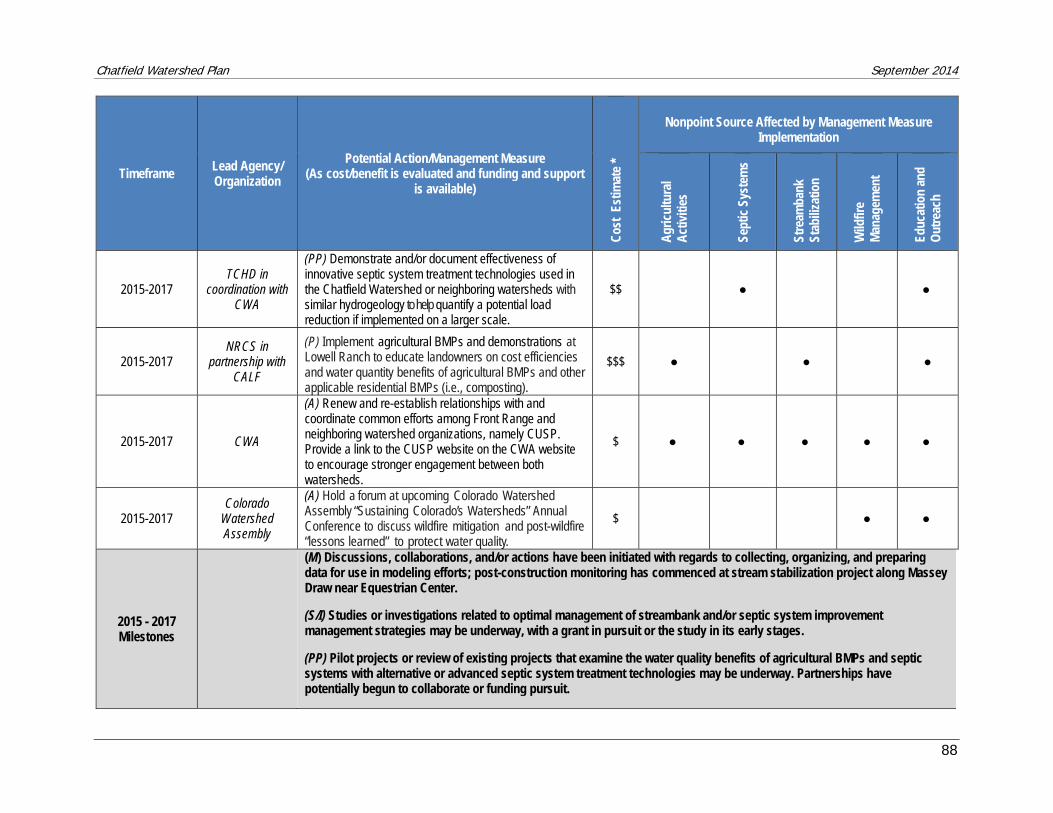
Chatfield Watershed Plan September 2014
88
Timeframe Lead Agency/ Organization
Potential Action/Management Measure (As cost/benefit is evaluated and funding and support
is available)
Cos
t Es
timat
e *
Nonpoint Source Affected by Management Measure Implementation
Agr
icul
tura
l A
ctiv
ities
Sept
ic S
yste
ms
Stre
amba
nk
Stab
iliza
tion
Wild
fire
Man
agem
ent
Educ
atio
n an
d O
utre
ach
2015-2017 TCHD in
coordination with CWA
(PP) Demonstrate and/or document effectiveness of innovative septic system treatment technologies used in the Chatfield Watershed or neighboring watersheds with similar hydrogeology to help quantify a potential load reduction if implemented on a larger scale.
$$ ● ●
2015-2017 NRCS in
partnership with CALF
(P) Implement agricultural BMPs and demonstrations at Lowell Ranch to educate landowners on cost efficiencies and water quantity benefits of agricultural BMPs and other applicable residential BMPs (i.e., composting).
$$$ ● ● ●
2015-2017 CWA
(A) Renew and re-establish relationships with and coordinate common efforts among Front Range and neighboring watershed organizations, namely CUSP. Provide a link to the CUSP website on the CWA website to encourage stronger engagement between both watersheds.
$ ● ● ● ● ●
2015-2017 Colorado
Watershed Assembly
(A) Hold a forum at upcoming Colorado Watershed Assembly “Sustaining Colorado’s Watersheds” Annual Conference to discuss wildfire mitigation and post-wildfire “lessons learned” to protect water quality.
$ ● ●
2015 - 2017 Milestones
(M) Discussions, collaborations, and/or actions have been initiated with regards to collecting, organizing, and preparing data for use in modeling efforts; post-construction monitoring has commenced at stream stabilization project along Massey Draw near Equestrian Center. (S/I) Studies or investigations related to optimal management of streambank and/or septic system improvement management strategies may be underway, with a grant in pursuit or the study in its early stages. (PP) Pilot projects or review of existing projects that examine the water quality benefits of agricultural BMPs and septic systems with alternative or advanced septic system treatment technologies may be underway. Partnerships have potentially begun to collaborate or funding pursuit.
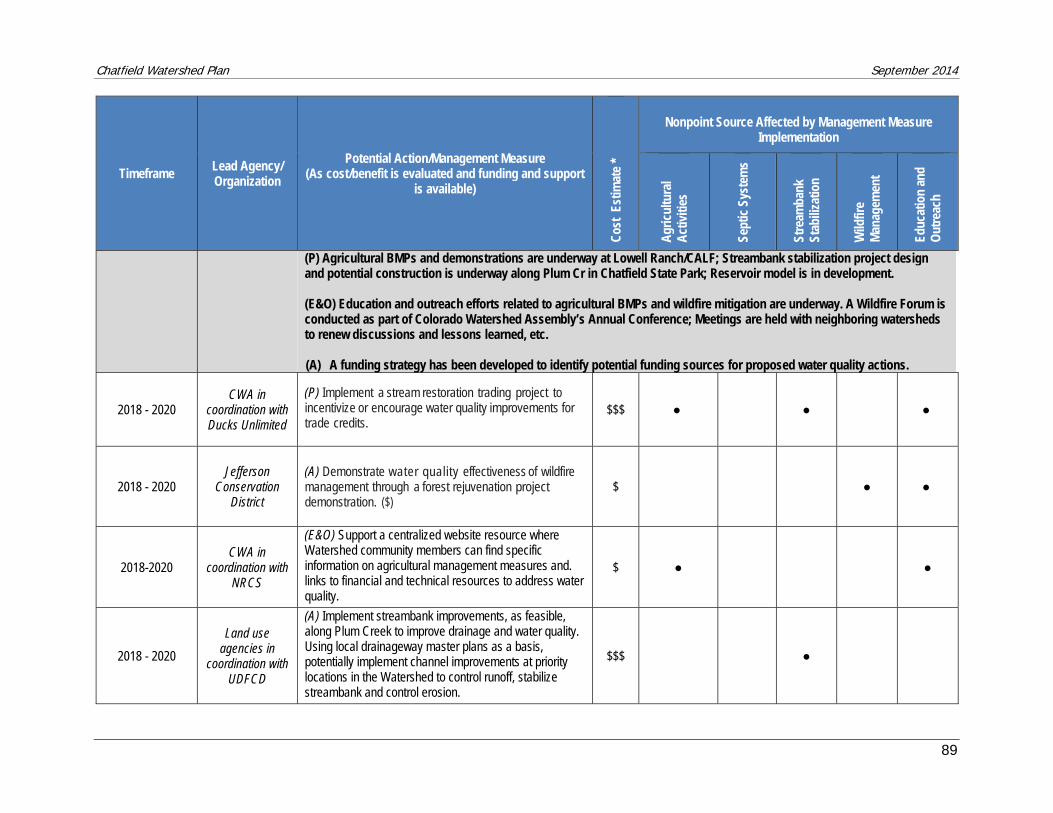
Chatfield Watershed Plan September 2014
89
Timeframe Lead Agency/ Organization
Potential Action/Management Measure (As cost/benefit is evaluated and funding and support
is available)
Cos
t Es
timat
e *
Nonpoint Source Affected by Management Measure Implementation
Agr
icul
tura
l A
ctiv
ities
Sept
ic S
yste
ms
Stre
amba
nk
Stab
iliza
tion
Wild
fire
Man
agem
ent
Educ
atio
n an
d O
utre
ach
(P) Agricultural BMPs and demonstrations are underway at Lowell Ranch/CALF; Streambank stabilization project design and potential construction is underway along Plum Cr in Chatfield State Park; Reservoir model is in development. (E&O) Education and outreach efforts related to agricultural BMPs and wildfire mitigation are underway. A Wildfire Forum is conducted as part of Colorado Watershed Assembly’s Annual Conference; Meetings are held with neighboring watersheds to renew discussions and lessons learned, etc. (A) A funding strategy has been developed to identify potential funding sources for proposed water quality actions.
2018 - 2020 CWA in
coordination with Ducks Unlimited
(P) Implement a stream restoration trading project to incentivize or encourage water quality improvements for trade credits.
$$$ ● ● ●
2018 - 2020 Jefferson
Conservation District
(A) Demonstrate water quality effectiveness of wildfire management through a forest rejuvenation project demonstration. ($)
$ ● ●
2018-2020 CWA in
coordination with NRCS
(E&O) Support a centralized website resource where Watershed community members can find specific information on agricultural management measures and. links to financial and technical resources to address water quality.
$ ● ●
2018 - 2020
Land use agencies in
coordination with UDFCD
(A) Implement streambank improvements, as feasible, along Plum Creek to improve drainage and water quality. Using local drainageway master plans as a basis, potentially implement channel improvements at priority locations in the Watershed to control runoff, stabilize streambank and control erosion.
$$$ ●
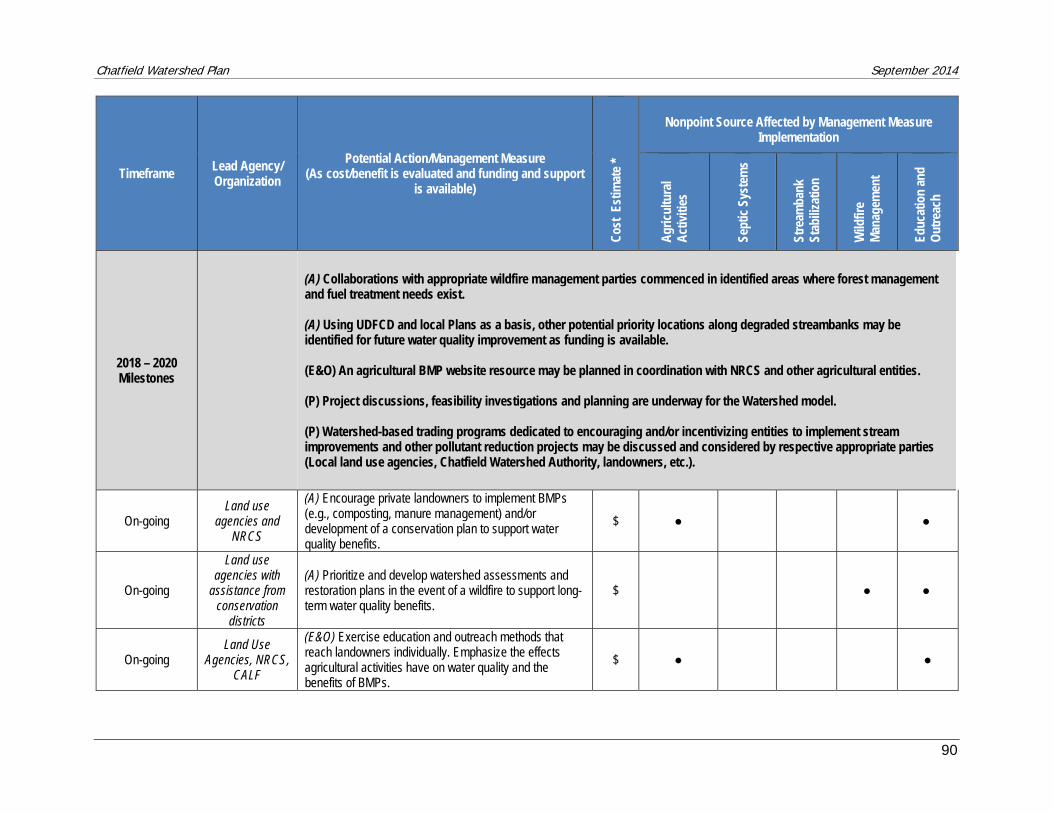
Chatfield Watershed Plan September 2014
90
Timeframe Lead Agency/ Organization
Potential Action/Management Measure (As cost/benefit is evaluated and funding and support
is available)
Cos
t Es
timat
e *
Nonpoint Source Affected by Management Measure Implementation
Agr
icul
tura
l A
ctiv
ities
Sept
ic S
yste
ms
Stre
amba
nk
Stab
iliza
tion
Wild
fire
Man
agem
ent
Educ
atio
n an
d O
utre
ach
2018 – 2020 Milestones
(A) Collaborations with appropriate wildfire management parties commenced in identified areas where forest management and fuel treatment needs exist. (A) Using UDFCD and local Plans as a basis, other potential priority locations along degraded streambanks may be identified for future water quality improvement as funding is available. (E&O) An agricultural BMP website resource may be planned in coordination with NRCS and other agricultural entities. (P) Project discussions, feasibility investigations and planning are underway for the Watershed model. (P) Watershed-based trading programs dedicated to encouraging and/or incentivizing entities to implement stream improvements and other pollutant reduction projects may be discussed and considered by respective appropriate parties (Local land use agencies, Chatfield Watershed Authority, landowners, etc.).
On-going Land use
agencies and NRCS
(A) Encourage private landowners to implement BMPs (e.g., composting, manure management) and/or development of a conservation plan to support water quality benefits.
$ ● ●
On-going
Land use agencies with
assistance from conservation
districts
(A) Prioritize and develop watershed assessments and restoration plans in the event of a wildfire to support long-term water quality benefits.
$ ● ●
On-going Land Use
Agencies, NRCS, CALF
(E&O) Exercise education and outreach methods that reach landowners individually. Emphasize the effects agricultural activities have on water quality and the benefits of BMPs.
$ ● ●
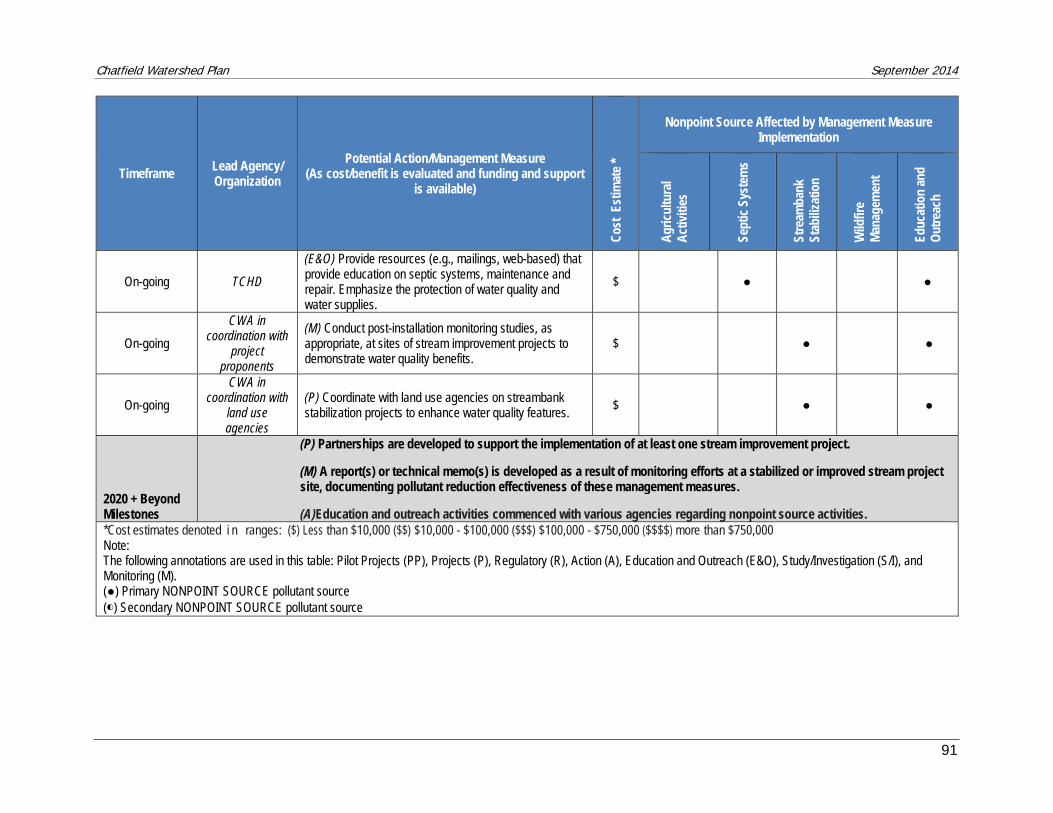
Chatfield Watershed Plan September 2014
91
Timeframe Lead Agency/ Organization
Potential Action/Management Measure (As cost/benefit is evaluated and funding and support
is available)
Cos
t Es
timat
e *
Nonpoint Source Affected by Management Measure Implementation
Agr
icul
tura
l A
ctiv
ities
Sept
ic S
yste
ms
Stre
amba
nk
Stab
iliza
tion
Wild
fire
Man
agem
ent
Educ
atio
n an
d O
utre
ach
On-going TCHD
(E&O) Provide resources (e.g., mailings, web-based) that provide education on septic systems, maintenance and repair. Emphasize the protection of water quality and water supplies.
$ ● ●
On-going
CWA in coordination with
project proponents
(M) Conduct post-installation monitoring studies, as appropriate, at sites of stream improvement projects to demonstrate water quality benefits.
$ ● ●
On-going
CWA in coordination with
land use agencies
(P) Coordinate with land use agencies on streambank stabilization projects to enhance water quality features. $ ● ●
2020 + Beyond Milestones
(P) Partnerships are developed to support the implementation of at least one stream improvement project. (M) A report(s) or technical memo(s) is developed as a result of monitoring efforts at a stabilized or improved stream project site, documenting pollutant reduction effectiveness of these management measures. (A)Education and outreach activities commenced with various agencies regarding nonpoint source activities.
*Cost estimates denoted i n ranges: ($) Less than $10,000 ($$) $10,000 - $100,000 ($$$) $100,000 - $750,000 ($$$$) more than $750,000 Note: The following annotations are used in this table: Pilot Projects (PP), Projects (P), Regulatory (R), Action (A), Education and Outreach (E&O), Study/Investigation (S/I), and Monitoring (M). (●) Primary NONPOINT SOURCE pollutant source (◐) Secondary NONPOINT SOURCE pollutant source
Chatfield Watershed Plan September 2014
92
7.2 Monitoring Plan
As discussed in Section 4, Watershed monitoring efforts are presently taking place and are coordinated by the CWA. These monitoring efforts will continue and will be presented in the Chatfield Watershed Annual Report. Overall Watershed assessment will be improved by the continuation of the Chatfield and Plum Creek Monitoring Program efforts.
Additional monitoring efforts would be useful in the Watershed as resources are available, including monitoring at Massey Draw and Deer Creek and pre- and post- monitoring at project sites to evaluate the effectiveness of implemented management measures. Massey Draw and Deer Creek are two stream systems in the Chatfield Watershed that discharge directly into the Chatfield Reservoir but do not have a monitoring plan in place. Monitoring at the discharge points of each stream system would allow for characterization of water quality conditions, identification of water quality benefits from implemented management measures, and further quantification of inputs into the Chatfield Reservoir.
Pre- and post-monitoring at project sites is also strongly encouraged as the monitoring data would help identify the effectiveness of that particular project and potentially support the pursuit or establishment of similar activities elsewhere in the Watershed. Depending on the project layout and location, pre- and post-monitoring may take place at the discharge point of a site or at an in-stream location. For instance, to measure the effectiveness of an agricultural BMP, monitoring may occur at an identifiable discharge point on-site, or monitoring may take place in-stream as in the case of stream improvement projects. Each monitoring effort to examine pre- and post- water quality improvements will have its own monitoring plan or Quality Assurance Project Plan (QAPP). Pre- and post-monitoring efforts are beneficial regardless of project size. These results can be used to support source assessments, develop accurate evaluations of nonpoint loadings, and demonstrate effectiveness that can potentially be scaled to larger implementation efforts.
7.3 Technical and Funding Assistance
Successful implementation of potential management measures identified in the Watershed Plan is dependent upon available technical and funding assistance. To ensure successful implementation, potential partnership and funding resources are identified in Table 7-2. With strategic partnerships and planning, projects may be funded through competitive grant processes.
Several of the resources listed in Table 7-2 support common causes, and, therefore, can potentially form beneficial collaborations. A key strategy this Plan emphasizes is the collaboration with CUSP, the watershed management authority of the Upper South Platte Watershed which also discharges to the Chatfield Reservoir. Nutrient management, specifically of phosphorus, is a shared goal within the Chatfield Watershed and Upper South Platte River Watershed (CUSP 2006) in order to meet the annual TP load allocations identified in Control Regulation 73. Partnership with CUSP will enhance CWA’s ability to reach areas outside Chatfield Watershed boundaries to address nonpoint source issues and ultimately improve conditions in the Chatfield Watershed on a broader, more holistic approach. The table is also useful to identify resources with common interests and strategize collaborations for water quality projects with multi-benefit intents. For instance, parties interested in a project involving streambank stabilization and wildfire management efforts may include, in addition to local land use agencies, the Colorado Wildlife Heritage Foundation, Colorado Department of Transportation, USACE, and South Platte Greenway Foundation. Similarly, a multi-benefit agricultural and streambank improvement project may be supported by the NRCS, National Fish and Wildlife Foundation and Ducks Unlimited. All of the resources listed have experience and expertise with particular pollutant sources and projects or they host grant programs that can potentially provide financial support for a project.
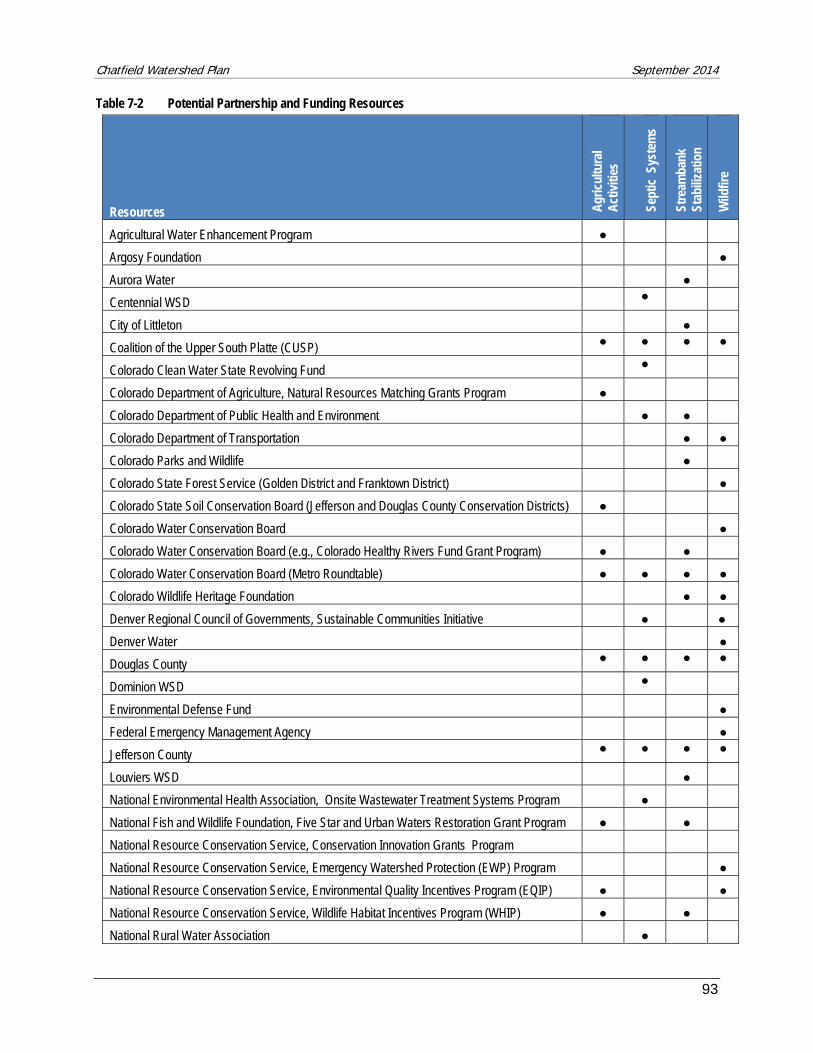
Chatfield Watershed Plan September 2014
93
Table 7-2 Potential Partnership and Funding Resources
Resources Agr
icul
tura
l A
ctiv
ities
Sept
ic S
yste
ms
Stre
amba
nk
Stab
iliza
tion
Wild
fire
Agricultural Water Enhancement Program ●
Argosy Foundation ●
Aurora Water ●
Centennial WSD ●
City of Littleton ●
Coalition of the Upper South Platte (CUSP) ● ● ● ●
Colorado Clean Water State Revolving Fund ●
Colorado Department of Agriculture, Natural Resources Matching Grants Program ●
Colorado Department of Public Health and Environment ● ●
Colorado Department of Transportation ● ●
Colorado Parks and Wildlife ●
Colorado State Forest Service (Golden District and Franktown District) ●
Colorado State Soil Conservation Board (Jefferson and Douglas County Conservation Districts) ●
Colorado Water Conservation Board ●
Colorado Water Conservation Board (e.g., Colorado Healthy Rivers Fund Grant Program) ● ●
Colorado Water Conservation Board (Metro Roundtable) ● ● ● ●
Colorado Wildlife Heritage Foundation ● ●
Denver Regional Council of Governments, Sustainable Communities Initiative ● ●
Denver Water ●
Douglas County ● ● ● ●
Dominion WSD ●
Environmental Defense Fund ●
Federal Emergency Management Agency ●
Jefferson County ● ● ● ●
Louviers WSD ●
National Environmental Health Association, Onsite Wastewater Treatment Systems Program ●
National Fish and Wildlife Foundation, Five Star and Urban Waters Restoration Grant Program ● ●
National Resource Conservation Service, Conservation Innovation Grants Program
National Resource Conservation Service, Emergency Watershed Protection (EWP) Program ●
National Resource Conservation Service, Environmental Quality Incentives Program (EQIP) ● ●
National Resource Conservation Service, Wildlife Habitat Incentives Program (WHIP) ● ●
National Rural Water Association ●
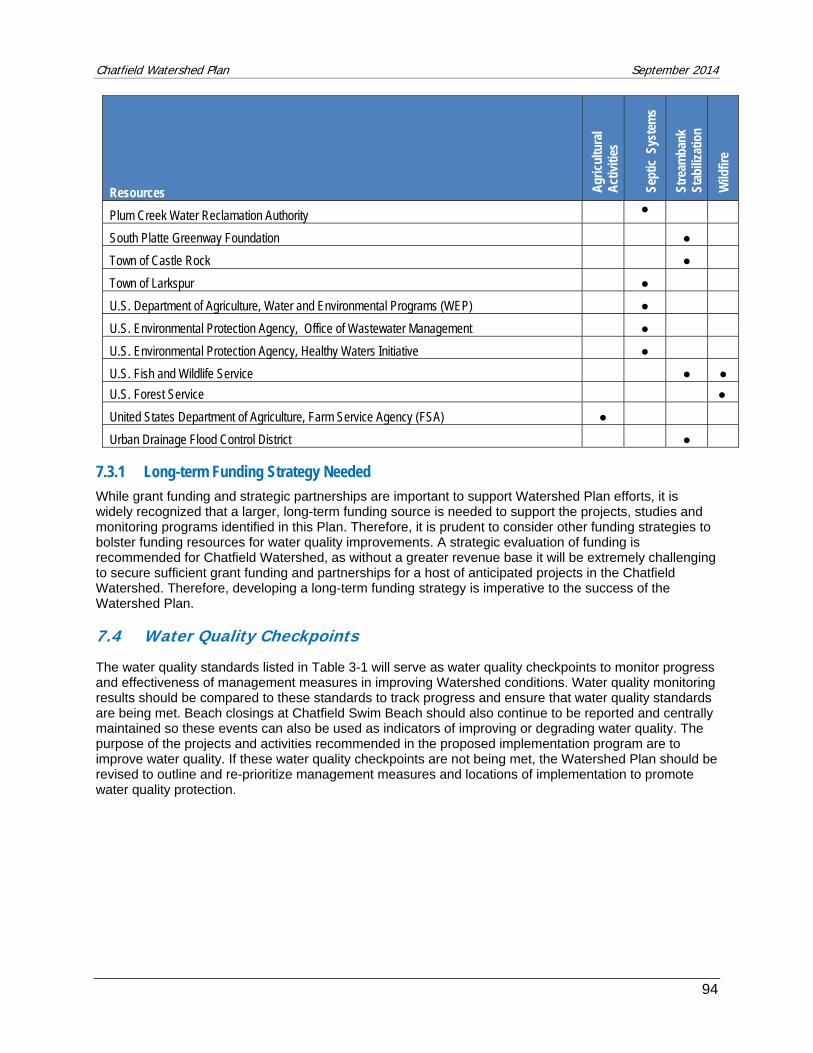
Chatfield Watershed Plan September 2014
94
Resources Agr
icul
tura
l A
ctiv
ities
Sept
ic S
yste
ms
Stre
amba
nk
Stab
iliza
tion
Wild
fire
Plum Creek Water Reclamation Authority ●
South Platte Greenway Foundation ●
Town of Castle Rock ●
Town of Larkspur ●
U.S. Department of Agriculture, Water and Environmental Programs (WEP) ●
U.S. Environmental Protection Agency, Office of Wastewater Management ●
U.S. Environmental Protection Agency, Healthy Waters Initiative ●
U.S. Fish and Wildlife Service ● ●
U.S. Forest Service ●
United States Department of Agriculture, Farm Service Agency (FSA) ●
Urban Drainage Flood Control District ●
7.3.1 Long-term Funding Strategy Needed
While grant funding and strategic partnerships are important to support Watershed Plan efforts, it is widely recognized that a larger, long-term funding source is needed to support the projects, studies and monitoring programs identified in this Plan. Therefore, it is prudent to consider other funding strategies to bolster funding resources for water quality improvements. A strategic evaluation of funding is recommended for Chatfield Watershed, as without a greater revenue base it will be extremely challenging to secure sufficient grant funding and partnerships for a host of anticipated projects in the Chatfield Watershed. Therefore, developing a long-term funding strategy is imperative to the success of the Watershed Plan.
7.4 Water Quality Checkpoints
The water quality standards listed in Table 3-1 will serve as water quality checkpoints to monitor progress and effectiveness of management measures in improving Watershed conditions. Water quality monitoring results should be compared to these standards to track progress and ensure that water quality standards are being met. Beach closings at Chatfield Swim Beach should also continue to be reported and centrally maintained so these events can also be used as indicators of improving or degrading water quality. The purpose of the projects and activities recommended in the proposed implementation program are to improve water quality. If these water quality checkpoints are not being met, the Watershed Plan should be revised to outline and re-prioritize management measures and locations of implementation to promote water quality protection.
Chatfield Watershed Plan September 2014
95
8. References Agnew, W.,R. Lahn, and M. Harding. 2000. Buffalo Creek, Colorado, Fire and Flood of 1996. Available at:
http://www.landandwater.com/features/vol41no1/vol41no1_1.html
Castle Rock Water Engineering. 2011. 2010 Stormwater Master Plan Update. March 2011.
Chatfield Watershed Authority (CWA). 2006. Manure Management Policy. Available at: http://chatfieldwatershedauthority.org/wp-content/uploads/2013/04/Manure-Management-Policy.pdf. Accessed on September 30, 2013.
Chatfield Watershed Authority (CWA). 2007. Chatfield Watershed Report 2006: Annual Summary and Water Quality Fact Sheets. September 2007.
Chatfield Watershed Authority (CWA). 2008. Quality Assurance Project Plan (QAPP), Sampling and Analysis Plan (SAP) and Standard Operating Procedures (SOP). Version 2008.01. November 2007.
Chatfield Watershed Authority (CWA). 2011. 2010 Chatfield Watershed Annual Report. Chatfield Watershed Authority.
Chatfield Watershed Authority (CWA). 2014. 2013 Chatfield Watershed Annual Report. Chatfield Watershed Authority.
Cherry Creek Basin Water Quality Authority (CCBWQA). 2011. Stream Reclamation Water Quality Benefit Evaluation – Interim Status Report. Prepared by the CCWWQA Technical Advisory Committee. June 16, 2011.
CH2M HILL. 2009. Phosphorus removal potential by Implementation of East Plum Creek Restoration Project. December 4, 2009.
Coalition for the Upper South Platte (CUSP). 2006. Revised Watershed Plan. Available at: http://www.uppersouthplatte.org/pdf/CUSP_Strategic_Plan_update_2006%20(2).pdf
Coalition for the Upper South Platte (CUSP). 2013a. Waldo Canyon Fire Watershed Assessment: The WARSS Results. April 5th, 2013. Prepared by: Dave Rosgen, Brandon Rosgen, and Summer Collins of Wildland Hydrology; Jim Nankervis of Blue Mountain Consultants; and Kyle Wright of U.S. Forest Service.
Coalition for the Upper South Platte (CUSP). 2013b. The Waldo Canyon Fire Master Plan for Watershed Restoration & Sediment Reduction. Submitted by: Wildland Hydrology.
Colorado Department of Public Health and Environment (CDPHE). 2012. Colorado Nonpoint Source Program 2012 Management Plan. Colorado Department of Public Health and Environment. Water Quality Control Division. February 13, 2012.
Colorado State Forest Service (CSFS). 2009. Lodgepole Pine Management Guidelines for Land Managers in the Wildland-Urban Interface. Authors: Frank C. Dennis, Jan Burke, Joe Duda, Carey Green, David Hessel, Merrill Kaufmann, Damon Lange, Brook Lee, Hans Rinke, Wayne Sheppard, Bob Sturtevant, Jim Thinnes, Jeff Underhill, Bob Woodmansee.
Colorado State Forest Service (CSFS). 2013a. Colorado WRAP Summary Report: Chatfield Watershed. Report generated using www.ColoradoWildfireRisk.com. Report version 1.1. Generated July 7, 17, 2013.
Chatfield Watershed Plan September 2014
96
Colorado State Forest Service (CSFS). 2013b. Forest Ag Program. Available at: http://csfs.colostate.edu/pages/forest-ag.html. Accessed on August 13th, 2013.
Colorado State University (CSU) Extension. 2013. Urban Agriculture. Available at: http://urbanag.colostate.edu/. Accessed on September 8, 2013.
Colorado Water Conservation Board (CWCB). 2013. Plum Creek Watershed Monitoring Report – Data Collection and Analysis, April 2012 – March 2013. Prepared by Tetra Tech, Inc. April 2013.
Corona Insights. 2009. Colorado Division of Parks and Outdoor Recreation Marketing Assessment: Executive Summary of Findings and Recommendations.
Denver Regional Council of Governments (DRCOG). 1996. Lemna Nonpoint Source Treatment System, Chatfield Reservoir, CO. In: Phosphorus Removal Potential by Implementation of the East Plum Creek Stream Restoration Project. Prepared for Town of Castle Rock. Prepared by CH2M Hill. December 4, 2009.
Denver Water. 2013. From Forests to Faucets: U.S. Forest Service and Denver Water Watershed Management Partnership. Available at: http://www.denverwater.org/SupplyPlanning/WaterSupply/PartnershipUSFS/. Accessed July 16, 2013.
Douglas County. 2008. Douglas County 2030 Comprehensive Master Plan. Douglas County Community Development, Planning and Zoning Services Division. Adopted by the Douglas County Planning Commission. May 12, 2008.
Douglas County. 2011. Community Wildfire Protection Plan. December 2011.
Front Range Fuels Treatment Partnership (FRFTP). 2013. Roundtable. Available at: http://www.frftp.org/roundtable.htm. Accessed on September 23, 2013.
Front Range Watershed Protection Group. 2009. Protecting Critical Watersheds in Colorado from Wildfire: A Technical Approach to Watershed Assessment and Prioritization. August 2009. Prepared by: JW Associates, Inc. Available at: http://www.jw-associates.org/wwpg.html. Accessed on July 19, 2013.
Geospatial Multi-Agency Coordination Group (Geomac). 2013. Geomac Wildland Fire Support. Available at: http://www.geomac.gov/index.shtml. Accessed on July 28, 2013.
Gorman, J., 2013. Spatial Analysis of Nonpoint Source Pollution Impacting the Plum Creek Watershed, Colorado. Completed as part of Colorado School of Mines, Master of Science degree program.
Halepaska and Associates, 1998. Final Report: Evaluation of Water Quality Impacts from Leach Fields in the Upper Cherry Creek Basin. October 1998.
Hunter, M.E., W.D. Shepperd, J.E. Lentile, J.E. Lundquist, M.G. Andreu, J.L. Butler, and F.W. Smith. 2007. A comprehensive guide to fuels treatment practices for ponderosa pine in the Black Hills, Colorado Front Range, and Southwest. Gen. Tech. Rep. RMRS-GTR-198. Fort Collins, CO: U.S. Department of Agriculture, Forest Service, Rocky Mountain Research Station. 93p.
Jefferson Conservation District (JCD). 2013. Jefferson Conservation District. Available at: http://www.jeffersonconservationdistrict.org/. Accessed on August 13, 2013.
Libohova, Zamir. 2004. Effects of Thinning and a Wildfire on Sediment Production Rates, Channel Morphology, and Water Quality in the Upper South Platte River Watershed. Thesis. Colorado State University; Fort Collins, CO. Spring 2004.
Chatfield Watershed Plan September 2014
97
Master, Dennis C., G. Shao, and J. Donnay. 2007. Protecting Front Range Forest Watersheds from High-Severity Wildfires. An assessment by the Pinchot Institute for Conservation funded by the Front Range Fuels Treatment Partnership.
National Interagency Fire Center (NIFC). 2013. BAER Burned Area Emergency Response. Available at http://www.nifc.gov/BAER/Page/NIFC_BAER.html. Accessed on August 13, 2013.
National Park Service (NONPOINT SOURCE). 2013. Hazardous Fuel Reduction. Available at: http://www.nonpoint source.gov/fire/wildland-fire/learning-center/fire-in-depth/hazardous-fuel-reduction.cfm. Accessed on August 13, 2013.
Natural Resources Conservation Service (NRCS). 2013. Emergency Watershed Protection Program (EWP) Fact Sheet. Available at: http://www.nrcs.usda.gov/wps/portal/nrcs/main/national/programs/landscape/ewpp/. Accessed on August 14, 2013.
Natural Resources Conservation Service (NRCS). 2013. Conservation Technical Assistance. Available at: http://www.nrcs.usda.gov/wps/portal/nrcs/main/co/technical/cp/cta/. Accessed on September 8, 2013.
Robichaud, P.R., Ashmun L.E., and Sims B.D. 2010. Post-Fire Treatment Effectiveness for Hillslope Stabilization. USDA Forest Service. Rocky Mountain Research Station. General Technical Report RMRS-GTR-240. August 2010.
Sham, Chi Ho. 2013. Water Research Foundation. Wildfire Readiness and Response Workshop. Denver, CO. April 4-5, 2013. Mitigating Risks of Wildfire for Drinking Water Systems. Available at: http://collab.waterrf.org/Workshops/wildliferrw/default.aspx. Accessed July 19, 2013.
Tetra Tech RMC. 2006. Design of the Cherry Creek Sediment Basin. Denver, CO.: Tetra Tech RMC.
Urban Drainage and Flood Control District (UDFCD). 1996. Flood Hazard Area Delineation. Willow Creek, Little Willow Creek, East Willow Creek. Douglas County, Colorado. Prepared by: Greenhorne & O’Mara, Inc. and Aurora Colorado. December 1996.
UDFCD. 2001. Flood Hazard Area Delineation Plum Creek Watershed. Prepared for: Douglas County; Urban Drainage & Flood Control District. Prepared by: WRC Engineering, INC. November 2001.
UDFCD. 2004. Design Report for Massey Draw Watershed and Ecosystem Improvements Pilot Project. Prepared by: Muller Engineering Company, Inc. October 2004.
UDFCD. 2005. Flood Hazard Area Delineation Massey Draw and SJCD (South). Prepared by: Olsson Associates. December 2005.
UDFCD. 2008. Massey Draw Channel Improvements (Balsam Street to Allison Street) Design Report. May 2008. Prepared by: Muller Engineering Company, Inc.
UDFCD. 2010. Urban Storm Drainage Criteria Manual Volume 3 – Best Management Practices.
URS. 2003. An Evaluation of Nonpoint Source Pollution Risks from On-Site Wastewater Systems in the Franktown Planning Area. URS Corporation, August 2003.
U.S. Army Corps of Engineer (USACE). 2012. Draft Integrated Feasibility Report and Environmental Impact Statement. June 2012.
U.S. Bureau of Reclamation. 1987. Design of Small Dams. Third Edition. A Water Resources Technical Publication. United States Department of the Interior.
Chatfield Watershed Plan September 2014
98
U.S. Census. 2010. TIGER/Line Shapefiles and TIGER/Line Files. Available at: http://www.census.gov/geo/maps-data/data/tiger-line.html. Accessed January 2013.
U.S. Environmental Protection Agency (USEPA). 2000. Low Impact Development (LID) A Literature Review. Office of Water. EPA-841-B-00-005. October 2000.
USEPA. 2002. Onsite Wastewater Treatment Systems Manual. EPA-625-R-00-008. February 2002.
USEPA. 2003. National Management Measures to Control Nonpoint Pollution from Agriculture. EPA 841-B-03-004. July 2003.
USEPA. 2005. Handbook for Managing Onsite and Clustered (Decentralized) Wastewater Treatment Systems Factsheet. EPA-832-B-05-001. December 2005.
USEPA. 2008. Handbook for Developing Watershed Plans to Restore and Protect Our Waters. EPA 841-B-08-002. U.S Environmental Protection Agency, Office of Water, Nonpoint Source Control Branch, Washington, DC.
USEPA. 2010. Green Infrastructure in Arid and Semi-Arid Climates. Office of Water. EPA-833-B-10-002. May 2010.
USEPA. 2013. Animal Feeding Operations. Available at: http://www.epa.gov/region8/water/cafo/. Accessed on August 16th, 2013.
U.S. Forest Service (USFS). 2000. Environmental Assessment for the Upper South Platte Watershed Protection and Restoration project. Pike National Forest. South Platte Ranger District; Morrison, CO. August 2000.
USFS. 2013a. Burned Area Emergency Response, BAER. Available at: http://www.fs.fed.us/biology/watershed/burnareas/background.html. Accessed on August 13, 2013.
USFS. 2013b. Meet the Forest Service. Available at: http://www.fs.fed.us/aboutus/meetfs.shtml. Accessed on August 8, 2013.
Chatfield Watershed Plan September 2014
99
9. Annotated Bibliography
Agnew, W.,R. Lahn, and M. Harding. 2000. Buffalo Creek, Colorado, Fire and Flood of 1996. Available at: http://www.landandwater.com/features/vol41no1/vol41no1_1.html
This publication identified the extent of and impacts of the 1996 Buffalo Creek Fire. Post-fire hazards and mitigation measures were identified and can be used as learning tools for future post-fire efforts.
Castle Rock Water Engineering. 2011. 2010 Stormwater Master Plan Update. March 2011.
The 2010 Stormwater Master Plan (SWMP) Update expands upon the 2004 SWMP. This report outlines the Castle Rock Stormwater Program, reaffirms the programs policies, summarizes completed work, and presents several capital improvement projects. This report was useful in identifying the cost of completed work related to streambank stabilization efforts.
Chatfield Watershed Authority (CWA). 2006. Manure Management Policy. Available at: http://chatfieldwatershedauthority.org/wp-content/uploads/2013/04/Manure-Management-Policy.pdf. Accessed on September 30, 2013.
This publication presents the Manure Management Policy adopted by the Chatfield Watershed Authority in 2006. The information provided in this publication was presented in the Chatfield Watershed Plan to reiterate the existing policy and emphasize animal manure as a contributing factor to nonpoint source pollution in the Chatfield Watershed.
Chatfield Watershed Authority (CWA). 2007. Chatfield Watershed Report 2006: Annual Summary and Water Quality Fact Sheets. September 2007.
The Chatfield Watershed Annual Report presents a summary of the water quality conditions throughout the Chatfield Watershed. In 2006, the water quality conditions presented reflect the water quality changes as a result of the 2002 Hayman Fires and others that have occurred in the Upper South Platte River Basin.
Chatfield Watershed Authority (CWA). 2008. Quality Assurance Project Plan (QAPP), Sampling and Analysis Plan (SAP) and Standard Operating Procedures (SOP). Version 2008.01. November 2007.
This document outlines the sampling procedures and protocols in place for the Chatfield Watershed Monitoring program. It identifies sampling location, sampling parameters, and sampling frequency, sampling methods, and data management, among other aspects of the monitoring program. Technical details on the sampling protocol are held in this document.
Chatfield Watershed Authority (CWA). 2014. 2013 Chatfield Watershed Annual Report. Chatfield Watershed Authority.
The Chatfield Watershed Annual Report presents a summary of the water quality conditions throughout the Chatfield Watershed. The 2013 Annual Report was the latest annual report at the time of development of the Chatfield Watershed Plan.
Cherry Creek Basin Water Quality Authority (CCBWQA). 2011. Stream Reclamation Water Quality Benefit Evaluation – Interim Status Report. Prepared by the CCWWQA Technical Advisory Committee. June 16, 2011.
The evaluation of stream reclamation benefits is evaluated in this Interim Status Report. This report outlines the CCBWQA’s procedures for identifying, evaluating, and prioritizing stream
Chatfield Watershed Plan September 2014
100
reclamation measures to reduce pollutant loads and concentrations discharged to Cherry Creek Reservoir and Cherry Creek. This report is useful in that it identifies parameters that can be used to measure the effectiveness of stream reclamation measures.
CH2M HILL. 2009. Phosphorus Removal Potential by Implementation of East Plum Creek Restoration Project. December 4, 2009.
This Technical Memorandum presents the potential phosphorus removal as a result of implementing the East Plum Creek Restoration Project. This study is based on data compiled from the Plum Creek watershed and the adjacent Cherry Creek watershed. The Technical Memorandum identified that phosphorus concentrations are site-specific and that Plum Creek shares very similar physical and geological attributes. A phosphorus concentration of 1.04 lbs of phosphorus per ton of sediment was used to quantify potential phosphorus removals of several streambank stabilization scenarios. This phosphorus concentration was useful in quantifying similar phosphorus reductions in the Chatfield Watershed.
Coalition for the Upper South Platte (CUSP). 2006. Revised Watershed Plan.
The Revised Watershed Plan presents the issues, goals, and strategies of the Upper South Platte River Watershed. The watershed plan identifies high and low priority issues as well as strategies and objectives intended to address each one. Nutrients, specifically phosphorus, have been identified as pollutants of concern and are addressed through various high and low priority issues and corresponding strategies.
Coalition for the Upper South Platte (CUSP). 2013a. Waldo Canyon Fire Watershed Assessment: The WARSS Results. April 5th, 2013. Prepared by: Dave Rosgen, Brandon Rosgen, and Summer Collins of Wildland Hydrology; Jim Nankervis of Blue Mountain Consultants; and Kyle Wright of U.S. Forest Service.
The Waldo Canyon Fire Watershed Assessment presented a sediment budget and stability analysis and most importantly highlight sub-watersheds for critical mitigation and restoration needs. This report serves as an excellent example of post-fire watershed efforts that prioritize efforts and identify specific areas of need.
Coalition for the Upper South Platte (CUSP). 2013b. The Waldo Canyon Fire Master Plan for Watershed Restoration & Sediment Reduction. Submitted by: Wildland Hydrology.
The fire master plan followed the Waldo Canyon Fire Watershed Assessment. It took the results from the assessment and outlined restoration approaches and treatments that would be effective and accelerate recovery in sub-watersheds from the adverse impacts of the Waldo Canyon Fire. This fire master plan also serves as an excellent example of how post-fire mitigation efforts can be identified, prioritized, and planned.
Colorado Department of Public Health and Environment (CDPHE). 2012. Colorado Nonpoint Source Program 2012 Management Plan. Colorado Department of Public Health and Environment. Water Quality Control Division. February 13, 2012.
This Report presents an assessment report and management plan of the Nonpoint Source Management Area (NPS program). The NPS program aims to restore NPS water quality impacts in impaired waterbodies, and to protect existing water quality from future NPS pollution. This report was useful identifying NPS issues that are prevalent throughout the state of Colorado.
Colorado State Forest Service (CSFS). 2009. Lodgepole Pine Management Guidelines for Land Managers in the Wildland-Urban Interface. Authors: Frank C. Dennis, Jan Burke, Joe Duda, Carey Green, David Hessel, Merrill Kaufmann, Damon Lange, Brook Lee, Hans Rinke, Wayne Sheppard, Bob Sturtevant, Jim Thinnes, Jeff Underhill, Bob Woodmansee.
Chatfield Watershed Plan September 2014
101
This publication provided significant background on wildfire issues relevant to the front range area in Colorado. The publication can be valuable for all audiences but is specifically aimed for land managers and/or land use agencies. This publication identified several techniques that can be used to mitigate the impacts of wildfires and specified specific areas or forest types suitable for such techniques. This publication can serve as a reference for managers planning to perform similar wildfire mitigation or forest health restoration projects.
Colorado State Forest Service (CSFS). 2013a. Colorado WRAP Summary Report: Chatfield Watershed. Report generated using www.ColoradoWildfireRisk.com. Report version 1.1. Generated July 7, 17, 2013.
The Colorado Wildfire Risk Assessment Summary Report is generated specifically for the Chatfield Watershed using the Risk Assessment Portal available on the Colorado State Forest Service website. The report identified the wildfire risk, wildfire threat, and other wildfire parameters that are useful in evaluating a wildfires potential and extent of impact. The results presented in this report identify key areas within the Chatfield Watershed that are most susceptible to wildfire and have the most significant resources at threat. This would be a valuable resource in prioritizing pre-wildfire mitigation efforts.
Colorado State Forest Service (CSFS). 2013b. Forest Ag Program. Available at: http://csfs.colostate.edu/pages/forest-ag.html. Accessed on August 13th, 2013.
The Forest Agricultural Program (Forest Ag Program) is a resourceful program for forest landowners. This program is intended to encourage landowners to practice good forest health practices by offering to buy timber which has been removed. This program can serve as a resource for potential Chatfield landowners interested in managing their forest lands.
Colorado State University (CSU) Extension. 2013. Urban Agriculture. Available at: http://urbanag.colostate.edu/. Accessed on September 8, 2013.
The Colorado State University (CSU) Extension website is a central resource covering various agricultural topics related to Colorado. CSU Extension acknowledges the growth in urban farming and provides substantial material and resources to Colorado residents interested in that activity.
Colorado Water Conservation Board (CWCB). 2013. Plum Creek Watershed Monitoring Report – Data Collection and Analysis, April 2012 – March 2013. Prepared by Tetra Tech, Inc. April 2013.
This report presents the water quality monitoring results that took place in April 2012 through March 2013 within the Plum Creek watershed to help identify and characterize nonpoint pollutant sources. Key pollutants such as phosphorus and E. coli were found at various sites indicating potential sources such as urban runoff, streambank erosion, and local ISDS were contributing factors to the water quality. Since this study, monitoring has continued to assess these potential sources more thoroughly.
Corona Insights. 2009. Colorado Division of Parks and Outdoor Recreation Marketing Assessment: Executive Summary of Findings and Recommendations.
This document was prepared for the Colorado Division of Parks and Outdoor Recreation to quantify socioeconomic benefits associated with State Parks in Colorado. Of particular interest are the benefits Chatfield State Park provides to the local and statewide economy.
Denver Regional Council of Governments (DRCOG). 1996. Lemna Nonpoint Source Treatment System, Chatfield Reservoir, CO. In: Phosphorus Removal Potential by Implementation of the East Plum Creek Stream Restoration Project. Prepared for Town of Castle Rock. Prepared by CH2M Hill. December 4, 2009.
Chatfield Watershed Plan September 2014
102
The 2009 report prepared by CH2M Hill evaluated the phosphorus removal potential by implementing the East Plum Creek Stream Restoration Project. In this study, various phosphorus reduction methods and treatments were evaluated. The potential phosphorus reductions and limitations of these methods and treatments are presented in this report.
Denver Water. 2013. From Forests to Faucets: U.S. Forest Service and Denver Water Watershed Management Partnership. Available at: http://www.denverwater.org/SupplyPlanning/WaterSupply/PartnershipUSFS/. Accessed July 16, 2013.
Denver Water is a water provide in the Denver metropolitan area serving 1.3 million people. With wildfires as a real and occasional threat to the front range, Denver Water has established a partnership with the USFS to improve and protect forest and watershed conditions. The “From Forests to Faucets” partnership intends to perform forest treatment and watershed protection projects over a five-year period in priority watersheds critical to Denver Water’s water supply. This website provides information on this program and the on-going efforts between Denver Water and the USFS.
Douglas County. 2008. Douglas County 2030 Comprehensive Master Plan. Douglas County Community Development, Planning and Zoning Services Division. Adopted by the Douglas County Planning Commission. May 12, 2008.
The 2008 Douglas County 2030 Comprehensive Master Plan outlines the goals, objectives, and policies in place to guide the growth of Douglas County in a manner that is sustainable and upholds community values such as access and transportation, natural environment, recreation, property rights, and others. This document was useful in providing insight on the types of land uses in the county, their purpose, and direction of growth.
Douglas County. 2011. Community Wildfire Protection Plan. December 2011.
The Douglas County Community Wildfire Protection Plan (CWPP) is a plan and tool used to identify mitigation, prevention, and preparedness strategies to benefit the citizens of Douglas County. The CWPP assists the county in identifying and prioritizing wildfire hazard areas on county-owned lands for future treatment as well as provides guidelines for local-level communities to develop their own CWPPs. This document serves as a living plan to guide wildfire-related efforts on the county-level.
Front Range Fuels Treatment Partnership (FRFTP). 2013. Roundtable. Available at: http://www.frftp.org/roundtable.htm. Accessed on September 23, 2013.
The FRFTP is a group of stakeholders who strive to reduce wildland fire risks through sustained fuels treatment along the Colorado Front Range. Activities and efforts put forth by this group is benefited by all residents and recreationalists of the Front Range. Efforts performed by this group can certainly be beneficial to the Chatfield Watershed as these efforts strive to reduce wildfire events and the effects thereof.
Front Range Watershed Protection Group. 2009. Protecting Critical Watersheds in Colorado from Wildfire: A Technical Approach to Watershed Assessment and Prioritization. August 2009. Prepared by: JW Associates, Inc.. Available at: http://www.jw-associates.org/wwpg.html. Accessed on July 19, 2013.
This publication presents the approach used by the Front Range Watershed Protection Group to identify and prioritize watersheds that provide or convey water for hazard reduction treatments or other watershed protection measures. The approach developed considers wildfire hazard, flood or debris flow risk, soil erodibility, and water uses ranking. As a case study, the approach was applied to the Upper South Platte Watershed, but did not include the Chatfield Watershed. The
Chatfield Watershed Plan September 2014
103
prioritized sub-watersheds, however, are still valuable and relative to Chatfield Reservoir since these areas are all upstream of the reservoir and contribute to the source water quality.
Geospatial Multi-Agency Coordination Group (Geomac). 2013. Geomac Wildland Fire Support. Available at: http://www.geomac.gov/index.shtml. Accessed on July 28, 2013.
As of 2000, geospatial data has been collected and stored in the Geomac Wildland Fire Support database. This data is available publicly and was used in the Chatfield Watershed Plan to display the location and extent past-wildfires in the Chatfield Watershed area since 2000.
Halepaska and Associates, 1998. Final Report: Evaluation of Water Quality Impacts from Leach Fields in the Upper Cherry Creek Basin. October 1998.
This study was conducted to understand the potential water quality impacts of septic system leach fields in various locations in the upper Cherry Creek Basin, CO. Based on ground water data collected, septic systems from upland areas may not contribute significant loads to stream preservation areas, while septic systems along tributaries and in the stream preservation areas can contribute pollutant loads to Cherry Creek and its alluvium.
Hunter, M.E., W.D. Shepperd, J.E. Lentile, J.E. Lundquist, M.G. Andreu, J.L. Butler, and F.W. Smith. 2007. A comprehensive guide to fuels treatment practices for ponderosa pine in the Black Hills, Colorado Front Range, and Southwest. Gen. Tech. Rep. RMRS-GTR-198. Fort Collins, CO: U.S. Department of Agriculture, Forest Service, Rocky Mountain Research Station. 93p.
This publication presents recommendations for fuels treatments specific to the Front Range area of Colorado based on recent and available studies and other peer-reviewed literature. Specific treatments are evaluated to determine the circumstances under which they can be applied and their treatment effectiveness. Hillside sloe stabilization measures used at the Hayman Fire were evaluated and their effectiveness is found to be significant. These measures, and others, are recommended techniques for future wildfire events.
Jefferson Conservation District (JCD). 2013. Jefferson Conservation District. Available at: http://www.jeffersonconservationdistrict.org/ . Accessed on August 13, 2013.
The Jefferson Conservation District (JCD) is one of 76 conservation districts in Colorado serving Jefferson, Clear Creek, and Gilpin Counties. JCD works towards protecting natural resources through efforts related to wildfire mitigation, forest health, source-water protection, urban agriculture, and noxious weeds. This website is a resourceful site that provides up-to-date information on JCD’s past and present efforts, as well as information and opportunities for residents within the district.
Libohova, Zamir. 2004. Effects of Thinning and a Wildfire on Sediment Production Rates, Channel Morphology, and Water Quality in the Upper South Platte River Watershed. Thesis. Colorado State University; Fort Collins, CO. Spring 2004.
This thesis evaluated the effects of thinning, a fuels treatment method, that was used in and around the Hayman Fire. This serves as a single, yet valuable case study on the quantified effectiveness of thinning since data is available to present conditions before and after the wildfire event. The results presented were used to exemplify the effectiveness of such measures as wildfire mitigation efforts.
Master, Dennis C., G. Shao, and J. Donnay. 2007. Protecting Front Range Forest Watersheds from High-Severity Wildfires. An assessment by the Pinchot Institute for Conservation funded by the Front Range Fuels Treatment Partnership.
This publication explores the threat of high-severity wildfires to Colorado Front Range communities. This report discusses historic trends, population growth, water supplies at risk,
Chatfield Watershed Plan September 2014
104
critical watersheds, and proposes some alternative forms of treatment or mitigation that should be considered on a larger scale aside to forest thinning. The valuable aspect in this publication was the discussion of the range of resources from natural to man-made that are at threat in the Colorado Front Range.
National Interagency Fire Center (NIFC). 2013. BAER Burned Area Emergency Response. Available at http://www.nifc.gov/BAER/Page/NIFC_BAER.html. Accessed on August 13, 2013.
BAER program is a team of federal agencies that work together to address immediate and critical emergency fire situations by implementing emergency treatments. Beyond these treatments, stakeholders are responsible for treating an area impacted by fire in order to restore and protect the watershed.
National Park Service (NPS). 2013. Hazardous Fuel Reduction. Available at: http://www.nps.gov/fire/wildland-fire/learning-center/fire-in-depth/hazardous-fuel-reduction.cfm Accessed on August 13, 2013.
The National Park Service provides excellent educational resources online on several wildfire related topics, including hazardous fuel reduction methods. Information presented on the NPS website was also used in the Chatfield Watershed Plan to highlight key measures that have been practiced successfully in the past and nationwide.
Natural Resources Conservation Service (NRCS). 2013. Emergency Watershed Protection Program (EWP) Fact Sheet. Available at: http://www.nrcs.usda.gov/wps/portal/nrcs/main/national/programs/landscape/ewpp/. Accessed on August 14, 2013.
The Emergency Watershed Protection Program factsheet is intended to provide communities within information on how to recover or rehabilitate land that has been damaged due to flood, fire, drought, windstorm, or other natural occurrence. The EWP Program addresses watershed impairments and through EWP, the NRCS may pay up to 75 percent of the construction costs of emergency measures. These measures are to address emergency circumstances and this resource is valuable to municipalities recovering from a fire. After these immediate concerns are taken care of, attention can then be diverted to longer term solutions and restoration mechanisms.
Natural Resources Conservation Service (NRCS). 2013. Conservation Technical Assistance. Available at: http://www.nrcs.usda.gov/wps/portal/nrcs/main/co/technical/cp/cta/. Accessed on September 8, 2013.
The Conservation Technical Assistance Program (CTA) is a voluntary program that provides technical assistance supported by science-based technology and tools to help people conserve, maintain, and improve their natural resources. This is a critical resource for private landowners in the Chatfield Watershed community who would like to play a role in improving and protecting the water quality of and other natural resources of the watershed.
Robichaud, P.R., Ashmun L.E., and Sims B.D. 2010. Post-Fire Treatment Effectiveness for Hillslope Stabilization. USDA Forest Service. Rocky Mountain Research Station. General Technical Report RMRS-GTR-240. August 2010.
This technical report provides a review of research, monitoring, and product development related to post-fire hillslope emergency stabilization treatments. It is intended to provide forest health and fire specialists information regarding the effectiveness of post-fire stabilization methods. This report was useful in that it identified slope stabilization techniques and their respective efficiencies that were used in the 2002 Hayman Fire.
Chatfield Watershed Plan September 2014
105
Sham, Chi Ho. 2013. Water Research Foundation. Wildfire Readiness and Response Workshop. Denver, CO. April 4-5, 2013. Mitigating Risks of Wildfire for Drinking Water Systems. Available at: http://collab.waterrf.org/Workshops/wildliferrw/default.aspx. Accessed July 19, 2013.
This presentation presented information on wildfire risk mitigation and response activities as it relates to drinking water systems. This presentation acknowledged targeting wildfire mitigation activities is most effective through wildfire risk assessments that characterize vulnerability within a given watershed. This sort of effort has already been put forth by Denver Water in the Upper South Platte River Basin. It is important for the Chatfield Watershed community to understand these efforts occurring in neighboring watersheds as these efforts will ultimately protect the water quality of the Chatfield Reservoir in the event of a fire.
Tetra Tech RMC. 2006. Design of the Cherry Creek Sediment Basin. Denver, CO.: Tetra Tech RMC.
This report presented the design of a sediment basin in the Cherry Creek watershed. The report was referenced in the Chatfield Watershed plan as it identified the sediment trapping efficiency of a properly designed basin to be 99%. This efficiency value is applicable to sediment basins that may be potentially designed for the Chatfield Watershed.
Urban Drainage and Flood Control District (UDFCD). 1996. Flood Hazard Area Delineation. Willow Creek, Little Willow Creek, East Willow Creek. Douglas County, Colorado. Prepared by: Greenhorne & O’Mara, Inc. and Aurora Colorado. December 1996.
This flood hazard area delineation (FHAD) report provides floodplain information for three drainageways The FHAD report focused on a tributary to the South Platte River, Willow Creek, and two additional tributaries to Willow Creek. This report demonstrated other focused efforts related to flooding that had occurred in Douglas County.
UDFCD. 2001. Flood Hazard Area Delineation Plum Creek Watershed. Prepared for: Douglas County; Urban Drainage & Flood Control District. Prepared by: WRC Engineering, INC. November 2001.
This flood hazard area delineation (FHAD) report provides floodplain information for creeks and tributaries within the Plum Creek Watershed. This report is an example of hydrologic studies within the Plum Creek Watershed related to flooding events.
UDFCD. 2004. Design Report for Massey Draw Watershed and Ecosystem Improvements Pilot Project. Prepared by: Muller Engineering Company, Inc. October 2004.
This report presents the final design for drainageway improvements in both the main stem and North Tributary of Massey Draw. The intent of this project is to minimize phosphorus loadings into Chatfield Reservoir by addressing nonpoint sources through streambank stabilization efforts. The efforts at this site include three drop structures, channel and wetlands bench grading, and channel bank stabilization. This is a featured project in the Chatfield Watershed that sought to limit erosion and entrainment of naturally-occurring phosphorus by stabilizing the channel grade and banks and providing wetland and improved riparian habitats along the channel.
UDFCD. 2005. Flood Hazard Area Delineation Massey Draw and SJCD (South). Prepared by: Olsson Associates. December 2005.
This flood hazard area delineation (FHAD) report is prepared for Massey Draw and SJCD drainage area. This report is an example of hydrologic studies within the Plum Creek Watershed related to flooding events.
UDFCD. 2008. Massey Draw Channel Improvements (Balsam Street to Allison Street) Design Report. May 2008. Prepared by: Muller Engineering Company, Inc.
Chatfield Watershed Plan September 2014
106
This report presents costs and designs for proposed improvements for Massey Draw Channel from Balsam Street to Allison Street. Proposed improvements include a boulder retaining wall, grouted boulder drop structures, bank protection, and a downstream cutoff wall. This project was administered by UDFCD with involvement from Jefferson County. The purpose of using this report was to demonstrate previous efforts in the Chatfield Watershed with regards to streambank improvements.
UDFCD. 2010. Urban Storm Drainage Criteria Manual Volume 3 – Best Management Practices.
The Urban Storm Drainage Criteria Manual is a three volume manual developed by the Urban Drainage and Flood Control District (UDFCD) in Denver, Colorado. The manual provides technical guidance to design and develop stormwater management systems or best management practices in a manner that complies with local regulations. Volume 3, in particular, presents BMP designs that are useful in managing and treating stormwater runoff.
URS. 2003. An Evaluation of Nonpoint Source Pollution Risks from On-Site Wastewater Systems in the Franktown Planning Area. URS Corporation, August 2003.
This publication studied the NPS risks from OWTS in the Franktown area of Douglas County in the Cherry Creek Watershed. This study was reviewed as Cherry Creek is a neighboring watershed that shares some physical similarities to Chatfield Watershed. This study, nor any other, can conclude a quantified amount of pollutant loading from OWTS that is affecting the alluvium in the Cherry Creek system.
U.S. Army Corps of Engineer (USACE). 2012. Chatfield Reservoir Storage Reallocation Draft Integrated Feasibility Report and Environmental Impact Statement. June 2012.
This publication is a Draft Feasibility Report and Environmental Impact Statement for the Chatfield Reservoir project involving reallocation of storage volumes. The Chatfield Watershed Plan references this draft to present the ongoing issues and projects within the Chatfield Watershed. This project, in particular, will affect monitoring and other project efforts within Chatfield Watershed as mitigation efforts for the reallocation will be required. Efforts within the Chatfield Watershed will coincide and work in tangent with mitigation efforts related to the potential reallocation.
U.S. Bureau of Reclamation (USBR). 1987. Design of Small Dams. Third Edition. A Water Resources Technical Publication. United States Department of the Interior.
This publication serves as a guide for designing small, and to some extent, large dams. This resource was valuable in the development of the Chatfield Watershed Plan as it contained some technical background on sediment transportation of natural flowing streams.
U.S. Census. 2010. TIGER/Line Shapefiles and TIGER/Line Files. Available at: http://www.census.gov/geo/maps-data/data/tiger-line.html. Accessed January 2013.
This source provided the most recent CENSUS data in GIS format. The data was used to illustrate the current and projected future populations within the Chatfield Watershed.
U.S. Environmental Protection Agency (USEPA). 2000. Low Impact Development (LID) A Literature Review. Office of Water. EPA-841-B-00-005. October 2000.
This publication presents the findings of a literature review on the effectiveness of LID practices for controlling stormwater runoff volume and reducing pollutant loadings to receiving waters. The effectiveness values in this publication were used and presented in the Chatfield Watershed Plan, where appropriate.
Chatfield Watershed Plan September 2014
107
USEPA. 2002. Onsite Wastewater Treatment Systems Manual. EPA-625-R-00-008. February 2002.
This manual provides detailed guidance on the design, construction, and operation of onsite wastewater treatment systems (OWTS). It is referenced in the Chatfield Watershed Plan as it is a comprehensive summary of OWTS management that can be useful for OWTS owners and managers within the watershed community. Key basic information provided in this manual is included in the Plan, and this resource is encouraged to be used widely.
USEPA. 2003. National Management Measures to Control Nonpoint Pollution from Agriculture. EPA 841-B-03-004. July 2003.
This guidance document provides technical information on the best available and economically achievable methods of reducing NPS pollution from agriculture. This resource is referenced in the Chatfield Watershed Plan as it provides significant background on NPS that originate from agriculture and offers methods on reducing these pollutant loads.
USEPA. 2005. Handbook for Managing Onsite and Clustered (Decentralized) Wastewater Treatment Systems Factsheet. EPA-832-B-05-001. December 2005.
This publication outlines guidelines to develop a community management program for decentralized wastewater systems. It also provides guidance to help improve the performance of onsite wastewater systems. This is valuable resource for OWTS managers or owners in the Chatfield Watershed community as this factsheet also contains links and identifies other resources for more thorough information.
USEPA. 2008. Handbook for Developing Watershed Plans to Restore and Protect Our Waters. EPA 841-B-08-002. U.S Environmental Protection Agency, Office of Water, Nonpoint Source Control Branch, Washington, DC.
This EPA handbook provided guidance in developing the Chatfield Watershed Plan to ensure that the final plan would meet EPA requirements. This is a valuable resource for all watershed plan developers who are receiving Section 319 grant funding.
USEPA. 2010. Green Infrastructure in Arid and Semi-Arid Climates. Office of Water. EPA-833-B-10-002. May 2010.
This publication discusses the drivers, applications, and design of green infrastructure in arid and semi-arid regions. These regions which receive limited rainfall can benefit from green infrastructure practices as they serve as a cost-effective approach to stormwater management and water conservation. This is a valuable publication for policy makers and other municipal staff in the Chatfield Watershed, front range and other portions of Colorado, as these areas can benefit from low impact development (LID) implementation.
USEPA. 2013. Animal Feeding Operations. Available at: http://www.epa.gov/region8/water/cafo/. Accessed on August 16th, 2013.
This resourceful website provided information regarding Animal Feeding Operations (AFOs). This website defined AFOs, identified affiliated potential nonpoint source pollutants, and additional information and links regarding methods on how to reduce NPS pollutants derived from AFOs.
U.S. Forest Service (USFS). 2000. Environmental Assessment for the Upper South Platte Watershed Protection and Restoration project. Pike National Forest. South Platte Ranger District; Morrison, CO. August 2000.
This publication is an environmental assessment for the Upper South Platte Watershed Protection and Restoration Project. This project is a guideline for management and project
Chatfield Watershed Plan September 2014
108
planning related to efforts regarding watershed restoration efforts to address soil and water issues that resulted from the 1996 Buffalo Creek fire. This environmental assessment is referenced in the Chatfield Watershed Plan as it identifies this watershed, and other neighboring watersheds, as a risk to catastrophic wildfire.
USFS. 2013a. Burned Area Emergency Response, BAER. Available at: http://www.fs.fed.us/biology/watershed/burnareas/background.html. Accessed on August 13, 2013.
This resource provides information on the BAER program. This program addressed emergency situations caused by wildfires. This program is identified in the Chatfield Watershed Plan to provide background on all the actions taken during and immediately after a wildfire. After BAER efforts are performed to stabilize areas and provide immediate and emergency restoration, other long-term efforts will need to be orchestrated in order to restore all aspects of the watershed.
USFS. 2013b. Meet the Forest Service. Available at: http://www.fs.fed.us/aboutus/meetfs.shtml. Accessed on August 8, 2013.
This resource provides significant background on the US Forest Service (USFS). The USFS is a federal agency that manages public lands in national forests and grasslands. This agency particularly takes on or plays a role in projects related to restoring or protecting the natural resources of the land. The USFS has partnered up with Denver Water on several projects related to watershed restoration and wildfire mitigation within and outside the Chatfield Watershed.