Embed Size (px)
Citation preview
lable at ScienceDirect
Applied Geochemistry 74 (2016) 24e32
Contents lists avai
Applied Geochemistry
journal homepage: www.elsevier .com/locate/apgeochem
Chemical and Sr isotopic characterization of North America uraniumores: Nuclear forensic applications
Enrica Balboni a, b, *, Nina Jones a, Tyler Spano a, Antonio Simonetti a, Peter C. Burns a, c
a Department of Civil and Environmental Engineering and Earth Science, University of Notre Dame, Notre Dame, IN 46556, United Statesb Glenn T. Seaborg Institute, Physical and Life Science Directorate, Lawrence Livermore National Laboratory, 7000 East Avenue, Livermore, CA 94550, UnitedStatesc Department of Chemistry and Biochemistry, University of Notre Dame, Notre Dame, IN 46556, United States
a r t i c l e i n f o
Article history:Received 27 June 2016Received in revised form23 August 2016Accepted 29 August 2016Available online 31 August 2016
Keywords:Uranium deposits in the United StatesUranium ore concentrateStrontium isotopesICP-MS
* Corresponding author. 7000 East Avenue, LivermE-mail address: [email protected] (E. Balboni).
http://dx.doi.org/10.1016/j.apgeochem.2016.08.0160883-2927/© 2016 Elsevier Ltd. All rights reserved.
a b s t r a c t
This study reports major, minor, and trace element data and Sr isotope ratios for 11 uranium ore (ura-ninite, UO2þx) samples and one processed uranium ore concentrate (UOC) from various U.S. deposits. Theuraninite investigated represent ores formed via different modes of mineralization (e.g., high- and low-temperature) and within various geological contexts, which include magmatic pegmatites, metamorphicrocks, sandstone-hosted, and roll front deposits. In situ trace element data obtained by laser ablation-ICP-MS and bulk sample Sr isotopic ratios for uraninite samples investigated here indicate distinct sig-natures that are highly dependent on the mode of mineralization and host rock geology. Relative to theirhigh-temperature counterparts, low-temperature uranium ores record high U/Th ratios (>1000), lowtotal rare earth element (REE) abundances (<1 wt%), high contents (>300 ppm) of first row transitionmetals (Sc, Ti, V, Cr, Mn, Co, Ni), and radiogenic 87Sr/86Sr ratios (>0.7200). Comparison of chondritenormalized REE patterns between uraninite and corresponding processed UOC from the same localityindicates identical patterns at different absolute concentrations. This result ultimately confirms theimportance of establishing geochemical signatures of raw, uranium ore materials for attribution purposesin the forensic analysis of intercepted nuclear materials.
© 2016 Elsevier Ltd. All rights reserved.
1. Introduction
One of the most important public concerns regarding the safeuse of nuclear energy is the possible diversion of nuclear andradiological material for illicit purposes. Nuclear material may beintercepted and traded illegally or originate from illegal miningoperations, and thus an interest exists in employing methods thathelp in tracking its origin. Since the early 1990s, the IAEA hasrecorded more than 800 cases of illicit trafficking of nuclear andradioactive material. Tracing the origin of these materials is ofutmost importance so as to deter future trafficking routes and helpintercept illicit materials (Mayer et al., 2007; Keatley et al., 2015).The IAEA Illicit trafficking database reports that many incidents ofnuclear trafficking have involved low-grade material, such as nat-ural uranium (IAEA, 2015). Thus, natural uranium within early fuelcycle stage material, such as ores and ore concentrate, is commonly
ore, 94550, United States.
intercepted material. Consequently, there is an international needto better understand and document the forensic signatures ofdifferent ore types such that an origin can be determined for seizedmaterial (IAEA, 2015).
More than 800 uranium deposits are identified globally, with atleast fifteen deposits type (IAEA, 2012). Uraninite, the main oresource, has an ideal crystal formula of UO2 but typically U4þ
1-x-y-
zU6þxREEy3þ Mz
2þ O2þx-(0.5)-z (Janeczek and Ewing, 1992); it belongsto the cubic crystal system and forms well crystallized grains athigher temperature, or a collomorph, known as pitchblende, at lowtemperature. The fluorite-type uraninite crystal structure can hostmany elements with ionic radii similar to that of U4þ in eightfoldcoordination. This applies particularly to Th4þ, the rare earth ele-ments (REEs3þ), and Y3þ. The incorporation of these elements intothe structure is mainly a function of temperature and elementavailability (Frimmel et al., 2014; Burns and Finch, 1999).
In recent years, several studies have successfully attributeduranium ores and uranium ore concentrates (UOCs) to specificmining areas via elemental and isotopic fingerprinting (Mayer et al.,2007; Mayer et al., 2005;Wallenius et al., 2006; Keegan et al., 2012;
E. Balboni et al. / Applied Geochemistry 74 (2016) 24e32 25
Han et al., 2013). Characteristic chemical fingerprints used in thesestudies include the concentration of elemental impurities as well asrelative abundance and type of radioisotopes (e.g., Sr, U, Pb) pre-sent. For intercepted uranium ores, details about the geologicenvironment of formation can be obtained by analyses of REEs,whereas details in relation to the origin and age can be gained byinvestigating the isotope systematics of uranium, strontium, andlead (Mayer et al., 2005; Varga et al., 2009, 2011; Svedkauskaite-LeGore et al., 2007; Svedkauskaite-LeGore et al., 2008).
For example, Varga et al. (2009) and Svedkauskaite-LeGore et al.(2007, 2008). both found a large variation in lead and strontiumisotopic compositions in UOC of different origin. The variation ofthe 87Sr/86Sr is due to the decay of long-lived 87Rb (half-life,4.8 � 1010 years) to 87Sr and the highly variable Rb/Sr ratio in na-ture. Sr isotope ratio measurements have been widely used in ge-ology for age determinations, and recently as possible indicators ofprovenance for origin assessment of ivory, human tooth enameland bones, and food products (Buzon et al., 2007; Buzon andSimonetti, 2013; Grupe et al., 1997; Van Der Merwe et al., 1990),as bioavailable Sr is characteristic of the geological background.
Keegan et al. (2008, 2012) and Varga et al. (2010a) have bothidentified key attributes within UOC and uranium ore that arespecific to geographic locations. However, only a few studies haveexamined unprocessed uranium ore (Frimmel et al., 2014; Richteret al., 1999; Mercadier et al., 2011), which represents the mostelementally heterogeneous stage in the nuclear fuel cycle. Whilstcertain forensic fingerprints are thought to be removed along theore-processing route, REE normalized patterns and heavy isotopefractionation are believed to remain intact and representative ofthe original deposit type (Varga et al, 2010b, 2011).
Building upon the data base of Mercadier et al. (2011) andFrimmel et al. (2014), which provide REE data for 32 localities andfourteen deposit types, this study reports chemical data and Srisotope ratios for uranium ore samples and one UOC sample fromthe North American continent. Specifically, the aim of this work isto: 1- chemically characterize uraninite samples from the UnitedStates including major, minor, and trace elements; 2- report87Sr/86Sr ratios for the same samples; and 3- provide in depthcharacterization of sandstone deposits. Sandstone depositsconstitute about 18% of uranium resources worldwide and 41% ofknown deposits. They are of major economic importance in severaldifferent countries (Kazakhstan, Uzbekistan and Niger) includingthe USA. The USA has large resources in sandstone type depositsand most of its uranium production has been from these deposits(Burns and Finch, 1999). Lastly, this study provides a direct com-parison of trace element (REE) signatures between uranium ore andUOC originating from a sandstone-hosted roll front deposit fromWyoming.
2. Materials and methods
2.1. Samples
Of the uranium ore samples analyzed in this work, eleven wereretrieved from the “Ewing collection” of minerals and rocks housedat the University of Notre Dame. The Continental1 mine (WY)sample was purchased from the Mineralogical Research Corpora-tion (www.minresco.com) and the Mistamisk uraninite was ob-tained from the Universite’ de Lorraine, GeoResources, France(Table 1). In addition to uraninite specimens, a sample of UOC fromPowder River Basin (WY) was obtained and its chemical composi-tion analyzed.
2.1.1. Brief description of the uraninite samplesYancey1 and Yancey2 (Yancey Co, NC) - pegmatite-hosted
uraninite are from the Spruce Pine pegmatite, North Carolina. Thepegmatites are of early Paleozoic age and cut mica and amphibolegneiss and schist rocks of Precambrian age (Brost, 1962). RugglesMine (NH) e In this area, the host rock consists of quartz-micaschist, quartzite, amphibolite, and high-grade metamorphic rocks.These rocks were folded, faulted, metamorphosed, and intruded inDevonian time. A U-Pb age of 304 Ma has been reported for thepegmatite (Olson, 1941; Korzeb et al., 1997). Billiken Lode (JeffersonCo., CO) - uranium ore veins are hosted in folded and faulted Pre-cambrian meta-sedimentary rocks; the U-Pb age for the uraniumore is 69 ± 1.1 million years (Zhao and Ewing Rodney, 2000;Dahlkamp, 1991). Marshall Pass1 and Marshall Pass2 (MarshallPass district, CO) - uranium mineralization in this area occurs infault-controlled veins and breccia zones in limestone of the Penn-sylvanian Belden Formation (320-300 million years). The uraniumore is located at the intersection of major faults with Tertiary (be-tween 65 and 2million years) erosion surfaces. These surfaces wereburied by Early Tertiary siliceous tuffs, a likely source of uranium(Zhao and Ewing Rodney, 2000; Deditius et al., 2007). Skyline Mine(Monument Valley, UT), Cameron Co. (Coconino Co. AZ) and HappyJack Mine (San Juan Co, UT)- uranium ore samples are from tabularuranium sandstone deposits hosted by Upper Paleozoic andMesozoic fluvial sediments typical of the Colorado plateau Prov-ince; i.e., mudstone and sandstone clastic layers consisting ofcoarse-grained pebbles and sandstone with abundant fossil wood.Ores originating from these deposits were formed in three mainmineralization events - Late Triassic-Early Jurassic, Late Jurassic,and Early Cretaceous (Burns and Sigmon, 2013; Granger, 1962).Orphan Lode (AZ)- deposits of this type occur in circular verticalpipes filled with collapse breccia in which uranium is concentratedin the matrix and fracture around the pipe. The only known ex-amples of this deposit type occur in the Arizona Strip, (USA). Thepipes developed in Pennsylvanian and Permian limestone andcalcareous rock formations, and were mineralized in the lateTriassic (26e254Ma) (Burns and Finch, 1999; Burns and Sigmon,2013). Continental1 and UOC (Wyoming) - uranium mineraliza-tion in the province started during the Laramide uplift and peakedin Oligocene (Burns and Sigmon, 2013). Mineralization is hosted inroll front deposit type in porous and permeable sedimentary rocks.
3. Analytical methods
Sample preparation and major element analyses. For eachsample, grains or chunks were separated or cut from the bulkmaterial and fixed in 1-inch round epoxy filled mounts. The surfaceof each sample was polished and carbon coated.
Chemical maps of the epoxy-mounted samples were con-structed utilizing an EDAX Orbis Micro EDXRF (X-ray fluorescence)system. Maps were collected on a matrix of 512 � 400 pixels withan X-ray aperture size of 30 mm, 10 Kv voltage, 200 ms dwell time,12.8 ms time with a total acquisition time ~8 h.
Major element analyses were conducted using a Cameca SX-50electron microprobe. An accelerating voltage of 15 KV was used,along with a beam size of 15 mm, and a beam current of 100 nA.Standardization was performed using well-characterized in-housestandards of uranium oxide (UO2), thorium oxide (ThO2), galena(PbO), anorthite glass (Al2O3, CaO), titanium oxide (TiO2), manga-nese metal (MnO), zircon (ZrO2, SiO2), vanadium oxide (V2O3),yttrium aluminum garnet (Y2O3), and apatite (P2O5). Uncertainties(2s mean) are based on counting statistics and are � 2% for TiO2,UO2, MnO and V2O3; �3% for PbO; � 5% for SiO2, Al2O3, P2O5, CaO,ZrO2 and ThO2 and �6% for Y2O3. For all samples, spots analyzedwere homogeneous in relation to their major element composition(75 mm diameter) based on their backscatter electron images alsocollected on the electron microprobe.
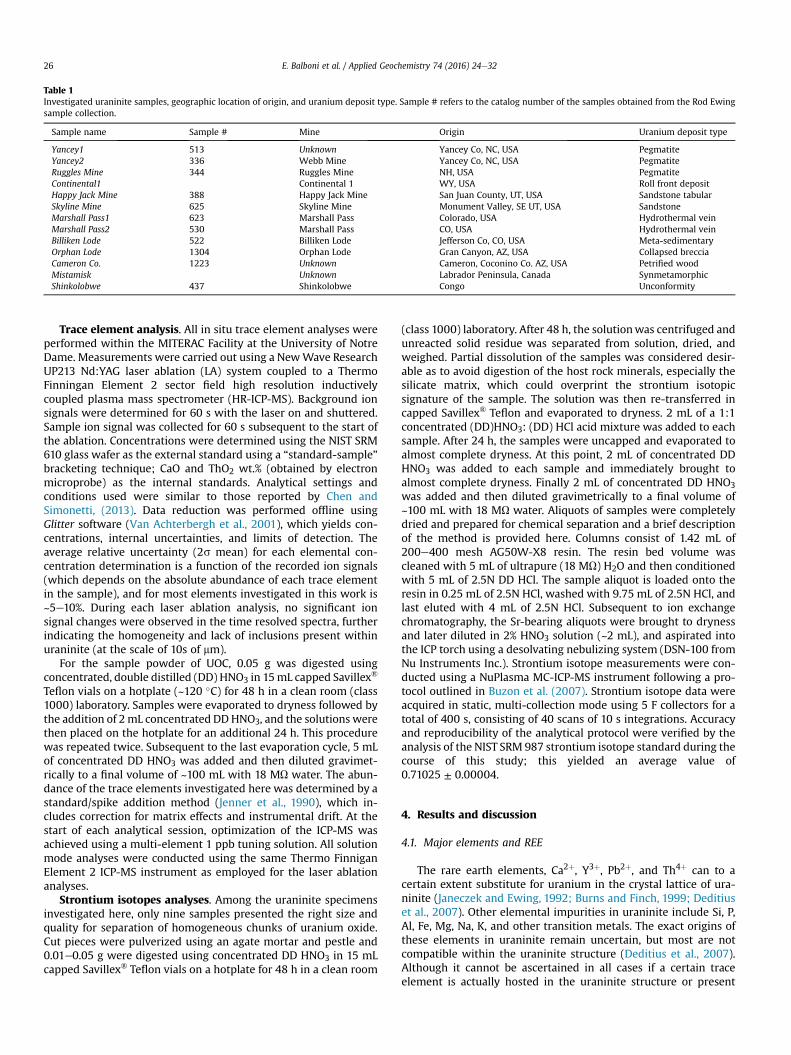
Table 1Investigated uraninite samples, geographic location of origin, and uranium deposit type. Sample # refers to the catalog number of the samples obtained from the Rod Ewingsample collection.
Sample name Sample # Mine Origin Uranium deposit type
Yancey1 513 Unknown Yancey Co, NC, USA PegmatiteYancey2 336 Webb Mine Yancey Co, NC, USA PegmatiteRuggles Mine 344 Ruggles Mine NH, USA PegmatiteContinental1 Continental 1 WY, USA Roll front depositHappy Jack Mine 388 Happy Jack Mine San Juan County, UT, USA Sandstone tabularSkyline Mine 625 Skyline Mine Monument Valley, SE UT, USA SandstoneMarshall Pass1 623 Marshall Pass Colorado, USA Hydrothermal veinMarshall Pass2 530 Marshall Pass CO, USA Hydrothermal veinBilliken Lode 522 Billiken Lode Jefferson Co, CO, USA Meta-sedimentaryOrphan Lode 1304 Orphan Lode Gran Canyon, AZ, USA Collapsed brecciaCameron Co. 1223 Unknown Cameron, Coconino Co. AZ, USA Petrified woodMistamisk Unknown Labrador Peninsula, Canada SynmetamorphicShinkolobwe 437 Shinkolobwe Congo Unconformity
E. Balboni et al. / Applied Geochemistry 74 (2016) 24e3226
Trace element analysis. All in situ trace element analyses wereperformed within the MITERAC Facility at the University of NotreDame. Measurements were carried out using a NewWave ResearchUP213 Nd:YAG laser ablation (LA) system coupled to a ThermoFinningan Element 2 sector field high resolution inductivelycoupled plasma mass spectrometer (HR-ICP-MS). Background ionsignals were determined for 60 s with the laser on and shuttered.Sample ion signal was collected for 60 s subsequent to the start ofthe ablation. Concentrations were determined using the NIST SRM610 glass wafer as the external standard using a “standard-sample”bracketing technique; CaO and ThO2 wt.% (obtained by electronmicroprobe) as the internal standards. Analytical settings andconditions used were similar to those reported by Chen andSimonetti, (2013). Data reduction was performed offline usingGlitter software (Van Achterbergh et al., 2001), which yields con-centrations, internal uncertainties, and limits of detection. Theaverage relative uncertainty (2s mean) for each elemental con-centration determination is a function of the recorded ion signals(which depends on the absolute abundance of each trace elementin the sample), and for most elements investigated in this work is~5e10%. During each laser ablation analysis, no significant ionsignal changes were observed in the time resolved spectra, furtherindicating the homogeneity and lack of inclusions present withinuraninite (at the scale of 10s of mm).
For the sample powder of UOC, 0.05 g was digested usingconcentrated, double distilled (DD) HNO3 in 15mL capped Savillex®
Teflon vials on a hotplate (~120 �C) for 48 h in a clean room (class1000) laboratory. Samples were evaporated to dryness followed bythe addition of 2mL concentrated DD HNO3, and the solutions werethen placed on the hotplate for an additional 24 h. This procedurewas repeated twice. Subsequent to the last evaporation cycle, 5 mLof concentrated DD HNO3 was added and then diluted gravimet-rically to a final volume of ~100 mL with 18 MU water. The abun-dance of the trace elements investigated here was determined by astandard/spike addition method (Jenner et al., 1990), which in-cludes correction for matrix effects and instrumental drift. At thestart of each analytical session, optimization of the ICP-MS wasachieved using a multi-element 1 ppb tuning solution. All solutionmode analyses were conducted using the same Thermo FinniganElement 2 ICP-MS instrument as employed for the laser ablationanalyses.
Strontium isotopes analyses. Among the uraninite specimensinvestigated here, only nine samples presented the right size andquality for separation of homogeneous chunks of uranium oxide.Cut pieces were pulverized using an agate mortar and pestle and0.01e0.05 g were digested using concentrated DD HNO3 in 15 mLcapped Savillex® Teflon vials on a hotplate for 48 h in a clean room
(class 1000) laboratory. After 48 h, the solutionwas centrifuged andunreacted solid residue was separated from solution, dried, andweighed. Partial dissolution of the samples was considered desir-able as to avoid digestion of the host rock minerals, especially thesilicate matrix, which could overprint the strontium isotopicsignature of the sample. The solution was then re-transferred incapped Savillex® Teflon and evaporated to dryness. 2 mL of a 1:1concentrated (DD)HNO3: (DD) HCl acid mixture was added to eachsample. After 24 h, the samples were uncapped and evaporated toalmost complete dryness. At this point, 2 mL of concentrated DDHNO3 was added to each sample and immediately brought toalmost complete dryness. Finally 2 mL of concentrated DD HNO3was added and then diluted gravimetrically to a final volume of~100 mL with 18 MU water. Aliquots of samples were completelydried and prepared for chemical separation and a brief descriptionof the method is provided here. Columns consist of 1.42 mL of200e400 mesh AG50W-X8 resin. The resin bed volume wascleaned with 5 mL of ultrapure (18 MU) H2O and then conditionedwith 5 mL of 2.5N DD HCl. The sample aliquot is loaded onto theresin in 0.25 mL of 2.5N HCl, washed with 9.75 mL of 2.5N HCl, andlast eluted with 4 mL of 2.5N HCl. Subsequent to ion exchangechromatography, the Sr-bearing aliquots were brought to drynessand later diluted in 2% HNO3 solution (~2 mL), and aspirated intothe ICP torch using a desolvating nebulizing system (DSN-100 fromNu Instruments Inc.). Strontium isotope measurements were con-ducted using a NuPlasma MC-ICP-MS instrument following a pro-tocol outlined in Buzon et al. (2007). Strontium isotope data wereacquired in static, multi-collection mode using 5 F collectors for atotal of 400 s, consisting of 40 scans of 10 s integrations. Accuracyand reproducibility of the analytical protocol were verified by theanalysis of the NIST SRM 987 strontium isotope standard during thecourse of this study; this yielded an average value of0.71025 ± 0.00004.
4. Results and discussion
4.1. Major elements and REE
The rare earth elements, Ca2þ, Y3þ, Pb2þ, and Th4þ can to acertain extent substitute for uranium in the crystal lattice of ura-ninite (Janeczek and Ewing, 1992; Burns and Finch, 1999; Deditiuset al., 2007). Other elemental impurities in uraninite include Si, P,Al, Fe, Mg, Na, K, and other transition metals. The exact origins ofthese elements in uraninite remain uncertain, but most are notcompatible within the uraninite structure (Deditius et al., 2007).Although it cannot be ascertained in all cases if a certain traceelement is actually hosted in the uraninite structure or present
E. Balboni et al. / Applied Geochemistry 74 (2016) 24e32 27
within submicroscopic inclusions, the chemical information cannonetheless be useful for fingerprinting purposes, when such in-clusions are a characteristic feature of a given deposit. Overall, theabundance of trace elements in uraninite is a function of ore gen-esis, fluid/magma chemistry, local element availability in the sourceregion, and chemistry of the host rock (Frimmel et al., 2014;Mercadier et al., 2011).
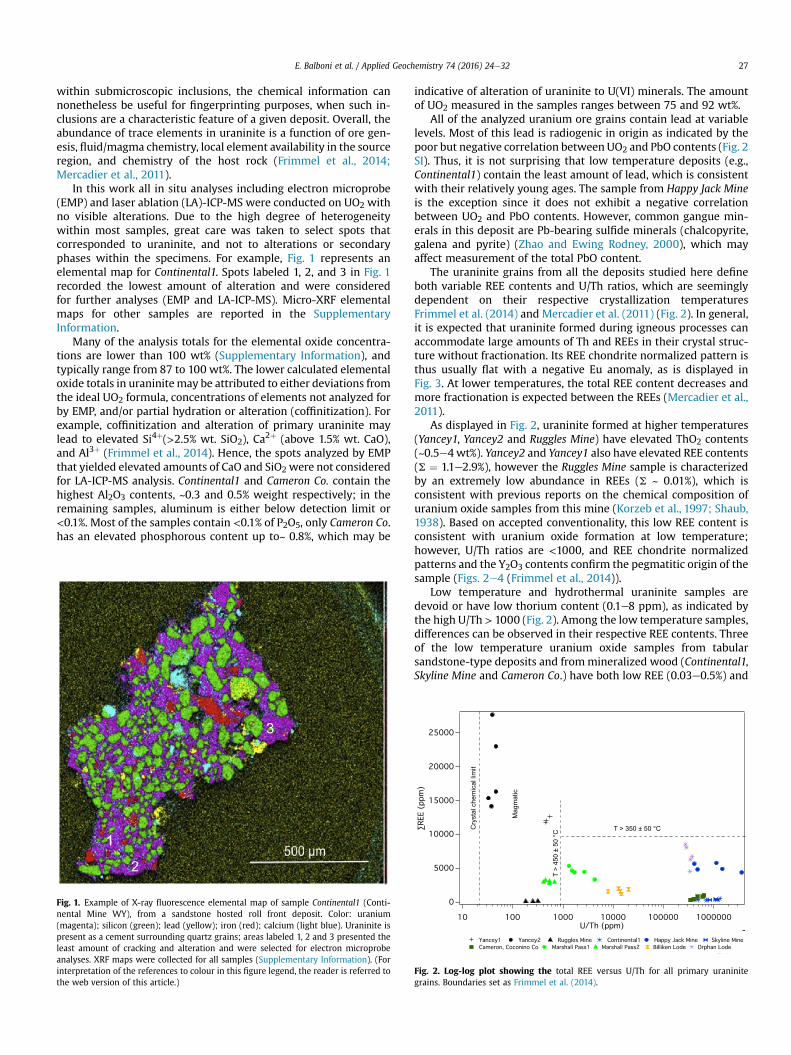
In this work all in situ analyses including electron microprobe(EMP) and laser ablation (LA)-ICP-MS were conducted on UO2 withno visible alterations. Due to the high degree of heterogeneitywithin most samples, great care was taken to select spots thatcorresponded to uraninite, and not to alterations or secondaryphases within the specimens. For example, Fig. 1 represents anelemental map for Continental1. Spots labeled 1, 2, and 3 in Fig. 1recorded the lowest amount of alteration and were consideredfor further analyses (EMP and LA-ICP-MS). Micro-XRF elementalmaps for other samples are reported in the SupplementaryInformation.
Many of the analysis totals for the elemental oxide concentra-tions are lower than 100 wt% (Supplementary Information), andtypically range from 87 to 100 wt%. The lower calculated elementaloxide totals in uraninitemay be attributed to either deviations fromthe ideal UO2 formula, concentrations of elements not analyzed forby EMP, and/or partial hydration or alteration (coffinitization). Forexample, coffinitization and alteration of primary uraninite maylead to elevated Si4þ(>2.5% wt. SiO2), Ca2þ (above 1.5% wt. CaO),and Al3þ (Frimmel et al., 2014). Hence, the spots analyzed by EMPthat yielded elevated amounts of CaO and SiO2 were not consideredfor LA-ICP-MS analysis. Continental1 and Cameron Co. contain thehighest Al2O3 contents, ~0.3 and 0.5% weight respectively; in theremaining samples, aluminum is either below detection limit or<0.1%. Most of the samples contain <0.1% of P2O5, only Cameron Co.has an elevated phosphorous content up to~ 0.8%, which may be
Fig. 1. Example of X-ray fluorescence elemental map of sample Continental1 (Conti-nental Mine WY), from a sandstone hosted roll front deposit. Color: uranium(magenta); silicon (green); lead (yellow); iron (red); calcium (light blue). Uraninite ispresent as a cement surrounding quartz grains; areas labeled 1, 2 and 3 presented theleast amount of cracking and alteration and were selected for electron microprobeanalyses. XRF maps were collected for all samples (Supplementary Information). (Forinterpretation of the references to colour in this figure legend, the reader is referred tothe web version of this article.)
indicative of alteration of uraninite to U(VI) minerals. The amountof UO2 measured in the samples ranges between 75 and 92 wt%.
All of the analyzed uranium ore grains contain lead at variablelevels. Most of this lead is radiogenic in origin as indicated by thepoor but negative correlation between UO2 and PbO contents (Fig. 2SI). Thus, it is not surprising that low temperature deposits (e.g.,Continental1) contain the least amount of lead, which is consistentwith their relatively young ages. The sample from Happy Jack Mineis the exception since it does not exhibit a negative correlationbetween UO2 and PbO contents. However, common gangue min-erals in this deposit are Pb-bearing sulfide minerals (chalcopyrite,galena and pyrite) (Zhao and Ewing Rodney, 2000), which mayaffect measurement of the total PbO content.
The uraninite grains from all the deposits studied here defineboth variable REE contents and U/Th ratios, which are seeminglydependent on their respective crystallization temperaturesFrimmel et al. (2014) and Mercadier et al. (2011) (Fig. 2). In general,it is expected that uraninite formed during igneous processes canaccommodate large amounts of Th and REEs in their crystal struc-ture without fractionation. Its REE chondrite normalized pattern isthus usually flat with a negative Eu anomaly, as is displayed inFig. 3. At lower temperatures, the total REE content decreases andmore fractionation is expected between the REEs (Mercadier et al.,2011).
As displayed in Fig. 2, uraninite formed at higher temperatures(Yancey1, Yancey2 and Ruggles Mine) have elevated ThO2 contents(~0.5e4 wt%). Yancey2 and Yancey1 also have elevated REE contents(S ¼ 1.1e2.9%), however the Ruggles Mine sample is characterizedby an extremely low abundance in REEs (S ~ 0.01%), which isconsistent with previous reports on the chemical composition ofuranium oxide samples from this mine (Korzeb et al., 1997; Shaub,1938). Based on accepted conventionality, this low REE content isconsistent with uranium oxide formation at low temperature;however, U/Th ratios are <1000, and REE chondrite normalizedpatterns and the Y2O3 contents confirm the pegmatitic origin of thesample (Figs. 2e4 (Frimmel et al., 2014)).
Low temperature and hydrothermal uraninite samples aredevoid or have low thorium content (0.1e8 ppm), as indicated bythe high U/Th > 1000 (Fig. 2). Among the low temperature samples,differences can be observed in their respective REE contents. Threeof the low temperature uranium oxide samples from tabularsandstone-type deposits and frommineralized wood (Continental1,Skyline Mine and Cameron Co.) have both low REE (0.03e0.5%) and
Fig. 2. Log-log plot showing the total REE versus U/Th for all primary uraninitegrains. Boundaries set as Frimmel et al. (2014).
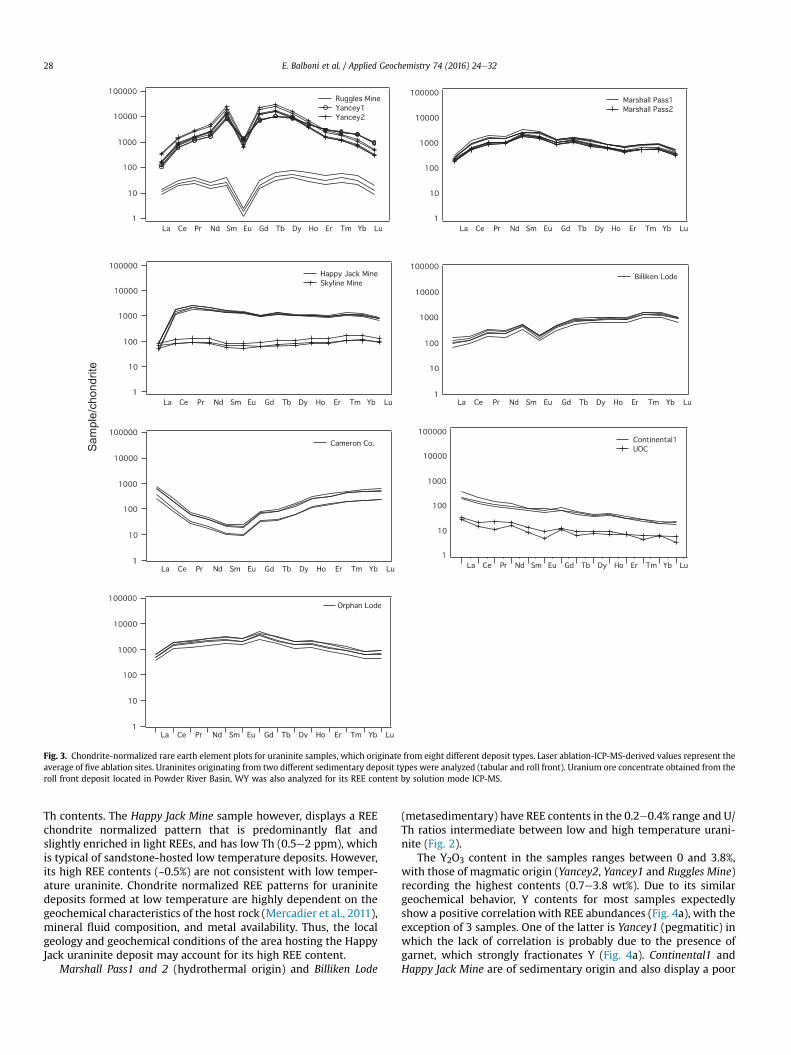
Fig. 3. Chondrite-normalized rare earth element plots for uraninite samples, which originate from eight different deposit types. Laser ablation-ICP-MS-derived values represent theaverage of five ablation sites. Uraninites originating from two different sedimentary deposit types were analyzed (tabular and roll front). Uranium ore concentrate obtained from theroll front deposit located in Powder River Basin, WY was also analyzed for its REE content by solution mode ICP-MS.
E. Balboni et al. / Applied Geochemistry 74 (2016) 24e3228
Th contents. The Happy Jack Mine sample however, displays a REEchondrite normalized pattern that is predominantly flat andslightly enriched in light REEs, and has low Th (0.5e2 ppm), whichis typical of sandstone-hosted low temperature deposits. However,its high REE contents (~0.5%) are not consistent with low temper-ature uraninite. Chondrite normalized REE patterns for uraninitedeposits formed at low temperature are highly dependent on thegeochemical characteristics of the host rock (Mercadier et al., 2011),mineral fluid composition, and metal availability. Thus, the localgeology and geochemical conditions of the area hosting the HappyJack uraninite deposit may account for its high REE content.
Marshall Pass1 and 2 (hydrothermal origin) and Billiken Lode
(metasedimentary) have REE contents in the 0.2e0.4% range and U/Th ratios intermediate between low and high temperature urani-nite (Fig. 2).
The Y2O3 content in the samples ranges between 0 and 3.8%,with those of magmatic origin (Yancey2, Yancey1 and Ruggles Mine)recording the highest contents (0.7e3.8 wt%). Due to its similargeochemical behavior, Y contents for most samples expectedlyshow a positive correlationwith REE abundances (Fig. 4a), with theexception of 3 samples. One of the latter is Yancey1 (pegmatitic) inwhich the lack of correlation is probably due to the presence ofgarnet, which strongly fractionates Y (Fig. 4a). Continental1 andHappy Jack Mine are of sedimentary origin and also display a poor
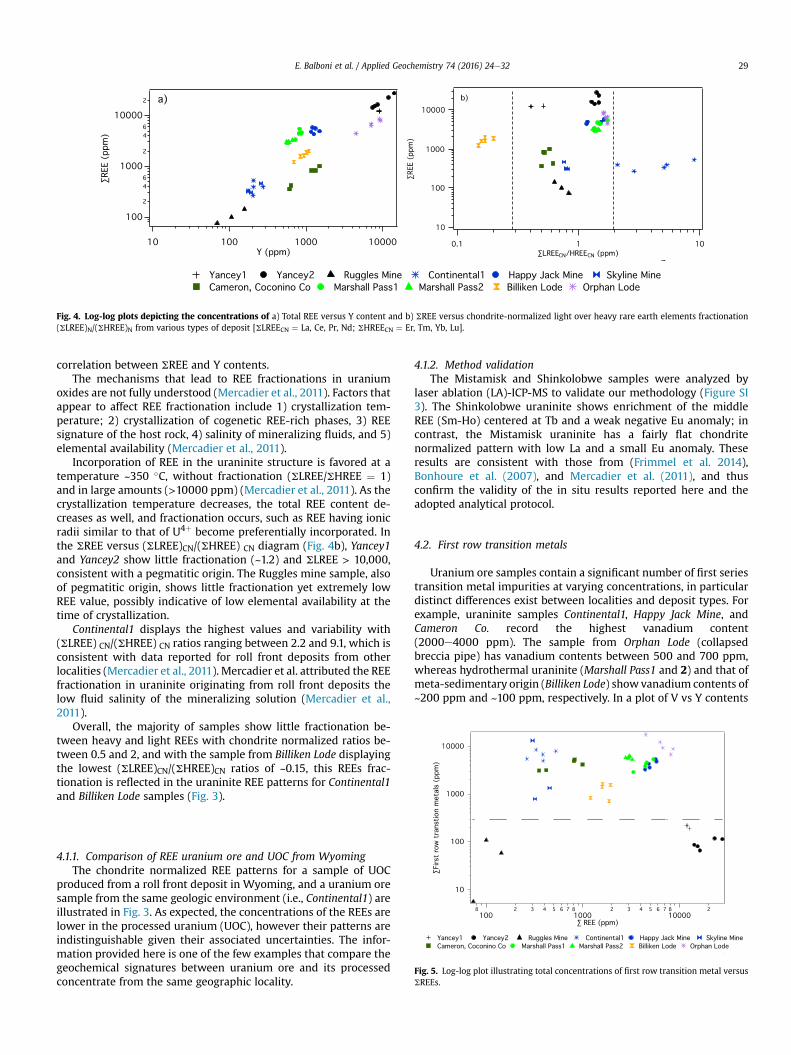
Fig. 4. Log-log plots depicting the concentrations of a) Total REE versus Y content and b) SREE versus chondrite-normalized light over heavy rare earth elements fractionation(SLREE)N/(SHREE)N from various types of deposit [SLREECN ¼ La, Ce, Pr, Nd; SHREECN ¼ Er, Tm, Yb, Lu].
E. Balboni et al. / Applied Geochemistry 74 (2016) 24e32 29
correlation between SREE and Y contents.The mechanisms that lead to REE fractionations in uranium
oxides are not fully understood (Mercadier et al., 2011). Factors thatappear to affect REE fractionation include 1) crystallization tem-perature; 2) crystallization of cogenetic REE-rich phases, 3) REEsignature of the host rock, 4) salinity of mineralizing fluids, and 5)elemental availability (Mercadier et al., 2011).
Incorporation of REE in the uraninite structure is favored at atemperature ~350 �C, without fractionation (SLREE/SHREE ¼ 1)and in large amounts (>10000 ppm) (Mercadier et al., 2011). As thecrystallization temperature decreases, the total REE content de-creases as well, and fractionation occurs, such as REE having ionicradii similar to that of U4þ become preferentially incorporated. Inthe SREE versus (SLREE)CN/(SHREE) CN diagram (Fig. 4b), Yancey1and Yancey2 show little fractionation (~1.2) and SLREE > 10,000,consistent with a pegmatitic origin. The Ruggles mine sample, alsoof pegmatitic origin, shows little fractionation yet extremely lowREE value, possibly indicative of low elemental availability at thetime of crystallization.
Continental1 displays the highest values and variability with(SLREE) CN/(SHREE) CN ratios ranging between 2.2 and 9.1, which isconsistent with data reported for roll front deposits from otherlocalities (Mercadier et al., 2011). Mercadier et al. attributed the REEfractionation in uraninite originating from roll front deposits thelow fluid salinity of the mineralizing solution (Mercadier et al.,2011).
Overall, the majority of samples show little fractionation be-tween heavy and light REEs with chondrite normalized ratios be-tween 0.5 and 2, and with the sample from Billiken Lode displayingthe lowest (SLREE)CN/(SHREE)CN ratios of ~0.15, this REEs frac-tionation is reflected in the uraninite REE patterns for Continental1and Billiken Lode samples (Fig. 3).
Fig. 5. Log-log plot illustrating total concentrations of first row transition metal versusSREEs.
4.1.1. Comparison of REE uranium ore and UOC from WyomingThe chondrite normalized REE patterns for a sample of UOC
produced from a roll front deposit in Wyoming, and a uranium oresample from the same geologic environment (i.e., Continental1) areillustrated in Fig. 3. As expected, the concentrations of the REEs arelower in the processed uranium (UOC), however their patterns areindistinguishable given their associated uncertainties. The infor-mation provided here is one of the few examples that compare thegeochemical signatures between uranium ore and its processedconcentrate from the same geographic locality.
4.1.2. Method validationThe Mistamisk and Shinkolobwe samples were analyzed by
laser ablation (LA)-ICP-MS to validate our methodology (Figure SI3). The Shinkolobwe uraninite shows enrichment of the middleREE (Sm-Ho) centered at Tb and a weak negative Eu anomaly; incontrast, the Mistamisk uraninite has a fairly flat chondritenormalized pattern with low La and a small Eu anomaly. Theseresults are consistent with those from (Frimmel et al. 2014),Bonhoure et al. (2007), and Mercadier et al. (2011), and thusconfirm the validity of the in situ results reported here and theadopted analytical protocol.
4.2. First row transition metals
Uranium ore samples contain a significant number of first seriestransition metal impurities at varying concentrations, in particulardistinct differences exist between localities and deposit types. Forexample, uraninite samples Continental1, Happy Jack Mine, andCameron Co. record the highest vanadium content(2000e4000 ppm). The sample from Orphan Lode (collapsedbreccia pipe) has vanadium contents between 500 and 700 ppm,whereas hydrothermal uraninite (Marshall Pass1 and 2) and that ofmeta-sedimentary origin (Billiken Lode) show vanadium contents of~200 ppm and ~100 ppm, respectively. In a plot of V vs Y contents

E. Balboni et al. / Applied Geochemistry 74 (2016) 24e3230
(Fig. 5), all deposits fall within distinct fields with the exception ofsample Continental1, which shows the highest variability in Vcontents. Titanium content is high in samples of hydrothermalorigin (Marshall Pass1 and 2) ranging between 2500 and 5300 ppm.Other samples that contain elevated Ti contents are Orphan Lode(500e900 ppm) and Continental1 (50e250 ppm). Orphan Lodeyields the highest Cr content (170e240 ppm). Mn contents range inthe 1000s of ppm for samples Cameron Co. (1600e1900 ppm), andin the 100s of ppm in samples Happy Jack Mine,Marshall Pass1, andOrphan Lode. Cobalt content is below detection limit or <10 ppm inmost samples with the exception of Orphan Lode and Cameron Co.,which have Co concentrations up to 2400 ppm and 1900 ppm,respectively. Ni was detected only in Orphan Lode(4000e7800 ppm) sample and was either at below detection limitor <10 ppm for the remaining samples. Among all the samples, thecollapsed breccia pipe from Orphan Lode has the highest Cr and Nicontents, which may be specific characteristics of this deposit type(Burns and Finch, 1999; Dahlkamp, 1991) (SupplementaryInformation).
For all uraninite of pegmatitic association, the abundances of allfirst row transition metals are either below detection limit (V, Cr,Co, Ni) or <10 ppm (Sc, Ti); Mn content ranges between 50 and200 ppm. All pegmatite-type uraninite deposits analyzed in thiswork contain <200 ppm total of first row transition metals (Fig. 5).As displayed in Fig. 5, samples of pegmatitic origin can bediscriminated from low temperature uranium oxide samples basedon their much lower total contents of first row transition metals.
4.3. Other metals
Ta contents correlate well with Hf, Nb, and Zr abundances(Fig. 6), although for a significant number of analyses, the former
Fig. 6. Log-log diagrams illustrating concentrations of various trace elements. a) V versudeposit.
were close to the detection limit. SamplesMarshall Pass1, and 2, andBilliken Lode contain the highest concentrations of these high fieldstrength elements (up to thousands of ppm).
In all of the samples, Ba contents range between 2 and 50 ppm;only the sample from Billiken Lode records extremely high Baabundances (1000e2000 ppm). The high Ba content in the BillikenLode sample is not surprising as the mineralization in Billiken Lode,Jefferson County (CO) is reportedly associated with Ba-rich car-bonates (100e1000 ppm) (Dahlkamp, 1991).
4.4. Strontium isotopes
All samples contain strontium abundances in the range of5e400 ppm. The 87Sr/86Sr isotope ratios reported in this studydefine a wide range of values between 0.70963 ± 0.000007 and0.76288 ± 0.000012 (Fig. 7), and corroborate and overlap thosereported for UOCs fromworldwide sources (0.70750 ± 0.00008 and0.76063 ± 0.00002; Varga et al. (2009)). Uraninite from sandstone-type (Happy Jack Mine and Skyline Mine) and roll-front (Continen-tal1) deposits are characterized by the least radiogenic Sr isotopevalues (<0.7200), whereas the highest ratios are recorded in sam-ples Orphan Lode (collapsed breccia), Billiken Lode (metasedi-mentary), and Marshall Pass1 (hydrothermal; Fig. 7).
The age and Rb/Sr ratio of the uraninitewill play significant rolesin determining the measured, present-day Sr isotope ratios of thesamples. In general, similar 87Sr/86Sr ratios can be expected foruraninite hosted by comparable host rocks that are of young age(due to the long half-life of 87Rb). For example, the youngest sampleContinental1 from Wyoming (Oligocene mineralization) has thelowest 87Sr/86Sr ratio of 0.70963 ± 0.000007.
In this work, four samples from the Colorado Plateau wereinvestigated, three from sandstone-hosted tabular uranium
s Y content; b) Ta versus Hf; c) Ta versus Nb, and d) Zr versus Nb from various types of
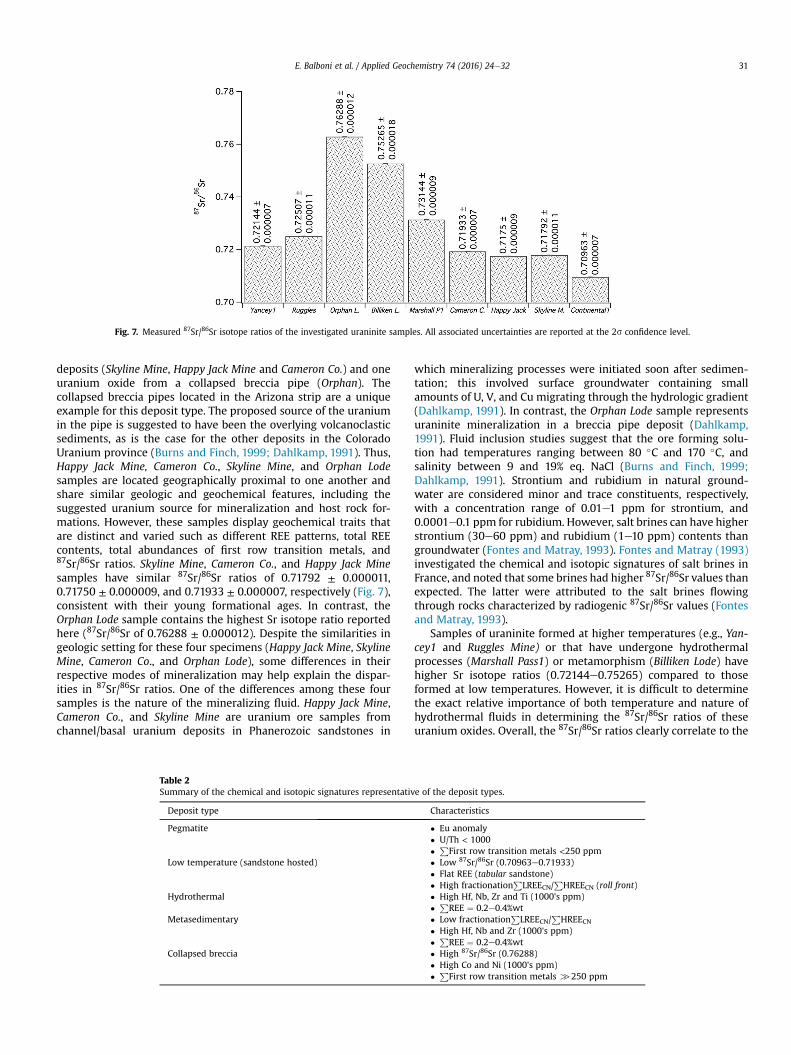
Fig. 7. Measured 87Sr/86Sr isotope ratios of the investigated uraninite samples. All associated uncertainties are reported at the 2s confidence level.
E. Balboni et al. / Applied Geochemistry 74 (2016) 24e32 31
deposits (Skyline Mine, Happy Jack Mine and Cameron Co.) and oneuranium oxide from a collapsed breccia pipe (Orphan). Thecollapsed breccia pipes located in the Arizona strip are a uniqueexample for this deposit type. The proposed source of the uraniumin the pipe is suggested to have been the overlying volcanoclasticsediments, as is the case for the other deposits in the ColoradoUranium province (Burns and Finch, 1999; Dahlkamp, 1991). Thus,Happy Jack Mine, Cameron Co., Skyline Mine, and Orphan Lodesamples are located geographically proximal to one another andshare similar geologic and geochemical features, including thesuggested uranium source for mineralization and host rock for-mations. However, these samples display geochemical traits thatare distinct and varied such as different REE patterns, total REEcontents, total abundances of first row transition metals, and87Sr/86Sr ratios. Skyline Mine, Cameron Co., and Happy Jack Minesamples have similar 87Sr/86Sr ratios of 0.71792 ± 0.000011,0.71750 ± 0.000009, and 0.71933 ± 0.000007, respectively (Fig. 7),consistent with their young formational ages. In contrast, theOrphan Lode sample contains the highest Sr isotope ratio reportedhere (87Sr/86Sr of 0.76288 ± 0.000012). Despite the similarities ingeologic setting for these four specimens (Happy Jack Mine, SkylineMine, Cameron Co., and Orphan Lode), some differences in theirrespective modes of mineralization may help explain the dispar-ities in 87Sr/86Sr ratios. One of the differences among these foursamples is the nature of the mineralizing fluid. Happy Jack Mine,Cameron Co., and Skyline Mine are uranium ore samples fromchannel/basal uranium deposits in Phanerozoic sandstones in
Table 2Summary of the chemical and isotopic signatures representativ
Deposit type
Pegmatite
Low temperature (sandstone hosted)
Hydrothermal
Metasedimentary
Collapsed breccia
which mineralizing processes were initiated soon after sedimen-tation; this involved surface groundwater containing smallamounts of U, V, and Cu migrating through the hydrologic gradient(Dahlkamp, 1991). In contrast, the Orphan Lode sample representsuraninite mineralization in a breccia pipe deposit (Dahlkamp,1991). Fluid inclusion studies suggest that the ore forming solu-tion had temperatures ranging between 80 �C and 170 �C, andsalinity between 9 and 19% eq. NaCl (Burns and Finch, 1999;Dahlkamp, 1991). Strontium and rubidium in natural ground-water are considered minor and trace constituents, respectively,with a concentration range of 0.01e1 ppm for strontium, and0.0001e0.1 ppm for rubidium. However, salt brines can have higherstrontium (30e60 ppm) and rubidium (1e10 ppm) contents thangroundwater (Fontes and Matray, 1993). Fontes and Matray (1993)investigated the chemical and isotopic signatures of salt brines inFrance, and noted that some brines had higher 87Sr/86Sr values thanexpected. The latter were attributed to the salt brines flowingthrough rocks characterized by radiogenic 87Sr/86Sr values (Fontesand Matray, 1993).
Samples of uraninite formed at higher temperatures (e.g., Yan-cey1 and Ruggles Mine) or that have undergone hydrothermalprocesses (Marshall Pass1) or metamorphism (Billiken Lode) havehigher Sr isotope ratios (0.72144e0.75265) compared to thoseformed at low temperatures. However, it is difficult to determinethe exact relative importance of both temperature and nature ofhydrothermal fluids in determining the 87Sr/86Sr ratios of theseuranium oxides. Overall, the 87Sr/86Sr ratios clearly correlate to the
e of the deposit types.
Characteristics
� Eu anomaly� U/Th < 1000� P
First row transition metals <250 ppm� Low 87Sr/86Sr (0.70963e0.71933)� Flat REE (tabular sandstone)� High fractionation
PLREECN/
PHREECN (roll front)
� High Hf, Nb, Zr and Ti (1000's ppm)� P
REE ¼ 0.2e0.4%wt� Low fractionation
PLREECN/
PHREECN
� High Hf, Nb and Zr (1000's ppm)� P
REE ¼ 0.2e0.4%wt� High 87Sr/86Sr (0.76288)� High Co and Ni (1000's ppm)� P
First row transition metals [250 ppm
E. Balboni et al. / Applied Geochemistry 74 (2016) 24e3232
deposit type and can be used to distinguish uraninite of differentorigin. However, this radiogenic isotope information has to besupplemented with other geochemical characteristics and signa-tures for a more accurate assessment of a sample's origin in relationto forensic analysis.
5. Conclusions
Accurate source attribution of intercepted nuclear material ispresently a major concern within the international community.This study provides a detailed chemical characterization of elevenuranium ore samples and one UOC from the United States. Thoriumand yttrium contents, U/Th ratios, rare earth chondrite normalizedpatterns, and total REE concentrations represent critical chemicalindices that can be used for differentiating deposit types. The re-sults reported here show the importance of combining multiplechemical signatures in order to determine the origin of uraniumore. For example, combining the abundances of first row transitionmetals and high field strength elements with their correspondingstrontium isotopic data provide significant information in relationto determining a sample's geographic origin. A summary of thechemical and isotopic signatures representative of the deposittypes characterized in this work is reported in Table 2.
Additionally, the corroborating chemical signatures of unpro-cessed uranium ore and early stage processing uranium fromContinental 1 Mine (Wyoming) reported here suggest that detailedelemental analyses of early stage nuclear material is an effectivetool that can be applied for provenance studies of intercepted nu-clear materials. The work presented here provides a step forward inthe global effort of creating a fingerprinting database of uraniumore raw materials used in the nuclear fuel cycle and weaponsmanufacturing.
Acknowledgments
This work is funded by DHS Grant 2014-DN-077-ARI082. Theauthors thank Dr. Ian Steele for his expertise with electron micro-probe analysis. The Center of Environmental Science and Technol-ogy (CEST) at the University of Notre Dame is thanked for thetraining and use of the m-XRF. This work was performed under theauspices of the U.S. Department of Energy by Lawrence LivermoreNational Laboratory under contract DE-AC52-07NA27344.
Appendix A. Supplementary data
Supplementary data related to this article can be found at http://dx.doi.org/10.1016/j.apgeochem.2016.08.016.
References
Bonhoure, J., et al., 2007. Methodology for rare earth element determinations ofuranium oxides by ion microprobe. Geostand. Geoanalytical Res. 31 (3),209e225.
Brost, A.D., 1962. The Spruce pine DistrictAvery, mitchel and Yancey counties NorthCarolina. In: Geological Survey Bulletin. Washington DC.
Burns, P.C., Finch, R., 1999. Uranium : Mineralogy, Geochemistry and the Environ-ment. In: Mineralogy, Geochemistry and the Environment. Mineralogical So-ciety of America, Washington, DC.
Burns, P.C., Sigmon, G.E., 2013. In: Uranium : Cradle to Grave. C. MineralogicalAssociation.
Buzon, M.R., Simonetti, A., 2013. Strontium isotope (Sr-87/Sr-86) variability in thenile valley: identifying residential mobility during ancient egyptian and nubiansociopolitical changes in the New kingdom and napatan periods. Am. J. Phys.Anthropol. 151 (1), 1e9.
Buzon, M.R., Simonetti, A., Creaser, R.A., 2007. Migration in the Nile Valley during
the New Kingdom period: a preliminary strontium isotope study. J. Archaeol.Sci. 34 (9), 1391e1401.
Chen, W., Simonetti, A., 2013. In-situ determination of major and trace elements incalcite and apatite, and U-Pb ages of apatite from the Oka carbonatite complex:insights into a complex crystallization history. Chem. Geol. 353, 151e172.
Dahlkamp, F.J., 1991. Uranium Ore Deposits.Deditius, A.P., Utsunomiya, S., Ewing, R.C., 2007. Fate of trace elements during
alteration of uraninite in a hydrothermal vein-type U-deposit from MarshallPass, Colorado, USA. Geochim. Cosmochim. Acta 71 (20), 4954e4973.
Fontes, J.C., Matray, J.M., 1993. Geochemistry and origin of formation brines fromthe Paris Basin, France .1. Brines associated with Triassic salts. Chem. Geol. 109(1e4), 149e175.
Frimmel, H.E., Schedel, S., Braetz, H., 2014. Uraninite chemistry as forensic tool forprovenance analysis. Appl. Geochem. 48, 104e121.
Granger, H.C., 1962. Reconnaisance Study of Uranium Deposits in Arizona. Wash-ington DC.
Grupe, G., et al., 1997. Mobility of Bell Beaker people revealed by strontium isotoperatios of tooth and bone: a study of southern Bavarian skeletal remains. Appl.Geochem. 12 (4), 517e525.
Han, S.-H., et al., 2013. Measurement of the sulphur isotope ratio (S-34/S-32) inuranium ore concentrates (yellow cakes) for origin assessment. J. Anal. AtomicSpectrom. 28 (12), 1919e1925.
IAEA. International Status and Prospects for Nuclear Power 2012.IAEA. http://www-ns.iaea.org/security/itdb.asp. [cited 2015.Janeczek, J., Ewing, R.C., 1992. Structural formula of uraninite. J. Nucl. Mater. 190 (0),
128e132.Jenner, G.A., et al., 1990. ICP-MS - a powerful tool for high-precision trace-element
analysis in earth sciences - evidence from analysis of selected USGS referencesamples. Chem. Geol. 83 (1e2), 133e148.
Keatley, A.C., et al., 2015. An investigation into heterogeneity in a single vein-typeuranium ore deposit: implications for nuclear forensics. J. Environ. Radioact.150, 75e85.
Keegan, E., et al., 2008. The provenance of Australian uranium ore concentrates byelemental and isotopic analysis. Appl. Geochem. 23 (4), 765e777.
Keegan, E., et al., 2012. Attribution of uranium ore concentrates using elemental andanionic data. Appl. Geochem. 27 (8), 1600e1609.
Korzeb, S.L., Foord, E.E., Lichte, F.E., 1997. The chemical evolution and paragenesis ofuranium minerals from the Ruggles and Palermo granitic pegmatites, NewHampshire. Can. Mineral. 35, 135e144.
Mayer, K., Wallenius, M., Ray, I., 2005. Nuclear forensics - a methodology providingclues on the origin of illicitly trafficked nuclear materials. Analyst 130 (4),433e441.
Mayer, K., Wallenius, M., Fanghaenel, T., 2007. Nuclear forensic science - from cradleto maturity. J. Alloys Compd. 444, 50e56.
Mercadier, J., et al., 2011. Origin of uranium deposits revealed by their rare earthelement signature. Terra Nova 23 (4), 264e269.
Olson, J.C., 1941. Mica-bearing Pegmatites on New Hampshire.Richter, S., et al., 1999. Isotopic “fingerprints” for natural uranium ore samples. Int. J.
Mass Spectrom. 193 (1), 9e14.Shaub, B.M., 1938. The occurrence, crystal habit and composition of the uraninite
from the Ruggles Mine, near Grafton Center, New Hampshire. Am. Mineralog.23 (5), 334e341.
Svedkauskaite-LeGore, J., et al., 2007. Investigation of the isotopic composition oflead and of trace elements concentrations in natural uranium materials as asignature in nuclear forensics. Radiochim. Acta 95 (10), 601e605.
Svedkauskaite-LeGore, J., et al., 2008. Investigation of the sample characteristicsneeded for the determination of the origin of uranium-bearing materials.J. Radioanal. Nucl. Chem. 278 (1), 201e209.
Van Achterbergh, E., et al., 2001. Data reduction software for LA-ICP-MS. In: LaserAblation ICPMS in the Earth Science - Principles and Applications, pp. 239e243.Mineralogical Association of Canada (short course series).
Van Der Merwe, N.J., et al., 1990. Source-area determination of elephant ivory byisotopic analysis. Nat. Lond. 346 (6286), 744e746.
Varga, Z., et al., 2009. Application of lead and strontium isotope ratio measurementsfor the origin assessment of uranium ore concentrates. Anal. Chem. 81 (20),8327e8334.
Varga, Z., et al., 2010a. Determination of rare-earth elements in uranium-bearingmaterials by inductively coupled plasma mass spectrometry. Talanta 80 (5),1744e1749.
Varga, Z., Wallenius, M., Mayer, K., 2010b. Origin assessment of uranium ore con-centrates based on their rare-earth elemental impurity pattern. In: Radio-chimica Acta International Journal for Chemical Aspects of Nuclear Science andTechnology, p. 771.
Varga, B.Z., et al., 2011. Analysis of uranium ore concentrates for origin assessment.Radiochim. acta 4, 1e4.
Wallenius, M., Mayer, K., Ray, I., 2006. Nuclear forensic investigations: two casestudies. Forensic Sci. Int. 156 (1), 55e62.
Zhao, D., Ewing Rodney, C., 2000. Alteration products of uraninite from the ColoradoPlateau. In: Radiochimica Acta International Journal for Chemical Aspects ofNuclear Science and Technology, p. 739.


![Index [] Index Sr, isotopic mixing, water, 430d Sr–Nd, isotopic mixture, sediment, 428d Sr, Rb, Nd, Sm isotope ratios sediment, Amazon and tributaries, 430t U–Pb, mixing, sediment,](https://img.pdfslide.net/doc/110x75/5ca16a0388c993f7068c1548/index-index-sr-isotopic-mixing-water-430d-srnd-isotopic-mixture-sediment.jpg)